Embed Size (px)
Citation preview
A Forrester Total Economic Impact™
Study Commissioned By Broadcom
July 2020
The Total Economic Impact™ Of Automic Automation Intelligence
Business Benefits Enabled By The Workload Automation Analytics And Intelligence Tool

Table Of Contents Executive Summary 1
Key Findings 1
TEI Framework And Methodology 4
The Automic Automation Intelligence Customer Journey 5
Interviewed Organization 5
Key Challenges 5
Solution Requirements 6
Key Results 6
Analysis Of Benefits 7
Productivity Gain For Business Users 7
Improved Automation Developer Productivity 8
Improved Productivity Of Production Support Team 9
Unquantified Benefits 10
Flexibility 11
Analysis Of Costs 12
Total License And Service Fees 12
Total Implementation And Ongoing Management Costs 13
Financial Summary 14
Automic Automation Intelligence: Overview 15
Adaptive Intelligence And Predictive Analytics For Workload Automation 15
Appendix A: Total Economic Impact 16
Project Director:
Casey Sirotnak
Project Contributors:
Josephine Phua
Sanitra Desai
ABOUT FORRESTER CONSULTING
Forrester Consulting provides independent and objective research-based
consulting to help leaders succeed in their organizations. Ranging in scope from a
short strategy session to custom projects, Forrester’s Consulting services connect
you directly with research analysts who apply expert insight to your specific
business challenges. For more information, visit forrester.com/consulting.
© 2020, Forrester Research, Inc. All rights reserved. Unauthorized reproduction
is strictly prohibited. Information is based on best available resources.
Opinions reflect judgment at the time and are subject to change. Forrester®,
Technographics®, Forrester Wave, RoleView, TechRadar, and Total Economic
Impact are trademarks of Forrester Research, Inc. All other trademarks are the
property of their respective companies. For additional information, go to
forrester.com.

1 | The Total Economic Impact™ Of Automic Automation Intelligence
Executive Summary
As organizations accelerate their automation and digital transformation,
many are finding that their workloads are increasingly complex to manage.
Not only are the volume of workloads increasing, so are both the inter-
dependencies between them and the myriad of applications they interact
with. Automic Automation Intelligence is an analytics platform that helps
organizations optimize their workload automation (WLA) by providing
monitoring, data visualization, predictive analytics, and simulation
capabilities for workloads.
Broadcom commissioned Forrester Consulting to conduct a Total
Economic Impact™ (TEI) study and examine the potential return on
investment (ROI) enterprises may realize by deploying Automic
Automation Intelligence on top of their workload automation platforms. The
purpose of this study is to provide readers with a framework to evaluate
the potential financial impact of Automic Automation Intelligence on their
WLA environment.
To better understand the benefits, costs, and risks associated with this
investment, Forrester interviewed one customer with several years of
experience using both AutoSys Workload Automation and Automic
Automation Intelligence. The organization, a global financial services firm,
had been using AutoSys Workload Automation solution before
implementing Automic Automation Intelligence on top of it.
Prior to this investment, workloads were monitored by several automation
production support staff, but with over 700 job streams under their purview
the volume and complexity of these workloads had grown beyond their
monitoring capacity, resulting in frequent breaches of service-level
agreements (SLAs). The customer thus looked for help to better manage
its WLA.
Key Findings
Quantified benefits. As a result of their investment in Automic Automation
Intelligence, the interviewed organization experienced time savings and
improved productivity across three groups of employees: 1) business
users; 3) automation developers; and 3) the WLA production support team.
The risk-adjusted present value (PV) of these productivity gains are as
follows:
› Productivity gain for business users. Within the interviewed
customer’s organization, WLA is responsible for generating reports daily
for business users, who use the information provided to make time-
sensitive business decisions. For these line-of-business users, a breach
in the specific SLA results in a delay in receiving timely information,
which then causes downtime and a disruption in business. With its
predictive workload performance analytics, Automic Automation
Intelligence helped to balance the organization’s WLA capacity, while
also preempting the automation support team on potential capacity and
overrun issues. Overall, this has helped the organization reduce the
number of WLA SLA breaches by 68%, and, subsequently, regained
business productivity of $1,611,655 over three years.
Benefits And Productivity Gains Across Three Key User Groups
For business users:
$1,611,655
For automation developers:
$676,822
For WLA production support team:
$513,256

2 | The Total Economic Impact™ Of Automic Automation Intelligence
› Improved automation developer productivity. WLA job streams often
interact with several different business systems and applications. Any
changes in these source applications have an impact on and potential to
disrupt WLAs in production. As such, with every new application release
and/or update, developers would have had to spend additional time
troubleshooting and rewriting code to ensure compatibility with WLA
code. The Automic Automation Intelligence simulation environment
allows developers to test schedule changes and their impact on SLAs
before promoting them to production. This has helped developers save
time on troubleshooting issues and developing follow-on releases to fix
incompatibility between applications and workloads. The improved
developer productivity is estimated to be $676,822 over three years.
› Improved productivity of production support team. Workloads in
production still require active monitoring and management. Production
support staff work to oversee the quality and timeliness of WLA
execution — monitoring alerts, SLA adherence, reporting, etc. Having a
WLA analytics tool in place has significantly reduced the amount of time
and effort required on active monitoring and management of workloads,
resulting in productivity gains of $513,256 for the WLA support team
over three years.
Unquantified benefits. Besides these productivity gains, the interviewed
organization also experienced several other benefits which are not
quantified for this study:
› Additional business insights from workload analytics data. By
analyzing how jobs performed and evolved over time, the WLA data also
served as an additional data source for providing business insights.
Such insights include historical performance data that served as a
benchmark for ongoing workload performance.
› Avoided revenue loss associated with downtime. Some business
users also reported that delays in receiving time-sensitive information
(due to SLA breaches) sometimes caused missed revenue opportunities.
The potential for avoided revenue loss can vary widely depending on the
workload, and it has therefore not been quantified in this study.
› Improved IT-business collaboration. The lower SLA breach incidence
rate, coupled with the added visibility into the causes of these breaches,
provided higher transparency amongst both IT and business teams on
WLA performance. The interviewed organization reported an improved
working relationship between the two teams, as they now feel more
empowered to fix WLA-related issues.
Costs. The interviewed organization experienced the following risk-
adjusted PV costs:
› Total license and service fees. These fees, paid to Broadcom,
comprise of annual license fees as well as professional services fees
paid as part of implementation support. These fees only account for the
use of the WLA analytics tool (Automic Automation Intelligence), and
exclude the amount paid for use of the WLA platform (AutoSys Workload
Automation) itself. Over three years, these fees amount to $843,070.
› Internal implementation and ongoing management costs. These
costs account for the time and effort that the automation and/or IT team
put into deploying the solution and the ongoing management of it. They
total $89,225 over three years.
ROI 201%
Benefits PV $2.8 million
NPV $1.9 million
Payback <3 months
3 | The Total Economic Impact™ Of Automic Automation Intelligence
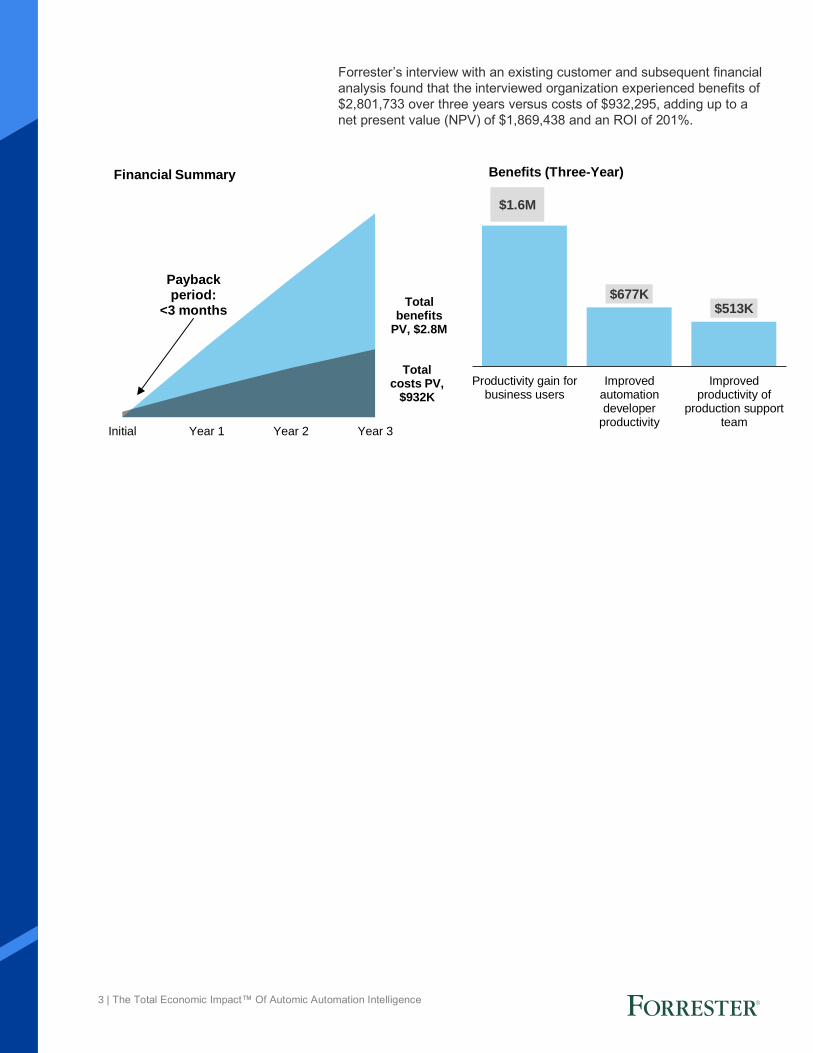
Forrester’s interview with an existing customer and subsequent financial
analysis found that the interviewed organization experienced benefits of
$2,801,733 over three years versus costs of $932,295, adding up to a
net present value (NPV) of $1,869,438 and an ROI of 201%.
Total benefits
PV, $2.8M
Total costs PV,
$932K
Initial Year 1 Year 2 Year 3
Financial Summary
Payback period:
<3 months
$1.6M
$677K$513K
Productivity gain forbusiness users
Improvedautomationdeveloper
productivity
Improvedproductivity of
production supportteam
Benefits (Three-Year)
4 | The Total Economic Impact™ Of Automic Automation Intelligence
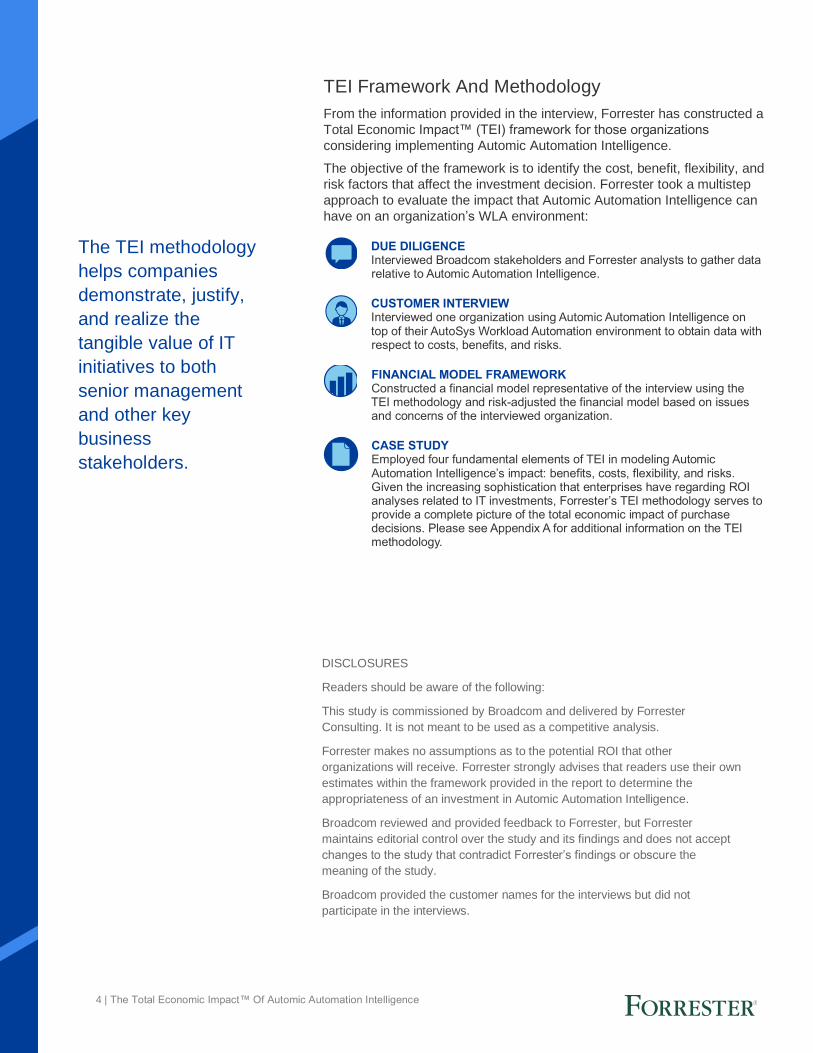
TEI Framework And Methodology
From the information provided in the interview, Forrester has constructed a
Total Economic Impact™ (TEI) framework for those organizations
considering implementing Automic Automation Intelligence.
The objective of the framework is to identify the cost, benefit, flexibility, and
risk factors that affect the investment decision. Forrester took a multistep
approach to evaluate the impact that Automic Automation Intelligence can
have on an organization’s WLA environment:
DUE DILIGENCE Interviewed Broadcom stakeholders and Forrester analysts to gather data relative to Automic Automation Intelligence.
CUSTOMER INTERVIEW Interviewed one organization using Automic Automation Intelligence on top of their AutoSys Workload Automation environment to obtain data with respect to costs, benefits, and risks.
FINANCIAL MODEL FRAMEWORK Constructed a financial model representative of the interview using the TEI methodology and risk-adjusted the financial model based on issues and concerns of the interviewed organization.
CASE STUDY Employed four fundamental elements of TEI in modeling Automic Automation Intelligence’s impact: benefits, costs, flexibility, and risks. Given the increasing sophistication that enterprises have regarding ROI analyses related to IT investments, Forrester’s TEI methodology serves to provide a complete picture of the total economic impact of purchase decisions. Please see Appendix A for additional information on the TEI methodology.
The TEI methodology
helps companies
demonstrate, justify,
and realize the
tangible value of IT
initiatives to both
senior management
and other key
business
stakeholders.
DISCLOSURES
Readers should be aware of the following:
This study is commissioned by Broadcom and delivered by Forrester
Consulting. It is not meant to be used as a competitive analysis.
Forrester makes no assumptions as to the potential ROI that other
organizations will receive. Forrester strongly advises that readers use their own
estimates within the framework provided in the report to determine the
appropriateness of an investment in Automic Automation Intelligence.
Broadcom reviewed and provided feedback to Forrester, but Forrester
maintains editorial control over the study and its findings and does not accept
changes to the study that contradict Forrester’s findings or obscure the
meaning of the study.
Broadcom provided the customer names for the interviews but did not
participate in the interviews.

5 | The Total Economic Impact™ Of Automic Automation Intelligence
The Automic Automation Intelligence
Customer Journey
BEFORE AND AFTER THE AUTOMIC AUTOMATION INTELLIGENCE
INVESTMENT
Interviewed Organization
For this study, Forrester interviewed a customer that had been using
AutoSys Workload Automation, it later implemented Automic Automation
Intelligence to help manage its WLA.
› The organization is a global financial services firm offering investment
banking and brokerage services.
› It has over 7,500 employees worldwide, including 14 in its workload
automation group.
› These 14 WLA staff collectively manage about 700 job streams,
containing thousands of individual jobs, across the entire organization.
Key Challenges
Prior to the investment in a WLA analytics tool, workloads were
monitored and manually managed by several staff within their
automation groups. The key challenges they faced, which drove their
investment into automation intelligence, include:
› Frequent SLA breaches. As the WLA environment grew larger and
more complex, capacity became an issue, and the team started
missing SLA windows more frequently.
› Lack of transparency into how their AutoSys Workload
Automation environment was performing. Beyond tracking SLA
adherence, the team was limited in the analytics they could perform on
the WLA data that they had accumulated over the year. This lack of
visibility also impeded their ability to pinpoint the causes of their SLA
misses.
› Overreliance on application development teams to review their
performance. Without visibility into WLA data, the organization had to
rely on application data to assess the performance and problems of
their workload automations. This was inefficient, with no way to
validate the claims, and often ineffective.
“Prior to Automic Automation
Intelligence, we had no good
way to understand how our
baseline AutoSys environment
was performing.”
Manager, integration services

6 | The Total Economic Impact™ Of Automic Automation Intelligence
Solution Requirements
The interviewed organization searched for a solution that could:
› Analyze back-end data to validate the performance of their AutoSys
Workload Automation environment.
› Provide analytics based on historical AutoSys data to inform
optimization efforts.
› Customize a user-friendly interface to allow business users to access
data and analytics tools.
Key Results
The interview revealed that key results from the investment include:
› Fewer SLA breaches from detailed insights into batches at the job level
and early detection of irregular performance.
› Less rework and troubleshooting after the go-live date from better
testing in simulation environment.
› Improved the relationship and collaboration environment between the
IT and business teams.
“The ability to run analyses of
our job scheduling runs, and
use those insights to make
changes in our base [WLA]
environment, has been a
game changer.”
Manager, integration services

7 | The Total Economic Impact™ Of Automic Automation Intelligence
The table above shows the total of all benefits across the areas listed below, as well as present values (PVs) discounted at 10%. Over three years, the interviewed organization expects risk-adjusted total benefits to be a PV of more than $2.8 million.
Impact risk is the risk that the business or technology needs of the organization may not be met by the investment, resulting in lower overall total benefits. The greater the uncertainty, the wider the potential range of outcomes for benefit estimates.
Analysis Of Benefits
QUANTIFIED BENEFIT DATA
Productivity Gain For Business Users
The interviewed customer’s key use case for WLA is to generate daily
reports for trading managers, who use the provided information to make
time-sensitive investment decisions. For these line-of-business users, a
breach in SLA results in a delay in receiving this timely information,
which then causes downtime and a disruption in business. On average,
these overruns were 1 hour long and affected 10 business users each.
The interviewee shared that with Automic Automation Intelligence they
managed to reduce the SLA breach incidences by 69% for this
particular job stream (from 102 taking place in one year down to 32). To
scale this benefit across the entire WLA landscape, Forrester applied
the same 69% improvement to the other business-critical WLA job
streams throughout the organization, which is estimated to be 15% of
all workloads.
In all, the interviewed organization managed to avoid 73,500 hours of
downtime in Year 1. Forrester estimates that the employee productivity
impact of this downtime is 15%, i.e., for 1 hour of downtime or delay,
there is 9 minutes (15%) of productivity loss. Employees will be able to
fill the other 51 minutes with other work tasks. Therefore, given a
downtime reduction of 73,500 hours, the productivity loss avoided in
Year 1 is 11,025 hours.
Assuming a fully loaded salary rate of $67 per hour for each business
user, the organization realized productivity gains of $738,675 for
business users in Year 1.
These productivity gains will vary from one organization to the next,
depending on the complexity of their workloads, severity of SLA
breaches, and average salaries of business users. To account for these
risks, Forrester adjusted this benefit downward by 20%, yielding a three-
year, risk-adjusted total PV of $1,611,655.
With Automic Automation
Intelligence, the
interviewed organization
managed to reduce SLA
breach incidences by
69%.
Total Benefits
REF. BENEFIT YEAR 1 YEAR 2 YEAR 3 TOTAL PRESENT VALUE
Atr Productivity gain for business users $590,940 $650,034 $715,037 $1,956,011 $1,611,655
Btr Improved automation developer productivity
$272,160 $272,160 $272,160 $816,480 $676,822
Ctr Improved productivity of production support team
$206,388 $206,388 $206,388 $619,164 $513,256
Total benefits (risk-adjusted) $1,069,488 $1,128,582 $1,193,585 $3,391,655 $2,801,733

8 | The Total Economic Impact™ Of Automic Automation Intelligence
Improved Automation Developer Productivity
WLA job streams often interact with several different business systems
and applications. Any changes in these source applications have the
potential to disrupt WLA streams in production, causing SLA breaches
and delays down the line. According to the interviewed customer, they
would typically need six to eight follow-on releases to fix issues, but with
the ability to run simulations in the Automic Automation Intelligence test
environment, this has been reduced.
Overall, with these testing and simulation capabilities in place,
developers have saved significant time on troubleshooting issues and
developing follow-on releases to fix incompatibility between applications
and workloads.
Assuming an application refresh and/or release rate of 5% per year, the
interviewed organization has 20 major application releases/refreshes per
year. For each of these applications, the organization can save 336
hours of developer time in troubleshooting and fixing errors. With over 20
application updates, this adds up to a total time savings of 6,720
developer hours. Forrester assumes that 75% of these time savings, or
5,040 hours, are captured and used towards productive work.
Assuming a fully loaded salary rate of $60 per hour for each developer,
the organization realized improved automation developer productivity of
$302,400 every year.
These productivity gains will vary from one organization to the next,
depending on the complexities of their application and workload
environment, and the average salaries and workloads of developers. To
account for these risks, Forrester adjusted this benefit downward by
10%, yielding a three-year, risk-adjusted total PV of $676,822.
Productivity Gain For Business Users: Calculation Table
REF. METRIC CALCULATION YEAR 1 YEAR 2 YEAR 3
A1 Number of WLA job streams in organization Interviewee 700 770 847
A2 Number of business-critical WLA job streams in organization A1*15% 105 115.5 127.1
A3 Number of SLA breaches per business-critical job stream (before investment)
Interviewee 102 102 102
A4 Number of SLA breaches per business-critical job stream (after investment)
Interviewee 32 32 32
A5 Number of SLA breaches avoided per business-critical job stream
A3-A4 70 70 70
A6 Average overrun per SLA breach (hours) Interviewee 1 1 1
A7 Total downtime avoided per user (hours) A5*A6 70 70 70
A8 Number of business users affected Interviewee 10 10 10
A9 Total downtime avoided (hours) A2*A7*A8 73,500 80,850 88,935
A10 Estimated employee productivity impact Assumption 15% 15% 15%
A11 Avoided productivity loss (hours) A9*A10 11,025 12,128 13,340
A12 Average fully-loaded salary of business user (per hour) Assumption $67 $67 $67
At Productivity gain for business users A11*A12 $738,675 $812,543 $893,797
Risk adjustment ↓20%
Atr Productivity gain for business users (risk-adjusted) $590,940 $650,034 $715,037

9 | The Total Economic Impact™ Of Automic Automation Intelligence
Improved Productivity Of Production Support Team
Workloads in production require active monitoring and management.
Production support staff work to oversee the quality and timeliness of
WLA execution — monitoring alerts, SLA adherence, reporting, etc.
Having a WLA analytics tool in place has significantly reduced the
amount of time and effort required on active monitoring and management
of workloads. The interviewee recounted that before Automic Automation
Intelligence, their WLA system could raise as many 15,000 alarms a day,
which would have to be monitored or addressed by the automation
production support team. With better capacity management (see Benefit
1), and predictive monitoring and alerting, the interviewed customer has
seen an “80% of noise reduction on the console” by prioritizing alarms so
the organization could focus on just those that are deemed critical.
Forrester estimates that this translates into a 70% reduction in time spent
on monitoring jobs and addressing alerts with their investment in Automic
Automation Intelligence. Across the organization’s 14 production support
staff, these time savings add up to 5,096 hours a year. Forrester
assumes that 75% of these time savings, or 3,822 hours, are captured
and used towards productive work.
Assuming a fully loaded salary rate of $60 per hour for each support
staff, the organization realized improved productivity of production
support team of $229,320 every year.
These productivity gains will vary from one organization to the next,
depending on the complexity of their workload automation environment,
and the average salaries and workloads of production support staff. To
account for these risks, Forrester adjusted this benefit downward by
10%, yielding a three-year, risk-adjusted total PV of $513,256.
Improved Automation Developer Productivity: Calculation Table
REF. METRIC CALCULATION YEAR 1 YEAR 2 YEAR 3
B1 Number of applications within organization Assumption 400 400 400
B2 Number of application releases and/or updates B1*5% 20 20 20
B3 Avoided additional troubleshooting and development time with simulation/testing capabilities (hours)
~35% of time spent on this over 8 weeks
112 112 112
B4 Number of automation developers involved per application release/update
Interviewee 3 3 3
B5 Total time savings for automation developers (hours)
B2*B3*B4 6,720 6,720 6,720
B6 Productivity captured B5*75% 5,040 5,040 5,040
B7 Average fully loaded salary of automation developers
Assumption $60 $60 $60
Bt Improved automation developer productivity B6*B7 $302,400 $302,400 $302,400
Risk adjustment ↓10%
Btr Improved automation developer productivity (risk-adjusted)
$272,160 $272,160 $272,160

10 | The Total Economic Impact™ Of Automic Automation Intelligence
Unquantified Benefits
Besides, the productivity gains quantified above, the interviewed
organization also experienced several other benefits which are not
quantified for this study:
› Additional business insights from workload analytics data. By
analyzing how jobs performed and evolved over time, the WLA data
also served as an additional information source for providing business
insights. This was especially important for the interviewed organization,
which noted, “We have gone from enabling business [users] to have
tools at their fingertips, to now delivering data to the tools for them to
decide what’s the better investment decision.”
› Avoided revenue loss associated with downtime. Some business
users also reported that delays in receiving time-sensitive information
(due to SLA breaches) sometimes caused missed revenue
opportunities.
› Improved IT-business collaboration. The lower SLA breach
incidence rate, coupled with the added visibility into the causes of
these breaches, provided higher transparency amongst both IT and
business teams on WLA performance. The interviewed organization
reported an improved working relationship between the two teams, as
they feel now more empowered to fix WLA-related issues.
Improved Productivity Of Production Support Team: Calculation Table
REF. METRIC CALCULATION YEAR 1 YEAR 2 YEAR 3
C1 Number of employees involved in production support Interviewee 14 14 14
C2 Number of hours spent on monitoring jobs and addressing alerts per week (before investment)
Assumption 10 10 10
C3 Total hours spent on monitoring jobs and addressing alerts (with investment)
C2*52 520 520 520
C4 Reduction in time spent on manual workload monitoring and management
Interviewee 70% 70% 70%
C5 Total time savings for production support team C1*C3*C4 5,096 5,096 5,096
C6 Productivity captured C5*75% 3,822 3,822 3,822
C7 Average fully loaded salary of production support team Assumption $60 $60 $60
Ct Improved productivity of production support team C6*C7 $229,320 $229,320 $229,320
Risk adjustment ↓10%
Ctr Improved productivity of production support team (risk-adjusted)
$206,388 $206,388 $206,388
By analyzing how jobs
performed and evolved
over time, the WLA
analytics data also
served as an additional
information source for
providing business
insights.

11 | The Total Economic Impact™ Of Automic Automation Intelligence
Flexibility, as defined by TEI, represents an investment in additional capacity or capability that could be turned into business benefit for a future additional investment. This provides an organization with the “right” or the ability to engage in future initiatives but not the obligation to do so.
Flexibility
The value of flexibility is clearly unique to each customer, and the
measure of its value varies from organization to organization. There are
multiple scenarios in which a customer might choose to implement WLA
analytics and later realize additional uses and business opportunities,
including:
› Business optimization through the analysis of WLA data.
Considering the volume of jobs in a typical WLA environment, WLA
data can be a rich source of information that’s useful not only to the
automation team to optimize their operations but also for business
analysts to explore too.
› Reassignment of production support resources to more value-
added activities. Reduction in manual job monitoring and analysis
allows production support to focus on strengthening business
relationships, including but not limited to finding additional business
processes to automate.
Flexibility would also be quantified when evaluated as part of a specific
project (described in more detail in Appendix A).

12 | The Total Economic Impact™ Of Automic Automation Intelligence
The table above shows the total of all costs across the areas listed below, as well as present values (PVs) discounted at 10%. Over three years, the interviewed organization expects risk-adjusted total costs to be a PV of more than $930,000.
Analysis Of Costs
QUANTIFIED COST DATA
Total License And Service Fees
The major cost component in an investment in Automic Automation
Intelligence is the license model and its associated fees. Forrester
assumes an annual license agreement for this model, though other
payment models are available. For its particular scale of deployment, the
interviewed organization incurred annual license costs of $310,000. In
addition, it paid $32,000 in professional service fees for implementation
support during the initial phase of the project.
These fees only account for the use of the WLA analytics tool (Automic
Automation Intelligence), and exclude the amount paid for use of the
WLA platform (AutoSys Workload Automation) itself.
To account for variances in deployment and discount rates, Forrester
adjusted this cost upward by 5%, yielding a three-year, risk-adjusted total
PV of $843,070.
Total Costs
REF. COST INITIAL YEAR 1 YEAR 2 YEAR 3 TOTAL PRESENT VALUE
Dtr Total license and service fees $33,600 $325,500 $325,500 $325,500 $1,010,100 $843,070
Etr Total implementation and ongoing management costs
$38,016 $20,592 $20,592 $20,592 $99,792 $89,225
Total costs (risk-adjusted) $71,616 $346,092 $346,092 $346,092 $1,109,892 $932,295
Total License And Service Fees: Calculation Table
REF. METRIC CALCULATION INITIAL YEAR 1 YEAR 2 YEAR 3
D1 License fees $0 $310,000 $310,000 $310,000
D2 Professional service fees $32,000
Dt Total license and service fees D1+D2 $32,000 $310,000 $310,000 $310,000
Risk adjustment ↑5%
Dtr Total license and service fees (risk-adjusted) $33,600 $325,500 $325,500 $325,500
Implementation risk is the risk that a proposed investment may deviate from the original or expected requirements, resulting in higher costs than anticipated. The greater the uncertainty, the wider the potential range of outcomes for cost estimates.
Forrester assumes an annual license agreement for this model, though other payment models are available.

13 | The Total Economic Impact™ Of Automic Automation Intelligence
Total Implementation And Ongoing Management
Costs
The second cost component in the investment is the resources needed
to deploy the solution and manage it on a day-to-day basis. To calculate
these costs, Forrester first considered the time that different users would
have to spent working on the project — from implementation throughout
the entire three-year period.
The interviewee recounted that implementation took about six months,
during which two to three project managers spent several hours a week
in meetings about this project. Forrester estimates that the total time put
into the implementation effort is at 192 hours.
Once configured and installed, minimal effort is required to keep the
solution running. The interviewee estimates that one employee spends
about 6 hours a week overseeing the program.
To account for the risk of a project going over time, Forrester adjusted
this cost upward by 10%, yielding a three-year, risk-adjusted total PV of
$89,225.
Total Implementation And Ongoing Management Costs: Calculation Table
REF. METRIC CALCULATION INITIAL YEAR 1 YEAR 2 YEAR 3
E1 Number of FTEs involved in implementation Interviewee 3
E2 Average fully loaded salary of IT staff Assumption $60 $60 $60 $60
E3 Number of hours spent on implementation Interviewee: 8 hours/week *24 weeks
192
E4 Implementation costs E1*E2*E3 $34,560
E5 Number of FTEs involved in ongoing management of solution
Interviewee 1 1 1
E6 Number of hours spent per week on ongoing management and maintenance
Assumption 6 6 6
E7 Ongoing management costs E6*52*E2 $18,720 $18,720 $18,720
Et Total implementation and ongoing management costs
E4+E7 $34,560 $18,720 $18,720 $18,720
Risk adjustment ↑10%
Etr Total implementation and ongoing management costs (risk-adjusted)
$38,016 $20,592 $20,592 $20,592
Six months
Total implementation
and deployment time
14 | The Total Economic Impact™ Of Automic Automation Intelligence
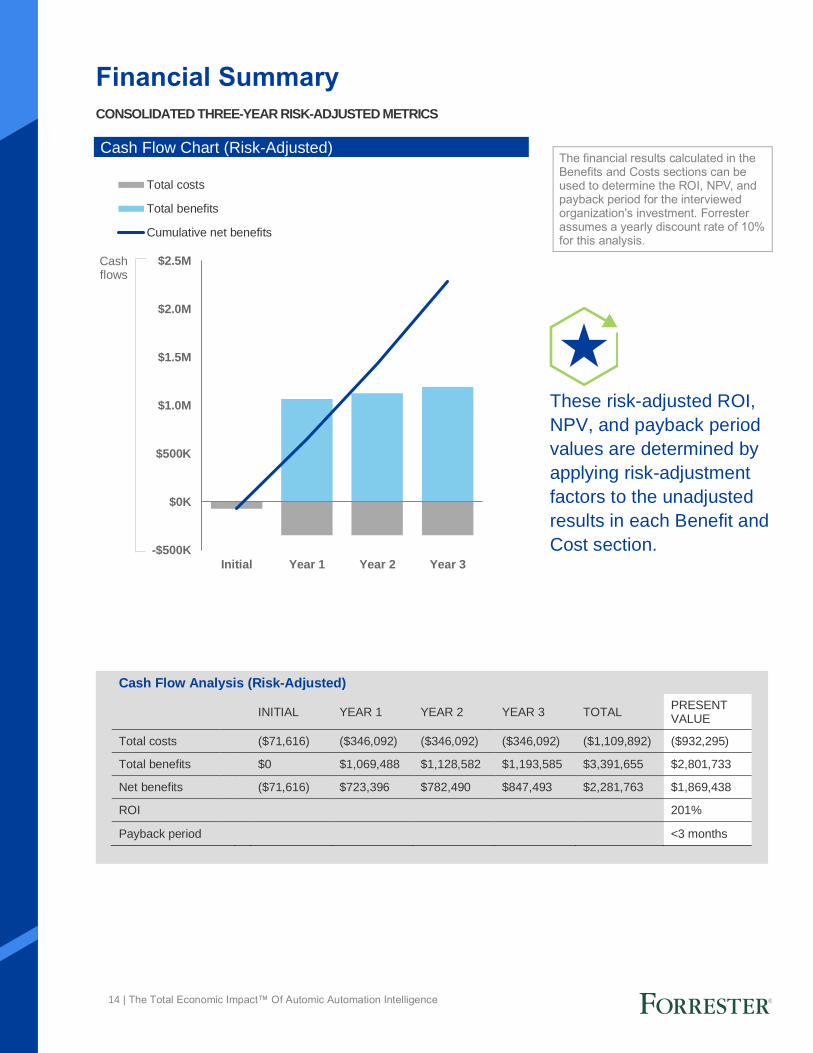
The financial results calculated in the Benefits and Costs sections can be used to determine the ROI, NPV, and payback period for the interviewed organization's investment. Forrester assumes a yearly discount rate of 10% for this analysis.
Financial Summary
CONSOLIDATED THREE-YEAR RISK-ADJUSTED METRICS
Cash Flow Chart (Risk-Adjusted)
-$500K
$0K
$500K
$1.0M
$1.5M
$2.0M
$2.5M
Initial Year 1 Year 2 Year 3
Cashflows
Total costs
Total benefits
Cumulative net benefits
These risk-adjusted ROI,
NPV, and payback period
values are determined by
applying risk-adjustment
factors to the unadjusted
results in each Benefit and
Cost section.
Cash Flow Analysis (Risk-Adjusted)
INITIAL YEAR 1 YEAR 2 YEAR 3 TOTAL PRESENT VALUE
Total costs ($71,616) ($346,092) ($346,092) ($346,092) ($1,109,892) ($932,295)
Total benefits $0 $1,069,488 $1,128,582 $1,193,585 $3,391,655 $2,801,733
Net benefits ($71,616) $723,396 $782,490 $847,493 $2,281,763 $1,869,438
ROI 201%
Payback period <3 months

15 | The Total Economic Impact™ Of Automic Automation Intelligence
Automic Automation Intelligence: Overview
The following information is provided by Broadcom. Forrester has not validated any claims and does not endorse
Broadcom or its offerings.
Adaptive Intelligence And Predictive Analytics For Workload Automation
Key Benefits
• Risk reduction and avoidance: Improved understanding of batch impact due to failures, latency, and
operator error.
• Improve efficiency and reduce costs: Gain the visibility you need to manage value streams end-to-end
and optimize costs, align execution to strategy, and prioritize strategic initiatives.
• Transform customer experience: Optimize customers’ experiences by using AI-driven insights to detect
and resolve issues faster, and to prevent them from occurring in the first place.
Key Capabilities
• Cross platforms/vendors visibility: Real-time single point of view across IWS z/d, CA 7, Jobtrac, AutoSys
Workload Automation, and Tidal Workload Automation solutions.
• Dynamic service-level management: Discover and track service-level agreements (SLA) across platforms
and schedulers simply by identifying the job that needs to be delivered.
• Predictive monitoring and alerting: Predict outcome of SLAs before they impact the business. Proactive
alert management to resolve before any impact to the business.
• Improved change control: Simulate potential changes against defined SLAs before going to production.
Limits SLA breaches and allows you to optimize complex batch processing across vendors and platforms.
Critical Differentiators
• Cross platform/vendor: Sole solution that allows you to monitor, manage, and improve workload
automation across multiple vendors and platforms.
• API-driven: Includes in-house schedulers and application data to enhance SLA management to expand
beyond the jobs that are scheduled.
• Lifecycle management: Simulate impact of schedule changes to understand impact on SLAs and
operational efficiency.
• Predictive analytics: Gain insight and understanding of your entire workload environment. Find unseen
impacts and dependencies across applications, platforms, and vendors.
• Business monitoring: See your workload from a line-of-business and business-process perspective instead
of a series of unrelated job streams.
• Proactive operations: Adaptive intelligence and artificial intelligence provides unprecedented forecasting to
accurately determine likely outcome.
• Dynamic critical-path discovery: Real-time discovery of critical path to determine requirements to meet
SLAs.
• Workload intelligence: Long-term storage of historical activities to better identify outcomes to critical
workload execution.
• Audit and compliance: Single repository of truth for outcome of workload execution over the long term.

16 | The Total Economic Impact™ Of Automic Automation Intelligence
Appendix A: Total Economic Impact
Total Economic Impact is a methodology developed by Forrester
Research that enhances a company’s technology decision-making
processes and assists vendors in communicating the value proposition
of their products and services to clients. The TEI methodology helps
companies demonstrate, justify, and realize the tangible value of IT
initiatives to both senior management and other key business
stakeholders.
Total Economic Impact Approach
Benefits represent the value delivered to the business by the
product. The TEI methodology places equal weight on the
measure of benefits and the measure of costs, allowing for a
full examination of the effect of the technology on the entire
organization.
Costs consider all expenses necessary to deliver the
proposed value, or benefits, of the product. The cost category
within TEI captures incremental costs over the existing
environment for ongoing costs associated with the solution.
Flexibility represents the strategic value that can be
obtained for some future additional investment building on
top of the initial investment already made. Having the ability
to capture that benefit has a PV that can be estimated.
Risks measure the uncertainty of benefit and cost estimates
given: 1) the likelihood that estimates will meet original
projections and 2) the likelihood that estimates will be
tracked over time. TEI risk factors are based on “triangular
distribution.”
The initial investment column contains costs incurred at “time 0” or at the
beginning of Year 1 that are not discounted. All other cash flows are discounted
using the discount rate at the end of the year. PV calculations are calculated for
each total cost and benefit estimate. NPV calculations in the summary tables are
the sum of the initial investment and the discounted cash flows in each year.
Sums and present value calculations of the Total Benefits, Total Costs, and
Cash Flow tables may not exactly add up, as some rounding may occur.
Present value (PV)
The present or current value of (discounted) cost and benefit estimates given at an interest rate (the discount rate). The PV of costs and benefits feed into the total NPV of cash flows.
Net present value (NPV)
The present or current value of (discounted) future net cash flows given an interest rate (the discount rate). A positive project NPV normally indicates that the investment should be made, unless other projects have higher NPVs.
Return on investment (ROI)
A project’s expected return in percentage terms. ROI is calculated by dividing net benefits (benefits less costs) by costs.
Discount rate
The interest rate used in cash flow analysis to take into account the time value of money. Organizations typically use discount rates between 8% and 16%.
Payback period
The breakeven point for an investment. This is the point in time at which net benefits (benefits minus costs) equal initial investment or cost.