Embed Size (px)
Citation preview
NBER WORKING PAPER SERIES
THE TOP 1 PERCENT IN INTERNATIONAL AND HISTORICAL PERSPECTIVE
Facundo AlvaredoAnthony B. Atkinson
Thomas PikettyEmmanuel Saez
Working Paper 19075http://www.nber.org/papers/w19075
NATIONAL BUREAU OF ECONOMIC RESEARCH1050 Massachusetts Avenue
Cambridge, MA 02138May 2013
This paper is in preparation for the Journal of Economic Perspectives. We are grateful to the editor,David Autor, the Managing Editor, Timothy Taylor, and Co-editors, Chang-Tai Hsieh and Ulrike Malmendierfor most helpful comments. Financial support from the MacArthur foundation, the Center for EquitableGrowth at UC Berkeley, the Institute for New Economic Thinking at the Oxford Martin School, andthe ESRC-DFID Joint Fund is thankfully acknowledged. The views expressed herein are those of theauthors and do not necessarily reflect the views of the National Bureau of Economic Research.
NBER working papers are circulated for discussion and comment purposes. They have not been peer-reviewed or been subject to the review by the NBER Board of Directors that accompanies officialNBER publications.
© 2013 by Facundo Alvaredo, Anthony B. Atkinson, Thomas Piketty, and Emmanuel Saez. All rightsreserved. Short sections of text, not to exceed two paragraphs, may be quoted without explicit permissionprovided that full credit, including © notice, is given to the source.
The Top 1 Percent in International and Historical PerspectiveFacundo Alvaredo, Anthony B. Atkinson, Thomas Piketty, and Emmanuel SaezNBER Working Paper No. 19075May 2013, Revised June 2013JEL No. H2
ABSTRACT
The top 1 percent income share has more than doubled in the United States over the last thirty years,drawing much public attention in recent years. While other English speaking countries have also experiencedsharp increases in the top 1 percent income share, many high�income countries such as Japan, France,or Germany have seen much less increase in top income shares. Hence, the explanation cannot relysolely on forces common to advanced countries, such as the impact of new technologies and globalizationon the supply and demand for skills. Moreover, the explanations have to accommodate the falls intop income shares earlier in the twentieth century experienced in virtually all high�income countries.We highlight four main factors. The first is the impact of tax policy, which has varied over time anddiffers across countries. Top tax rates have moved in the opposite direction from top income shares.The effects of top rate cuts can operate in conjunction with other mechanisms. The second factor isindeed a richer view of the labor market, where we contrast the standard supply-side model with onewhere pay is determined by bargaining and the reactions to top rate cuts may lead simply to a redistributionof surplus. Indeed, top rate cuts may lead managerial energies to be diverted to increasing their remunerationat the expense of enterprise growth and employment. The third factor is capital income. Overall, privatewealth (relative to income) has followed a U-shaped path over time, particularly in Europe, whereinherited wealth is, in Europe if not in the United States, making a return. The fourth, little investigated,element is the correlation between earned income and capital income, which has substantially increasedin recent decades in the United States.
Facundo AlvaredoNuffield College and EModUniversity of OxfordEagle HouseWalton Well RoadOX2 6ED [email protected]
Anthony B. AtkinsonDept. of EconomicsOxford UnviersityManor Road Building, Manor Rd.Oxford, OX1 3BJ, United [email protected]
Thomas PikettyParis School of Economics48 Boulevard Jourdan75014 Paris, [email protected]
Emmanuel SaezDepartment of EconomicsUniversity of California, Berkeley530 Evans Hall #3880Berkeley, CA 94720and [email protected]
2
For three decades the debate about rising income inequality in the United States has centered on the dispersion of wages and the increased premium for skilled/educated workers, attributed in varying proportions to skill-‐biased technological change and to globalization (for example, see Katz and Autor, 1999 for a survey). In recent years, however, there has been growing realization that most of the action has been at the very top. This has attracted a great deal of public attention (as witnessed by the number of visits to and press citations of our World Top Incomes Database at http://topincomes.parisschoolofeconomics.eu/), and has represented a challenge to the economics profession. Stories based on the supply and demand for skills are not enough to explain the extreme top tail of the earnings distribution; nor is it enough to look only at earned incomes. Different approaches are necessary to explain what has happened in the United States over the past century, and also to explain the differing experience in other high-‐income countries over recent decades. We begin with the international comparison in the first section, and then turn to the causes and implications of the evolution of top income shares.
We should start by emphasizing the factual importance of the top 1 percent. It is tempting to dismiss the study of this group as a passing political fad, due to the slogans of Occupy Movement or as the academic equivalent of reality TV. But the magnitudes are truly substantial. Based on pre-‐tax and pre-‐transfer market income (excluding non-‐taxable fringe benefits such as health insurance but including realized capital gains) per family reported on tax returns, the share of total annual income received by the top 1 percent has more than doubled from 9 percent in 1976 to 20 percent in 2011 (Piketty and Saez, 2003, and updated tables). There have been rises for other top shares, but these have been much smaller: during the same period, the share of the group from 95th to 99th percentile rose only by 3 percentage points. The rise in the share of the top 1 percent has had a noticeable effect on overall income inequality in the US (Atkinson, Piketty and Saez, 2011, Section 2.2).
The United States Top 1 Percent in International Perspective
Figure 1 depicts the US top 1 percent income share since 1913. Kuznets (1955) famously hypothesized that economic growth would first be accompanied by a rise in inequality, and then by a decline in inequality. At first glance, it is tempting to conclude from Figure 1 that the Kuznets curve has been turned upside-‐down. But this suggestion is too facile. After all, the interwar period did not exhibit a secular downward trend in shares of top incomes. Apart from the bubble of the late 1920s, the US top 1 percent share was between 15 and 20 percent throughout this time. At the time of Pearl Harbor in 1941, the share of the top 1 percent was essentially the same as in 1918. The downward trend in top shares started at the time of World War II and continued until the end of the 1960s. There was then a sharp reversal, so that the top share is today back in the same range as in the 1920s. Interestingly, the Great Recession of 2008-‐2009 does not seem to have reversed the upward trend. There was a fall in the top 1 per cent share in 2008-‐2009, but a rebound in 2010. This would be consistent with the experience of the previous economic downturn: top income shares fell in 2001-‐2002, but quickly recovered and returned to the previous trend in 2003-‐2007. Another piece of evidence that is consistent with this interpretation
3
is the smaller cyclical variation in the series excluding capital gains (shown by the hollow symbols in Figure 1).
Has the US experience been reproduced in other high-‐income countries? The evolution of the shares of the top 1 percent is shown for four Anglo-‐Saxon countries in Figure 2A and for France, Germany, Sweden, and Japan in Figure 2B (it should be noted that the estimates for France and the United Kingdom do not include capital gains, the estimates for Canada, Germany and Sweden include realized capital gains after the year therein shown, and the estimates for Australia include them only partially and at varying degrees over time). The other Anglo-‐Saxon countries, Australia, Canada, and the United Kingdom all show a strong asymmetric U-‐shape. However, the rises were less marked in two of these countries. Over the period 1980 to 2007, when the top 1 percent share rose by some 135 percent in the US and the UK, it rose by some 105 percent in Australia and 76 percent in Canada (and by 39 percent in New Zealand, not shown). The experience is markedly different in continental Europe and Japan, where the long pattern of income inequality is much closer to an L-‐shaped than to a U-‐shaped curve. (Sweden and other Scandinavian countries such as Norway (not shown) are intermediate cases.)1 There has been some rise in recent years in the top shares in these countries, but the top 1 percent shares are not far today from their levels in the late 1940s, whereas in the US the share is higher by more than a half.
To us, the fact that high-‐income countries with similar technological and productivity developments have gone through different patterns of income inequality at the very top supports the view that institutional and policy differences play a key role in these transformations. Purely technological stories based solely upon supply and demand of skills can hardly explain such diverging patterns. What is more, within countries, we have to explain not only why top shares rose (in the U-‐shaped countries) but also why they fell for a sustained period of time earlier in the twentieth century. The most obvious policy difference – between countries and over time – is that regarding taxation, and it is with this that we begin.
Taxes and Top Shares
During the twentieth century, top income tax rates have followed an inverse U-‐shaped time-‐path in many countries, as illustrated in Figure 3. In the United States, top income tax rates were consistently above 60 percent from 1932 to 1981 and, at the start of the 1920s, they were above 70 percent (of course, varying proportions of taxpayers were subject to the top rate). High income tax rates are not just a feature of the post-‐World War II period, and their cumulative effect contributed to the earlier decline in top income shares. While many countries have cut top tax rates in recent decades, the depth of these cuts has varied considerably. For example, the top tax rate in France in 2010 was only 10 percentage points lower than in 1950, whereas the top tax rate in the US was less than half its 1950 value. Figure 4 plots the changes in top marginal income tax rates (combining both central and local
1 The Swedish top 1 percent share was very high during World War One. The same is observed in Denmark – see the discussion in Atkinson and Søgaard (2013).
4
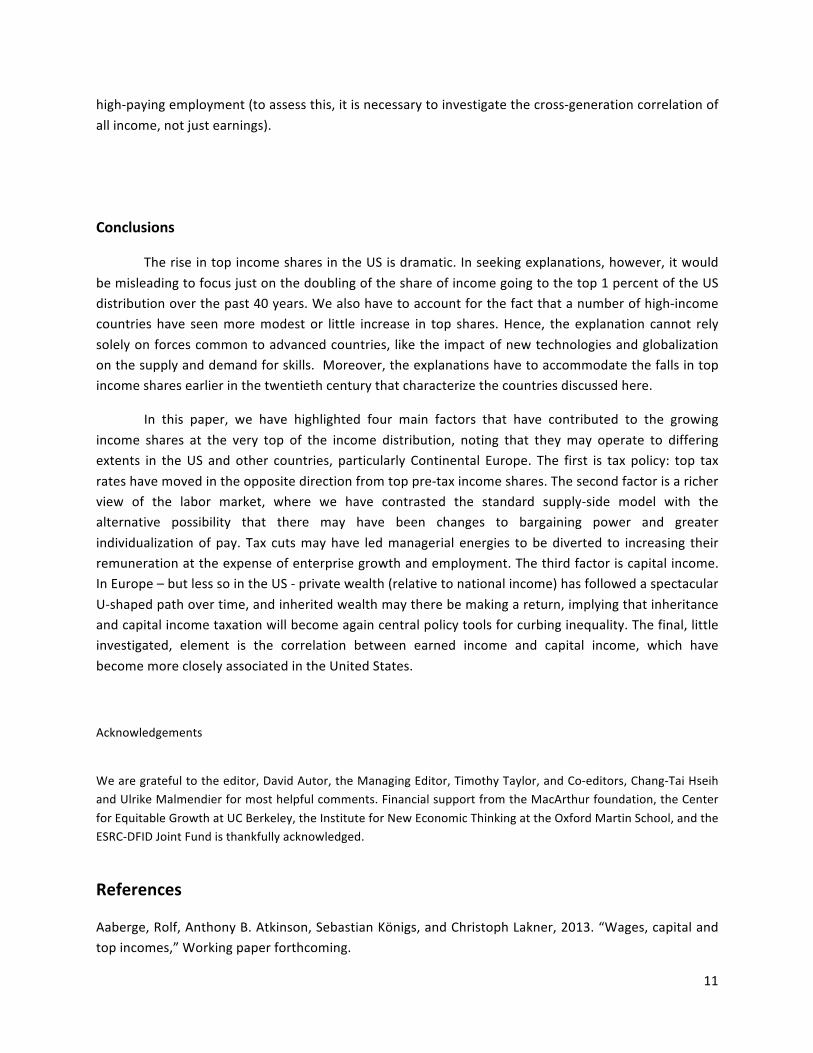
government income taxes) since the early 1960s, against the changes over that period in top 1 percent income shares for 18 high-‐income countries in the World Top Incomes Database. It shows that there is a strong correlation between the reductions in top tax rates and the increases in top 1 percent pre-‐tax income shares. For example, the United States experienced a 47 percentage points reduction in its top income tax rate and a 10 percentage point increase in its top 1 percent pre-‐tax income share. By contrast, countries such as Germany, Spain, or Switzerland, which did not experience any significant top rate tax cut, did not show increases in the top 1 percent income share. Hence, the evolution of top tax rates is strongly negatively correlated with changes in pre-‐tax income concentration.
This negative correlation can be explained in a variety of ways. As pointed out originally by Slemrod (1996), it is possible that the rise in top US income shares occurred because when top tax rates declined, those with high incomes had less reason to seek out tax avoidance strategies. This argument has more recently been used to deny that any real increase in income concentration actually took place – that it is a pure statistical artifact. Under this scenario, the real US top income shares were as high in the 1960s as they are today, but a smaller fraction of top incomes was reported on tax returns. While this factor may have affected the pattern of the data at certain times—for example, the jump in top US income shares following the 1986 Tax Reform Act—closer examination of the US case suggests that the tax avoidance response cannot account for a significant fraction of the long-‐run surge in top incomes. Top income shares based on a broader definition of income that includes realized capital gains, and hence a major part of avoidance channels, have increased virtually as much as top income shares based on a narrower definition of income subject to the progressive tax schedule (See Figure 1 and Piketty, Saez and Stantcheva 2011 for a detailed analysis).
The explanation that changes in tax rates in the top tax brackets do lead to substantive behavioral change has indeed received some support. After noting that top US incomes surged following the large top marginal tax rate cuts of the 1980s, Lindsey (1987) and Feldstein (1995) proposed a standard supply-‐side story whereby lower tax rates stimulate economic activity among top earners involving more work, greater entrepreneurship, and the like. In this scenario, lower top tax rates would lead to more economic activity by the rich and hence more economic growth.
Behavioral change is at the heart of the optimal income tax analysis pioneered by Mirrlees (1971), publicly evoked in the debate about top tax rates in the UK, where the Chancellor of the Exchequer has argued that reducing the top tax rate below 50 per cent (for broadly the top 1 percent) will not reduce revenue. The standard optimal tax formula (Diamond and Saez, 2011) implies, with an elasticity of taxable income of 0.5, that the revenue-‐maximizing top tax rate would be 57 percent.2 When allowance is made for other taxes levied in the UK, such as the payroll tax, this implies a top income tax rate in the UK of some 40 percent (Atkinson, 2012).
2 The revenue maximizing top tax rate formula takes the form τ=1/(1+a·∙e) where a is the Pareto parameter of the top tail of the income distribution, and e is the elasticity of pre-‐tax income with respect to the net-‐of-‐tax rate 1-‐τ. With e=0.5 (as estimated from Figure 4) and a=1.5 (the current Pareto parameter of the US income distribution), we get τ=1/(1+0.5·∙1.5)=57 percent.
5
Richer models of pay determination
The optimal tax literature has, however, remained rooted in an over-‐simplified model of pay determination that takes no account of developments in labor economics, and the same applies to the explanations of changing top income shares. Changes in the pay of a worker are assumed to have no impact on either the other side of the labor market or on other workers. The worker generates more output and pay adjusts by the same amount. Each person is an island. However, in the – now standard – models of job-‐matching, a job emerges as the result of the costly creation of a vacancy by the employer and of job search by the employee. A match creates a positive surplus and there is Nash bargaining over the division of the surplus, leading to a proportion β going to the worker and (1-‐β) to the employer. Typically, β is assumed fixed, but it is possible that what we have observed, at least at the top, is an increase in β, which can lead to changes in the distribution of income.3
Why should β have increased? The extent to which top earners exercised bargaining power may have interacted with the changes in the tax system. When top marginal tax rates were very high, the net reward to a highly paid executive for bargaining for more compensation was modest. When top marginal tax rates fell, high earners started bargaining more aggressively to increase their compensation. In this scenario, cuts in top tax rates can increase top income shares – consistent with the observed trend in Figure 1 – but the increases in top 1 percent incomes now come at the expense of the remaining 99 percent.
One can also weave this notion of greater incentives for bargaining into a broader scenario, in which the improved information and communications technology and globalization were increasing the demand for high-‐skilled labor, and deregulation of finance and other industries was both raising the demand for skill at the top and changing the rules under which compensation had been calculated in the past. In this perspective, high marginal tax rates had served as a brake on the level of surplus extraction in the past, but then this brake was released at the same time that economic and institutional conditions allowed for higher compensation at the top of the income distribution (Piketty, Saez and Stantcheva 2011).
In this scenario, the higher share of income going to the top 1 percent does not reflect higher economic growth—which is a key difference with the supply-‐side scenario. It is even possible that reductions in top marginal tax rates may have adverse effects on growth, as may be seen if we go back to the theories of managerial firms and the separation of ownership and control developed by William Baumol, Robin Marris and Oliver Williamson in the 1960s and 1970s (see Solow, 1971). In these models, managers are concerned with their remuneration (both monetary and non-‐monetary) but also with other dimensions such as the scale or rate of growth of their firms, and allocate their effort accordingly. Where top tax rates were high, there was a low return to effort spent on negotiating higher pay. Top corporate executives may have concentrated on securing alternative sources of utility, such as unproductive corporate expenses, but they may also have ploughed back profits into securing faster expansion than in the traditional stock market valuation maximizing firm. Cuts in top tax rates, however, 3 Kleven et al. (2013) find evidence of such bargaining effects in the pay determination of high earners, using the Danish preferential tax scheme for highly paid immigrants.
6
meant that top executives switched efforts back to securing a larger share of the profits, in which case increases in remuneration, or bonuses, may have come at the expense of employment and growth.
The correlation shown in Figure 4 between top marginal tax rates and changes in top income shares may of course reflect in part coincidence rather than causality. The political factors that led to top tax rate cuts – such as those by Reagan and Thatcher in the 1980s in the United States and the United Kingdom –were accompanied by other legislative changes, such as deregulation, which may have caused top incomes to rise, not least on account of the impetus they gave to the growth of the financial services (Philippon and Reshef, 2012) and legal services sectors. More generally, the effects of taxation may interact with other changes, such as those in remuneration practices. Where there is a surplus to be shared, the division may reflect relative bargaining strength, as above, but it may also be influenced by social norms. Notions of fairness, or a “pay code”, may come into play to remove the indeterminacy where “individual incentives are not by themselves … sufficient to determine a unique equilibrium” (MacLeod and Malcomson 1998, p. 400). A “pay code” limits the extent to which earnings are individually determined, a situation that both workers and employers accept on reputational grounds. As argued in Atkinson (2008), there may be a tipping-‐point where there is a switch from a high level of adherence to such a code to a situation where pay becomes largely individually determined. This has been documented in the case of the US by Lemieux, MacLeod and Parent (2009), who find an increase in the proportion of performance-‐pay jobs over the period 1976 to 1998. As they note, the increased extent of performance-‐pay may be a channel by which other factors are expressed in greater wage dispersion, and they stress the impact at the top end of the wage distribution.
Top Tax Rates and Growth
If we look at the aggregate outcomes, we find no apparent correlation between cuts in top tax rates and growth rates in real per capita GDP (Piketty, Saez and Stantcheva, 2011). Countries that made large cuts in top tax rates such as the United Kingdom or the United States have not grown significantly faster than countries that did not, such as Germany or Denmark. This lack of correlation is more consistent with a story that the response of pre-‐tax top incomes to top tax rates documented in Figure 4 is due to increased bargaining power or more individualized pay at the top, rather than increased productive effort. Naturally, cross-‐country comparisons are bound to be fragile; exact results vary with the specification, years, and countries. However, the regression analysis by Piketty, Saez, and Stantcheva (2011) using the complete time-‐series data since 1960, shows that the absence of correlation between economic growth and top tax rates is quite robust. By and large, the bottom line is that rich countries have all grown at roughly the same rate over the past 40 years – in spite of huge variations in tax policies.
More specifically, international evidence shows that current pay levels for chief executive officers across countries are strongly negatively correlated with top tax rates even controlling for firm's characteristics and performance, and that this correlation is stronger in firms with poor governance
7
(Piketty, Saez and Stantcheva, 2011).4 This finding also suggests that the link between top tax rates and pay of chief executive officers does not run through firm performance but is likely to be due to bargaining effects.
Such findings have strong implications for top tax rate policies. The optimal top tax rate rises dramatically if a substantial fraction of the effect of top tax rates on pre-‐tax top incomes documented in Figure 4 above is due to wage-‐bargaining effects, instead of supply-‐side effects. Using mid-‐range parameter values where the response of top earners to top tax rate cuts is due in part (three-‐fifths) to increased bargaining behavior and in part (two-‐fifths) to increased productive work, Piketty, Saez and Stantcheva (2011) find that the top tax rate could potentially be set as high as 83 percent – as opposed to 57 percent in the pure supply-‐side model.5
Capital income and inheritance
The analysis just cited focused – like much of the literature – on what is commonly called “earned incomes,” referring to income received in response for work. But capital income is also an important part of the story. Of course, the distinction between the two types of income can become blurry in some cases—notably, entrepreneurial income can have elements of both compensation for work and a return to capital investment. Here, we define “capital income” as rents, dividends, interest, and realized capital gains. The decline of top capital incomes is the main driver of the falls in top income shares found in many countries in the early twentieth century. For example, from 1916 to 1939, capital income represented 50 percent of US top 1 percent incomes, whereas by the end of the century from 1987 to 2010, the share had fallen to a third (Piketty and Saez, 2003, Tables A7 and A8). In the UK, the corresponding share fell from 60 percent in 1937 to under 20 percent by the end of the century (Atkinson, 2007, Figure 4.11). At the same time, it should be borne in mind that these calculations depend on the definition of taxable incomes. In times past, a number of income tax systems like those in France and the United Kingdom included imputed rents of homeowners in the income tax base, but today imputed rents are typically excluded. Where the tax base has been extended, this has in some cases taken the form of separate taxation (as with realized capital gains in the UK), so that this element of capital income is not covered in the income tax data. As a result of these developments, the share of capital income that is reportable on income tax returns has often significantly decreased over time.
Earlier we referred to the cumulative effect of progressive taxation. A long period of high top rates of income taxation, coupled with high top rates of taxation on the transmission of wealth by inheritance and gift, reduced the capacity of large wealth-‐holders to sustain their pre-‐eminence. The key factor in determining the capacity to transmit wealth is the difference between the “internal rate of 4 Governance is measured with an index that combines various governance measures: insider ownership, institutional ownership, the ratio of independent board directors, whether the CEO is also chairman of the board, the average number of board positions held by board members. 5 With wage-‐bargaining effects, the optimal top tax rate formula becomes τ=(1+s·∙a·∙e)/(1+a·∙e) where s is the fraction of the total behavioral elasticity due to bargaining effects. With a=1.5, e=0.5 (as above), and s=3/5, we obtain τ = 83%. In the standard model with no wage-‐bargaining effects, we had s=0 and τ = 57%.
8
accumulation” (the savings rate times the rate of return net of taxes) and the rate of growth of the economy. This means that the taxation of income and wealth transfers can cause the share of top wealth-‐holders to fall, as in the United Kingdom over the first three-‐quarters of the twentieth century (Atkinson and Harrison, 1978), contributing to the downward trajectory of top income shares. Alongside this was the growth of “popular wealth” owned by the bottom 99 per cent. Back in 1908 in the United Kingdom, the 17th Earl of Derby had a rent roll of some £100,000, which was more than a thousand times the average income at the time. Many of these houses are now owned by their occupiers.
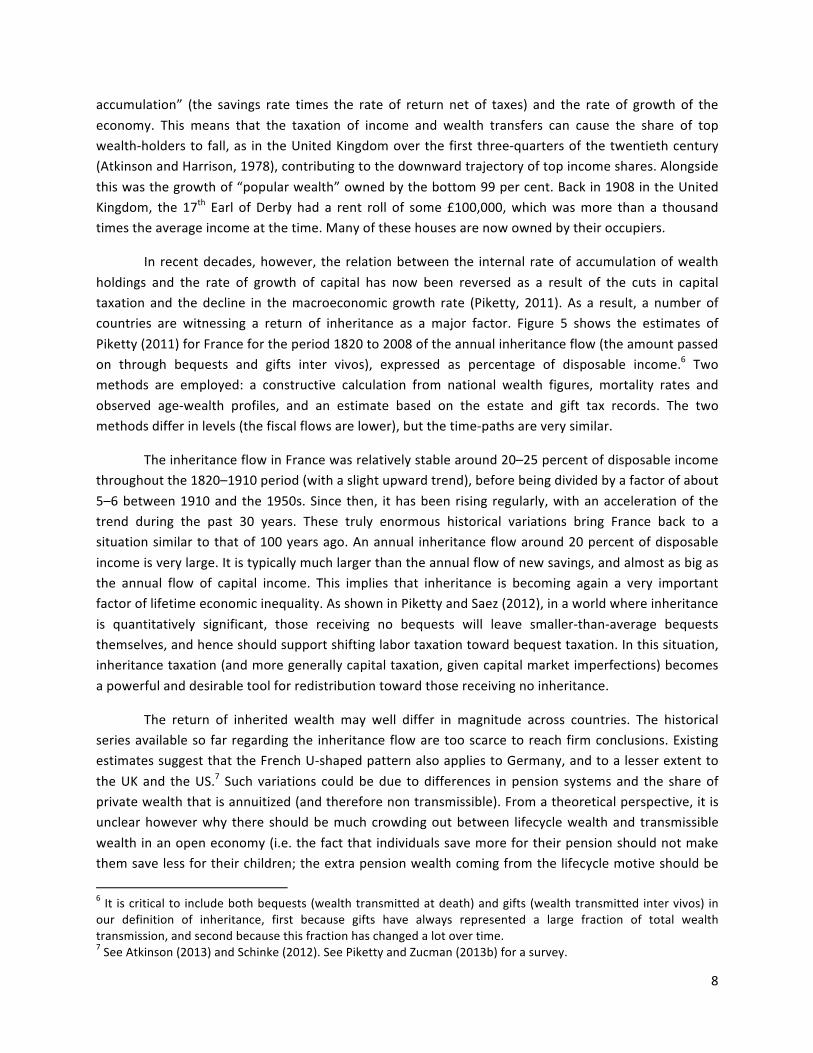
In recent decades, however, the relation between the internal rate of accumulation of wealth holdings and the rate of growth of capital has now been reversed as a result of the cuts in capital taxation and the decline in the macroeconomic growth rate (Piketty, 2011). As a result, a number of countries are witnessing a return of inheritance as a major factor. Figure 5 shows the estimates of Piketty (2011) for France for the period 1820 to 2008 of the annual inheritance flow (the amount passed on through bequests and gifts inter vivos), expressed as percentage of disposable income.6 Two methods are employed: a constructive calculation from national wealth figures, mortality rates and observed age-‐wealth profiles, and an estimate based on the estate and gift tax records. The two methods differ in levels (the fiscal flows are lower), but the time-‐paths are very similar.
The inheritance flow in France was relatively stable around 20–25 percent of disposable income throughout the 1820–1910 period (with a slight upward trend), before being divided by a factor of about 5–6 between 1910 and the 1950s. Since then, it has been rising regularly, with an acceleration of the trend during the past 30 years. These truly enormous historical variations bring France back to a situation similar to that of 100 years ago. An annual inheritance flow around 20 percent of disposable income is very large. It is typically much larger than the annual flow of new savings, and almost as big as the annual flow of capital income. This implies that inheritance is becoming again a very important factor of lifetime economic inequality. As shown in Piketty and Saez (2012), in a world where inheritance is quantitatively significant, those receiving no bequests will leave smaller-‐than-‐average bequests themselves, and hence should support shifting labor taxation toward bequest taxation. In this situation, inheritance taxation (and more generally capital taxation, given capital market imperfections) becomes a powerful and desirable tool for redistribution toward those receiving no inheritance.
The return of inherited wealth may well differ in magnitude across countries. The historical series available so far regarding the inheritance flow are too scarce to reach firm conclusions. Existing estimates suggest that the French U-‐shaped pattern also applies to Germany, and to a lesser extent to the UK and the US.7 Such variations could be due to differences in pension systems and the share of private wealth that is annuitized (and therefore non transmissible). From a theoretical perspective, it is unclear however why there should be much crowding out between lifecycle wealth and transmissible wealth in an open economy (i.e. the fact that individuals save more for their pension should not make them save less for their children; the extra pension wealth coming from the lifecycle motive should be
6 It is critical to include both bequests (wealth transmitted at death) and gifts (wealth transmitted inter vivos) in our definition of inheritance, first because gifts have always represented a large fraction of total wealth transmission, and second because this fraction has changed a lot over time. 7 See Atkinson (2013) and Schinke (2012). See Piketty and Zucman (2013b) for a survey.
9
invested abroad, without reducing the return). It could be that there are differences in tastes for wealth transmission. Maybe wealthy individuals in the UK and in the US have less taste for bequest than their French and German counterparts. However it should be kept in mind that there are important data problems (in particular, wealth surveys tend to vastly underestimate inheritance receipts), which could partly explain why the rise of inheritance flows in the recent period appears to be more limited in some countries than in others.8
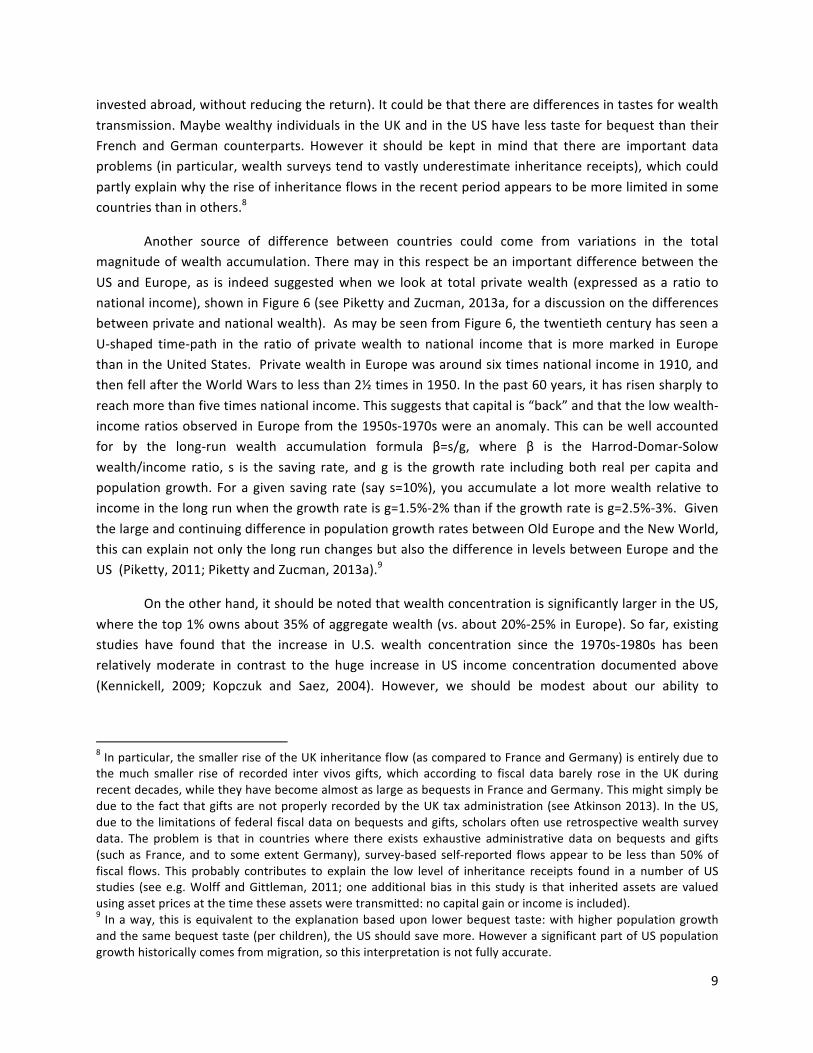
Another source of difference between countries could come from variations in the total magnitude of wealth accumulation. There may in this respect be an important difference between the US and Europe, as is indeed suggested when we look at total private wealth (expressed as a ratio to national income), shown in Figure 6 (see Piketty and Zucman, 2013a, for a discussion on the differences between private and national wealth). As may be seen from Figure 6, the twentieth century has seen a U-‐shaped time-‐path in the ratio of private wealth to national income that is more marked in Europe than in the United States. Private wealth in Europe was around six times national income in 1910, and then fell after the World Wars to less than 2½ times in 1950. In the past 60 years, it has risen sharply to reach more than five times national income. This suggests that capital is “back” and that the low wealth-‐income ratios observed in Europe from the 1950s-‐1970s were an anomaly. This can be well accounted for by the long-‐run wealth accumulation formula β=s/g, where β is the Harrod-‐Domar-‐Solow wealth/income ratio, s is the saving rate, and g is the growth rate including both real per capita and population growth. For a given saving rate (say s=10%), you accumulate a lot more wealth relative to income in the long run when the growth rate is g=1.5%-‐2% than if the growth rate is g=2.5%-‐3%. Given the large and continuing difference in population growth rates between Old Europe and the New World, this can explain not only the long run changes but also the difference in levels between Europe and the US (Piketty, 2011; Piketty and Zucman, 2013a).9
On the other hand, it should be noted that wealth concentration is significantly larger in the US, where the top 1% owns about 35% of aggregate wealth (vs. about 20%-‐25% in Europe). So far, existing studies have found that the increase in U.S. wealth concentration since the 1970s-‐1980s has been relatively moderate in contrast to the huge increase in US income concentration documented above (Kennickell, 2009; Kopczuk and Saez, 2004). However, we should be modest about our ability to
8 In particular, the smaller rise of the UK inheritance flow (as compared to France and Germany) is entirely due to the much smaller rise of recorded inter vivos gifts, which according to fiscal data barely rose in the UK during recent decades, while they have become almost as large as bequests in France and Germany. This might simply be due to the fact that gifts are not properly recorded by the UK tax administration (see Atkinson 2013). In the US, due to the limitations of federal fiscal data on bequests and gifts, scholars often use retrospective wealth survey data. The problem is that in countries where there exists exhaustive administrative data on bequests and gifts (such as France, and to some extent Germany), survey-‐based self-‐reported flows appear to be less than 50% of fiscal flows. This probably contributes to explain the low level of inheritance receipts found in a number of US studies (see e.g. Wolff and Gittleman, 2011; one additional bias in this study is that inherited assets are valued using asset prices at the time these assets were transmitted: no capital gain or income is included). 9 In a way, this is equivalent to the explanation based upon lower bequest taste: with higher population growth and the same bequest taste (per children), the US should save more. However a significant part of US population growth historically comes from migration, so this interpretation is not fully accurate.
10
measure the trends in top billionaire wealth. With low and diminishing growth rates and high global returns to capital, the potential for divergence of the wealth distribution is naturally quite large.
Joint distribution of earned and capital income
We have discussed earned income and capital income. The last piece of the puzzle concerns the joint distribution of earned and capital incomes – an aspect that is rarely given explicit consideration. Yet it is important to know whether the same people are at the top of both the distribution of capital income and the distribution of earned income. Suppose that we imagine asking the population first to line up along one side of a room in increasing order of their earned income and then to go to the other side of the room and line up in increasing order of their capital income. How much will they cross over? In the Ricardian class model, the crossing is complete: the capitalists come top in one case and bottom in the other. Has a negative correlation in the nineteenth century been replaced today by a zero correlation? Or is there a perfect correlation, so that people cross straight over? The pattern of crossing is given by the copula, which represents the joint distribution in terms of a function of the ranks in the two distributions of earnings and capital income. Because the copula compares ranks, it is not affected by whether the distributions themselves are widening or narrowing.
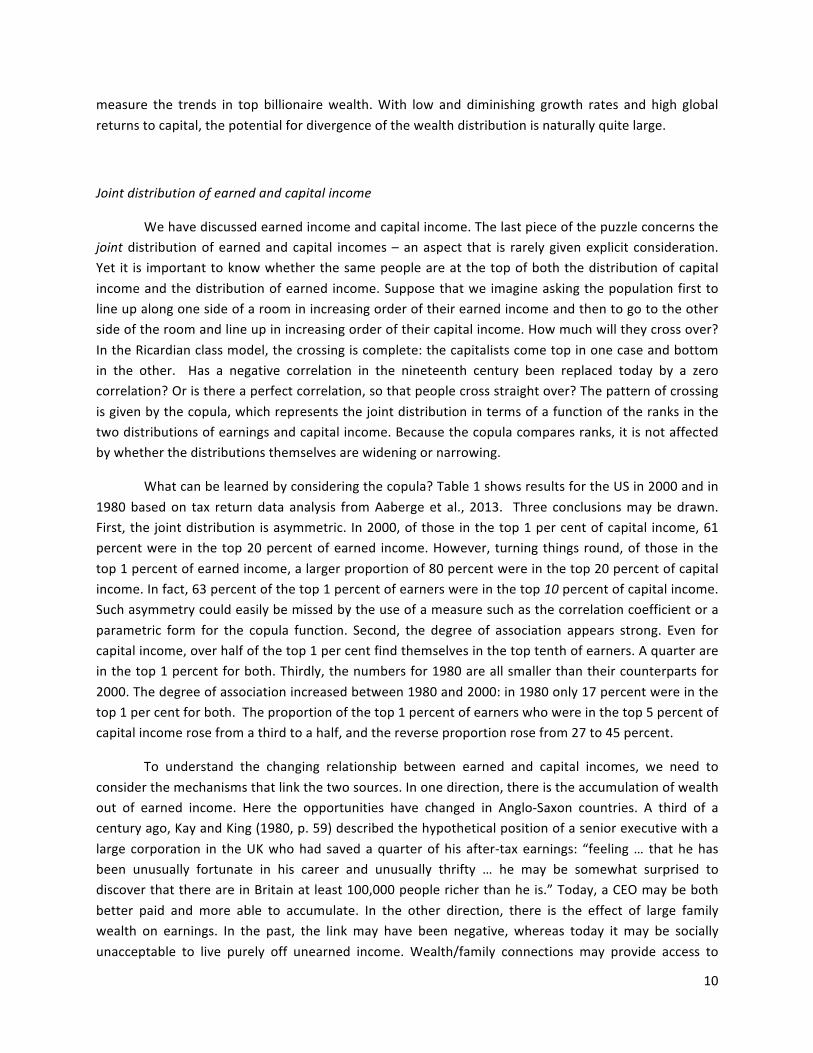
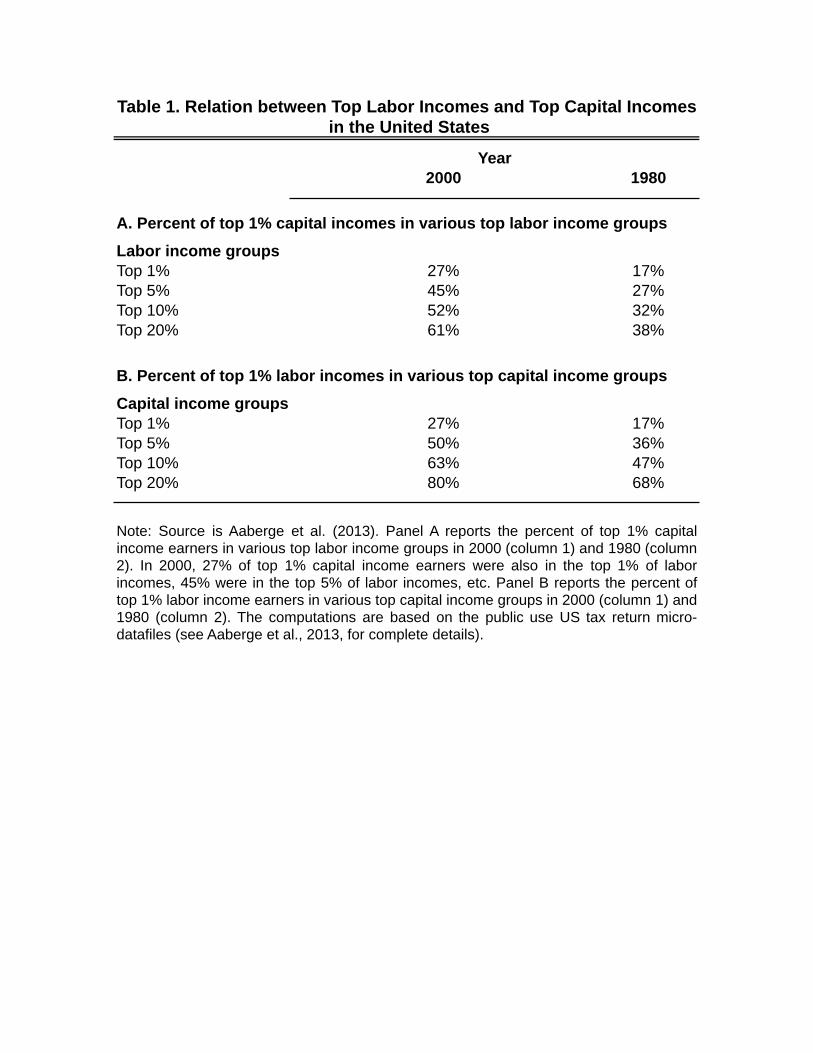
What can be learned by considering the copula? Table 1 shows results for the US in 2000 and in 1980 based on tax return data analysis from Aaberge et al., 2013. Three conclusions may be drawn. First, the joint distribution is asymmetric. In 2000, of those in the top 1 per cent of capital income, 61 percent were in the top 20 percent of earned income. However, turning things round, of those in the top 1 percent of earned income, a larger proportion of 80 percent were in the top 20 percent of capital income. In fact, 63 percent of the top 1 percent of earners were in the top 10 percent of capital income. Such asymmetry could easily be missed by the use of a measure such as the correlation coefficient or a parametric form for the copula function. Second, the degree of association appears strong. Even for capital income, over half of the top 1 per cent find themselves in the top tenth of earners. A quarter are in the top 1 percent for both. Thirdly, the numbers for 1980 are all smaller than their counterparts for 2000. The degree of association increased between 1980 and 2000: in 1980 only 17 percent were in the top 1 per cent for both. The proportion of the top 1 percent of earners who were in the top 5 percent of capital income rose from a third to a half, and the reverse proportion rose from 27 to 45 percent.
To understand the changing relationship between earned and capital incomes, we need to consider the mechanisms that link the two sources. In one direction, there is the accumulation of wealth out of earned income. Here the opportunities have changed in Anglo-‐Saxon countries. A third of a century ago, Kay and King (1980, p. 59) described the hypothetical position of a senior executive with a large corporation in the UK who had saved a quarter of his after-‐tax earnings: “feeling … that he has been unusually fortunate in his career and unusually thrifty … he may be somewhat surprised to discover that there are in Britain at least 100,000 people richer than he is.” Today, a CEO may be both better paid and more able to accumulate. In the other direction, there is the effect of large family wealth on earnings. In the past, the link may have been negative, whereas today it may be socially unacceptable to live purely off unearned income. Wealth/family connections may provide access to
11
high-‐paying employment (to assess this, it is necessary to investigate the cross-‐generation correlation of all income, not just earnings).
Conclusions
The rise in top income shares in the US is dramatic. In seeking explanations, however, it would be misleading to focus just on the doubling of the share of income going to the top 1 percent of the US distribution over the past 40 years. We also have to account for the fact that a number of high-‐income countries have seen more modest or little increase in top shares. Hence, the explanation cannot rely solely on forces common to advanced countries, like the impact of new technologies and globalization on the supply and demand for skills. Moreover, the explanations have to accommodate the falls in top income shares earlier in the twentieth century that characterize the countries discussed here.
In this paper, we have highlighted four main factors that have contributed to the growing income shares at the very top of the income distribution, noting that they may operate to differing extents in the US and other countries, particularly Continental Europe. The first is tax policy: top tax rates have moved in the opposite direction from top pre-‐tax income shares. The second factor is a richer view of the labor market, where we have contrasted the standard supply-‐side model with the alternative possibility that there may have been changes to bargaining power and greater individualization of pay. Tax cuts may have led managerial energies to be diverted to increasing their remuneration at the expense of enterprise growth and employment. The third factor is capital income. In Europe – but less so in the US -‐ private wealth (relative to national income) has followed a spectacular U-‐shaped path over time, and inherited wealth may there be making a return, implying that inheritance and capital income taxation will become again central policy tools for curbing inequality. The final, little investigated, element is the correlation between earned income and capital income, which have become more closely associated in the United States.
Acknowledgements
We are grateful to the editor, David Autor, the Managing Editor, Timothy Taylor, and Co-‐editors, Chang-‐Tai Hseih and Ulrike Malmendier for most helpful comments. Financial support from the MacArthur foundation, the Center for Equitable Growth at UC Berkeley, the Institute for New Economic Thinking at the Oxford Martin School, and the ESRC-‐DFID Joint Fund is thankfully acknowledged.
References
Aaberge, Rolf, Anthony B. Atkinson, Sebastian Königs, and Christoph Lakner, 2013. “Wages, capital and top incomes,” Working paper forthcoming.
12
Alvaredo, Facundo, Anthony B. Atkinson, Thomas Piketty, and Emmanuel Saez, 2011. The World Top Incomes Database, online at http://topincomes.g-‐mond.parisschoolofeconomics.eu/, 15 May 2013.
Atkinson, Anthony B., 2007. “The Distribution of Top Incomes in the United Kingdom 1908-‐2000” in A. B. Atkinson and T. Piketty (eds.), Top Incomes over the Twentieth Century -‐ A Contrast between Continental European and English-‐Speaking Countries (Volume 1), Oxford University Press: 82-‐140.
Atkinson, Anthony B., 2008. The Changing Distribution of Earnings in OECD Countries, Oxford: Oxford University Press, 506 pp.
Atkinson, Anthony B., 2012. “The Mirrlees Review and the State of Public Economics,” Journal of Economic Literature, 50(3): 770-‐80.
Atkinson, Anthony B., 2013. "Wealth and Inheritance in Britain from 1896 to the Present", working paper forthcoming.
Atkinson, Anthony B. and Allan J. Harrison, 1978. Distribution of Personal Wealth in Britain, Cambridge: Cambridge University Press.
Atkinson, Anthony B. and Thomas Piketty. 2007. Top Incomes over the Twentieth Century -‐ A Contrast between Continental European and English-‐Speaking Countries (Volume 1), Oxford: Oxford University Press: 585 pp.
Atkinson, Anthony B. and Thomas Piketty. 2010. Top Incomes -‐ A Global Perspective (Volume 2), Oxford: Oxford University Press: 776 pp.
Atkinson, Anthony B., Thomas Piketty, and Emmanuel Saez, 2011. “Top Incomes in the Long Run of History,” Journal of Economic Literature, 49(1), 3-‐71.
Atkinson, Anthony B. and Jakob E. Søgaard, 2013. “The long-‐run history of income inequality in Denmark: Top incomes from 1870 to 2010”, EPRU working paper 2013-‐01.
Diamond, Peter and Emmanuel Saez, 2011 “The Case for a Progressive Tax: From Basic Research to Policy Recommendations,” Journal of Economic Perspectives, 25(4), 165-‐90.
Feldstein, Martin. 1995. “The Effect of Marginal Tax Rates on Taxable Income: A Panel Study of the 1986 Tax Reform Act.” Journal of Political Economy, 103(3): 551-‐572.
Katz, Lawrence F., and David H. Autor. 1999. “Changes in the Wage Structure and Earnings Inequality,” in O. Ashenfelter and D. Card (eds.) Handbook of Labor Economics, volume 3A. Amsterdam: North-‐Holland.
Kay, John A., and Mervyn A. King 1980. The British Tax System, Oxford: Oxford University Press.
Kennickell, Arthur B. 2009. "Ponds and Streams: Wealth and Income in the U.S., 1989 to 2007," Finance and Economics Discussion Series 2009-‐13. Board of Governors of the Federal Reserve System.
13
Kleven, Henrik, Camille Landais, Emmanuel Saez, and Esben Schultz. 2013. “Migration and Wage Effects of Taxing Top Earners: Evidence from the Foreigners' Tax Scheme in Denmark”, NBER Working Paper, No. 18885.
Kopczuk, Wojciech and Emmanuel Saez. 2004. “Top Wealth Shares in the United States, 1916-‐2000: Evidence from Estate Tax Returns”, National Tax Journal, 57(2), Part 2, 445-‐487.
Kuznets, Simon. 1955. Economic Growth and Income Inequality. American Economic Review 45 (March): 1–28.
Lemieux, Thomas, W Bentley MacLeod, and Daniel Parent, 2009. “Performance Pay and Wage Inequality”, Quarterly Journal of Economics, 124(1): 1-‐49.
Lindsey, Lawrence. 1987. “Individual Taxpayer Response to Tax Cuts: 1982-‐1984, with Implications for the Revenue Maximizing Tax Rate,” Journal of Public Economics 33: 173-‐206.
MacLeod, Bentley and Malcomson, James, 1998. "Motivation and Markets," American Economic Review, 88(3): 388-‐411.
Mirrlees, J. A. 1971. An Exploration in the Theory of Optimum Income Taxation, Review of Economic Studies, 38(2): 175-‐208.
Philippon, Thomas and Ariell Reshef, 2012. “Wages and Human Capital in the U.S. Financial Industry: 1909-‐2006”, Quarterly Journal of Economics 127(4): 1551–1609.
Piketty, Thomas, 2011. “On the Long-‐run Evolution of Inheritance: France 1820-‐2050,” Quarterly Journal of Economics, 126(3): 1071-‐1131.
Piketty, Thomas, and Emmanuel Saez. 2003. “Income inequality in the United States, 1913-‐1998,” Quarterly Journal of Economics, 118(1): 1-‐39, series updated to 2011 in January 2013.
Piketty, Thomas, and Emmanuel Saez, 2012. “A Theory of Optimal Inheritance Taxation,” CEPR Discussion Paper No. 9241, forthcoming Econometrica.
Piketty, Thomas, and Emmanuel Saez. 2013. "Optimal Labor Income Taxation", forthcoming in A. Auerbach, R. Chetty, M. Feldstein, and E. Saez (eds.) Handbook of Public Economics, Volume 5, Elsevier-‐North Holland, forthcoming.
Piketty, Thomas, Emmanuel Saez, and Stefanie Stantcheva. 2011. “Optimal Taxation of Top Labor Incomes: A Tale of Three Elasticities,” NBER Working Paper No. 17616, forthcoming American Economic Journal: Economic Policy.
Piketty, Thomas, and Gabriel Zucman, 2013a. “Capital is Back: Wealth-‐Income Ratios in Rich Countries, 1700-‐2010,” PSE Working Paper.

14
Piketty, Thomas, and Gabriel Zucman, 2013b. “Wealth and Inheritance in the Long Run", forthcoming in A. Atkinson and F. Bourguignon (eds.) Handbook of Income Distribution, Volume 2, Elsevier-‐North Holland.
Schinke, Christoph. 2012. “Inheritance in Germany 1911 to 2009. A Mortality Multiplier Approach.” DIW-‐Berlin SOEP Paper n. 462.
Slemrod, Joel. 1996. “High Income Families and the Tax Changes of the 1980s: The Anatomy of Behavioral Response.” In Empirical Foundations of Household Taxation, eds. Martin Feldstein and James Poterba, University of Chicago.
Solow, Robert, 1971. “Some Implications of Alternative Criteria for the Firm”, in R. Marris and A. Wood (eds.), The Corporate Economy, Macmillan, pp. 318-‐342.
Wolff, Edward and Maury Gittleman. 2011. “Inheritances and the Distribution of Wealth Or Whatever Happened to the Great Inheritance Boom?”, Bureau of Labor Statistics Working Paper No. 445.
2000 1980
A. Percent of top 1% capital incomes in various top labor income groups Labor income groupsTop 1% 27% 17%Top 5% 45% 27%Top 10% 52% 32%Top 20% 61% 38%
B. Percent of top 1% labor incomes in various top capital income groups Capital income groupsTop 1% 27% 17%Top 5% 50% 36%Top 10% 63% 47%Top 20% 80% 68%
Year
Table 1. Relation between Top Labor Incomes and Top Capital Incomes in the United States
Note: Source is Aaberge et al. (2013). Panel A reports the percent of top 1% capitalincome earners in various top labor income groups in 2000 (column 1) and 1980 (column2). In 2000, 27% of top 1% capital income earners were also in the top 1% of laborincomes, 45% were in the top 5% of labor incomes, etc. Panel B reports the percent oftop 1% labor income earners in various top capital income groups in 2000 (column 1) and1980 (column 2). The computations are based on the public use US tax return micro-datafiles (see Aaberge et al., 2013, for complete details).
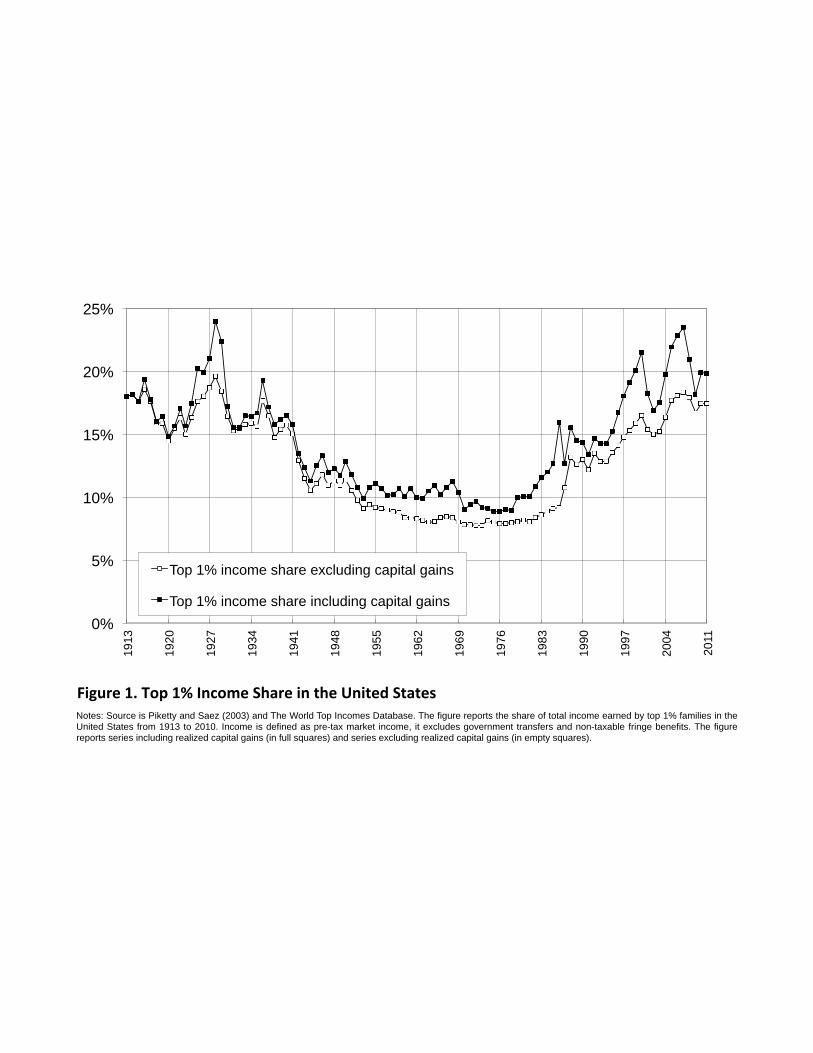
Figure 1. Top 1% Income Share in the United StatesNotes: Source is Piketty and Saez (2003) and The World Top Incomes Database. The figure reports the share of total income earned by top 1% families in theUnited States from 1913 to 2010. Income is defined as pre-tax market income, it excludes government transfers and non-taxable fringe benefits. The figurereports series including realized capital gains (in full squares) and series excluding realized capital gains (in empty squares).
0%
5%
10%
15%
20%
25%
1913
1920
1927
1934
1941
1948
1955
1962
1969
1976
1983
1990
1997
2004
2011
Top 1% income share excluding capital gains
Top 1% income share including capital gains
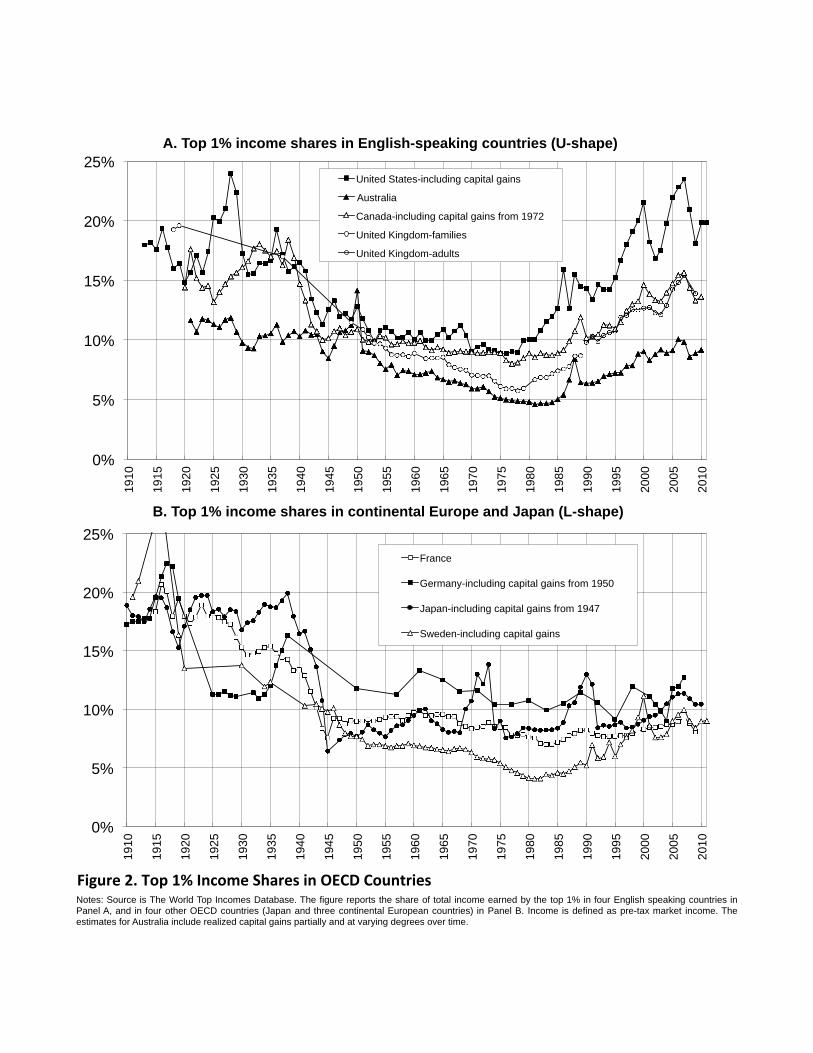
Figure 2. Top 1% Income Shares in OECD CountriesNotes: Source is The World Top Incomes Database. The figure reports the share of total income earned by the top 1% in four English speaking countries inPanel A, and in four other OECD countries (Japan and three continental European countries) in Panel B. Income is defined as pre-tax market income. Theestimates for Australia include realized capital gains partially and at varying degrees over time.
0%
5%
10%
15%
20%
25%
1910
1915
1920
1925
1930
1935
1940
1945
1950
1955
1960
1965
1970
1975
1980
1985
1990
1995
2000
2005
2010
A. Top 1% income shares in English-speaking countries (U-shape)
United States-including capital gains
Australia
Canada-including capital gains from 1972
United Kingdom-families
United Kingdom-adults
0%
5%
10%
15%
20%
25%
1910
1915
1920
1925
1930
1935
1940
1945
1950
1955
1960
1965
1970
1975
1980
1985
1990
1995
2000
2005
2010
B. Top 1% income shares in continental Europe and Japan (L-shape)
France
Germany-including capital gains from 1950
Japan-including capital gains from 1947
Sweden-including capital gains
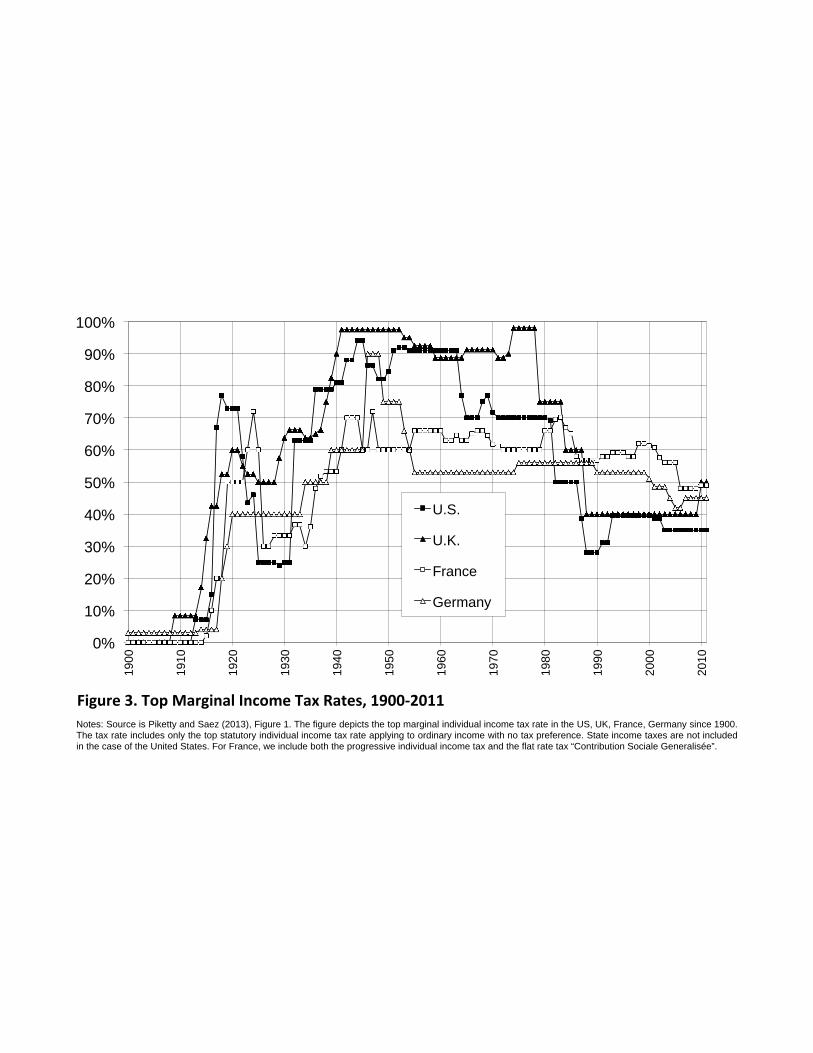
Figure 3. Top Marginal Income Tax Rates, 1900-‐2011Notes: Source is Piketty and Saez (2013), Figure 1. The figure depicts the top marginal individual income tax rate in the US, UK, France, Germany since 1900.The tax rate includes only the top statutory individual income tax rate applying to ordinary income with no tax preference. State income taxes are not includedin the case of the United States. For France, we include both the progressive individual income tax and the flat rate tax “Contribution Sociale Generalisée”.
0%
10%
20%
30%
40%
50%
60%
70%
80%
90%
100%
1900
1910
1920
1930
1940
1950
1960
1970
1980
1990
2000
2010
U.S.
U.K.
France
Germany
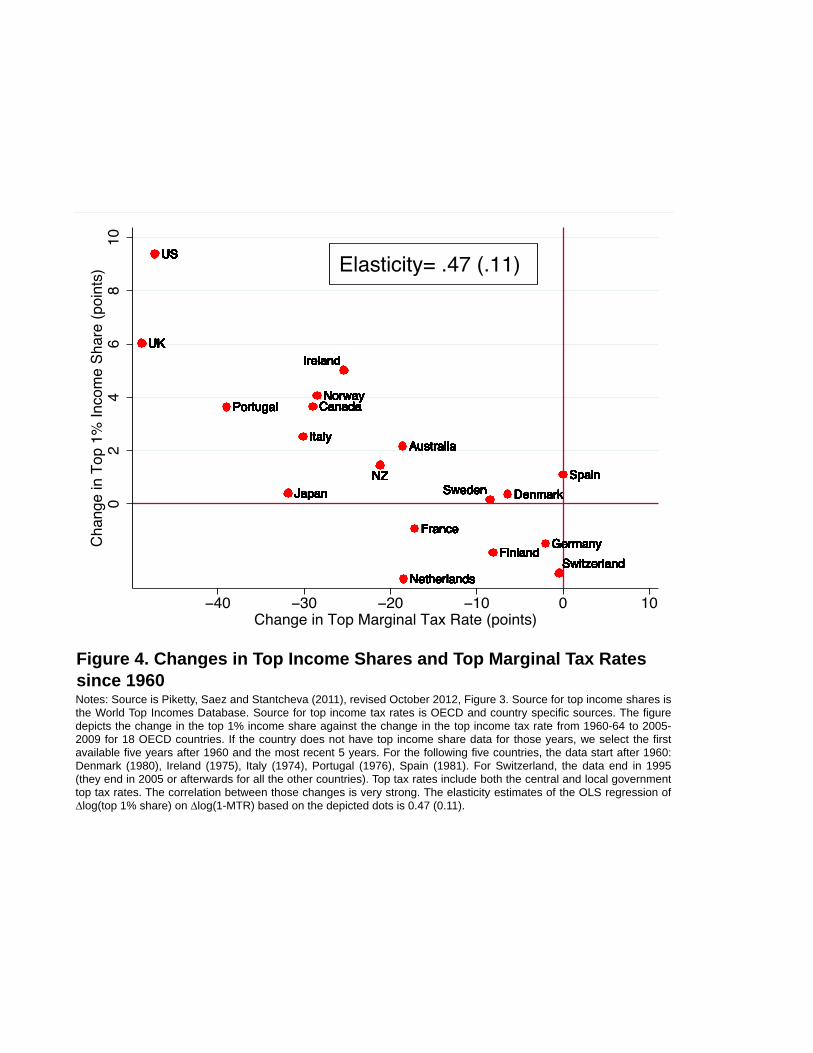
Notes: Source is Piketty, Saez and Stantcheva (2011), revised October 2012, Figure 3. Source for top income shares isthe World Top Incomes Database. Source for top income tax rates is OECD and country specific sources. The figuredepicts the change in the top 1% income share against the change in the top income tax rate from 1960-64 to 2005-2009 for 18 OECD countries. If the country does not have top income share data for those years, we select the firstavailable five years after 1960 and the most recent 5 years. For the following five countries, the data start after 1960:Denmark (1980), Ireland (1975), Italy (1974), Portugal (1976), Spain (1981). For Switzerland, the data end in 1995(they end in 2005 or afterwards for all the other countries). Top tax rates include both the central and local governmenttop tax rates. The correlation between those changes is very strong. The elasticity estimates of the OLS regression of∆log(top 1% share) on ∆log(1-MTR) based on the depicted dots is 0.47 (0.11).
Figure 4. Changes in Top Income Shares and Top Marginal Tax Rates since 1960
AustraliaAustraliaAustraliaAustraliaAustraliaAustraliaAustraliaAustraliaAustraliaAustraliaAustraliaAustraliaAustraliaAustraliaAustraliaAustraliaAustraliaAustraliaAustraliaAustraliaAustraliaAustraliaAustraliaAustraliaAustraliaAustraliaAustraliaAustraliaAustraliaAustraliaAustraliaAustraliaAustraliaAustraliaAustraliaAustraliaAustraliaAustraliaAustraliaAustraliaAustraliaAustraliaAustraliaAustraliaAustraliaAustraliaAustraliaAustraliaAustralia
CanadaCanadaCanadaCanadaCanadaCanadaCanadaCanadaCanadaCanadaCanadaCanadaCanadaCanadaCanadaCanadaCanadaCanadaCanadaCanadaCanadaCanadaCanadaCanadaCanadaCanadaCanadaCanadaCanadaCanadaCanadaCanadaCanadaCanadaCanadaCanadaCanadaCanadaCanadaCanadaCanadaCanadaCanadaCanadaCanadaCanadaCanadaCanadaCanadaCanada
DenmarkDenmarkDenmarkDenmarkDenmarkDenmarkDenmarkDenmarkDenmarkDenmarkDenmarkDenmarkDenmarkDenmarkDenmarkDenmarkDenmarkDenmarkDenmarkDenmarkDenmarkDenmarkDenmarkDenmarkDenmarkDenmark
FinlandFinlandFinlandFinlandFinlandFinlandFinlandFinlandFinlandFinlandFinlandFinlandFinlandFinlandFinlandFinlandFinlandFinlandFinlandFinlandFinlandFinlandFinlandFinlandFinlandFinlandFinlandFinlandFinlandFinlandFinlandFinlandFinlandFinlandFinlandFinlandFinlandFinlandFinlandFinlandFinlandFinlandFinlandFinlandFinlandFinlandFinlandFinlandFinlandFinland
FranceFranceFranceFranceFranceFranceFranceFranceFranceFranceFranceFranceFranceFranceFranceFranceFranceFranceFranceFranceFranceFranceFranceFranceFranceFranceFranceFranceFranceFranceFranceFranceFranceFranceFranceFranceFranceFranceFranceFranceFranceFranceFranceFranceFranceFranceFranceGermanyGermanyGermanyGermanyGermanyGermanyGermanyGermanyGermanyGermanyGermanyGermanyGermanyGermanyGermanyGermanyGermanyGermanyGermanyGermanyGermanyGermanyGermanyGermanyGermanyGermanyGermanyGermanyGermanyGermanyGermanyGermanyGermanyGermanyGermanyGermanyGermanyGermanyGermanyGermanyGermanyGermanyGermanyGermanyGermanyGermanyGermanyGermany
IrelandIrelandIrelandIrelandIrelandIrelandIrelandIrelandIrelandIrelandIrelandIrelandIrelandIrelandIrelandIrelandIrelandIrelandIrelandIrelandIrelandIrelandIrelandIrelandIrelandIrelandIrelandIrelandIrelandIrelandIrelandIrelandIrelandIrelandIreland
ItalyItalyItalyItalyItalyItalyItalyItalyItalyItalyItalyItalyItalyItalyItalyItalyItalyItalyItalyItalyItalyItalyItalyItalyItalyItalyItalyItalyItalyItalyItalyItalyItalyItalyItalyItaly
JapanJapanJapanJapanJapanJapanJapanJapanJapanJapanJapanJapanJapanJapanJapanJapanJapanJapanJapanJapanJapanJapanJapanJapanJapanJapanJapanJapanJapanJapanJapanJapanJapanJapanJapanJapanJapanJapanJapanJapanJapanJapanJapanJapanJapanJapan
NetherlandsNetherlandsNetherlandsNetherlandsNetherlandsNetherlandsNetherlandsNetherlandsNetherlandsNetherlandsNetherlandsNetherlandsNetherlandsNetherlandsNetherlandsNetherlandsNetherlandsNetherlandsNetherlandsNetherlandsNetherlandsNetherlandsNetherlandsNetherlandsNetherlandsNetherlandsNetherlandsNetherlandsNetherlandsNetherlandsNetherlandsNetherlandsNetherlandsNetherlandsNetherlandsNetherlandsNetherlandsNetherlandsNetherlandsNetherlandsNetherlandsNetherlandsNetherlandsNetherlandsNetherlandsNetherlandsNetherlands
NZNZNZNZNZNZNZNZNZNZNZNZNZNZNZNZNZNZNZNZNZNZNZNZNZNZNZNZNZNZNZNZNZNZNZNZNZNZNZNZNZNZNZNZNZNZNZNZNZNZ
NorwayNorwayNorwayNorwayNorwayNorwayNorwayNorwayNorwayNorwayNorwayNorwayNorwayNorwayNorwayNorwayNorwayNorwayNorwayNorwayNorwayNorwayNorwayNorwayNorwayNorwayNorwayNorwayNorwayNorwayNorwayNorwayNorwayNorwayNorwayNorwayNorwayNorwayNorwayNorwayNorwayNorwayNorwayNorwayNorwayNorwayNorwayNorwayNorwayPortugalPortugalPortugalPortugalPortugalPortugalPortugalPortugalPortugalPortugalPortugalPortugalPortugalPortugalPortugalPortugalPortugalPortugalPortugalPortugalPortugalPortugalPortugalPortugal
SpainSpainSpainSpainSpainSpainSpainSpainSpainSpainSpainSpainSpainSpainSpainSpainSpainSpainSpainSpainSpainSpainSpainSpainSpainSpainSpainSpainSpain
SwedenSwedenSwedenSwedenSwedenSwedenSwedenSwedenSwedenSwedenSwedenSwedenSwedenSwedenSwedenSwedenSwedenSwedenSwedenSwedenSwedenSwedenSwedenSwedenSwedenSwedenSwedenSwedenSwedenSwedenSwedenSwedenSwedenSwedenSwedenSwedenSwedenSwedenSwedenSwedenSwedenSwedenSwedenSwedenSwedenSwedenSwedenSwedenSwedenSwedenSweden
SwitzerlandSwitzerlandSwitzerlandSwitzerlandSwitzerlandSwitzerlandSwitzerlandSwitzerlandSwitzerlandSwitzerlandSwitzerlandSwitzerlandSwitzerlandSwitzerlandSwitzerlandSwitzerlandSwitzerlandSwitzerlandSwitzerlandSwitzerlandSwitzerlandSwitzerlandSwitzerlandSwitzerlandSwitzerlandSwitzerlandSwitzerlandSwitzerlandSwitzerlandSwitzerlandSwitzerlandSwitzerlandSwitzerlandSwitzerlandSwitzerlandSwitzerland
UKUKUKUKUKUKUKUKUKUKUKUKUKUKUKUKUKUKUKUKUKUKUKUKUKUKUKUKUKUKUKUKUKUKUKUKUKUKUKUKUKUKUKUKUKUKUKUKUKUK
USUSUSUSUSUSUSUSUSUSUSUSUSUSUSUSUSUSUSUSUSUSUSUSUSUSUSUSUSUSUSUSUSUSUSUSUSUSUSUSUSUSUSUSUSUSUSUSUSUSUSElasticity= .47 (.11)
02
46
810
Change in
Top 1
% Inco
me S
hare
(poin
ts)
−40 −30 −20 −10 0 10Change in Top Marginal Tax Rate (points)
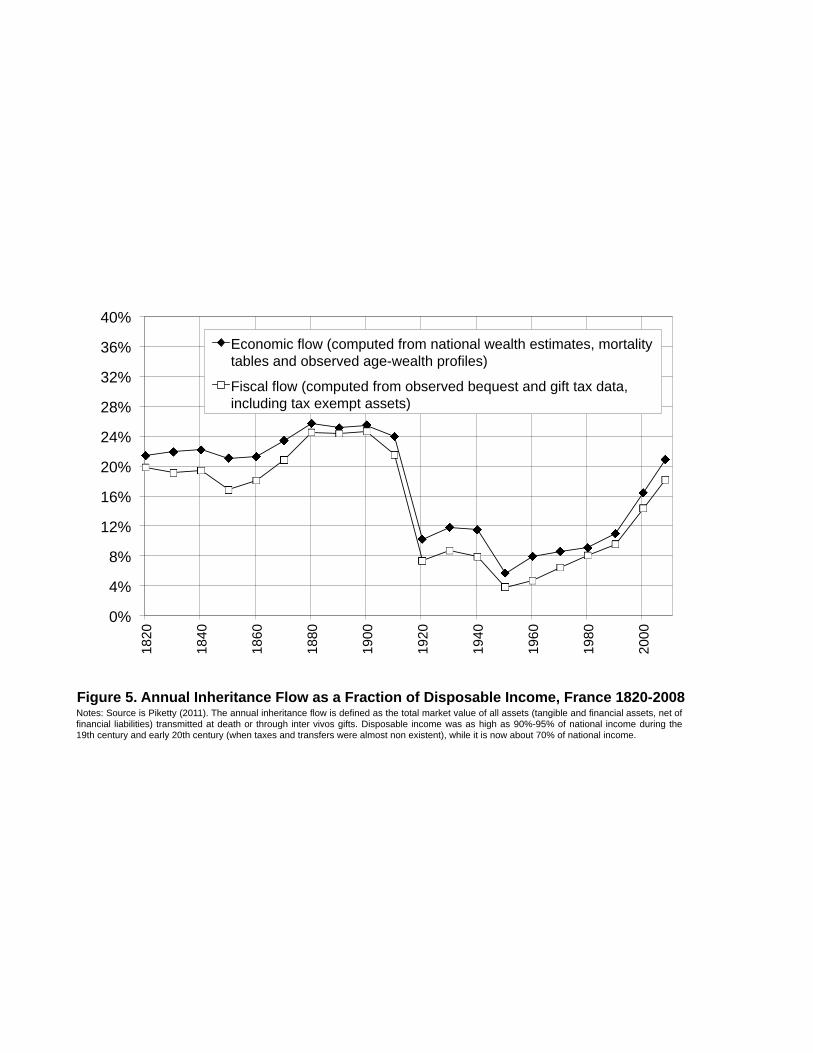
Figure 5. Annual Inheritance Flow as a Fraction of Disposable Income, France 1820-2008Notes: Source is Piketty (2011). The annual inheritance flow is defined as the total market value of all assets (tangible and financial assets, net offinancial liabilities) transmitted at death or through inter vivos gifts. Disposable income was as high as 90%-95% of national income during the19th century and early 20th century (when taxes and transfers were almost non existent), while it is now about 70% of national income.
0%
4%
8%
12%
16%
20%
24%
28%
32%
36%
40%
1820
1840
1860
1880
1900
1920
1940
1960
1980
2000
Economic flow (computed from national wealth estimates, mortality tables and observed age-wealth profiles)
Fiscal flow (computed from observed bequest and gift tax data, including tax exempt assets)
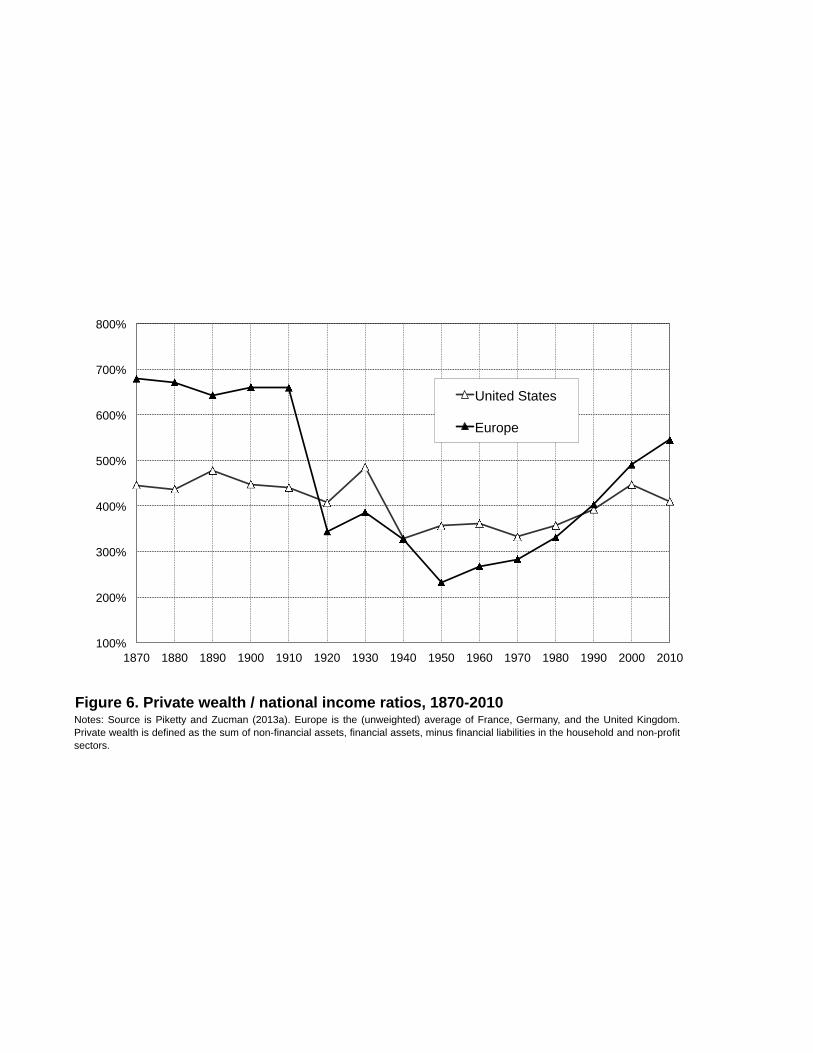
Figure 6. Private wealth / national income ratios, 1870-2010Notes: Source is Piketty and Zucman (2013a). Europe is the (unweighted) average of France, Germany, and the United Kingdom.Private wealth is defined as the sum of non-financial assets, financial assets, minus financial liabilities in the household and non-profitsectors.
100%
200%
300%
400%
500%
600%
700%
800%
1870 1880 1890 1900 1910 1920 1930 1940 1950 1960 1970 1980 1990 2000 2010
United States
Europe