Embed Size (px)
Citation preview

THE TITRATION OF SOME PHOSPHATIDES AND RELATED COMPOUNDS IN A
NON-AQUEOUS MEDIUM*
BY JAMES E. GARVINt AND MANFRED L. KARNOVSKY
(From the Department of Biological Chemistry and the Biophysical Laboratory, Harvard Medical School, Boston, Massachusetts)
(Received for publication, November 16, 1955)
Information regarding the ionic species of the phosphatides as they exist in lipide solvents may be inferred from their acid-base titration curves in such solvents. A number of titrations of lecithin (24) and of “cephalin” (2, 4, 5) have been reported. However, the chemical composition of some of the preparations employed, especially the “cephalin,” is questionable. In addition, cross-comparison of the available data is difficult, as different solvents were used by the various investigators. Finally, evaluation of the behavior of the phosphatide functional groups in aqueous medium re- mains uncertain. The clarification of the chemical species present in brain “cephalin” by Folch (6-9) and the availability of synthetic phosphatides by the methods of Baer et al. (10, 11) have suggested the reexamination of the properties of the phosphatides when titrated in non-aqueous media.
An electrometric titration system in which a solvent mixture which dis- solves a large number of lipides is employed has been developed. Titra- tions of phosphatidylcholine, phosphatidylserine, phosphatidylethanola- mine, a phosphatidic acid, and fatty acids, as well as related compounds, were carried out. The method described should be of interest in connec- tion uith the quantitative determination and ident,ification of small amounts of lipide substances. Further, the data obt,ained permit infer- ences to be drawn regarding the ionic species present in solution under conditions defined as to solvent composit’ion, inorganic ions present, and apparent ~1-1 as measured by the glass electrode.
* This investigation was supported by a contract with the Atomic Energy Commis- sion and by the Eugene Higgins Trust through Harvard University. Some of the data presented are from a thesis submitted by James E. Garvin to the Faculty of the Graduate School of Arts and Sciences of Harvard University, Division of Medical Sciences, in partial fulfilment of the requirements for the degree of Doctor of Philos- ophy. A preliminary report has already been presented (1).
t Postdoctoral Fellow of the United States Public Health Service, 1951-53. Pres- ent address, Department of Nutrition, Harvard School of Public Health, 1 Shattuck Street, Boston 15, Massachuset.ts.
211
by guest on January 8, 2019http://w
ww
.jbc.org/D
ownloaded from

212 NON-AQUEOUS TITRATION OF PHOSPHATIDES
Materials
In the titrations the following materials were employed: potassium acid phthalate, Mallinckrodt primary standard; DL-alanine, Eastman No. 845 (total nitrogen, theory 15.7 per cent, found 15.8 per cent) ; glycine, Eastman No. 445 (total nitrogen, theory 18.7 per cent, found 19.3 per cent); DL-
serine, Merck recrystallized (total nitrogen, theory 13.8 per cent, found 13.4 per cent); ethanolamine, Eastman No. 1597, distilled from potassium hydroxide just before use, b.p. 168-171” (corrected); stearic acid, Merck, five times recrystallized, m.p. 69.5-70.0”; palmitic acid, Eastman No. 1213; lauric acid, Eastman No. 933; myristic acid, Matheson No. 2431; benzoic acid, Mallinckrodt analytical reagent, sublimed two times; acetic acid, Baker’s analyzed; lactic acid, Mallinckrodt 85 per cent; p-hydroxybenzoic acid, Poulenc F&es, resublimed, m.p. 214” (corrected) ; P-glycerophos- phoric acid, disodium salt (pentahydrate), Eastman No. 3532, maximal content of the OL isomer 0.1 per cent (tot,al phosphorus, theory 10.1 per cent, found 9.8 per cent).
The dipalmitoyl-L-c+glycerophosphoric acid’ was a synthetic prepara- tion (10). The phosphatidylserine, prepared from ox brain according to Folch (8), had the following composition: N 1.76 per cent, P 3.62 per cent, NH*-N 1.44 per cent, COOH-N2 1.44 per cent, nitrogen as serine 1.31 per cent, nitrogen as ethanolamine 0.03 per cent, iodine number 65. Egg lecithin prepared according to Pangborn (12) had the following composi- tion: N 1.82 per cent, P 3.94 per cent, N:P 1.01 (molar ratio), NHZ-N less than 1 per cent (as phosphatidylethanolamine or phosphatidylserine), iodine number 54.2, soap plus free fatty acid 0 per cent. The L-oc-dimy- ristoylcephalin, which was a synthetic preparation1 (ll), had the following composition: NHZ-N 2.1 per cent, P 4.96 per cent. The L-a-dipalmitoyl- lecithin3 prepared from yeast (13) had the following composition: N 2.10 per cent, P 4.70 per cent, N:P 0.97 (molar ratio), iodine number 0, soap plus free fatty acid 8 per cent. With the exception of the rat,her high phos- phorus and nitrogen values for the L-or-dipalmitoyllecithin, these data are in accord with those reported in t,he literature.
Methods
In the analysis of the materials the following procedures were employed: total phosphorus by the method of King (14) ; iodine number by the micro- method of Yasuda (15); total nit.rogen by a wet combustion met’hod (16) slightly modified from Uzman;4 NH2-N according to Van Slyke (17), as
1 The authors are greatly indebted to Dr. Erich Baer for these preparations. 2 We wish to express our appreciation to Dr. J. Folch and Dr. M. Lees for carrying
out this determination. * The authors are greatly indebted to Dr. D. J. Hanahan for this sample. 4 Personal communication of Dr. J. Folch.
by guest on January 8, 2019http://w
ww
.jbc.org/D
ownloaded from

J. E. GARVIN AND M. L. KARNOVSKY 213
modified by Folch4 (8) for phosphatides; nitrogen as serine or ethanolamine by the procedure of Axelrod et al. (18) ; amino nitrogen as phosphatidyl- serine or phosphatidyletjhanolamine by spot testing on paper with the buffered ninhydrin reagent of Moore and Stein (19). The free fatty acid and soap determinations were made by the non-aqueous titration procedure described in this paper.
The solvent system employed in the titrations consisted of 99 per cent (volume per volume) (11.0 M) 2-ethoxyethanol and 1 per cent (0.56 M)
water. The mixture was 0.001 M with respect to KCl. This solvent mixture (without the KCl) had a dielectric constant of 14 f l5 at low frequency (lo5 cycles per second). The titrations were followed by meas- uring the potential difference developed between a glass electrode (Beck- man 4990-29) and a saturated calomel half cell reference electrode (Beck- man 4970-29) immersed in the solution. Potentials, recorded in millivolts, were measured with a potentiometer (Beckman model H-2 pH meter). The materials to be titrated (approximately 1 Req.) were dissolved in 2.0 ml. of solvent mixture and added to a small glass cup. The cup was at- tached to the titration apparatus with a gas-tight seal, the apparatus was flushed with nitrogen, and the titration was carried out by the addition of small increments of 0.01 N HCl or KOH in a solvent mixture of 99 per cent (volume per volume) 2-ethoxyethanol and 1 per cent water. Back- titration with either acid or base was accomplished without taking down the apparatus since two burettes, one containing acid and one base, were routinely incorporated in the arrangement of equipment. Mixing was provided by a magnetic stirrer. All the titrations were carried out at room temperature which varied from 21-27”.
In the preliminary titrations the potentiometer was standardized with 0.05 M potassium acid phthalate (pH 4.008 at 25’ (20)) and Beckman buffer solution (pH 7.07 f 0.04 at 25”). In the phosphatide titrations the fol- lowing four reference solutions were used: 0.100 N HCl, pH 1.085 at 25” (21); 0.050 M potassium acid phthalate as above; phosphate buffer, pH 6.994 at 25” (22); 0.050 M sodium borate, pH 9.180 at 25” (21).
End-points and mid-points (“PK’,“)~ were estimated from the titration curves by a simple graphical procedure, which gave greater stoichiometric accuracy and precision than the ApH/AB method (23). A template was fitted to the titration curve plotted after subtraction of the blank and ro- tated through 180”. Corresponding points on the mirror image arms of the curve were noted. End-points were assigned at positions plus and minus 120 mv. (or 2.0 “pH” units) from the mid-point of symmetry.
5 We wish to express our appreciation to Dr. J. L. Oncley and Mr. J. K. Inman for carrying out this determination.
6 Throughout this paper apparent pH or apparent pK’, in the 2-ethoxyethanol solvent system is referred to as “pH” or “PK’~“, respectively.
by guest on January 8, 2019http://w
ww
.jbc.org/D
ownloaded from

214 NON-AQUEOUS TITRATION OF PHOSPHATIDES
“PK’,” was designated as this mid-point. “pH” numbers were assigned to the millivolt values according to the equation
E, - Kb -= A-%/APHb “PH” (1)
where E, is the measured electromotive force in the 2-ethoxyethanol sol- vent and AEb/ApHb and Kb are the slope and intercept, respectively, of the electrode pair employed with the aqueous reference standards.
8
DL ALANINE (K2)
pKg5 .j
GLYCINE (K 2 --2 1
ETHANOLAMINE /‘O ’ o
6 0
4
2-
- / /
Oo’ 2 I I I I I I I I,,
4 6 8 IO 12
” PKb ‘I FIG. 1. Relation of apparent pK’= (“PK’~“) to PK,,~~ (in water). Measurement of
“PK’,” was made from titration curves obtained with the glass electrode and sat- urated calomel half cell reference electrode. The solvent system was 99 per cent (volume per volume) 2-ethoxyethanol, 1 per cent water, and 0.001 M KCl. The val- ues for the pK,26 (which include a number of pK’,z6 values) were obtained from the following sources: nn-serine, K’, and K’, (28); glycine, K’I and K’Q; m-alanine, K’, and K’s (29) ; potassium acid phthalate, KI (30) and I<2 (31) ; lactic acid, K (32) ; ben- zoic acid, K (24) ; ethanolamine, K (27) ; acetic acid, K (24) ; p-hydroxybenzoic acid, K1 (33) ; P-glycerophosphoric acid, K’I and K’z (26).
In practice when 1 to 2 peq. was titrated, these procedures regularly gave results in the “pK’,” range of 3.8 to 8.5 to within 2 per cent of the value of the carboxyl groups, as determined by independent characteriza- tion of the compounds. Thus, by using base standardized against pure benzoic acid the following purity was determined by triplicate titrations for several of Dhe compounds noted under “Materials:” potassium acid phthalate 102 f 1 per cent, p-hydroxybenzoic acid 99 f 1 per cent, stearic acid 102 f 1 per cent, nn-serine (carboxyl group) 98 f 4 per cent. Out- side the range of “pK’a” mentioned above, the titration values were less exact. When an end-point at either margin of the titration range was
by guest on January 8, 2019http://w
ww
.jbc.org/D
ownloaded from

.I. E. GARVIN AND M. L. KARNOVSKY 215
uncertain but a mid-point of symmetry could be established, the total titer was estimated by taking twice the value between the “pKh” and the certain end-point. This was found necessary with the 0.01 N titrants only when the end-points were less than “pH” 2 or greater than “pH” 11.
An estimate of the variability of individual measurements of the “PK’~” was provided by a comparison of the mid-points measured for the benzoic acid standard over a period of months. In thirty titrations of benzoic acid in the non-aqueous solvent mixture an average “PK’~” of 7.79 f 0.11 (standard deviation) was obtained. The reliability of the apparatus itself was further tested by employing it in the apueous titration of representative known materials. These aqueous titrations were conducted at approxi-
- + MILLIVOLTS - + I I I II 11 11 1 I 2 4 6 a IO 12
APPARENT pH
FIG. 2. Theoretical law of mass action curve compared with stearic acid titration curve. The solid line represents the mass law relationship; the circles represent the experimentally determined points after subtraction of a small blank. The solvent system was 99 per cent (volume per volume) 2-ethoxyethanol, 1 per cent water, and 0.001 M KCI.
mately 0.005 M with respect to the total amount of the compound with the following results: acetic acid, pKla = 4.76 f 0.02, pKaz6 = 4.76 (24) ; second acid dissociation constant of &-glycerophosphoric acid, pK’, = 6.51 f 0.02, pKaz5 = 6.6 (25), and PK’,~~ = 6.34 (26); ethanolamine, pK’, = 9.25 f 0.02, PK’,,~~ at approximately 0.005 M = 9.36 (27).
Results
Preliminary Titration of Some Compounds Containing Carboxyl and Amino Groups Which Are Soluble in Both &Ethoxyethanol
Solvent System and Water
The apparent pK’, (“pK’,“) values obtained for a series of compounds were plotted against their pK,2S values (in water) as shown in Fig. 1. The
by guest on January 8, 2019http://w
ww
.jbc.org/D
ownloaded from

216 NON-AQUEOUS TITRATION OF PHOSPHATIDES
solid line (obtained by the method of averages) through the points for the carboxyl groups is described by the equation
pK,26 = 0.5”pK’,” + 0.5 (2)
Titration of Fatty Acids
A comparison of the experimentally obtained curve for stearic acid with the mass law equation
“pH [A-l ” = c(pK’aPP + log - [HAI (3)
is shown in Fig. 2. The agreement is quite close. The acid dissociation
TABLE I
Calculated PK,~~ Values for Some Long Chain Fatty Acids
The empirical Equation 2, pK,26 = 0.5 “pKla” + 0.5, was used to obtain these estimates. ‘LpKlaX denotes the apparent pK’, as determined in the solvent system 99 per cent (volume per volume) 2-ethoxyethanol, 1 per cent water, and 0.001 M KCI.
Fatty acid I “PK~” pK,= (calculated)
Stearic acid ...................................... Palmitic acid ..................................... Myristic “ ..................................... Laurie acid ....................................... Acetic “ .......................................
8.4 4.7 8.2 4.6 8.3 4.7 8.2 4.6 8.1 4.6*
* Our value for acetic acid measured in the same apparatus as was used for the non-aqueous titrations was pK’, = 4.76 at approximately 0.005 M. The pK,*s has been determined to be 4.76 (24).
constants of five fatty acids expressed as “PK’~” found by titration in the non-aqueous medium and as calculated pK’, in aqueous medium from Equation 2 are shown in Table I.
Titration of Some Phosphatides
Fig. 3 and Table II show the results obtained on titrating some phos- phatides (as well as nn-serine, ethanolamine, and /3-glycerophosphoric acid) in the 2-ethoxyethanol solvent system. To test for a possible interaction of lecithin and fatty acid in this solvent system, 1 pmole of palmitic acid was quantitatively titrated in the presence of 5 pmoles of egg lecithin. The presence of the lecithin did not affect the “PK’~” of the palmitic acid, nor did the presence of the palmitic acid appreciably affect the appearance of the lecithin curve outside the range of the “pK’=” for palmitic acid f2.0 “pH” units. The yeast lecithin preparation showed buffering correspond-
by guest on January 8, 2019http://w
ww
.jbc.org/D
ownloaded from

J. E. GARVIN AND M. L. KARNOVSKY 217
ing to 8 per cent of the phosphorus on a molar basis. The mid-point of this buffering was 8.2 f 0.1 “PI-I” units. Since the amino nitrogen, as phosphatidylserine or phosphatidylethanolamine, was less than 1 per cent of the phosphorus on a molar basis, this buffering u’as assigned to “free” fatty acids. Of importance in this regard was the finding that the bulk of titratable fatty acid (unesterified fatty acid) was in the salt form. Hence, if the determination of “free” fatty acid had been carried out by titration with base alone, the salt (soap) present would have been undetected.
APPARENT pH APPARENT pH FIG. 3. Titration curves of some phosphatides. The titrations were carried out
with approximately 0.01 N HCl and KOH in a solvent system consisting of 99 per cent (volume per volume) 2-ethoxyethanol, 1 per cent water, and 0.001 M KCI. The titra- tion curves have been normalized as follows: Curve A (dipalmitoyl-n-a-glycerophos- phoric acid) to 1 peq. of phosphatide phosphorus added, Curve B (phosphatidylserine from brain) to 1 Feq. of NHs-N and COOK-N (NH,-N and COOH-N were exactly equal for this preparation), Curve C (n-a-dimyristoylcephalin) to 0.25peq. of NH,-N added, Curve D (egg lecithin) to 5 peq. of phosphatide phosphorus added.
DISCUSSION
The quantitative correspondence of the titrations with the value of the functional groups as determined by separate chemical analysis is taken as support for the belief that these titrations are actually of the groups indi- cated. Thus the contour of the titration curve and its position in the ‘LpH” scale serve both to identify and determine quantitatively the various groups. In addition, the close conformity of the titration curves to contours con- sistent with simple mass law considerations suggests that the ionic species present in the solvent at the different points in the titration are such as this law predicts. Hence, although the “pH” numbers are recognized as
by guest on January 8, 2019http://w
ww
.jbc.org/D
ownloaded from

218 NON-AQUEOUS TITRATION OF PHOSPHATIDES
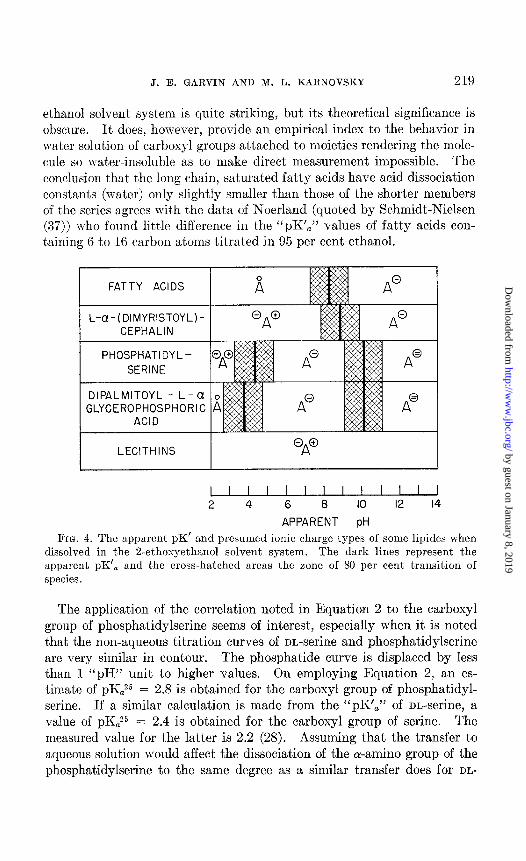
arbitrary, they would appear to provide information about the events dur- ing titration. The presumed charge types for a number of lipides as a func- tion of “pH” as measured by the glass electrode are summarized in Fig. 4. No assumptions are made concerning associat’ion with anions or cations or solvent molecules.
TABLE II
Quantitative Data from Titrations in d-Ethoxyethanol Solvent System*
Material titrated
(A) Dipalmitoyl-n-a-glyc- erophosphoric acid.
(B) fl-Glycerophosphoric acid.
(6) nn-Serine. (D) Phosphatidylserine (E) Ethanolaminc§. (F) n-a:-Dimyristoylceph-
alinjj (G) n-a-Dimyristoylceph-
alinT.
Lmount Acid-dissociable groups Base-dissociable groups
usedt “pK’e”# “pK’a”$
PW. wq. WI.
0.89 0.88 f 0.014.1 rt 0.1 0.94 f 0.0 10.0 f 0.1
1.00 1.03 f 0.014.0 f 0.1 0.99 f 0.04 9.2 f 0.1 0.91 0.89 f 0.043.8 f 0.1 0.97 f 0.02 9,s Irt 0.1 0.76 0.79 f 0.014.6 f 0.000.86 f 0.0310.3 f 0.1 0.90 0.91 f 0.01 8.1 f 0.0
0.23 0.41 f 0.01 9.1 f 0.1
0.11 0.15 f 0.01 9.1 f 0.2
* All titrations uere carried out at least in duplicate. The mean values are fol- lowed by the maximal deviation from the mean.
t All values were obtained by independent chemical analysis relating to the func- tional groups as follows: (A) and (B) by phosphorus determination, (C) by total nitrogen determination, (D) carboxyl group by COOH-N determination andor-amino nitrogen group by total NH2-N determination, (E), (F), and (G) by total NH2-N determination.
$ “pK’a” refers to the apparent pK’ (1 obtained in the 2-ethoxyethanol solvent system in which the glass electrode and saturated calomel half cell reference elec- trode are employed.
8 Stirred at apparent pH (“pH”) 1.8 for 1 hour. 11 Initial titration with IICl immediately followed with KOH. 7 Stirred for 1 hour at apparent pH (“pH”) 3.5 before titration with KOH.
The direction and magnitude of the acid dissociation constant changes in the 2-ethoxyethanol solvent system as measured with the glass electrode are quite similar to what would have been expected if the hydrogen elec- trode had been employed. This is apparent when the values reported here are compared with those for the same compounds in alcohol (34-36). This conformity applies to carboxyl, amino, and a-amino groups.
The correlation, noted in Equation 2, for the half titration points of the carboxyl groups of the compounds soluble in both water and the 2-ethoxy-
by guest on January 8, 2019http://w
ww
.jbc.org/D
ownloaded from
J. E. GARVIN AND M. L. KARNOVSKY 219
ethanol solvent system is quite striking, but its theoretical significance is obscure. It does, however, provide an empirical index to the behavior in water solution of carboxyl groups attached to moieties rendering the mole- cule so Tvater-insoluble as to make direct measurement impossible. The conclusion that the long chain, saturated fatty acids have acid dissociation constants (water) only slightly smaller than those of the shorter members of the series agrees with the data of Xoerland (quoted by Schmidt-Nielsen (37)) who found little difference in the “PK’~” values of fatty acids con- taining 6 to 16 carbon atoms titrated in 95 per cent ethanol.
I FATTY ACIDS I
L-a-(DIMYRISTOYLI- CEPHALIN
I ACID I I%
I LECITHINS I
APPARENT pH
FIG. 4. The apparent pK’ and presumed ionic charge types of some lipides when dissolved in the 2-ethoxyethanol solvent system. The dark lines represent the apparent pK’ a and the cross-hatched areas the zone of 80 per cent transition of species.
The application of the correlation noted in Equation 2 to the carboxyl group of phosphatidylserine seems of interest, especially when it is noted that the non-aqueous titration curves of nn-serine and phosphatidylserine are very similar in contour. The phosphatide curve is displaced by less than 1 “pH” unit to higher values. On employing Equation 2, an es- timate of pKaz5 = 2.8 is obtained for the carboxyl group of phosphatidyl- serine. If a similar calculation is made from the “PK’~” of nn-serine, a value of pKz,25 = 2.4 is obtained for the carboxyl group of serine. The measured value for the latter is 2.2 (28). Assuming that the transfer to aqueous solution would affect the dissociation of the a-amino group of the phosphatidylserine to the same degree as a similar transfer does for DL-
by guest on January 8, 2019http://w
ww
.jbc.org/D
ownloaded from

220 NON-AQUEOUS TITRATION OF PHOSPHATIDES
serine, a value of pKGZ6 = 9.7 (water) is obtained for the a-amino group of phosphatidylserine. Folch (9) has found that 1 mole of monovalent cation is associated with each mole of phosphatidylserine as isolated from ox brain. The titration curve shown in Fig. 3, Curve B is consistent with this and suggests that, in this solvent system at “pH” 7.0, t,he molecule exists with both the diester phosphoric acid group and the carboxyl group in the anionic form, while the a-amino function exists as a positive group of unit charge. No inferences can be made from these data regarding the ionic form in the dry state. In assigning ionic species to phosphatide molecules, it is important to specify the physical state to which the formulae are to apply.
It can be calculated from the data in Table II that for the n-a-dimyristoyl- cephalin the ratio of microequivalents determined by titration to micro- equivalents determined as NHZ-N was lowered from 1.75 to 1.36 by stirring for 1 hour at acid “PH.” The cause of this effect is unknown. However, as the “pK’,” was unaffected by 1 hour of stirring, the amount of carbon dioxide (or other possible contaminant) does not appear to affect the half titration point. The estimated “pK’=” of 9.1 is close to the value of 8.9 obtained by Jukes (2) in 98 per cent ethanol. The pKa25 is calculated to be in the direction of a higher value, judging from the behavior of ethanol- amine. The amount by which it is higher may be approximated from that measured for ethanolamine, namely 1.3 pH units, or PK,*~ = 10.4 (in water). These conclusions are consistent with a zwitter ion configuration for phos- phatidylethanolamine in the 2-ethoxyethanol solvent system in the range from “pH” 2 to 7. In aqueous medium one would predict the zwitter ion range to be shifted to a somewhat higher pH number at least for the upper end of the range. Again no inferences concerning the ionic form of the solid state appear warranted from these data.
The titration curve of the synthetic dipalmitoyl-n-ar-glycerophosphoric acid clearly indicates that before titration it was present in solution as the dibasic acid. The titration curve of the p-glycerophosphoric acid in the 2-ethoxyethanol solvent was similar to that for the phosphatidic acid, ex- cept that the P-glycerophosphoric acid had a somewhat more acid second dissociable group (Table II). This suggests that in aqueous media the phosphatidic acid would dissociate very much like the glycerophosphoric acid. The titration curve of the egg lecithin preparation is in agreement with previous studies (24), indicating a zwitter ion in the neutral range both in alcoholic solvents and in water. The very basic character of the quaternary nitrogen is well shown.
SUMMARY
1. An electrometric titration method has been developed in which a sol- vent system consisting of 99 per cent (volume per volume) 2-ethoxyethanol,
by guest on January 8, 2019http://w
ww
.jbc.org/D
ownloaded from

J. E. GARVIN AND M. L. KARNOVSKY 221
1 per cent water, and 0.001 M KC1 is used. The method has been used to titrate a variety of phosphatides and related compounds in amounts of about 1 peq.
2. The properties of the titration curves were such as to permit assign- ment of ionic species present in solution for each of the materials over a wide range of apparent pH.
3. Approximations to the behavior of dissociable groups of the phos- phatides in true water solution have been made by analogy with compounds having similar functional groups but which are soluble both in the 2-eth- oxyethanol solvent system and in water.
We wish to express our gratitude to Professor A. B. Hastings for his in- terest and advice and to Professor John Edsall for valuable criticism of the manuscript.
BIBLIOGRAPHY
1. Garvin, J. E., and Kamovsky, M. L., Federation Proc., 13, 215 (1954). 2. Jukes, T. H., J. Biol. Chem., 107, 783 (1934). 3. Fishgold, H., and Chain, E., Biochem. J., 28, 2044 (1934). 4. Fishgold, H., and Chain, E., Proc. Roy. Sot. London, Series B, 117, 239 (1935). 5. Rudy, H., and Page, I. H., 2. physiol. Chem., 193, 251 (1930). 6. Folch, J., and Schneider, H. A., J. Biol. Chem., 137, 51 (1941). 7. Folch, J., J. Biol. Chem., 139, 973 (1941). 8. Folch, J., J. Biol. Chem., 146, 35 (1942). 9. Folch, J., J. Biol. Chem., 174, 439 (1948).
10. Baer, E., J. Biol. Chem., 189, 235 (1951). 11. Baer, E., Maurukas, J., and Russel, M., J. Am. Chem. Sot., 74, 152 (1952). 12. Pangborn, 111. C., J. Biol. Chem., 188, 471 (1951). 13. Hanahan, D. J., and Jayko, M. E., J. Am. Chem. Sot., 74, 5070 (1952). 14. King, E. J., Biochem. J., 26, 292 (1932). 15. Yasuda, M., J. Biol. Chem., 94, 401 (1931-32). 16. Peters, J. P., and Van Slyke, D. D., Q uantitative clinical chemistry; Methods,
Baltimore, 2, 518 (1932). 17. Van Slyke, D. D., J. Biol. C&m., 83, 425 (1929). 18. Axelrod, J., Reichenthal, J., and Brodie, B. B., J. BioZ. Chem., 204, 903 (1953). 19. Moore, S., and Stein, W. H., J. BioZ. Chem., 176, 367 (1948). 20. Hamer, W. J., and Acree, S. F., J. Res. Nut. Bur. Standards, 32, 215 (1944). 21. Hitchcock, D. I., and Taylor, A. C., J. Am. Chem. Sot., 69, 1812 (1937). 22. Bates, R. G., and Acree, S. F., J. Res. Nat. Bur. Standards, 30, 129 (1943). 23. Kolthoff, I. M., and Sandell, E. B., Textbook of quantitative inorganic anaIysis,
h’ew York, 3rd edition, 488 (1952). 24. Dippy, J. F. J., and Williams, F. R., J. Chem. Sot., 1888 (1934). 25. Snell, F. M., Thesis, Massachusetts Institute of Technology (1952). 26. Kiessling, W., Biochem. Z., 273, 103 (1934). 27. Sivertz, V., Reitmeier, R. E., and Tartar, H. V., J. Am. Chem. Xoc., 62, 1379
(1940). 28. Kirk, P. L., and Schmidt, C. L. A., J. BioZ. Chem., 81, 237 (1929). 29. Czarnetsky, E. J., and Schmidt, C. L. A., 2. phusiol. Chem., 204, 129 (1932).
by guest on January 8, 2019http://w
ww
.jbc.org/D
ownloaded from

222 NON-AQUEOUS TITRATION OF PHOSPHATIDES
30. Hamer, W. J., Pinching, G. D., and Acree, S. F., J. Res. Nat. BUT. Standards, 36, 539 (1945).
31. Hamer, W. J., and Acree, S. F., J. Res. Nat. Bur. Standards, 36, 381 (1945). 32. Martin, A. W., and Tartar, H. V., J. Am. Chem. Sot., 69, 2672 (1937). 33. Branch, G. E. K., and Yabroff, D. L., J. A,m. Chem. Sot., 66, 2568 (1934). 34. Mizutani, M., 2. physik. Chem., 116, 350 (1925); 118, 318 (1925). 35. Michaelis, L., and Miautani, M., 2. physik. Chem., 116, 135 (1925). 36. Jukes, T. H., and Schmidt, C. L. A., J. Biol. Chem., 106, 359 (1934). 37. Schmidt-Nielsen, K., Acta physiol. Stand., 12, suppl. 37, 1 (1946).
by guest on January 8, 2019http://w
ww
.jbc.org/D
ownloaded from

James E. Garvin and Manfred L. KarnovskyMEDIUM
COMPOUNDS IN A NON-AQUEOUSPHOSPHATIDES AND RELATED
THE TITRATION OF SOME
1956, 221:211-222.J. Biol. Chem.
http://www.jbc.org/content/221/1/211.citation
Access the most updated version of this article at
Alerts:
When a correction for this article is posted•
When this article is cited•
alerts to choose from all of JBC's e-mailClick here
tml#ref-list-1
http://www.jbc.org/content/221/1/211.citation.full.haccessed free atThis article cites 0 references, 0 of which can be by guest on January 8, 2019
http://ww
w.jbc.org/
Dow
nloaded from


![AGC Book 20% CyanBasics of Titration · 2020-02-24 · Non-aqueous acid/base titrations: ... titration curves obtained from acid/ base titrations. E [pH or mV] V [mL] E [mV] V [mL]](https://img.dokumen.tips/doc/110x75/5f501a6dd95989003f6ec9e5/agc-book-20-cyanbasics-of-titration-2020-02-24-non-aqueous-acidbase-titrations.jpg)


![Spectrophotometric Determination of Tiemonium Methyl …methods as aqueous potentiometric titration [11] and electrogenerated chemiluminescence [12]. High-performance liquid chromatography](https://img.dokumen.tips/doc/110x75/6142453e55c1d11d1b34166d/spectrophotometric-determination-of-tiemonium-methyl-methods-as-aqueous-potentiometric.jpg)