Embed Size (px)
Citation preview

The Titration in the Kjeldahl Method of Nitrogen Determination:Base or Acid as Titrant?Tadeusz Michałowski,*,† Agustin G. Asuero,‡ and Sławomir Wybraniec†
†Faculty of Engineering and Chemical Technology, Technical University of Cracow, 31-155 Cracow, Poland‡Department of Analytical Chemistry, The University of Seville, 41012 Seville, Spain
*S Supporting Information
ABSTRACT: The final step of the Kjeldahl method of nitrogen determination inbiological and other samples faces a dilemma: which titrant, whether acid or base,should be used for the titration of ammonia? To solve this problem, a simplecalculation procedure, illustrating the manner of ammonia determination in thismethod, enables one to resolve this dilemma with the use of theory based onacid−base titration curves. It refers, in particular, to the choice of a strong acid(HCl, H2SO4) solution as a titrant for titration of the solution with H3BO3applied in a receiver flask following the distillation (NH3) step. The paper presents aclear illustration of the statement that “a good theory is the best practical tool”.
KEYWORDS: Upper-Division Undergraduate, Analytical Chemistry, Computer-Based Learning, Problem Solving/Decision Making,Acids/Bases, Aqueous Solution Chemistry, Potentiometry, Titration/Volumetric Analysis
The Kjeldahl method1 is widely applied to the measure-ment of nitrogen content in foods, beverages (originally it
was designed for the brewing industry2), meat, agriculturalproducts, feed, waste, environmental waters, soil, biologicalmaterials, dairy products, vinegar, pharmaceutical products,and many other samples. It has been the subject of a greatnumber of scientific studies and some review papers weredevoted to this method.2−7 The Kjeldahl method consists ofthree steps:8
(1) acidic (conc. H2SO4) digestion (mineralization) of nitrogen-containing sample (in presence of a catalyst and a saltpromoting the ebullioscopic effect) causing its conversioninto NH4
+ ions;(2) transformation of NH4
+ ions into NH3, distillation ofNH3 with water steam and collection of NH3 in theacidic distillation receiver;
(3) titration of the solution from the distillation receiver.
In the Kjeldahl’s original method of nitrogen analysis, sulfuricacid alone was used as a digestion medium; the digestion inboiling H2SO4 converts organic nitrogen into NH4
+. Toshorten the time needed for the digestion made in a Kjeldahlflask, a selenium reagent mixture (Na2SO4, Hg2SO4, CuSO4,Se) is usually applied; Na2SO4 increases the boiling point ofH2SO4, and the other components act as catalysts. Digestion inthe temperature range of 360−410 °C6 is completed when thedigesting liquor clarifies with the release of fumes. Transformationof NH4
+ into NH3, caused by addition of NaOH (pH growth) inParnas−Wagner apparatus, is shown as
+
=
+ +
+−
H IooNH H NH
[NH ][NH ]
10
K
K
4 3
3
4
pH p
1N
1N
(1)
where pK1N = −logK1N; pK1N = 9.35 at 20 °C.Among several alternatives applied for estimation of
ammonia in the digest,6 the steam-distillation followed bytitration is the most popular method.2 The distillation is spedup by the use of the semiautomated systems.9,10 After collectionin an acid solution, ammonia is titrated with strong base orstrong acid, depending on whether strong acid (HCl or H2SO4)or boric acid (H3BO3) is applied in the distillation receiver;H3BO3 is commonly used to trap ammonia.11−13 Optionally,a titration with sulfamic acid (as primary standard) solution wasalso suggested.14 Another titrimetric approach, the so-named“formol” titration, with formaldehyde, was also applied for thispurpose.15,16
Titration of ammonia absorbed in H3BO3 solution offers anadvantage that only one standardized solution (e.g., HCl orH2SO4) is needed (as titrant) and the results of titrations areobtained directly. When a strong acid (HCl or H2SO4) is appliedin the receiver (i.e., in the titrand), two standard solutionsare needed: (i) titrant (NaOH solution) and (ii) the strong acidin the receiver; in (ii), the results are obtained in an indirectmanner.There were some proposals involved with a choice of a
proper indicator or mixtures of indicators applied in these(visual) titrations. For example, mixture of methyl red and
Published: December 7, 2012
Article
pubs.acs.org/jchemeduc
© 2012 American Chemical Society andDivision of Chemical Education, Inc. 191 dx.doi.org/10.1021/ed200863p | J. Chem. Educ. 2013, 90, 191−197

methylene blue (2:1) known later as Tashiro indicatorchanging its color from green to violet at about pH 5.2 wassuggested.17 Knowing the number of milliliters of the volumeof the standardized acid used in the titration, the amount ofammonia neutralized with boric acid can be calculated.All considerations involved with these titrations and
practiced hitherto were based only on stoichiometries of thereactions involved,18,19 which do not provide a quantitativeinsight into the matter in question. None of the approachespresented hitherto were based on theoretical approaches, withequations for titration curves involved. The present paper is avaluable and understandable approach for students of chemicaland other faculties where the Kjeldahl method is applied. TheExcel file in the Supporting Information20 enables one to do somecalculations related to different trapping acids and titrants (acids orbases) and helps the students to better understand the informationgained experimentally. The Excel files were successfully appliedduring computer trainings done with students of Chemistryat Technical University of Cracow. This way, the calculationsfollowed the experimental laboratory trainings involved withKjeldahl method for the determination of nitrogen in meat.To find quantitative relationships between the reagents
participating in the titration and check the proper pH value forthe end point, the approach based on acid−base titration curvescan be applied.21−23 The considerations based on formulationof “stoichiometric reactions” involved with hydrolytic effectsand presumable formation of some “salts” in the system inquestion are thus not needed for this purpose.
■ THEORETICAL APPROACHTo check a priori the validity of a titrimetric procedure, it isadvisable to gain prior knowledge based on a mathematicalapproach with equations for the titration curves involved. Theformulas for acid−base titrations can be represented in a simplefunctional form, V = V(pH), where pH = −log[H+]. Theformulas refer to acid−base titrations of the solution containingan acid (HCl, H2SO4, or H3BO3) and NH3 in the titrand D,titrated with strong base (NaOH) or strong acid (HCl orH2SO4) as titrant T, are specified in Table 1, where
α = − = − =+ − − − K[H ] [OH ] 10 10 (p 14.0)KpH pH pw
w
(2)
η =+
=+
=+
+
−
− K[NH ]
[NH ] [NH ]10
10 1(p 9.35)
K
KN4
4 3
p pH
p pH 1N
1N
1N
(3)
η =+
=+
=−
− −
−
− K[HSO ]
[HSO ] [SO ]10
10 1(p 1.8)
K
KS4
4 42
p pH
p pH 2S
2S
2S
(4)
η =+ +
+ + +
= · + · ++ + +
= = =
− −
− − −
+ + − + − −
+ + − + − −
K K K
3[H BO ] 2[H BO ] [HBO ][H BO ] [H BO ] [HBO ] [BO ]
3 10 2 10 1010 10 10 1
(p 9.24; p 12.74; p 13.80)
K K K K K K
K K K K K K
B3 3 2 3 3
2
3 3 2 3 32
33
p p p 3pH p p 2pH p pH
p p p 3pH p p 2pH p pH
1B 2B 3B
1B 2B 3B 2B 3B 3B
1B 2B 3B 2B 3B 3B
(5)
+ =·
++ C V
V V[NH ] [NH ]4 3
0N 0
0 (6)
where K2S is the second dissociation constant for sulfuric acid;one can assume [H2SO4] = 0; KiB, i = 1, 2, 3, is the aciddissociation constant for boric acid, C0N is the concentration(mol/L) of NH3 in the titrand (D), V0 is the volume (mL) oftitrand, and V is the volume (mL) of titrant (T). The symbolsη N, ηS, and ηB in eqs 2−5 express the mean numbers of protonsattached to the corresponding, basic forms: NH3, SO4
2‑, andBO3
3‑, respectively. The values of the equilibrium constants thatapply to eqs 2−5 can be found in the literature.24,25
Some of the equations presented in Table 1 are derived inthe Appendix (see the Supporting Information). In theseequations, the indicators are not involved. However, theindicators themselves have acid−base properties and, formally,should be included in equation for titration curve.21,22 Forexample, assuming that D referred to system d in Table 1 andcontains a mixture of two indicators: MkiHmi−kil(i) at concentra-
tion C0l(i) (for i = 1, 2), then HjI(i)+j−mi (j = 1, ..., qi) are the
protonated species formed by i-th indicator, M+ = Na+, K+,I(i)−mibasic (the least protonated) form of the i-th indicator, qiis the maximum number of protons attached to I(i)
−mi, and we getthe relation
η η η α
η α=
· + − · + ∑ − + · +
− −=
V VC C k m C
C
(3 ) ( )
(2 )i i i
0N 0N B,in 0 1
2I 0I
S
i i( ) ( )
(7)
where
η =∑ ·
∑==
+ −
=+ −
ji
[H I ]
[H I ]( 1, 2)j
qj i
j m
jq
j ij mI
0 ( )
0 ( )i
i i
i i( )(8)
Table 1. Equations for Titration Curves Related to Different Titrand and Titrant (D + T) Systemsa
System Titrand (D) Titrant (T) V = V(pH)a
a HCl (C0) + NH3 (C0N) NaOH (C)η α
α= ·
− · −+
V VC C
C00 N 0N
b H2SO4 (C0) + NH3 (C0N) NaOH (C)η η α
α= ·
− · − · −+
V VC C
C
(2 )0
S 0 N 0N
c H3BO3 (C0) + NH3 (C0N) HCl (C)η η α
α= · · − − · +
−V V
C CC(3 )
0N 0N B 0
d H3BO3 (C0) + NH3 (C0N) H2SO4 (C)η η α
η α= · · − − · +
− · −V V
C CC
(3 )
(2 )0N 0N B 0
S
e H3BO3 (C0) + NH3 (C0N) NaOH (C)η η α
α= ·
− · − · −+
V VC CC
(3 )0
B 0 N 0N
aThe notation of the equations agrees with the notation of the plot series in Figure 1: V0 is the volume of titrand (D); V is the volume of titrant (T)added up to a given point of titration; C0, C0N, and C are the concentrations of the species indicated.
Journal of Chemical Education Article
dx.doi.org/10.1021/ed200863p | J. Chem. Educ. 2013, 90, 191−197192

The titration curves in Figure 1c,d have distinctly markedinflection (inf) points that occurred at pH ca. 5.2−5.3 (seeFigure 2), where the (theoretical) relative error in NH3determination is closest to zero value (Figure 3). The relativeerror is calculated as 100(Ve − Veq)/Veq (%) where Ve is thevolume of the titrant at the end (e) point and Veq is theequivalence (eq) volume. The Vinf (volume of the titrant atinflection point) values corresponding to these points decrease(Figure 1a,b) or grow (Figure 1c,d) linearly with theconcentration C0N of NH3 in the titrand. Then, the numberof millimoles of NH3 equals (i) C·Vinf for the titration of thisbase with C mol/L HCl or (ii) 2·C·Vinf for titration with C mol/L H2SO4.
At the equivalence (eq) point, pH = pHeq ≈ pHinf ispractically independent of the C0N value when ammonia istrapped in H3BO3 solution (Figure 2). The slopes at theequivalence points are more than 2 times greater in Figure 2panels a and d than in panels b and c.The plots in Figure 4, from system e in Table 1, do not
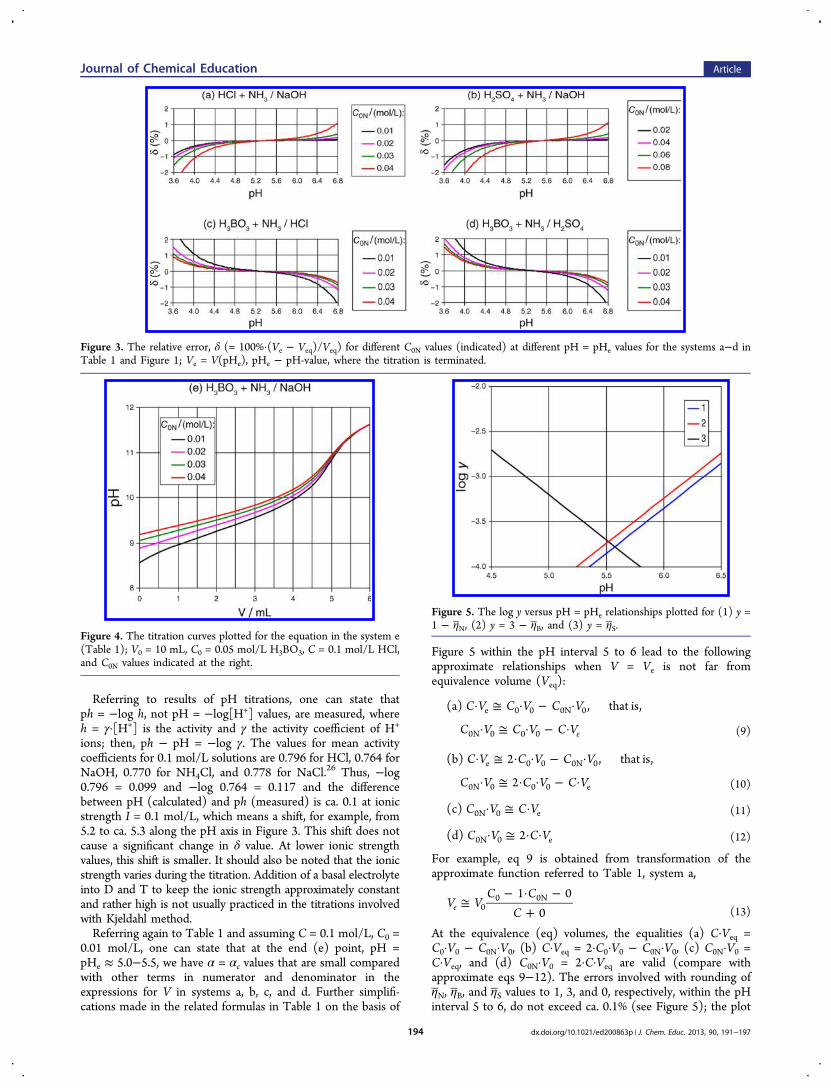
appear to have the properties applicable for quantitativedetermination of NH3. In this pH range, the buffer capacityof the solution is high. The pK1N and pK1B values are similar(9.35 and 9.24, respectively) and the curves do not showdifferentiated jumps at different C0N values (compare withFigure 1). The curves converge near more distinct jump, as inFigure 1a,b.
Figure 1. Series of titration curves plotted for eqs a−d in Table 1, at V0 = 10 mL, C0 = 0.05 mol/L, C = 0.1 mol/L, and C0N values indicated at the right.
Figure 2. The dpH/dV versus pH relationships plotted for different (indicated) C0N values and other data taken from caption for Figure 1.
Journal of Chemical Education Article
dx.doi.org/10.1021/ed200863p | J. Chem. Educ. 2013, 90, 191−197193
Referring to results of pH titrations, one can state thatph = −log h, not pH = −log[H+] values, are measured, whereh = γ·[H+] is the activity and γ the activity coefficient of H+
ions; then, ph − pH = −log γ. The values for mean activitycoefficients for 0.1 mol/L solutions are 0.796 for HCl, 0.764 forNaOH, 0.770 for NH4Cl, and 0.778 for NaCl.26 Thus, −log0.796 = 0.099 and −log 0.764 = 0.117 and the differencebetween pH (calculated) and ph (measured) is ca. 0.1 at ionicstrength I = 0.1 mol/L, which means a shift, for example, from5.2 to ca. 5.3 along the pH axis in Figure 3. This shift does notcause a significant change in δ value. At lower ionic strengthvalues, this shift is smaller. It should also be noted that the ionicstrength varies during the titration. Addition of a basal electrolyteinto D and T to keep the ionic strength approximately constantand rather high is not usually practiced in the titrations involvedwith Kjeldahl method.Referring again to Table 1 and assuming C = 0.1 mol/L, C0 =
0.01 mol/L, one can state that at the end (e) point, pH =pHe ≈ 5.0−5.5, we have α = αe values that are small comparedwith other terms in numerator and denominator in theexpressions for V in systems a, b, c, and d. Further simplifi-cations made in the related formulas in Table 1 on the basis of
Figure 5 within the pH interval 5 to 6 lead to the followingapproximate relationships when V = Ve is not far fromequivalence volume (Veq):
· ≅ · − ·
· ≅ · − ·
C V C V C V
C V C V C V
(a) , that is,
e
e 0 0 0N 0
0N 0 0 0 (9)
· ≅ · · − ·
· ≅ · · − ·
C V C V C V
C V C V C V
(b) 2 , that is,
2e 0 0 0N 0
0N 0 0 0 e (10)
· ≅ ·C V C V(c) 0N 0 e (11)
· ≅ · ·C V C V(d) 20N 0 e (12)
For example, eq 9 is obtained from transformation of theapproximate function referred to Table 1, system a,
≅− · −
+V V
C CC1 0
0e 00 0N
(13)
At the equivalence (eq) volumes, the equalities (a) C·Veq =C0·V0 − C0N·V0, (b) C·Veq = 2·C0·V0 − C0N·V0, (c) C0N·V0 =C·Veq, and (d) C0N·V0 = 2·C·Veq are valid (compare withapproximate eqs 9−12). The errors involved with rounding ofη N, ηB, and ηS values to 1, 3, and 0, respectively, within the pHinterval 5 to 6, do not exceed ca. 0.1% (see Figure 5); the plot
Figure 3. The relative error, δ (= 100%·(Ve − Veq)/Veq) for different C0N values (indicated) at different pH = pHe values for the systems a−d inTable 1 and Figure 1; Ve = V(pHe), pHe − pH-value, where the titration is terminated.
Figure 4. The titration curves plotted for the equation in the system e(Table 1); V0 = 10 mL, C0 = 0.05 mol/L H3BO3, C = 0.1 mol/L HCl,and C0N values indicated at the right.
Figure 5. The log y versus pH = pHe relationships plotted for (1) y =1 − ηN, (2) y = 3 − ηB, and (3) y = ηS.
Journal of Chemical Education Article
dx.doi.org/10.1021/ed200863p | J. Chem. Educ. 2013, 90, 191−197194

of log α (see eq 2) versus pH relationship falls here below thepH axis (beyond the figure). The approximations assumed ineqs 9−12 are comparable with an indicator error.22
■ DISCUSSIONThe curves plotted in Figure 1a correspond to equal concentra-tion C0 = 0.05 mol/L HCl and different concentrations C0Nmol/L of NH3 in the titrand, D. The abscissas (Vinf) at thejump on the corresponding curves shift toward lower V valueswith growth of C0N, in accordance with eq 9. The generalcourse of the plots in Figure 1b, referred to C0 = 0.05 mol/LH2SO4 and C0N mol/L NH3 in D, is very similar to one relatedto D with C0 = 0.10 mol/L HCl and C0N mol/L NH3; thissystem is in accordance with eq 10. The systems representedby Figure 1a,b are titrated with C = 0.10 mol/L NaOH. Thebuffering action at the start for titrations in the systems a and bis secured by HCl and H2SO4, respectively.In the systems c and d, with C0 = 0.05 mol/L H3BO3 and C0N
mol/L NH3 in D, the buffering action of D is secured, incomparable degree, by H3BO3 and NH3; NH3 is the onlycomponent titrated with C = 0.1 mol/L solution of HCl orH2SO4, in accordance with eqs 11 and 12.In the systems a and b, the titration starts from lower pH
values, ca. 1.5−2 (Figure 1a,b) at pHj+1 > pHj, whereas in systemsc and d, it starts from higher pH values, ca. 8.5−9.5 (Figure 1c,d)at pHj+1 < pHj, for successive [jth and (j + 1)th] points oftitration. As a consequence,
• for the systems a, b: Ve < Veq at pHe < pHeq and Ve > Veqat pHe > pHeq (see Figure 1a,b);
• for the systems c, d: Ve < Veq at pHe > pHeq and Ve > Veqat pHe < pHeq (see Figure 1c,d).
Taking
= −V VDV e eq (14)
as the degree of misfit between the end and equivalence volumes,we get
δ = = −V V VDV/ / 1eq e eq (15)
(see Figure 3). Denoting by nN(e) = (C0NV0)e and nN(eq) =(C0NV0)eq the numbers of millimoles of ammonia calculated atVe and Veq, respectively, for (a) we have:
= − = −
→ − = − ·
CV C V n CV C V n
n n C
(e), (eq)
(e) (e) DV
e 0 0 N eq 0 0 N
N N
Analogously,
for (b):
= − = −
→ − = − ·
CV C V n CV C V n
n n C
2 (e), 2 (eq)
(e) (eq) DV
e 0 0 N eq 0 0 N
N N
for (c):
= = → −
= ·
CV n CV n n n
C
(e), (eq) (e) (eq)
DV
e N eq N N N
for (d):
= = → −
= ·
CV n CV n n n
C
2 (e), 2 (eq) (e) (eq)
2 DV
e N eq N N N
When titration is terminated at Ve < Veq (DV < 0 → δ < 0),then we have: nN(e) − nN(eq) > 0, that is, nN(e) > nN(eq) forsystems a and b, and nN(e) < nN(eq) for systems c and d.Reverse relations occur at Ve > Veq. Then, negative or positiveerror of titration is involved with positive or negative error ofthe ammonia determination in systems a and b, and negative orpositive error of titration is involved with negative or positiveerror of the ammonia determination in systems c and d.Low buffer capacity, β = |dc/dpH|, where c = CV/(V0 +
V),22,23 at the end (e) point of titration, in the vicinity ofinflection (inf) point on the curves in Figure 1, secures goodprecision of results obtained in visual or pH titrations. The pHvalues, corresponding to maximal buffer capacities, agree verywell with pH = pHe values assumed in the literature at the endpoints of the related titrations. It results from the relation
β = = · =+
·
=+
·
c cV
V CVV V
V
CVV V
ddpH
dd
ddpH ( )
ddpH
( )1
V
0
02
0
02 dpH
d (16)
The number of millimoles of ammonia, nN = C0N·V0, is equalto the number of millimoles of the nitrogen (as an element)involved in it. Mass (g) of the nitrogen determined at the endpoint of titration in systems a−d equals ca. 0.01401·(C0·V0 −C·Ve), 0.01401·(2·C0·V0 − C·Ve), 0.01401·C·Ve, and0.02802·C·Ve, respectively. The percent contents of nitrogenin m grams of the sample tested equals 1.401·nN/m (%),provided that all the nitrogen involved in a sample placed in theKjeldahl flask is captured in the Parnas−Wagner apparatusduring the distillation with water vapor after addition of anexcess of NaOH to the solution.When C0 is unknown, it must be determined in the titration
made with use of a standardized base NaOH (C, mol/L), forexample, the same as one used for titration of a sample takenfrom receiving flask. For titration of C0V0 mmol of H2SO4 withV mL of C mol/L NaOH, we get the relation
η αα
= ·− · −
+V V
C
C
(2 )S0
0
(17)
and then for V = Ve,s (i.e., the end volume for standardizedsolution), we get 2·C0·V0 ≅ C·Ve,s, C0N·V0 ≅ C·(Ve,s − Ve). Theknowledge of exact H3BO3 concentration is not required.A comment should also be referred to pH titrations, where
ph = −log h not pH = −log[H+] values are measured; h =γ·[H+] is the activity, and γ is the activity coefficient of H+ ions.However, the titrations are made at (rather) low ionic strengthvalues and the related effects were omitted, that is, γ = 1 wasassumed for simplicity of considerations. In pH titrations,indicators are not involved (see Table 1). In visual titrations,the concentration(s) of indicator(s) is (are) small and then canbe omitted in the related functions V = V(pH).The NH3 trapping in the systems a and b (with HCl or
H2SO4) results exclusively from low pH value and high buffercapacities of the trapping acids; in these cases, NH3 istransformed quantitatively into NH4
+. In the systems c and d,buffer capacity of H3BO3 solution is low andon the trappingsteppH grows rapidly to the values in the vicinity of pK1N =9.35, where [NH3] is comparable with [NH4
+]. Evolution ofNH3 from the systems c and d is hampered by high solubility ofNH3 in such media.
Journal of Chemical Education Article
dx.doi.org/10.1021/ed200863p | J. Chem. Educ. 2013, 90, 191−197195

■ FINAL COMMENTS
In spite of the fact that Kjeldahl’s nitrogen determination methodwas developed nearly 130 years ago, it is still widely used innitrogen analysis. However, it is advisable to know adequately itstheoretical basis, in order to be applied in a right way.The results obtained from simulated titrimetric procedure,
based on prior physicochemical knowledge (equilibrium con-stants) and equilibrium analysis, with use of functions obtained onthe basis of charge and concentration balances, confirm the properchoice of pHe values chosen by experimentalists through trialand error method (as a rule), that needs to be acknowledged.Four options, represented by the systems a, b, c, and d specified inTable 1, were discussed in detail. Comparison of the plots inFigures 1 and 4 enables to answer the question presented in thetitle of the paper. Namely, ammonia trapped in HCl or H2SO4
solution should be titrated with NaOH (back-titration), whereasammonia trapped in H3BO3 should be titrated with HCl orH2SO4 solution. Two standardized (trapping and titrant) solutionsare required in a and b, whereas in c and d, only one standardsolution (titrant) is used.NH4Cl or ammonium sulfates are less volatile than NH3;
consequently, NH4+ is less volatile than NH3. When NH3 is
trapped in HCl or H2SO4 solution, the pH of the resultingsolutions are low, provided that HCl or H2SO4 are instoichiometric excess against NH3. This way, NH3 is better“preserved” in HCl or H2SO4 solution before titration withNaOH. When the related solution is titrated with NaOH, thetitration is finished at pH ca. 5 to 6, that is, at the pH regionwhere [NH4
+]/[NH3]≫ 1. It means that the risk of dissipationof NH3 on both stages, preservation and titration, is low. Forcomparison, the (starting) pH of H3BO3 solution is ca. 5−5.5,that is, close to the pH at the end point of titration of an excessof HCl or H2SO4 with NaOH. At this pH value, distant frompK1 = 9.24 for H3BO3, buffer capacity of the solution is low andfirst portions of trapped ammonia make a significant pH shifttoward pK1 = 9.35, where comparable quantities of NH3 andNH4
+ exist in the solution. This also means that some potentialrisk of evaporation of NH3 from this solution exists. According tothe literature,27−29 this risk is apparent, however. The possibilityto use the nonstandardized trapping acid (H3BO3) is thus asignificant advantage in comparison with the alternative option;it saves the time and standards needed for standardization ofthe trapping solution. In addition, a carefully standardized acidsolution is less than a standard alkali solution subjected to achange during storage.30
Micro-Kjeldahl nitrogen determination testifies also in favorof the method in which the ammonia is trapped in a boricacid−indicator solution and titrated with a standardized mineralacid, HCl or H2SO4.
17,31−33 However, in spite of particularadvantages, all the options considered from theoretical view-point provide good results of analyses if the pHe value close to5.2 is assumed (Figure 3).Further quantitative information can be obtained by applying
new data (C0, C0N, C, V0) in the Excel file. It enables one toevaluate the errors related to the analyses made under differentconditions applied for this purpose. These calculationsdemonstrate the value of using theoretical models for optimizingconditions prior to experimental work. All the calculationspresented in this paper are based on charge and concentrationbalances, and expressions for equilibrium constants related toacid−base equilibria. This approach can be perceived as the clear
confirmation of the statement (ascribed to J. C. Maxwell) that “agood theory is the best practical tool”.34
■ ASSOCIATED CONTENT*S Supporting Information
Appendix; Excel file. This material is available via the Internet athttp://pubs.acs.org.
■ AUTHOR INFORMATIONCorresponding Author
*E-mail: [email protected]
The authors declare no competing financial interest.
■ REFERENCES(1) Kjeldahl, J. Z. Anal. Chem. 1883, 22, 366.(2) Bradstreet, R. B. Chem. Rev. 1940, 27, 331.(3) Dyer, B. J. Chem. Soc. Trans. 1895, 67, 811.(4) Oesper, R. E. J. Chem. Educ. 1934, 11, 457.(5) Veibel, S. J. Chem. Educ. 1949, 26, 459.(6) Fleck, A.; Mundro, H. N. Clin. Chim. Acta 1965, 11, 2.(7) Conklin-Brittain, N. L.; Dierenfeld, E. S.; Wrangham, R. W.;Norconk, M.; Silver, S. C. J. Chem. Ecol. 1999, 25, 2601.(8) McKenzie, H. A. Trends Anal. Chem. 1994, 13, 138.(9) Barlow, S. M.; Bimbo, A.; Jensen, O. B.; Smith, G. L. J. Sci. FoodAgric. 1981, 32, 732.(10) Watson, M. E.; Galliher, T. L. Commun. Soil Sci. Plant Anal.2001, 32, 2007.(11) Winkler, J. W. Z. Angew. Chem. 1913, 26, 231.(12) Beljkas, B.; Matic, A.J.; Milovanovic, I.; Jovanov, P.; Misan, A.;Saric, L. Accredit. Qual. Assur. 2010, 15, 555.(13) Takatsu, A.; Eyama, S.; Saeki, M. Accredit. Qual. Assur. 2008, 13,409.(14) Milner, O. I.; Zahner, R. J. Anal. Chem. 1960, 32, 294.(15) Sorensen, S. Biochem. Zeitschr. 1907, 7, 45.(16) Shaw, W. S. Analyst 1924, 49, 558.(17) Ma, T. S.; Zuazaga, G. Ind. Eng. Chem., Anal. Ed. 1942, 14, 280.(18) A guide to Kjeldahl nitrogen determination. Methods;Labconco, An Industry Service Publication, http://www.expotechusa.com/catalogs/labconco/pdf/KJELDAHLguide.PDF (accessed Nov2012)(19) Kjeldahl Method for Determining Nitrogen, Cole-Palmerresource web page http://www.coleparmer.ca/TechLibraryArticle/384 (accessed Nov 2012), http://www.coleparmer.ca/techinfo/techinfo.asp?htmlfile=KjeldahlBasics.htm&ID=384 (accessed Nov2012).(20) The Excel file available in the Supporting Information enablesone to check the calculation procedure applied for drawing the figurespresented in this paper. The calculations can also be made for otherconcentrations (C0, C0N, C) and volume (V0), involved in the formulaspresented in Table 1. The notation of the systems (a, ..., e) presentedin Table 1 is in accordance with denotation of sheets designed forpreparation of Figures 1−4. The last sheet was designed forpreparation of Figure 5. In each sheet of this file, the points for thecurves of pH vs V (Figures 1, 4), dpH/dV or −dpH/dV vs pH (Figure2), and relative error vs pH (Figure 3) were calculated. All operationsdone in there are presented in understandable manner.(21) Michałowski, T. Chem. Anal. 1981, 26, 799.(22) Michałowski, T. Calculations in Analytical Chemistry withElements of Computer Programming (in Polish); PK: Cracow, Poland,2001; http://www.biblos.pk.edu.pl/bcr&id=1762&ps=-12&dir=MD.MichalowskiT.ObliczeniaChemii.html (accessed Nov 2012).(23) Asuero, A. G.; Michałowski, T. Crit. Rev. Anal. Chem. 2011, 41,151.(24) Inczedy, J. Analytical Applications of Complex Equilibria;Horwood: Chichester, 1976.
Journal of Chemical Education Article
dx.doi.org/10.1021/ed200863p | J. Chem. Educ. 2013, 90, 191−197196

(25) Guide-Book for Chemists (in Russian). Nikolsky, B. P., Ed.;Khimia: Moscow, 1964; Vol. 3, p 78.(26) Meites, L., Ed. Handbook of Analytical Chemistry; McGraw-HillCompany: New York, 1963.(27) Kolthoff, I. M.; Sandel, E. B.; Meehan, E. J.; Bruckenstein, S.Quantitative Chemical Analysis, 4th ed.; The Macmillan Company:New York, 1969; p 790.(28) Laitinen, H. A.; Harris, W. E. Chemical Analysis: an AdvancedText and Reference, 2nd ed.; McGraw-Hill: New York, 1975; p 115.(29) Thiex, N. J.; Manson, H.; Anderson, S.; Persson, J. A. J. Assoc.Official Anal. Chem. 2002, 85, 309.(30) Stover, N. M.; Sandin, R. B. Ind. Eng. Chem., Anal. Ed. 1931, 3,240.(31) Sher, I. H. Anal. Chem. 1931, 3, 240.(32) Wagner, E. C. Ind. Eng. Chem., Anal. Ed. 1940, 12, 771.(33) Yuen, S. H.; Pollard, A. G. J. Sci. Food Agric. 1953, 4, 490.(34) Kantowitz, B. H.; Roediger, H., III; Elmes, D. G. ExperimentalPsychology, 9th ed.; Wadsworth: Belmont, CA, 2009.
■ NOTE ADDED AFTER ASAP PUBLICATIONAn minor typographical error was found in the text above eq 7in the version published on December 7, 2012. This wascorrected in the version published to the Web on December 17,2012.
Journal of Chemical Education Article
dx.doi.org/10.1021/ed200863p | J. Chem. Educ. 2013, 90, 191−197197