Embed Size (px)
Citation preview

The Timescale of SurfaceThe Timescale of Surface Charging Events
J. E. Mazur1, J. J. Likar2, J. F. Fennell1, J. L. Roeder1, P. O’Brien1, & T. B. Guild1
1The Aerospace Corporation2Lockheed Martin Commercial Space Systems
Presentation to the 2010 Spacecraft Charging Technology Conference
©2010 The Aerospace Corporation
21 September 2010

Title: The Timescale of Surface Charging Events
Author Names: J. E. Mazur1, J. J. Likar2, J. F. Fennell1, J. L. Roeder1, P. O’Brien1, & T. B. Guild1
Presenter: Dr. J. E. Mazur
Organizations:1The Aerospace Corporation2Lockheed Martin Commercial Space Systems
Classification: Unclassified
Categories: Surface Charging; Electrostatic Discharge; Environment Specification
Abstract:Abstract:
The timescale for creating high potentials on shadowed spacecraft surfaces depends on the conductivity of the surface inquestion, whether the neighboring surfaces are tied to the spacecraft frame or not, and on the space environment input. It isunderstood from laboratory and spaceflight measurements that the likelihood of a large surface potential and the timescale overwhich it might occur depends on these variables, yet the complex interplay between them makes the hazard difficult to assesseven in controlled experiments. In this paper we approach the specific question of the timescale of surface charging usingseveral datasets in several orbit regimes: GEO, HEO, and LEO. The measurements we will show involve different approachesto the question of surface charging and subsequent ESD (GEO: surface charge monitors; HEO: direct plasma measurements;LEO: anomalies due to surface charging). However, the main strengths of the data derive from their long duration coveringmultiple years and their occasional overlap in time. At the meeting we will thus report on the timescale of surface chargingevents at different locations in the magnetosphere across ~11 years of geomagnetic activity The results will be relevant forevents at different locations in the magnetosphere across ~11 years of geomagnetic activity. The results will be relevant forassessments of space system impact due to surface discharges and ESD, simulations of surface charging, and laboratorytesting of flight systems designs.
This work was supported under The Aerospace Corporation’s Independent
2
This work was supported under The Aerospace Corporation s Independent Research and Development Program.

Objective & Outline
• Objective: Derive the worst-case timescales for surface charging in a variety of orbitsvariety of orbits
• Outline:D t il f th th f h i d t b– Details of the three surface charging databases• Examples from LEO, HEO, and GEO• Local time dependence
S l d d• Seasonal dependence– Results of the charging event duration study– Summary
3

Surface Charging Databases
• This survey includes signatures of the surface-charging hazard observed in three orbital regimes: LEO, HEO, and GEO.
• Portions of the HEO and GEO measurements have been• Portions of the HEO and GEO measurements have been discussed previously in the literature and at previous satellite surface charging conferences, while the LEO example has not been as widely discussed.been as widely discussed.
4

An Example From the LEO Database
• A commonly cited example of satellite surface charging in LEO is from the DMSP vehicles (e.g. Gussenhoven et al. 1985; Frooninckx & Sojka 1992 & references therein).Frooninckx & Sojka 1992 & references therein).
• Thus, it was a surprise to encounter a set of LEO anomalies that have more in common with surface charging signatures at GEO rather than within the unique conditions of auroral arcs. at e t a t t e u que co d t o s o au o a a cs
• This figure shows one such event from the SAMPEX satellite
• The subsequent figures in this talk show more evidence for why we believe these anomalies are a unique signature of surface charging i LEO
5
in LEO

An Example From the HEO Database
• Fennell et al. [2008] recently reviewed therecently reviewed the statistics of HEO charging events using a plasma analyzer ona plasma analyzer on board the HEO2 spacecraft
• For this paper we usedFor this paper we used the same dataset as the Fennell et al.[2008] study
6

An Example From the GEO Database
• There are many published examples of surface charging in GEOcharging in GEO
• Here we used the charging signature from a charging plate analyzercharging plate analyzer (Bogorad et al. 1995) on board one of the Intelsat satellites (e g Ozkul et alsatellites (e.g. Ozkul et al.2001; Koons et al. 2006; Likar et al. 2009).
• The Intelsat database benefits from very long time coverage, a clear response to plasmasheet electrons when the sensor is in shadow, and the ability to place a wide range of thresholds on the charging level
7
the ability to place a wide range of thresholds on the charging level

Solar Cycle Coverage
• Our three charging datasets overlapped in time during solar cycle 23
• The LEO database is the only one that included the descent to the 1996 solar minimum when several recurrent high-speed solar wind streams led to severe geomagneticsevere geomagnetic storms
• However, geomagnetic activity that leads toactivity that leads to surface charging occurred within every dataset
8
dataset

Coincident Charging Signatures
• The figure shows a 2 month gperiod in 2001 in order to establish that our charging signatures responded to the same environmental inputs, at least on the timescale of a few days
f• We chose not to focus on the studies of specific events across the three orbits
9

Organization By Local Time
• Event occurrence versus L shell and local time is a common way of organizing the data to show the unique signature of the drift oforganizing the data to show the unique signature of the drift of plasmasheet electrons from the magnetotail towards dawn local time.
• This has been done with the GEO and HEO databases already (Ozkul et al 2001; Fennell et al 2008) but we combine all the datasets here to
10
et al. 2001; Fennell et al. 2008) but we combine all the datasets here to emphasize the point that they show the same phenomenon.

Seasonal Probabilities
• One expects a semiannual variation in the charging signatures because the driving geomagnetic activity exhibits such a pattern due to the projection of thethe projection of the interplanetary magnetic field on the magnetosphere. (Russell & McPherron 1973)(Russell & McPherron 1973)
• To our knowledge, this is the first time such a seasonal variation has been shown forvariation has been shown for charging in a wide range of orbits
11

LEO Duration
• It is puzzling that we encountered charging-related anomalies that t s pu g t at e e cou te ed c a g g e ated a o a es t atlasted a significant fraction of the LEO orbital period (~ 90 minutes)
• Timescale to traverse L=3.75 to 7 is 2 to 13 minutes• The worst-case in July 2002 lasted 164 minutes
12
The worst-case in July 2002 lasted 164 minutes

LEO: L Shell Traversal Rate
• It took the SAMPEX vehicle as long as 13 minutes to traverse this range of L but the most likelyrange of L, but the most likely traversal time was closer to 2 minutes.
• Thus anomalies sometimes• Thus, anomalies sometimes continued well beyond the spatial region within which the plasmasheet electrons were likelyplasmasheet electrons were likely located.
• One might have expected that the charging-related anomaly wouldcharging related anomaly would cease if the electron input was no longer present; this was clearly not the case
13

Unique Low-L LEO Events
• One unique aspect of this LEO database is the presence of events well inside the typical inner edge of the plasmasheet. yp g p
• The anomalies that occurred below L=2 appeared after April 2001 and were most prevalent in July 2002.
• We suggest that they were related to intense and long-lived injections
14
We suggest that they were related to intense and long lived injections of electrons into the inner radiation belt that appeared in mid-2001
HEO Duration
• As was the case for LEO we also had events that appear to last longerAs was the case for LEO, we also had events that appear to last longerthan the time required to traverse the nominal charging region
• Timescale to traverse L=4 to 7 is 3 to 45 minutes• The worst case in May 1998 lasted 97 minutes
15
• The worst-case in May 1998 lasted 97 minutes

HEO: L Shell Traversal Rate
• The typical timescale for l f L 3 75 7traversals of L=3.75 to 7 ranges
up to 45 minutes, yet there were 22 events that lasted longer than 60 minuteslonger than 60 minutes
• These long-duration events correlated with the maximum L shell of the charging meaningshell of the charging, meaning that while the longest lasting events began near L=4 to 5, they continued up to higher Lthey continued up to higher L, beyond GEO
16
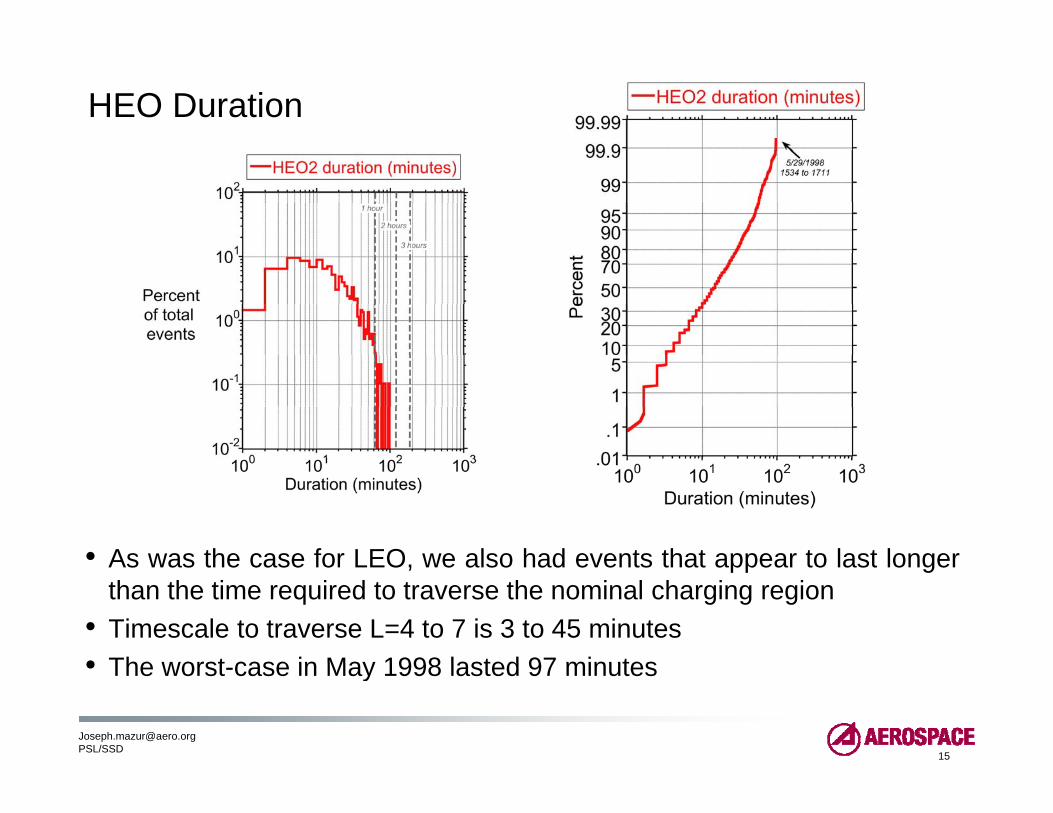
GEO Duration
• For GEO we have the added variable of charging threshold; here we show the99 9% worst-case charging level (other thresholds are shown in the paper)99.9% worst-case charging level (other thresholds are shown in the paper)
• The slope of the duration distribution changes little with the threshold potential,and we are able to almost arbitrarily define the worst-case charging durationfrom as long as ~12 hours to as short as ~80 minutes.
17
• These histories are directly proportional to the distribution of timescales ofchanges in the charging environment itself.

Normalized Distributions
• These distributions imply that for surface charging lasting a few to 10 minutes, the LEO and HEO frequencies of occurrence were comparablewere comparable.
• All three orbits had worst-case durations between 1 and 2 hourshours
• It is interesting that if one chooses a lower GEO potential than shown here then thethan shown here, then the worst-case duration at GEO can be an order of magnitude longer than HEO’s 97 minutes
18
than HEO s 97 minutes

Summary (1 of 2)
• The databases had these major shortcomings:– unknown charging level (and exact anomaly mechanism) for LEO– minimum L shell of ~4 for HEO– unclear choice of appropriate charging level to choose for GEO.
• We note that the HEO charging level was low (-30 volts), so the HEOdataset was not restricted to the worst-case levels.
• The LEO and HEO events had similar occurrence probabilitiessuggesting a sensitivity to relatively low-level charging in LEO,although we cannot prove this directly with the LEO anomalies.
19

Summary (2 of 2)
• We find several compelling aspects of vehicle surface charging in the magnetospherethat are quantitative, reproducible, and might serve as a reference for futuremeasurements or laboratory work on the surface charging phenomenon:
1. Worst-case durations for LEO (164 minutes) and HEO (97 minutes)2. Both LEO and HEO longest-duration events were much longer than the orbital
residence time within the nominal L=4 to L=6 surface charging region (on the order of 10 and 50 minutes for LEO and HEO, respectively), p y)
3. Worst-case duration for GEO that varied from 667 minutes at -100 volts to 82 minutes at -475 volts
4. Within these databases, there were comparable likelihoods for LEO and HEO charging events to occur and last the same amount of time at both orbits (e.g. g g ( gat a 10 minute duration, both LEO and HEO likelihoods were ~ 2e-03)
5. New evidence for LEO vehicle charging inside L=2 during intense injections of electrons into the inner magnetosphere
• It is clear that a simple residence time argument is insufficient to characterize theworst-case duration for surface charging in LEO and HEO
• For GEO, the worst-case duration depends more on the charging level than ontraversal rate through the relevant local times
20
traversal rate through the relevant local times.

ReferencesKorth, H., M. F. Thomsen, J. E. Borovsky, and D. J. McComas (1999), Plasma sheet access to geosynchronous orbit, J. Geophys. Res., , , , y, ( ), g y , p y ,
104(A11), 25, 047–25, 061
Bogorad, A., C. Bowman, A. Dennis, J. Beck, D. Lang, R. Herschitz, M. Buehler, B. Blaes, and D. Martin, Integrated environmental monitoring system for spacecraft, IEEE Trans. Nucl. Sci., 42, 2051, 1995
Likar J J A L Bogorad R E Lombardi R Herschitz D Pitchford G Kircher and M J Mandell Spacecraft Charging Monitoring at GEO:Likar, J. J., A. L. Bogorad, R. E. Lombardi, R. Herschitz, D. Pitchford, G. Kircher, and M. J. Mandell, Spacecraft Charging Monitoring at GEO: Natural andElectric Propulsion Environment Measurements, 47th AIAA Aerospace Sciences Meeting Including The New Horizons Forum and Aerospace Exposition 5 - 8 January 2009, Orlando, Florida
Ozkul, A., Lopatin, A., Shipp, A., Pitchford, D., Mazur, J. E., Roeder, J. L., Koons, H. C., Bogorad, A., and Herschitz, R., 的nitial Correlation Results of Charge Sensor Data from Six INTELSAT VIII Class Satellites with Other Space and Ground- Based Measurements, Proceedings of the 7th Spacecraft Charging Technology Conference SP 476 ESA Noordwijk The Netherlands 2001 pp 293 298the 7th Spacecraft Charging Technology Conference, SP-476, ESA, Noordwijk, The Netherlands, 2001, pp. 293–298.
Koons, H., J. E. Mazur, A. Lopatin, D. Pitchford, A. Bogorad, R. Herschitz, Journal of Spacecraft and Rockets 2006 0022-4650 vol.43 no.1 (178-185) doi: 10.2514/1.10805
Frooninckx, T. B. and J. J. Sojka, Solar cycle dependence of spacecraftcharging in low earth orbit, J. Geophys. Res., vol. 97, no. A3, pp. 2985–2996, 1992.
Gussenhoven,. S., D. A. Hardy, F . Rich, W . J. Burke, and H .-C. Yeh,High-level spacecraft charging in the low-altitude polar auroral environment, J. Geophys. Res.,90, 11,009,1985.
S H E J B Bl k d J F F ll S f h i l i f hi h i li ti hi h ltit d ft Id tifi ti d h i fSpence, H. E., J. B. Blake, and J. F. Fennell, Surface charging analysis of high-inclination, high-altitude spacecraft: Identification and physics ofthe plasma source region, IEEE Trans. Nucl. Sci., vol. 40, no. 6, pp. 1521–1524, Dec. 1993
Russell, C., and R. McPherron (1973), Semiannual Variation of Geomagnetic Activity, J. Geophys. Res., 78(1), 92-108.
Fennell, J. F. and J. L. Roeder, HEO Satellite Surface Charging in 1995-2002 ,, 9th S/C Charging Conf.
21
Fennell, J. F. and J. L. Roeder, HEO Satellite Surface Charging in 1995 2002 ,, 9th S/C Charging Conf.


![Canards in a Surface Oxidation Reactionmoehlis/moehlis_papers/ducks.pdfof one variable on a fast timescale and the other on a slow timescale (cf. [39]). It is shown numerically that](https://img.dokumen.tips/doc/110x75/6042514f77d6591aa12c42cc/canards-in-a-surface-oxidation-reaction-moehlismoehlispapersduckspdf-of-one.jpg)