Embed Size (px)
Citation preview

7th TAE 2019
17 - 20 September 2019, Prague, Czech Republic
THE TIME-TEMPERATURE DEPENDENCIES OF POLYCRYSTALLINE
PHOTOVOLTAIC MODULE DIFFERENT PARTS
Matúš BILČÍK1, Monika BOŽIKOVÁ1, Martin MALÍNEK1, Patrik KÓSA2, Marián KIŠEV2,
Juraj BALÁŽI2, Ana PETROVIĆ1, Ján CSILLAG1
1Department of Physics, Faculty of Engineering, Slovak University of Agriculture in Nitra 2Department of Electrical Engineering, Automation and Informatics, Slovak University of Agriculture
in Nitra
Abstract
The main aim of this research is creation of thermal model for photovoltaic module which is usable in
real climatic conditions with localization in Central Europe region. The measuring system for
temperature measurement of the photovoltaic module was designed and built at Department of
Physics Slovak University of Agriculture in Nitra. Climate characteristics were measured by weather
station. The measurements were done during the summer on photovoltaic module. From obtained
results is clear that the response of the module temperature is dynamic with irradiance changes,
particularly during periods of irradiance fluctuating. Based on the previous facts were made
mathematical descriptions of obtained time-temperature and time-irradiance relations. For every
graphical relation was obtained polynomial function of the second degree with relatively high
coefficients of determination. Temperature model of photovoltaic module was obtained after
application of fitting procedure to real dependencies and correlation analysis.
Key words: external factor; relation; solar system; energy.
INTRODUCTION
Solar energy can be directly converted into electrical energy by photovoltaic cells. Photovoltaic have a
lot of applications. These applications described author’s (Olejár et al., 2015; Milićević et al., 2012).
The usage of PV system depends on many factors as: solar radiation, ambient temperature, wind
speed, material of PV module, composition and mounting structure. Mentioned factors were described
by the authors (Amstrong & Hurley , 2010; Bilčík & Božiková, 2018; Malínek et al., 2018; Libra et
al., 2017). The temperature of PV module especially the temperature of PV cells is important
parameter for assessing the long term performance of PV system and its energy production.
The authors (Amstrong & Hurley, 2010; Jones & Underwood, 2001) reported that PV module
efficiency strongly depends on its cells operating temperature. The increasing cell´s temperature has
negative influence on the electric power production of PV module (Duffie & Beckman, 1980; Schott,
1985, Servant, 1985; Cviklovič & Olejár, 2013). However, in real operating conditions, the
temperature measurement of a photovoltaic cell is relatively difficult, so it is more appropriate to
measure the surface temperature of PV module active and passive parts. Based on presented facts the
main aim of this research was to identify real time-temperature dependencies of the polycrystalline PV
module different parts. The next aim of this work is creating the simplified mathematical model for
temperature and solar radiation which could be used for prediction operational parameters of PV
module. For these measurements was designed and created fully autonomous measuring system with
24 temperature sensors. The measurements were performed on the photovoltaic system, which is
located in area of CULS in Czech Republic. The climate parameters were measured by weather station
which was located near the PV system.
MATERIALS AND METHODS
For temperature measurement was designed and constructed the measuring system (Fig.1).
The measuring system contains these components: 24 temperature sensors with accuracy ± 0.75 %,
control module, communication module, measuring module (B&R, Austria), It works fully
automatically. The control software of the measuring system was programmed in Automation Studio.
The position of the temperature sensors was chosen according to the temperature changes of the PV
module different parts. The temperature changes were detected by the thermovision using the
59

7th TAE 2019
17 - 20 September 2019, Prague, Czech Republic
termocamera Fluke TiR1 (Fluke, USA) (Fig. 2).
Fig. 1 Measuring system
This weather station measures quantity as: ambient temperature, humidity, air pressure, rainfall, wind
velocity, wind direction and global solar radiation. Ambient temperature was measured by sensor
HMP45C with accuracy ± 0.5 °C (Vaisala, Inc., Germany). The intensity of solar radiation was
detected by pyranometer CM11 with accuracy < 10 W·m-2 (Kipp & Zonen, Holland).
Fig. 2 Identification of temperature changes by termocamera Fluke TiR1
The measurements were performed on the polycrystalline PV module (Yingli Solar, China).
The technical parameters of this PV module are presented in Tab. 1. The efficiency of the
polycrystalline PV module was 14 %.
Tab. 1 Technical parameters of PV module
Module type YL230P-29b
Rated maximum power 230 W
Rated voltage 29.5 V
Rated current 7.8 A
Size 1590 mm x 990 mm x 45 mm
RESULTS AND DISCUSSION
At the first were detected the temperature changes by the thermocamera (Fig. 2). These measurements
identified differences between upside and downside temperatures of PV module, so the temperatures
were measured on the upside parts of PV module and also on downside of PV module. The results of
experiments are presented as graphical dependencies. Especially, the time-temperature relations and
the relations of global solar radiation intensity in the same time range were identified. The temperature
was measured of PV module active part, no active white part of PV module and also in the frame of
PV module. The graphical relation on Fig. 3 represents a certain deviation from the expected trend of
temperature, which is known from the theoretical models presented in literature (Amstrong & Hurley,
2010; Jones & Underwood, 2001; Duffie & Beckman, 1980; Schott, 1985; Servant, 1985).
60
7th TAE 2019
17 - 20 September 2019, Prague, Czech Republic
Fig. 3 The time-temperature dependencies of PV module different parts and ambient temperature –
real curves
The fitting procedure was applied on the graphical dependences, because from the mathematical point
of view it was necessary to smooth out extreme parts of the time-temperature graphical dependences.
It eliminates extremes of graphical dependencies which did not correspond to the assumed trend of the
graphs.
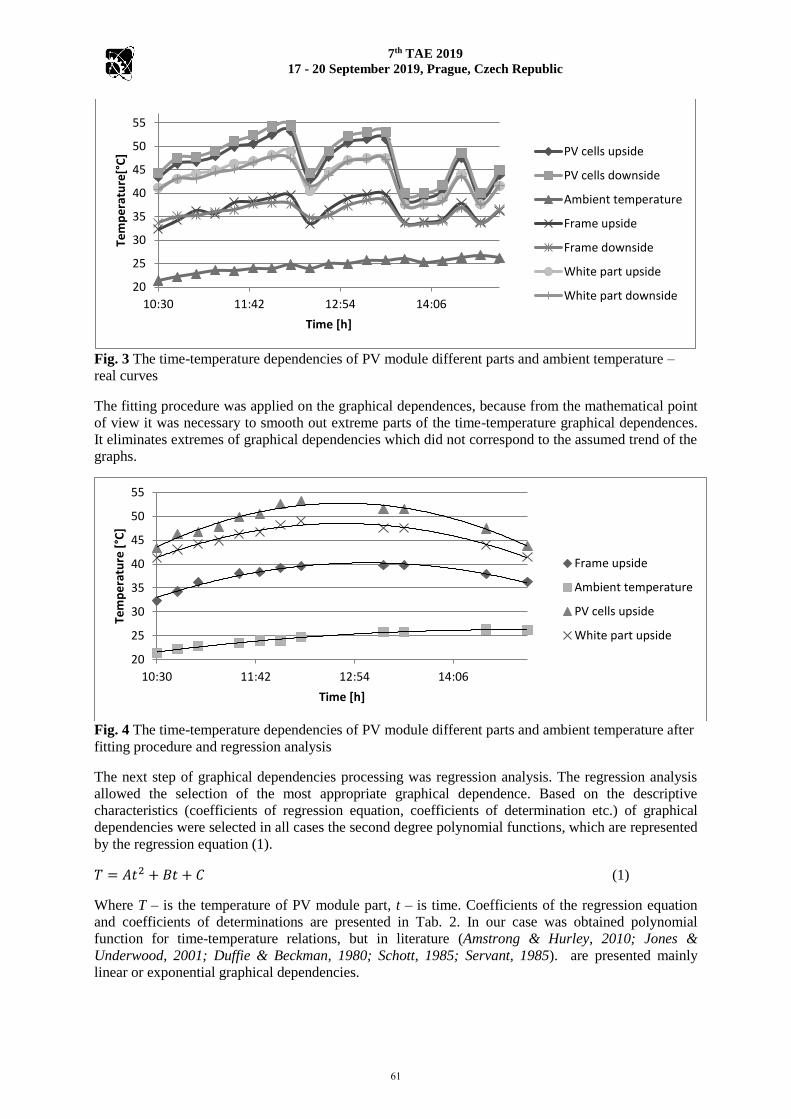
Fig. 4 The time-temperature dependencies of PV module different parts and ambient temperature after
fitting procedure and regression analysis
The next step of graphical dependencies processing was regression analysis. The regression analysis
allowed the selection of the most appropriate graphical dependence. Based on the descriptive
characteristics (coefficients of regression equation, coefficients of determination etc.) of graphical
dependencies were selected in all cases the second degree polynomial functions, which are represented
by the regression equation (1).
𝑇 = 𝐴𝑡2 + 𝐵𝑡 + 𝐶 (1)
Where T – is the temperature of PV module part, t – is time. Coefficients of the regression equation
and coefficients of determinations are presented in Tab. 2. In our case was obtained polynomial
function for time-temperature relations, but in literature (Amstrong & Hurley, 2010; Jones &
Underwood, 2001; Duffie & Beckman, 1980; Schott, 1985; Servant, 1985). are presented mainly
linear or exponential graphical dependencies.
20
25
30
35
40
45
50
55
10:30 11:42 12:54 14:06
Tem
pe
ratu
re[°
C]
Time [h]
PV cells upside
PV cells downside
Ambient temperature
Frame upside
Frame downside
White part upside
White part downside
20
25
30
35
40
45
50
55
10:30 11:42 12:54 14:06
Tem
pe
ratu
re [°C
]
Time [h]
Frame upside
Ambient temperature
PV cells upside
White part upside
61

7th TAE 2019
17 - 20 September 2019, Prague, Czech Republic
Tab. 2 Table of statistical coefficients for time-temperature relations
Part of PV
module A B C
Coefficients
of
determinations
Coefficient
of
correlation
Degree of
correlation
PV cells -1035.7 1101.4 -240.06 0.97 0.34 mild
Frame -642.8 699.13 -149.84 0.97 0.7 high
White part -814.68 865.29 -181.27 0.98 0.32 mild
The next part of this research was identifying the influence of the ambient temperature on the
temperature of different parts of PV module, so there was performed correlation analysis on all
graphical dependencies. The results of correlation analysis are presented in Tab. 2 as coefficients of
correlations and degree of correlation. The correlation coefficients were found in the range from 0.32
to 0.7. Especially, the correlation coefficient of 0.34 was found for correlation between the ambient
temperature and the temperature of the PV cells, which means middle degree of correlation. The
temperature of the PV module frame and ambient temperature correlate on the high degree with a
correlation coefficient 0.7 and for the correlation between the temperature of PV module and white
area was identified a mild correlation degree with correlation coefficient 0.32. Based on presented
results is clear the influence of ambient temperature on the temperature of individual parts of the PV
module. This result is new because all known mathematical models presented in literature (Amstrong
& Hurley, 2010; Jones & Underwood, 2001; Duffie & Beckman, 1980; Schott, 1985; Servant, 1985).
assume the constant temperature of all PV module parts which is contrary to the results obtained under
real conditions. In the next part of results are presented the time-temperature and solar radiation
dependencies. Fig. 6 shows the fluctuations in the intensity of sunshine due to cloudiness change.
These fluctuations also affected temperature of PV cells. These extremes were inappropriate for
creating of a mathematical model, so fitting procedure was applied.
Fig. 5 The time-temperature and solar radiation dependencies – real curves
After fitting procedure were created graphs with smooth curves (Fig. 7.) and by using of regression
analysis were chosen model regression equations. The model relations can be described by the
polynomial function of second degree (Equation 2).
𝐼 = 𝐸𝑡2 + 𝐹𝑡 + 𝐺 (2)
Where I – is the solar radiation, t – is the time. Tab. 3 presents the coefficients of this regression
equation and the coefficients of determinations. Determination coefficients are relatively very high,
they are from range R2 = (0.8 – 0.92). The polynomial function of second degree was chosen correctly,
not only from the mathematical point of view, but also from the physical theoretical point of view. It
200
250
300
350
400
450
30
35
40
45
50
55
10:30 11:42 12:54 14:06
Sola
r ra
dia
tio
n[k
J.m
-2.(
10
min
)-1]
Tem
pe
ratu
re [°C
]
Time [h]
PV cell upside
PV cells downside
Frame upside
Frame downside
White part upside
White part downside
Solar radiation
62

7th TAE 2019
17 - 20 September 2019, Prague, Czech Republic
predicts the polynomial progress of temperature relation during the culmination of the sun's intensity.
Tab. 3 Table of statistical coefficients for time relations of solar radiation
Part of PV
module E F G
Coefficients
of
determinations
Coefficient
of
correlation
Degree of
correlation
PV cells -844.75 909.13 -192.33 0.8 0.8 high
Frame -590.66 645.21 -135.68 0.92 0.89 high
White part -542.29 577.58 -105.98 0.82 0.69 high
Fig. 6 The time-temperature dependencies of PV module different parts and solar radiation after fitting
procedure and regression analysis
A basic correlation analysis was performed for evaluation of graphical dependencies as in previous
cases. The correlation between the temperature of PV module different parts and the solar radiation
intensity was high with correlation coefficients in range (0.69 - 0.89). The results of the measurement
and statistical evaluation of the measured data confirmed from the literature well-known fact, that the
intensity of solar radiation most significantly affects the temperature of the PV module.
𝑇𝑚 = 𝑇𝑎 + 𝛼𝐺𝑇(1 + 𝛽𝑇𝑎)(1 − 𝛾𝑣𝑊)(1 − 1.053𝜂𝑐) (3)
The Equation (3) presents temperature model by (Servant, 1985) and Equation (6) present temperature
model by (Schott, 1985). The models for PV module temperature Tm contain physical quantities as
ambient temperature Ta , global solar radiation GT, module electrical efficiency ηc and constant wind
velocity vw with value 1 m·s-1. The parameters in Equations (3) and (6) have values α = 0.0138, β =
0.031, γ = 0.042 and a, b (Eq. 4, 5) are coefficients of empirical functions of PV and ground
emissivities εPV, εg and a cloudiness factor, εc.
𝑎 = 208𝜀𝑃𝑉 + 297.14𝜀𝑎 − 594.3𝜀𝑔 (4)
𝑏 = 6𝜀𝑃𝑉 + 𝜀𝑎 − 2𝜀𝑔 (5)
𝑇𝑚 = 𝑇𝑎 +(𝛼−𝜂𝑐).𝐺𝑇+(𝑎+𝑏𝑇𝑎)
17.8+2.1𝑣𝑤 (6)
Equations (3) and (6) predict temperature of PV module with the linear trend. From presented results
is clear that there is high correlation between the intensity of solar radiation and temperature of PV
module different parts. From the physical theory is known fact that the culmination of sun intensity
has polynomial trend too. It was the main reason for usage the polynomial functions of second degree.
0
50
100
150
200
250
300
350
400
450
30
35
40
45
50
55
60
10:30 11:42 12:54 14:06
Sola
r ra
dia
tio
n[k
J.m
-2.(
10
min
)-1]
Tem
pe
ratu
re[°
C]
Time [h]
Frame upside
PV cells upside
White part upside
Solar radiation
63

7th TAE 2019
17 - 20 September 2019, Prague, Czech Republic
CONCLUSIONS
Results obtained by PV module temperature measurements and measurements of solar radiation
intensity confirmed that the reaction of PV module temperature is dynamic in real conditions. This fact
is clear for periods where are detected changes of solar radiation intensity which were affected by the
cloudiness. The next result is that temperature changes of PV module different parts can be
characterized by polynomial function of the second degree. This result was determined by regression
analysis of experimental data and by application of the fitting procedure. The significant influence of
solar radiation intensity and partial influence of ambient temperature to temperature of polycrystalline
PV module was confirmed by correlation analysis. From results is evident, that the temperature of PV
module depends on the material of PV module components. The obtained results are in good
agreement with the literature (Amstrong & Hurley, 2010; Jones & Underwood, 2001; Duffie &
Beckman, 1980).
ACKNOWLEDGEMENT This work was supported by project KEGA 017-SPU 4/2017 - Multimedia textbook of physics for
engineers, Ministry of Education, Science, Research, and Sport of the Slovakia and was co-funded by
European Community under project no 26220220180: Building Research Centre AgroBioTech.
REFERENCES
1 Amstrong, S., & Hurley, W.G. (2010). A
thermal model for photovoltaic panels
under varying atmospheric conditions.
Applied Thermal Engineering, 30, 1488-
1495.
2 Bilčík, M., & Božiková, M. (2018). Wind
speed and the selected time temperature
dependencies for photovoltaic module.
Physics – Applications and Inovations.
SUA in Nitra.
3 Cviklovič, V., & Olejár, M. (2013).
Temperature dependence of photovoltaic
cells efficiency. In Trends in agricultural
engineering 2013 (pp. 128-131).
4 Duffie, J.A., Beckman, W.A. (1980) Solar
Engineering of Thermal Processes. New
York: John Wiley & Sons.
5 Jones, A.D., & Underwood, C.P. (2001) A
thermal model for photovoltaic systems.
Solar Energy, 70(4), 349-359.
6 Libra, M., Poulek, & V., Kouřím. P.,
(2017). Temperature changes of I-V
characteristics on photovoltaic cells as
consequence of the Fermi energy level
shift. Research in Agricultural
Engineering, 63(1), 10–15.
7 Malínek, M., Bilčík, M., Božiková, M.,
Petrović, A., Kotoulek, P., & Hlaváč, P.
(2018). The selected time temperature and
wind speed dependencies for photovoltaic
module. Journal on Processing and
Energy in Agriculture, 22(2), 82-84.
9 Milićević, D., Popadić, B., Dumnić, B.,
Čorba, & Z., Kalić, V. (2012) Possibility
of solar potential utilization in Republic of
Serbia – practical example. Journal on
Processing and Energy in Agriculture,
16(3), 109 – 112.
10 Olejár, M., Cviklovič, V., Hrubý, D., &
Lukáč, O. (2015). Autonomous control of
biaxial tracking photovoltaic system.
Research in agricultural engineering. 61,
48-52.
10 Servant J.M. (1985). Calculation of the
cell temperature for photovoltaic modules
from climatic data. In Bilgen E, Hollands
KGT, editors. Proceedings of the 9th
biennial congress of ISES – Intersol 85
(pp. 370).
11 Schott T. (1985). Operation temperatures
of PV modules. In Proceedings of the
sixth E.C. photovoltaic solar energy
conference (pp.392–396).
Corresponding author:
Ing. Matúš Bilčík, Department of Physics, Faculty of Engineering, Slovak University of Agriculture in
Nitra, Tr. A. Hlinku 2, SK - 949 76 Nitra, Slovak Republic, phone: +421 917 048 772,
e-mail: [email protected]
64