Embed Size (px)
Citation preview

The Tim-3 ligand galectin-9 negatively regulatesT helper type 1 immunity
Chen Zhu1, Ana C Anderson1, Anna Schubart1, Huabao Xiong2, Jaime Imitola1, Samia J Khoury1,Xin Xiao Zheng3, Terry B Strom3 & Vijay K Kuchroo1
Tim-3 is a T helper type 1 (TH1)–specific cell surface molecule that seems to regulate TH1 responses and the induction of
peripheral tolerance. However, the identity of the Tim-3 ligand and the mechanism by which this ligand inhibits the function
of effector TH1 cells remain unknown. Here we show that galectin-9 is the Tim-3 ligand. Galectin-9-induced intracellular
calcium flux, aggregation and death of TH1 cells were Tim-3-dependent in vitro, and administration of galectin-9 in vivo
resulted in selective loss of interferon-c-producing cells and suppression of TH1 autoimmunity. These data suggest that
the Tim-3–galectin-9 pathway may have evolved to ensure effective termination of effector TH1 cells.
In adaptive immunity CD4+ T cells differentiate into T helper 1 (TH1)and TH2 cells in response to different antigenic stimulation1. TH1 cellsproduce interleukin 2 (IL-2) and interferon-g (IFN-g), elicit delayed-type hypersensitivity responses and induce cell-mediated immunityagainst intracellular pathogens, whereas TH2 cells produce IL-4, IL-5,IL-10 and IL-13, mediate immunoglobulin G1 (IgG1) and IgE produc-tion and eosinophilic inflammation and promote immunity to extra-cellular parasites2. The cytokines produced by TH1 and TH2 cells haveopposite effects in immune regulation, cross-regulate each otherantagonistically and show reciprocal functional inhibition3. However,dysregulated TH1 and TH2 responses may lead to pathologicalconsequences. Overactivated TH1 responses cause organ-specificautoimmune diseases, such as type I diabetes and multiplesclerosis4,5, whereas uncontrolled TH2 responses have been linked toallergy and atopy6,7. Thus, elucidation of the molecular mechanisms ofcontrolling effector TH1 and TH2 cells in related immune responseshas both biological and clinical importance.
Tim-3, a TH1-specific type 1 membrane protein, is not expressed onthe surfaces of naive T cells but emerges on the cell surface of fullydifferentiated TH1 cells8. Tim-3 may regulate T cell responses, asshown by the fact that expression of Tim-3 mRNA is correlated withthe activation of effector TH1 cells in the animal model experimentalautoimmune encephalomyelitis (EAE)8 and by the high expression ofthe proinflammatory cytokines IFN-g and tumor necrosis factor inpatients with multiple sclerosis9. Furthermore, polymorphisms inTim-3 are associated with the development of airway hyper-reactivityin mice10 and rheumatoid arthritis in humans11.
Several lines of indirect evidence suggest that Tim-3 expressed onT cells functions as an inhibitory molecule. First, blocking this path-way with a Tim-3–Ig fusion protein during an ongoing immune
response results in hyperproliferation of TH1 cells, with massivespontaneous production of IFN-g12. Second, administration of Tim-3–Ig abrogates the induction of high-dose antigen-specific tolerance aswell as transplantation tolerance induced by antibody to CD40ligand12,13. Those data indicate the importance of Tim-3 and itsligand (Tim-3L) in regulating both peripheral tolerance and theexpansion of effector TH1 cell populations; however, the identity ofthe Tim-3 ligand has remained unknown.
Here we have identified galectin-9, a member of the galectin family(also called S-type lectins) that is expressed on lymphocytes and othercell types14, as the Tim-3 ligand. Galectins are a family of carbohydrate-binding proteins that have been linked to a crucial function inregulating immune cell homeostasis and inflammation15, but the lig-ands for most of the galectins in the immune system have not beenidentified. Functional studies suggested that galectin-9 induced celldeath in TH1 cells but not in TH2 cells and that the galectin-9-inducedcell death in TH1 cells was dependent on Tim-3. In vivo administrationof galectin-9 in immunized mice specifically reduced the numbers ofIFN-g-producing TH1 cells. The Tim-3–galectin-9 pathway may there-fore have evolved to downregulate effector TH1 responses.
RESULTS
Tim-3 expression on effector-memory CD4+ T cells
Tim-3 is expressed on TH1 cells after several rounds of in vitropolarization8. However, the expression of Tim-3 on T cells in vivohas not been analyzed in detail. We examined the phenotype ofCD4+Tim-3+ T cells in vivo and found that almost all theCD4+Tim-3+ T cells in naive and immunized mice were CD44hi
and CD62Llo (Fig. 1). This suggested functional involvement ofTim-3 in regulating effector-memory CD4+ cells in vivo.
Received 14 July; accepted 4 October; published online 13 November 2005; doi:10.1038/ni1271
1Center for Neurologic Diseases, Brigham and Women’s Hospital, Harvard Medical School, Boston, Massachusetts 02115, USA. 2Immunobiology Center, Mount SinaiSchool of Medicine of New York University, New York, New York 10029, USA. 3Division of Immunology and Transplant Research Center, Beth Israel and DeaconessHospital, Harvard Medical School, Boston, Massachusetts 02115, USA. Correspondence should be addressed to V.K.K. ([email protected]).
NATURE IMMUNOLOGY VOLUME 6 NUMBER 12 DECEMBER 2005 1245
A R T I C L E S©
2005
Nat
ure
Pub
lishi
ng G
roup
ht
tp://
ww
w.n
atur
e.co
m/n
atur
eim
mun
olog
y
Identification of galectin-9 as the ligand for Tim-3
To identify the ligand for Tim-3, we used two different Tim-3–Igfusion proteins: a full-length form (flTim-3–Ig), containing both theIgV and mucin domains, and a soluble isoform (sTim-3–Ig), contain-ing the IgV domain but lacking the mucin domain12. We used thesefusion proteins to screen cell lines for expression of Tim-3L by flowcytometry. Of the cell lines tested, TK-1, a CD8+ mouse lymphomacell line, had maximum expression of Tim-3L (Fig. 2a).
To determine the identity of the specific protein mediating thebinding of Tim-3–Ig, we used lysates from surface-biotinylated TK-1cells in a precipitation assay with Tim-3–Ig fusion proteins, followedby separation by SDS-PAGE. Both Tim-3–Ig fusion proteins precipi-tated broad bands of over 85 kilodaltons (kDa) and 40–60 kDa(Fig. 2b) that were not obtained with the control Tim-2–Ig fusionprotein or with human IgG. After treatment of the precipitates withN-glycosidase F (PNGase F) to remove N-linked oligosaccharides, a‘sharper’ band of 35 kDa appeared (Fig. 2b), indicating a cell surfacemembrane protein was specifically recognized by Tim-3. Mass spec-trometry analysis of the 35-kDa silver-stained band extracted from theSDS polyacrylamide gel identified the protein as galectin-9.
We isolated two cDNA sequences from TK-1 cells that encodedgalectin-9. These corresponded to galectin-9 (Gal-9) and its longisoform (Gal-9L), which has a 31–amino acid insertion in the hingeregion of the two carbohydrate-recognition domains (CRDs)14. Toconfirm the interaction between galectin-9 and Tim-3, we subclonedcDNA encoding each galectin-9 isoform into an expression vector thatbicistronically expressed enhanced green fluorescent protein (EGFP)along with the protein of interest. Transiently transfected Chinesehamster ovary (CHO) cells expressing either Gal-9 or Gal-9L stainedwith both flTim-3–Ig and sTim-3–Ig but not with control human IgG(Fig. 3a). As an additional control, we stained galectin-9 transfectantswith other Tim-Ig fusion proteins (Tim-2–Ig and Tim-4-Ig) and
found that only Tim-3–Ig fusion proteins, but not other Tim-Ig fusionproteins, stained galectin-9 transfectants (Fig. 3b). To determinewhether other members of the galectin family can also interact withTim-3, we cloned and transiently expressed galectin-4, galectin-3 andgalectin-1 in CHO cells. As expected, all cells expressing EGFPgalectin-9 stained with flTim-3–Ig and sTim-3–Ig, but only a smallpercentage of cells with very high expression of galectin-4, galectin-3and galectin-1 stained with the flTim-3–Ig and sTim-3–Ig fusionproteins (Fig. 3c), suggesting low-affinity interactions between Tim-3and other members of the galectin family.
Galectin-9 binds carbohydrate chains on Tim-3
The interaction of galectins and their receptors is dependent on theCRD and the oligosaccharide chains of the cell surface–associatedproteins16,17. Therefore, we sought to determine whether the bindingof galectin-9 and Tim-3 is based on the same mechanism. Recombi-nant galectin-9 bound to both full-length and soluble Tim-3–Ig fusionproteins in solution and was inhibited in a dose-dependent way bya-lactose, a competitive substrate that inhibits the interaction betweengalectins and their receptors (Fig. 4a). We obtained similar resultswhen we examined the intracellular staining of galectin-9-transfectedCHO cells with sTim-3–Ig in the presence of various concentrations ofa-lactose (Fig. 4b).
NaiveSpleen
CD62L
100
Max
(%
)M
ax (
%)
80
60
40
20
0
100
80
60
40
20
01 10 100 1,000 10,000 1 10 100 1,000 10,000 1 10 100 1,000 10,000 1 10 100 1,000 10,000
CD44
Day 7Spleen
Day 10Spleen Brain
Figure 1 Tim-3 expression on effector-memory T
cells in vivo. SJL mice were left untreated (Naive)
or were immunized for the induction of EAE with
a peptide of proteolipid protein (amino acids
139–151) and were killed 7 and 10 d after
immunization. Spleens and brains were collected,
and single-cell suspensions were prepared by
collagenase D digestion and Percoll gradientpurification. Cells were stained with antibody to
Tim-3 (anti-Tim-3), anti-CD4, anti-CD62L and
anti-CD44 and were assessed by flow cytometry
for expression of CD62L and CD44 on CD4+ Tim-
3+ cells (filled histograms) relative to total CD4+
cells (open histograms). Data are representative
of two independent experiments.
100
Max
(%
)
TK-1
85 kDa
a
b
60 kDa
50 kDa
40 kDa
25 kDa
1 2 3
PNGase – +
4 5 6 7 8
CD8 fITim-3–Ig
fITim
-3–I
g
sTim
-3–I
g
Tim-2
–Ig
hlgG
fITim
-3–I
g
sTim
-3–I
g
Tim-2
–Ig
hlgG
sTim-3–Ig
80
60
40
20
01 10 100
85.6 91.1 96.8
1,00010,000 1 10 100 1,00010,000 1 10 100 1,000 10,000
Figure 2 Identification of the Tim-3-binding protein. (a) TK-1 cells stained
with anti-CD8 and biotinylated flTim-3–Ig, sTim-3–Ig or human IgG (human
IgG) control. Numbers above bracketed lines indicate the percentage of cells
positive for CD8, flTim-3–Ig or sTim-3–Ig staining. (b) Precipitation assays
with Tim–Ig fusion proteins or human IgG (hIgG) in lysates of surface-
biotinylated TK-1 cells. Bound proteins were separated by SDS-PAGE and
detected by immunoblot. A broad band of more than 80 kDa and a band of
40–60 kDa (arrows) are specifically associated with Tim-3–Ig fusion proteins
(lanes 1,2) but not with the controls Tim-2–Ig (lane 3) or human IgG (lane4). After deglycosylation with PNGase F, a ‘sharper’ band of 35 kDa appears
(arrow, lanes 5,6). This band is not present for the controls Tim-2–Ig
(lane 7) and human IgG (lane 8). Data are representative of four
independent experiments.
1246 VOLUME 6 NUMBER 12 DECEMBER 2005 NATURE IMMUNOLOGY
A R T I C L E S©
2005
Nat
ure
Pub
lishi
ng G
roup
ht
tp://
ww
w.n
atur
e.co
m/n
atur
eim
mun
olog
y
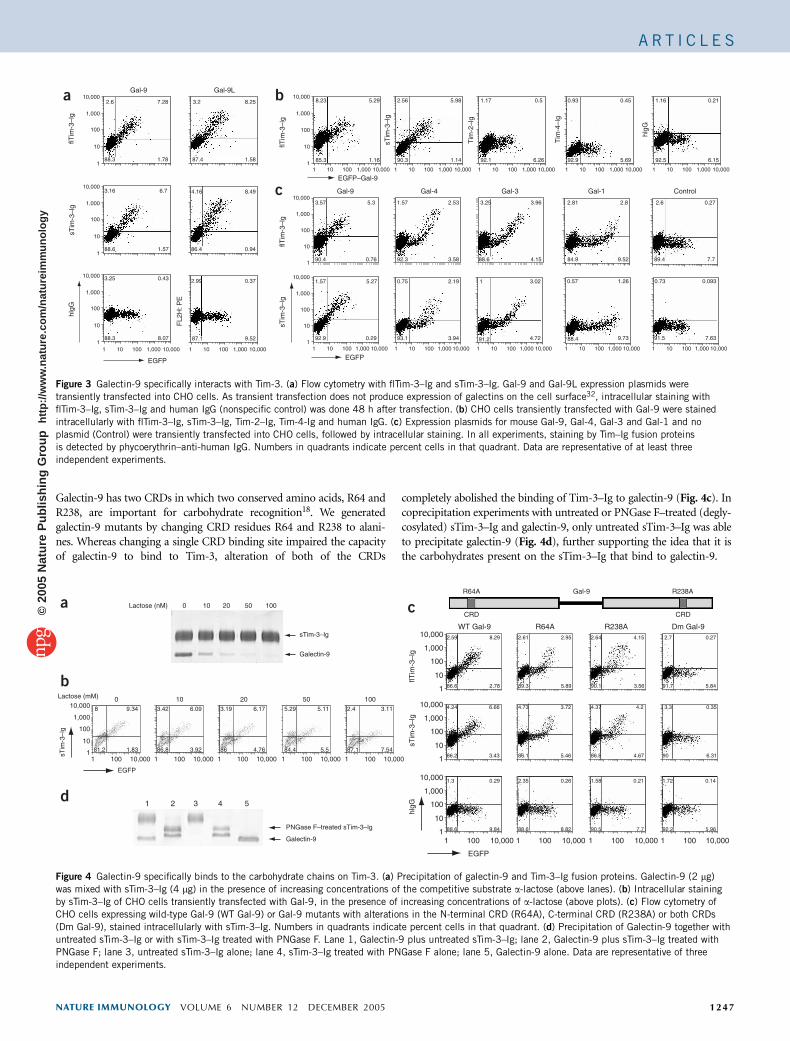
Galectin-9 has two CRDs in which two conserved amino acids, R64 andR238, are important for carbohydrate recognition18. We generatedgalectin-9 mutants by changing CRD residues R64 and R238 to alani-nes. Whereas changing a single CRD binding site impaired the capacityof galectin-9 to bind to Tim-3, alteration of both of the CRDs
completely abolished the binding of Tim-3–Ig to galectin-9 (Fig. 4c). Incoprecipitation experiments with untreated or PNGase F–treated (degly-cosylated) sTim-3–Ig and galectin-9, only untreated sTim-3–Ig was ableto precipitate galectin-9 (Fig. 4d), further supporting the idea that it isthe carbohydrates present on the sTim-3–Ig that bind to galectin-9.
10,0002.6 3.2 8.25 8.23 5.29 2.56 5.98
90.3 1.14
1.17
92.1
0.5
6.26
0.93
92.9
0.45
5.69
1.16
92.5
0.21
6.1585.3 1.16
7.28
88.3
3.16
87.4 1.58
4.16 8.49
86.4 0.94
2.99 0.37
87.1 9.52
1.78
6.7
88.6 1.57
3.25 0.43
88.3 8.07
Gal-9
EGFP–Gal-9
Gal-9 Gal-4 Gal-3 Gal-1 Control
hlgG
FL2
H: P
E
EGFP EGFP
sTim
-3–l
gflT
im-3
–lg
flTim
-3–l
gflT
im-3
–lg
sTim
-3–l
g
sTim
-3–l
g
Tim
-2–l
g
Tim
-4–l
g
hlgG
Gal-9L
1,000
1,000 10,000
100
10
1
10,000
1,000
100
10
1
10,0003.57
90.4
1.57
92.3
2.53
3.58
3.25
88.6
3.96
4.15
2.81
84.9
2.8
9.52
2.6
89.4
0.27
7.7
5.3
0.76
1.57
92.9
0.75
93.1
2.19
3.94
1
91.2
3.02
4.72
0.57
88.4
1.26
9.73
0.73
91.5
0.093
7.63
5.27
0.29
1,000
100
10
1
10,000
1,000
100
10
1
10,000
1,000
100
10
1
10,000
1,000
100
10
11 10 100 1,000 10,0001 10 100 1,000 10,0001 10 100 1,000 10,0001 10 100 1,000 10,0001 10 100 1,000 10,0001 10 100 1,000 10,0001 10 100
1,000 10,0001 10 100 1,000 10,0001 10 100 1,000 10,0001 10 100 1,000 10,0001 10 100 1,000 10,0001 10 100
a b
c
Figure 3 Galectin-9 specifically interacts with Tim-3. (a) Flow cytometry with flTim-3–Ig and sTim-3–Ig. Gal-9 and Gal-9L expression plasmids were
transiently transfected into CHO cells. As transient transfection does not produce expression of galectins on the cell surface32, intracellular staining with
flTim-3–Ig, sTim-3–Ig and human IgG (nonspecific control) was done 48 h after transfection. (b) CHO cells transiently transfected with Gal-9 were stained
intracellularly with flTim-3–Ig, sTim-3–Ig, Tim-2–Ig, Tim-4-Ig and human IgG. (c) Expression plasmids for mouse Gal-9, Gal-4, Gal-3 and Gal-1 and no
plasmid (Control) were transiently transfected into CHO cells, followed by intracellular staining. In all experiments, staining by Tim–Ig fusion proteins
is detected by phycoerythrin–anti-human IgG. Numbers in quadrants indicate percent cells in that quadrant. Data are representative of at least three
independent experiments.
a Lactose (nM)
Lactose (mM)
EGFP
0
010,000 8 3.42 6.099.34
81.2 86.8 3.92
3.19 6.17
86 4.76
5.29 5.11
84.4 5.5
2.4 3.11
87.1 7.541.83
10,000
1,000
100
sTim
-3–l
g
100
10
11 10,0001001 10,0001001 10,0001001 10,0001001
10 20 50 100
1
R64A R238AGal-9
CRD
WT Gal-9 R64A R238A Dm Gal-9
CRD
2 3 4 5
10 20 50 100
sTim-3–lg
Galectin-9
b
c
d
PNGase F–treated sTim-3–lg
Galectin-9
10,000 2.59 8.29
86.6 2.78
2.61 2.95
89.3 5.89
2.64 4.15
90.1 3.56
2.7 0.27
91.7 5.84
4.24 6.66
86.2 3.43
4.73 3.72
86.1 5.46
4.37 4.2
86.8 4.67
3.3 0.35
90 6.31
1.3 0.29
88.6 9.84
2.35 0.26
88.6 8.82
1.58 0.21
90.5 7.7
1.72 0.14
92.2 5.96
1,000
100
flTim
-3–l
gsT
im-3
–lg
hlgG
10
1
10,000
1,000
100
10
1
10,000
10,000
1,000
100
100
EGFP
10
11 10,0001001 10,0001001 10,0001001
Figure 4 Galectin-9 specifically binds to the carbohydrate chains on Tim-3. (a) Precipitation of galectin-9 and Tim-3–Ig fusion proteins. Galectin-9 (2 mg)
was mixed with sTim-3–Ig (4 mg) in the presence of increasing concentrations of the competitive substrate a-lactose (above lanes). (b) Intracellular staining
by sTim-3–Ig of CHO cells transiently transfected with Gal-9, in the presence of increasing concentrations of a-lactose (above plots). (c) Flow cytometry of
CHO cells expressing wild-type Gal-9 (WT Gal-9) or Gal-9 mutants with alterations in the N-terminal CRD (R64A), C-terminal CRD (R238A) or both CRDs
(Dm Gal-9), stained intracellularly with sTim-3–Ig. Numbers in quadrants indicate percent cells in that quadrant. (d) Precipitation of Galectin-9 together with
untreated sTim-3–Ig or with sTim-3–Ig treated with PNGase F. Lane 1, Galectin-9 plus untreated sTim-3–Ig; lane 2, Galectin-9 plus sTim-3–Ig treated with
PNGase F; lane 3, untreated sTim-3–Ig alone; lane 4, sTim-3–Ig treated with PNGase F alone; lane 5, Galectin-9 alone. Data are representative of three
independent experiments.
NATURE IMMUNOLOGY VOLUME 6 NUMBER 12 DECEMBER 2005 1247
A R T I C L E S©
2005
Nat
ure
Pub
lishi
ng G
roup
ht
tp://
ww
w.n
atur
e.co
m/n
atur
eim
mun
olog
y

Galectin-9 induces TH1 cell death through Tim-3
Blocking Tim-3L in vivo by the administration of Tim-3–Ig induceshyperproliferation of effector TH1 cells12; however, the molecularmechanism by which the interaction of Tim-3 with its ligand regulatesTH1 cell population expansion is not known. Galectin-9 can inducecell death of thymocytes and peripheral CD4+ and CD8+ T cells19,20,and the calcium–calpain–caspase-1 pathway has been linked galectin-9-induced cell death20. However, the receptor engaged by galectin-9 onthe surface of T cells is not known. To analyze the effect of galectin-9on T cells, we first determined the effect of galectin-9 on terminallydifferentiated TH1 and TH2 cells derived from naive DO11.10 T cellreceptor (TCR)–transgenic T cell precursors. Incubation of TH1 cellswith galectin-9 induced rapid cell death that peaked within 4 to 8 h,with little or no cell death in TH2 cells (Fig. 5a,b and SupplementaryTable 1 online). Thus, galectin-9-induced cell death correlated withTim-3 expression on TH1 cells. To test whether the effects of galectin-9on TH1 cells were dependent on Tim-3, we used Tim-3-deficientDO11.10 TCR-transgenic mice. The addition of galectin-9 generated adistinct calcium flux in wild-type TH1 cells. In contrast, Tim-3-deficient TH1 cells showed substantially less galectin-9-mediatedcalcium flux (Fig. 5c). However, thapsigargin, an inhibitor of endo-plasmic reticulum calcium-ATPase21, triggered immediate calciumefflux from the endoplasmic reticulum lumen in both wild-type andTim-3-deficient TH1 cells (Fig. 5c), suggesting that there was nointrinsic defect in intracellular calcium mobilization in Tim-3-deficient TH1 cells and that the galectin-9-induced intracellular
calcium flux was dependent on its interactionwith Tim-3 on TH1 cells. Independent ana-lysis of cell death by nucleosome enrichmentassay further demonstrated that wild-typeTH1 cells were susceptible to cell death bygalectin-9, which was partially abrogated inthe Tim-3-deficient TH1 cells (Fig. 5d). As anadditional specificity control, we treated cellswith galectin-3, which also has a CRD andshowed low-affinity binding to Tim-3–Ig(Fig. 3c). Galectin-3 was not able to induceeither calcium flux (Fig. 5c) or cell death(Fig. 5a,d and Supplementary Table 1 on-line) in TH1 cells, further supporting the ideaof a functional interaction between galectin-9and Tim-3 in the regulation of TH1 responses.In the same experiment, TH2 cells generatedfrom the same precursor did not flux calciumwhen stimulated with galectin-9. Thus, thecell death assays suggested that a portion ofthe galectin-9-mediated cell death in TH1 cellswas dependent on the Tim-3–galectin-9 inter-action. As galectin-9-mediated cell death ofTH1 cells was not completely abolished inTim-3-deficient cells, this raises the possibilitythat galectin-9 may use an additional receptorto induce cell death.
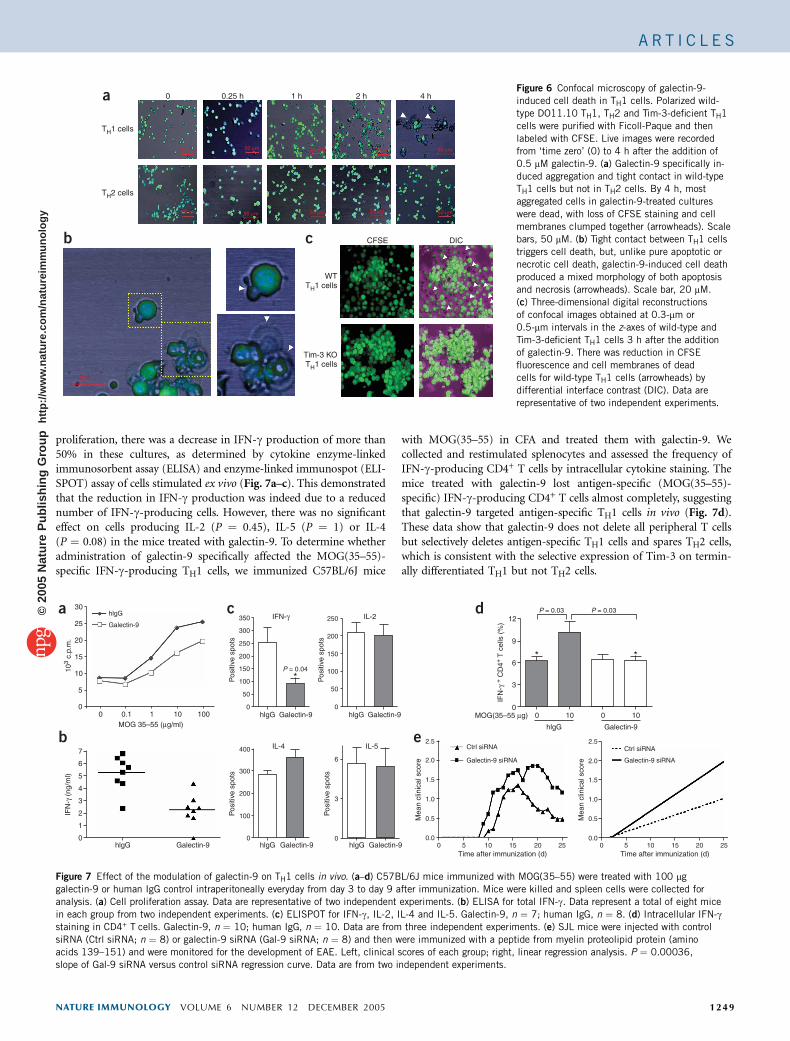
To determine the mechanism by whichTH1 cells undergo cell death, we obtainedgalectin-9-treated TH1 and TH2 cells fromDO11.10 TCR-transgenic mice and did live-imaging confocal microscopy of cells labeledwith carboxyfluoroscein succinimidyl ester(CFSE). Treatment with galectin-9 inducedDO11.10 TH1 cell aggregation beginning at
15 min after exposure and induced cell death 4 h thereafter. DO11.10TH2 cells did not demonstrate this galectin-9-induced aggregation andcell death (Fig. 6a,b). Cell death was preceded by and was associatedwith tight physical engagement between TH1 cells, leading to theformation of large clusters (Supplementary Videos 1 and 2 online). Inaddition, galectin-9-induced cell death in TH1 cells seemed to involveboth apoptotic and necrotic mechanisms, because typical apoptoticbodies as well as necrotic cells were present in the galectin-9-treatedcultures (Fig. 6b). Cell death was accompanied by a massive increasein cell size, rapid disruption of the cell membrane and loss ofcytoplasmic contents, as shown by the loss of CFSE-labeled proteins(Supplementary Video 3 online). Galectin-9 induced cell aggregationin both wild-type and Tim-3-deficient TH1 cells, but Tim-3-deficient-TH1 cells were less vulnerable to galectin-9-triggered cell death thanwild-type TH1 cells, as demonstrated by the reduction in the numberof CFSE+ T cells (Fig. 6c).
Galectin-9 eliminates IFN-c-producing TH1 cells
To determine the in vivo effects of galectin-9 on the development ofTH1 responses, we immunized C57BL/6J mice (a TH1-prone mousestrain) to induce EAE using a myelin oligodendrocyte glycoprotein(MOG) peptide of amino acids 35–55 (MOG(35–55)) in completeFreund’s adjuvant (CFA) and treated the mice intraperitoneally withrecombinant galectin-9. We then collected splenocytes and analyzedcell proliferation and cytokine production. Although galectin-9administration in vivo did not substantially affect overall T cell
10,000PBS
Galectin-3(0.75 µM)
Galectin-9(0.25 µM)
Galectin-9(0.5 µM)
1,000
100
9.92
3.37 3.45 2.57 2.9818.9 20.719.3 14.1
11.3 13.3 15.6 41.8
TH1
TH2
19.98.19.41
10
1
10,000
1,000
100
10
1086
6
4
2
0
20Flu
o 3–
AM
15
10
5
00 100 200 300
Time (s)
WT TH1 cells WT TH2 cellsTim-3 KO TH1 cells
400 0 100 200 300 400 0 100 200
Gal
-3 (
0.75
µM
)G
al-9
(0.
75 µ
M)
TG
(20
0 nM
)
300 400
420
11 100 10,000
Annexin V-FITC
Pl
1 100 10,000 1 100 10,000 1 100 10,000
67.2 13.5
12.3 70.9 45.5 44.311.6
70.8 9.78 33.9 12.6 30.133
33 3265
a
c
b
d
TH1 + galectin-9
A40
5A
405
TH2 + galectin-9
2.5
WT + PBSWT + galectin-3
Tim-3 KO + PBSTim-3 KO + galectin-3Tim-3 KO + galectin-9WT + galectin-9
2
1
0.5
02 4
Time after treatment (h)
8 12
1.5
0.8
0.6
0.4
0.2
02 4 8
Time after treatment (h)12
Figure 5 Galectin-9-induced cell death in activated mouse TH1 cells is mediated by interaction with
Tim-3. (a) Propidium iodide staining for cell viability. DO11.10 TH1 and TH2 cells polarized in vitro
were purified with Ficoll-Paque and then treated with PBS, galectin-3 or galectin-9. After 8 h, cells
were stained with propidium iodide (PI) and annexin V–fluorescein isothiocyanate (Annexin V–FITC).
Numbers in quadrants indicate percent cells in each. Propidium iodide–positive populations positive
or negative for annexin V are dead or late-stage apoptotic cells; propidium iodide–negative annexin
V–positive populations represent early-stage apoptotic cells; double-negative populations are live cells.
(b) Nucleosome enrichment assay of cell death of wild-type (WT) DO11.10 TH1 cells and TH2 cells
treated with 0.5 mM galectin-9. A405, absorbance at 405 nm. (c) Calcium flux in wild-type and Tim-3-
deficient (Tim-3 KO) DO11.10 TH1 and wild-type DO11.10 TH2 cells labeled with Fluo-3–AM andtreated with galectin-9, galectin-3 or thapsigargin (TG). (d) Nucleosome enrichment assay of cell death
of wild-type and Tim-3-deficient DO11.10 TH1 cells treated with 0.5 mM galectin-9, galectin-3 or PBS.
Data are representative of three independent experiments.
1248 VOLUME 6 NUMBER 12 DECEMBER 2005 NATURE IMMUNOLOGY
A R T I C L E S©
2005
Nat
ure
Pub
lishi
ng G
roup
ht
tp://
ww
w.n
atur
e.co
m/n
atur
eim
mun
olog
y
proliferation, there was a decrease in IFN-g production of more than50% in these cultures, as determined by cytokine enzyme-linkedimmunosorbent assay (ELISA) and enzyme-linked immunospot (ELI-SPOT) assay of cells stimulated ex vivo (Fig. 7a–c). This demonstratedthat the reduction in IFN-g production was indeed due to a reducednumber of IFN-g-producing cells. However, there was no significanteffect on cells producing IL-2 (P ¼ 0.45), IL-5 (P ¼ 1) or IL-4(P ¼ 0.08) in the mice treated with galectin-9. To determine whetheradministration of galectin-9 specifically affected the MOG(35–55)-specific IFN-g-producing TH1 cells, we immunized C57BL/6J mice
with MOG(35–55) in CFA and treated them with galectin-9. Wecollected and restimulated splenocytes and assessed the frequency ofIFN-g-producing CD4+ T cells by intracellular cytokine staining. Themice treated with galectin-9 lost antigen-specific (MOG(35–55)-specific) IFN-g-producing CD4+ T cells almost completely, suggestingthat galectin-9 targeted antigen-specific TH1 cells in vivo (Fig. 7d).These data show that galectin-9 does not delete all peripheral T cellsbut selectively deletes antigen-specific TH1 cells and spares TH2 cells,which is consistent with the selective expression of Tim-3 on termin-ally differentiated TH1 but not TH2 cells.
0 0.25 h
CFSE
WTTH1 cells
Tim-3 KOTH1 cells
DIC
TH1 cells
TH2 cells
1 h 2 h 4 ha
b c
50 µm 50 µm 50 µm 50 µm 50 µm
50 µm50 µm50 µm50 µm50 µm
20 µm
Figure 6 Confocal microscopy of galectin-9-
induced cell death in TH1 cells. Polarized wild-
type DO11.10 TH1, TH2 and Tim-3-deficient TH1
cells were purified with Ficoll-Paque and then
labeled with CFSE. Live images were recorded
from ‘time zero’ (0) to 4 h after the addition of
0.5 mM galectin-9. (a) Galectin-9 specifically in-
duced aggregation and tight contact in wild-typeTH1 cells but not in TH2 cells. By 4 h, most
aggregated cells in galectin-9-treated cultures
were dead, with loss of CFSE staining and cell
membranes clumped together (arrowheads). Scale
bars, 50 mM. (b) Tight contact between TH1 cells
triggers cell death, but, unlike pure apoptotic or
necrotic cell death, galectin-9-induced cell death
produced a mixed morphology of both apoptosis
and necrosis (arrowheads). Scale bar, 20 mM.
(c) Three-dimensional digital reconstructions
of confocal images obtained at 0.3-mm or
0.5-mm intervals in the z-axes of wild-type and
Tim-3-deficient TH1 cells 3 h after the addition
of galectin-9. There was reduction in CFSE
fluorescence and cell membranes of dead
cells for wild-type TH1 cells (arrowheads) by
differential interface contrast (DIC). Data are
representative of two independent experiments.
30
350
400
300
200
100
0
250
2.5Ctrl siRNA
Galectin-9 siRNA
Ctrl siRNA
Galectin-9 siRNA2.0
1.5
1.0
0.5
0.00 5 10 15 20 25
200
150
100
50
12
9
6
3
00 010 10
6
3
0
0
300
250
200
150 P = 0.04
P = 0.03 P = 0.03
100
50
0
*
* *
25
20
hlgG
Pos
itive
spo
tsP
ositi
ve s
pots
Pos
itive
spo
ts
Mea
n cl
inic
al s
core
2.5
2.0
1.5
1.0
0.5
0.0
Mea
n cl
inic
al s
core
Time after immunization (d)0 5 10 15 20 25
Time after immunization (d)
Pos
itive
spo
ts
Galectin-9
15
103
c.p.
m.
10
5
7
6
5
4
3
2
1
0
00 0.1
hlgG hlgG
hlgG
hlgGGalectin-9 Galectin-9
Galectin-9
Galectin-9
MOG(35–55 µg)hlgG Galectin-9 hlgG Galectin-9MOG 35–55 (µg/ml)
IFN
-γ (
ng/m
l)
IFN
-γ +
CD
4+ T
cel
ls (
%)
IFN-γ IL-2
IL-4 IL-5
10 1001
a c
eb
d
Figure 7 Effect of the modulation of galectin-9 on TH1 cells in vivo. (a–d) C57BL/6J mice immunized with MOG(35–55) were treated with 100 mg
galectin-9 or human IgG control intraperitoneally everyday from day 3 to day 9 after immunization. Mice were killed and spleen cells were collected for
analysis. (a) Cell proliferation assay. Data are representative of two independent experiments. (b) ELISA for total IFN-g. Data represent a total of eight mice
in each group from two independent experiments. (c) ELISPOT for IFN-g, IL-2, IL-4 and IL-5. Galectin-9, n ¼ 7; human IgG, n ¼ 8. (d) Intracellular IFN-gstaining in CD4+ T cells. Galectin-9, n ¼ 10; human IgG, n ¼ 10. Data are from three independent experiments. (e) SJL mice were injected with control
siRNA (Ctrl siRNA; n ¼ 8) or galectin-9 siRNA (Gal-9 siRNA; n ¼ 8) and then were immunized with a peptide from myelin proteolipid protein (amino
acids 139–151) and were monitored for the development of EAE. Left, clinical scores of each group; right, linear regression analysis. P ¼ 0.00036,
slope of Gal-9 siRNA versus control siRNA regression curve. Data are from two independent experiments.
NATURE IMMUNOLOGY VOLUME 6 NUMBER 12 DECEMBER 2005 1249
A R T I C L E S©
2005
Nat
ure
Pub
lishi
ng G
roup
ht
tp://
ww
w.n
atur
e.co
m/n
atur
eim
mun
olog
y
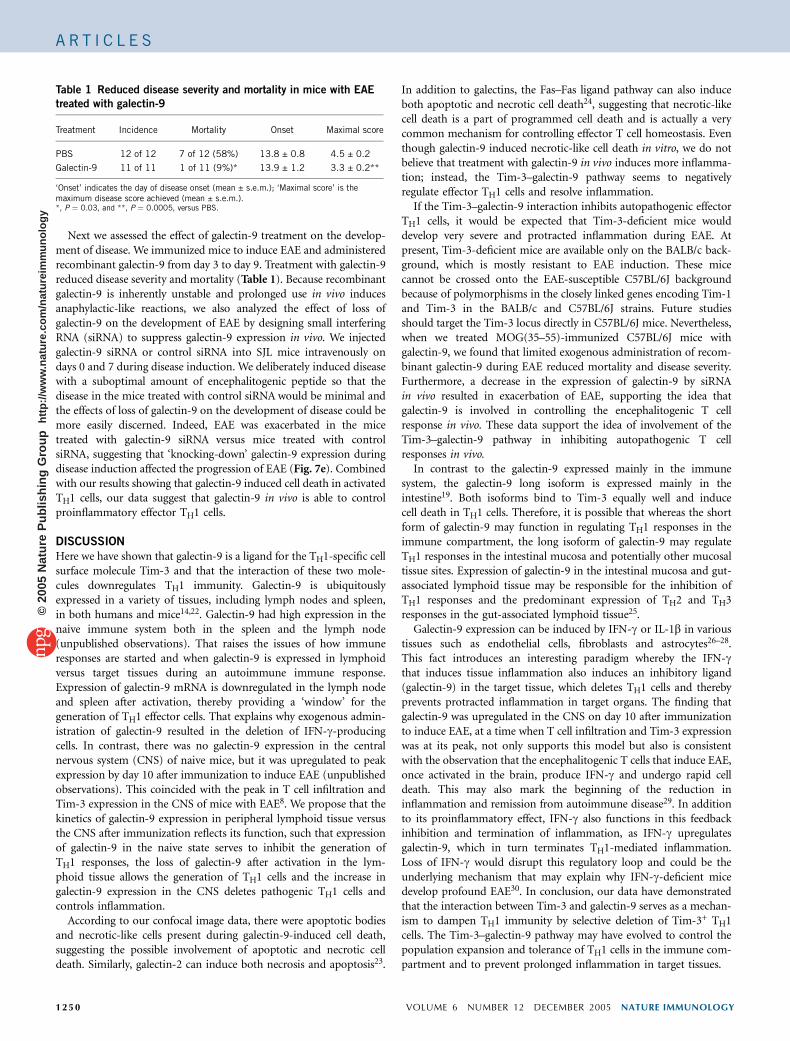
Next we assessed the effect of galectin-9 treatment on the develop-ment of disease. We immunized mice to induce EAE and administeredrecombinant galectin-9 from day 3 to day 9. Treatment with galectin-9reduced disease severity and mortality (Table 1). Because recombinantgalectin-9 is inherently unstable and prolonged use in vivo inducesanaphylactic-like reactions, we also analyzed the effect of loss ofgalectin-9 on the development of EAE by designing small interferingRNA (siRNA) to suppress galectin-9 expression in vivo. We injectedgalectin-9 siRNA or control siRNA into SJL mice intravenously ondays 0 and 7 during disease induction. We deliberately induced diseasewith a suboptimal amount of encephalitogenic peptide so that thedisease in the mice treated with control siRNA would be minimal andthe effects of loss of galectin-9 on the development of disease could bemore easily discerned. Indeed, EAE was exacerbated in the micetreated with galectin-9 siRNA versus mice treated with controlsiRNA, suggesting that ‘knocking-down’ galectin-9 expression duringdisease induction affected the progression of EAE (Fig. 7e). Combinedwith our results showing that galectin-9 induced cell death in activatedTH1 cells, our data suggest that galectin-9 in vivo is able to controlproinflammatory effector TH1 cells.
DISCUSSION
Here we have shown that galectin-9 is a ligand for the TH1-specific cellsurface molecule Tim-3 and that the interaction of these two mole-cules downregulates TH1 immunity. Galectin-9 is ubiquitouslyexpressed in a variety of tissues, including lymph nodes and spleen,in both humans and mice14,22. Galectin-9 had high expression in thenaive immune system both in the spleen and the lymph node(unpublished observations). That raises the issues of how immuneresponses are started and when galectin-9 is expressed in lymphoidversus target tissues during an autoimmune immune response.Expression of galectin-9 mRNA is downregulated in the lymph nodeand spleen after activation, thereby providing a ‘window’ for thegeneration of TH1 effector cells. That explains why exogenous admin-istration of galectin-9 resulted in the deletion of IFN-g-producingcells. In contrast, there was no galectin-9 expression in the centralnervous system (CNS) of naive mice, but it was upregulated to peakexpression by day 10 after immunization to induce EAE (unpublishedobservations). This coincided with the peak in T cell infiltration andTim-3 expression in the CNS of mice with EAE8. We propose that thekinetics of galectin-9 expression in peripheral lymphoid tissue versusthe CNS after immunization reflects its function, such that expressionof galectin-9 in the naive state serves to inhibit the generation ofTH1 responses, the loss of galectin-9 after activation in the lym-phoid tissue allows the generation of TH1 cells and the increase ingalectin-9 expression in the CNS deletes pathogenic TH1 cells andcontrols inflammation.
According to our confocal image data, there were apoptotic bodiesand necrotic-like cells present during galectin-9-induced cell death,suggesting the possible involvement of apoptotic and necrotic celldeath. Similarly, galectin-2 can induce both necrosis and apoptosis23.
In addition to galectins, the Fas–Fas ligand pathway can also induceboth apoptotic and necrotic cell death24, suggesting that necrotic-likecell death is a part of programmed cell death and is actually a verycommon mechanism for controlling effector T cell homeostasis. Eventhough galectin-9 induced necrotic-like cell death in vitro, we do notbelieve that treatment with galectin-9 in vivo induces more inflamma-tion; instead, the Tim-3–galectin-9 pathway seems to negativelyregulate effector TH1 cells and resolve inflammation.
If the Tim-3–galectin-9 interaction inhibits autopathogenic effectorTH1 cells, it would be expected that Tim-3-deficient mice woulddevelop very severe and protracted inflammation during EAE. Atpresent, Tim-3-deficient mice are available only on the BALB/c back-ground, which is mostly resistant to EAE induction. These micecannot be crossed onto the EAE-susceptible C57BL/6J backgroundbecause of polymorphisms in the closely linked genes encoding Tim-1and Tim-3 in the BALB/c and C57BL/6J strains. Future studiesshould target the Tim-3 locus directly in C57BL/6J mice. Nevertheless,when we treated MOG(35–55)-immunized C57BL/6J mice withgalectin-9, we found that limited exogenous administration of recom-binant galectin-9 during EAE reduced mortality and disease severity.Furthermore, a decrease in the expression of galectin-9 by siRNAin vivo resulted in exacerbation of EAE, supporting the idea thatgalectin-9 is involved in controlling the encephalitogenic T cellresponse in vivo. These data support the idea of involvement of theTim-3–galectin-9 pathway in inhibiting autopathogenic T cellresponses in vivo.
In contrast to the galectin-9 expressed mainly in the immunesystem, the galectin-9 long isoform is expressed mainly in theintestine19. Both isoforms bind to Tim-3 equally well and inducecell death in TH1 cells. Therefore, it is possible that whereas the shortform of galectin-9 may function in regulating TH1 responses in theimmune compartment, the long isoform of galectin-9 may regulateTH1 responses in the intestinal mucosa and potentially other mucosaltissue sites. Expression of galectin-9 in the intestinal mucosa and gut-associated lymphoid tissue may be responsible for the inhibition ofTH1 responses and the predominant expression of TH2 and TH3responses in the gut-associated lymphoid tissue25.
Galectin-9 expression can be induced by IFN-g or IL-1b in varioustissues such as endothelial cells, fibroblasts and astrocytes26–28.This fact introduces an interesting paradigm whereby the IFN-gthat induces tissue inflammation also induces an inhibitory ligand(galectin-9) in the target tissue, which deletes TH1 cells and therebyprevents protracted inflammation in target organs. The finding thatgalectin-9 was upregulated in the CNS on day 10 after immunizationto induce EAE, at a time when T cell infiltration and Tim-3 expressionwas at its peak, not only supports this model but also is consistentwith the observation that the encephalitogenic T cells that induce EAE,once activated in the brain, produce IFN-g and undergo rapid celldeath. This may also mark the beginning of the reduction ininflammation and remission from autoimmune disease29. In additionto its proinflammatory effect, IFN-g also functions in this feedbackinhibition and termination of inflammation, as IFN-g upregulatesgalectin-9, which in turn terminates TH1-mediated inflammation.Loss of IFN-g would disrupt this regulatory loop and could be theunderlying mechanism that may explain why IFN-g-deficient micedevelop profound EAE30. In conclusion, our data have demonstratedthat the interaction between Tim-3 and galectin-9 serves as a mechan-ism to dampen TH1 immunity by selective deletion of Tim-3+ TH1cells. The Tim-3–galectin-9 pathway may have evolved to control thepopulation expansion and tolerance of TH1 cells in the immune com-partment and to prevent prolonged inflammation in target tissues.
Table 1 Reduced disease severity and mortality in mice with EAE
treated with galectin-9
Treatment Incidence Mortality Onset Maximal score
PBS 12 of 12 7 of 12 (58%) 13.8 ± 0.8 4.5 ± 0.2
Galectin-9 11 of 11 1 of 11 (9%)* 13.9 ± 1.2 3.3 ± 0.2**
‘Onset’ indicates the day of disease onset (mean ± s.e.m.); ‘Maximal score’ is themaximum disease score achieved (mean ± s.e.m.).*, P ¼ 0.03, and **, P ¼ 0.0005, versus PBS.
1250 VOLUME 6 NUMBER 12 DECEMBER 2005 NATURE IMMUNOLOGY
A R T I C L E S©
2005
Nat
ure
Pub
lishi
ng G
roup
ht
tp://
ww
w.n
atur
e.co
m/n
atur
eim
mun
olog
y
METHODSPrecipitation assays and mass spectrometry analyses. Extracellular
membrane–associated proteins on live TK-1 cells were labeled with biotin
(EZ-Link Sulfo-NHS-LC-Biotin; Pierce). Whole-cell lysates were prepared and
were incubated at 4 1C with 5 mg human IgG, Tim-2–Ig, flTim-3–Ig or sTim-3–
Ig in the presence of protein G–agarose beads (Roche). Beads were washed and
boiled with 1� SDS-PAGE loading buffer. Supernatants were collected by
centrifugation, and half of each was digested with PNGase F (New England
Biolabs). Samples were separated by SDS-PAGE and the Tim-3–Ig fusion
protein–specific binding proteins were detected by immunoblot. For mass
spectrometry, TK-1 cells were subjected to precipitation assays with Tim-3–Ig
fusion proteins. Protein samples were separated by SDS-PAGE and were
detected by modified silver staining. The 35-kDa band was cut out for
matrix-assisted laser desorption–ionization technique-time of flight and tan-
dem mass spectrometry analyses.
Intracellular staining. Mouse cDNA encoding Gal-9 or Gal-9L from TK-1 cells
was subcloned into the bicistronic expression vector pIRES2-EGFP (Invitro-
gen). CHO cells were transfected and then were analyzed for galectin-9
expression by detection of the EGFP signal. For intracellular staining with
sTim-3–Ig, Tim-2–Ig, Tim-4-Ig and human IgG, transfected CHO cells were
fixed with 2% paraformaldehyde and then were made permeable with buffer
containing 0.1% saponin. Phycoerythrin-conjugated anti-human IgG was used
as the secondary detection reagent in flow cytometry.
TH1-TH2 polarization. CD4+CD62Lhi T cells from wild-type or Tim-3-
deficient DO11.10 TCR-transgenic mice were polarized into TH1 and TH2 cells
as described8. Cells were considered fully polarized into TH1 or TH2 popula-
tions after three rounds of polarization.
Purification of recombinant mouse galectin-9. Expression plasmids of Gal-9
were generated in vector pTrcHis2A (Invitrogen) and were transformed into
BL21 Escherichia coli (Invitrogen). Protein induction and purification were
done as described19 with some modifications. PBS containing 80 mM a-lactose
and 0.5 mM dithiothreitol was used as the elution buffer as well as the control
reagent for in vitro and in vivo analyses (referred to as ‘PBS’ here). Purified
galectin-9 was applied to Detoxi-Gel (Pierce) for removal of endotoxin
contamination. Typical protein yield was between 1 and 1.5 mg per liter
bacterial culture.
Cell death analyses. Tim-3-deficient DO11.10 TH1 cells and wild-type
DO11.10 TH1 and TH2 cells were stimulated with irradiated splenocytes from
BALB/c mice and 10 mg/ml of ovalbumin peptide (amino acids 323–339). After
60–72 h, cells were purified by Ficoll-Paque (Pharmacia) and were plated for 2,
4, 8 and 12 h at a density of 2 � 105 cells/well in the presence of recombinant
galectin-9 (0.25 mM, 0.5 mM or 0.75 mM), recombinant galectin-3 (0.75 mM) or
PBS. Cell death was analyzed by staining with annexin V–fluorescein isothio-
cyanate and propidium iodide (Annexin V-FITC Apoptosis Detection Kit I; BD
Biosciences) or by nucleosome enrichment assay (Cell Death Detection
ELISAPLUS kit; Roche).
Confocal microscopy and live imaging. Polarized wild-type TH1, TH2 and
Tim-3-deficient TH1 cells from DO11.10 TCR-transgenic mice were labeled
with 1 mM CFSE according to the protocol from the manufacturer (Molecular
Probes) and then cultured in MatTek culture dishes. Cells were placed in a Zeiss
Live Imaging Microincubator at 37 1C and 5% CO2 for monitoring of the
response of CFSE-labeled cells to 0.5 mM galectin-9. Data were recorded over
4 h with a Zeiss laser-scanning confocal microscope and results were analyzed
with LSM 510 software (Carl Zeiss). Sixty images at 20-second intervals were
recorded at each time point.
Calcium mobilization. Live cells were labeled with 10 mM Fluo-3–
acetoxymethylester (Fluo-3–AM; Molecular Probe) as described with some
modifications20. For determination of baseline, calcium signals were recorded
for 45 s by flow cytometry without any stimuli. After 45 s, stimuli were added
and calcium fluxes were measured for a total of 8 min. Calcium signals were
recorded on a FACSCalibur.
Proliferation assay, ELISA, ELISPOT assay and IFN-c intracellular staining.
C57BL/6J mice (Jackson Laboratory) were immunized with 100 mg MOG(35–
55) (MEVGWYRSPFSRVVHLYRNGK) in CFA (Difco). Mice were injected
intraperitoneally every day from day 3 to day 9 with 100 mg recombinant
galectin-9 or with human IgG as a control (Sigma Aldrich). Proliferation assays
were done as described12. Detection of IFN-g by ELISA and of IFN-g, IL-2, IL-4
and IL-5 by ELISPOT assay was done as described12,31.
For IFN-g intracellular staining, splenocytes were plated at a density of
5 � 105 cells/well in round-bottomed 96-well plates with or without 10 mg/ml
of MOG(35–55). On day 7, cells were stimulated for 4 h with 5 ng/ml of
phorbol 12-myristate 13-acetate and 500 ng/ml of ionomycin in the presence of
GolgiStop (BD Bioscience). Intracellular staining for IFN-g in CD4+ T cells was
assessed by flow cytometry. All animal experiments were in compliance with
the approval of the Harvard Medical Area Standing Committee on Animals
(protocol 696).
Induction of EAE. For treatment with recombinant galectin-9 in vivo, female
C57BL/6J (Jackson Laboratory) mice were immunized with 100 mg MOG(35–
55) in CFA supplemented with 400 mg Mycobacterium tuberculosis (Difco).
Mice received 100 ng pertussis toxin (List Biological Laboratories) intrave-
nously on days 0 and 2. Recombinant galectin-9 (100 mg) or PBS was injected
intraperitoneally every day from day 3 to day 9.
For Gal-9 siRNA knockdown, female SJL/J mice (Jackson Labora-
tories) were immunized with a suboptimal dose (60 mg) of a peptide consisting
of amino acids 139–151 of myelin proteolipid protein (HSLGKWLGHPDKF)
in CFA supplemented with 400 mg M. tuberculosis. Mice were injected intra-
venously with 100 ng pertussis toxin on day 0 and were injected intravenously
on days 0 and 7 with 50 mg control siRNA or Gal-9 siRNA (Dharmacon). The
sequence of each siRNA was 5¢-GGCCAGAGCUUCUCG GUGU-3¢ (mouse
Gal-9) and 5¢-UAGCGACUAAACACAUCAA-3¢ (control). Disease progression
was monitored and assigned scores as follows: limp tail, 1; uneven gait and
hindlimb weakness, 2; total hindlimb paralysis, 3; weak forelimb and hindlimb
paralysis; forelimb and hindlimb paralysis, 4; and moribund, 5.
Accession code. BIND (http://bind.ca): 335759.
Note: Supplementary information is available on the Nature Immunology website.
ACKNOWLEDGMENTSWe thank J. Meyers for reading the manuscript and B. Zhu for technicalassistance. Supported by the National Institutes Health, National MultipleSclerosis Society, Juvenile Diabetes Research Foundation, Forest Health andthe Javits Neuroscience Investigator Award from the National Institutes ofHealth (V.K.K.).
COMPETING INTERESTS STATEMENTThe authors declare competing financial interests (see the Nature Immunologywebsite for details).
Published online at http://www.nature.com/natureimmunology/
Reprints and permissions information is available online at http://npg.nature.com/
reprintsandpermissions/
1. Mosmann, T.R. & Coffman, R.L. TH1 and TH2 cells: different patterns of lymphokinesecretion lead to different functional properties. Annu. Rev. Immunol. 7, 145–173(1989).
2. Paul, W.E. & Seder, R.A. Lymphocyte responses and cytokines. Cell 76, 241–251(1994).
3. Street, N.E. & Mosmann, T.R. Functional diversity of T lymphocytes due to secretion ofdifferent cytokine patterns. FASEB J. 5, 171–177 (1991).
4. Romagnani, S. Lymphokine production by human T cells in disease states. Annu. Rev.Immunol. 12, 227–257 (1994).
5. Kamradt, T. & Mitchison, N.A. Tolerance and autoimmunity. N. Engl. J. Med. 344,655–664 (2001).
6. Abbas, A.K., Murphy, K.M. & Sher, A. Functional diversity of helper T lymphocytes.Nature 383, 787–793 (1996).
7. Sher, A. & Coffman, R.L. Regulation of immunity to parasites by T cells and T cell-derived cytokines. Annu. Rev. Immunol. 10, 385–409 (1992).
8. Monney, L. et al. Th1-specific cell surface protein Tim-3 regulates macrophageactivation and severity of an autoimmune disease. Nature 415, 536–541 (2002).
9. Khademi, M. et al. T cell Ig- and mucin-domain-containing molecule-3 (TIM-3) andTIM-1 molecules are differentially expressed on human TH1 and TH2 cells and in
NATURE IMMUNOLOGY VOLUME 6 NUMBER 12 DECEMBER 2005 1251
A R T I C L E S©
2005
Nat
ure
Pub
lishi
ng G
roup
ht
tp://
ww
w.n
atur
e.co
m/n
atur
eim
mun
olog
y
cerebrospinal fluid-derived mononuclear cells in multiple sclerosis. J. Immunol. 172,7169–7176 (2004).
10. McIntire, J.J. et al. Identification of Tapr (an airway hyperreactivity regulatory locus)and the linked Tim gene family. Nat. Immunol. 2, 1109–1116 (2001).
11. Chae, S.C., Park, Y.R., Shim, S.C., Yoon, K.S. & Chung, H.T. The polymorphisms of TH1cell surface gene Tim-3 are associated in a Korean population with rheumatoid arthritis.Immunol. Lett. 95, 91–95 (2004).
12. Sabatos, C.A. et al. Interaction of Tim-3 and Tim-3 ligand regulates T helper type 1responses and induction of peripheral tolerance. Nat. Immunol. 4, 1102–1110(2003).
13. Sanchez-Fueyo, A. et al. Tim-3 inhibits T helper type 1-mediated auto- and alloimmuneresponses and promotes immunological tolerance. Nat. Immunol. 4, 1093–1101(2003).
14. Wada, J. & Kanwar, Y.S. Identification and characterization of galectin-9, a novelb-galactoside-binding mammalian lectin. J. Biol. Chem. 272, 6078–6086 (1997).
15. Rabinovich, G.A. et al. Galectins and their ligands: amplifiers, silencers or tuners of theinflammatory response? Trends Immunol. 23, 313–320 (2002).
16. Oda, Y. et al. Soluble lactose-binding lectin from rat intestine with two differentcarbohydrate-binding domains in the same peptide chain. J. Biol. Chem. 268, 5929–5939 (1993).
17. Hernandez, J.D. & Baum, L.G. Ah, sweet mystery of death! Galectins and control of cellfate. Glycobiology 12, 127R–136R (2002).
18. Matsushita, N. et al. Requirement of divalent galactoside-binding activity of ecalectin/galectin-9 for eosinophil chemoattraction. J. Biol. Chem. 275, 8355–8360 (2000).
19. Wada, J., Ota, K., Kumar, A., Wallner, E.I. & Kanwar, Y.S. Developmental regulation,expression, and apoptotic potential of galectin-9, a b-galactoside binding lectin. J. Clin.Invest. 99, 2452–2461 (1997).
20. Kashio, Y. et al. Galectin-9 induces apoptosis through the calcium-calpain-caspase-1pathway. J. Immunol. 170, 3631–3636 (2003).
21. Lam, M. et al. Evidence that BCL-2 represses apoptosis by regulating endoplas-mic reticulum-associated Ca2+ fluxes. Proc. Natl. Acad. Sci. USA 91, 6569–6573(1994).
22. Matsumoto, R. et al. Human ecalectin, a variant of human galectin-9, is a noveleosinophil chemoattractant produced by T lymphocytes. J. Biol. Chem. 273, 16976–16984 (1998).
23. Sturm, A. et al. Human galectin-2: novel inducer of T cell apoptosis with distinct profileof caspase activation. J. Immunol. 173, 3825–3837 (2004).
24. Vercammen, D. et al. Dual signaling of the Fas receptor: initiation of both apoptotic andnecrotic cell death pathways. J. Exp. Med. 188, 919–930 (1998).
25. Weiner, H.L. Oral tolerance: immune mechanisms and the generation of TH3-type TGF-b-secreting regulatory cells. Microbes Infect. 3, 947–954 (2001).
26. Yoshida, H. et al. Interleukin-1b stimulates galectin-9 expression in human astrocytes.Neuroreport 12, 3755–3758 (2001).
27. Imaizumi, T. et al. Interferon-g stimulates the expression of galectin-9 in culturedhuman endothelial cells. J. Leukoc. Biol. 72, 486–491 (2002).
28. Asakura, H. et al. Selective eosinophil adhesion to fibroblast via IFN-g-inducedgalectin-9. J. Immunol. 169, 5912–5918 (2002).
29. Pender, M.P., McCombe, P.A., Yoong, G. & Nguyen, K.B. Apoptosis of ab T lymphocy-tes in the nervous system in experimental autoimmune encephalomyelitis:its possible implications for recovery and acquired tolerance. J. Autoimmun. 5,401–410 (1992).
30. Ferber, I.A. et al. Mice with a disrupted IFN-g gene are susceptible to the induction ofexperimental autoimmune encephalomyelitis (EAE). J. Immunol. 156, 5–7 (1996).
31. Salama, A.D. et al. Critical role of the programmed death-1 (PD-1) pathway inregulation of experimental autoimmune encephalomyelitis. J. Exp. Med. 198, 71–78(2003).
32. Rabinovich, G.A. et al. Recombinant galectin-1 and its genetic delivery suppresscollagen-induced arthritis via T cell apoptosis. J. Exp. Med. 190, 385–398 (1999).
1252 VOLUME 6 NUMBER 12 DECEMBER 2005 NATURE IMMUNOLOGY
A R T I C L E S©
2005
Nat
ure
Pub
lishi
ng G
roup
ht
tp://
ww
w.n
atur
e.co
m/n
atur
eim
mun
olog
y


![Potential Hepatoprotective Role of Galectin-3 during HCV ... · cule in cell biology [22, 23]. Galectin-3 is involved in several biological processes including cell proliferation,](https://img.dokumen.tips/doc/110x75/60e40d64a7cbb4423f4233bf/potential-hepatoprotective-role-of-galectin-3-during-hcv-cule-in-cell-biology.jpg)