Embed Size (px)
Citation preview

University of St. Thomas Law JournalVolume 15Issue 1 Campus Speech in Uncertain Times: Hopesand Challenges?
Article 5
2018
The Three-Fifths Rule and the PresidentialElections of 1800 and 1824Michael L. Rosin
This Article is brought to you for free and open access by UST Research Online and the University of St. Thomas Law Journal. For more information,please contact [email protected].
Bluebook CitationMichael L. Rosin, The Three-Fifths Rule and the Presidential Elections of 1800 and 1824, 15 U. St. Thomas L.J. 159 (2018).

\\jciprod01\productn\U\UST\15-1\UST105.txt unknown Seq: 1 4-JAN-19 11:35
ARTICLE
THE THREE-FIFTHS RULE AND THE
PRESIDENTIAL ELECTIONS
OF 1800 AND 1824
MICHAEL L. ROSIN*
I. Introduction . . . . . . . . . . . . . . . . . . . . . . . . . . . . . . . . . . . . . . . . . . . . . . 160 R
II. The Three-Fifths Rule and the Election of 1800 . . . . . . . . . . . 165 R
A. Setting the Ratio of Representation at the Convention . . 166 R
1. Sizing the Initial House with the Three-FifthsRule . . . . . . . . . . . . . . . . . . . . . . . . . . . . . . . . . . . . . . . . . . . . . 166 R
2. Sizing the Initial House with a No-FifthsRule . . . . . . . . . . . . . . . . . . . . . . . . . . . . . . . . . . . . . . . . . . . . . 172 R
B. The First Reapportionment of the House . . . . . . . . . . . . . . 174 R
1. The First Reapportionment with the Three-FifthsRule . . . . . . . . . . . . . . . . . . . . . . . . . . . . . . . . . . . . . . . . . . . . . 175 R
2. The First Reapportionment with a No-Fifths Rule . . 178 R
C. The 1800 Electoral Vote with a No-Fifths Rule . . . . . . . . 183 R
1. Freehling’s Analysis Corrected . . . . . . . . . . . . . . . . . . . . 183 R
2. Freehling’s Analysis Replaced . . . . . . . . . . . . . . . . . . . . 188 R
III. The Three-Fifths Rule and the Election of 1824 . . . . . . . . . . . 196 R
A. The Electoral Vote of 1824 . . . . . . . . . . . . . . . . . . . . . . . . . . . 197 R
1. Clay Finishes Dead Last . . . . . . . . . . . . . . . . . . . . . . . . . . 198 R
2. The 1824 Electoral Vote with a No-fifthsRule . . . . . . . . . . . . . . . . . . . . . . . . . . . . . . . . . . . . . . . . . . . . . 200 R
* Michael L. Rosin is an independent scholar. He received an A.B. from the University ofChicago, an M.Sc. from the London School of Economics, and an M.A. from the University ofPittsburgh. Please address all correspondence to [email protected]. While discussing analyses ofcontingent statutory factors affecting the outcome of presidential elections with Professor JohnDinan of Wake Forest University, Professor Dinan suggested factoring in the role of the three-fifths rule in Jefferson’s first election, something the author had already questioned. While analyz-ing the impact of the three-fifths rule on all other antebellum elections, the author nearly fell outof his chair when he saw the initial results for the election of 1824. The author would also like tothank Professor Michael Stokes Paulsen of the University of St. Thomas Law School for encour-aging him. Finally, the author would like to thank Andrew Gauld, a former colleague at AT&T,for developing the software so critical to the analysis of North Carolina’s electoral votes in theelection of 1800 in a no-fifths rule Union.
159

\\jciprod01\productn\U\UST\15-1\UST105.txt unknown Seq: 2 4-JAN-19 11:35
160 UNIVERSITY OF ST. THOMAS LAW JOURNAL [Vol. 15:1
B. The 1825 House Election . . . . . . . . . . . . . . . . . . . . . . . . . . . . . 217 R
1. The Actual House Election of 1825 . . . . . . . . . . . . . . . 217 R
2. The 1825 House Election with Clay Instead ofCrawford . . . . . . . . . . . . . . . . . . . . . . . . . . . . . . . . . . . . . . . . 220 R
IV. Conclusion . . . . . . . . . . . . . . . . . . . . . . . . . . . . . . . . . . . . . . . . . . . . . . . 223 R
I. INTRODUCTION
Which president owed his election to the three-fifths rule? Over thelast quarter-century, a distinguished array of scholars have claimed thatThomas Jefferson owed his first term in the Executive Mansion to the three-fifths rule.1 They may well be mistaken. A much better argument can bemade that John Quincy Adams was the president who owed his election tothe three-fifths rule.2
In a 2013 article in the Rutgers Law Journal, Paul Finkelman detailedthe proslavery nature of the original Constitution.3 After listing five consti-tutional clauses that directly sanctioned slavery,4 Finkelman noted that
the three-fifths clause also gave the South extra political mus-cle—in the House of Representatives and in the electoral col-
1. WILLIAM W. FREEHLING, THE ROAD TO DISUNION, VOLUME 1, SECESSIONISTS AT BAY,1776–1854, at 147, 559 (1990); JAMES ROGER SHARP, AMERICAN POLITICS IN THE EARLY REPUB-
LIC: THE NEW NATION IN CRISIS 247 (1993) [hereinafter SHARP, AMERICAN POLITICS] ; LEONARD
RICHARDS, THE SLAVE POWER 43 (2000); Brian D. Humes, Elaine K. Swift, Richard M. Valelly,Kenneth Finegold & Evelyn C. Fink, Representation of the Antebellum South in the House ofRepresentatives: Measuring the Impact of the Three-Fifths Clause, in PARTY, PROCESS, AND PO-
LITICAL CHANGE IN CONGRESS: NEW PERSPECTIVES ON THE HISTORY OF CONGRESS 452, 464(David. W. Brady & Mathew D. McCubbins eds., 2002); Jack N. Rakove, The Political Presi-dency: Discovery and Invention, in THE REVOLUTION OF 1800: DEMOCRACY, RACE, AND THE NEW
REPUBLIC 30, 31 (James Horn, Jan Ellen Lewis & Peter S. Onuf eds., 2002); GARRY WILLS,“NEGRO PRESIDENT”: JEFFERSON AND THE SLAVE POWER 2, 62, 234 n.2 (2003); SUSAN DUNN,JEFFERSON’S SECOND REVOLUTION: THE ELECTION CRISIS OF 1800 AND THE TRIUMPH OF REPUBLI-
CANISM 192 (2004); JOHN FERLING, ADAMS VS. JEFFERSON: THE TUMULTUOUS ELECTION OF 1800,at 168 (2004); BRUCE ACKERMAN, THE FAILURE OF THE FOUNDING FATHERS: JEFFERSON, MAR-
SHALL, AND THE RISE OF PRESIDENTIAL DEMOCRACY 34 (2005); AKHIL REED AMAR, AMERICA’S
CONSTITUTION: A BIOGRAPHY 345–46, 599 n.44 (Random House 2d ed. 2005); MARK A. GRABER,DRED SCOTT AND THE PROBLEM OF CONSTITUTIONAL EVIL 115 n.30 (2006); Robin L. Einhorn,Institutional Reality in the Age of Slavery: Taxation and Democracy in the States, 18(1) J. POL’Y
HIST. 21, 41 n.21 (2006); SANFORD LEVINSON, OUR UNDEMOCRATIC CONSTITUTION: WHERE THE
CONSTITUTION GOES WRONG (AND HOW WE THE PEOPLE CAN CORRECT IT) 90 (2006); EDWARD
J. LARSON, A MAGNIFICENT CATASTROPHE: THE TUMULTUOUS ELECTION OF 1800, AMERICA’S
FIRST PRESIDENTIAL CAMPAIGN 250 (2007); JAMES ROGER SHARP, THE DEADLOCKED ELECTION
OF 1800: JEFFERSON, BURR, AND THE UNION IN THE BALANCE 173 (2010) [hereinafter SHARP,DEADLOCKED ELECTION OF 1800]; Paul Finkelman, How the Proslavery Constitution Led to theCivil War, 43 RUTGERS L.J. 405 (2013). Wills, Sharp, Richards, Dunn, Ackerman, and Amar citecontemporary New England newspaper accounts of the election. Wills, Dunn, and Ferling citeFreehling.
2. Humes et al., supra note 1, at 464. R3. Finkelman, supra note 1, at 405. R4. The “three-fifths clause,” the “slave trade clause,” the “capitation tax clause,” the “fugi-
tive slave clause,” and the provision in Article V prohibiting any amendment to the slave importa-tion or capitation clauses prior to 1808. Id. at 418–19.

\\jciprod01\productn\U\UST\15-1\UST105.txt unknown Seq: 3 4-JAN-19 11:35
2018] THE THREE-FIFTHS RULE 161
lege—to support that claim. Indeed, the electoral collegeprovision might be seen as a sixth direct proslavery provision[.]5
He continued by asserting, “Thomas Jefferson’s victory in the electionof 1800 would be possible only because of the electoral votes the southernstates gained on account of their slaves.”6
In response, Earl Maltz disputed Finkelman’s claim “that the presiden-tial selection process could be described as proslavery in any meaningfulsense.”7 Maltz also disputed Finkelman’s claim concerning Jefferson’selection in 1800.8
Finkelman’s claim concerning the election of 1800 is not a new one.Over the last quarter-century, Finkelman and distinguished scholars such asWilliam Freehling, James Roger Sharp, Leonard Richards, Brian D. Humeset al., Jack Rakove, Garry Wills, Susan Dunn, John Ferling, Bruce Acker-man, Akhil Reed Amar, Mark Graber, Robin Einhorn, Sanford Levinson,and Edward J. Larson have each claimed that Thomas Jefferson owed hisfirst term in the Executive Mansion to the three-fifths rule.9 I do not denythat the three-fifths rule gave the South an advantage in the Electoral Col-lege (and the House of Representatives). It did. Instead, I deny that theadvantage was ever unquestionably decisive for the South in the ElectoralCollege.10 At best, the claim that Thomas Jefferson owed his first term tothe three-fifths rule is poorly argued. At worst, the claim is mistaken. In asignificant percentage of alternate, no-fifths rule Unions, Thomas Jeffersonwould have still won the electoral vote.11
John Quincy Adams might very well have agreed with Freehling et al.that Jefferson owed his first election to the three-fifths rule. Commenting
5. Id. at 419.
6. Id. at 420; see also id. at 427.
7. Earl M. Maltz, The Presidency, the Electoral College, and the Three-Fifths Clause, 43RUTGERS L.J. 439, 441 (2013).
8. Id. at 468–69.
9. Finkelman, supra note 1, at 412 n.38 (citing Paul Finkelman, The Proslavery Origins ofthe Electoral College, 23 CARDOZO L. REV. 1145, 1155 (2002)); FREEHLING, supra note 1, at 147, R559; SHARP, AMERICAN POLITICS, supra note 1, at 247; RICHARDS, supra note 1, at 43; Humes et Ral., supra note 1, at 464; Rakove, supra note 1, at 31; WILLS, supra note 1, at 2, 62, 234 n.2; RDUNN, supra note 1, at 192; FERLING, supra note 1, at 168; ACKERMAN, supra note 1, at 34; RAMAR, supra note 1, at 345–46, 599 n.44; GRABER, supra note 1, at 115 n.30; Einhorn, supra note R1, at 41 n.21; LEVINSON, supra note 1, at 90; LARSON, supra note 1, at 250; SHARP, DEADLOCKED RELECTION OF 1800, supra note 1, at 173. R
10. Elsewhere, I have argued that “while Southern states disenfranchised almost all theirblack citizens and many of their white citizens, the Electoral College provided a mechanism toprotect the states outside the South from the overwhelming influence the solid South would havehad if presidential elections had been conducted by a national popular vote.” Michael L. Rosin,The Five-Fifths Clause and the Unconstitutional Election of 1916, 46 HIST. METHODS 57, 57(2013).
11. More properly speaking, the Jefferson-Burr ticket would have edged out the Adams-Pinckney ticket by that vote. The present analysis ignores running mates Burr and Pinckney.

\\jciprod01\productn\U\UST\15-1\UST105.txt unknown Seq: 4 4-JAN-19 11:35
162 UNIVERSITY OF ST. THOMAS LAW JOURNAL [Vol. 15:1
on the impact of the three-fifths rule during the Missouri debates of 1820,Adams made the following entry in his diary:
The impression produced upon my mind by the progress of thisdiscussion is, that the bargain between freedom and slavery con-tained in the Constitution of the United States is morally and po-litically vicious, inconsistent with the principles upon which aloneour Revolution can be justified; cruel and oppressive, by rivetingthe chains of slavery, by pledging the faith of freedom to maintainand perpetuate the tyranny of the master; and grossly unequal andimpolitic, by admitting that slaves are at once enemies to be keptin subjection, property to be secured or restored to their owners,and persons not to be represented themselves, but for whom theirmasters are privileged with nearly a double share of representa-tion. The consequence has been that this slave representation hasgoverned the Union.12
In an ironic twist of fate, it is at least as plausible that the presidentwho owed his election to the three-fifths rule was the very same JohnQuincy Adams, the most ardent foe of slavery to occupy the ExecutiveMansion before Abraham Lincoln.13 Without the three-fifths rule it is verypossible that Henry Clay would have been chosen president in 1824–1825.Only one previous commentary appears to have suggested this.14
William Freehling, the earliest of these commentators on the electionof 1800, makes a very specific claim.
In an Electoral College where the three-fifths clause gaveSoutherners 14 extra electors, the Republicans’ Thomas Jeffersondefeated the Federalists’ John Adams, 73–65. . . . If no three-fifths clause had existed and House apportionment been based
12. 5 MEMOIRS OF JOHN QUINCY ADAMS, COMPRISING PORTIONS OF HIS DIARY FROM 1795 TO
1848, at 11 (Charles Francis Adams ed., New York, AMS Press 1970) (1874) [hereinafter ADAMS
MEMOIRS]. Adams was serving as Secretary of State in the Monroe administration when he madethis comment, which was undoubtedly about the balance of power in the House ofRepresentatives.
13. Adams made his views on slavery very clear in his diary entries made during the Mis-souri debates. “I take it for granted that the present question is a mere preamble—a title page to agreat tragic volume.” 4 id. at 502. “Slavery is the great and foul stain upon the North AmericanUnion, and it is a contemplation worthy of the most exalted soul whether its total abolition is or isnot practicable[.]” Id. at 531. “[A] law for perpetuating slavery in Missouri, and perhaps in NorthAmerica, has been smuggled through both Houses of Congress. . . . The fault is in the Constitu-tion of the United States, which has sanctioned a dishonorable compromise with slavery.” 5 id. at4. “If the Union must be dissolved, slavery is precisely the question upon which it ought to break.”Id. at 12. For an account of these diary entries, see WILLIAM LEE MILLER, ARGUING ABOUT SLAV-
ERY: THE GREAT BATTLE IN THE UNITED STATES CONGRESS 179–93 (1996).14. Humes et al. assert this claim but provide little supporting argument. See Humes et al.,
supra note 1, at 464. It is even more ironic that in 1804, while arguing for the replacement of the Rthree-fifths rule by a no-fifths rule, the younger Adams claimed that his father had lost the 1800election thanks to the three-fifths rule. Publius Valerius, Serious Reflections, Addressed to theCitizens of Massachusetts, THE REPERTORY, Nov. 6, 1804; 3 WRITINGS OF JOHN QUINCY ADAMS
71 (Worthington C. Ford, ed., Macmillan 1914).

\\jciprod01\productn\U\UST\15-1\UST105.txt unknown Seq: 5 4-JAN-19 11:35
2018] THE THREE-FIFTHS RULE 163
strictly on white numbers, Adams would have likely squeaked by,63–61.15
Of course, the three-fifths rule applied to the nation above the Mason-Dixon line as well as below it.16 Neither Freehling nor, presumably, thecontemporary New England newspaper writers noticed that, without its1790 slave population of 21,324, New York would not have been appor-tioned its tenth House seat.17 Without New York’s tenth and final Houseseat, Jefferson’s electoral vote total should be diminished by one to giveAdams an apparent 63–60 edge in the electoral vote.18
Or would it? Freehling et al. may declare unproblematically that in theactual election of 1800 Jefferson owed thirteen of his seventy-three electo-ral votes to the three-fifths rule, compared to only two for Adams. How-ever, it is quite another matter to assert that Jefferson owed his election tothe three-fifths rule.19 In the context of the events leading up to South Caro-lina’s secession from the Union, Freehling has written:
The point here—the caution that should always condition might-have-been history—is that to think that one contingency will nec-
15. FREEHLING, supra note 1, at 147 (emphasis added).16. Moreover, the three-fifths rule distinguished “free persons” from “all other persons,” not
“white persons” from “all other persons,” as Freehling’s text suggests. If the apportionment sup-posed by Freehling et al. had been in place, Pennsylvania and Rhode Island would have eachowed their last House seat to their non-white free population.
17. The 1790 census counted a total of 340,120 persons in New York; of these, 21,324 wereslaves. J. PHILLIPS, RETURN OF THE WHOLE NUMBER OF PERSONS WITHIN THE SEVERAL DISTRICTS
OF THE UNITED STATES ACCORDING TO “AN ACT PROVIDING FOR THE ENUMERATION OF THE IN-
HABITANTS OF THE UNITED STATES;” PASSED MARCH THE FIRST, ONE THOUSAND SEVEN HUNDRED
AND NINETY-ONE 3 (1793). All 1790 census data is taken from this source unless otherwise noted.Forty percent of the slave count is 8,529. This reduces New York’s total population from 340,120to a federal population with the three-fifths rule to 331,591, above the 330,000 needed for a tenthseat with 1:33,000 as the ratio of representation. With no slaves counted, New York’s no-fifthsrule population would be 318,796, below the 330,000 threshold needed for a tenth seat with thatratio.
18. In 1941, Albert F. Simpson cited contemporary sources that recognized that Jeffersonowed fifteen electoral votes to the three-fifths rule. Albert F. Simpson, The Political Significanceof Slave Representation, 1787–1821, 7(3) J. S. HIST. 315, 321–22 (1941). Freehling’s failure todeduct New York’s last electoral vote from Jefferson’s column is hard to fathom. Just before hisanalysis of the 1800 election, he reviewed the slave numbers in New York and the rest of theNorth during the first forty years of the republic. FREEHLING, supra note 1, at 131–34. At the Rbeginning of his analysis of that election, he asks: “But did the Virginia Dynasty, spawned by thethree-fifths clause, begin its reign democratically?” Id. at 147. He notes that “[t]hese questions aresuperbly explored in Arthur F. Simpson[‘s article].” Id. at 585 n.3.
19. As Maltz notes, two large-scale surveys of the early republic have concluded that, in allprobability, Jefferson would have won a direct popular election in 1800. Maltz, supra note 7, at R469 (citing STANLEY ELKINS & ERIC MCKITTRICK, THE AGE OF FEDERALISM: THE EARLY AMERI-
CAN REPUBLIC, 1788–1800, at 741 (1993) and SEAN WILENTZ, THE RISE OF AMERICAN DEMOC-
RACY: JEFFERSON TO LINCOLN 97–98 (2005)). I have no quarrel with this contention except to notethat I think it highly unlikely that a Convention unable to agree on common suffrage qualificationsfor electors of the House of Representatives would have agreed on common suffrage qualifica-tions much more relevant to a nationwide popular election of the president. In this article, I willtake on the analysis of the three-fifths rule in relative isolation on the assumption that it wasreplaced by a no-fifths rule starting with the Convention.

\\jciprod01\productn\U\UST\15-1\UST105.txt unknown Seq: 6 4-JAN-19 11:35
164 UNIVERSITY OF ST. THOMAS LAW JOURNAL [Vol. 15:1
essarily change all subsequent history, without other surprise oc-currences changing things again, is to deny the very nature ofcontingency.20
Certainly, the other side of that historiographical coin must not be to sup-pose that a contingency such as the adoption of the three-fifths rule happensat one point in history and then no subsequent history changes until just theright moment.
Had the Constitutional Convention adopted a no-fifths rule, that choicewould have undoubtedly had an impact on the choice of the ratio of repre-sentation for the House of Representatives, initially at the Convention andsubsequently when the Second Congress reapportioned the House in1791–1792.21
Part II of this article will scrutinize the steps that determined the sizeof the Electoral College in 1800. It will argue that a plausible case can bemade that in a significant percentage of cases, Jefferson would have wonthe electoral vote even if the Convention had adopted a no-fifths rule.22
On the final day of the Convention, Nathaniel Gorham proposed andGeorge Washington seconded changing the ratio of representation from nomore than 1:40,000 to no more than 1:30,000 as a means to increase repre-sentation in the future.23 Part II.A will argue that this change in the ratio ofrepresentation is the key unknown at the Convention for understanding theresult of the 1800 election in a no-fifths rule Union.
Part II.B will argue that if the Constitution had included a no-fifthsrule then the ratio of representation used in the first reapportionment of theHouse certainly would not have been 1:33,000, as implicitly supposed byFreehling et al. but a ratio between 1:25,000, and 1:30,000.
20. WILLIAM W. FREEHLING, THE ROAD TO DISUNION, VOLUME II, SECESSIONISTS TRIUM-
PHANT, 1854–1861, at 574 n.66 (2007). Finkelman notes that “[c]ounterfactuals are of courseimpossible to prove, but possible and plausible scenarios help clarify these issues.” Finkelman,supra note 1, at 424. R
21. No one has published a history of how the Convention arrived at the initial size of theHouse of Representatives. The most recent history of the first apportionment is more than a cen-tury old! Edmund J. James, The First Apportionment of Federal Representatives in the UnitedStates, 9 ANNALS OF THE AMERICAN ACAD. OF POL. & SOC. SCI. 1 (1897). The author has been atwork on a large-scale analysis of the history of House apportionment among the states and howthat has affected the outcome of presidential elections.
22. Several commentators have noted that in several of the states the dominant party changedthe state’s method of choosing its presidential electors just prior to the 1800 election, hoping to tipthe balance in their candidates’ favor. The overall outcome of these changes was that Jefferson’selectoral vote margin was smaller than the cumulative popular vote margin that the JeffersonianRepublicans achieved over the Adams Federalists. See, e.g., FERLING, supra note 1, at 156–58; RDUNN, supra note 1, at 175–87; SHARP, DEADLOCKED ELECTION OF 1800, supra note 1, at 116–25. RThere is no obvious reason to suppose that any of these state level machinations would have beenany different had the federal constitution embodied a no-fifths rule rather than a three-fifths rule.Moreover, since the overall impact of these machinations favored Adams rather than Jefferson, thepresent analysis will leave them all in place.
23. 2 THE RECORDS OF THE FEDERAL CONVENTION OF 1787, at 643–44 (Max Farrand, ed.,Yale rev. ed. 1937).

\\jciprod01\productn\U\UST\15-1\UST105.txt unknown Seq: 7 4-JAN-19 11:35
2018] THE THREE-FIFTHS RULE 165
Part II.C will argue that for ratios of 1:25,000, 1:26,000, and 1:30,000,the way in which the North Carolina legislature would have drawn a mapfor thirteen or eleven presidential elector districts is the key unknown forprojecting the outcome of the 1800 election in a no-fifths rule Union. Jeffer-son’s chances for a victory or even a tie are extremely slight for ratios of1:25,000 and 1:26,000. At 1:27,000, this article projects Adams as a certainwinner. For ratios of 1:28,000 and 1:29,000, North Carolina would havehad twelve presidential electors in a no-fifths rule Union, just as it did in theactual three-fifths rule Union. This article projects that in the case of1:28,000, Jefferson would have edged out Adams in the electoral vote by acount of 71–70 and that the two candidates would have tied for the case of1:29,000. Finally, for a ratio of 1:30,000, this article projects Jefferson tohave just under a twenty-five percent chance to win the electoral vote.24
Part III will argue that a plausible case can be made that the presidentwho owed his election to the three-fifths rule was John Quincy Adams,25
the most ardent foe of slavery to occupy the Executive Mansion prior toAbraham Lincoln. With a no-fifths rule in place, Speaker of the HouseHenry Clay rather than William Crawford would have finished behind An-drew Jackson and John Quincy Adams in third place in the 1824 electoralvote. As Robert V. Remini, a leading historian of that era, has written, “Inthat case [Clay] would have been elected President—unquestionably.”26
Part IV concludes the article by reviewing the analyses in Part II andPart III as essays in both actual history and virtual history.
II. THE THREE-FIFTHS RULE AND THE ELECTION OF 1800
The standard interpretation that Jefferson owed his first term to thethree-fifths rule unproblematically supposes that in a no-fifths rule Union,the Electoral College of 1800 would have been based on a House of Repre-sentatives apportioned with 1:33,000 as the ratio of representation, as it wasin the actual, three-fifths rule Union. In order to project the outcome of theelection of 1800 with a no-fifths rule, the present analysis must first explainthe history leading to 1:33,000 as the ratio of representation with the three-
24. In the analysis presented here, none of Jefferson’s winning scenarios require eliminatingthe senatorial, two-vote bonus, as suggested by Joyce Appleby and Lance Banning. Joyce Ap-pleby, Having It All, WASHINGTON POST (Nov. 16, 2003), https://www.washingtonpost.com/archive/entertainment/books/2003/11/16/having-it-all/99abb9f6-2737-4390-a857-ce20eb09e360/?noredirect=on&utm_term=.56664f1070c4 (reviewing WILLS, supra note 1); Lance Banning,Three-Fifths Historian, 4 CLAREMONT REV. BOOKS 54, 55 (2004) (reviewing WILLS, supra note1).
25. Humes et al., supra note 1, at 464. R26. ROBERT V. REMINI, HENRY CLAY: STATESMAN FOR THE UNION 250 (1991) [hereinafter
REMINI, CLAY]. Nearly a century earlier, John W. Burgess came to the same conclusion. JOHN
WILLIAM BURGESS, THE MIDDLE PERIOD, 1817–1858, at 140 (1901). Remini’s claim is based onthe supposition that Clay would have received expected electoral votes in New York.

\\jciprod01\productn\U\UST\15-1\UST105.txt unknown Seq: 8 4-JAN-19 11:35
166 UNIVERSITY OF ST. THOMAS LAW JOURNAL [Vol. 15:1
fifths rule and then rerun that history supposing a no-fifths rule. Not surpris-ingly, the present analysis begins with the Constitutional Convention.
A. Setting the Ratio of Representation at the Convention
On the last day of the Convention, George Washington rose from thechair to make his only speech of the Convention in support of NathanielGorham’s proposal that “the number of Representatives shall not exceedone for every forty thousand” be changed to one for every thirty thousand.There could be no opposition to Washington. The Convention unanimouslyapproved Gorham’s proposal. Forty thousand was erased in the parchmentand replaced by thirty thousand.27 This was the final step in the process thatset the ratio of representation at no more than 1:30,000 in the Representa-tion Clause.
1. Sizing the Initial House with the Three-Fifths Rule
The three-fifths rule first appeared in April 1783 when the ContinentalCongress passed a proposal with the following population-based tax appor-tionment scheme:
[A]ll charges of war and all other expences that have been or shallbe incurred for the common defence or general welfare, and al-lowed by the United States in Congress assembled, except so faras shall be otherwise provided for, shall be defrayed out of a com-mon treasury, which shall be supplied by the several states in pro-portion to the whole number of white and other free citizens andinhabitants, of every age, sex and condition, including thosebound to servitude for a term of years, and three-fifths of all otherpersons not comprehended in the foregoing description, exceptIndians, not paying taxes, in each State; which number shall betriennially taken and transmitted to the United States in Congressassembled, in such mode as they shall direct and appoint.28
On April 18, 1783, the Continental Congress applied the new tax ap-portionment scheme to a requisition to raise 1,500,000 dollars from thestates based on population estimates recorded on April 7. Two years later,the Continental Congress twice apportioned three million dollar requisitions
27. THE RECORDS OF THE FEDERAL CONVENTION OF 1787, supra note 23, at 643–44. R28. 24 JOURNALS OF THE CONTINENTAL CONGRESS, 1774–1789, at 260 (Worthington C. Ford
ed., 1905) (emphasis added). The Articles of Confederation required any amendment to receivethe unanimous approval of all thirteen states. This proposal never received the approval of allthirteen states. AMAR, supra note 1, at 95. At the Pennsylvania Ratifying Convention, James RWilson remarked that the proposal had been approved by eleven states. 2 THE DEBATES IN THE
SEVERAL STATE CONVENTIONS ON THE ADOPTION OF THE FEDERAL CONSTITUTION 452 (JonathanElliot, ed., 2d 1836) [hereinafter ELLIOT’S DEBATES]. At the North Carolina ratifying convention,William Davie stated that it had been approved by twelve of the states. 4 id. at 31.

\\jciprod01\productn\U\UST\15-1\UST105.txt unknown Seq: 9 4-JAN-19 11:35
2018] THE THREE-FIFTHS RULE 167
to the states in double the amounts.29 Table 1 presents these populationestimates and tax apportionments.
TABLE 1 ESTIMATED POPULATION AND TAX ALLOCATIONS
State Estimated Population
$1.5M Tax Allocation
$3.0M Tax Allocations
New Hampshire 82,200 $52,708 $105,416Massachusetts 350,000 $224,426 $448,854Rhode Island 50,400 $32,317 $64,636
Connecticut 206,000 $132,091 $264,182New York 200,000 $128,243 $256,486
New Jersey 130,000 $83,358 $166,716 Pennsylvania 320,000 $205,190 $410,378Delaware 35,000 $22,443 $44,886
Maryland 220,700 $141,517 $283,034Virginia 400,000 $256,487 $512,974North Carolina 170,000 $109,007 $218,012South Carolina 150,000 $96,183 $192,366Georgia 25,000 $16,030 $32,060Total 2,339,300 $1,500,000 $3,000,000
Edmund Randolph’s Virginia plan had specified neither the number ofrepresentatives per state nor a total number.30 However, the Conventionquickly assumed that such a lower house would have about ninety mem-bers. On June 8, during a discussion of the national legislature’s proposedpower to nullify state legislation, Gunning Bedford complained that hissmall state of Delaware “would have about 1/90 [for its] share in the Gen-eral Councils, whilst Pa. & Va. would possess 1/3 of the whole.”31 The nextday, the debate turned its focus to the nature of representation in the legisla-ture with the small states complaining that they would be overrun by thelarge states. David Brearley observed that “by the quota of Congs. Virga.would have 16 votes, and Georgia but one.”32
29. For the population estimates, see 24 JOURNALS OF THE CONTINENTAL CONGRESS, supranote 28, at 231. For the $1.5M requisition, see id. at 259. For the $3M requisitions, see 28 id. at217, and 29 id. at 745.
30. The text of the Virginia plan contains a blank space where a total number would appear.It contains a list of state names in the margin. 3 THE RECORDS OF THE FEDERAL CONVENTION OF
1787, supra note 23, at 596.
31. 1 id. at 167.
32. Id. at 176–77.
\\jciprod01\productn\U\UST\15-1\UST105.txt unknown Seq: 10 4-JAN-19 11:35
168 UNIVERSITY OF ST. THOMAS LAW JOURNAL [Vol. 15:1
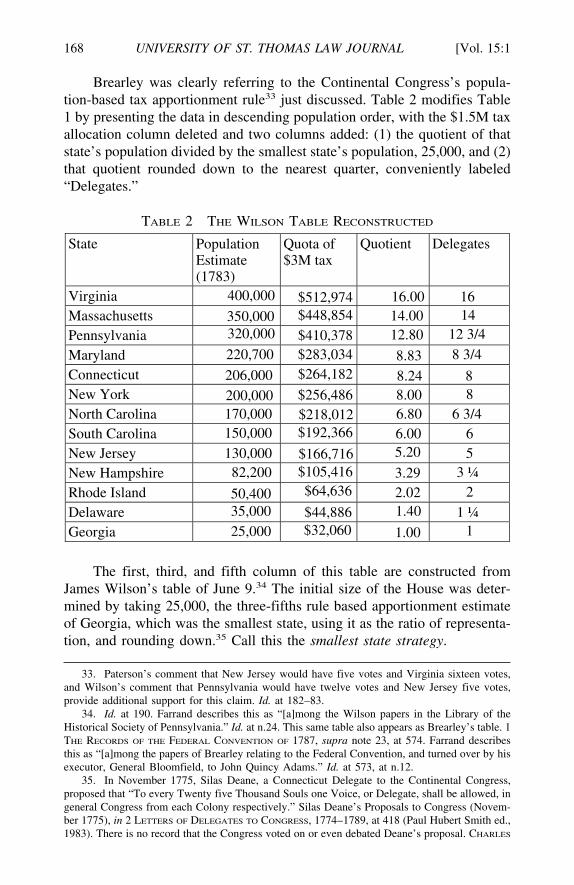
Brearley was clearly referring to the Continental Congress’s popula-tion-based tax apportionment rule33 just discussed. Table 2 modifies Table1 by presenting the data in descending population order, with the $1.5M taxallocation column deleted and two columns added: (1) the quotient of thatstate’s population divided by the smallest state’s population, 25,000, and (2)that quotient rounded down to the nearest quarter, conveniently labeled“Delegates.”
TABLE 2 THE WILSON TABLE RECONSTRUCTED
State Population Estimate (1783)
Quota of $3M tax
Quotient Delegates
Virginia 400,000 $512,974 16.00 16 Massachusetts 350,000 $448,854 14.00 14 Pennsylvania 320,000 $410,378 12.80 12 3/4
Maryland 220,700 $283,034 8.83 8 3/4Connecticut 206,000 $264,182 8.24 8New York 200,000 $256,486 8.00 8North Carolina 170,000 $218,012 6.80 6 3/4South Carolina 150,000 $192,366 6.00 6New Jersey 130,000 $166,716 5.20 5New Hampshire 82,200 $105,416 3.29 3 ¼Rhode Island 50,400 $64,636 2.02 2Delaware 35,000 $44,886 1.40 1 ¼Georgia 25,000 $32,060 1.00 1
The first, third, and fifth column of this table are constructed fromJames Wilson’s table of June 9.34 The initial size of the House was deter-mined by taking 25,000, the three-fifths rule based apportionment estimateof Georgia, which was the smallest state, using it as the ratio of representa-tion, and rounding down.35 Call this the smallest state strategy.
33. Paterson’s comment that New Jersey would have five votes and Virginia sixteen votes,and Wilson’s comment that Pennsylvania would have twelve votes and New Jersey five votes,provide additional support for this claim. Id. at 182–83.
34. Id. at 190. Farrand describes this as “[a]mong the Wilson papers in the Library of theHistorical Society of Pennsylvania.” Id. at n.24. This same table also appears as Brearley’s table. 1THE RECORDS OF THE FEDERAL CONVENTION OF 1787, supra note 23, at 574. Farrand describesthis as “[a]mong the papers of Brearley relating to the Federal Convention, and turned over by hisexecutor, General Bloomfield, to John Quincy Adams.” Id. at 573, at n.12.
35. In November 1775, Silas Deane, a Connecticut Delegate to the Continental Congress,proposed that “To every Twenty five Thousand Souls one Voice, or Delegate, shall be allowed, ingeneral Congress from each Colony respectively.” Silas Deane’s Proposals to Congress (Novem-ber 1775), in 2 LETTERS OF DELEGATES TO CONGRESS, 1774–1789, at 418 (Paul Hubert Smith ed.,1983). There is no record that the Congress voted on or even debated Deane’s proposal. CHARLES

\\jciprod01\productn\U\UST\15-1\UST105.txt unknown Seq: 11 4-JAN-19 11:35
2018] THE THREE-FIFTHS RULE 169
Luther Martin from midsize Maryland offered a different objec-tion than Bedford. Unequal confederacies can never produce goodeffects. Apply this to the Virginia plan. Out of the number 90,Virginia has 16 votes, Massachusetts 14, Pennsylvania 12—in all42. Add to this a state having four votes, and it gives a majority inthe general legislature. Consequently, a combination of thesestates will govern the remaining nine or ten states. Where is thesafety and independency of those states?36
He measured the top-heaviness of the Virginia plan by computing theease with which the largest states would be able to join together to imposetheir will on the other states.
As June wore on, Madison wrote in his notes:
The great difficulty lies in the affair of Representation; and if thiscould be adjusted, all others would be surmountable. It was ad-mitted by both the gentlemen from N. Jersey, (Mr. Brearly andMr. Patterson) that it would not be just to allow Virga. which was16 times as large as Delaware an equal vote only. Their languagewas that it would not be safe for Delaware to allow Virga. 16times as many votes.37
Another plan was needed; one that dampened the advantages of thelarge states and was palatable to both large and small states in what Hamil-ton termed “the contest for power.”38
The Convention appointed a committee chaired by Elbridge Gerry ofMassachusetts with one member per state, including Franklin rather thanWilson from Pennsylvania, and Mason rather than Madison from Vir-ginia.39 The fact that the Committee worked on July 3 and 4 while theConvention adjourned to celebrate the nation’s independence attests to theimportance of its task. On July 5, the committee reported its proposal backto the whole Convention.
I. that in the 1st. branch of the Legislature each of the States nowin the Union shall be allowed 1 member for every 40,000 inhabi-tants of the description reported in the 7th Resolution of theCome. of the whole House [the three-fifths rule]: that each Statenot containing that number shall be allowed 1 member: . . . II. thatin the 2d branch each State shall have an equal vote.40
A. KROMKOWSKI, RECREATING THE AMERICAN REPUBLIC 163 (2002). Two years later, the Conti-nental Congress considered and voted down proposals that each state have one delegate for every50,000 and then 30,000. 9 JOURNALS OF THE CONTINENTAL CONGRESS, supra note 28, at 779–80.
36. 1 THE RECORDS OF THE FEDERAL CONVENTION OF 1787, supra note 23, at 440. R37. Id. at 321 (emphasis added to first sentence).38. Id. at 466.39. Id. at 516.40. Id. at 526 (emphasis added). For the reference to the three-fifths rule, see id. at 444.

\\jciprod01\productn\U\UST\15-1\UST105.txt unknown Seq: 12 4-JAN-19 11:35
170 UNIVERSITY OF ST. THOMAS LAW JOURNAL [Vol. 15:1
Yates’ notes record that Franklin initiated the Committee’s ultimateproposal.41 In spite of his age, Franklin was undoubtedly still the mostmathematically gifted member of the committee.42 He may have noticedthat increasing the divisor from 25,000, the size of the smallest state’s pop-ulation, to a larger number such as 40,000, one-tenth the size of the largeststate, while also guaranteeing each state at least one vote, would dampenthe larger states’ dominance in a population-proportioned House. Such achange would curry favor with the small states. Call this the 10:1 strategyto recognize the fact that 40,000 was exactly one-tenth of the apportionmentbasis of the largest state.
Interestingly, the Committee’s July 5 proposal did not suggest what thestate-by-state representation would be. It did not even propose what thetotal number would be. The committee may have lacked a population esti-mate that separately counted slaves. The 1783 population estimates notedby Wilson and Brearley43 did not count slaves separately. However, if any-one had employed these population estimates,44 they would have ended upwith a fifty-six-member House. Table 3 presents the results of employingthe 1783 population estimates with a divisor of 40,000, rounding down, anda minimum of one.
41. 1 THE RECORDS OF THE FEDERAL CONVENTION OF 1787, supra note 23, at 523.42. For an analysis of Franklin’s mathematical prowess, see Paul C. Pasles, The Lost Squares
of Dr. Franklin, 108 AM. MATHEMATICAL MONTHLY 489 (2001), or more generally, PAUL C.PASLES, BENJAMIN FRANKLIN’S NUMBERS: AN UNSUNG MATHEMATICAL ODYSSEY (2007).
43. See supra Table 2.44. On July 6, 1787, Rufus King commented: “Delaware does not contain it is computed
more than 35,000 souls.” 1 THE RECORDS OF THE FEDERAL CONVENTION OF 1787, supra note 23, Rat 541. It is likely that he did have the 1783 population estimates in mind.

\\jciprod01\productn\U\UST\15-1\UST105.txt unknown Seq: 13 4-JAN-19 11:35
2018] THE THREE-FIFTHS RULE 171
TABLE 3 REPRESENTATION ACCORDING TO THE 1783 POPULATION
ESTIMATE WITH A 40,000 DIVISOR
State Population Estimate (1783)
Quotient (dividing by 40,000)
Delegates
Virginia 400,000 10.00 10Massachusetts 350,000 8.75 8Pennsylvania 320,000 8.00 8Maryland 220,700 5.52 5Connecticut 206,000 5.15 5New York 200,000 5.00 5
North Carolina 170,000 4.25 4South Carolina 150,000 3.75 3
New Jersey 130,000 3.25 3New Hampshire 82,200 2.06 2Rhode Island 50,400 1.26 1Delaware 35,000 0.88 1Georgia 25,000 0.63 1Total 2,339,300 56
On initially hearing the committee’s report, Gouverneur Morris ob-jected. He expressed concern that many delegates were there only “to truckand bargain for their particular States”45 rather than argue from first princi-ples. A day later, the Convention responded by naming Morris chairman ofa new committee charged with proposing a first enumeration.46 On July 9,this committee reported a proposal with a slightly different fifty-six mem-ber House that shifted representation somewhat southward.47 Not contentwith this proposal, which suggested that future apportionments be based onstate wealth as well as population, the Convention appointed yet anothercommittee, chaired by Rufus King, to resolve the enumeration and to dealwith the rules for future apportionments.48 King’s committee proposed asixty-five seat House, the proposal enshrined in Article I, Section 2.49 Table4 compares the King committee’s sixty-five seat apportionment with thefifty-six seat apportionment that Gerry’s committee had proposed.50
45. Id. at 529.
46. Id. at 540–41.
47. Id. at 559.
48. Id. at 557–62.
49. Id. at 568.
50. See supra Table 3.

\\jciprod01\productn\U\UST\15-1\UST105.txt unknown Seq: 14 4-JAN-19 11:35
172 UNIVERSITY OF ST. THOMAS LAW JOURNAL [Vol. 15:1
TABLE 4 FIFTY-SIX AND SIXTY-FIVE MEMBER APPORTIONMENTS
State Delegates Computed on 1783 Estimates
Gerry Committee 56 Member Proposal
King Committee 65 Member Proposal
New Hampshire 2 2 3 Massachusetts 8 7 8Rhode Island 1 1 1
Connecticut 5 4 5New York 5 5 6 New Jersey 3 3 4 Pennsylvania 8 8 8Delaware 1 1 1
Maryland 5 4 6Virginia 10 9 10North Carolina 4 5 5South Carolina 3 5 5Georgia 1 2 3Total 56 56 65
Following a brief attempt by Madison to double each state’s represen-tation,51 the ratio of representation remained at 40,000 until the Conven-tion’s final days when Hugh Williamson proposed to “make an addition ofone half generally to the number allotted to the respective States; and toallow two to the smallest States.”52 Only Washington’s support couldchange the ratio of representation to 1:30,000 on the Convention’s finalday.53
2. Sizing the Initial House with a No-Fifths Rule
How would the history of the initial setting of ratio of representationhave unfolded with a no-fifths rule instead of a three-fifths rule?
Table 5 presents Greene and Harrington’s estimates for the white andslave populations of the five southernmost states,54 extended to compute the
51. 1 THE RECORDS OF THE FEDERAL CONVENTION OF 1787, supra note 23, at 569–70. Theproposal was defeated by a vote of 2–9. Id. at 570.
52. 2 id. at 612. Williamson’s proposal was defeated by a vote of 5–6. Id. For explicit state-ments of 40,000 by the Committee of Detail and the Committee of Style, see id. at 178, 566, and591 respectively.
53. See supra text accompanying note 27. R54. For the estimates in the order presented, see EVARTS B. GREENE & VIRGINIA D. HAR-
RINGTON, AMERICAN POPULATION BEFORE THE FEDERAL CENSUS OF 1790, at 127, 142, 160, 176,182 (1932). They give no white/slave estimate for Delaware.

\\jciprod01\productn\U\UST\15-1\UST105.txt unknown Seq: 15 4-JAN-19 11:35
2018] THE THREE-FIFTHS RULE 173
white population as a percentage of the “federal” population computed witha three-fifths rule.
TABLE 5 WHITE/SLAVE POPULATION ESTIMATES
State Year Whites Slaves 3/5 Slave Population
Federal Population
Whites: Federal
Maryland 1782 170,688 83,362 50,017 220,705 77.34% Virginia 1782 296,852 270,762 162,457 459,309 64.63% North Carolina 1786 164,000 60,000 36,000 200,000 82.00% South Carolina 1785 108,000 80,000 48,000 156,000 69.23% Georgia 1773 18,000 15,000 9,000 27,000 66.67%
Using the white-to-federal percentages in the rightmost column of Ta-ble 5, Table 6 estimates the census data the Convention would have used ifit had adopted a no-fifths rule.
TABLE 6 NO-FIFTHS RULE APPORTIONMENTS
State 1783 est.(3/5 Rule)
Whites: Federal Pct
No-Fifths Rule est.
Delegates, Smallest State Strategy
Delegates, 10:1 Strategy
New Hampshire 82,200 100.00% 82,200 4 2 Massachusetts 350,000 100.00% 350,000 21 10 Rhode Island 50,400 100.00% 50,400 3 1 Connecticut 206,000 100.00% 206,000 12 5 New York 200,000 100.00% 200,000 12 5 New Jersey 130,000 100.00% 130,000 7 3 Pennsylvania 320,000 100.00% 320,000 19 9 Delaware 35,000 100.00% 35,000 2 1 Maryland 220,700 77.34% 170,684 10 4 Virginia 400,000 64.63% 258,520 15 7 North Carolina 170,000 82.00% 139,400 8 3 South Carolina 150,000 69.23% 103,846 6 2 Georgia 25,000 66.67% 16,667 1 1 Total 120 53
An initial application of a smallest state strategy would have used16,667 as the ratio of representation, thereby giving Massachusetts, the statewith the largest apportionment basis, twenty-one delegates to Georgia’sone. In contrast, with the three-fifths rule in place, the actual Convention’sapplication of the smallest state strategy yielded a less extreme ratio of only

\\jciprod01\productn\U\UST\15-1\UST105.txt unknown Seq: 16 4-JAN-19 11:35
174 UNIVERSITY OF ST. THOMAS LAW JOURNAL [Vol. 15:1
16:1.55 With this 21:1 ratio even more extreme than the 16:1 ratio, it islikely that the Convention would have adopted something like the 10:1strategy. Dividing Massachusetts’ free population of 350,000 by ten wouldhave yielded 35,000 as the ratio of representation. That ratio would havereduced the size of the House from 120 to 53, just three shy of the totalgenerated by the actual 10:1 strategy with the three-fifths rule.56
An upward adjustment of the total by nine or so seats most likelywould have followed just as the King committee raised the actual total bynine seats. However, there is no reason to believe that the ratio of represen-tation would have been altered in this alternate history until the Conven-tion’s final day when Washington supported Gorham’s proposal to changethe ratio as a means of increasing future representation.
Unfortunately, it may not be possible to know what ratio Gorhamwould have proposed if the Convention had entered its final day with a no-fifths rule apportionment of the House and a ratio of representation of1:35,000 in Article I. He left no record of why he proposed 1:30,000.57 Washe proposing a reduction of 10,000, a reduction of 25 percent, or did heconsider 30,000 to be a magic number?58 Perhaps all that can be said withrelative certainty is that it would have been one of 1:25,000, 1:26,000,1:27,000, 1:28,000, 1:29,000, or 1:30,000.59
B. The First Reapportionment of the House
The first reapportionment of the House was in many respects the mostimportant reapportionment. Congress recognized that reapportionment ofthe House needed to be enacted by legislation presented to the President.Reapportionment was a matter of paramount constitutional importance and
55. See supra text accompanying note 35. R
56. Reducing the size of the House by more than half would have assuaged the oft-statedconcerns about the expense of the national legislature. For examples of these concerns, see thecomments of William Paterson, Oliver Ellsworth, and John Rutledge. 1 THE RECORDS OF THE
FEDERAL CONVENTION OF 1787, supra note 23, at 251–52, 569–70. R
57. As a delegate to the Continental Congress, Gorham often complained about the absenceof state delegations. “[T]he principle of the confederat[ion] as it respects representation & themode of voting is calculated to encourage delinquency. . . if the representation had been appor-tioned according to numbers or property—and a suitable quorum established & the major vote todetermine questions—this inattention would not exist.” Letter from Nathaniel Gorham to JamesWarren (March 6, 1786), in 23 LETTERS OF DELEGATES TO CONGRESS, supra note 35, at 180.
58. Note that 30,000 like 40,000 is a multiple of 5,000, as were each of the apportionmentproposals made in the Continental Congress. See supra note 35. R
59. The ratios 1:25,000 and 1:26,000 result in the same electoral vote margins and specifi-cally in the same number of electors apportioned to North Carolina and Maryland, the two keystates in the present analysis. See infra Tables 21 and 23. See infra text accompanying Tables 11and 12, which will demonstrate that the Second Congress would have certainly replaced the ratio1:27,000 with 1:28,000 since the former left significantly larger remainders than the latter.

\\jciprod01\productn\U\UST\15-1\UST105.txt unknown Seq: 17 4-JAN-19 11:35
2018] THE THREE-FIFTHS RULE 175
not simply a matter of housekeeping that could be handled by Houseresolution.60
1. The First Reapportionment with the Three-Fifths Rule
When the Second House began its work to reapportion the House, itread the constitutional text simply, divided each state’s apportionment pop-ulation by 30,000, and rounded down61—an apportionment method that hassubsequently been named after Thomas Jefferson.62 This resulted in the112-seat apportionment shown in Table 7.63
TABLE 7 ACTUAL THREE-FIFTHS RULE HOUSE REAPPORTIONMENT OF
1791: RATIO OF 1:30,000
State Basis Population
Seats Remainder
New Jersey 179,570 5 29,570 Connecticut 236,841 7 26,841Delaware 55,540 1 25,540Vermont 85,533 2 25,533Massachusetts 475,327 15 25,327North Carolina 353,523 11 23,523New Hampshire 141,822 4 21,822Pennsylvania 432,879 14 12,879Georgia 70,835 2 10,835
Kentucky64 68,705 2 8,705
Maryland 278,514 9 8,514Rhode Island 68,446 2 8,446 New York 331,591 11 1,591
Virginia 630,560 21 560
South Carolina 206,236 6 26,236 Total (wo/SC) 229,686
60. DAVID P. CURRIE, THE CONSTITUTION IN CONGRESS: THE FEDERALIST PERIOD 130(1997).
61. Proposed by John Laurance of New York on Oct. 31, 1791. 3 ANNALS OF CONG. 148(1791).
62. For a description of Jefferson’s method, see MICHAEL L. BALINSKI & H. PEYTON YOUNG,FAIR REPRESENTATION: MEETING THE IDEAL OF ONE MAN, ONE VOTE 10–15 (Brookings 2d ed.2001).
63. For the 1790 census data, see 1790 CENSUS, supra note 17, at 3. South Carolina’s final Rcensus data was not received until March 5, 1792. 3 ANNALS OF CONG. 100 (1792). I have interpo-lated South Carolina’s final apportionment population. Prior to that date, most proposed billsomitted precise representation numbers for South Carolina.
64. The Kentucky Statehood Act became law on February 4, 1791, making provision forKentucky to be admitted to the Union on June 1, 1792. Kentucky Statehood Act, 1 Stat. 189. A

\\jciprod01\productn\U\UST\15-1\UST105.txt unknown Seq: 18 4-JAN-19 11:35
176 UNIVERSITY OF ST. THOMAS LAW JOURNAL [Vol. 15:1
The House quickly realized it would have to come to grips with theproblem of rounding and the remainders it left.65 Seeing that the ratio of1:30,000 left the small states with large remainders, Hugh Williamson “ob-served that such a ratio should be adopted as would leave the fewest frac-tions, and at the same time do as much justice as possible to those States.”66
During the course of its debate, the House heard proposals for ratios of1:33,000, 1:34,000, 1:35,000, and 1:40,00067 as it grappled with the prob-lem of rounding. Table 8 presents remainders for all ratios from 1:30,000 to1:40,000 (in increments of 1:1,000). None of the apportionments generatedby any of these ratios satisfied everyone.
TABLE 8—RATIOS OF REPRESENTATION AND THEIR REMAINDERS, FIRST
APPORTIONMENT WITH THREE-FIFTHS RULE68
Ratio of Representation
Remainder(wo/SC)
1:30,000 229,686 1:31,000 247,686 1:32,000 209,686
1:33,000 142,686 1:34,000 213,686 1:35,000 224,686 1:36,000 313,686 1:37,000 338,686 1:38,000 293,686 1:39,000 211,686
1:40,000 369,686
After some debate, the House approved the choice of 1:30,000 as theratio of representation, first by a vote of 35–23,69 then by a vote of 43–12.70
On December 7, the Senate voted in favor of the House bill by a mar-gin of 13–11 and sent it on to a third reading the next day.71 With passageby both chambers almost in sight as the bill went to its third reading a day
subsequent act of February 25, 1791 provided Kentucky and Vermont each two seats in the Houseuntil reapportionment. Act of Feb. 25, 1791, ch.IX, 1 Stat. 191. Vermont became a state on March4, 1791. Vermont Statehood Act, ch. VII, 1 Stat. 191. Hence, Vermont and Kentucky were alwaysincluded in apportionment proposals even before admitted to statehood.
65. See generally CURRIE, supra note 60, at 128–35 and James, supra note 21. R66. 3 ANNALS OF CONG. 154 (1791).67. Id. at 149, 154, 169, 188.68. The total remainders have been computed using South Carolina’s final census tally,
which was not received until March 5, 1792. Id. at 100.69. Id. at 191.70. Id. at 210.71. Id. at 43–44.

\\jciprod01\productn\U\UST\15-1\UST105.txt unknown Seq: 19 4-JAN-19 11:35
2018] THE THREE-FIFTHS RULE 177
later, the Senate “expunged” the first section of the House version (contain-ing 1:30,000 as the ratio of representation) and considered an amended ver-sion based on 1:33,000 as the ratio of representation.72 Vice President JohnAdams broke the tie in favor of the 1:33,000 ratio when Stephen Bradley ofVermont, who had voted for the ratio of 1:30,000 the day before, cast thekey vote in favor of the 1:33,000 ratio, leaving the Senate evenly divided12–12.73 Bradley must have switched his vote when he realized that a ratioof 1:33,000 produced a smaller, 105 member House in which his state hadgreater power than in a 112 member House.
The House and Senate remained at loggerheads over the ratio of repre-sentation for nearly three months as the Senate’s change in the ratio wasseen as having “diminish[ed] the fractions to the Eastward, and increase[d]those to the Southward,” in the words of North Carolina’s Hugh William-son.74 With the two chambers unable to agree on a ratio of representationfor Jefferson’s method, the Senate resuscitated a proposal:
Made by dividing the whole aggregate numbers of the people ofthe United States by thirty thousand, and apportioning themamong the several States by that ratio, until they shall respectivelyhave the number to which it will entitle them, and the residue ofsaid members among those States having the highest fractions.75
This proposal, using a method since dubbed the Hamilton method ofapportionment,76 resulted in a 120-seat House, with the eight extra seatsawarded to New Hampshire, Vermont, Massachusetts, Connecticut, NewJersey, Delaware, North Carolina, and South Carolina. It barely passed theSenate by a 14–13 vote.77
At first, the House rejected the Senate’s new apportionment by a voteof 30–31.78 After the Senate voted to insist on its amendment by the same14–13 vote,79 the House finally capitulated by the narrow margin of31–29.80
The Senate’s insistence on its amendment would soon prove to havebeen in vain. Concerned “that the vote for and against the bill was perfectlygeographical, a northern against a southern vote, and he feared he should be
72. 3 ANNALS OF CONG. 46–47 (1791).73. Id. at 47.74. Id. at 244. Strictly speaking, Williamson erred when he said that the southern fractions
had increased. Not counting South Carolina, they had been reduced slightly from 77,677 to71,677. But the impact on the northern states was much more dramatic, with a reduction from152,009 to 71,009.
75. Id. at 105–06. March 12, 1792. The Senate voted down a motion to include this explana-tory text by a vote of 7–20. Id. at 106.
76. For a description of the Hamilton method, see BALINSKI & YOUNG, supra note 62, at R16–23.
77. 3 ANNALS OF CONG. 105 (1792).78. Id. at 473.79. Id. at 111.80. Id. at 482.

\\jciprod01\productn\U\UST\15-1\UST105.txt unknown Seq: 20 4-JAN-19 11:35
178 UNIVERSITY OF ST. THOMAS LAW JOURNAL [Vol. 15:1
thought to be taking side with a southern party. . .”81 President Washingtonfound constitutional grounds to issue his first veto.82 Following the adviceof Secretary of State Thomas Jefferson, Washington made the followingobjections in his veto message to Congress:
First. The Constitution has prescribed that Representativesshall be apportioned among the several states according to theirrespective numbers; and there is no one proportion or divisorwhich applied to the respective numbers of the States, will yieldthe number and allotment of Representatives proposed by the bill.
Second. The Constitution has also provided that the numberof Representatives shall not exceed one for every thirty thousand;which restriction is, by the context, and by fair and obvious con-struction, to be applied to the separate and respective numbers ofthe States; and the bill has allotted to eight of the States more thanone for every thirty thousand.83
Unable to override the first presidential veto,84 the House narrowlyvoted for the Senate’s preferred ratio of representation, 1:33,000.85 OnApril 10, the bill breezed through three readings in the Senate, which thenpassed the bill without recording the vote.86 On April 14, President Wash-ington signed the bill into law.87
2. The First Reapportionment with a No-Fifths Rule
Had the Convention enshrined a no-fifths rule in the Constitution, theSecond Congress would not have chosen 1:33,000 as the ratio of represen-tation for the new apportionment starting with the third House in 1793. Forthe sake of clarity, the present analysis is temporarily separated into two
81. Memorandum from Thomas Jefferson (mistakenly dated as Apr. 6, 1792, most likelyApr. 4, 1792), in 4 MEMOIR, CORRESPONDENCE, AND MISCELLANIES, FROM THE PAPERS OF
THOMAS JEFFERSON 466–67 (Thomas Jefferson Randolph ed., 1829). 3 THE RECORDS OF THE
FEDERAL CONVENTION OF 1787, supra note 23, at 366.82. In addition, by April 3, word got to Washington that Supreme Court Justice James Wil-
son also had grave concerns about the constitutionality of the bill. 23 THE PAPERS OF THOMAS
JEFFERSON 377 editor’s note (Charles T. Cullen et. al. eds., 1950) [hereinafter JEFFERSON PAPERS].One set of Washington’s editors reports that “GW apparently had earlier requested [Attorney-General Edmund] Randolph to consult with U.S. Supreme Court justices James Wilson and JohnBlair about the constitutionality of the Apportionment Bill.” 10 THE PAPERS OF GEORGE WASH-
INGTON: PRESIDENTIAL SERIES 222 n.1 (Robert F. Haggard & Mark A. Mastromarino eds., 2002).83. 3 ANNALS OF CONG. 539 (1792). For Jefferson’s memorandum, see 23 JEFFERSON PA-
PERS, supra note 82, at 370–76. For Alexander Hamilton’s ineffectual memorandum in support ofthe bill, see 11 THE PAPERS OF ALEXANDER HAMILTON 228–30 (Harold C. Syrett & Jacob E.Cooke eds., 1961–87). Jefferson’s vigorous analysis is riddled with errors, many of which wereonly addressed forty years later by Daniel Webster during the apportionment debate following the1830 census. See 8 REG. DEB. 94 app. (1832).
84. 3 ANNALS OF CONG. 539 (1792). The vote was 28–33.85. Id. at 548–49. The vote was 34–30.86. Id. at 120.87. See Act of Apr. 14, 1792, ch. XXIII, 1 Stat. 253 (apportioning Representatives among the
several states).

\\jciprod01\productn\U\UST\15-1\UST105.txt unknown Seq: 21 4-JAN-19 11:35
2018] THE THREE-FIFTHS RULE 179
parts. The first assumes that the maximal ratio of representation in the no-fifths rule Union was 1:30,000. The second supposes it was a value between1:25,000 and 1:29,000.
If the Convention had retained the requirement that “the number ofRepresentatives shall not exceed one for every thirty thousand,” the SecondCongress would have chosen 1:30,000 as the ratio of representation for thenew apportionment.
The Second House’s first gambit was to read the constitutional text aswritten and try out 1:30,000 as the ratio of representation.88 In the hypothet-ical no-fifths rule Union, this results in the following apportionment ofninety-eight House seats shown in Table 9.
TABLE 9 NO-FIFTHS RULE HOUSE REAPPORTIONMENT OF 1791: 1:30,000AS THE RATIO OF REPRESENTATION
State Free Population
Seats Remainder
Vermont 85,523 2 25,523Massachusetts 475,327 15 25,327 Connecticut 235,182 7 25,182Georgia 53,284 1 23,284North Carolina 293,179 9 23,179 New Jersey 172,716 5 22,716 New Hampshire 141,727 4 21,727 Delaware 50,207 1 20,207New York 318,796 10 18,796 Pennsylvania 430,636 14 10,636 Rhode Island 67,877 2 7,877 Maryland 216,692 7 6,692Virginia 454,983 15 4,983Kentucky 61,247 2 1,247South Carolina 141,979 4 21,979
Total (wo/SC) 237,376
On seeing this large remainder, the House in the hypothetical no-fifthsrule Union would have no doubt looked for a better ratio, as the House inthe actual, three-fifths rule Union did.89 Looking at the remainderspresented in Table 10, the hypothetical House would not have found a ratiobetter than 1:30,000.
88. See supra Part II.A.1.89. See supra text accompanying notes 61–66. R

\\jciprod01\productn\U\UST\15-1\UST105.txt unknown Seq: 22 4-JAN-19 11:35
180 UNIVERSITY OF ST. THOMAS LAW JOURNAL [Vol. 15:1
TABLE 10 NO-FIFTHS RULE HOUSE REAPPORTIONMENT OF 1791:ALTERNATE RATIOS OF REPRESENTATION AND THEIR
REMAINDERS—1:30,000 TO 1:35,000
State Free Population
Ratio of Representation 30,000 31,000 32,000 33,000 34,000 35,000
Delaware 50,207 20,207 19,207 18,207 17,207 16,207 15,207
Georgia 53,284 23,284 22,284 21,284 20,284 19,284 18,284
Kentucky 61,247 1,247 30,247 29,247 28,247 27,247 26,247
Rhode Island 67,877 7,877 5,877 3,877 1,877 33,877 32,877 Vermont 85,523 25,523 23,523 21,523 19,523 17,523 15,523
Small States Subtotal 78,138 101,138 94,138 87,138 114,138 108,138 New Hampshire 141,727 21,727 17,727 13,727 9,727 5,727 1,727 New Jersey 172,716 22,716 17,716 12,716 7,716 2,716 32,716 Maryland 216,692 6,692 30,692 24,692 18,692 12,692 6,692 Connecticut 235,182 25,182 18,182 11,182 4,182 31,182 25,182 Medium States Subtotal 76,317 84,317 62,317 40,317 52,317 66,317 North Carolina 293,179 23,179 14,179 5,179 29,179 21,179 13,179
New York 318,796 18,796 8,796 30,796 21,796 12,796 3,796 Pennsylvania 430,636 10,636 27,636 14,636 1,636 22,636 10,636 Virginia 454,983 4,983 20,983 6,983 25,983 12,983 34,983 Massachusetts 475,327 25,327 10,327 27,327 13,327 33,327 20,327
Large States Subtotal 82,921 81,921 84,921 91,921 102,921 82,921 Total (wo/SC) 237,376 267,376 241,376 219,376 269,376 257,376 Free States 157,784 129,784 135,784 79,784 159,784 142,784 Slave States (wo/SC) 79,592 137,592 105,592 139,592 109,592 114,592
Of the alternate ratios within hailing distance of 1:30,000, only1:33,000 offered any relief for the remainders. That relief was modest atbest and came at the expense of the smallest states and the slave states whencompared to the ratio specified in the constitutional text.90
Table 11 and Table 12 show the apportionment results that the SecondCongress would have faced if the Convention had chosen a more capaciousmaximal ratio of representation than 1:30,000.
90. The ratio of 1:39,000 offered a remainder of 210,376 (excluding South Carolina). How-ever, the smallest states and the slave states would have carried greater remainders in that seventy-seven-seat House than in the ninety-eight-seat House resulting from a ratio of 1:30,000.

\\jciprod01\productn\U\UST\15-1\UST105.txt unknown Seq: 23 4-JAN-19 11:35
2018] THE THREE-FIFTHS RULE 181
TABLE 11 NO-FIFTHS RULE HOUSE REAPPORTIONMENT OF 1791:ALTERNATE RATIOS OF REPRESENTATION AND THEIR JEFFERSON
APPORTIONMENT REMAINDERS—1:25,000 TO 1:30,000State Free
PopulationRatio of Representation
25,000 26,000 27,000 28,000 29,000 30,000 Delaware 50,207 207 24,207 23,207 22,207 21,207 20,207 Georgia 53,284 3,284 1,284 26,284 25,284 24,284 23,284
Kentucky 61,247 11,247 9,247 7,247 5,247 3,247 1,247
Rhode Island 67,877 17,877 15,877 13,877 11,877 9,877 7,877 Vermont 85,523 10,523 7,523 4,523 1,523 27,523 25,523 Small States Subtotal 43,138 58,138 75,138 66,138 86,138 78,138 New Hampshire 141,727 16,727 11,727 6,727 1,727 25,727 21,727
New Jersey 172,716 22,716 16,716 10,716 4,716 27,716 22,716
Maryland 216,692 16,692 8,692 692 20,692 13,692 6,692 Connecticut 235,182 10,182 1,182 19,182 11,182 3,182 25,182
Medium States Subtotal 66,317 38,317 37,317 38,317 70,317 76,317
North Carolina 293,179 18,179 7,179 23,179 13,179 3,179 23,179 New York 318,796 18,796 6,796 21,796 10,796 28,796 18,796 Pennsylvania 430,636 5,636 14,636 25,636 10,636 24,636 10,636
Virginia 454,983 4,983 12,983 22,983 6,983 19,983 4,983 Massachusetts 475,327 327 7,327 16,327 27,327 11,327 25,327 Large States Subtotal 47,921 48,921 109,921 68,921 87,921 82,921
Total (wo/SC) 157,376 145,376 222,376 173,376 244,376 237,376 Free States 102,784 81,784 118,784 79,784 158,784 157,784 Slave States (wo/SC) 54,592 63,592 103,592 93,592 85,592 79,592

\\jciprod01\productn\U\UST\15-1\UST105.txt unknown Seq: 24 4-JAN-19 11:35
182 UNIVERSITY OF ST. THOMAS LAW JOURNAL [Vol. 15:1
TABLE 12 NO-FIFTHS RULE HOUSE REAPPORTIONMENT OF 1791:ALTERNATE RATIOS OF REPRESENTATION AND THEIR STATE-BY-STATE
JEFFERSON APPORTIONMENTS—1:25,000 TO 1:30,000
State Free Population
Ratio of Representation
25,000 26,000 27,000 28,000 29,000 30,000 Delaware 50,207 2 1 1 1 1 1Georgia 53,284 2 2 1 1 1 1Kentucky 61,247 2 2 2 2 2 2Rhode Island 67,877 2 2 2 2 2 2Vermont 85,523 3 3 3 3 2 2
Small States Total 11 10 9 9 8 8 New Hampshire 141,727 5 5 5 5 4 4New Jersey 172,716 6 6 6 6 5 5
Maryland 216,692 8 8 8 7 7 7Connecticut 235,182 9 9 8 8 8 7
Medium States Total 28 28 27 26 24 23 North Carolina 293,179 11 11 10 10 10 9 New York 318,796 12 12 11 11 10 10 Pennsylvania 430,636 17 16 15 15 14 14
Virginia 454,983 18 17 16 16 15 15 Massachusetts 475,327 19 18 17 16 16 15 Large States Total 77 74 69 68 65 63
Total (wo/SC) 116 112 105 103 97 94 South Carolina 141,979 5 5 5 5 4 4 Free 73 71 67 66 61 59 Slave 43 41 38 37 36 35
If the Convention had chosen 1:25,000 as the maximal ratio of repre-sentation, the Second Congress might have considered changing the ratio to1:26,000, which gave a slightly smaller total remainder. However, thisslight improvement would have cost Delaware a second seat.
If 1:26,000 had been the maximal ratio of representation written intothe Constitution, the Second Congress would have certainly employed thatratio when it reapportioned the House. It yielded the smallest overall re-mainder and any change from this maximal ratio would deny Georgia itssecond seat.
With 1:28,000 leaving a significantly smaller remainder of 173,376benefitting the small states and especially the large states, the Second Con-gress would have been much more inclined to reject 1:27,000 in favor1:28,000 as the ratio of representation when it resized the House. The ratioof 1:28,000 achieved its advantages by benefiting the free states much morethan the slave states. This might have generated resistance to making thechange from 1:27,000 to 1:28,000, but most likely not. The practical impact

\\jciprod01\productn\U\UST\15-1\UST105.txt unknown Seq: 25 4-JAN-19 11:35
2018] THE THREE-FIFTHS RULE 183
of changing the ratio from 1:27,000 to 1:28,000 would have been limited toone-seat losses for Maryland and Massachusetts.
The ratio of 1:28,000 left a smaller total remainder than any less capa-cious ratio of representation. Moreover, a change to 1:29,000 would havecost six states a seat in the next House (plus South Carolina as it turnedout). The only reason to change the ratio would have been to improve theprospects of the slave states at the expense of the free states. It is hard toimagine the slave states having the votes to make such a change, especiallysince it would have cost Virginia a seat.
With 1:29,000 as the maximal ratio of representation, the Second Con-gress would have faced the slight temptation to change the ratio to 1:30,000to improve the total remainder. Although this would have benefited theslave states more than the free states, it would have cost Connecticut, Mas-sachusetts, and North Carolina one seat each. It seems unlikely that theSecond Congress would have made this change for such a slight improve-ment in the total remainder.
C. The 1800 Electoral Vote with a No-Fifths Rule
A literal reading of Freehling’s claims is that replacing the three-fifthsrule with a no-fifths rule would have resulted in Jefferson receiving twelvefewer electoral votes in 1800 than he actually did, and Adams receiving twofewer electoral votes in that election than he actually did, and nothing more.
In an Electoral College where the three-fifths clause gaveSoutherners 14 extra electors, the Republicans’ Thomas Jeffersondefeated the Federalists’ John Adams 73–65. If no three-fifthsclause had existed and House apportionment had been basedstrictly on white numbers, Adams would have likely squeaked by,63–61.91
The analysis of the 1800 election commences by correcting Freeh-ling’s analysis, while maintaining the supposition that Congress would haveemployed 1:33,000 as the ratio of representation for the first reapportion-ment of the House. Having demonstrated that Congress would not haveused that ratio, the analysis focuses on the ratios (and methods) it wouldhave considered.
1. Freehling’s Analysis Corrected
The three-fifths rule applied to the nation above the Mason-Dixon lineas well as below it. In making his claim, Freehling failed to notice that NewYork would not have been apportioned its tenth House seat without its 1790slave population of 21,324.
91. FREEHLING, supra note 1, at 147 (emphasis added). For a similar statement focused onthe three-fifths rule’s impact on just the South, see WILLS, supra note 1, at 2.

\\jciprod01\productn\U\UST\15-1\UST105.txt unknown Seq: 26 4-JAN-19 11:35
184 UNIVERSITY OF ST. THOMAS LAW JOURNAL [Vol. 15:1
With the claim that the Adams ticket captured two electoral votes dueto the three-fifths rule, Freehling’s analysis undoubtedly supposes that oneof these electoral votes is lost in Maryland and the other in North Caro-lina.92 Table 13 reconstructs Freehling’s totals in a 123-member ElectoralCollege based on 1:33,000 as the ratio of representation in a no-fifths ruleUnion, in which New York has eleven rather than twelve presidentialelectors.
TABLE 13 FREEHLING’S ELECTORAL VOTE TOTALS RECONSTRUCTED
AND ADJUSTED FOR NEW YORK
State 1790 Free Population
House Seats
Electors Jefferson Ticket
Adams Ticket
Connecticut 235,182 7 9 0 9Delaware 50,207 1 3 0 3Georgia 53,284 1 3 3 0Kentucky 61,247 1 3 3 0Maryland 216,692 6 8 4 4 Massachusetts 475,327 14 16 0 16 New Hampshire 141,727 4 6 0 6 New Jersey 172,716 5 7 0 7 New York 318,796 9 11 11 0 North Carolina 293,179 8 10 7 3 Pennsylvania 430,636 13 15 8 7 Rhode Island93 67,877 2 4 0 4 South Carolina 141,979 4 6 6 0 Tennessee 32,274 1 3 3 0
Vermont 85,523 2 4 0 4Virginia 454,983 13 15 15 0Total 91 123 60 63
The World Wide Web was just about to make its debut when Freehlingpublished The Road to Disunion in 1990.94 Among the many persons totake advantage of the web, none is more important to scholars of the earlyrepublic than Philip Lampi, who has devoted much of his adult life to col-
92. In addition to Maryland and North Carolina, Delaware was the only other slave state inwhich Adams won electoral votes. Adams could not have lost any electoral votes in Delaware, asthat state had only three electors, the minimum number possible.
93. One of Rhode Island’s electors cast an electoral vote for John Jay. The present analysisdisregards that sloughed off vote when appropriate.
94. Posting of Tim Berners-Lee to https://groups.google.com/forum/#!msg/alt.hypertext/eCTkkOoWTAY/bJGhZyooXzkJ (Aug. 6, 1991).

\\jciprod01\productn\U\UST\15-1\UST105.txt unknown Seq: 27 4-JAN-19 11:35
2018] THE THREE-FIFTHS RULE 185
lecting election data from that era95 and posting it on the Internet since2007.96
Three states split their electoral vote in 1800: Pennsylvania, Maryland,and North Carolina. Of these, Pennsylvania had the same number of electo-ral votes in Freehling’s no-fifths rule analysis as it had in the actual three-fifths rule election. Consequently, there is no reason to suppose that thePennsylvania legislature would not also have chosen eight Jefferson elec-tors and seven Adams electors in this no-fifths rule election, just as it did inthe actual three-fifths rule election.
Maryland and North Carolina are another matter. Fortuitously, eachloses two electoral votes in Freehling’s no-fifths rule analysis compared tothe actual three-fifths rule election, leaving each state with a number ofpresidential electors equal to the number of representatives it actually had inthe three-fifths rule Union. It is certainly reasonable to suppose that theMaryland and North Carolina legislatures would have used the same eight-district and ten-district plans that they actually used for three-fifths rulecongressional districts for the same number of presidential elector districtsin a no-fifths rule Union. Fortunately, each of these districting plansrespected county boundaries and that makes for an easy application ofcounty level voting data for 1800 from A New Nation Votes.
Jefferson and Adams split Maryland’s ten electoral votes in the actualthree-fifths rule election. However, as shown in Table 14, in a no-fifths ruleelection with eight electoral districts, Jefferson wins five electoral votes andAdams only wins three.97
95. Lampi’s data is available at Phillip Lampi ed., A New Nation Votes: American ElectionReturns 1787–1825, AM. ANTIQUARIAN SOC’Y (2007), https://elections.lib.tufts.edu (last visitedJuly 30, 2018) [hereinafter A New Nation Votes]. Unless otherwise stated, all election data is fromthis source. For Lampi’s remarkable story, see Katherine Mangu-Ward, The Orphan Scholar,HUMAN., Jan.–Feb. 2008, at 36–37.
96. E-mail from Pamela Hopkins, Public Service and Outreach Archivist, Digital Collectionsand Archives, Tufts University, to author (July 30, 2018) (on file with author).
97. For the data, see A New Nation Votes, supra note 95, at https://elections.lib.tufts.edu/catalog/tufts:md.presidentialelector1.1800 through https://elections.lib.tufts.edu/catalog/tufts:md.presidentialelector10.1800 (last visited July 30, 2018) (spreadsheet on file with author).

\\jciprod01\productn\U\UST\15-1\UST105.txt unknown Seq: 28 4-JAN-19 11:35
186 UNIVERSITY OF ST. THOMAS LAW JOURNAL [Vol. 15:1
TABLE 14 MARYLAND 1800 EIGHT ELECTORAL DISTRICT RESULTS
District Popular Vote Electors Jefferson Adams Jefferson Adams
1 67 1,114 0 12 1,336 1,074 1 03 920 2,125 0 1
4 2,482 2,182 1 05 2,340 672 1 0
6 1,828 753 1 0
7 1,460 613 1 08 196 1,485 0 1Total 10,629 10,018 5 3
This should come as no shock to students of districting. Nor should thefact that in a no-fifths rule, ten elector districting in North Carolina, Jeffer-son’s 8–4 vote margin completely vanishes in favor of a 5–5 split.98 Table15 presents the result of a ten elector districting in North Carolina.
98. See id. at https://elections.lib.tufts.edu/catalog/tufts:nc.presidentialelector.edenton.1800,https://elections.lib.tufts.edu/catalog/tufts:nc.presidentialelector.edgecombe.1800, https://elections.lib.tufts.edu/catalog/tufts:nc.presidentialelector.fayetteville.1800, https://elections.lib.tufts.edu/catalog/tufts:nc.presidentialelector.orange.1800, https://elections.lib.tufts.edu/catalog/tufts:nc.presidentialelector.morgan.1800, https://elections.lib.tufts.edu/catalog/tufts:nc.presidentialelector.newbern.1800, https://elections.lib.tufts.edu/catalog/tufts:nc.presidentialelector.northampton.1800, https://elections.lib.tufts.edu/catalog/tufts:nc.presidentialelector.raleigh.1800, https://elections.lib.tufts.edu/catalog/tufts:nc.presidentialelector.rockingham.1800, https://elections.lib.tufts.edu/catalog/tufts:nc.presidentialelector.salisbury.1800, https://elections.lib.tufts.edu/catalog/tufts:nc.presidentialelector.halifax.1800, https://elections.lib.tufts.edu/catalog/tufts:nc.presidentialelector.wilmington.1800 (last visited July 30, 2018) (spreadsheet on file with author). A New Na-tion Votes does not present voting data for North Carolina’s Edenton electoral district in the north-east corner of the state, whose elector voted for Jefferson. The Edenton district consisted of thefollowing counties: Camden, Chowan, Currituck, Gates, Pasquotank, Perquimans, and Tyrell.These seven counties combined with Bertie and Hertford counties to form the eighth congres-sional district, and these two counties voted for Jefferson by 268–29 and 219–115. Consequently,Jefferson must have carried the actual eighth congressional district. The voting data presented forthe eighth district is for Bertie and Hertford counties only.
Adams is the first case of not being able to fill in the blank in the following statement with anon-negative integer.
In state S, candidate C owed _____ electoral votes to the three-fifths rule.

\\jciprod01\productn\U\UST\15-1\UST105.txt unknown Seq: 29 4-JAN-19 11:35
2018] THE THREE-FIFTHS RULE 187
TABLE 15 NORTH CAROLINA 1800 TEN ELECTORAL DISTRICT RESULTS
District Popular Vote Electors Jefferson Adams Jefferson Adams
1 1,374 484 1 02 1,058 1,794 0 13 1,918 1,052 1 04 1,338 692 1 05 1,555 582 1 06 736 1,395 0 17 264 1,868 0 18 487 144 1 09 1,420 1,512 0 110 1,342 1,401 0 1Total 11,492 10,924 5 5
With these analyses for Maryland and North Carolina in hand, Freeh-ling’s analysis of the 1800 electoral vote can be revised to what it wouldhave been in a no-fifths rule Union with the first apportionment of theHouse using 1:33,000 as the ratio of representation. Table 16 presents thisrevision.

\\jciprod01\productn\U\UST\15-1\UST105.txt unknown Seq: 30 4-JAN-19 11:35
188 UNIVERSITY OF ST. THOMAS LAW JOURNAL [Vol. 15:1
TABLE 16 FREEHLING’s Electoral Vote Totals Reconstructed andAdjusted for New York, Maryland, and North Carolina
State 1790 Free Population
House Seats
Electors Jefferson Ticket
Adams Ticket
Connecticut 235,182 7 9 0 9Delaware 50,207 1 3 0 3Georgia 53,284 1 3 3 0Kentucky 61,247 1 3 3 0Maryland 216,692 6 8 5 3 Massachusetts 475,327 14 16 0 16 New Hampshire 141,727 4 6 0 6 New Jersey 172,716 5 7 0 7 New York 318,796 9 11 11 0 North Carolina 293,179 8 10 5 5 Pennsylvania 430,636 13 15 8 7 Rhode Island 67,877 2 4 0 4 South Carolina 141,979 4 6 6 0 Tennessee 32,274 1 3 3 0Vermont 85,523 2 4 0 4Virginia 454,983 13 15 15 0Total 91 123 64 59
In Freehling’s 1:33,000, no-fifths rule Union, Adams wins the electo-ral vote 64–59, not 63–61.
2. Freehling’s Analysis Replaced
Part II.B.2 demonstrated that Congress would not have employed1:33,000 as the ratio of representation for the first reapportionment of theHouse in a no-fifths rule Union. Instead, it would have employed a ratiobetween 1:25,000 and 1:30,000, with a Jefferson-style apportionment.99 Ta-ble 17 presents the maximum and minimum number of electors for eachstate for these ratios of representation and apportionment methods alongwith the number of electors in the actual three-fifths rule election as well asthe selection method.100
99. It is conceivable but unlikely that Congress would have passed and President Washingtonwould have signed into law a Hamilton apportionment. For the sake of brevity and completeness,note 112 presents the final results for Hamilton apportionments with ratios of representation be-tween 1:25,000 and 1:30,000. See infra note 112.
100. For a brief overview of elector selection methods in the early republic, see McPherson v.Blacker, 146 U.S. 1, 29–33 (1892).

\\jciprod01\productn\U\UST\15-1\UST105.txt unknown Seq: 31 4-JAN-19 11:35
2018] THE THREE-FIFTHS RULE 189
TABLE 17 1800 ELECTORAL VOTE PARAMETERS
State Selection Method Split Vote
Electors Actual Maximum Minimum
Connecticut State Legislature N 9 11 9 Delaware State Legislature N 3 4 3 Georgia State Legislature N 4 4 3
Kentucky Popular, by District N 4 4 4 Maryland Popular, by District Y 10 10 9
Massachusetts State Legislature N 16 21 17 New Hampshire State Legislature N 6 7 6
New Jersey State Legislature N 7 8 7 New York State Legislature N 12 14 12 North Carolina Popular, by District Y 12 13 11 Pennsylvania State Legislature Y 15 19 16 Rhode Island Popular, Statewide N 4 4 4
South Carolina State Legislature N 8 7 6 Tennessee Popular, by District N 3 3 3 Vermont State Legislature N 4 5 4 Virginia Popular, Statewide N 21 20 17
Three states split their electoral vote (and have a number of electorsunder consideration different than their actual number of electors): Penn-sylvania, Maryland, and North Carolina. Projecting their electoral votes inpossible no-fifths rule Union merits careful attention.
With Republicans in control of its House and Federalists in control ofits Senate, Pennsylvania’s legislature almost failed to choose any scheme toappoint electors.101 On December 1, 1800, the two chambers agreed thateach would nominate eight electors and then select fifteen by joint ballot.102
With Republicans holding a majority of the two chambers combined, theygot to choose the odd elector. The projections presented below suppose thatif Pennsylvania has an odd number of electoral votes, then the Jefferson/Burr ticket wins the odd vote and that if Pennsylvania has an even numberof electoral votes, then the two tickets split them evenly.
After choosing its electors by statewide popular vote in 1789 and1792, the Maryland legislature switched to a ten-district system in 1795.103
In the range of no-fifths rule possible Unions under consideration, Mary-land has either ten or nine electors. For those cases in which Maryland hasten electors, it seems reasonable to suppose that it would have used the
101. See FERLING, supra note 1, at 157.102. See Act of Dec. 1, 1800, ch. MMCXLIX, 16 Pa. Stat. 493–94 (directing the manner of
appointing electors of a president and vice president of the United States).103. See Act of Dec. 24, 1795, ch. LXXII, 1795 Md. Laws 66 (altering the mode of electing
electors to choose the president and vice president of the United States).

\\jciprod01\productn\U\UST\15-1\UST105.txt unknown Seq: 32 4-JAN-19 11:35
190 UNIVERSITY OF ST. THOMAS LAW JOURNAL [Vol. 15:1
same districting scheme it used in the actual, ten-elector, three-fifths ruleelection. Jefferson and Adams each receive five electoral votes for thesecases. That leaves the cases in which Maryland has only nine electors.
Given its late autumn sessions, the Maryland legislature chose not towait for the Second Congress to finish its resizing of the House of Repre-sentatives, an effort that lasted from late October 1791 to the middle ofApril 1792. Instead, in late December 1791, the Maryland legislature passeda bill to district the state for an eight or nine-member delegation. Each ofthe plans created eight districts. In the nine-member plan, the Fifth District,consisting of Baltimore City and Baltimore and Harford Counties, electedtwo representatives.104 Again, it seems reasonable to presume that the Ma-ryland legislature would have adopted the same plan in a no-fifths ruleUnion, in which it chose nine presidential electors.
Applying A New Nation Votes’ data to the nine elector plan results inAdams’s ticket winning only three electoral votes to six for Jefferson’sticket,105 as shown in Table 18.
TABLE 18 MARYLAND 1800 ELECTOR PROJECTIONS BASED ON 1791NINE MEMBER PLAN
District Popular Vote Electors Jefferson Adams Jefferson Adams
1 67 1,114 0 12 1,336 1,074 1 03 920 2,125 0 14 2,482 2,182 1 05 3,137 683 2 06 1,628 969 1 07 1,054 1,045 1 08 5 826 0 1Total 10,629 10,018 6 3
North Carolina receives between eleven and thirteen electors in therange of no-fifths rule Unions under consideration. For twelve-electorcases, it is reasonable to suppose that the North Carolina legislature would
104. See Act of Dec. 26, 1791, ch. LXI, 1791 Md. Laws 589 (directing the mode of electingelectors to choose the president and vice president of the U.S.).
105. Spreadsheets on file with author. A New Nation Votes provides town-by-town results forFrederick County, which the 1791 nine-member plan split between districts three and four. A NewNation Votes, supra note 95, at https://elections.lib.tufts.edu/catalog/tufts:md.presidentialelector3.1800 (last visited July 30, 2018).
Jefferson is the second case of not being able to fill in the blank in the following statementwith a non-negative integer.
In state S, candidate C owed _____ electoral votes to the three-fifths rule.

\\jciprod01\productn\U\UST\15-1\UST105.txt unknown Seq: 33 4-JAN-19 11:35
2018] THE THREE-FIFTHS RULE 191
have employed the actual twelve-district plan enacted in 1792.106 With thatassumption in place, Jefferson receives eight electoral votes and Adamsonly receives four.
Unfortunately, the North Carolina legislature left no suggestions abouthow it might have districted the state to choose eleven or thirteen electors.North Carolina’s actual, twelve-district plan respected county boundaries.So did its plan for ten congressional districts.107 With fifty-eight counties,there are a myriad of possible ways to draw eleven-district or thirteen-dis-trict maps.
Rather than speculate on which districting the legislature might havechosen,108 software has been developed to generate 50,000 such maps foreleven or thirteen presidential elector districts,109 subject to the followingconstraints:
• No county is split between districts.• Districts must consist of contiguous counties.• A potential plan is rejected if any district’s free population
differs from the average free population per district by morethan twenty percent.110
• In the actual ten-district and twelve-district maps drawn by thelegislature, the first congressional district is identical to thefirst elector district. It consists of Burke, Lincoln, Rutherford,and Wilkes counties. Given the legislature’s choice to retainthis district in ten-district and twelve-district schemes, it is re-tained in the eleven-district schemes.
• As discussed previously, there is no data from A New NationVotes for the twelfth elector district. Consequently, it can onlybe joined to counties that voted for Jefferson in the eleven-district plans. There are only two such counties adjacent to thetwelfth district: Bertie and Hertford.○ By fiat, in eleven-district plans, it is joined to Hertford
County, whose free population of 3,386 produces a districtcloser to the statewide average, rather than Bertie, whosefree population was 7,465.
○ By fiat, in the thirteen-district scheme, the twelfth electordistrict is retained as an elector district by itself.
106. See Act of 1792, ch. XVI, 1795 N.C. Acts 48–49 (directing the mode of electing electorsto choose the president and vice president of the U.S.).
107. See Act of 1792, ch. XVII, 1795 N.C. Acts 50 (directing the division of the state intodistricts for the purpose of electing Representatives to Congress).
108. For discussions of the legislative politics of drawing the congressional maps, see DEL-
BERT HAROLD GILPATRICK, JEFFERSONIAN DEMOCRACY IN NORTH CAROLINA 1789–1816, at57–59 (1931); NORMAN K. RISJORD, CHESAPEAKE POLITICS 1781–1800, at 410–11 (1978).Neither of these sources has anything to say about drawing the map for elector districts.
109. Source code and input files on file with author.110. In addition, each of the runs generated a small number of cases resulting in a popular
vote tie in a district. These cases have been discarded from the results presented.

\\jciprod01\productn\U\UST\15-1\UST105.txt unknown Seq: 34 4-JAN-19 11:35
192 UNIVERSITY OF ST. THOMAS LAW JOURNAL [Vol. 15:1
With these constraints in place, the software generated the resultspresented in Table 19 (for eleven electoral districts) and Table 20 (for thir-teen electoral districts).111
TABLE 19 NORTH CAROLINA 1800 ELEVEN ELECTOR PROJECTIONS
Cases Percent Electoral Votes Jefferson Adams
12 0.02% 9 2 1,288 2.59% 8 3
10,761 21.64% 7 4 22,320 44.89% 6 5 13,438 27.03% 5 6
1,888 3.80% 4 7 12 0.02% 3 8
49,719
TABLE 20 NORTH CAROLINA 1800 THIRTEEN ELECTOR PROJECTIONS
Cases Percent Electoral Votes Jefferson Adams
8 0.02% 11 2 523 1.05% 10 3
4927 9.89% 9 4 15467 31.06% 8 5 18468 37.09% 7 6
8723 17.52% 6 7 1578 3.17% 5 8
103 0.21% 4 9 49,797
With projections in place for the states that split their electoral votes,projections of the nationwide electoral vote can be made. Because of thedistribution of results for North Carolina, the results are first presented ex-clusive of North Carolina, these results are then summarized and then theNorth Carolina distribution is added to complete the analysis.
Table 21 presents the results for the Jefferson-style apportionments,exclusive of North Carolina. The table displays Jefferson’s electoral votesfirst, then Adams’s. For example, the value in the cell for Pennsylvania with
111. In the eleven-elector projections, 229 plans failed the population per district test andfifty-two resulted in a tied district. For the thirteen-elector projections, these numbers were sixty-four and 139.

\\jciprod01\productn\U\UST\15-1\UST105.txt unknown Seq: 35 4-JAN-19 11:35
2018] THE THREE-FIFTHS RULE 193
[1:]25,000 as the ratio of representation is “10–9,” means ten electoral votesfor Jefferson and nine for Adams. Maryland’s results are highlighted.
TABLE 21 PRESIDENTIAL ELECTION OF 1800 PROJECTIONS,JEFFERSON–STYLE APPORTIONMENTS, NORTH CAROLINA EXCLUDED
State Ratio of Representation 25,000 26,000 27,000 28,000 29,000 30,000
Connecticut 0–11 0–11 0 –10 0–10 0 –10 0–9 Delaware 0–4 0–3 0–3 0–3 0–3 0–3
Georgia 4–0 4–0 3–0 3–0 3–0 3–0
Kentucky 4–0 4–0 4–0 4–0 4–0 4–0 Maryland 5–5 5–5 5–5 6–3 6–3 6–3 Massachusetts 0–21 0–20 0–19 0–18 0–18 0–17 New Hampshire 0–7 0–7 0–7 0–7 0–6 0–6 New Jersey 0–8 0–8 0–8 0–8 0–7 0–7 New York 14–0 14–0 13–0 13–0 12–0 12–0 Pennsylvania 10 – 9 9 – 9 9 – 8 9 – 8 8 – 8 8 – 8 Rhode Island 0 – 4 0 – 4 0 – 4 0 – 4 0 – 4 0 – 4
South Carolina 7 – 0 7 – 0 7 – 0 7 – 0 6 – 0 6 – 0
Tennessee 3 – 0 3 – 0 3 – 0 3 – 0 3 – 0 3 – 0
Vermont 0 – 5 0 – 5 0 – 5 0 – 5 0 – 4 0 – 4
Virginia 20 – 0 19 – 0 18 – 0 18 – 0 17 – 0 17 – 0 Total (exclusive of North Carolina)
67 – 74 65 – 72 62 – 69 63 – 66 59 – 63 59 – 61
Table 22 presents the simple cases in which North Carolina has twelveelectors.
TABLE 22 PRESIDENTIAL ELECTION OF 1800, JEFFERSON-STYLE
APPORTIONMENTS, NORTH CAROLINA 12 ELECTORS INCLUDED
Ratio of Representation 27,000 28,000 29,000
Total excluding North Carolina
62–69 63–66 59–63
North Carolina 8–4 100.00% 8–4 100.00% 8–4 100.00% Total including North Carolina
70–73 100.00% 71–70 100.00% 67–67 100.00%
Table 23 adds in the range of North Carolina results for those cases inwhich the state has other than twelve electors.

\\jciprod01\productn\U\UST\15-1\UST105.txt unknown Seq: 36 4-JAN-19 11:35
194 UNIVERSITY OF ST. THOMAS LAW JOURNAL [Vol. 15:1
TABLE 23 PRESIDENTIAL ELECTION OF 1800, JEFFERSON-STYLE
APPORTIONMENTS, NORTH CAROLINA ELEVEN OR THIRTEEN
ELECTORS INCLUDED
Ratio of Representation 25,000 26,000 30,000
Total excluding North Carolina
67–74 65–72 59–61
North Carolina
11–2 0.02% 11–2 0.02% 9–2 0.02%
10–3 1.05% 10–3 1.05% 8–3 2.59% 9–4 9.89% 9–4 9.89% 7–4 21.64% 8–5 31.06% 8–5 31.06% 6–5 44.89% 7–6 37.09% 7–6 37.09% 5–6 27.03% 6–7 17.52% 6–7 17.52% 4–7 3.80% 5–8 3.17% 5–8 3.17% 3–8 0.02%
4–9 0.21% 4–9 0.21%
Total including North Carolina
78–76 0.02% 76–74 0.02% 68–63 0.02% 77–77 1.05% 75–75 1.05% 67–64 2.59% 76–78 9.89% 74–76 9.89% 66–65 21.64%
75–79 31.06% 73–77 31.06% 65–66 44.89% 74–80 37.09% 72–78 37.09% 64–67 27.03% 73–81 17.52% 71–79 17.52% 63–68 3.80%
72–82 3.17% 70–80 3.17% 62–69 0.02% 71–83 0.21% 69–81 0.21%
Table 24 summarizes the outcomes of the Jefferson-style apportion-ment in terms of winners and ties.112
112. Jefferson fares somewhat worse in the Hamilton apportionments.
Winner Ratio of Representation
25,000 26,000 27,000 28,000 29,000 30,000 Jefferson 0.01% 0.02% 0.00% 0.00% 100.00% 0.00%
Tie 0.49% 1.05% 0.00% 0.00% 0.00% 0.00%
Adams 99.50% 98.93% 100.00% 100.00% 0.00% 100.00%

\\jciprod01\productn\U\UST\15-1\UST105.txt unknown Seq: 37 4-JAN-19 11:35
2018] THE THREE-FIFTHS RULE 195
TABLE 24 PRESIDENTIAL ELECTION OF 1800, JEFFERSON-STYLE
APPORTIONMENTS—SUMMARY
Winner Ratio of Representation 25,000 26,000 27,000 28,000 29,000 30,000
Jefferson 0.02% 0.02% 0.00% 100.00% 0.00% 24.26% Tie 1.05% 1.05% 0.00% 0.00% 100.00% 0.00% Adams 98.93% 98.93% 100.00% 0.00% 0.00% 75.74%
The outcome of the 1800 presidential election in a no-fifths rule Unionwould have depended critically on:
• The maximal ratio of representation specified in NathanielGorham’s proposal on the last day of the Convention;
• Congress’s choice of a ratio of representation in the first reap-portionment; and
• In some cases, the North Carolina legislature’s districtingplan.113
There is even a small probability that the electoral vote would haveended in a (first-place) tie (at exactly half the total number of electors)between Jefferson and Adams (and Burr), sending those three names alongwith Pinckney and Jay to the House of Representatives.114 In that case,
113. Neubauer and Zeitlin have analyzed how the outcome of the electoral vote in 2000 criti-cally depended on House size. See Michael G. Neubauer & Joel Zeitlin, Outcomes of PresidentialElections and the House Size, 36 PS: POL. SCI. & POL. 721, 721 (2003).
114. In a recent book calling for abolition of the Electoral College, Mark Weston claims that,“were it not for the early Constitution’s infamous ‘3/5’ rule that allowed southern states to countthree-fifths of their slaves as population for the purpose of congressional and electoral apportion-ment, Adams would have narrowly beaten Jefferson by an electoral vote of 70 to 68.” MARK
WESTON, THE RUNNER-UP PRESIDENCY: THE ELECTIONS THAT DEFIED AMERICA’S POPULAR WILL
71 (2016).
Weston provides neither analysis nor citations for this unique claim, which supposes that theSecond Congress was somehow fixated on creating a House of 105 members (before the admis-sion of Tennessee).
A 105-member House based on the 1790 census can be achieved in a no-fifths rule Union inone of two ways: a Jefferson-style apportionment based on a ratio of representation between28,437 and 28,507, inclusive, and in round numbers, 28,500. Of course, such an analysis needs toask whether the Second Congress would have chosen a ratio of representation not divisible by1,000, and if so, why would it have been 28,500, which leaves New Hampshire, South Carolina,and almighty Virginia with remainders of at least 27,483.
A Hamilton apportionment based on a ratio of representation of 30,000 also yields a 105-member House based on a no-fifths rule. This is the same ratio of representation in the actual textof Article I of the U.S. Constitution, and as this article has shown, it might have been there in ano-fifths rule Union.
Amazingly, each of these apportionments yields a 70–68 electoral vote victory for Adamsbased on the following assumptions in the three states that split their electoral votes (showingJefferson’s electoral votes first).

\\jciprod01\productn\U\UST\15-1\UST105.txt unknown Seq: 38 4-JAN-19 11:35
196 UNIVERSITY OF ST. THOMAS LAW JOURNAL [Vol. 15:1
Alexander Hamilton would have had an opportunity to engineer the selec-tion of Charles Cotesworth Pinckney as a compromise candidate.115
III. THE THREE-FIFTHS RULE AND THE ELECTION OF 1824
Perhaps no one has seen his presidential ambitions frustrated more cru-elly than Henry Clay did in 1824. The final electoral vote recorded AndrewJackson with ninety-nine, John Quincy Adams with eighty-four, WilliamCrawford with forty-one, and Clay with thirty-seven.116 Table 25 presentsthese results by state.
State Jefferson (28,500)
Hamilton (30,000)
Pennsylvania 9–8 8–8
North Carolina 8–4 8–4 Maryland 5–4 5–4
The hypothetical allocations for Pennsylvania are based on the statute passed giving the leg-islature the power to choose the electors. The hypothetical allocations for North Carolina matchthe actual outcome. Given Jefferson’s small popular vote margin in Maryland, coupled with thatstate splitting its electoral vote 5–5, the 5–4 split seems reasonable, but this article has shown thata 6–3 split would have been more likely. That would have resulted in Jefferson and Adams (andBurr) each receiving sixty-nine electoral votes, leaving no one with a majority.
115. For the actual House election of 1801, see FERLING, supra note 1, at 175–96. For Hamil- Rton’s machinations on behalf of Pinckney, see id. at 142–43, 158–61.
116. 1 REG. DEB. 526 (1825).

\\jciprod01\productn\U\UST\15-1\UST105.txt unknown Seq: 39 4-JAN-19 11:35
2018] THE THREE-FIFTHS RULE 197
TABLE 25 1824 ELECTORAL VOTE, ACTUAL
State Selection Method
Electoral Votes
Jackson Adams Crawford Clay
Alabama Statewide 5 5 Connecticut Statewide 8 8
Delaware Legislature 3 1 2
Georgia Legislature 9 9 Illinois District 3 2 1
Indiana Statewide 5 5 Kentucky District 14 14
Louisiana Legislature 5 3 2
Maine District 9 9 Maryland District 11 7 3 1 Massachusetts Statewide 15 15 Mississippi Statewide 3 3
Missouri District 3 3 New Hampshire Statewide 8 8 New Jersey Statewide 8 8 New York Legislature 36 1 26 5 4 North Carolina Statewide 15 15
Ohio Statewide 16 16 Pennsylvania Statewide 28 28
Rhode Island Statewide 4 4
South Carolina Legislature 11 11
Tennessee District 11 11 Vermont Legislature 7 7 Virginia Statewide 24 24 Total 261 99 84 41 37
Following the election, Clay wrote to James Brown, “accident aloneprevented my return to the H. of R. and, as is generally now believed, myelection.”117 In spite of the accidents he suffered, Clay would have finishedahead of Crawford in third place in the electoral vote in a no-fifths ruleUnion.
A. The Electoral Vote of 1824
Even before Congress tallied the all but unanimous electoral vote forJames Monroe’s second term, well-placed observers speculated that the
117. Letter from Henry Clay to James Brown (Jan. 23, 1825), in 4 THE PAPERS OF HENRY
CLAY 38 (James F. Hopkins ed., 1972) [hereinafter CLAY PAPERS] .

\\jciprod01\productn\U\UST\15-1\UST105.txt unknown Seq: 40 4-JAN-19 11:35
198 UNIVERSITY OF ST. THOMAS LAW JOURNAL [Vol. 15:1
election of his successor would devolve on the House of Representatives.118
Clay’s strategy all along was to garner enough electoral votes to be amongthe “persons having the highest numbers not exceeding three on the list ofthose voted for as President.”119 Clay fully expected he would win theHouse election.120 Others expected his election via this scenario as well.121
1. Clay Finishes Dead Last
Clay’s first accident came in New York, a state in which the legislaturechose the electors.122 According to that state’s law, each house of the legis-lature would choose a slate of thirty-six electors, with a joint vote of the twohouses resolving any differences between the two slates.123 Such a jointvote was in order after the Senate chose a slate of twenty-nine Crawfordelectors and seven Clay electors, and the Assembly chose a full slate ofAdams electors with the support of the Clay and Crawford factions.124
One hundred fifty-seven members were present when the legislaturemet in joint session on November 15 to finalize its choice of electors. Onthe first ballot, the seven Clay electors received ninety-five votes, twenty-five Adams electors received seventy-eight votes, the Crawford electors re-ceived seventy-six votes, and three ballots were left blank. With 157 mem-bers present, the Crawford forces argued that seventy-nine votes wereneeded for a majority. However, the Adams faction prevailed in their view
118. See Letter from William Plumer Jr. to William Plumer (Nov. 24, 1820), in THE MISSOURI
COMPROMISES AND PRESIDENTIAL POLITICS, 1820–1825, 55 (Everett Somerville Brown ed., 1926)[hereinafter THE MISSOURI COMPROMISES]. For similar comments from the first half of 1822, seeLetters from Rufus King, in 6 THE LIFE AND CORRESPONDENCE OF RUFUS KING 437, 456, 468(Charles R. King ed., 1900) [hereinafter RUFUS KING] .
119. U. S. CONST. amend. XII. For the recognition that this was Clay’s strategy, see Letterfrom Rufus King to Jeremiah Mason (May 17, 1822), in RUFUS KING, supra note 118, at 471;Letter from Rufus King to Christopher Gore (June 5, 1822), in id. at 475; Letter from WilliamPlumer Jr. to William Plumer (Dec. 21, 1822), in THE MISSOURI COMPROMISES, supra note 118, at81.
120. See Letter from Henry Clay to Josephus B. Stuart (Dec. 19, 1823), in 3 CLAY PAPERS,supra note 117, at 544–45; Letter from Henry Clay to Francis T. Brooke (Jan. 22, 1824), in id. at603; Letter from Henry Clay to Peter B. Porter (Jan. 31, 1824), in id. at 630; Letter from HenryClay to Charles Hammond (Feb. 22, 1824), in id. at 654; Letter from Henry Clay to Francis T.Brooke (Feb. 26, 1824), in id. at 662; Letter from Henry Clay to Peter B. Porter (Apr. 26, 1824),in id. at 743.
121. See Letter from Willie P. Mangum to Thomas Ruffin (Jan. 20, 1824), in 1 THE PAPERS OF
WILLIE PERSON MANGUM 109 (Henry Thomas Shanks ed., 1950); Letter from Willie P. Mangumto Seth Jones (Feb. 11, 1824), in id. at 116; Letter from W. H. Haywood Jr. to Willie P. Mangum(Feb. 23, 1824), in id. at 120.
122. Earlier in the year, Crawford’s supporters in the New York Senate had beaten back anattempt to enact a law placing the selection of presidential electors in the hands of the voters. SeeTHURLOW WEED, 1 LIFE OF THURLOW WEED INCLUDING HIS AUTOBIOGRAPHY AND A MEMOIR
EMBELLISHED WITH PORTRAITS AND OTHER ILLUSTRATIONS COMPLETE IN TWO VOLUMES 105(Harriet Weed ed., 1884).
123. ROBERT V. REMINI, MARTIN VAN BUREN AND THE MAKING OF THE DEMOCRATIC PARTY
73 (1959) [hereinafter VAN BUREN].124. Id. at 76–77.

\\jciprod01\productn\U\UST\15-1\UST105.txt unknown Seq: 41 4-JAN-19 11:35
2018] THE THREE-FIFTHS RULE 199
that a majority of the 154 voting members was sufficient to elect thetwenty-five Adams electors and the seven Clay electors on this first ballot.A day later, the legislature awarded the final four spots to Crawfordelectors.125
Had Clay received seven electoral votes from New York and Crawfordfour, the two of them would have ended up in a 40–40 tie in third place inthe Electoral College. But New York did not cast its electoral vote that way.When the electors met on December 1, two Clay electors were absent andreplaced by Adams supporters. A third Clay elector voted for Jackson.126
With an Adams elector voting for Crawford, the New York electoral votewas twenty-six for Adams, five for Crawford, four for Clay, and one forJackson.
Clay’s second accident came in Louisiana where a coalition of Jacksonand Adams forces aligned in an attempt to deny Clay the state’s five electo-ral votes.127 These electoral votes slipped away from Clay’s grasp whenfour key Clay-backers in the legislature were unexpectedly absent and threemore defected to the Adams-Jackson coalition. As a result, the legislaturenarrowly voted for a slate of three Jackson electors and two Adamselectors.128
Had Clay swept Louisiana’s electoral vote, he would have finished onevote ahead of Crawford in the Electoral College, even with the unexpectedoutcome in New York. Had he carried Louisiana and had New York’s elec-toral vote been cast as expected, Clay would have received forty-five elec-toral votes to Crawford’s forty (with ninety-five for Jackson and eighty-onefor Adams).
125. Id. at 80.126. Id. at 82. Remini writes that “It is futile to guess what took place during these two short
weeks [leading up to the electors’ vote].” Crawford’s biographer Chase Mooney writes:Probably no one will ever know exactly what happened, but there have been severalspeculations and accounts. Roger Skinner, writing to Van Buren on December 1, saidJohn Taylor (who had been appointed to one of the vacancies) was active, as was Am-brose Spencer, in trying to secure six votes for Crawford. Hammond and others, accord-ing to Skinner, said the Adamsites had violated a pledge to give Clay eight votes inconsideration of Clay’s friends’ support of the successful ticket. Jackson’s friends hadattended the meeting of the electors and had sought to effect a division of the votesbetween Jackson and Adams.
CHASE C. MOONEY, WILLIAM H. CRAWFORD 294–95 n.63 (1974).127. Letter from David Corbin Ker to Andrew Jackson (Nov. 23, 1824), in 5 THE PAPERS OF
ANDREW JACKSON 450 (Harold D. Moser et al. eds., 1996).128. According to Jackson’s editors, two Old Hickory electors were chosen on the first ballot,
as was an Adams elector. The third Jackson elector was chosen on the fourth ballot, and thesecond Adams elector on the fifth ballot. Id. at 451 n.1. Clay wrote to his friends that he had lostthe balloting by a vote of 30–28. See Letter from Henry Clay to Francis T. Brooke (Dec. 22,1824), in 3 CLAY PAPERS, supra note 117, at 900; Letter from Henry Clay to Peter B. Porter (Dec.26, 1824), in id. at 905.

\\jciprod01\productn\U\UST\15-1\UST105.txt unknown Seq: 42 4-JAN-19 11:35
200 UNIVERSITY OF ST. THOMAS LAW JOURNAL [Vol. 15:1
2. The 1824 Electoral Vote with a No-Fifths Rule
Clay’s candidacy would have survived these accidents in a constitu-tional order grounded in a no-fifths rule.129
Before assessing the impact of a no-fifths rule, the present analysisbegins by determining which states were in play for Crawford and Clay intheir contest for third place in the Electoral College.130 The present analysislooks for a somewhat better than actual case for Crawford and a somewhatpoorer than actual case for Clay to demonstrate the robustness of Clayfinishing ahead of Crawford in a no-fifths rule Union.
The following states chose their electors by statewide popular vote andthe present analysis supposes the same statewide winner regardless of thenumber of electoral votes:131 Alabama, Connecticut, Indiana, Massachu-setts, Mississippi, New Hampshire, New Jersey, North Carolina, Ohio,Pennsylvania, Rhode Island, and Virginia. Of these, Virginia voted forCrawford and Ohio voted for Clay.
In Delaware, Georgia, Louisiana, New York, South Carolina, and Ver-mont, the legislature chose the state’s presidential electors.
Delaware’s legislature chose two Crawford electors and one Adamselector.132 The present analysis supposes that if Delaware had four electoralvotes, its legislature would have chosen three Crawford electors and oneAdams elector.
The present analysis supposes that Georgia’s legislature would havechosen a slate of electors for its native son Crawford regardless of the sizeof the slate.
The present analysis takes Louisiana out of play on the suppositionthat its legislature would have selected only Jackson and Adams electors.
129. The task here is to demonstrate that in a no-fifths rule Union, Clay finishes in third placein the electoral vote, ahead of Crawford. This analysis supposes the changes to the presidentialelection process made by the Twelfth Amendment. It is conceivable that such changes would nothave been made if John Adams had won the election of 1800, when an Adams elector in RhodeIsland cast his second electoral vote for John Jay rather than Adams’s running mate, CharlesCotesworth Pinckney. In that case, as many as five names could have gone to the House, perhapsincluding John C. Calhoun’s, who ran for vice president. It is important to note, however, thatconstitutional amendments requiring electors to distinguish their presidential vote from their vice-presidential vote had been introduced in January 1797. See 6 ANNALS OF CONG. 1824 (1797), andFebruary 1800, see 10 ANNALS OF CONG. 510 (1800).
130. See infra, note 169 for Jackson/Adams highlights. R131. Theoretically, a split outcome could have resulted in a state that chose its electors indi-
vidually on a long ballot. There is no evidence that any of the states just listed were near to anysuch outcome, and the present analysis discounts its possibility.
132. In the actual election, Delaware’s thirty-member legislature chose three electors from aslate of eight candidates. Joseph G. Rowland, who voted for Adams, received twenty-one votesfrom the legislature. Isaac Tunnell and John Caldwell, who each voted for Crawford, each re-ceived fifteen votes. See H. Clay Reed, Presidential Electors in Delaware, 1789–1829, 14 DEL.HIST. 1, 15 (1970).

\\jciprod01\productn\U\UST\15-1\UST105.txt unknown Seq: 43 4-JAN-19 11:35
2018] THE THREE-FIFTHS RULE 201
New York ultimately cast five of its thirty-six electoral votes for Craw-ford and four for Clay, a difference of one in Crawford’s favor. The presentanalysis supposes that if New York had had a larger number of electoralvotes, then Crawford would have received one more, and that if it had fewerelectoral votes, Clay would have received one less. That is, the present anal-ysis supposes that if New York had any number of electoral votes otherthan thirty-six, then Crawford would have received two more than Clay.
The present analysis supposes that South Carolina’s legislature wouldhave chosen a complete slate of Jackson electors regardless of the numberof electoral votes it had.
Likewise, the present analysis supposes that Vermont’s legislaturewould have chosen a complete slate of Adams electors regardless of itsnumber of electoral votes.
The following states chose their electors by district by popular vote:Illinois, Kentucky, Maine, Maryland, Missouri, and Tennessee.
In a hotly contested four-way race, Illinois’ voters chose two Jacksonelectors and one Adams elector from its three districts. The analysis thatfollows supposes a minimal ratio of representation of 1:30,000. Illinois hada free population of 54,294 in 1820 so it always has three electoral votesregardless of the ratio of representation considered in the present analysis.As a result, neither Crawford nor Clay wins an electoral vote in any scena-rio considered below.
Kentucky chose its fourteen electors in three multi-elector districts.Clay won a minimum of 69.5 percent of the votes cast in each district. Thepresent analysis supposes that Clay wins all of Kentucky’s electoral votesregardless of their number.
Missouri chose three Clay electors by district. Like Illinois, it neverhas more than three electors when the ratio of representation is at least1:30,000.
Tennessee chose its eleven electors by district. With Andrew Jacksonwinning more than 90 percent of his home state’s popular vote, the presentanalysis supposes that he would have won all of Tennessee’s electoral votesregardless of their number.
Maryland and Maine merit detailed attention after a brief commentabout the apportionment of the House following the 1820 census.
On January 7, 1822, Congress began consideration of a bill to set theratio of representation at 1:40,000, creating a 213 seat House. Seven weekslater, it approved that ratio after a wide range of others were considered.133
133. Ratios of representation between 1:37,000 and 1:75,000 were considered. All ratiosgreater than 1:50,000 were voted down without a recorded vote. For the opening of the debates,see 38 ANNALS OF CONG. 708 (1822). For the closing, see id. at 1171. For the most extreme ratiosduring the debate of Jan. 17, see id. at 736. For the final statute, see Act of Mar. 7, 1822, ch. X, 3Stat. 651 (apportioning representatives among the several states, according to the fourth census).

\\jciprod01\productn\U\UST\15-1\UST105.txt unknown Seq: 44 4-JAN-19 11:35
202 UNIVERSITY OF ST. THOMAS LAW JOURNAL [Vol. 15:1
The present analysis considers all ratios of representations between1:30,000 and 1:50,000 in increments of 1,000. Table 26 presents the num-ber of House seats apportioned to the states in play for Clay or Crawford foreach of these ratios of representation.134
TABLE 26 HOUSE SEATS BY RATIO OF REPRESENTATION IN A NO-FIFTHS
RULE APPORTIONMENT: CRAWFORD, CLAY STATES IN PLAY
1824
Ratio of Repr.
House Size
DE GA KY MD ME MO NY OH VA
1:30,000 255 2 6 14 9 9 3 45 19 21 1:31,000 244 2 6 14 9 9 3 43 18 20
1:32,000 239 2 5 13 9 9 3 42 18 20 1:33,000 234 2 5 13 9 9 3 41 17 19 1:34,000 225 2 5 12 8 8 3 40 17 18 1:35,000 215 1 5 12 8 8 3 38 16 18 1:36,000 213 1 5 12 8 8 3 37 16 17 1:37,000 207 1 5 11 8 8 3 36 15 17 1:38,000 201 1 5 11 7 7 3 35 15 16 1:39,000 194 1 4 11 7 7 3 34 14 16 1:40,000 191 1 4 10 7 7 3 34 14 16 1:41,000 185 1 4 10 7 7 3 33 14 15 1:42,000 181 1 4 10 7 7 3 32 13 15 1:43,000 175 1 4 10 6 6 3 31 13 14 1:44,000 169 1 4 9 6 6 3 30 13 14 1:45,000 168 1 4 9 6 6 3 30 12 14 1:46,000 163 1 4 9 6 6 3 29 12 13 1:47,000 161 1 4 9 6 6 3 28 12 13 1:48,000 158 1 3 9 6 6 3 28 12 13 1:49,000 150 1 3 8 6 6 3 27 11 13 1:50,000 146 1 3 8 5 5 3 27 11 12
When Congress resized the House in January 1802, it apportioned anadditional ninth seat to Maryland.135 A year later, the Maryland legislature
134. Using the following counts of free persons from the 1820 census: Delaware 68,240,Georgia 191,333, Kentucky 437,585, Maryland, 299,953, Maine 298,335, Missouri 56,364, NewYork 1,362,724, Ohio 581,434, Virginia 640,226. See Census for 1820, at 18 (1821), https://www2.census.gov/prod2/decennial/documents/1820a-02.pdf.
135. See Act of Jan. 14, 1802, ch. I, 2 Stat. 128 (apportioning representatives among theseveral states, according to the second enumeration).

\\jciprod01\productn\U\UST\15-1\UST105.txt unknown Seq: 45 4-JAN-19 11:35
2018] THE THREE-FIFTHS RULE 203
drew nine districts, choosing eleven presidential electors.136 Two districtson the western shore chose two electors; the remainder chose one each. Ingeneral, this districting respected county boundaries. However, Montgom-ery and Prince Georges counties on the western shore and DorchesterCounty on the eastern shore were split between districts.137
This districting remained in place following Congress’s resizing of theHouse in December 1811, which left Maryland with nine Representa-tives.138 The Maryland legislature made a minor change on the easternshore in February 1820. In 1817, it added a fifth election district toDorchester County.139 Three years later, in 1820, the legislature assignedDorchester County’s second election district to the state’s eighth presiden-tial electoral district.140 Finally, in 1823, the legislature reassigned two elec-tion districts in Montgomery County,141 as Congress’s resizing of theHouse in March 1822 left Maryland’s House delegation unchanged at ninemembers.142 By 1824, the division of Dorchester County into six ratherthan five election districts resulted in election districts one through threebeing joined with Caroline and Talbot counties and election districts fourthrough six being combined with Somerset and Worcester counties.143
136. See Act of Jan. 8, 1803, ch. LXX, 1803 Md. Laws 36 (“providing for the elections ofrepresentatives of [Maryland] in the Congress of the United States, and of electors on the part of[Maryland] for choosing a president and vice-president of the United States.”) The Act also dreweight districts electing nine members of the House.
137. The interested reader may wish to consult Dennis Griffith’s 1795 map of Maryland. For azoomable version of the entire state, see Dennis Griffith, James Thackara & J. (John) Vallance,[Map of the state of Maryland], 1:300,000, Library of Congress, https://hdl.loc.gov/loc.gmd/g3840.ct000307. For a snapshot of just Dorchester County, see Dorchester 1795, 1000x900,Dorchester Graves, https://dorchestergraves.com/history/maps/#jp-carousel-147.
138. See Act of Dec. 21, 1811, ch. IX, 2 Stat. 669 (apportioning representatives among theseveral states, according to the third enumeration). The Maryland Session Laws for 1811, 1812,and 1813 contain no statutes concerning redistricting congressional or presidential elector dis-tricts. See Acts of 1811, 1811 Md. Laws; Acts of 1812, 1812 Md. Laws; Acts of 1813, 1813 Md.Laws 181–227. Martis does not report a redrawing of Maryland’s House districts between 1802and 1833. See KENNETH C. MARTIS, THE HISTORICAL ATLAS OF UNITED STATES CONGRESSIONAL
DISTRICTS: 1789–1983, at 234 (1982).
139. See Act of Jan. 27, 1817, ch. 127, 1817 Md. Laws 89 (appointing commissioners for thepurpose of dividing Dorchester County into five separate election districts).
140. See Act of Feb. 14, 1820, ch. CLXXI, 1820 Md. Laws 106 (reducing into one the GeneralActs of Assembly respecting elections and regulating elections).
141. See Act of Feb. 24, 1823, ch. 218, 1823 Md. Laws 136 (relating to the second and thirddistricts for choosing electors of President and Vice President of the United States).
142. See Act of Mar. 7, 1822, ch. X, 3 Stat. 651 (apportioning representatives among theseveral states, according to the fourth census).
143. I have not found a statute making this change in the assignment of Dorchester County’selection districts. However, this is how A New Nation Votes reports the data. See A New NationVotes, supra note 95, at https://elections.lib.tufts.edu/catalog/tufts:md.presidentialelector8.1824,https://elections.lib.tufts.edu/catalog/tufts:md.presidentialelector9.1824 (last visited July 30,2018). See Act of Dec. 16, 1822, ch. 5, 1822 Md. Laws 4–5 (commissioning the division ofDorchester County into six election districts).

\\jciprod01\productn\U\UST\15-1\UST105.txt unknown Seq: 46 4-JAN-19 11:35
204 UNIVERSITY OF ST. THOMAS LAW JOURNAL [Vol. 15:1
In 1824, Crawford won only 12.39 percent of Maryland’s popular votestatewide.144 However, with more than 60 percent of his vote coming fromthe eastern shore, he managed to win the eastern shore’s eighth electoraldistrict, the middle of its three districts.145 Adams won the district to thesouth in a close race with Crawford146 and the district to the north in whichCrawford was not competitive.147 In a race lacking a Crawford elector,Jackson won the district containing the eastern shore’s northernmostcounty, Cecil County, combined with Harford County on the westernshore.148
With Crawford winning less than 6 percent of the vote on the westernshore, his only chance of winning more than one elector was on the easternshore. That could not have happened given the apportionment ratios underconsideration. With a free population of 299,953, Maryland would have hadbetween nine and five House seats, and between eleven and seven presiden-tial electors. Table 27 presents the average single elector district sizes thatwould have resulted.
TABLE 27 POSSIBLE NUMBERS OF PRESIDENTIAL ELECTORS,MARYLAND 1824
House Ratio of Representation Presidential Electors
Average Single Elector District Minimum Maximum
1:30,000 1:33,000 11 27,2681:34,000 1:37,000 10 29,9951:38,000 1:42,000 9 33,3281:43,000 1:49,000 8 37,494
1:50,000 7 42,850
Table 28 presents the votes for Adams and Crawford on Maryland’seastern shore counties from Worcester County at the southeastern end toCecil County at the northern end.149
144. For the returns by county in each electoral district, see A New Nation Votes, supra note95, at https://elections.lib.tufts.edu/catalog/tufts:md.presidentialelector1.1824 through https://elections.lib.tufts.edu/catalog/tufts:md.presidentialelector9.1824.
145. See A New Nation Votes, supra note 95, at https://elections.lib.tufts.edu/catalog/tufts:md.presidentialelector8.1824.
146. See A New Nation Votes, supra note 95, at https://elections.lib.tufts.edu/catalog/tufts:md.presidentialelector9.1824.
147. See A New Nation Votes, supra note 95, at https://elections.lib.tufts.edu/catalog/tufts:md.presidentialelector7.1824.
148. See A New Nation Votes, supra note 95, at https://elections.lib.tufts.edu/catalog/tufts:md.presidentialelector6.1824.
149. See A New Nation Votes, supra note 95, at https://elections.lib.tufts.edu/catalog/tufts:md.presidentialelector6.1824, https://elections.lib.tufts.edu/catalog/tufts:md.presidentialelector7.1824, https://elections.lib.tufts.edu/catalog/tufts:md.presidentialelector8.1824, https://elections.lib.tufts.edu/catalog/tufts:md.presidentialelector9.1824.

\\jciprod01\productn\U\UST\15-1\UST105.txt unknown Seq: 47 4-JAN-19 11:35
2018] THE THREE-FIFTHS RULE 205
TABLE 28 EASTERN SHORE PRESIDENTIAL VOTE FOR ADAMS AND
CRAWFORD, 1824
County Free Population Vote by County Crawford Margin(/Deficit)
By County Cumulative Adams Crawford By County Cumulative Worcester 12,870 12,870 421 754 333 333 Somerset 12,343 25,213 619 288 -331 2 Dorchester 12,562 37,775 411 297 -114 -112Caroline 8,477 46,252 317 689 372 260 Talbot 9,653 55,905 747 496 -251 9Queen Anne 9,351 65,256 427 30 -397 -388Kent 7,382 72,638 469 21 -448 -836Cecil 13,646 86,284 594 0 -594 -1,430
In the actual election of 1824, Dorchester County’s first and secondelection districts were joined with Caroline and Talbot counties to form theeighth electoral district. The remainder of Dorchester County combinedWorcester and Somerset counties to form the ninth electoral district. Table29 presents the votes in these two electoral districts with Dorchester Countygiven in detail.150
TABLE 29 DORCHESTER COUNTY DETAILED ADAMS-CRAWFORD VOTE
1824, ACTUAL ELECTORAL DISTRICT ASSIGNMENTS
County /Counties
Election District Actual ElectoralDistrict
Adams Crawford Crawford Margin (/Deficit)
Caroline and Talbot 8 1,064 1,185 121
Dorchester
First District (Vienna) 8 56 49 -7
Second District (New Market)
8 82 83 1
Third District (Ferry) 8 13 90 77 Fourth District (Cambridge)
9 59 8 -51
Fifth District 9 140 61 -79Sixth District 9 60 6 -54
Somerset and Worcester 9 1,040 1,042 2
150. The detailed data at A New Nation Votes for Adams’s Dorchester County vote sums to410, one less than the total given for the whole county. A New Nation Votes, supra note 95, athttps://elections.lib.tufts.edu/catalog/tufts:md.presidentialelector8.1824, https://elections.lib.tufts.edu/catalog/tufts:md.presidentialelector9.1824.

\\jciprod01\productn\U\UST\15-1\UST105.txt unknown Seq: 48 4-JAN-19 11:35
206 UNIVERSITY OF ST. THOMAS LAW JOURNAL [Vol. 15:1
Crawford would not have won both electoral districts with the legisla-ture’s actual apportionment of Dorchester County’s election districts be-tween Caroline and Talbot counties to the north and Somerset andWorcester counties to the south and east. Nor could he have won both elec-toral districts with any sensible apportionment of Dorchester County’s sixelection districts. Table 30 demonstrates how two Crawford electoral dis-tricts could be created by clairvoyantly dividing Dorchester County.
TABLE 30 DORCHESTER COUNTY DETAILED ADAMS-CRAWFORD VOTE
1824, CRAWFORD BEST CASE ELECTORAL DISTRICT
ASSIGNMENT
County /Counties
Election District ElectoralDistrict
Adams Crawford Crawford Margin (/Deficit)
Caroline and Talbot X 1,064 1,185 121
Dorchester
Fourth District (Cambridge)
X 59 8 -51
Sixth District X 60 6 -54First District (Vienna) X 56 49 -7Fifth District Y 140 61 -79
Second District (New Market)
Y 82 83 1
Third District (Ferry) Y 13 90 77
Somerset and Worcester Y 1,040 1,042 2
However, this hypothetical apportionment ignores two geographic re-alities. First, the Vienna district was in the southeastern part of DorchesterCounty, across the Nanticoke River from Somerset County. Second, theFerry and New Market districts were to the north of the Vienna district andthe New Market district, especially, was closer to Talbot County than Som-erset County. There is no geographically realistic way for Crawford to havewon more than a single elector in Maryland.
In 1824,151 as in 1820,152 Maine chose two presidential electors state-wide and one elector in each of its seven congressional districts. In theactual election of 1824, John Quincy Adams defeated William Crawford
151. J. Res. LXXVI, 4th Leg., 1824 Me. Laws 350–52. A New Nation Votes presents Maine’s1824 presidential elector data on a county-by-county basis with Penobscot and Somerset countiespresented together on the same web page as is the data for Hancock and Washington counties. ANew Nation Votes, supra note 95, at https://elections.lib.tufts.edu/catalog/tufts:me.electors.hancock_washington.1824, https://elections.lib.tufts.edu/catalog/tufts:me.electors.somerset_penobscot.1824 (last visited July 30, 2018). This gives the impression that, in 1824, no Maine countywas split between two electoral districts. That was not the case. Some of Maine’s counties weresplit between two congressional districts. See Act of Feb 8, ch. 223, 1823 Me. Laws 52–53.
152. J. Res. XIX, 1820 Leg., 1820 Me. Laws 31.

\\jciprod01\productn\U\UST\15-1\UST105.txt unknown Seq: 49 4-JAN-19 11:35
2018] THE THREE-FIFTHS RULE 207
statewide and in all seven congressional districts to sweep Maine’s nineelectoral votes. What could the outcome have been if there had been a dif-ferent number of electoral votes at stake?153
In the last presidential election prior to Maine’s separation from Mas-sachusetts, the Bay State’s legislature chose all of the state’s electors.154
Four years before that, Massachusetts chose all twenty-two of its presiden-tial electors from six districts even though it chose its entire House delega-tion from single member districts.155 The district of Maine had the onlyelectoral district that chose a single elector. Maine’s two other electoraldistricts chose three electors each.156
Maine’s Massachusetts heritage provided a rich variety of methods forchoosing presidential electors. Popularly electing two statewide and the re-mainder from single elector districts was not one of them.157 By choosingthat method in 1820 and 1824, the Maine legislature made a clear choicenot to imitate its Massachusetts past.158
Crawford managed to win just under 25 percent of the vote in the racefor the two electors chosen statewide.159 Adams won the rest. (NeitherJackson nor Clay was on the ballot in Maine.) In the seven electoral districtraces, Crawford only came within hailing distance of Adams in the Cum-berland district, in which the Crawford elector lost to the Adams elector byonly 156 votes (5.38 percent).160 Crawford’s next best showing came in theneighboring York district to the south in which his electors won a mere
153. Maine was, of course, admitted as a free state on March 3, 1820. Act of Mar. 3, 1820, ch.XIX, 3 Stat. 544. The 1820 census counted no slaves in Maine. Census for 1820, supra note 134, Rat 18.
154. J. Res. XIX, 1816 Leg., 1816 Mass. Acts 233.
155. Act of February 28, 1812 ch. CXLV, 1812 Mass. Acts 300.
156. The three districts in downstate Massachusetts chose five, six, and four electors each. J.Res. LXXI, 1812 Leg., 1812 Mass. Acts. 94.
157. For a recapitulation of Massachusetts’ constantly changing methods of choosing its presi-dential electors, see McPherson, 146 U.S. at 29–32. The closest Massachusetts came to themethod adopted by Maine was in 1796 when the legislature chose two electors and the voterschose the remainder from each congressional district with the proviso that the legislature wouldchoose in case no candidate had a majority in a district. Id. at 31.
158. In 1820, the Massachusetts legislature adopted a two-statewide plus the remainder bycongressional district method a week before the Maine legislature did. J. Res. VI, 1820 Leg., 1820Mass. Acts 245. Four years later, the Massachusetts legislature abandoned that method for thegeneral ticket system. McPherson, 146 U.S. at 32.
159. A New Nation Votes, supra note 95, at https://elections.lib.tufts.edu/catalog/tufts:me.electors.at_large.1824.
160. A New Nation Votes, supra note 95, at https://elections.lib.tufts.edu/catalog/tufts:me.elector.cumberland.1824.

\\jciprod01\productn\U\UST\15-1\UST105.txt unknown Seq: 50 4-JAN-19 11:35
208 UNIVERSITY OF ST. THOMAS LAW JOURNAL [Vol. 15:1
22.66 percent of the vote.161 Table 31 presents the popular vote for electorsby district and statewide.162
TABLE 31 1824 MAINE ELECTORAL DISTRICT VOTE
District Adams Crawford Adams Margin
Crawford Percentage
York 1,642 481 1,161 22.66% Cumberland 1,526 1,370 156 47.31% Lincoln 1,530 248 1,282 13.95% Kennebec 1,387 180 1,207 11.49% Oxford 1,093 107 986 8.92% Penobscot and Somerset
1,556 275 1,281 15.02%
Hancock and Washington
1,406 393 1,013 21.85%
Statewide 10,140 3,054 7,086 23.15%
Crawford won twelve of twenty municipalities in the actual Cumber-land district. If a different number of districts had been drawn, Crawford’sbest chance of winning an elector in one of them would have depended on adistrict being constructed from just the right set of municipalities in theactual Cumberland district. Outside of the Cumberland district, Crawfordwon only eleven of 127 municipalities by an aggregate margin of only 326votes. These eleven municipalities were spread out over six of Maine’sother eight counties. In contrast, Adams accumulated a margin of 7,516votes in the other 116 municipalities outside of Cumberland County.163
161. A New Nation Votes, supra note 95, at https://elections.lib.tufts.edu/catalog/tufts:me.electors.york.1824.
162. See also A New Nation Votes, supra note 95, at https://elections.lib.tufts.edu/catalog/tufts:me.electors.kennebec.1824, https://elections.lib.tufts.edu/catalog/tufts:me.electors.lincoln.1824, https://elections.lib.tufts.edu/catalog/tufts:me.electors.oxford.1824.
163. A New Nation Votes reports data for all twenty-one municipalities in the CumberlandDistrict except Thompson Pond Plantation. A New Nation Votes, supra note 95 at https://elections.lib.tufts.edu/catalog/tufts:me.elector.cumberland.1824. The municipality level data for therest of the state at A New Nation Votes is slightly incomplete. There is no municipality level datafor the Oxford district, just to the north of the York and Cumberland Districts, which contained allof Oxford County and the five northernmost municipalities in Cumberland County. See A NewNation Votes, supra note 95, at https://elections.lib.tufts.edu/catalog/tufts:me.electors.oxford.1824.The municipality level data for the Cumberland district includes the town of Saco, which alsoappears, properly, in the York district. As a result, the municipality-by-municipality data for theCumberland district sums to totals that exceed the totals presented for the district by exactly theSaco numbers. See A New Nation Votes, supra note 95 at https://elections.lib.tufts.edu/catalog/tufts:me.elector.cumberland.1824. Therefore, there must be municipality level data missing foreach of the districts other than Cumberland and Oxford because the district totals exceed the sumof the municipality-by-municipality data.

\\jciprod01\productn\U\UST\15-1\UST105.txt unknown Seq: 51 4-JAN-19 11:35
2018] THE THREE-FIFTHS RULE 209
Understanding how the Maine legislature dealt with Cumberland andYork counties in the actual sevenfold congressional districting will helpprojecting how it might have treated these counties while drawing a differ-ent number of congressional districts.164
With seven House seats, Maine’s single member congressional dis-tricts averaged 42,619 inhabitants each. The Maine legislature could havedrawn up a reasonable apportionment not dividing any county into multiplecongressional districts by first combining Penobscot and Somerset countiesin the northern part of the state, then combining Hancock and Washingtoncounties in the eastern part of the state, and finally leaving the other fivecounties intact. Table 32 shows such a seven-district plan.
TABLE 32 SEVEN MAINE CONGRESSIONAL DISTRICTS PRESERVING
COUNTY BOUNDARIES, 1823
County County Population
District Population
Deviation
York 46,283 46,283 8.60% Cumberland 49,445 49,445 16.02% Lincoln 53,189 53,189 24.80% Kennebec 42,623 42,623 0.01% Oxford 27,104 27,104 -36.40%Penobscot 13,870
35,657 -16.34%Somerset 21,787Hancock 31,290
44,034 3.32% Washington 12,744 Statewide 298,335 42,619
In fact, that is just what the legislature did.165 However, that wouldhave left the Lincoln County district at nearly 25 percent above the state-wide average and the Oxford County district at just more than 36 percentbelow the statewide average.
Table 33 summarizes the municipality shifts made by the Maine legis-lature to achieve a more balanced apportionment.
164. Readers of this Article may wish to consult Moses Greenleaf’s 1820 “Map of the State ofMaine” available in the Osher Map Library at the Smith Center for Cartographic Education at theUniversity of Southern Maine or in the Norman B. Leventhal Map Center at the Boston PublicLibrary. Moses Greenleaf, A Map of the State of Maine from the Latest and Best Authorities,1820, OSHER MAP LIBRARY, http://www.oshermaps.org/browse-maps?id=47014#img0; MosesGreenleaf, A Map of the State of Main from the Latest and Best Authorities, 1820, NORMAN B.LEVENTHAL MAP AND EDUCATION CENTER, https://collections.leventhalmap.org/search/commonwealth:6t053q062.
165. Act of Feb. 8, 1823, 1823 Me. Laws 52–53.

\\jciprod01\productn\U\UST\15-1\UST105.txt unknown Seq: 52 4-JAN-19 11:35
210 UNIVERSITY OF ST. THOMAS LAW JOURNAL [Vol. 15:1
TABLE 33 MUNICIPALITIES SHIFTED, 1823 MAINE CONGRESSIONAL
DISTRICTING
Municipalities Shifted
From To Population Shifted
6 Lincoln Kennebec 3,894 3 Lincoln Oxford 4,567 3 Kennebec Oxford 3,0395 Cumberland Oxford 6,690
This apportionment, which left York County in the southernmost partof Maine intact and shifted its eastern neighbor Cumberland County’s fivenorthernmost municipalities (Baldwin, Bridgton, Harrison, Minot, and Otis-field) to the Oxford district, resulted in the following sized congressionaldistricts, shown in Table 34.
TABLE 34 ACTUAL MAINE CONGRESSIONAL DISTRICTS (1823)
District District Population
Deviation
York 46,283 8.60%Cumberland 42,755 0.32%Lincoln 44,728 4.95%Kennebec 43,478 2.01%Oxford 41,400 -2.86%Penobscot and Somerset
35,657 -16.34%
Hancock and Washington
44,034 3.32%
Statewide 298,335
In this actual apportionment, the smallest district, Penobscot and Som-erset, was just over 16 percent below the average district size and the largestdistrict, York, was a mere 8.6 percent larger than the average district size.
Exclusive of Maine, Clay’s projected electoral vote margin over Craw-ford in a no-fifths rule republic is smallest for ratios of representation of1:45,000 and 1:49,000. For these ratios, Maine has six House seats.166
Therefore, the present analysis focuses attention on how six House districtscould have been drawn in Maine.
Maine’s legislature would have surely begun a six-district apportion-ment by leaving its four largest counties (York, Cumberland, Lincoln, andKennebec) intact, combining the three easternmost counties (Hancock, Pe-
166. See infra Table 40.

\\jciprod01\productn\U\UST\15-1\UST105.txt unknown Seq: 53 4-JAN-19 11:35
2018] THE THREE-FIFTHS RULE 211
nobscot, and Washington) into one district, and combining its two othernorthern counties (Oxford and Somerset) into another. This would have re-sulted in the following initial apportionment that splits no county into multi-ple districts, as shown in Table 35.
TABLE 35 SIX CONGRESSIONAL DISTRICTS PRESERVING MAINE COUNTY
BOUNDARIES (1823)
County County Population
District Population
Difference
York 46,283 46,283 -6.92%Cumberland 49,445 49,445 -0.56%Lincoln 53,189 53,189 6.97%Kennebec 42,623 42,623 -14.28%Oxford 27,104
48,891 -1.67%Somerset 21,787 Hancock 31,290
57,904 16.45%Penobscot 13,870 Washington 12,744 Statewide 298,335 49,723
To improve on this initial apportionment, the legislature would haveshifted municipalities from western Hancock County to the Kennebec dis-trict.167 Cumberland and York counties would have been left intact.
Crawford would not have won any of these six electoral districts. Norwould he have won any electors if Maine had been apportioned only fiveHouse seats with 1:50,000 as the ratio of representation. With five Houseseats, Maine’s average congressional district size would have been 59,667.The state’s legislature would have had three options for CumberlandCounty.
The first option would have been to leave Cumberland County intact.That would have resulted in an Adams victory in the countywide district.
The legislature’s second option would have divided Oxford Countybetween a York district and a Cumberland district. York County is Maine’ssouthwestern most county. Cumberland County lies up the coast to the east.Oxford lies on top of them to the north. In 1820, these three counties had acombined population of 122,832, just a little more than twice the five-dis-trict average size. If the legislature had pursued this second option, Craw-
167. Hancock County’s nine westernmost municipalities (Belfast, Belmont, Brooks, Jackson,Knox, Lincolnville, Northport, Scarsmont, Thorndike) had a total population of 7,484. Shiftingthese municipalities to the Kennebec district would have given that district 50,107 inhabitants, amere 0.77 percent above the six-district average. A population of 50,420 would have remained inthe Hancock, Penobscot, and Washington district, just 1.40 percent above the six-district average.

\\jciprod01\productn\U\UST\15-1\UST105.txt unknown Seq: 54 4-JAN-19 11:35
212 UNIVERSITY OF ST. THOMAS LAW JOURNAL [Vol. 15:1
ford would not have won either of these districts given his losses in theactual York and Cumberland districts and his less than 10 percent share ofthe Oxford district vote.
The legislature’s final option would have been to split off part of Cum-berland County and join it to York County in a York district. That wouldhave been of no avail to Crawford. His aggregate margin of 403 votes in thetwelve Cumberland County municipalities he carried was far exceeded byAdams’ 1,161 vote margin in the actual York district.
Crawford could have won a single electoral district centered on hisCumberland County core if Maine had eight or nine House seats. Withthose numbers of House seats, the average district sizes would have been37,292 and 33,148 respectively. These would have been too small for YorkCounty’s 46,283 inhabitants to be left intact as a congressional district bythemselves.
Crawford’s Cumberland County core consisted of ten municipalities inthe southern part of the county. Crawford’s core includes two towns that didnot vote for him: Gorham on the York County line and Portland, which issurrounded by Crawford towns. Table 36 presents the relevant data forCrawford’s Cumberland core.168 (The towns are presented in alphabeticalorder.)
TABLE 36 CRAWFORD’s Cumberland County Core
Town Adams Crawford Crawford Margin
Population
Cape Elizabeth 13 67 54 1,688 Falmouth 16 39 23 1,673 Gorham 63 60 -3 2,795 Gray 34 59 25 1,479 Portland 600 416 -184 8,581Scarborough 35 85 50 2,232 Standish 52 71 19 1,619 Westbrook 56 163 107 2,502Windham 7 27 20 1,793 Crawford Cumberland Core Total
876 987 111 24,362
Crawford’s Cumberland core combined with all of York County had apopulation of 70,645, just about the right size to construct two congres-sional districts out of a total of eight or nine. Table 37 shows how such a
168. A New Nation Votes, supra note 95, at https://elections.lib.tufts.edu/catalog/tufts:me.elector.cumberland.1824.

\\jciprod01\productn\U\UST\15-1\UST105.txt unknown Seq: 55 4-JAN-19 11:35
2018] THE THREE-FIFTHS RULE 213
district could have been constructed while leaving the remaining part ofYork County with the right size population to form a district.
TABLE 37 CONSTRUCTING A CRAWFORD DISTRICT
Town Adams Crawford Crawford Margin
Popu-lation
CrawfordDistrict Margin
Crawford District Size
York District Size
Crawford Cumberland Core Total
876 987 111 24,362 111 24,362 46,283
Cornish 34 4 -30 1,088 81 25,450 45,195Limington 0 0 0 2,122 81 27,572 43,073 Parsonsfield 46 55 9 2,355 90 29,927 40,718
Limerick 41 28 -13 1,377 77 31,304 39,341
Waterborough 22 42 20 1,762 97 33,066 37,579
Alfred 7 85 78 1,271 175 34,337 36,308
Buxton 110 24 -86 2,590 89 36,927 33,718Hollis 72 20 -52 1,762 37 38,689 31,956
To make a best case for Crawford (and worst case for Clay), the pre-sent analysis supposes that Crawford would have won a single electoraldistrict if Maine had been apportioned eight or nine House seats in 1822.
Table 38 summarizes the suppositions just made. (EV represents thestate’s number of electoral votes.)
TABLE 38—SUMMARY OF ELECTORAL VOTE ASSUMPTIONS FOR
CRAWFORD AND CLAY
State Clay Crawford Clay Margin over Crawford
Crawford Margin over Clay
Delaware 0 EV–1 EV–1 Georgia 0 EV EV Kentucky EV 0 EV
Maine 0 if EV>9, then 1, otherwise 0
if EV>9, then 1, otherwise 0
Maryland 0 1 1 Missouri EV 0 EV
New York if EV<36 then 3, otherwise 4
if EV>36 then 6, otherwise 5
if EV=36 then 1, otherwise 2
Ohio EV 0 EV Virginia 0 EV EV

\\jciprod01\productn\U\UST\15-1\UST105.txt unknown Seq: 56 4-JAN-19 11:35
214 UNIVERSITY OF ST. THOMAS LAW JOURNAL [Vol. 15:1
Table 39 applies the electoral vote assumptions for Clay and Crawfordpresented in Table 38 to the state-by-state apportionments shown justabove. (In the New York column, “4–6” indicates four Clay electors and sixCrawford electors.)
TABLE 39 PROJECTED ELECTORS FOR CLAY AND CRAWFORD BASED ON
A NO-FIFTHS RULE APPORTIONMENT, STATES IN PLAY, 1824
Ratio of Repr.
Total Electoral Votes
Clay Electors–Crawford Electors DE GA KY MD ME MO NY OH VA
1:30,000 303 0–3 0–8 16–0 0–1 0–1 3–0 4–6 21–0 0–23 1:31,000 292 0–3 0–8 16–0 0–1 0–1 3–0 4–6 20–0 0–22 1:32,000 287 0–3 0–7 15–0 0–1 0–1 3–0 4–6 20–0 0–22 1:33,000 282 0–3 0–7 15–0 0–1 0–1 3–0 4–6 19–0 0–21 1:34,000 273 0–3 0–7 14–0 0–1 0–1 3–0 4–6 19–0 0–20 1:35,000 263 0–2 0–7 14–0 0–1 0–1 3–0 4–6 18–0 0–20 1:36,000 261 0–2 0–7 14–0 0–1 0–1 3–0 4–6 18–0 0–19 1:37,000 255 0–2 0–7 13–0 0–1 0–1 3–0 4–6 17–0 0–19 1:38,000 249 0–2 0–7 13–0 0–1 0–0 3–0 4–6 17–0 0–18 1:39,000 242 0–2 0–6 13–0 0–1 0–0 3–0 4–5 16–0 0–18 1:40,000 239 0–2 0–6 12–0 0–1 0–0 3–0 4–5 16–0 0–18 1:41,000 233 0–2 0–6 12–0 0–1 0–0 3–0 3–5 16–0 0–17 1:42,000 229 0–2 0–6 12–0 0–1 0–0 3–0 3–5 15–0 0–17 1:43,000 223 0–2 0–6 12–0 0–1 0–0 3–0 3–5 15–0 0–16 1:44,000 217 0–2 0–6 11–0 0–1 0–0 3–0 3–5 15–0 0–16 1:45,000 216 0–2 0–6 11–0 0–1 0–0 3–0 3–5 14–0 0–16 1:46,000 211 0–2 0–6 11–0 0–1 0–0 3–0 3–5 14–0 0–15 1:47,000 209 0–2 0–6 11–0 0–1 0–0 3–0 3–5 14–0 0–15 1:48,000 206 0–2 0–5 11–0 0–1 0–0 3–0 3–5 14–0 0–15 1:49,000 198 0–2 0–5 10–0 0–1 0–0 3–0 3–5 13–0 0–15 1:50,000 194 0–2 0–5 10–0 0–1 0–0 3–0 3–5 13–0 0–14
Using these state-by-state electoral vote projections, Table 40 presentsthe outcome of the race for third-place between Clay and Crawford.169
169. In the actual election based on the three-fifths rule, Jackson received 37.9 percent andAdams received 32.2 percent of the 261 electoral votes. Jackson’s share of the electoral vote basedon the no-fifths rule apportionments presented here ranges from 37.56 percent to 36.79 percent,Adams’ share ranges from 34.90 percent to 34.10 percent, so Jackson’s margin over Adamsranges from 3.45 percent to 2.07 percent. Spreadsheet on file with author.
Robert Pierce Forbes claims otherwise. He claims that without the three-fifths rule, Jacksonwould have received 77 electoral votes to 83 for Adams. ROBERT PIERCE FORBES, THE MISSOURI
COMPROMISE AND ITS AFTERMATH: SLAVERY AND THE MEANING OF AMERICA 218 (2007). No

\\jciprod01\productn\U\UST\15-1\UST105.txt unknown Seq: 57 4-JAN-19 11:35
2018] THE THREE-FIFTHS RULE 215
estimate is given for Crawford or Clay. Ratcliffe repeats Forbes’s claim. DONALD RATCLIFFE, THE
ONE-PARTY PRESIDENTIAL CONTEST: ADAMS, JACKSON, AND 1824’S FIVE-HORSE RACE 233(2015) [hereinafter RATCLIFFE 1824]; Donald Ratcliffe, Popular Preferences in the PresidentialElection of 1824, 34(1) J. EARLY REPUBLIC 45, 66 (2014).
Forbes’s argument is a model of how not to estimate the outcome of an electoral vote in a no-fifths rule Union. “This figure is derived in the following manner. The total number of slaves inthe United States, according to the 1820 census figures, was 1,538,125. Three-fifths of this figuregives a “federal number” of 911,400 for purposes of electoral representation.” FORBES, supra, at334 n.34.
Here is the first problem. Multiply 1,538,125 by 3/5 and the result is 922,875. Divide911,400 by 3/5 and the result is 1,519,000. This may be government work, but in the age ofspreadsheets, this is an easy calculation. Forbes continues, “The average size of a congressionaldistrict in 1824 was approximately 41,000 persons; thus slaves accounted for approximately 22additional congressional seats, and electoral votes.” Id.
The hidden assumption here is that Congress would have used the same ratio of representa-tion in a no-fifths rule Union than it actually used in the three-fifths rule Union. The analysispresented in this Article frames no such hypothesis, but considers a range of ratios instead. (By theway, twenty-two additional seats result from a three-fifths rule contribution of 911,400. If thethree-fifths rule contribution is 922,875, the impact is closer to twenty-three seats rather thantwenty-two.) Forbes concludes:
Adams actually received 84 electoral votes; but by applying the same rule to him, histotal would have declined to 83 as a result of subtracting the slave representation (theequivalent of 41,051 “federal votes”) from the 6 electoral votes he received from slavestates (3 from Maryland, 2 from Louisiana, and one from Delaware).
Id.So, on this analysis, Adams loses a single electoral vote thanks to the three-fifths rule and
Jackson loses all the rest! (77 = 99 – 22. Twenty-two plus one equals twenty-three!) Forbes neverbothers to assess the impact on Crawford or Clay who won thirty-six and seventeen electoral votesrespectively in slave states. Forbes concludes his analysis by citing William Seward’s book onJohn Quincy Adams and his source, Calvin Colton. Neither of these mid-nineteenth century com-mentators make any claim about what the 1824 electoral vote would have been in a no-fifths ruleUnion. They simply note that Jackson received fifty-five electoral votes from slave states com-pared to only six for Adams. WILLIAM HENRY SEWARD, LIFE AND PUBLIC SERVICES OF JOHN
QUINCY ADAMS: SIXTH PRESIDENT OF THE UNITED STATES 150 (1856); CALVIN COLTON, 1 THE
LIFE AND TIMES OF HENRY CLAY 291 (1846).Now consider the impact of the three-fifths rule on Adams’s electoral vote given Forbes’s
hidden assumptions. With only a single House seat, Delaware was immune to any change from ano-fifths rule.
Maryland presents a tractable problem. Maryland chose its electors by district. With a slavepopulation of 107,398, it presumably loses two electoral votes leaving it with nine, matchingnumber of House members it actually had in the three-fifths rule Union since 1803. In 1802, theMaryland legislature drew an eight-district, nine-representative map for its House delegation. Actof Jan. 8, 1803, 1803 Md. Laws 36; The legislature reenacted this districting in 1806. Act of Jan.25, 1806, 1806 Md. Laws 71. The data at A New Nation Votes for Maryland’s 1824 House elec-tions confirms that it remained in place for the 1824 election. Spreadsheet on file with author.
With this districting in place, the county and town level data at A New Nation Votes revealsAdams winning five of Maryland’s five electoral votes and Jackson four. Adams gains electoralvotes in a state that loses them thanks to a no-fifths rule! See A New Nation Votes, supra note 95,at https://elections.lib.tufts.edu/catalog/tufts:md.presidentialelector1.1824 through https://elections.lib.tufts.edu/catalog/tufts:md.presidentialelector9.1824 (use the “previous” and “next” options atthe top of the page to toggle between each district).This is yet another case of not being able to fillin the blank in the following statement with a non-negative integer.
In state S, candidate C owed _____ electoral votes to the three-fifths rule.Louisiana’s legislature chose its electors. With a slave population of 69,059, Louisiana would
have lost a single elector. There is no way to tell how its legislature would have chosen fourelectors rather than five, However, one thing is certain: Having received only two electoral votes

\\jciprod01\productn\U\UST\15-1\UST105.txt unknown Seq: 58 4-JAN-19 11:35
216 UNIVERSITY OF ST. THOMAS LAW JOURNAL [Vol. 15:1
TABLE 40 PROJECTED ELECTORAL VOTE TOTALS FOR CLAY AND
CRAWFORD BASED ON NO-FIFTHS RULE APPORTIONMENTS,1824
Ratio of Repr.
Total Electoral Votes
Clay Electoral Vote
Crawford Electoral Vote
Clay Margin Over Crawford
New York Electoral Votes
1:30,000 303 44 42 2 47 1:31,000 292 43 41 2 45 1:32,000 287 42 40 2 44 1:33,000 282 41 39 2 43 1:34,000 273 40 38 2 42 1:35,000 263 39 37 2 40 1:36,000 261 39 36 3 39 1:37,000 255 37 36 1 38 1:38,000 249 37 34 3 37 1:39,000 242 36 32 4 36 1:40,000 239 35 32 3 36 1:41,000 233 34 31 3 35 1:42,000 229 33 31 2 34 1:43,000 223 33 30 3 33 1:44,000 217 32 30 2 32 1:45,000 216 31 30 1 32 1:46,000 211 31 29 2 31 1:47,000 209 31 29 2 30 1:48,000 206 31 28 3 30 1:49,000 198 29 28 1 29 1:50,000 194 29 27 2 29
Given the assumptions made above for the state-by-state electoralvote, Clay finishes ahead of Crawford for all ratios of representation be-tween 1:30,000 and 1:50,000.170 Clay’s margin over Crawford reflects the
in the actual election, Adams could not possibly have owed the three electoral votes to the three-fifths rule necessary to give him a net loss of one!
Given the analysis of Maryland just presented, the best conjecture for Forbes’s hidden as-sumptions is that Jackson wins 87 or 88 electoral votes, Adams 86 or 85, Crawford 31, and Clay35. The uncertainty stems from whether Louisiana splits its four electoral votes evenly or three-to-one for Jackson.
170. All ratios of representation between 1:30,000 and 1:50,000 have been examined. Craw-ford never does better than falling one electoral vote short of Clay for third place with the assump-tions made here. He does this for ratios of representation between 1:44,726 and 1:45,730 inclusive

\\jciprod01\productn\U\UST\15-1\UST105.txt unknown Seq: 59 4-JAN-19 11:35
2018] THE THREE-FIFTHS RULE 217
degree to which the assumptions made in the present analysis may be re-laxed in favor of Crawford and against Clay.
B. The 1825 House Election
No apportionment based on a no-fifths rule results in a majority winnerin the Electoral College, just as no apportionment based on the three-fifthsrule results in a majority winner. Under all circumstances, the selection ofthe president falls to the House.
1. The Actual House Election of 1825
A state-level analysis of the actual House election involving Crawfordwill be useful before turning to an analysis of a hypothetical House electioninvolving Clay. This analysis classifies states into the following categories:
firmly for Jackson,leaning to Jackson,firmly for Adams,leaning to Adams,firmly for Crawford,in play.
Alabama, Mississippi, Pennsylvania, and Tennessee voted decisively forJackson in the November election, giving him at least 63 percent of theirpopular vote. Each voted for Jackson in the actual House election with onlyPennsylvania Federalist, Samuel Breck, not voting for Jackson (he voted forAdams).171 These states are classified as firmly for Jackson.
Three states gave Jackson a less decisive victory in the popular vote.Indiana gave him 47 percent of its vote compared to 34 percent for Clay.New Jersey cast 52 percent of its ballots for Jackson and 43 percent forAdams. In North Carolina, Jackson received 57 percent of the popular votecompared to 43 percent for Crawford. The House delegations from Indianaand New Jersey voted for Jackson by votes of 3–0 and 5–1 (Adams) respec-tively. However, the delegation from North Carolina cast its vote for Craw-ford with ten of its thirteen members voting for him, two voting for Adams,and only one voting for Jackson. Indiana and New Jersey are classified asleaning to Jackson.172 North Carolina is classified as in play by virtue of thefact that its House delegation voted for Crawford rather than Jackson.
(Electoral College sizes of 216 to 213) and 1:48,621 and 1:49,248 inclusive (Electoral Collegesizes of 203 to 198).
171. Neither the House Journal nor the Register of Debates records the details of the Houseelection. That was left to the press and was collected by Martis. See KENNETH C. MARTIS, THE
HISTORICAL ATLAS OF POLITICAL PARTIES IN THE UNITED STATES CONGRESS 1789–1989, at318–19 (1989).
172. On January 24, 1825, William Plumer Jr. wrote to his father that Pennsylvania, SouthCarolina, Tennessee, Indiana, Mississippi, and Alabama were certain to vote for Jackson. New

\\jciprod01\productn\U\UST\15-1\UST105.txt unknown Seq: 60 4-JAN-19 11:35
218 UNIVERSITY OF ST. THOMAS LAW JOURNAL [Vol. 15:1
John Quincy Adams received at least 70 percent of the vote in the fiveNew England states whose electorates chose their presidential electors.(Vermont’s legislature chose its electors.) Rhode Island’s Samuel Eddy hes-itated a long time before voting for Adams rather than Jackson,173 a votethat would have left Rhode Island divided. Therefore, the present analysisclassifies Rhode Island as leaning to Adams. With one exception, the dele-gations from the remaining four New England states voted unanimously forAdams in the House election. Only Massachusetts’ Francis Baylies strayedby voting for Jackson. These four states are classified as firmly for Adams.
Virginia gave nearly 56 percent of its popular vote to Crawford withAdams receiving 22 percent, Jackson 19 percent, and Clay 3 percent.Twenty of Virginia’s twenty-two Representatives voted for Crawford in theHouse election with Adams and Jackson receiving one vote each. Virginiais classified as firmly for Crawford.174
Clay won the popular vote by large margins in his home state of Ken-tucky and in nearby Missouri. These states would prove to be crucial toAdams’s victory in the House election. Missouri’s lone representative JohnScott cast his vote for Adams, in spite of the fact that the New Englanderhad garnered less than 5 percent of the state’s popular vote.175 Eight of thetwelve members of the Kentucky House delegation defied the instructionsof the state legislature and cast their votes for Adams.176 These states areclassified as in play since their House delegations could not vote for Clay.
There were close popular votes in Ohio, Illinois, and Maryland. Claynarrowly won the Buckeye state’s winner-take-all pot of sixteen electorswith 38.5 percent of its popular vote compared to 37 percent for Jacksonand 24.5 percent for Adams. Adams received the votes of ten Ohio mem-bers in the House election with Jackson and Crawford each receiving two.
Illinois and Maryland each chose their electors by district. The Illinoiselectorate split its statewide popular vote four ways, with Adams receiving33 percent of the vote, Jackson 27 percent, Clay 22 percent, and Crawford
Jersey is notably absent from this list. See THE MISSOURI COMPROMISES, supra note 118, at 134.A few days earlier, John Quincy Adams recorded Secretary of the Navy and former New JerseySenator Samuel Southard telling him that three of New Jersey’s representatives favored Adams. 6ADAMS MEMOIRS, supra note 12, at 470–71. A month after the election, Stephen Van Rensselaer Rwrote to DeWitt Clinton that “New Jersey and Indiana would in a second or third ballot have goneover to Adams.” William B. Fink, Stephen Van Rensselaer and the House Election of 1825, 32(3)N.Y. HIST. 323, 329 (1951) (quoting Stephen Van Rensselaer to DeWitt Clinton, March 10, 1825.DeWitt Clinton Papers).
173. MOONEY, supra note 126, at 296–99. R174. Plumer Jr. wrote to his father that the Virginia delegation would vote for Crawford on the
first two or three ballots, and then for Adams. Letter from William Plumer Jr. to William Plumer(Dec. 24, 1824), in THE MISSOURI COMPROMISES, supra note 118, at 124. Also, that it would nevervote for Jackson. Id. at 134.
175. For Scott, see Alan S. Weiner, John Scott, Thomas Hart Benton, David Barton and thePresidential Election of 1824, 60 MO. HIST. REV. 460 (1966).
176. See Letter from William T. Barry to Clay (January 10, 1825), in 4 CLAY PAPERS, supranote 117, at 11.

\\jciprod01\productn\U\UST\15-1\UST105.txt unknown Seq: 61 4-JAN-19 11:35
2018] THE THREE-FIFTHS RULE 219
18 percent. Daniel Cook, Illinois’ sole member of the House, voted for Ad-ams in the House election. Adams and Jackson each captured 44 percent ofMaryland’s popular vote with Crawford and Clay receiving 10 percent and2 percent respectively. However, Jackson won seven of the state’s elevenelectoral votes while Adams won only three and Crawford one. Adams nar-rowly earned Maryland’s vote in the House election capturing the votes offive of its nine members with Jackson getting three and Crawford one. Allthree of these states are classified as in play by virtue of their close popularvotes.177
Six legislatures chose their state’s presidential electors. The legisla-tures in South Carolina, Vermont, and Georgia selected electors who votedunanimously for Jackson, Adams, and Crawford respectively. The Housedelegations from these states voted in a similar unanimous fashion in theHouse election. Therefore, these states are classified as being firmly forJackson, Adams, and Crawford respectively.
Delaware’s legislatively chosen electors cast two electoral votes forCrawford and one for Adams. However, Louis McLane, the state’s solerepresentative, was well known to be a friend of Crawford.178 For this rea-son, Delaware is classified as firmly for Crawford. Clay’s accidents in Loui-siana and New York have already been recounted.179 Adams barely won thevotes of these states in the House election. He received the votes of two ofLouisiana’s representatives with Jackson getting the third. New York’s votein the House election went to Adams at the last moment when Stephen VanRensselaer provided the crucial eighteenth vote180 to achieve an absolutemajority over Crawford, who received fourteen votes, and Jackson who re-ceived two. Had Van Rensselaer cast his ballot for Crawford or Jackson, theNew York delegation would have been divided. Clearly, Louisiana andNew York were in play.
Table 41 summarizes the classifications just made.
177. On December 15, 1824, John Quincy Adams noted that “Cook has just come from Illi-nois, and mentioned the result of the election of Presidential electors there. He says it leaves himat perfect liberty to vote in the House as he should think best for the public interest.” 6 ADAMS
MEMOIRS, supra note 12, at 444. R178. Letter from William Plumer Jr. to William Plumer Sr. (Dec. 25, 1824), in THE MISSOURI
COMPROMISES, supra note 118, at 125.179. See supra Part III.A.1.180. See Fink, supra note 172.

\\jciprod01\productn\U\UST\15-1\UST105.txt unknown Seq: 62 4-JAN-19 11:35
220 UNIVERSITY OF ST. THOMAS LAW JOURNAL [Vol. 15:1
TABLE 41 CLASSIFICATION OF STATES, ACTUAL HOUSE
ELECTION OF 1825
Category Count States
Firmly for Jackson 5 Alabama, Mississippi, Pennsylvania, South Carolina, Tennessee
Leaning to Jackson 2 Indiana, New Jersey
Firmly for Adams 5 Connecticut, Maine, Massachusetts, New Hampshire, Vermont
Leaning to Adams 1 Rhode Island Firmly for Crawford 3 Delaware, Georgia, Virginia
In Play 8 Illinois, Kentucky, Louisiana, Maryland, Missouri, New York, North Carolina, Ohio
Of course, Henry Clay helped to deliver seven of the eight states inplay to John Quincy Adams on the first ballot, giving Adams the minimumthirteen states needed to secure the presidency in the House election.
2. The 1825 House Election with Clay Instead of Crawford
Had Clay’s name rather than Crawford’s been before the House, thencertainly the states marked as firmly for Crawford would have been in play,and the in play states that had unanimously given their electoral votes toClay would have been firmly for Clay.181 As a result, Table 42 representsthe likely starting point for a three-way contest among Adams, Jackson, andClay.
181. Ohio was initially classified as in play by virtue of its close popular vote. Representativeand future President James Buchanan, who voted for Jackson, explicitly noted that Clay controlledthe vote of the Ohio delegation in the three-way contest including Crawford. Letter from JamesBuchanan to Thomas Elder (Jan. 2, 1825), in 1 THE WORKS OF JAMES BUCHANAN: COMPRISING
HIS SPEECHES, STATE PAPERS, AND PRIVATE CORRESPONDENCE 120 (John Bassett Moore ed.)(1908) [hereinafter “WORKS OF JAMES BUCHANAN”].

\\jciprod01\productn\U\UST\15-1\UST105.txt unknown Seq: 63 4-JAN-19 11:35
2018] THE THREE-FIFTHS RULE 221
TABLE 42 CLASSIFICATION OF STATES, HYPOTHETICAL HOUSE
ELECTION OF 1825
Category Count States
Firmly for Jackson 5 Alabama, Mississippi, Pennsylvania, South Carolina, Tennessee
Leaning to Jackson 2 Indiana, New Jersey
Firmly for Adams 5 Connecticut, Maine, Massachusetts, New Hampshire, Vermont
Leaning to Adams 1 Rhode Island Firmly for Clay 3 Kentucky, Missouri, Ohio
In Play 8 Delaware, Georgia, Illinois, Louisiana, Maryland, New York, North Carolina, Virginia
Shortly before he learned his ultimate fate in the actual three-fifths ruleElectoral College, Clay wrote to Francis Brooke, Chief Justice of the Vir-ginia Supreme Court of Appeals,182 that even if he nosed out Crawford forthird place, “I shall enter the H. so crippled that my election can scarcely beanticipated.”183 Nevertheless, with the prize so near, Clay would likely nothave abandoned his quest in the no-fifths rule Union despite the accidentshe had suffered in New York and Louisiana. When Clay returned to theHouse at the beginning of the Eighteenth Congress in 1823, he easilywrested the Speaker’s chair from incumbent Philip Barbour with a first bal-lot vote of 139–42.184 In contrast, two years earlier it took Barbour twelveballots to win the speakership in Clay’s absence.185
Of course, the present analysis can only entertain conjecture about howthe Eighteenth House would have voted for president had it been able tovote for its Speaker, Henry Clay, rather than William Crawford, in a three-way contest with Andrew Jackson and John Quincy Adams. With the insti-tutional advantages of the Speaker’s chair, Clay might have been able towin the House election. He surely could have forced it to go more than oneballot.186
Certainly, Clay had a good chance of winning the four states that votedfor Crawford in the actual House election. New Hampshire representative
182. Brooke served on the Virginia Supreme Court of Appeals from 1811 until his death in1851. For Brooke, see 2 ENCYCLOPEDIA OF VIRGINIA BIOGRAPHY 62 (Lyon Gardiner Tyler ed.1915); Brooke’s older brother Robert was of one of Henry Clay’s law teachers. DAVID S. HEIDLER
& JEANNE T. HEIDLER, HENRY CLAY: THE ESSENTIAL AMERICAN 23–24 (2010).183. Letter from Clay to Brooke (Nov. 16, 1824), in 3 CLAY PAPERS, supra note 117, at 888.
For a similar remark made to Clay see Peter Porter’s letter of January 14, 1825. 4 Id. at 17.184. 41 ANNALS OF CONG. 795 (1823).185. 38 ANNALS OF CONG. 516 (1821).186. For a much less optimistic view of Clay’s prospects, had his name rather than Crawford’s
been before the House, see RATCLIFFE 1824, supra note 169, at 229–58, especially 235–37.

\\jciprod01\productn\U\UST\15-1\UST105.txt unknown Seq: 64 4-JAN-19 11:35
222 UNIVERSITY OF ST. THOMAS LAW JOURNAL [Vol. 15:1
William Plumer Jr. wrote to his father that Virginia’s delegation wouldnever vote for Jackson nor would Delaware’s sole Representative LouisMcLane187—assertions corroborated in Adams’s Memoirs.188 Buchananwrote to Elder that neither North Carolina nor Georgia would vote for Ad-ams,189 and North Carolina had indeed deserted Jackson for Crawford.Buchanan also described Clay as having influence on Louisiana’s delega-tion,190 which would have had only two members under a no-fifths ruleapportionment.191
Whether Clay could have won the votes of the larger delegations fromMaryland and New York is another matter.192 If Clay won Delaware, Geor-gia, Louisiana, North Carolina, and Virginia, he would have been at least onpar with Adams and Jackson in the early ballots. With eight states in hiscolumn, Clay might have been able to add Maryland and New York to hislist leaving him three states short of the thirteen required for election.Rhode Island’s two-member delegation might have been ripe for Clay’spersuasions. So might New Jersey’s delegation, which would have had be-tween six and nine members under a no-fifths rule apportionment.193
Christopher Rankin, the only representative from Mississippi, mighthave been the object of intense lobbying.194 It is even possible that Illinois’lone member, Daniel Cook, who bore a grudge against Clay for thespeaker’s role in the House investigation of Cook’s father-in-law, SenatorNinian Edwards, would have voted for his fellow westerner Clay.195
Three weeks before the House election, Daniel Webster wrote hisbrother Ezekiel and asked, “Is it advisable, under any circumstances, tohold out and leave the chair to Mr. Calhoun? Would or would not NewEngland prefer conferring the power on Calhoun, to a choice of General
187. See Letter from William Plumer Jr. to William Plumer (Dec. 25, 182) in THE MISSOURI
COMPROMISES, supra note 118, at 125–26; Letter from William Plumer Jr. to William Plumer(Jan. 24, 1825), in THE MISSOURI COMPROMISES, supra note 118, at 134–36.
188. For Virginia, see Notes of a conversation with Virginia Senator James Barbour (January13, 1825), in 6 ADAMS MEMOIRS, supra note 12, at 467. For Delaware, see Notes of a conversa- Rtion with Massachusetts representative Henry Dwight (February 2, 1825). Id. at 490.
189. WORKS OF JAMES BUCHANAN, supra note 181, at 121.190. Id. at 120.191. With a free population of 84,343, Louisiana would not receive a third House seat for any
ratio of representation above 1:28,114.192. Willie Mangum described Clay as holding the votes of Maryland and New York in his
hands. Letter from Mangum to Duncan Cameron (Jan. 25, 1825), in THE PAPERS OF WILLIE PER-
SON MANGUM, supra note 121, at 174. However, this most likely concerned Clay’s ability to tipthe scale between candidates with nearly equal backing in each of these delegations.
193. With a census count of 270,018, New Jersey would have had nine representatives with aratio of representation as low as 1:30:000.
194. Rankin, who voted for Jackson, had meetings with Adams on December 15 and 29, 1824.6 ADAMS MEMOIRS, supra note 12, at 442, 455. R
195. For the grudge, see MARY W. M. HARGREAVES, THE PRESIDENCY OF JOHN QUINCY AD-
AMS 39 (1985). Remini suggests that Cook might have been bribed to vote for Adams. REMINI,CLAY, supra note 26, at 264 n.43.

\\jciprod01\productn\U\UST\15-1\UST105.txt unknown Seq: 65 4-JAN-19 11:35
2018] THE THREE-FIFTHS RULE 223
Jackson?”196 Perhaps the Eighteenth House would have expired withoutmaking a choice, thereby forcing newly elected Vice President John Cal-houn to “act as president.”197 An unresolved stalemate in the EighteenthHouse would have left the presidential election to its successor, whose firsttask would be to organize itself and choose a Speaker.
There are many scenarios in which John Quincy Adams would nothave been inaugurated on March 4, 1825.198 The nation might have had anacting president. The Age of Jackson might have commenced four yearsearlier. Henry Clay might have been elected after having received approxi-mately 13 percent of the popular vote and just a handful of electoral votesin the states whose legislatures chose their electors. Would this have beenthe presidential game of faction envisioned by George Mason?199
IV. CONCLUSION
This Article has been an essay in both actual history and virtual his-tory.200 Each informs the other and each has its own challenges.
196. Letter from Daniel Webster to Ezekiel Webster (Jan. 18, 1825), in 2 THE PAPERS OF
DANIEL WEBSTER: CORRESPONDENCE 14 (1974). Webster was not the only one to realize that astalemate would make John Calhoun acting president. In his entry for December 22, 1824, JohnQuincy Adams recorded a conversation with Virginia Senator James Barbour who “thought itwould be treason to the Constitution to hold out and prevent an election by the House until the 4thof March, so as to give the actual Presidency to the Vice-President.” 6 ADAMS MEMOIRS, supranote 12, at 450–51. Amos Kendall wrote to Clay that he “would sooner vote for any of the three Rthan have a Viceregent for four years.” Letter from Amos Kendall to Henry Clay (Jan. 21, 1825),in 4 CLAY PAPERS, supra note 117, at 35. R
197. “And if the House of Representatives shall not choose a President whenever the right ofchoice shall devolve upon them, before the fourth day of March next following, then the Vice-President shall act as President, as in the case of the death or other constitutional disability of thePresident.” U. S. CONST. amend. XII. (Superseded by U. S. CONST. amend. XX, § 3).
198. Jenkins and Sala analyzed the charge that Adams’s election by the Eighteenth Houseresulted from the corrupt bargain of making Clay his secretary of state. They conclude that “Ad-ams’s victory and profile of support were consistent with the sincere voting model and did notsupport the corrupt-bargain hypothesis.” Jeffery A. Jenkins & Brian R. Sala, The Spatial Theory ofVoting and the Presidential Election of 1824, 42(4) AM. J. POL. SCI. 1157 (Oct. 1998). ProfessorJenkins has written to me that they did not analyze a three-way election involving Clay rather thanCrawford. He wrote “my hunch would be that there would not have been a first ballot winner.Clay and Adams had very similar voting records, and thus had very similar NOMINATE scores,so they would have split the Adams vote in the real-world House election. This would have helpedJackson, as would Crawford not being in the race, but I doubt it would have been enough to getJackson a first ballot majority.” (Email correspondence on file with author.) Jenkins’ conjecture isbased exclusively on voting records in the Eighteenth House and does not consider the institu-tional advantages Clay would have reaped as Speaker of the House.
199. At the Convention, Mason suggested that nineteen times out of twenty the Electoral Col-lege would fail to produce a victor. THE RECORDS OF THE FEDERAL CONVENTION OF 1787, supranote 23, at 500. By the time of the Virginia ratifying convention, Mason raised the likelihood to Rforty-nine times out of fifty. 3 ELLIOT’S DEBATES, supra note 28, at 493. For the phrase “the Rgame of faction,” see RICHARD P. MCCORMICK, THE PRESIDENTIAL GAME 5 (1982).
200. Others might prefer the term “counterfactual history” to “virtual history.” The term “vir-tual history” is taken from Niall Ferguson, Virtual History: Towards a ‘Chaotic’ Theory of thePast, in VIRTUAL HISTORY: ALTERNATIVES AND COUNTERFACTUALS 1 (Niall Ferguson ed.) (1997).

\\jciprod01\productn\U\UST\15-1\UST105.txt unknown Seq: 66 4-JAN-19 11:35
224 UNIVERSITY OF ST. THOMAS LAW JOURNAL [Vol. 15:1
In the actual election of 1824, one of Henry Clay’s accidents occurredwhen three New York electors defected away from him. Writing the actualhistory of this episode, one commentator has written “It is futile to guesswhat took place.”201 Another has written “Probably no one will ever knowexactly what happened.”202 Perhaps a hitherto undiscovered document willsurface that will enable a future generation of historians to resolve thisissue.
Writing virtual history has a different challenge: distinguishing plausi-ble unrealized alternatives from implausible unrealized ones. Historian Ni-all Ferguson has recognized this challenge and proposed a response.
How exactly are we to distinguish probable unreali[z]ed al-ternatives from improbable ones? The most frequently raised ob-jection to the counterfactual approach is that it depends on ‘factswhich concededly never existed’. Hence, we simply lack theknowledge to answer counterfactual questions. But this is not so.The answer to the question is in fact very simple: We should con-sider as plausible or probable only those alternatives which wecan show on the basis of contemporary evidence that contempo-raries actually considered.203
This is valuable advice for assessing claims made about the impact of thethree-fifths rule on the outcome of presidential elections.
This article rests on detailed historical knowledge in two areas. Thefirst is a detailed knowledge of the actual apportionment of the House ofRepresentatives at the Convention, by Congress in 1791–1792, and in 1822.The second is the gold mine of data available at A New Nation Votes, a dataset that Gordon Wood has described as “monumental” and “[i]ndispensablefor understanding politics in the early Republic.”204
Freehling et al. may declare unproblematically that in the actual elec-tion of 1800, Jefferson owed a dozen or so of his seventy-three electoralvotes to the three-fifths rule, compared to only two or so for Adams. That isa matter of actual history based on the actual apportionment made by Con-gress in 1791–1792205 and the choice of presidential electors made in 1800under that apportionment.206
It is quite another matter, however, to assert that Jefferson owed hiselection to the three-fifths rule. That is a matter informed by virtual history.It is an assertion that Adams would have defeated Jefferson in 1800 in a no-fifths rule Union, a matter of virtual history.
201. REMINI, VAN BUREN, supra note 123, at 82. See supra note 126 and accompanying text.202. MOONEY, supra note 126, at 294–95 n.63. See supra note 126 for the full passage.203. Ferguson, supra note 200, at 86. (emphasis in original).204. Gordon S. Wood, Empire of Liberty: A History of the Early Republic, 1789–1815, at 745
(2009).205. See supra Part II.B.1.206. For the actual results, see 10 ANNALS OF CONG. 1024 (1801).

\\jciprod01\productn\U\UST\15-1\UST105.txt unknown Seq: 67 4-JAN-19 11:35
2018] THE THREE-FIFTHS RULE 225
Had the Constitutional Convention adopted a no-fifths rule, the elec-tion of 1800 would not have been the first point of impact for that majoralteration in American history. If the Convention had adopted a no-fifthsrule, that decision would have impacted the apportionment of the House ofRepresentatives at the Convention itself in 1787 and by the Second Con-gress in 1791–1792. That leaves two key unknowns: whether the minimalratio of representation in Article I, Section 2 would have been 30,000 orsomething less, and what ratio would have been adopted by the SecondCongress. There is no way to determine with certainty what these ratioswould have been in a no-fifths rule Union.
However, it is possible to know with certainty what ratio of representa-tion would not have been adopted by the Second Congress in 1792. Itwould not have been 1:33,000 as supposed by Freehling et al. Congressadopted that ratio because it minimized total remainders in a three-fifthsrule Union.207 For the very same reason, Congress would not have adoptedthat ratio in a no-fifths rule Union.208 Nor would the House size have been105 members in a no-fifths rule Union as Weston suggests.209 The SecondCongress treated total House size as an output, not an input. The SecondCongress never considered an apportionment method that began with a tar-get House size.
The electoral votes from Maryland and North Carolina present similarchallenges for a virtual history of the 1800 election in a no-fifths ruleUnion. In those cases in which the state legislature adopted a districtingplan for some number of electors or representatives in the early to middle1790s, it is reasonable to suppose such a plan would have been in place forthe same number of presidential electors in the state in a no-fifths ruleUnion.210 No such districting plan is available for North Carolina when it isapportioned eleven or thirteen electors. In such cases, a viable alternative isto consider a wide variety of districting plans generated by software basedon a reasonable set of specifications.211
Not surprisingly, this results in a set of probabilities. Jefferson wins theelection with some apportionments nationwide and in North Carolina. Ad-ams wins with the rest. In virtual histories such as the one presented herefor the election of 1800, the most that can be said is that in a non-trivialpercentage of cases, one outcome follows; in another, non-trivial percentageof cases, a different outcome follows.
207. See supra text accompanying Table 7 and Table 8.
208. See supra text accompanying Table 9 through Table 12.
209. See supra note 114. All apportionment methods considered began with a ratio of repre-sentation that was a multiple of 1,000. A House size of 105 could only have been possible for aratio of between 28,437 and 28,507 inclusive.
210. See supra text accompanying notes 103, 104, and 106. R
211. See supra text accompanying notes 109 and 110. R

\\jciprod01\productn\U\UST\15-1\UST105.txt unknown Seq: 68 4-JAN-19 11:35
226 UNIVERSITY OF ST. THOMAS LAW JOURNAL [Vol. 15:1
A virtual history of the election of 1824–1825 presents a different setof challenges. Determining the outcome of the electoral vote in this electiondoes not critically depend on how the Congress resized the House in 1822.Instead, it demands careful analysis of how the precise size of the Houseimpacts the number of electoral votes won by Henry Clay and WilliamCrawford in states that did not adopt the unit rule and chose electors whovoted for one or the other of them: Delaware, Maine, Maryland, and NewYork.
Maine and Maryland chose electors by district in 1824. Projecting howthese states might have drawn a different number of districts in 1824 beginswith understanding the history of how they drew the actual districts.212
With that actual history in hand, it is possible to project a virtual history ofhow they might have drawn a different number of districts in 1824, makingsure always to give Crawford any possible advantage over Clay in doubtfulcases.213 A similar rule advantaging Crawford over Clay applies when pro-jecting how the Delaware and New York legislatures might have chosen analternate number of electors.214
Making sure that Clay never benefits at Crawford’s expense from anychoices made in this virtual history enables the conclusion that in a no-fifthsrule Union, Clay finishes in third place in the electoral vote, ahead of Craw-ford. This can be known with certainty.
The outcome of a contingent House election of 1825 with the choice ofHenry Clay available is another matter. The late historian Robert Remini,an authority on the era of Adams, Clay, and Jackson, adopted an air ofcertainty when he wrote “In that case [Clay] would have been elected Presi-dent—unquestionably.”215
This Article addresses a different issue than the one addressed byRemini. He addressed the issue of whether Henry Clay would have beenchosen in the House contingent election if his name rather Crawford’s hadbeen in the mix. This Article asks whether a good case can be made thatJohn Quincy Adams owed his election to the three-fifths rule. The articlehas demonstrated that in a no-fifths rule Union, Clay rather than Crawfordwould have been the third candidate before the House.
With Speaker Henry Clay as one of three candidates for the presi-dency, the dynamics of the House election would have been very different.The lame duck Eighteenth House might still have elected John Quincy Ad-ams president, but it might also have elected Henry Clay or Andrew Jack-son instead. It might even have stalemated and been unable to make achoice in the twenty-three days remaining in its session. Vice President
212. See supra text accompanying notes 136 through 143 and notes 151 through 166. R213. See supra text accompanying Table 28 through Table 30 and Table 35 through Table 37.214. See supra text accompanying note 133 and Table 38.215. REMINI, CLAY, supra note 26, at 250.
\\jciprod01\productn\U\UST\15-1\UST105.txt unknown Seq: 69 4-JAN-19 11:35
2018] THE THREE-FIFTHS RULE 227
John Calhoun might have become acting president on March 4, 1825. Aplausible argument can be made that the House would not have electedJohn Quincy Adams.
Actual history and virtual history inform each other.