Embed Size (px)
Citation preview
Journal of Physical and Chemical Reference Data 14, 227 (1985); https://doi.org/10.1063/1.555749 14, 227
© 1985 American Institute of Physics for the National Institute of Standards and Technology.
The Thermal Conductivity of Fluid AirCite as: Journal of Physical and Chemical Reference Data 14, 227 (1985); https://doi.org/10.1063/1.555749Published Online: 15 October 2009
K. Stephan, and A. Laesecke
ARTICLES YOU MAY BE INTERESTED IN
Viscosity and Thermal Conductivity of Dry Air in the Gaseous PhaseJournal of Physical and Chemical Reference Data 14, 947 (1985); https://doi.org/10.1063/1.555744
Flash Method of Determining Thermal Diffusivity, Heat Capacity, and Thermal ConductivityJournal of Applied Physics 32, 1679 (1961); https://doi.org/10.1063/1.1728417
Thermodynamic Properties of Air and Mixtures of Nitrogen, Argon, and Oxygen From 60 to2000 K at Pressures to 2000 MPaJournal of Physical and Chemical Reference Data 29, 331 (2000); https://doi.org/10.1063/1.1285884
The Thermal Conductivity of Fluid Air
K. Stephan and A. Laeseckea)
lnstitut!ur Technische Thermodynamik und Thermische Verfahrenstechnik, Universitiit Stuttgart, P. O. Box 80 1140, D 7000 Stuttgart-80, Federal Republic of Germany
Based on available experimental data, the thermal conductivity of fluid air has been critically evaluated. A new set of recommended values is presented covering a pressure range from 1 to 1000 bar and a temperature range from 70 to 1000 K. Using the concept of residual thermal conductivity the recommended values are described by a 13-parameter equation of statein terms of temperature and density which may be applied up to a density of900kg/m3
• From comparisons of all data sources, the uncertainty of the recommended. values was estimated to be below ± 4%. Additional experiments are needed, especially in the subcritical region ofliquid air.
Key words: air; fluid region; interpolating equation; recommended values; thermal conductivity.
Contents 1. 2. 3.
Introduction .................................................... . 227 6. Thermodynamic Key Values ......................... .. 227 Thermal Conductivity ..................................... . 228 3.1. Dilute Gas Thermal Conductivity ......... . 228 1. 3.2. Residual Thermal Conductivity ............. . 231
4. 5.
Estimation of Uncertainty .............................. . 231 2. Acknowledgments ........................................... . 234
1. Introduction
Air is one of the technologically most important substances. Reliable values of its thermophysical properties are therefore very often needed.
There exists a vast literature on the thermal and caloric properties of air. Based on a collection of these data, Baehr and Schwierl established a set of equations of state. However, Baehr and Schwier did not treat the transport properties of air, which had been measured only in a very limited range prior to 1961. The first compilation of thermal conductivity data in the fluid region of air was given in the books ofVassermann.2
•3 Touloukian4 restricted his compilation to
the thermal conductivity at atmospheric pressure. In 1975, VargaftikS published a data set covering a broad range of fluid states. Unfortunately this set contained inconsistencies because, in some cases, two different thermal conductivity val11e.~ were given for the same point of ~tate. These ambiguities were eliminated in a revised version which was published in 1978.6 However, after the first appearance ofVargaftik's work in 1971 many new experiments were published, which were not considered in the revised edition.
Recent experiments on the thermal conductivity of air give rise to a reexamination of the available data. As a result
aJInstitut fUr Fluid- und Thermodynamik, Universitiit-GH Siegen, P. O. Box 21 0209, D 5900 Siegen 21, F.R.G.
© 1985 by the U.S. Secretary of Commerce on behalf of the United States. This copyright is assigned to the American Institute of Physics and the American Chemical Society. Reprints available from ACS; see Reprints List at back of issue.
0047-2689/85/010227 .. 08/$05.00 227
References ....................................................... .
List of Tables
Skeleton table of the recommended data set. Thermal conductivity [m W l(m.K)] of air ........ Comparison of the recommended dataset with other sources and compilations ...................... ..
234
230
232
of this analysis, a new set of recommended values has been compiled which was used to establish an equation of state for the thermal conductivity of fluid air. The new data set is consistent with thermal and caloric properties with regard to the phase equilibrium curve. Its accuracy has been assessed by comparisons with all data sources.
2. Thermodynamic Key Values Air is a mixture and not a pure fluid. Hence its vapor
pressure curve consists of a bubble and a dew line (Fig. 1). In the critical region, one has to distinguish between a point of maximum pressure Pmax and a point of maximum temperature T max' The point Pmax separates the bubble line from the . dew line, whereas the point T max is referred to as the critical point. Its coordinates were taken from the book of Baehr and Schwierl
Pc = 37.663 bar,
Tc = 132.52 K,
Pc = 313 kg/m3• (1)
The dew and bubble points were also calculated from the correlations established by Baehr and Schwier. The equation of the dew line reads
10gpR =Al +A2ITR +A3(1 - ~1 - TR )eA4(1-l/T
R),
(2)
with the coefficients
Al = 2.532 93, A2 = - 2.539 01,
A3 = 0.006 09, A4 = 271.6.
J. Phys. Chem. Ref. Data, Vol. 14, No.1, 1985
228 K. STEPHAN AND A. LAESECKE
with
A similar relationship holds for the bubble line:
10gpR =B1 +B2/TR + 10-3
X(3 + B3 ~B4 + I/TR ) eBs(B6+ 1ITR
), (3)
BI = 2.2997, B2 = - 2.301 16,
B3 = 75.0893, B4 = - 1.000 53,
Bs = - 41.503, B6 = - 1.000 755.
In both equations pressure and temperature are expressed in reduced form,PR = plpc and TR = T ITc' There is good agreement between these data and the corresponding values given by Vassermann.2,3
3. Thermal Conductivity A total of 3) publications was found in the literature
devoted to the thermal conductivity of air, but 15 of them had to be omitted from the analysis because they contain either less than three data points or because they report data only in small diagrams that cannot be evaluated with sufficient accuracy. Among the remaining papers which are relevant for an evaluation procedure.2- 22 13 report original measurements while six references were previous data compilations. Naturally, these were not used for the generation of the new set of recommended values but served to estimate its tolerances by comparing it with them.
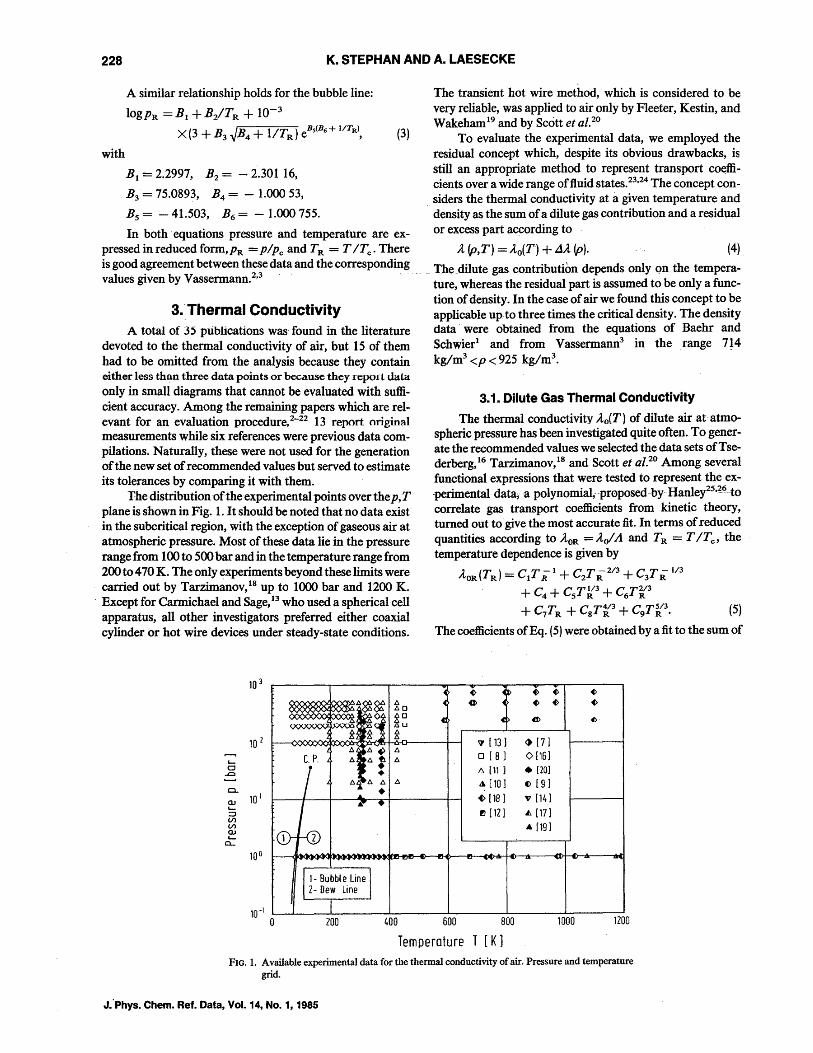
The distribution -oftheexperimentalpoints over the p;T plane is shown in Fig. 1. It should be noted that no data exist· in the subcritical region, with the exception of gaseous air at atmospheric pressure. Most of these data lie in the pressure range from 100 to 500 bar and in the temperature range from 200 to 470 K. The only experiments beyond these limits were carried out by Tarzimanov,18 up to 1000 bar and 1200 K.
. Except for Carmichael and Sage,13 who used a spherical cell apparatus, all other investigators preferred either coaxial cylinder or hot wire devices under steady-state conditions.
10 2
L-a
.c:::.
a. OJ 10 1
L-:::J U"l U"l OJ L-
a...
~~A~~ A 600 ~o
~ ~] .o.u
~~ I. A A~ A
c. P. A A~ A
I • • Ai.A A A
...... . .~
AY •
10°
1 1- Bubble line 1 2- Dew Line
-..,
The transient hot wire method, which is considered to be very reliable, was applied to air only by Fleeter, Kestin, and Wakeham19 and by Scott et al.2°
To evaluate the experimental data, we employed the residual concept which, despite its obvious drawbacks, is still an appropriate method to represent transport co~fficients over a wide range offluid states.23.24 The concept con-
. siders the thermal conductivity at a given temperature and density as the sum of a dilute gas contribution and a residual or excess part according to
A (P,T) = Ao(T) +.dA (P). (4)
The dilute gas contribution depends only Qn the temperature, whereas the residual part is assumed to be only a function of density. In the case of air we found this concept to be applicable upto three times the critical density. The density data were obtained trom the equations of Baehr and Schwier1 and from Vassermann3 in the range 714 kglm3 <p < 925 kglm3• .-
3.1. Dilute Gas Thermal Conductivity
The thermal conductivity Ao(T) of dilute air atatmospheric pressure has been investigated quite often. To generate the recommended values we selected the data sets ofTsederberg,16 Tarzimanov,18 and Scott et al.20 Among several functional expressions that were tested to represent the ex-perimental data,·a polynomial,·proposed-by-Hanley2S,~6to correlate gas transport coefficients from kinetic theory, turned out to· give the most accurate fit. In terms of reduced quantities according to AOR = Ao! A and T R = T lTc, the temperature dependence is given by
AOR(TR) = CIT R 1 + C2T :i 2/3 + C3T:i 113 + C4 + CsT:{3 + C6Ti{3
+ C7TR + CsT::3 + C9Ti{3. (5)
The coefficients ofEq. (5) were obtained by a fit to the sum of
~ ~ ~~ ~ ~ ~
~ G> ~ ~ ~ ~
4l 4 C () .
7 [131 ~ [71 0[8 ] 0[16] A [11] • [20]
~ [10] t> [91 ~[181 v [14]
r:J [12] £. [17]
• [19]
"LO ~ 'V .., - .., - ...
200 ~oo 600 800 1000 1200
Temperature T [K] FIG. 1. Available experimental data for the thermal conductivity of air. Pressure and temperature
grid. .
J."Phys. Chem. Ref. Data, Vol. 14, No.1, 1985
THE THERMAL CONDUCTIVITY OF FLUID AIR 229
100.0
:::.c::: BO.O E A
A
3: 0 [16] E 60.0 ~ [7 ]
t<. A [11]
>-. .t. [10]
:~ 40.0 £. (171
1:3 0 [S]
::::) -0 .., [13] c a • f20] L..)
20.0 V [14]
Cl E L..
(> [18] ClJ () [9] .r:::. - 00 200.0 400.0 600.0 900.0 1000.0 1200.0 1400.0
Temperature T [K]
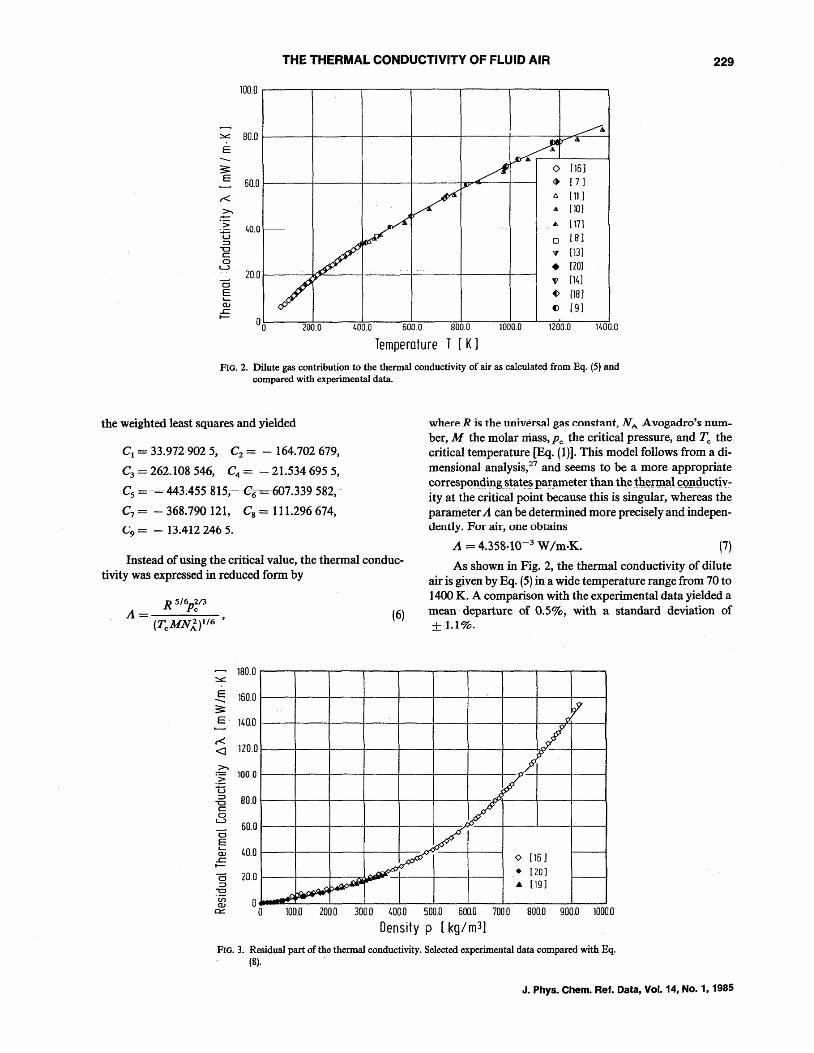
FIG. 2. Dilute gas contribution to the thermal conductivity of air as calculate<:i from Eq. (5) and compared with experimental data.
the weighted least squares and yielded
C1 = 33.9729025, C2 = - 164.702679,
C3 = 262.108546, C4 = - 21.5346955,
Cs =-~·443A55 815;---e6-=-607 .339582,
C7 = - 368.790121, Cg = 111.296674,
C9 = - 13.412246 S.
where R is the universal gas constant, N A Avogadro's number, M the molar mass, Pc the critical pressure, and Tc the critical temperature [Eq. (l)]. This model follows from a dimensional analysis,27 and seems to be a more appropriate ~9!fespon4i~gstat~ l'arameter14;t~.t1:le .t1:l~!1Jl:aJ~!lductiyity at the critical point because this is singular, whereas the parameter A can be determined more precisely and independently. For air, one obtains
A = 4.358.10-3 W /m·K. (7) Instead of using the critical value, the thermal conduc
tivity was expressed in reduced form by As shown in Fig. 2, the thermal conductivity of dilute
air is given by Eq. (5) in a wide temperature range from 70 to 1400 K. A comparison with the experimental data yielded a mean· departure of 0.5%, with a standard deviation of
180.0
!: 160.0 3: E· 140.0
~ 120.0
::::-:~ 100.0
t3 ::::) -0 C a
L..)
o E ClJ
.r:::. -
BO.O
60.0
40.0
C5 20.0 ::::)
"CJ
.~ 0 0:: 0
(6) ± 1.1%.
o~ /
/~
~7 V
.~ / -o [16]
It\. • f20] r---
~ ~ ,,- ..t. ['19]
~ 100.0 200.0 300.0 400.0 500.0 600.0 700.0 800.0 900.0 1000.0
Density p {kg/ m3]
FIG. 3. Residual part of the thermal conductivity. Selected experimental data compared with Eq. (8).
J. Phys. Chern. Ref. Data, Vol. 14, No.1, 1985
230 K. STEPHAN AND A. LAESECKE
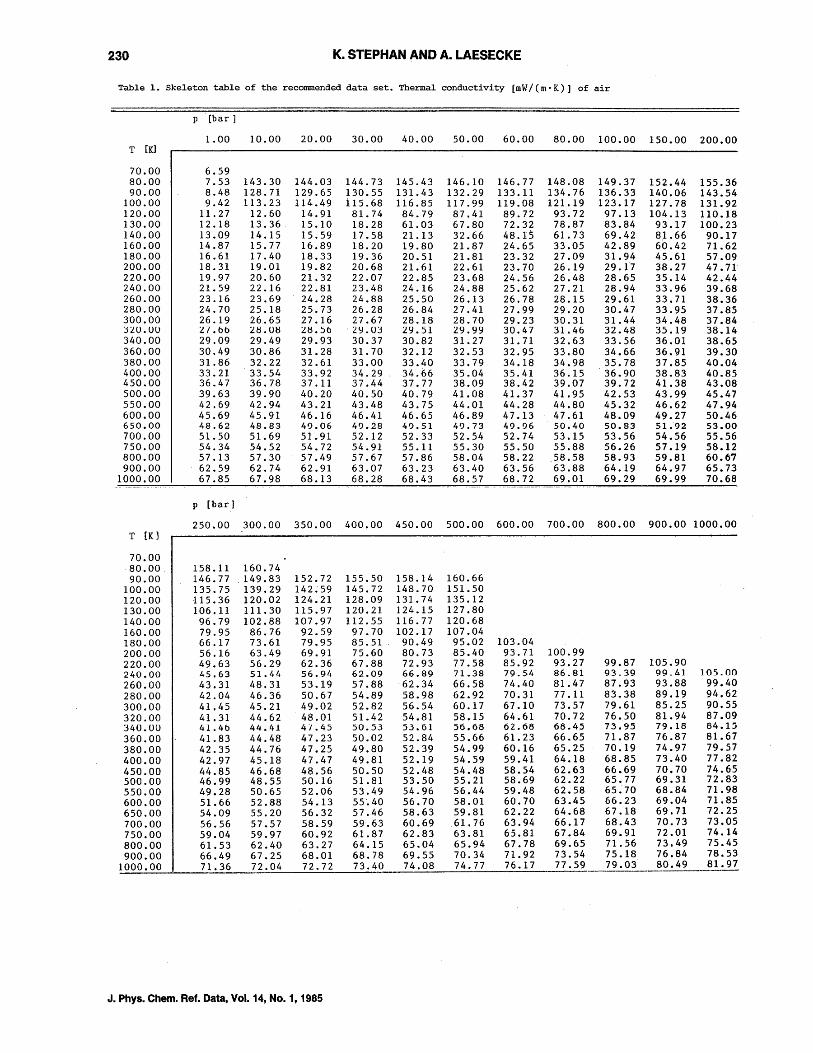
Table 1. Skeleton table of the recommended data set. Thermal conductivity [mW/(m'K)] of air
p [bar]
1.00 10.00 20.00 30.00 40.00 50.00 60.00 80.00 100.00 150.00 200.00 T [K]
70.00 6.59 80.00 7.53 143.30 144.03 144.73 145.43 146.10 146.77 148.08 149.37 152.44 155.36 90.00 8.48 128.71 129.65 130.55 131.43 132.29 133.11 134.76 136.33 140.06 143.54
100.00 9.42 113.23 114.49 i15.68 116.85 117.99 119.08 121.19 123.17 127.78 131.92 120.00 11.27 12.60 14.91 81.74 84.79 87.41 89.72 93.72 97.13 104.13 110.18 130.00 12.18 13.36 15~10 18.28 61.03 67.80 72.32 78.87 83.84 93.17 100.23 140.00 13.09 14.15 15.59 17.58 21.13 32.66 48.15 61. 73 69.42 81.66 90.17 160.00 14.87 15.77 16.89 18.20 19.80 21.87 24.65 33.05 42.89 60.42 71.62 180.00 16.61 17.40 18.33 19.36 20.51 21.81 23.32 27.09 31.94 45.61 57.09 200.00 18.31 19.01 19.82 20.68 21. 61 22.61 23.70 26.19 29.17 38.27 47.71 220.00 19.97 20.60 21. 32 22.07 22.85 23.68 24.56 26.48 28.65 35.14 42.44 240.00 21. 59 22.16 22.81 23.48 24.16 24.88 25.62 27.21 28.94 33.96 39.68 260.00 23.16 23.69 24.28 24.88 25.50 26.13 26.78 28.15 29.61 33.71 38.36 280.00 24.70 25.18 25.73 26.28 26.84 27.41 27.99 29.20 30.47 33.95 37.85 300.00 26.19 26.65 27.16 27.67 28.18 28.70 29.23 30.31 31.44 34.48 37.84 JlU.UU "L7.66 "LB.U8 "L8.56 29.U3 29.51 29.99 30.47 31.46 32.48 35.19 38.14 340.00 29.09 29.49 29.93 30.37 30.82 31. 27 31. 71 32.63 33.56 36.01 38.65 360.00 30.49 30.86 31. 28 31. 70 32.12 32.53 32.95 33.80 34.66 36.91 39.30 380.00 31. 86 32.22 32.61 33.00 33.40 33.79 34.18 34.98 35.78 37.85 40.04 400.00 33.21 33.54 33.92 34.29 34.66 35.04 35.41 36.15 36.90 38.83 40.85 450.00 36.47 36.78 37.11 37.44 37.77 38.09 38.42 39.07 39.72 41.38 43.08 500.00 39.63 39.90 40.20 40.50 40.79 41.08 41. 37 41.95 42.53 43.99 45.47 550.00 42.69 42.94 43.21 43.48 43.75 44.01 44.28 44.80 45.32 46.62 47.94 600.00 45.69 45.91 46.16 46.41 46.65 46.89 47.13 47.61 48.09 49.27 50.46 650.00 48.62 48.83 49.06 49.28 49.51 49.73 49.96 50.40 50.83 51.92 53.00 700.00 51. 50 51.69 51.91 52.12 52.33 52.54 52.74 53.15 53.56 54.56 55.56 750.00 54.34 54.52 54.72 54.91 55.11 55.30 55.50 55.88 56.26 57.19 58.12 800.00 57.13 57.30 57.49 57.67 57.86 58.04 58.22 58.58 58.93 59.81 60.67 900.00 62.59 62.74 62.91 63.07 63.23 63.40 63.56 63.88 64.19 64.97 65.73
1000.00 67.85 67.98 68.13 68.28 68.43 68.57 68.72 69.01 69.29 69.99 70.68
p [bar]
250.00 300.00 350.00 400.00 450.00 500.00 600.00 700.00 800.00 900.00 1000.00 T [K]
70.00 80.00 " 158.11 160.74 90.00 146.77 " 149.83 152.72 155.50 158.14 160.66
100.00 135.75 139.29 142~59 145.72 148.70 151.50 120.00 115.36 120.02 124.21 128.09 131.74 135.12 130.00 106.11 111. 30 115.97 120.21 124.15 127.80 140.00 96.79 102.88 107.97 112.55 116.77 120.68 160.00 79.95 86.76 92.59 97.70 102.17 107.04 180.00 66.17 73.61 79.95 85.51 90.49 95.02 103.04 200.00 56.16 63.49 69.91 75.60 80.73 85.40 93.71 100.99 220.00 49.63 56.29 62.36 67.88 72.93 77.58 85.92 93.27 99.87 105.90 240.00 45.63 51. 44 56.94 62.09 66.89 71.38 79.54 86.81 93.39 99.41 105.00
260.00 43.31 48.31 53.19 57.88 62.34 66.58 74.40 81.47 87.93 93.88 99.40 280.00 42.04 46.36 50.67 54.89 58.98 62.92 70.:31 77.11 83.38 89.19 94.62 300.00 41.45 45.21 49.02 52.82 56.54 60.17 67.10 73.57 79.61 85.25 90.55 320.00 41. 31 44.62 48.01 51.42 54.81 58.15 64.61 70.72 76.50 81.94 87.09 340.UU 41. 46 44.41 4/.45 50.53 53.61 56.68 62.68 68.4.:> 73.9.5 79.18 84. I,:} 360.00 41.83 44.48 47.23 50.02 52.84 55.66 61. 23 66.65 71.87 76.87 81.67 380.00 42.35 44.76 47.25 49.80 52.39 54.99 60.16 65.25 70.19 74.97 79.57 400.00 42.97 45.18 47.47 49.81 52.19 54.59 59.41 64.18 68.85 73.40 77.82 450.00 44.85 46.68 48.56 50.50 52.48 54.48 58.54 62.63 66.69 70.70 74.65 500.00 46.99 48.55 50.16 51.81 53.50 55.21 58.69 62.22 "65.77 69.31 72.83 550.00 49.28 50.65 52.06 53.49 54.96 56.44 59.48 62.58 65.70 68.84 71.98 600.00 51.66 52.88 54.13 55".40 56.70 58.01 60.70 63.45 66.23 69.04 71.85 650.00 54.09 55.20 56.32 57.46 58.63 59.81 62.22 64.68 67.18 69.71 72.25 700.00 56.56 57.57 58.59 59.63 60.69 61. 76 63.94 66.17 68.43 70.73 73.05 750.00 59.04 59.97 60.92 61.87 62.83 63.81 65.81 67.84 69.91 72.01 74.14 800.00 61. 53 62.40 63.27 64.15 65.04 65.94 67.78 69.65 71.56 73.49 75.45 900.00 66.49 67.25 68.01 68.78 69.55 70.34 71.92 73.54 75.18 76.84 78.53
1000.00 71. 36 72.04 72.72 73.40 74.08 74.77 76.17 77.59 79.03 80.49 81.97
J. Phys. Chern. Ref. Data, Vol. 14, NO.1, 1985
THE THERMAL CONDUCTIVITY OF FLUID AIR 231
. 3.2. Residual Thermal Conductivity
The pressure dependence of the thermal conductivity of air has not been investigated as much as the thermal conductivity of the dilute gas region. As the distribution of experi-
. mental data in Fig. 1 reveals, in certain pressure and temperature ranges data do not exist. However, in many cases the residual Concept offers a useful tool to obtain the missing data by extrapolation, provided the concept can be applied and no splitting of the isotherms occurs at higher densities. This can easily be checked when the residual part of all data points is plotted versus density. In cases where a large scatter isobserved,~es~cially at high densities, one may deduce that the residual part is not a function of density alone. In such cases the concept is not applicable in its simple form but requires additional temperature functions.
After careful analysis of the experimental data, the measurements ofTsederberg and Ivanova, 16 Fleeter, Kestin, and Wakeham,19 and Scott et al.20 were selected. Forthe representation of the residual thermal conductivity of these data, a polynomial of 4th degree turned out to be sufficient,
.JAR =D1 PR +D2P~ +D3Pi +D4P~' (8) with the coefficients listed below:
Dl = 3.12013125, D2 = - 2.30762400.101,
D3 = 1.65049430, D4 = - 1.911 481 75.10- 1•
Again,~the.residua1therma1. conductivity-is-reduced-bythe factor A from Eq. (6). We have .JAR =.JA I A, whereas the density was reduced by its critical value PR = pi Pc. Figure 3 presents the residual thermal conductivity according to Eq. (8) and compares calculated values with the selected experimental data. .
By means ofEqs. (5) and (8) representing the new set of recommended values, we calculated a skeleton table for the thermal conductivity of air for given pressures and temperatures (Table 1)_ The spacing of temperatur~ and pressures was chosen in different steps in order to permit a safe interpolation of the values. However, in process design systems,
Temperature T[ KJ
theuse of Eqs. (5) and (8) is recommended for easier computation.
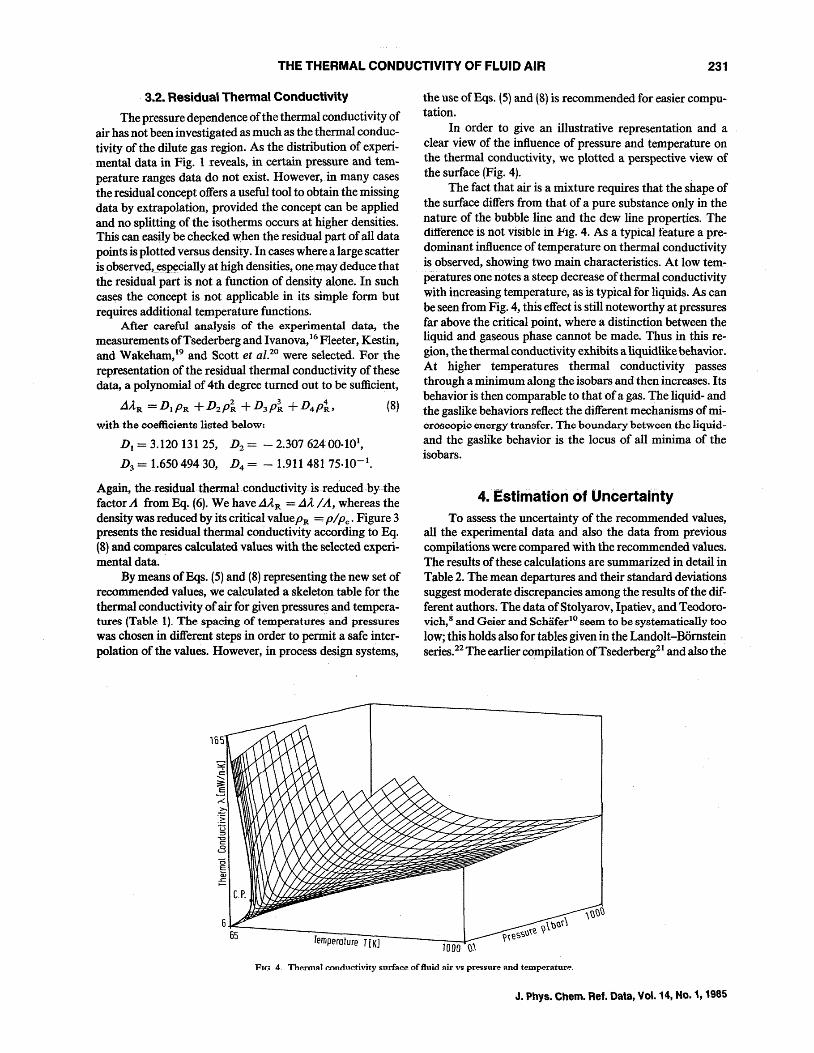
In order to give an illustrative representation and· a clear view of the influence of pressure and temperature on the thermal conductivity, we plotted a perspective view of the surface (Fig. 4).
The fact that air is a mixture requires that the shape of the surface differs from that of a pure substance only in the nature of the bubble line and the dew line properties. The ditference is not visible in Fig. 4. As a typical teature a predominant influence of temperature on thermal conductivity is observed, showing two main characteristics. At low temperatures one notes a steep decrease of thermal conductivity with increasing temperature, as is typical for liquids. As can be seen from Fig. 4, this effect is still noteworthy at pressures far above the critical point. where a distinction between the liquid and gaseous phase cannot be made. Thus in this region, the thermal conductivity exhibits a liquidlike behavior. At higher temperatures thermal conductivity passes through a minimum along the isobars and then increases. Its behavior is then comparable to that of a gas. The liquid- and the gaslike behaviors reflect the different mechanisms of mioroscopio energy transfer. The boundary between the liquidand the gaslike behavior is the locus of all minima of the isobars.
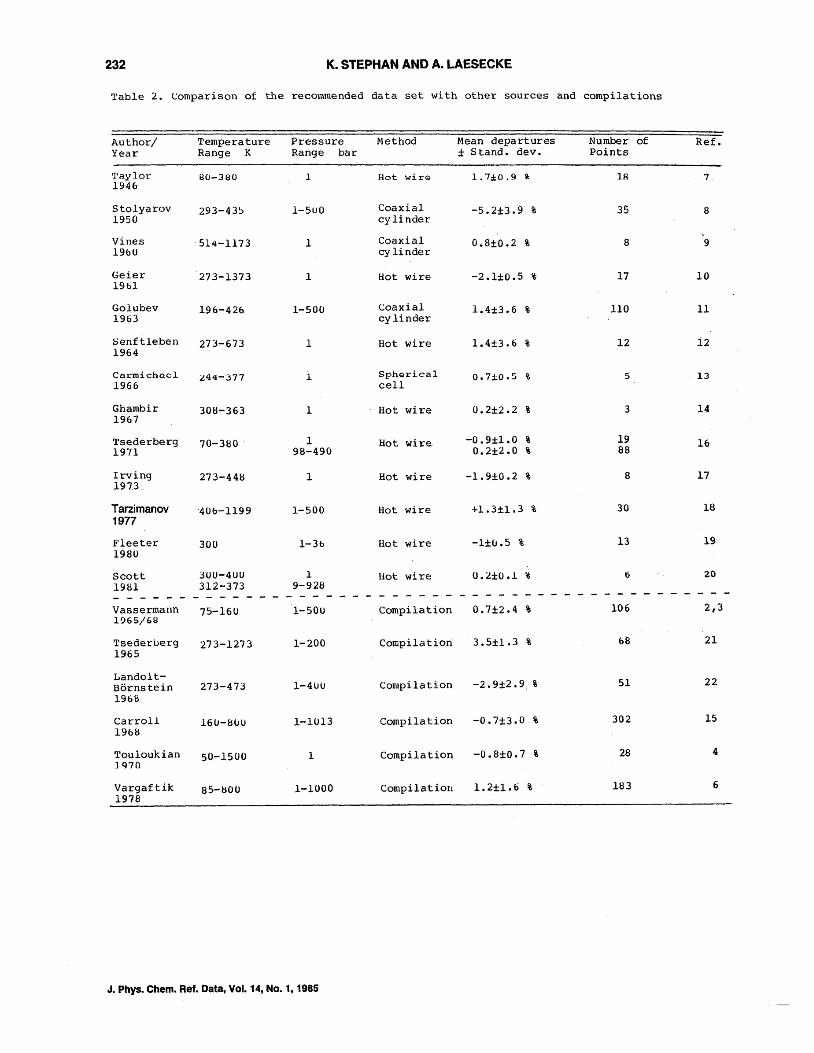
4. Estimation of Uncertahlty To assess the uncertainty of the recommended values,
all the experimental data and also the data from previous compilations were compared with the recommended values. The results of these calculations are summarized in detail in Table 2. The mean departures and their standard deviations suggest moderate discrepancies among the results of the different authors. The data ofStolyarov, Ipatiev, and Teodorovich,8 and Geier and Schiifer10 seem to be systematically too low; this holds also for tables given in the Landolt-Bomstein series.22 The earlier compilation ofTsederberg21 and also the
1000 \),
FIG. 4. Thennal conductivity surface offtuid air vs pressure and temperature.
J. Phys. Chem. Ref. Data, Vol. 14, No.1, 1985
232 K. STEPHAN AND A. LAESECKE
Table 2. comparison of the recommended data set with other sources and compilations
Author/ 'I'emperature Year Range K
Taylor 80-380 1946
Stolyarov 293-43~ 1950
Vines 514-1173 1960
Geier 273-1373 19b1
Golubev 196-426 1963
Senftleben 273-673 1964
Carmichael 244-377 1966
Ghambir 308-363 1967
Tsederberg 70-380· 1971
Irving 273-44B 1973
Tarzimanov '400-1199 1977
Fleeter 300 1980
Scott 300-4UU 1981 312-373
Vassermann 1965/6B
Tsederoerg 1965
LandoltBornstein 1968
Carroll 196B
Touloukian ] Q70
Vargaftik 1978
75-160
273-1273
273-473
16U-BUU
50-1500
8S-BOO
Pressure Range bar
1
I-SUO
1
I
1-500
1
i
1
1 98-490
1
1-500
1-3b
1 9-928
I-SOu
1-200
1-4UU
1-IU13
1
1-1000
J. Phys. Chem. Ref. Data, Vol. 14, No.1, 1985
Method
Hot wire
Coaxial cy 1inder
Coaxial cy linder
Hot wire
Coaxial cylinder
Hot wire
Spherical cell
Hot wire
Hot wire
Hot wire
Hot wire
Hot wire
Hot wire
Mean departures ± Stand. dev.
1.7±O.9 i
-S.2±3.9 %
O.8±0.2 %
-2.1±0.S %
1.4±3.6 %
1.4±3.6 %
O.7±O.S %
0.2±2.2 %
-O.9±1.0 % O.2±2.0 %
-1.9±O.2 %
+1.3±1.3 %
-l±lI.S %
O.2±0.1 ~
Compilation O.7±2.4 %
Compilation 3.S±I.3 %
Compilation -2.9±2.9, %
Compilation -0.7±3.0 %
Compilation -O.S±o.7 %
Compilation 1.2±1.6 %
Number of Points
lR
35
8
17
110
12
5
3
19 88
8
30
13
6
106
68
51
302
28
183
Ref.
7
8
9
10
11
i2
13
14
16
17
18
19
20
2,3
21
22
15
4
6
THE THERMAL CONDUCTIVITY OF FLUID AIR 233
4.0 r--______ ...:...T_=1.:..,.30...;.;.0_K ______ --,
3.0 ~ L 2.0
>-r<o::. 1.0
~ O~~--~c=---=~_v~~~======~~r=~------~ r< -1.0
'0.
r<~ -2.0
6' -3.0 Cl
-4.0
- 5. 00L-----'----L----:'-:----=2...L.:---=-2~---:-~---'"":-----...---' 50 100 150 00 50 300 350 400 450
Pressure p 1 bar]
FIG. 5. Comparison of data from other literature sources with values calculated from the equation of :state propo:sed in tIu:s wock at T = 130 K.
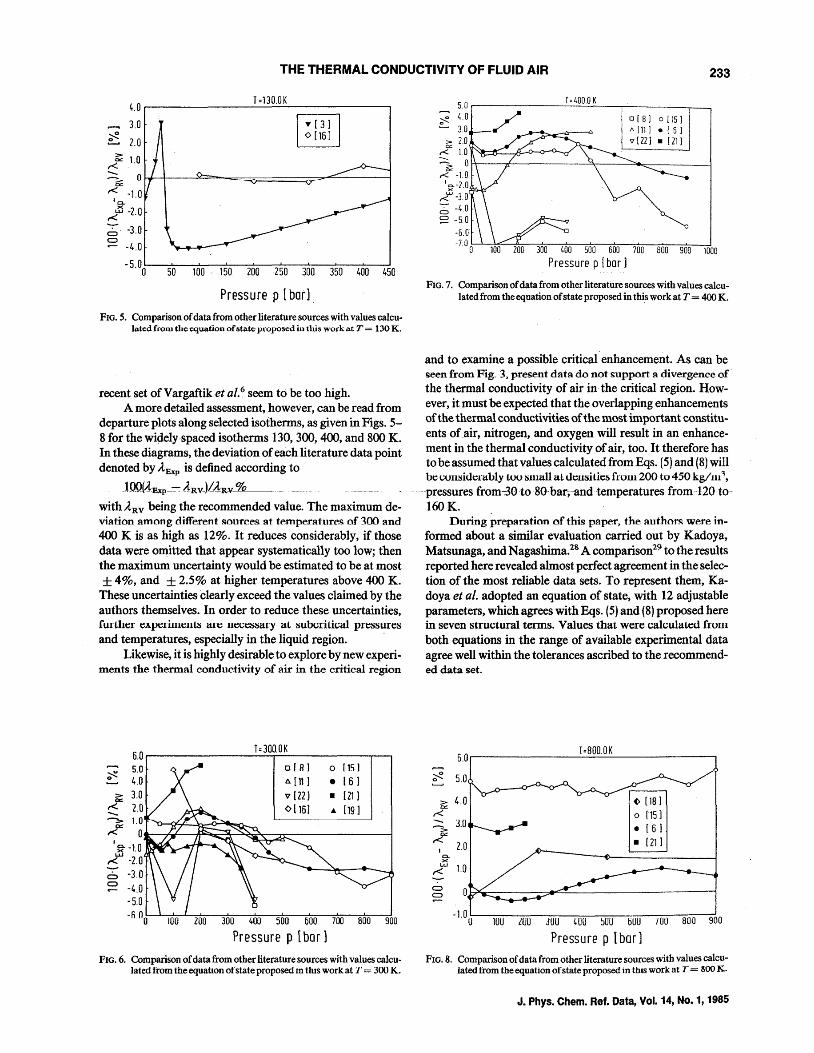
recent set of Vargaftik et al.6 seem to be too high. A more detailed assessment, however, can be read from
departure plots along selected isotherms, as given in Figs. 5-8 for the widely spaced isotherms 130, 300, 400, and 800 K. In these diagrams, the deviation of each literature data point denoted by AExP is defined according to
JOO{4-Bxp_-:-:ARVJLJR¥~%~~-
with ARV being the recommended value. The maximum deviation among different sonrces. at temperatures. of 300 and 400 K is as high as 12%. It reduces considerably, if those data were omitted that appear systematically too low; then the maximum uncertainty would be estimated to be at most ± 4%, and ± 2.5% at higher temperatures above 400 K.
These uncertainties 'clearly exceed the values claimed by the authors themselves. In order to reduce these uncertainties, furtln:r e:::Apt:linumt:s an~ ne:::ct::s:sal'Y at :subcritical pre:::ssures and temperatures, especially in the liquid region. .
Likewise, it is highly desirable to explore by new experiments the thermal conductivity of air in the critical region
6.0 T;300.0K
~ 5.0 o [RJ o [15)
0 4.0 .A [111 • [6 ] ::> 3.0 a:: v [22J • [21 ]
,<. 2.0 <>1161 ... 119] -~ 1.0 ,< 0 ,
~-1.0 LU
-2.0 r< 6 -3.0 Cl -4.0
-5.0
800 900
FIG. 6. Comparison of data from other literature sources with values calculated from the equation of state proposed In thIS work at l' = 300 .K..
5.0 r----______ T_= 4_0_00'-K_----, ____ ---.-~
~ 1,.0 3.0
:> 2.0 ~ 1.0
0[8] 0 [151 A [11] • [6 J 'i7 [22] • [211
~ Ort---~----------~~--~~------~ ~-1.0
10..-20 ,<..J5 .3.'0
6' -4.0 ~ -5.0
-6.0
-7. 0 0!:-'-~~-=--:::*::;-~~--;:-;!-:::~~--;:7;;-;:00:----;:-!80:::-0 ---=-90~0----l1000
FIG. 7. Comparison of data from other literature sources with values calculated from the equation of state proposed in this work at T = 400 K.
and to examine a possible critical' enhancement. As can be seen from Fig. 3, present data do not support a divergence of the thermal conductivity of air in the critical region. However, it must be expected that the overlapping enhancements of the thermal conductivities of the most important constituents of.air, nitrogen, and oxygen will result in an enhancement in the thermal conductivity of air, too. It therefore has to be assumed that values calculated from Eqs. (5) and (8) will be::: cUIlsiue:::l'ably tuu ~mall at ue:::nsitles from 200 to 450 kg/lll '\
--pressures from--;-30t080-bar,--and temperatures from-1-20-to--160K.
During preparation of this paper, the al1tho~ were informed about a similar evaluation carried out by Kadoya, Matsunaga, and Nagashima.28 A comparison29 to the results reported here revealed almost perfect agreement in the selecw
tion of the most reliable data sets. To represent them, Kadoya et al. adopted an equation of state, with 12 adjustable parameters, which agrees with Eqs. (5) and (8) proposed here in seven structural terms. Values that were calculale:::u frum both equations in the range of available experimental data agree well within the tolerances ascribed to the recommendw
ed data set.
~
>-er: r< ->-,<
I 0. x
LU
r<
Cl
S2
5.0
5.0
4.0
3.0
2.0
1.0
-1.0 U
T=BOO.OK
(> [18] o ['15] • [61 • [211
lUU lUU JUU 4UU JUU bUU 700 800 900
Pressure p [bar) FIG. 8. Comparison of data from other literature sources with values calcu
lated from the equation of state proposed in this work at T = 800 K.
J. Phys. Chem. Ref. Data, Vol. 14, No.1, 1985
234 K. STEPHAN ANDA. LAESECKE
5. Acknowledgments We owe sincere thanks to the Deutsche Forschungsge
meinschaft (DFG) for financi~l support. The help of Mr. R. Krauss is gratefully acknowledged. The work described in this paper was performed in consultation with the Subcommittee on Transport Properties of the International Union of Pure and Applied Chemistry (IUP A.C). The authors are indebted to Professor J. Kestin for his valuable suggestions.
6. References IH. D. Baehr and K. Schwier, Die Thermodynamischen Eigenschaften der Luft (Springer, Berlin, 1961). . ..._ ..
2 A. A. Vassermann, Ya. Z. Kazavchinskij, and V. A Rabinovich, Thermophysical Properties of Air amlits Components (Nauka, Moscow, 1966), in Russian.
3A. A. Vasserman and V. A. Rabinovich, Thermophysical Properties of Liquid Air and its Components (Standard. Moscow. 1968). in Russian.
4y. S. Touloukian, P. E. Liley, and S. C. Saxena, Thermophysical Properties of Matter. Vol. 3: Thermal Conductivity. Nonmetallic Liquids and Gases (Plenum, New York, 1970).
sN. B. Vargaftik. Tables on the Thermophysical Properties of Liquids and Gases, 2nd ed. (Hemisphere, Washington~ 1975).
6N. B. Vargaftik, L. P. Filippov, A. A. Tarzimanov, and E. E. Tozkij, Thermal Conductivity of Liquids and Gases (Standard, Moscow, 1978), in Russian.
7W.l. Taylor and H. L. Johnston, J. Chem. Phys. 14,219 (1946). 8E. A. Stolyarov, V. V. Ipatiev, and V. P. Teodorovich, Zh. Fiz. Khim. 24, 166 (1950). ~. G. Vines, Trans. Am. Soc. Mech. Eng. 82, 48 (1960). 1«11. Geier and K. Schafer, Allg. Waermetech. 4, 70 (1961). HI. RGolubev;-Teploenergetika·l0,78 (1963).· 121. H. Senftleben, Z. Angew. Phys. 17,86 (1964,.
J. Phys. Chem. Ref. Data, Vol. 14, No.1, 1985
13L. T. Carmichael and B. H. Sage, AIchE J. 3,559 (1966). 14R. S. Ghambir, J. M. Ghandi, and S. C. Saxena, Ind. J. P1,lre Appl. Phys. 5,
457 (1967). ISD. L. Carroll, H. Y. Lo, and L. I. Stiel, J. Chem. Eng. Data 13,53 (1968). 16N. V. Tsederberg and Z. A Ivanova, Therm. Eng. 18, 100 (1971). 17J. B. Irving, D. T. Jamieson, and D. J. Piaget, Trans. Inst. Chem. Eng. 51,
10(1973). 18A. A. Tarzimanovand R. S. Salmanov, Teplofiz. Vys. Temp. 15, 912
(1977). l~. Fleeter, J. Kestin, and W. A. Wakeham, Physica (Amsterdam) 103A,
521 (1980). 2°A. C. SIA}tt, A. I. JOOO3, J. T. R. Wat30n, AIld A. A. Clifford; Int. 1.
Thermophys.2, 103 (1981). ZIN. V. Tsederberg, Thermal Conductivity of Gases and Liquids (MIT,
Cambridge, MA, 1965). 22Landolt-BOmstein, Zahlenwerte und Funktionen (Springer, Berlin, 1968),
Vol. II, Part 5. z3K. Stephan and K. Lucas, The Viscosity of Dense Fluids (Plenum, New
York, 1979). : z4H. J. M. Hanley. R. D. McCarty. and E. G. D~ Cohen. Physica (Utrecht)
60, 322 (1972). zSH. 1. M. Hanley, K.E. Gubbins, and S. Murad, 1. Phys. Chern. Ref. Data
4, 1167 (1977). z6H. 1. M. Hanley, R. D. McCarty, and W. M. Haynes, Cryogenics 15. 413
(1975). Z7R. C. Reid, J. M. Prausnitz, and Th. K. Sherwood; -The Properties of Gases
and Liquids, 3ed ed. (McGraw-Hill, New York; 1977). z8K. Kadoya, N. Matsunaga, and A. Nagashima, "Viscosity and Thermal
COnductivity of Air in a Wide Range of Temperature and Pressure," Report to the IUPAC Subcommittee on TranspOrt Properties, Lyngby~ Denmark, 18-19 August 1983. .
29 A. Laesecke and R. Krauss, "Comments on the Calculation of the Thermal Conductivity of Fluid Air," Report of Institut fUr Technische Ther. modynamik und -Thermische-Verfahrenstechnik,-Universitiit--Stuttgart; -November, 1983.