Embed Size (px)
Citation preview

Vol. 11(15), pp. 183-206, 16 August, 2016
DOI: 10.5897/IJPS2016.4500
Article Number: E00ABBF60017
ISSN 1992 - 1950
Copyright ©2016
Author(s) retain the copyright of this article
http://www.academicjournals.org/IJPS
International Journal of Physical
Sciences
Full Length Research Paper
The thermal behaviour of gases under the influence of infrared-radiation
Thomas Allmendinger
CH-8152 Glattbrugg/Zürich, Switzerland.
Received 21 April, 2016; Accepted 20 June, 2016
In contrast to the usual spectroscopic methods, the temperature of a gas embedded in a tube was measured here and not the intensity loss of the radiation. In order to minimize the interference by the tube, light-weight building materials were used, preferably Styrofoam, transparent plastic foils and aluminium foils. Sunlight as well as infrared (IR)-bulbs was employed as radiation sources, whereby near-IR is predominant and not medium-IR as it is usually assumed. Different gases were tested, not only air and carbon-dioxide but also the noble gases argon, helium and neon. In each case, a temperature increase was detected up to a limiting value. While the warming-up rate was independent of the gas type, the limiting temperature turned out to be gas-specific. Surprisingly and contrary to the expectation of the greenhouse theory, the limiting temperatures of air, pure carbon-dioxide and argon were nearly equal while the light gases neon, and particularly helium, exhibited significant lower limiting temperatures. Applying the kinetic gas theory, and assuming a direct correlation between limiting temperature and radiative emission power, a stringent dependency of the product on mean kinetic energy and collision frequency could be deduced. Moreover, the adsorption degree could be calculated, turning out to be very low. The absorption was assumed as a result of vibration of the atomic electron shell, induced by the electromagnetic waves. Comparing the results in sunlight to those obtained in artificial light, the effective wavelength could be assessed delivering the value of 1.9 μm. Therefore, the greenhouse theory has to be questioned. Key words: Solar-tube, gas-temperature, radiation-absorption, radiation-emission, kinetic-gas-theory, near-infrared, carbon-dioxide.
INTRODUCTION The starting point of this research was the generally accepted greenhouse theory which assumes that the recent climate change is mainly due to the growing amount of the so-called greenhouse gases in the atmosphere, particularly of carbon dioxide. This theory takes its source in the comparison of the Earth
atmosphere with the glass of a green house, made by Fourier (1827), first advocated by Tyndall (1863) and by Arrhenius (1896, 1901). In modern times, the topic was taken up particularly by Möller (1956), Plass (1956a, b) and Curtis (1956), followed by a great number of publications delivering several climate models, which
E-mail: [email protected].
Author(s) agree that this article remain permanently open access under the terms of the Creative Commons Attribution
License 4.0 International License

184 Int. J. Phys. Sci. differed already significantly in the mid-nineties (Schlesinger et al., 1997).
In view of the atmospheric warming, each climate model or theory must exhibit two major parts: the influence of the direct incident solar light and the thermal output of the earth surface. The theoretical description of the latter one appears to be inherently difficult since different effects are involved, such as the surface albedo, the heat transfer at the surface and its IR-radiative emission. Hitherto, several theories are known, designated by the generic term radiative transfer. Thereto, basic comprehensive treatises are given by Tien (1968) and by Cess and Tiwari (1972).
However, these theories are not within the scope of the present paper which is primarily focused on empiric measuring methods on a laboratory-like scale, solely concerning incident radiation, and at most, finding a theoretical interpretation of the results. Thereto, not only natural (solar) light is of interest but also artificial light. Of course, in order to characterize the radiation sources, Planck’s law, which is valid for black bodies, may be used. Thereby, as to IR-radiation, it is important to distinguish between near IR (λ = 0.8 to 3 μm), emitted at high temperatures (>1000 K) and medium IR (λ = 3 to 50 μm) occurring at lower temperatures as usual thermal radiation, while IR-radiation with larger wavelengths (λ = 50 to 1000 μm) is conveniently denoted as far IR.
The fact that the extra-terrestrial solar constant is considerably larger than the terrestrial one (namely 1367 Wm
-2 instead of approx. 1000 Wm
-2), even in the absence
of clouds and haze, provides evidence that, in addition to the Raleigh scattering, infrared solar radiation is absorbed. This expectation may be sustained by the resemblance of the respective spectra suggesting an intensity decrease over the whole spectral range, and not solely in the visible one. According to the greenhouse theory, the absorption of IR-radiation is solely due to greenhouse-gases such as carbon-dioxide or water vapour but not to pure air since thereto no spectral absorbance had been observed. As a consequence, in the absence of such greenhouse gases, the atmosphere would be expected to absorb no IR-radiation at all.
As initially mentioned, prior gas absorption measurements in the laboratory were made by Tyndall (1861, 1863, 1872), always applying artificial light. He used various apparatus which may be understood as wideband spectrometers for gases. The favoured one, described in his paper published in 1861, consisted of a brass tube (length 1.2 m, diameter 6 cm) which was filled with various gases at different pressures but which could also be evacuated allowing measurements in the vacuum. The ends of the tube were capped with slabs of rock salt crystal (sodium chloride), a substance known to be highly transparent to heat radiation. A standard Leslie cube from copper, coated with lamp-lack and filled with boiling water, emitted radiation that traversed the tube and interacted with the gas before entering one cone of a
differential thermopile. Radiation from a second Leslie cube passed through a screen and entered another cone. The common apex of the two cones, containing a differential thermopile junction, was connected to a galvanometer which measured small voltage differences. The intensity of the two radiation sources entering the two cones could be compared by measuring the deflection of the galvanometer which was proportional to the temperature difference across the thermopile. Different gases in the tube, as well as different gas pressures, caused varying amounts of deflection of the galvanometer needle. Tyndall did not detect any adsorption by pure air, unlike in the case of carbon-dioxide or of other strongly absorbing gases particularly of an olefiant gas, at least when he worked at lower temperatures, while at higher temperatures he found a weak absorbance by air (Figure 1).
About forty years later, a similar apparatus was used by Arrhenius (1896, 1901), focusing on the carbon-dioxide adsorption of infrared radiation and using a 50 cm long iron tube, but two different IR-sources, namely, besides a Leslie-cube at 100°C, a hollow body from smutted copper, being chilled down to -80°C by a mixture of dry ice and ether. He varied the pressure, but within such a low range that no significant deviation from linearity appeared.
However, due to the comparatively low temperature of the heat source, these kinds of radiation sources imply solely the emission of medium-wave IR which is not typical for sunlight, at least not to a considerable extent. Tyndall could not know that, since Wien’s distribution law of 1896 and even less Planck’s radiation law of 1900, were not known at that time. But his observation of a weak absorbance by air at higher temperatures could mean that air does not absorb medium-wave IR-radiation while it becomes absorbing at lower IR-radiation waves.
Moreover, Ångström (1900) made another experiment using an apparatus consisting of two 40 cm long glass tubes, arranged side by side within a wider tube made from wood, the latter one serving as a visible thermal insulation, and exhibiting plates from fluorspar, on one end, and thermocouples on the opposite end. When one tube was filled with air, and the other with pure carbon-dioxide, and when the tubes were oriented perpendicularly to the sun beam, practically no temperature difference could be found. This means both gases either did not absorb any sunlight or they absorbed it to the same extent.
A further false conclusion is drawn by making the assumption that all the radiative energy absorbed by the gas will be transformed into heat, for it is conceivable that gas atoms or molecules may be electronically excited due to the absorption of electromagnetic radiation, but emitting it without transforming it into thermal motion. Since this emission will occur in any direction, and not only in the direction of the sensor of the apparatus, intensity loss will nevertheless be detected while the

Allmendinger 185
Figure 1. The preferred apparatus of Tyndall (1861), with annotations which were inserted afterwards.
emitted radiation is absorbed by the material of the sample tube. For this purpose, the temperature of the enclosed gas should therefore be measured, rather than the intensity loss of the radiation beam. But such measurements are not easy to carry out since a considerable interference with the tube material has to be expected, due to its large heat capacity compared to the heat capacity of the gas. A further difficulty arises when artificial light or radiation is applied, as it was the case in Tyndall’s experiments, since a normal intensity-loss is to be expected then, even in the absence of a medium.
With respect to practical measurements, the general interest was more and more geared to monochromatic spectroscopic methods for analytical applications, using artificial light sources and photo detectors, the light usually being resolved by a prism in combination with a frame. In astronomy as well as in meteorology, the direct analysis of natural light, in particular of solar light, still
plays a certain role (Zerlaut, 1989; Bird, 1989), whereby the measuring of the absolute intensities is needed much more here. But while the over-all intensity (given in Wm
-2)
may be easily determined by temperature measurements at a blackened cavity or by electronical instruments (bolo-meters) which are gauged by such blackened cavities, wave-specific measurements are much more delicate, particularly when infrared radiation is affected, since the medium for splitting the radiation may absorb parts of it, which is leading to systematic measuring errors. For instance, for the “spectro-bolometer” used by Langley (1884), interference due to the glass-prism may occur since glass absorbs IR-light. Even grating infrared spectrometers, e.g. the one described by Thompson et al. (1994), may exhibit some intrinsic deficiencies since glassy materials such as glass-lenses and glass-prisms are necessary for focusing the beam, not least the ones of the telescope. When gases are concerned, the

186 Int. J. Phys. Sci. circumstances are even more intricate, especially when they absorb only slightly, and when the absorption bandwidth is wide so that an absorption effect may be overlooked.
Normally, molecule-spectra of gases are calculated by quantum-mechanical methods. The relating theory, outlined e.g. in the textbook of Boeker and van Grondelle (2011), is complex and shall not be discussed in detail here, except one item: the statement that any IR-activity of molecules or atoms requires a shift of the electric dipole moment, so that two-atomic homo-nuclear molecules are always IR-inactive, must be regarded as a theorem and not as a principal natural law, since numerous examples of nonpolar substances are known where an interaction with electromagnetic radiation occurs, e.g. at halogens where even coloured and thus visible light is absorbed.
Hitherto, apparently no thermal measurements have been made with gases in the presence of IR-radiation, in particular of sunlight, except of those being provided for didactic purposes as the one of Sirtl (2010) but delivering no scientifically evaluable results. Therefore, it seemed advisable to seek a method for measuring the thermal behaviour of gases under the influence of IR-radiation within special tubes, in particular of air and of carbon-dioxide but also of noble gases such as argon, helium and neon. Thereby, sunlight as well as artificial light (IR-lamps) shall be applied. OBJECTIVES, CONCEPT AND APPARATUS The primary objective of this investigation was to verify empirically the common assumption that carbon-dioxide unlike the main air components nitrogen and oxygen absorbs infrared light, being thus significantly accountable for the so-called greenhouse effect. For this purpose and contrary to any previous measuring concepts, not the intensity of the radiation beam should be studied as by spectroscopic methods but its particular influence on gases, thus on matter, that is, their thermal behaviour in the presence of a light-beam. At that time, it was not evident that solely the near-IR should be focused.
Compared with solid bodies, thermal measurements on gases are much more delicate due to their low heat capacity letting suppose a considerable interference of the vessel walls in which the gas is embedded, apart from the fact that gases may move when a temperature gradient arises. Hence, a large ratio between the gas volume and the surface of the vessel must be intended, as well as a low heat capacity of the vessel material. Therefore, it does not astonish that no effect could be detected when erstwhile materials and apparatus were used. But it is all the more astonishing that such measurements have not been made in recent times.
Preliminary tests for the present investigation were
made using square twin-tubes from Styrofoam (3 cm thick, 1 m long, outer diameter 25 cm), each being equipped with three thermometers at different positions, and being covered above and below by a thin transparent foil (preferably a 0.01 mm thick Saran-wrap). The tubes were pivoted on a frame in such a way that they could be oriented in the direction of the solar light (Figure 2). One tube was filled with air, the other with carbon-dioxide. Incipiently, the tubes were covered on the tops with aluminium-foils being removed at the start of the experiment.
The primary experimental result was quite astonishing in many respects. Firstly, the content gases warmed within a few minutes by approximately 10°C up to a constant limiting temperature. This was surprising at least in the case of air, for no warming-up should occur since sunlight is colourless and allegedly not able to absorb any IR-light. However, the existence of a limiting temperature is conceivable since an emission of heat radiation has to be expected insofar as the temperature rises. Secondly, the limiting temperatures were more or less equal at any measuring point. This means that the intensity of the sun beam was virtually not affected by the heat absorption in the gas tube since the latter one was comparatively weak. And thirdly, between the two tubes no significant difference could be detected. Therefore, thanks to this simple experiment, a significant effect of carbon-dioxide on the direct sunlight absorption can already be excluded since it is unlikely that the minor carbon-dioxide concentration in the air of approximately 0.04% should have the same effect as pure carbon-dioxide. However, even pure air (and perhaps also other colourless gases) seems to absorb IR-light - that is indeed an effect which, so far, has obviously not been taken account of because it is very weak. Indeed, in the open atmosphere such a warming-up cannot usually be perceived since the warmed air rises immediately, cooling itself. Moreover, this direct warming-up-effect is superimposed by the much stronger one via the ground-surface. However, it seemed appropriate to study this effect more precisely with the aim of getting quantitative results, and insight of the theoretically ascertainable coherences. For this purpose, the subsequent experi-ments were made with artificial light, that is, with IR-lamps, exhibiting a higher amount of IR and being better reproducible (Figure 3). Furthermore, different gases were employed (ambient air, a 4:1 N2/O2-mixture, CO2, Ar, Ne, He) while the apparatus was improved step by step. Finally, the results obtained in artificial light were compared with the results obtained in solar light allowing an approximate statement about the wavelength of the effective radiation.
The preparation of the single measuring-tube is of great importance since it can influence the reliability of the results. Initially, there was no clue at all as to what will happen when such a tube is irradiated by an IR-lamp of the type being used for terraria (150, 100 and 50 W).

Allmendinger 187
Figure 2. Twin-tubes from Styrofoam.
Figure 3. Equipment with IR-lamp.

188 Int. J. Phys. Sci. At least it was clear that an irradiation from the aforementioned would guarantee an optimum immobility of the gas since the gas expansion would be larger at the hotter upper region than in the lower region. Moreover, in the case of artificial light a decrease of intensity from top to bottom was to be expected since this case differs from the general case of punctuate light source where the intensity decreases inversely proportionally to the square distance, letting suppose another intensity course due to the channelling of the radiation within the tube. Moreover, modifying the texture of the tube may diminish the path dependence of the radiation intensity, preferably by mirroring the inner surfaces of the walls with aluminium-foils. In order to be able to study this, three temperature measuring points were provided, positioned 10, 50 and 90 cm from the edge. The temperatures were measured with Hg-thermometers (approx. 8.5 mm thick) which were inserted into the Styrofoam walls and sealed by foamed plastics. In order to ensure a definite distance to the light source, a spacer (5 cm) from wood was mounted between tube and reflector of the lamp, while a square opening in the bottom board prevented a reflection of the passing radiation, and the tube was mounted on sockets from Styrofoam. The measuring gas, supplied from a professional steel-cylinder via a reducing valve, was injected through the bottom thermometer-hole while the top hole was opened for letting out the previous gas. In order to monitor the filling degree by means of the relative humidity of the ambient air, a hygrometer was provided 30 cm beyond the lower edge. The filling process lasted normally one hour or more, usually reaching 3 to 5% relative humidity. In the case of carbon-dioxide, the reducing valve had to be warmed with a hair dryer because of the cooling due to the gas expansion.
The measuring process starts when the IR-bulb is plugged. Subsequently, temperature-readings are made at the three thermometer positions, and on constant time-intervals (initially 2½ min, later 5 min) until the limiting temperature is reached. The execution of the experiments requires professional skills, not least since the measurements have to be made almost simultaneously. When sunlight is used as a radiation source, the starting point is difficult to determine since it can hardly be avoided that the sun heats up the surroundings. Furthermore, it has to be avoided that the content of the solar tube is not warmed up prematurely, preferably by using an aluminium-foil as a covering. And finally, the sunlight irradiation as well as the tube direction versus the sun must be constant during the experiment.
It would be confusing to list all the numerous apparatus amendments which have been made over time. Solely the most important variants shall be mentioned being compiled in Figure 4. Usually, the amendments were made due to experimental results which will be reported subsequently in detail.
First of all, the mirroring of the contact tips of the thermometers has to be mentioned. They had to be
mirrored in order to minimize the direct heating-up of the thermometers by the IR radiation which would distort the temperature measuring of the gas. This direct interaction is due to the glass-bulb containing the mercury since glass absorbs infrared radiation considerably.
Moreover, the thermal course along the tube was focused, regarding the fact that the tube walls or their laminations, respectively, may influence the thermal behaviour by absorption, emission and conduction of heat. Hence, bare walls may act as heat-mediators in such a way that they absorb IR radiation directly coming from the radiation source which leads to a superficial warming-up while they are emitting heat to the adjacent gas layer, partly by heat radiation, and partly by heat conduction. The latter one may play a certain role at such small distances while for the large distances occurring along the tube it may be neglected. However, detailed quantitative studies have not been made hereof. Instead, the point was to minimize the influence of the tube to such an extent that in the case of using artificial IR radiation the temperature gradient along the tube was minimal, and the results were plausible, especially with respect to the mathematical analysis made subsequently.
A mirroring of the walls by aluminium foils reduces the direct warming-up of the Styrofoam wall due to their reflection properties. Thereto, several kinds of glossy aluminium foils were employed. However, even such a mirroring may lead to interferences, namely down the tube and due to their heat conductivity. Altogether, four types of aluminium-foils were used, in Figure 4 being always marked in blue. In order to mirror contact-tips of the thermometers, a common 0.015 mm thick aluminium-foil was applied. The thickness of the aluminium component of the adhesive foils was the same while the total thickness was 0.18 mm for method A1 and 0.26 mm for C1. At methods B2 and B3, a very thin foil (metallized plastic, 0.015 mm) was employed which is commonly used for freeze protection. The optimal furniture was realized in method B3, shown in Figure 5, but it was not available for any experiments, solely for the final ones.
A further problem arose because of the bad gastight sealing character of Styrofoam, particularly when helium was used, needing an additional adhesive splicing foil (in Figure 4 marked in green). In respect of the many variables
(six different gas fills, and three different lamp intensities), it was not feasible to run the whole experimental program
every time, in particular since, for studying the pressure
influence, some experiments were made in a room of a
hotel being situated on a mountain at 2100 m above sea-level, and furthermore the final outdoor measurements in
sunlight did not allow the application of other gases than
ambient air since the complete filling with another gas
would have needed too much time, accompanied by a
considerable shift of the solar altitude. Nevertheless, several valuable results could already be obtained when
the apparatus was not yet optimal, especially since argon
had turned out to be suited as a reference gas.

Allmendinger 189
Fig. 3: Drafts of the Styrofoam-wall including thermometer, coated with additional layers
(Blue coloured: aluminium-foils; green coloured: plastic materials; both specified in the text)
Additional method: Method C ≡ method C1 without the adhesive aluminium-foil
thermometer
1.5 cm
Method A Method B
Method A1 Method C1
Method B2
4.0 cm
PE 5 mm
Styrofoam
Method B3
Figure 4. Drafts of the Styrofoam-wall including thermometer, coated with additional layers (Blue coloured: aluminium-foils; green coloured: plastic materials; both specified in the text). Additional method: Method C ≡ method C1 without the adhesive aluminium-foil.

190 Int. J. Phys. Sci.
Figure 5. Solar-tube according to method B3.
It must be admitted that even the final version of this apparatus was not perfect since on the inside surfaces of the tube walls no (thin) plastic foils were provided which would have avoided the diffusion of the gas into the (porous) Styrofoam and which would have improved the tightness even if an absolutely tight apparatus is not feasible using such materials. However, it must be taken into account that initially there was absolutely no clue what will happen, and that this apparatus had to be developed from scratch, starting with a prototype which had to be improved step by step. Nevertheless, the finally obtained results appeared to be sufficient for making significant and principally correct statements and interpretations.
As IR-bulbs, “Basking Spots” from exo-terra in three sizes, according to three intensities (150, 100, and 50 W), were used, being inserted in an Arcadia reflector. Due to the different sizes of the bulbs, the distances between the lower surfaces of the bulbs and the base of the reflector were different, namely, 5, 7.5, and 9 cm.
Some additional but inconsistent information is delivered by the producer. On the one hand, a colour-temperature of 1500 K is indicated, besides being poorly defined. In particular, the relative spectral power distribution, displayed in Figure 6, does not correspond to that colour-temperature but to a much higher one, namely to 3450 K. This may be checked by a calculation using Planck’s formula, written in simplified terms as:
1
1
5 Tk
hc
e
I
(1)
whereby mK
k
hc01439.0
The resulting curve, displayed in Figure 7 and exhibiting a peak-maximum at a wavelength of about 0.85 μm, describes the curve given by the producer quite well except for its left branch whereas the difference to the 1500 K curve, exhibiting a maximum at 1.9 μm as shown in Figure 8, is large. Such a high temperature of the glowing filament seems possible with respect to the melting point of tungsten of 3680 K and thus being higher than the estimated colour-temperature of 3450 K. However, with respect to the glass of the bulb, there arise considerable doubts. But even the 1500 K specification seems questionable since red heat corresponds to approximately 1000 K. Anyway, there remains an uncertainty regarding the producer’s declaration, notably since no information is given about the measuring method.
The irradiation intensity of the sunlight was measured by a certified KIMO Solarmeter SL 100. Most experiments were made at about 450 m above sea level during several summer days, and preferably early in the afternoon. Normally, the atmospheric pressure was between 960 to 980 hPa, and the relative humidity was between 50 and 60%.

Allmendinger 191
Wavelength (nm)
Rela
tive s
pec
tra
l p
ow
er
(%)
Figure 6. Relative spectral power, according to producer’s information.
Figure 7. Comparison of producer’s information with a Planck calculation.
Figure 8. Relative spectral power at 1500 K according to Planck’s calculation.
EXPERIMENTAL RESULTS The influences of the apparatus features The tests for optimizing the apparatus were made with equipment
similar to the one shown in Figure 3 and using a 150 W spot. Initially, solely ambient air was used. As obvious from the time-temperature-diagram displayed in Figure 9, a constant limiting temperature was reached at any measuring point. Since the limiting temperature at the supreme measuring point was quite high,

192 Int. J. Phys. Sci.
Figure 9. Temporal courses at the three temperature positions with 150 W in air (Method being analogous to method A, but with bare thermometer-contact-tips).
possibly harming the Styrofoam, and since low air humidity was intended, the initial tests were made in a room at a low ambient temperature. But all the following tests were made at room temperature with argon as a reference gas, behaving similarly to air.
Such limiting states are due to equilibria between absorption and emission rates. But unlike in the case of solar radiation (alleged for comparison in Figure 20), in the case of artificial radiation the limiting temperatures at the three measuring positions (in every case indicated by the three colours yellow, orange and red) differed more or less, depending on the texture of the tube. In order to make these distinctions more visible, and in addition to the examples given in Figures 10, 12, 14, 16, 18, and 20, the respective diagrams in Figures 11, 13, 15, 17, 19, and 21 reveal the difference between limiting and starting temperature as a function of the measuring position. Comparing these examples, the optimum variant can be assumed for the case where the slope of the distance/limiting temperature curve is minimal, while the limiting temperature at the medium position is maximal.
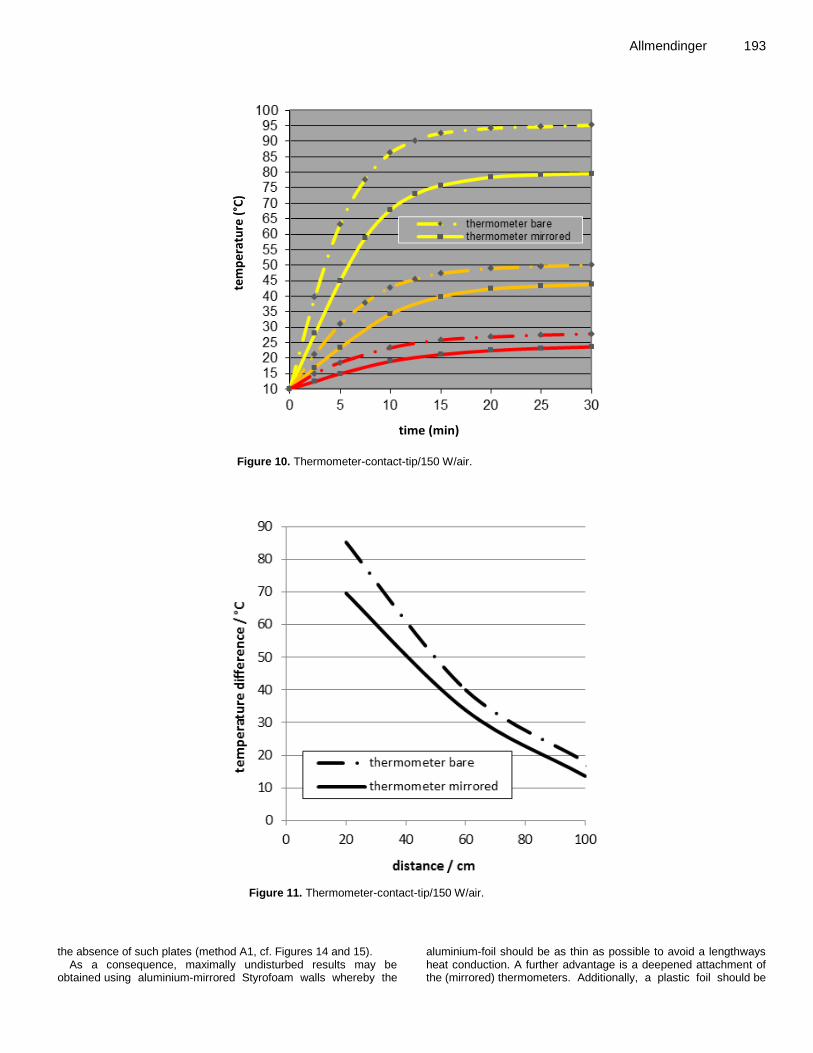
In Figures 10 and 11, the effect of mirroring the thermometer-contact-tips by aluminium-foils is revealed whereby in both cases the thermometers were positioned alike in method A (The first case is identical with the example given in Figure 9). Obviously, the mirroring of the thermometers induces a general reduction of the heating-up rates, as well as of the limiting temperatures. Hence, it may be concluded that the differences must be due to the glass films enclosing the mercury bulbs of the thermometers. The interferences were considerably large, so that all subsequent measurements were made using mirrored thermometer-contact-tips.
Figures 12 and 13 reveal the influence of the horizontal thermometer position illustrated in Figure 4 (methods A and B). When the contact-tips of the thermometers were positioned closer to the Styrofoam wall, the temperatures were generally lower. This fact suggests that the wall absorbed some heat, in spite of its low heat capacity, inducing interference and letting appear method B as the preferable one. However, since method A implies a lower slope of the distance/limiting temperature curve, and since the heat stress on the Styrofoam tube is lower, too, several measurements comparing the influence of different gases were made applying this method, particularly since unaware of the effects of completely different gases such measurements had to be carried out without having the final perfect apparatus available.
The attachment of a self-adhesive aluminium foil inside the Styrofoam walls (method A1) lead to a considerable flattening of the distance/limiting temperature curve, as it is evident from Figures 14 and 15. This may be explained by a less warming-up of the walls due to the reflection of the aluminium foil, and therefore reducing their counter-radiation towards the contact-tips of the thermometers. On the other hand, the initial energy loss of the radiation beam becomes lower inducing a smoother pathway of the radiative intensity.
However, as it may be seen from Figures 16 and 17, when the heat capacity of the wall was enhanced - as it was the case when massive polyethylene plates were applied (method C) -, the warming-up of the enclosed gas is considerably reduced due to the high heat capacity of these plates, while the covering of the plates with aluminium foils (method C1) generated similar conditions as in
Allmendinger 193
Te
mp
era
ture
(°C
)
Time (min)
tem
per
atu
re (
°C)
time (min)
Figure 10. Thermometer-contact-tip/150 W/air.
Figure 11. Thermometer-contact-tip/150 W/air. the absence of such plates (method A1, cf. Figures 14 and 15).
As a consequence, maximally undisturbed results may be obtained using aluminium-mirrored Styrofoam walls whereby the
aluminium-foil should be as thin as possible to avoid a lengthways heat conduction. A further advantage is a deepened attachment of the (mirrored) thermometers. Additionally, a plastic foil should be

194 Int. J. Phys. Sci.
Te
mp
era
ture
(°C
)
Time (min)
tem
pe
ratu
re (
°C)
time (min)
Figure 12. Thermometer position/150 W/argon.
Figure 13. Thermometer position/150 W/argon.

Allmendinger 195
Time (min)
Tem
pera
ture
(°C
) te
mp
era
ture
(°C
)
time (min)
Figure 14. Alu adhesive foil/150 W/argon.
Figure 15. Alu adhesive foil/150 W/argon.

196 Int. J. Phys. Sci.
Time (min)
Tem
pera
ture
(°C
) te
mp
era
ture
(°C
)
time (min)
Figure 16. Alu adh. foil on PE-plate/150 W/argon.
Figure 17. Alu adh. foil on PE-plate/150 W/argon.
provided, avoiding the diffusion of the embedded gas (method B2, Figures 18 and 19). For outdoor experiments, that is, for
experiments with solar radiation, it is advantageous to apply additional aluminium-foils on the outsides of the tube preventing an

Allmendinger 197
Figure 18. Alu light/termomet. deep/150 W/Ar.
Figure 19. Alu light/termomet. deep/150 W/Ar. unintentional influence of the dispersed daylight (method B3, Figures 20 and 21).
As the comparison of Figures 22, 23 and 24 yields, the pattern of the distance/limiting temperature courses is independent of the lamp intensity, while of course the initial slopes as well as the limiting temperatures are different. Hence, the accuracy of the
measurements cannot be improved considerably by the choice of the lamp intensity.
In summary, it can be said that a mirroring of the inside surfaces of the tube engenders a linearization and a flattening of the time-temperature curves meaning that the intensity loss along the tube is minimal, becoming inversely proportional to the distance

198 Int. J. Phys. Sci.
Figure 20. Method B3/solar tube/outdoor/air.
Figure 21. Method B3/solar tube/outdoor/air.
and not as usual for open artificial radiation inversely proportional to the square of the distance. Hence, the optimal method for quantitative analyses is given by method B2 (or for outdoor measurements by method B3). However, for basic comparing purposes, the more simple method A was used, but preferably choosing the medium measuring point since this one delivered similar results as method A1 (cf. Figure 15). Regarding the three thermometric measuring points, it generally seemed conceivable to neglect the thermal conductivities of the gases in consideration of the relatively large distances.
The dependence on the kind of gas and on the gas pressure The influence of the several gas kinds, as well as of the atmospheric gas pressure, was studied by means of artificial IR-light measurements since the reproducibility as well as the tempera-ture enhancement was higher than in the case of the sunlight measurements. Since the greater part of the measurements had been accomplished before the method-optimization had been finished (delivering method B2), mostly the results basing on the less reliable and only semi-quantitative method A were available for

Allmendinger 199
Figure 22. Temporal courses with the 150 W lamp/method B2/argon.
Figure 23. Temporal courses with the 100 W lamp/method B2/argon.
Figure 24. Temporal courses with the 75 W lamp/method B2/argon.
comparisons, preferably with the 150 W spot, and regarding the medium time-temperature curve, while for most quantitative analyses the results of methods B2 and B3 were used (see next chapter).
As Figure 25 reveals, the limiting temperatures of argon and (pure) carbon-dioxide were almost equal while that one of room air
was slightly lower. The initial slopes were equal in any case. A nitrogen/oxygen mixture (4:1), being adequate to dry and carbon-dioxide free air is not displayed here since it delivered nearly the identical result as room air. Hence, the rough initial observation which was made using twin-tubes in the presence of sunlight could

200 Int. J. Phys. Sci.
Tem
per
atu
re (
°C)
Time (min)
tem
pera
ture
(°C)
time (min)
Figure 25. Comparison of argon, air and CO2 (method A, 150 W, medium postion).
Time (min)
Tem
per
atu
re (
°C)
time (min)
tem
per
atu
re (
°C)
Figure 26. Comparison of argon, neon and helium (method A, 150 W, medium postion).
Time (min)
Tem
pera
ture
(°C
)
time (min)
tem
pe
ratu
re (
°C)
Figure 27. Comparison of argon and helium (method B2, 150 W, medium postion).
be approved. Moreover, there is no doubt that air, and even noble gases such as argon, absorb IR-light, while the absorbance of pure carbon-dioxide happens in the range of the absorbance of air, the latter one being not considerably influenced by traces of further gaseous components, such as water vapour.
Significantly larger differences of the limiting temperatures
appeared when the noble gases argon, neon and helium were compared, as revealed in Figure 26. However, the initial slopes were equal in any case. In this respect it is interesting to know that the molar heat capacities of these gases are equal.
The comparison of Figures 26 and 27, that is, the comparison of the methods A and B2, yields approximately the same ratio

Allmendinger 201
Time (min)
Te
mp
era
ture
(°C
) te
mp
era
ture
(°C
)
time (min)
Figure 28. Comparison of air at different pressures (method A, 150 W).
between the limiting absolute temperatures of argon and helium (331: 314 = 1.054 at Figure 26, instead of 342:323.5 = 1.057 at Figure 27), while the warming-up rates differed which may be explained by the stronger interference between gas and tube in the case of method A. In Figure 27, the equity of the initial slopes is even more obvious. The similarity of the absolute limiting temperature ratios between argon and helium with respect to the methods A and B2 enables the appraisal of the respective ratio between argon and neon according to Figure 26, delivering the value 331:323 = 1.025, or adjusted analogously to the argon/helium results 1.025 x 1.057 : 1.054 = 1.028.
In order to study the influence of the gas pressure, it is necessary to change the ambient pressure since it is not possible to evacuate or pressurize the measuring tube due to the low stability of the Styrofoam and of the cover foils. The simplest way to realize this is to displace the measuring station on a mountain, and e.g. to rent hotel room there. In our case, the two levels of the measuring stations, namely about 450 and 2100 m above sea level, enabled a pressure decrease of about 20%, that is, from 0.97 to 0.79 bar. But as Figure 28 reveals, no significant pressure dependence could be found when the 150 W spot was used. Similar results were obtained with the 100 W and the 75 W spot, respectively.
THEORETICAL INTERPRETATION OF THE RESULTS
The determination of the absorption degree
The course of the time/temperature curves can be explained by a linear growth within the initial phase where the gas is continuously warmed-up, on one hand, and a final constant limiting phase where its radiative emission rate is equal to the warming-up rate, on the other hand.
Hence, for determining the absorption degree, solely the linear initial phase has to be regarded, while the values of the limiting temperatures promise to deliver information about the radiative behaviour of the gases, the latter one being subject of the next chapter.
Obviously, in order to calculate the heat absorbance of a gas, its molar heat capacity cp is relevant, exhibiting the unit J/mol∙K. Instead of K (Kelvin), also centigrade may be inserted. The multiplication by the measured initial heating rate yields a molar power [W/mole]:
t
TcP pabsorb
(2)
whereby T is the temperature [K] or [°C] and t = time [s]
Using for example the values for argon being evaluable from Figure 27 (yielding a warming-up rate of 20°/5 min = 0.0667 K/s, and exhibiting a molar heat capacity of 20.85 J/mol∙K), the molar absorption power gets 1.39 W/mole, or converted into litres, approximately 0.062 W/l. Assuming at this point a lamp-power of about 120 W, the absorption degree is solely 0.012/mole or 0.00053/l, so it is not surprising, that this effect has so far been overlooked.
The determination on base of medium values or of the warming-up rate at the medium measuring point, can be considered reasonable for guaranteeing a result which is as accurate as possible. Admittedly, the result is not highly exact, in particular since the lamp intensity at the

202 Int. J. Phys. Sci. reference point had to be estimated. However, at least the order of magnitude is correct. Moreover, this approach delivers the explanation why the warming-up rates of argon and of helium (and of similar gases) are equal, namely since their molar heat capacities are equal.
The radiative emission of gases in view of the kinetic gas theory
Comparing the time/temperature curves of argon and helium in Figure 27, a significant difference of the limiting temperatures is evident while the initial slopes are equal. If we assume a temperature dependency on the emission rate, and if we furthermore assume that the limiting temperature condition is given by the equity of warming-up power and emission power, we can conclude that the radiative emission rates of the two gases must be different, the one of helium being smaller than the one of argon. And since the molar heat capacities of the two gases are virtually equal, this difference must be due to one or more other factors. Thereby, the atomic mass seems to play a certain role. However, the atomic mass ratio of these elements is much greater than the ratio of the absolute temperatures, namely, 40:4 = 10 instead of 342:323.5 = 1.057, so that a direct proportionality has to be left out of consideration.
In order to explain this, it is necessary to draw on the kinetic gas theory which has already been successfully applied on the heat conductivities of gases, and which is described in any textbooks. Thereto, it seems reasonable to consider the emission power as being proportional to the arithmetic product of the mean kinetic energy of the gas particles and their collision-frequency. For both terms there exist mathematical expressions:
TkwmE Bkin 23
21 2 (3)
M
RTw
3
(4)
Tk
pwz
B
2 (5)
M
RTpzEkin
2
33
(6)
where kinE is the mean kinetic energy, w is the
mean velocity, z is the mean collision-frequency, m is
the particle mass (atom or molecule), M is the mole mass, is the cross sectional area of a particle (atom or
molecule), p is the pressure, R is the ideal gas
constant (= 8.314 J/K∙mol), Bk is the Boltzmann constant
(= R/NL = 1.38∙10-23
J/K), LN is the Avogadro constant
(= 6.023∙1023
) When two gases are compared, their absorption
powers can be assumed to be equal, and since the emission power is equal to the absorption power, at
constant pressure the term MRT 23 should be
constant; that is, the comparison of two gases yields the relation:
412
4
21
2
12
2
2121 rMrMMMTT
(7a) Therein r1 and r2 indicate the atomic radii of the compared gases. However, this relation is difficult to verify since there are some uncertainties with respect to the cross sectional areas even when noble gases are considered. On the one hand, the atomic radii are not well defined so that the literature values are diverging; and on the other hand, solely a minimal deviation of the radius values leads to a large deviation of the temperature ratio due to the forth power of the atomic radii. Contrarily, the inverse way where the radius ratio is calculated on basis of the temperature ratio seems to be promising, hence representing a determination method for the atomic radii of noble gases according to the rearranged formula:
4
211212 TTMMrr
(7b)
Nevertheless, it presupposes the knowledge of one atomic radius serving as a reference. When we use argon as the reference assuming its atomic radius rAr = 1 Å = 0.1 nm, we get for helium and neon, when using the temperature ratios given earlier, the following values:
rHe = 0.57 Å and rNe = 0.85 Å
Since these results are plausible it seems to be advisable to assume that the aforementioned approach, and thus Formula 6 for describing the radiative emission of gases, is correct. Obviously, it is completely different from Stefan’s formula which is solely valid for solid black bodies.

Moreover, there arises the question of proportionality between the collision power, given by Equation (6), and the effective emission power being relevant to the power equilibrium at the limiting temperature condition. Thereby, it must be kept in mind that the mean kinetic energy being formulated in Equation (3) solely concerns a single particle, and not the particle ensemble being present in a thermodynamic system. For this purpose, the basic kinetic relation about the ideal gas equation must be used:
kinL ENnTRnVp 3
2 (8)
(n = mole number, V = Volume) As a consequence, the molar collision power Pcollision is given by Equation 9:
pM
RTNzENP LkinLcollision
2
32
32
(9)
Moreover, proportionality between that collision power and the emission power may be assumed, represented by a proportional factor ε:
collisionemission PP (10)
When the equilibrium temperature is attained, the molar emission power, given by Equation (10), should be equal to the molar absorption power, given by Equation (2). When argon is adduced as an example, at 1 bar pressure (= 10
5 Nm
-2) the numeric values are T = 342 K (according
to Figure 27), and σ = 3.14∙10-20
m2, yielding a Pcollision-
value of 1.23∙1012
W/mole. The comparison with the empiric Pabsorbance-value which has previously been obtained using Equation (2), namely 1.39 W/mole, delivers the extremely low ε-value of 1.13∙10
-12. For now,
this result cannot theoretically be explained. Probably, it is connected with the question of what happens when two atoms collide, letting suppose that atomic electron shells are caused to vibrate being accompanied with electron excitations. However, the pressure independence of the process, displayed in Figures 28, can be easily explained by considering the pressure-dependence of the heat capacity of the gas.
Estimate of the effective wavelength-range
A rough estimate of the effective wavelength-range
Allmendinger 203 appears feasible by comparing the absorbance rates due to sunlight and artificial light, for their spectra are not congruent but overlapping. When both spectra are plotted in the same diagram in such a way that the ratio of their integrated intensities corresponds to the ratio of the real intensities, the effective wavelength may be determined by graphically evaluating the wavelength where the ratio of the warming-up rates is equal to the ratio of the respective spectral intensities. Hereto, methods B2 and B3 were used with air fillings and using the 75 W Basking spot (implying a local radiation density of approximately 1500 Wm
-2, while the one of sunlight was 1000 Wm
-2),
yielding at the medium measuring point, warming up rates of 1.4°/min for sunlight and 2.1°/min for artificial IR-light, and thus a ratio of 1.5. But while the solar spectrum can be adopted from literature, the uncertainties with respect to the spectrum of the Basking spot, as mentioned earlier, make it appear meaningful to consider any variant (c.f. Figures 29 to 31), and delivering the wave lengths 0.8, 1.45 and 1.9 μm, where solely the last one seems to be plausible.
The determination of the radiative heat coefficient
Finally, the question as to which portion of the radiation energy is transformed into heat energy shall be answered. For such a comparison, both energies must be known but being preferably focused on a single particle, and not on the whole ensemble. Since we know now the effective wavelength, namely 1.9 μm, delivering the respective wave frequency according to the relation
c (speed of light), we can easily calculate the
respective energy by using Einstein’s relation
hErad (11)
chErad
= 1.05∙10
-16 J (12)
On the other hand, the mean kinetic energy, calculated employing Formula (3) may be interpreted as the heat energy, delivering the value 6.6∙10
-21 J (with T = 300 K).
Therefore, defining the quotient of the two energies as the radiative heat coefficient, we obtain the very low value 6.3∙10
-5 J, that is, the amount of radiative energy
which is transformed into kinetic heat energy is very small. The order of magnitude of this coefficient wouldn’t change significantly if the adsorption wavelength were in the middle IR-range. Indeed, this low yield is charac-teristic for gases differing considerably from the one of black bodies, which may be explained vividly by the large

204 Int. J. Phys. Sci.
Wavelength (µm)
Re
lati
ve
in
ten
sit
y o
r in
ten
sit
y r
ati
o
Figure 29. Comparison of sunlight with spotlight according to the producer specification.
Rela
tive i
nte
nsit
y o
r in
ten
sit
y r
ati
o
Wavelength (µm)
Figure 30. Comparison of sunlight with spotlight being calculated for 1500 K (Planck)
Rela
tive i
nte
nsit
y o
r in
ten
sit
y r
ati
o
Wavelength (µm)
Figure 31. Comparison of sunlight with spotlight being calculated for 1000 K (Planck).

difference in density and the reduced intermolecular interaction.
Conclusions
This study describes a method employing one or two comparatively large tubes from Styrofoam, preferably mirrored by aluminium foils, and being covered on both ends with thin plastic foils. It enables temperature measurements at gases under the influence of solar light as well as of artificial IR-light using special bulbs with a reflector. The temperatures are measured at three positions, allowing studying the path dependence on the radiation intensity. Due to a hygrometer being laterally embedded in the tube, the filling degree of a gas can be checked. Usually, immediately after the start, the tem-perature rises linearly but later on, it tends to a constant limiting temperature, which is due to the equilibrium of the thermal absorption rate and the radiative emission rate. The initial slope of the temperature/time curve enables the determination of the warming-up rate and the thermal absorption degree, regarding the heat capacity of the gas, while the limiting temperature delivers the empirical coherence between the (absolute) temperature and the emission power of the gas.
Thereto, the following remarks have to be made with respect to an atomic model concept: It has to be emphasized that the thermal absorption degree may probably not be equal to the radiative absorption degree since presumably not the whole adsorbed radiation energy is transformed into heat, i.e. into kinetic energy, but it may be temporarily stored within the atoms or molecules in the form of exited electronic vibrational states. In order to determine the radiative absorption degree, solely spectroscopic methods would be suitable. However, at very low absorption degrees, as is the case in this study, such methods appear to not be sensitive enough due to the relative low absorbance compared to the whole radiation intensity, and due to the possible interference with lenses and prisms in the IR-range. But above all, for atmospheric considerations solely the thermal behaviour is relevant, and that one cannot be strictly derived from spectroscopic features because of the aforementioned reason.
Moreover, the knowledge of the limiting temperatures and of the fact that different gases may deliver different limiting temperatures. The conclusion can be drawn that the radiative emission depends on the atomic features of the gas, namely on the mass and on the size. Indeed, based on the kinetic gas theory, a mathematical formulation could be found delivering a direct correlation between limiting temperature and radiative emission power, given by the product of mean kinetic energy and collision frequency, delivering the power-dimension W. On the other hand, the warming-up rate turned out to be independent of the gas type.
Allmendinger 205 Since sunlight as well as IR-bulbs were employed as
radiation sources, near-IR was expected to be predominant and not medium-IR as it is commonly assumed. Comparing the results in sunlight and in artificial light, the effective wavelength could be assessed delivering the value of 1.9 μm.
Surprisingly, and contrary to the expectation of the greenhouse theory, the limiting temperatures of air, pure carbon-dioxide and argon were nearly equal, while the light gases neon, and particularly helium, exhibited significant lower limiting temperatures. Thanks to this empirical evidence, the greenhouse theory has to be questioned. Instead, the warming-up of the lowest layer of the troposphere has to be understood as the result of the warming-up of the Earth’s surface, mainly depending on its albedo (Barrett, 1995).
Conflict of Interests The author has declared no conflict of interests. ACKNOWLEDGEMENTS
The present work has been carried out independently but not without the professional support of Dr Andreas Rüetschi (physicist, from the Swiss Federal Institute of Technology, Zurich).
REFERENCES
Ångström K (1900). Ueber die Bedeutung des Wasserdampfes und der
Kohlensäure bei der Absorption der Erdatmosphäre. Ann. Phys. 308(12):720-732.
Arrhenius S (1896). On the Influence of Carbonic Acid in the Air upon the Temperature of the Ground. Phil. Mag. 41(5):238-276.
Arrhenius S (1901). Ueber die Wärmeabsorption durch Kohlensäure. Ann. Phys. 309(4):690-705.
Barrett J (1995). The roles of carbon dioxide and water vapour in warming and cooling the Earth’s troposphere. Spectrochimica Acta 51A(3):415-417.
Bird R (1989). Spectral Terrestrial Solar Radiation, in: Solar Resources, ed. by R.L. Hulstrom, Cambridge, MA, MIT Press VIII:310-333.
Boeker E, van Grondelle R (2011). Environmental Physics, Wiley (Third Edition).
Cess RD, Tiwari SN (1972). Infrared Radiative Energy Transfer in Gases. Adv. Heat Transf. 8:229-283.
Curtis AR (1956). The computation of radiative heating rates in the atmosphere. Proc. R. Soc. London. Series A, Math. Phys. Sci. 236:156-159.
Fourier M (1827). Mémoire sur les temperatures du globe terrestre et des espaces planétaires; Mémoires de l’Académie Royale des Sciences de l’institut de France 7:569-604.
Langley SP (1884). Professional Papers of the Signal Service: Researches On Solar Heat And Its Atsorption By The Earth’s Atmosphere, US. Army. Signal Corps, William Babcock Hazen.
Möller F (1956). The pattern of radiative heating and cooling in the troposphere and lower stratosphere. Proc. R. Soc. London. Series A. Math. Phys. Sci. 236:148-156.

206 Int. J. Phys. Sci. Plass GN (1956a). The Carbon Dioxide Theory of Climatic Change.
Tellus 8:140-154. Plass GN (1956b). Effect of Carbon Dioxide Variations on Climate. Am.
J. Phys. 24:376-387. Schlesinger ME, Andronova NG, Entwistle B, Ghanem A, Ramankutty
N, Wang W, Yang F (1997). Modelling and simulation of climate and climate change, in: Proceedings of the International School of Physics «Enrico Fermi», Course CXXXIII, Società Italiana di Fisica Bologna-Italy. pp. 389-429.
Sirtl S (2010). Absorption thermischer Strahlung durch atmosphärische Gase, Wissenschaftliche Arbeit für das Staatsexamen im Fach Physik, http://hpfr02.physik.uni-freiburg.de/arbeiten/diplomarbeiten/ sirtl_staatsexamen_2010.pdf
Tien CL (1968). Thermal Radiation Properties of Gases, in: Hartnett J.R. and Irvine T. (Eds.). Adv. Heat Transf. 5:253-324.
Thompson RI, Epps HW, Winters G, Womack W, Mentzell E (1994).
GRIS: The Grating Infrared Spectrometer. Public Astron. Soc. Pac. 106:94-100.
Tyndall J (1861). On the Absorption and Radiation of Heat by Gases and Vapours, and on the Physical Connexion of Radiation, Absorption, and Conduction. Phil. Mag. 22:169-285.
Tyndall J (1863). On the Radiation through the Earth’s Atmosphere. Phil. Mag. 25:200-206.
Tyndall J (1872). Contributions of Molecular Physics in the Domain of Radiant Heat. Logmans, Green, and Co., 446 p.
Zerlaut G (1989). Solar Radiation Instruments, in: Solar Resources, ed. by R.L. Hulstrom, Cambridge, MA, MIT Press VIII:173-308.