Embed Size (px)
Citation preview

Munich Personal RePEc Archive
The textile and clothing industry in
Lesotho in the wake of the multi-fibre
agreement phase-out
Ayoki, Milton
Institute of Policy Research and Analysis
22 December 2016
Online at https://mpra.ub.uni-muenchen.de/88112/
MPRA Paper No. 88112, posted 24 Jul 2018 11:29 UTC
IPRA WORKING PAPER 65, 2018 i
The textile and clothing industry in Lesotho in the wake
of the multi-fibre agreement phase-out
Milton Ayoki
Institute of Policy Research and Analysis
Kampala, Uganda
IPRA Working Paper 54
Institute of Policy Research and Analysis, Kampala
December 2016

ii
The textile industry in Lesotho in the wake of the multi-fibre agreement phase-out
Milton Ayoki
Abstract: This paper examines the textile and clothing (T&C) industry in Lesotho to ascertain the initial effects of the end of quotas and other restrictions on global trade in textile and clothing. Results show a dramatic decline in Lesotho’s T&C exports, both in value terms and export share in major markets in industrialised countries: the U.S. and the EU in the aftermath of the Agreement on Textile and Clothing (ATC). The export decline for Lesotho and for Sub-Saharan African countries as a group has not been accompanied by simultaneous or rapid shift of increasing T&C exports by Asian developing countries, who continue to export post-ATC at about the same levels of textile and clothing that they did before ATC phase out. While T&C exports from Lesotho and other African countries continue to decline, post-ATC, it is unclear if the end of the ATC quotas has been the main cause of that decline. Results do not provide clear evidence that the termination of the ATC has been a major contributing factor to the decline of Lesotho’s and SSA Africa’s T&C exports. Instead, we find evidence of simultaneous and rapid shift of increasing T&C exports from China to Lesotho and other African markets. Compared to competition in export markets, the influx of Chinese products imposes worse threat to the textile and clothing sector in Lesotho and the rest of Africa. Further to these, the utilisation of safeguard mechanisms by the U.S. and the continued option to maintain tariffs and other non-tariff barriers means that the end of ATC did not fully bring about “free trade” for clothing and textiles. These results raise important policy issues that could be considered in the ongoing negotiations on rules: trade remedies, particularly those dealing with safeguard and countervailing measures.
JEL Classification: F13, D14, D53, N27.
Key words: Agreement on Textile and Clothing (ATC), Multifibre arrangement, global textile and clothing exports, quota restrictions, trade remedies, Sub-Saharan Africa, Lesotho Disclaimer: IPRA Working Paper Series disseminates the findings of work in progress to encourage the exchange of ideas about development issues. An objective of the series is to get the findings out quickly, even if the presentations are less than fully polished. The author alone is responsible for any views, omissions or deficiencies. Email: [email protected]
IPRA Working Paper 54, December 2016 © 2017 Institute of Policy Research and Analysis. All rights reserved. Short sections of text, not to exceed two paragraphs, may be quoted without explicit permission provided that full credit, including © notice, is given to the source.

IPRA WORKING PAPER 65, 2018 iii
Table of Contents
1 Introduction 1
2 The textile & clothing industry in Lesotho’s economy 3
2.1 Structural changes in the economy 3
2.2 GDP growth trajectory 4
2.3 Growth of textile & apparel sector 6
2.4 Lesotho’s industrial & trade policies and emerging issues 6
in T&C sector 6
2.5 Investment & Asian’s footprint in Lesotho’s textile-apparel value chain 8
3 The textile and apparel trade 9
3.1 T&C export intensity 9
3.2 Textiles & clothing exports and imports 10
4 T&C exports to the U.S and the EU 11
4.1 Recent trends, 2000–2016 11
4.2 The China factor and global competition 16
5 Conclusions and implications for policy 20
References 21


1
1 Introduction
After nearly 50 years of trade restrictions under three successive regimes: Short-Term
Arrangement, Long-Term Arrangement and the Multi-fibre Agreement (MFA), with the coming
of the World Trade Organization in 1995, a 10-year quota phasing out transitional period
governed by the Agreement on Textile and Clothing (ATC) was agreed upon, in which quota
restrictions on world trade in textile and clothing (T&C) was to be phased out progressively,
down to zero by the end of 2004—thus subjecting T&C to the same multilateral trade rules as
other industrial products under GATT/WTO. Although the elimination of quota and other
restrictions on T&C sector was delayed by another four years, to December 2008, the long-
awaited goal of liberalizing the T&C has been achieved. Considering the scale of exposure to
global competition that the end of MFA created, especially for those countries that enjoyed
preferential market access regimes, it is important to evaluate what the impact might have been,
now close 10 ten years after the MFA departure. We step back and look at the impact of the
MFA departure on textile and clothing industry in Lesotho, one of Africa’s industry leader.1
As pointed out in several studies, the end of MFA generated a lot of concern in those countries
that were enjoying preferential market access regimes. They worried mainly about losing their
preferential access to the U.S and EU markets, and about global competition especially from large
Asian countries that have well established textile and clothing industries. Under the MFA regime,
major importing countries used a combination of quotas, high tariffs and nontariff measures (NTBs)
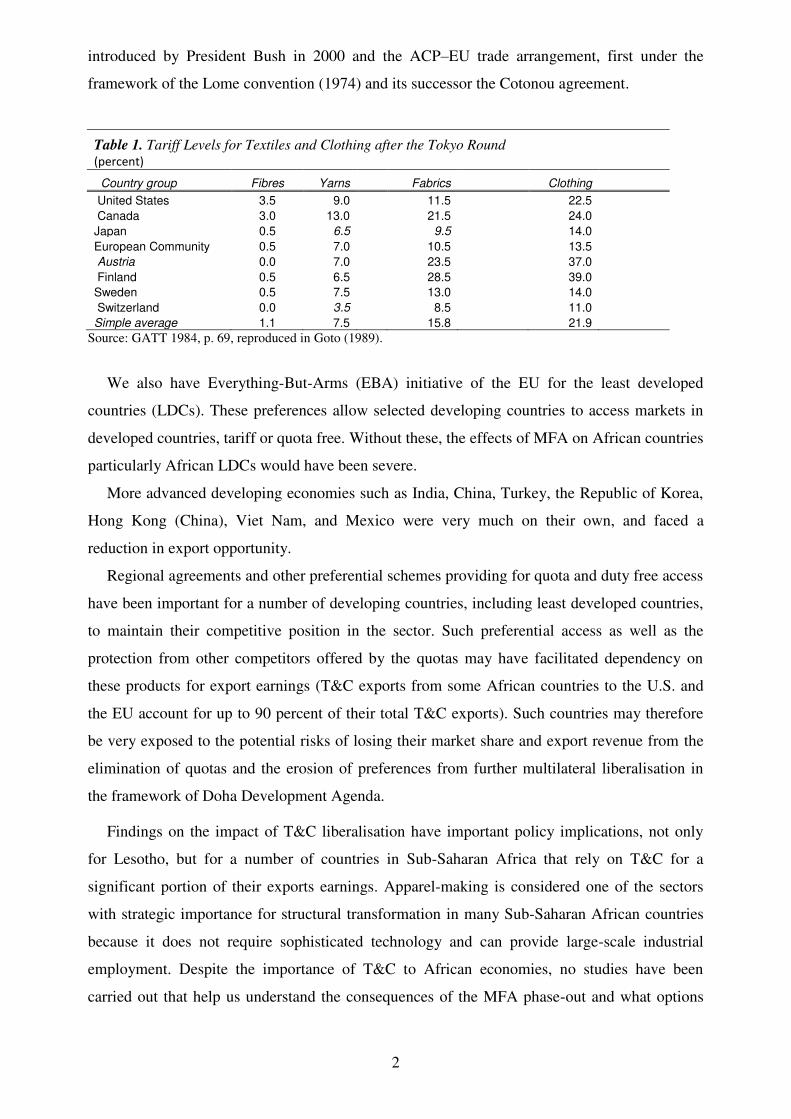
on extensive scales to protect their markets from global competition. Table 1 shows the tariff rates
on textile and clothing after the Tokyo round of GATT negotiations, which was almost three times
higher than that on manufactured goods as a whole.
In addition, the share of textile and clothing imports subject to non-tariff measures (NTBs)
was two to three times that for manufactured imports as a whole (Goto, 1989). Because MFA
restrictions were imposed only on low-cost suppliers, textile and clothing imports from
developing countries were more likely to be subject to NTBs than those from industrial
countries.
For most African countries, the impact of MFA was partly offset by preferential schemes
most of which derive their legal basis from the generalised system of preferences (GSP) under
the framework of the GATT e.g. the U.S’ African Growth and Opportunity Act (AGOA),
1 In this paper we use MFA and ATC phase-out interchangeable to mean the same thing.
2
introduced by President Bush in 2000 and the ACP–EU trade arrangement, first under the
framework of the Lome convention (1974) and its successor the Cotonou agreement.
Table 1. Tariff Levels for Textiles and Clothing after the Tokyo Round (percent)
Country group Fibres Yarns Fabrics Clothing
United States 3.5 9.0 11.5 22.5
Canada 3.0 13.0 21.5 24.0
Japan 0.5 6.5 9.5 14.0
European Community 0.5 7.0 10.5 13.5
Austria 0.0 7.0 23.5 37.0
Finland 0.5 6.5 28.5 39.0
Sweden 0.5 7.5 13.0 14.0
Switzerland 0.0 3.5 8.5 11.0
Simple average 1.1 7.5 15.8 21.9
Source: GATT 1984, p. 69, reproduced in Goto (1989).
We also have Everything-But-Arms (EBA) initiative of the EU for the least developed
countries (LDCs). These preferences allow selected developing countries to access markets in
developed countries, tariff or quota free. Without these, the effects of MFA on African countries
particularly African LDCs would have been severe.
More advanced developing economies such as India, China, Turkey, the Republic of Korea,
Hong Kong (China), Viet Nam, and Mexico were very much on their own, and faced a
reduction in export opportunity.
Regional agreements and other preferential schemes providing for quota and duty free access
have been important for a number of developing countries, including least developed countries,
to maintain their competitive position in the sector. Such preferential access as well as the
protection from other competitors offered by the quotas may have facilitated dependency on
these products for export earnings (T&C exports from some African countries to the U.S. and
the EU account for up to 90 percent of their total T&C exports). Such countries may therefore
be very exposed to the potential risks of losing their market share and export revenue from the
elimination of quotas and the erosion of preferences from further multilateral liberalisation in
the framework of Doha Development Agenda.
Findings on the impact of T&C liberalisation have important policy implications, not only
for Lesotho, but for a number of countries in Sub-Saharan Africa that rely on T&C for a
significant portion of their exports earnings. Apparel-making is considered one of the sectors
with strategic importance for structural transformation in many Sub-Saharan African countries
because it does not require sophisticated technology and can provide large-scale industrial
employment. Despite the importance of T&C to African economies, no studies have been
carried out that help us understand the consequences of the MFA phase-out and what options

3
exist for African governments to reinforce their presence in global T&C trade for their
development. The post-MFA literature on T&C sector in developing countries2 have
concentrated primarily on the Asian developing countries—Mainland China, India, Turkey, the
Republic of Korea, Hong Kong, Viet Nam, Bangladesh, Mexico and Indonesia—with very little
reflection on Africa more especially on LDCs, which Lesotho is part.
The rest of the paper is organized as follows: the second section provides a detailed account
of the Lesotho textile and apparel sector. The third section delves on the T&C trade, which
extends to the discussion on T&C export to the US and EU markets in section four, and section
five concludes.
2 The textile & clothing industry in Lesotho’s economy
2.1 Structural changes in the economy
The structure of Lesotho’s economy over the last two decades shows relatively stable shares of
the different economic sectors in GDP—a product of the country’s structural adjustment
programme implemented from the late 1980s to 1990s and effort by the government to improve
critical infrastructure (e.g. the construction of the Lesotho Highlands Water Project).3 Other
factors that have played crucial role in Lesotho’s economy include the development of labour-
intensive manufacturing sector, the growth of the textile industry driven partly by increase in
foreign direct investment in the T&C sector, and reduced reliance on remittance from migrant
workers. In the late 1980s almost half of its GNP was based upon remittances from over
120,000 male migrant labourers, mostly in South Africa’s gold mines. Today, only half that
number of migrants is employed.
By contrast, the manufacturing sector in Lesotho has grown rapidly. Today it employs over
60,000 workers, most of whom are women in the textile industry. Manufacturing sector now
accounts for the bulk of industrial output in Lesotho, at 20.6 percent of GDP in 2002/3 and 14
percent in 2009/10, with textile and clothing (T&C) being the dominant sub-sector. T&C sector
is the third contributor to Lesotho's GDP (with 7.7% share of GDP) after agriculture (7.9%) and
the construction sector (9.6%). T&C remains the backbone of Lesotho's manufacturing and
2 For example, Goto (1989) found that a dramatic growth of clothing exports from developing countries occurred in spite of a high level of tariffs and nontariff barriers. 3 Public revenue increased as Lesotho Highlands Water Project (LHWP)-related imports led to an increase in SACU receipts (from 5 percent of GNI prior to 1988/89 to 14 percent in the 1990s) and because of water royalties after the completion of the first phase of the LHWP in 1996. The textile and garment industry developed rapidly.

4
export sector, accounting for about 60 percent of its total exports in 2016 and has continued its
rapid expansion. Other manufacturing industries include leather, food and beverages, consumer
electronics, clay-based brick and ceramic tiles, television assembly, and edible oils.
2.2 GDP growth trajectory
In the 1960-70, Lesotho’s economy grew at an average rate of 4.6 percent per annum—with
over 10 percent of that growth contributed by T&C sub-sector. Between 1970 and 1979 the
economy grew at an average of 7 percent per annum (with growth averaged 8 percent between
1970/71 and 1974/75). However, the effect of the 1980s oil crisis and the financial crisis of
1998, slowed down the economy, to an average growth of 2.8 percent per annum between
1980/81 and 1986/874. Growth rebound to 4 percent between 1982/83 and 2002/03 (with 6%
growth per annum achieved between 1987/88 and 1997/98).
After three years (2000 – 2003) of slow and stagnated growth (below 4 percent), the
economy picked up in 2004 and in 2007 it grew by 7.7 percent growth, making the fourth
consecutive years of strong economic growth.
Figure 1 GDP growth by key economic sectors
The robust economic growth resulted in the creation of 234,900 jobs and a fall in the rate of
unemployment to 2.1 percent in 2007. Tax revenue increased by 24.9 percent in 2007 over the
previous year (2006) collection. However, the slowdown in global economy brought about by
the financial and global economic crisis of the late-2008–2010, coupled with high food and fuel
prices, put the economy back on a downward trajectory. GDP dropped from an average of over
-15
-10
-5
0
5
10
15
20
19
94
19
95
19
96
19
97
19
98
19
99
20
00
20
01
20
02
20
03
20
04
20
05
20
06
20
07
20
08
20
09
20
10
20
11
20
12
20
13
20
14
20
15
20
16
Agriculture Industry Services GDP

5
6 percent to an annual average of less than 3 percent between 2008 and 2010 and 3.2 percent for
the period 2000–2009. Clothing exports to the U.S. declined and so did exports to the SACU
region, especially South Africa, which led to a sharp decline in the SACU revenue, Lesotho's
main source of public revenue. With weak global demand especially in Euro area (largest
market for diamonds), the prices of rough diamonds fell by 50 per cent during the first quarter
of 2009 alone.
In 2010, Lesotho economy began to recover; and between 2011 and 2014 the economy grew
at an average rate of about 5 percent, with over 5 percent recorded in 2011 and 6.6 percent in
2012, despite the severe floods of 2011, which destroyed crops and reduced agricultural output.
Growth in construction and mining activities, reflecting new mine investments4, contributed to
maintaining positive growth rates. Although the mining sector experienced a slight dip of 6.1
percent in the aftermath of the 2008–2010 financial and global economic crisis, it picked up
again following improvement in the global prices of diamonds. This was helped by the
Government decision to have the diamond cut and polished in Lesotho.
Recent growth has been driven by performance of the mining sector, information and
communication sector, and the construction sector.
The economy is projected to grow at 3.5 percent in 2017 as mining activities drop and at 4.3
percent in 2018. The driver of this growth, beginning 2018, will be construction activities under
Phase II of the Lesotho Highland Water Project (LHWP). Lesotho’s economy is still highly
dependent on subsistence agriculture. Most people live in the rural areas where poverty is
widespread.5
In order to effectively tackle the problem of poverty and combat unemployment in the long-
term, the country will need to become increasingly competitive to attract foreign capital for
investment and job creation. There seems to be a positive progress in that direction considering
the move by government to modernize the legislation on financial services and open up the
telecommunications sector to competition. These efforts should assist in creating a favourable
atmosphere for foreign investment. Infrastructural problems in the water, power, and transport
industries may constrain industrial development, and government is trying to find an enduring
solution to these challenges. Government is also exploring ways to develop the tourism sector to
diversify the economy and reduce pressure on few commodities exports. Lesotho’s
mountainous terrain is seen as a major asset for tourism industry.
4 The mining industry is governed by the Mines and Minerals Act 2005. 5 Although the growing garment sector has picked up some of the slack, the wage and gender structure of employment is very different, and incomes and remittances have fallen.

6
2.3 Growth of textile & apparel sector
The garment sector, which has grown rapidly under foreign investment, has been the big
success in boosting Lesotho’s industrial base in recent years. As various studies note, this is
giving rise to capacity constraints domestically; concerns are also expressed about the long-term
viability of the sector in terms of linkages to the rest of the economy and its dependence on
unilateral preferential access, particularly under the African Growth and Opportunity Act. The
authorities are well aware of these potential problems.
The rapid growth of the textile industry has been made possible largely as a result of the
preferential trade arrangement with the United States under the African Growth and
Opportunity Act (AGOA) initiative for which Lesotho became eligible in 2000. AGOA has
created preferential terms of trade on a range of products manufactured in Africa for the U.S
market. Through this, over 40,000 jobs have been created in the private sector. Some
households have been able to find work, mostly for younger female members, in the new textile
industries. Indeed, the contribution of textile and clothing sub-sector to employment is by far,
higher than that of the public service – showing the significant contribution the sub-sector can
make to growth and tax revenue. Textiles and clothing sub-sector accounts for over 60 percent
of the manufacturing base, and about 50 percent of post–MFA investment has gone to the
manufacturing sector.
2.4 Lesotho’s industrial & trade policies and emerging issues
in T&C sector
Future sustainability or further expansion of the textiles and apparel sector will depend on
robust policies and efforts to address some of the key constraints facing the sector including
strengthening backward linkages, and in particular, knitted fabric mills; erratic supplies of water
to the major industrial estates; lack of serviced industrial sites, and conditions and handling
facilities at the Maseru railhead. Problems of document clearance and customs inspection
(related to the distance between the points of import and Maseru, where final verification of
documents takes place).
As Figure 4 illustrates, it takes up to 35 days in Lesotho to receive the imported materials
and 31 days for its finished products to reach the export market, much different for its
competitors for the U.S. such as Cambodia, Vietnam and Pakistan (due to differences in
distance to key input markets). In the modern business environment of just-in-time production

7
and delivery, U.S buyers would prefer to place their orders with such countries whose lead time
is shorter.
Figure 2. Time in days, it takes to import and export for selected T&C exporters
Beside, government needs to figure out alternative market when AGOA comes to an end. For
years, the sector lived with uncertainty about the renewal of the AGOA framework and its third-
country fabric rule.
The AGOA third-country fabric provision was renewed in 2012 for three more years until
September 2015, and later renewed for ten more years until September 2025, which restored
confidence once more among suppliers in the cotton-textiles - apparel value chain to plan their
activities. Whether AGOA gets another extension is something hard to tell, but it is perhaps
time to experiment with other markets. Recently, as Rand continued to appreciate against the
dollar, the Government realised that it needed to put top priority on improving the
competitiveness of the textile and diversifying its markets and products, including seeking new
markets for textile in SACU, SADC, and other African countries.
The country is coming to term with the lost of trade preferences under the Multi-Fiber
Agreement on Textiles and Clothing (ATC), which Lesotho enjoyed as an LDC. The
Agreement expired on 1 January, 2005, exposing Lesotho to stiff competition from the Asian
producers. The second setback in recent years has been the falling global demand associated
with the global economic crisis of 2009–2010, which led to fall in output and near close of shop
by textile companies and threatening loss of over 40,000 jobs.
The responsibility for the development and management of Lesotho's industrial and trade
policies is vested on the Ministry of Trade and Industry (MTI). The MTI chairs the Inter-
Ministerial task team for the textiles and apparel industry which is in charge of analysing
industry performance and making recommendations on ways to make Lesotho a more competitive
0 10 20 30 40
Cambodia
Vietnam
Pakistan
Bangladesh
Lesotho
Time to import (No of days)
Time to export (No. of days)

8
investment destination. Another important institution for the manufacturing sector is the Lesotho
National Development Corporation (LNDC), whose major role is to facilitate the development
of manufacturing industries, and to promote investment.
Clothing and textiles sectors carry the highest average duties of the SACU tariff schedule.
For clothing, the average CET was 40.6 percent in 2014 with rates ranging between zero and 45
percent6, while for textiles, the average CET was 16.9 percent with rates varying from zero to
30 percent, when excluding non-ad valorem tariffs (i.e. four lines). For manufactured products
(WTO definition) the CET was 8 percent.
Lesotho applies a favourable fiscal regime for firms engaged in manufacturing activities.
These firms are subject to a corporate tax of 10 percent, compared to 25 percent for other
activities. There is also no withholding tax on dividends. Building companies, as well as hotels
and casinos can also benefit from different tax incentives. Other incentives granted to the
manufacturing sector are those administered by the LNDC which focus mainly on investment.
The textile and apparel sector is also one of the main beneficiaries of the SACU rebate 470.03.7
Under this programme, registered companies are exempted from duties on imports of raw
materials from outside SACU as long as they use these inputs to produce goods destined for
export outside the SACU area. If the final good is exported to the SACU area, exporters must
pay the import duties that were initially exempted.
2.5 Investment & Asian’s footprint in Lesotho’s textile-apparel value chain
Lesotho’s economy depends heavily on export-oriented FDI in the apparel industry for export
revenue and employment. Lesotho has been able to attract investors in the sector partly by
providing, in certain cases, ready-made factory shells and serviced industrial sites. The bulk of
the FDI is from South Africa, UK, US, Australia and the EU, but in recent years increasing
number of investors are coming from Asian countries, notably, China and India.
Although reliable data on investment in Lesotho is hard to come by, some estimates (by
UNCTAD for example), suggest that since 1991, FDI inflows into Lesotho, in U.S. dollar
terms, have been rising rapidly, albeit with significant year-on-year fluctuations; recent
investment being mostly in export-oriented manufacturing.
As of March 2014, there were 74 companies operating in the textile and clothing sector in
Lesotho, majority of which were owned by investors from South Africa (45%), Chinese Taipei
6 All tariffs within this product category are ad valorem. 7 Rebate under item 470.03 of the Tariff Book (Schedule 4).

9
(34%) and China (4%).8 The Asian companies have succeeded to position themselves well in
the textile-apparel value chain to take advantage of U.S. market concessions under the AGOA
scheme. They have increasingly become integrated into American value chains. Meanwhile,
companies owned by South Africans are attracted mainly by wage differentials and participate
in regional value chains. Yet, Lesotho could take better advantage of its integration into value
chains by diversifying into other products and markets and conducting tasks with a higher
added value.
Asian companies are increasing their footprint in the whole cotton-textile-apparel value
chain, in cotton acquisition and production. Increasing number of Asian traders are arriving in
Lesotho and neighbouring countries where they engage directly in the plantation, purchase, and
manufacturers.
3 The textile and apparel trade
3.1 T&C export intensity
Lesotho's economy relies mainly on apparel industry, which account for 60 percent of total
exports (Figure 3). With high export concentration, external vulnerability remains a problem. This
challenge also applies to Mauritius and, to a certain extent to Madagascar as well.
Figure 3. Lesotho Textiles and Clothing Export Product Share (percent)
8 Information provided by the authorities.
82.2%Lesotho Export
Product Share (%)
64.7%
6.8%
Mauritius Export
Product Share (%)
34.98%
Madagascar
Export Product
Share (%)
23.3%
0
10
20
30
40
50
60
70
80
90
Kenya Export Product Share (%) Swaziland Export Product Share (%)

10
The experience of the twentieth century and recent global economic crisis ( 2008– 2010) has
shown that countries with economies dependent on revenues from a few primary commodity
exports and foreign inflows are likely to suffer big swings of income through causes over which
they frequently have little or no control (Ayoki, 2011). The high export concentration is
compounded by a concentration of exports in a few export markets, especially the U.S and the
EU. There is a pending job for Government particularly, to identify new areas of comparative
advantage and to re-structure and diversify the economy and export base.
3.2 Textiles & clothing exports and imports
Figure 4 gives some indication of the evolving the trend in Lesotho textile and clothing trade.
Over the last decade, textile and clothing export has been rather erratic. It suffered a sharp fall
in the eve of the global economic and financial crisis in 2008 and 2009, exports declined, and
tried to recover, aftermath of the crisis, but not yet fully until now when judged by the 2004
exports.
Figure 4. Evolution of Lesotho textile and clothing trade, 2000–2012 in million $US
Source: World Bank WITS database
As mentioned already before, 2008 coincided with the phase out of the MFA restrictions which
partly explain the decline, but the greater contributor to the 2008 decline is the fall in global
demand triggered by the financial crisis. As the U.S. economy improved in 2011, a positive
trajectory emerged, facilitated by the renewal of the AGOA third-country fabric provision in
2012 and the depreciation of the loti against the U.S. dollar in 2013. With the renewal of this
provision, apparel goods produced in lesser developed AGOA beneficiary countries with yarn
and fabric imported from abroad can continue to benefit from duty-free access to the U.S.
Lesotho Exports
Lesotho Imports
0
100
200
300
400
500
600
700
800
2000 2001 2002 2003 2004 2008 2009 2010 2011 2012

11
market.9 T&C imports have been subdued, but after 2008 it began to grow and if the trend
continues it will soon overtake exports.
Figure 5 shows a significant and persistent year-on-year gap between Lesotho’s share in
world T&C exports and imports over the last two decades. In 2008, Lesotho accounted for
0.021 percent of world T&C exports and 0.063 percent of world T&C imports.
Figure 5. Lesotho’s shares in world textile and apparel exports and imports (percent)
In 2009, these shares dropped to 0.018 percent for exports and 0.060 percent for imports, and
stagnated around 0.029 percent for exports during 2013 and 2016 while rising for imports,
reaching 0.083 percent in 2016. Although Lesotho’s T&C exports exceed its imports in nominal
terms (Figure 4), the country’s share in world T&C imports far exceed its world share in T&C
export (Figure 4) —meaning that at world stage, Lesotho is a more important importer of T&C
than an exporter of the same (T&C).
4 T&C exports to the U.S and the EU
4.1 Recent trends, 2000–2016
Lesotho's apparel exports remains concentrated in one market, the United States, and in very
few products: jeans and knitted garments. During 2008-2016, on average 65 percent of textile
and garment exports were destined for the U.S. market and almost all entered under the AGOA
scheme. Other export markets for Lesotho apparel are Canada, Australia, Mexico, Mauritius and the
European Union.
9 In June 2015, the AGOA programme (including the third-country fabric provision) was extended until
2025.
0.063%
0.060%
Share in world
T&C imports
0.021%
0.018%
Share in world
T&C exports
0
0.02
0.04
0.06
0.08
0.1
0.12
12
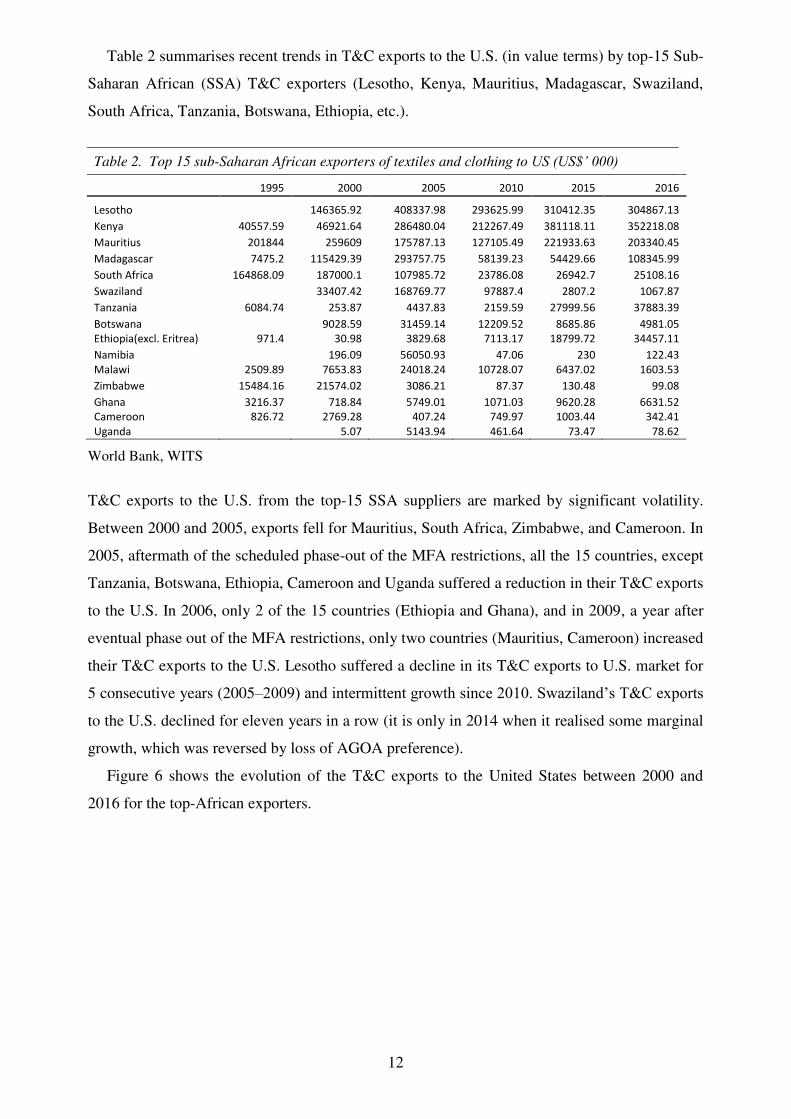
Table 2 summarises recent trends in T&C exports to the U.S. (in value terms) by top-15 Sub-
Saharan African (SSA) T&C exporters (Lesotho, Kenya, Mauritius, Madagascar, Swaziland,
South Africa, Tanzania, Botswana, Ethiopia, etc.).
Table 2. Top 15 sub-Saharan African exporters of textiles and clothing to US (US$’ 000)
1995 2000 2005 2010 2015 2016
Lesotho
146365.92 408337.98 293625.99 310412.35 304867.13
Kenya 40557.59 46921.64 286480.04 212267.49 381118.11 352218.08
Mauritius 201844 259609 175787.13 127105.49 221933.63 203340.45
Madagascar 7475.2 115429.39 293757.75 58139.23 54429.66 108345.99
South Africa 164868.09 187000.1 107985.72 23786.08 26942.7 25108.16
Swaziland
33407.42 168769.77 97887.4 2807.2 1067.87
Tanzania 6084.74 253.87 4437.83 2159.59 27999.56 37883.39
Botswana
9028.59 31459.14 12209.52 8685.86 4981.05
Ethiopia(excl. Eritrea) 971.4 30.98 3829.68 7113.17 18799.72 34457.11
Namibia
196.09 56050.93 47.06 230 122.43
Malawi 2509.89 7653.83 24018.24 10728.07 6437.02 1603.53
Zimbabwe 15484.16 21574.02 3086.21 87.37 130.48 99.08
Ghana 3216.37 718.84 5749.01 1071.03 9620.28 6631.52
Cameroon 826.72 2769.28 407.24 749.97 1003.44 342.41
Uganda
5.07 5143.94 461.64 73.47 78.62
World Bank, WITS
T&C exports to the U.S. from the top-15 SSA suppliers are marked by significant volatility.
Between 2000 and 2005, exports fell for Mauritius, South Africa, Zimbabwe, and Cameroon. In
2005, aftermath of the scheduled phase-out of the MFA restrictions, all the 15 countries, except
Tanzania, Botswana, Ethiopia, Cameroon and Uganda suffered a reduction in their T&C exports
to the U.S. In 2006, only 2 of the 15 countries (Ethiopia and Ghana), and in 2009, a year after
eventual phase out of the MFA restrictions, only two countries (Mauritius, Cameroon) increased
their T&C exports to the U.S. Lesotho suffered a decline in its T&C exports to U.S. market for
5 consecutive years (2005–2009) and intermittent growth since 2010. Swaziland’s T&C exports
to the U.S. declined for eleven years in a row (it is only in 2014 when it realised some marginal
growth, which was reversed by loss of AGOA preference).
Figure 6 shows the evolution of the T&C exports to the United States between 2000 and
2016 for the top-African exporters.

13
Figure 6. Changes in the volume of T&C exports to the United States, 2000–2016 (percent)
-30-20-10
0102030405060
Lesotho
-40
-20
0
20
40
60
80
100
120
Kenya Mauritius
-150
-100
-50
0
50
100
Swaziland
-60
-40
-20
0
20
40
South Africa
-100
-50
0
50
100
150
200
Madagascar
-200
-100
0
100
200
300
400
500
Tanzania
-1000
0
1000
2000
3000
Ethiopia
-100
0
100
200
Botswana

14
All the top-15 countries, except Swaziland, are eligible for trade preferences under the U.S.
African Growth and Opportunity Act (AGOA) initiative, which has since been renewed three
times. In June 2015, the Trade Preferences Extension Act of 2015 simultaneously extended the GSP
programme until 31 December 2017 and AGOA until 30 September 2025. Eligible countries
qualify for duty-free and quota-free access to the U.S. market for a range of products, including
selected agricultural and textile products (except for "wearing apparel"). To be eligible for
AGOA benefits, a number of conditions are laid out, including proven progress in establishing a
market-based economy; commitment and action in developing political pluralism and the rule
of law; eliminating discriminatory barriers to U.S. trade and investment; adequate protection of
intellectual property; combating corruption; and protecting human rights, e.g. those specifically
related to labour, particularly the abolition of certain child labour practices. Swaziland's
eligibility was terminated in 2014, due to issues related to worker rights. As a result,
Swaziland’s apparel exports to the U.S fell by 97.1 percent in 2015.
The Africa Investment Incentive Act of 2006, AGOA IV, which amended the textile and
apparel provisions of the AGOA, provides duty-free and quota-free treatment for eligible
apparel articles made in qualifying Sub-Saharan African countries. To export apparel (and
certain textile items) to the United States under the AGOA, countries must implement a "visa
system" to ensure compliance with the required rules of origin. Sub-Saharan African countries
may use non-U.S. fabric and yarn in apparel wholly assembled in their countries and still
-200
0
200
400
600
800
Ghana Cameroon
-200
-100
0
100
200
300
400
500Malawi Zimbabwe
-2000
200400600800
1000
Namibia
-40
-20
0
20
40
Sub-Saharan Africa

15
qualify for duty- and quota-free treatment. AGOA IV continues to grant “lesser developed
beneficiary” country status to Botswana, Lesotho, and Namibia, qualifying them for the Special
Rule.
As Table 3 shows T&C export to United States is very concentrated on a few countries:
Lesotho, Kenya, Mauritius, Madagascar and South Africa, which account for over 90 percent of
Sub-Saharan Africa T&C exports to the United States as a group.
Table 3. Participation in the Sub-Saharan’s T&C export to the United States, 1995 – 2016 (percentage share)
1995 2000 2005 2010 2015 2016
Lesotho - 17.53 25.81 34.56 28.94 28.14 Kenya 8.97 5.62 18.11 24.98 35.53 32.51
Mauritius 44.65 31.09 11.11 14.96 20.69 18.77
Madagascar 1.65 13.82 18.57 6.84 5.07 10.00
South Africa 1.65 13.82 18.57 6.84 5.07 10.00
Swaziland 0.00 4.00 10.67 11.52 0.26 0.10 Tanzania 1.35 0.03 0.28 0.25 2.61 3.50
Botswana 0.00 1.08 1.99 1.44 0.81 0.46 Ethiopia(excl. Eritrea) 0.21 0.00 0.24 0.84 1.75 3.18
Namibia 0.00 0.02 3.54 0.01 0.02 0.01 Malawi 0.56 0.92 1.52 1.26 0.60 0.15
Zimbabwe 3.43 2.58 0.20 0.01 0.01 0.01
Ghana 0.71 0.09 0.36 0.13 0.90 0.61
Cameroon 0.18 0.33 0.03 0.09 0.09 0.03
Uganda 0.00 0.00 0.33 0.05 0.01 0.01
Source: World Bank WITS database.
Most of these countries have well established textile and apparel industries. Lesotho and
Swaziland have apparel-making clusters that consist of predominantly foreign investors; the
same with South Africa and Botswana, and other SSA African countries. In South Africa, for
example, we have over 1,000 apparel manufacturers, mostly white and Indian immigrants and
investors from mainland China and Taiwan. In Botswana, most of the apparel factories found in
industrial areas in Gaborone and Francistown are owned by investors from China, India, and
Mauritius. The decline of their apparel exports (Figure 5) is partly caused by the influx of Asian
imports into their domestic markets.
Table 4. Growth of SSA clothing and textile exports, 2000–2004
2000–2005 2000–2005 2000–2005 2006
Country Exports $
‘000 US share
(%) AGOA as share of exports to US (%)
AGOA as share of exports to US (%)
Kenya 199,000 94.12 93.34 97.50
Lesotho 345333.3 96.43 90.30 99.40 Madagascar 635166.67 32.73 85.34 96.00 Mauritius 1564666.67 16.08 51.86 92.10 South Africa 835333.33 37.92 48.82 53.10
Swaziland 133000.00 94.28 77.40 99.50
16
4.2 The China factor and global competition
Traditionally, the Asian developing countries especially the Asian Tigers have dominated
global T&C exports. In the run up to the scheduled date for MFA phase out, there were
concerns that because textile products from Asian countries are no longer limited by the quota
system in the export destination markets, their low price would allow them to quickly grab a
large portion of Africa’s export market in the United States and Europe. Consequently, textile
and apparel exports from Africa to the U.S. market would fall, and a large number of factories
could close down.
While T&C exports from African countries declined in aftermath of the MFA phase out, we
find no evidence to suggest that the T&C exports (from Africa to the main industrialised
markets particularly the U.S. and the EU) fell as result of competition from textiles products
from Asian countries. There are indications that imports from Asian countries to African
countries grew substantially after liberalisation of T&C trade; the influx of Asian T&C imports
into African domestic markets, appears to be the worse threat to the existence of the textile
industries in Africa.
The East Asia and Pacific countries accounted for more than half of the U.S T&C imports
when the MFA quota restrictions were still in place and accounted for the same rate after MFA
phase out. So, to assume that Asian products displaced African products may be unfounded.
Between 1995 and 2016, the East Asia and Pacific countries’ share in the U.S’ T&C import
basket grew by 15 percentage points, from 42.76 percent in 1995 to 57.42 percent in 2016.
Between the scheduled dates of elimination of MFA restrictions (December 2004) and actual
phase out of MFA restrictions in 2008, East Asia and Pacific’s T&C exports to the US rose by
14.3 percentage points, from 42.7 percent in 2004 to 57 percent in 2009.
Since the complete elimination of MFA quotas and other restrictions in December 2008, the
share of East Asia and Pacific countries in the U.S’ T&C import basket has grown at an annual
average of less than one-tenth of a percentage point (0.06 ppt.) over the last seven years (2009–
2016) compared with average growth of 2.5 percentage points per annum over the seven years
period prior to MFA phase out (2002–2008). In fact, the region’s annual share in the U.S’ T&C
import has stagnated around 57.6 percent since 2011. Between 2005, the scheduled year of
elimination of MFN restriction and 2008, when the restrictions were eventually eliminated,
South Asia’s share in the U.S’ T&C import basket grew by 2.2 percentage points, from 12.1
percent in 2004 to 14.3 percent in 208. A year later, in 2009, South Asia increased its share in

17
the U.S’ T&C import basket by 0.7 percentage points and thereafter, at an average of one-fifth
of a percentage point per annum (twice the growth in East Asia & Pacific during the same
period) compared to 0.32 percentage point growth per annum achieved over the last seven years
preceding the MFA phase out.
China is the biggest T&C exporter to the U.S (account for the bulk of East Asia and Pacific
exports). However , but the ability of China to expand its clothing and textile exports to the
United States in the initial years of the end of ATC faced some constraints. The terms of
China’s accession to WTO, permit the United States and other WTO members to impose
safeguard measures on Chinese clothing and textiles exports if they were prove “disruptive” to
the domestic U.S. clothing and textile markets. The United States imposed safeguard measures
in 2004 and 2005, and negotiated a “memorandum of understanding” with China that continued
quotas on selected items until 2008, initially.
As results suggest, the removal of MFA restrictions was followed by year-on-year reductions
in growth of Asia’s T&C exports to the U.S. That largely rules out global competition from
Asia as the major cause of the decline of Africa’s T&C exports to the U.S. The scenarios for
Latin America and the Caribbean, as well as Europe and Central Asia and North America as
illustrated in Figure 7, also rules out competition from these regions because their share in U.S.
T&C imports declined, following MFA phase out in 2008. Other factor(s) other than global
competition explain Africa’s T&C exports performance.
Figure 7. Share in US textiles and apparel imports (PERCENT)
Notes: East Asia & Pacific region includes Cambodia, China, Fiji, Indonesia, Kiribati, Korea, the People's Democratic Republic of Lao (Lao PDR), Malaysia, Marshall Islands, FS Micronesia,
42.76
East Asia & Pacific57.42
Europe & Central
Asia 6.18
21.03
27.61Latin America &
Caribbean
13.93
2.73North America
South Asia16.32
0.950.00
10.00
20.00
30.00
40.00
50.00
60.00
70.00
19
95
19
96
19
97
19
98
19
99
20
00
20
01
20
02
20
03
20
04
20
05
20
06
20
07
20
08
20
09
20
10
20
11
20
12
20
13
20
14
20
15
20
16
Middle East & North Africa
Sub-Saharan Africa

18
Mongolia, Palau, Papua New Guinea, the Philippines, Samoa, Solomon Islands, Thailand, Timor-
Leste, Tonga, Vanuatu, and Vietnam. Source: World Bank database - WITS
In the immediate aftermath of MFA phase out, T&C exports to U.S. decline for all the
exporting regions. Sub-Saharan Africa’s T&C exports to U.S. declined by 21.2 percent (US$
0.3 billion) in 2009 as the overall U.S. T&C imports declined by 13.7 percent (US$ 13.76
billion), East Asia & Pacific by 10.7 and South Asia by 9.5 percent. Over the last eight years of
liberalized T&C sector (2008 – 2016), the share of Sub-Saharan Africa in the US’ T&C imports
basket declined from 1.25 percent in 2008 to 0.95 percent in 2016. While the decline in growth
of South Asia’s share in the US T&C import basket reflects the decline in the dependency of
South Asia on T&C exports, the decline in the Sub-Saharan Africa’s market share in the US
T&C imports has no discernable impact on the region’s export diversification.
Between 2003 and 2016, the share of the T&C sector in the South Asia’s total export basket
declined by 17 percentage points, from 35.1 percent in 2003 to 18.12 percent in 2016. As
illustrated in Figure 8, there has been a general slow-down in the flow of exports (T&C) to the
U.S. for all major exporters from Asia.
Figure 8. Growth in T&C exports to the U.S. from selected Asian countries, 2000–2016 (%)
-10
0
10
20
30
Indonesia
-10
0
10
20
30
Bangladesh
-20
0
20 Pakistan
-20
-10
0
10
20
East Asia & Pacific
-20
0
20
40India
-20
0
20
40
60China
19
Source: World Bank WITS database
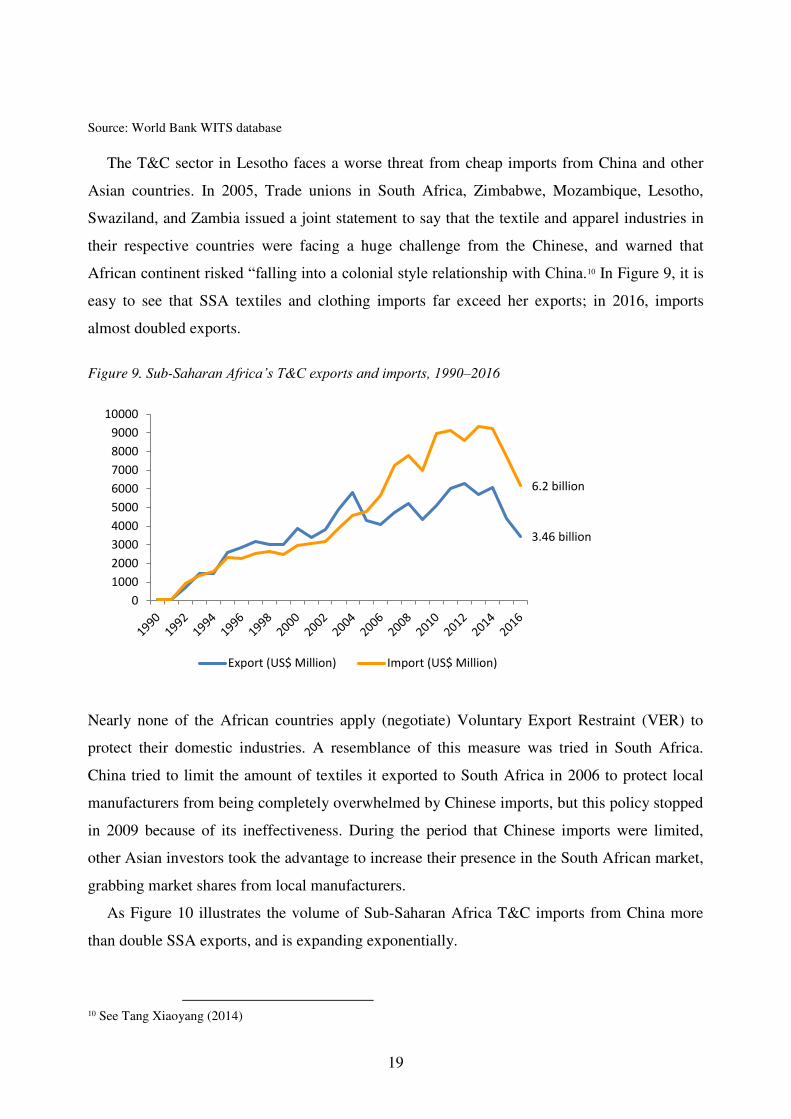
The T&C sector in Lesotho faces a worse threat from cheap imports from China and other
Asian countries. In 2005, Trade unions in South Africa, Zimbabwe, Mozambique, Lesotho,
Swaziland, and Zambia issued a joint statement to say that the textile and apparel industries in
their respective countries were facing a huge challenge from the Chinese, and warned that
African continent risked “falling into a colonial style relationship with China.10 In Figure 9, it is
easy to see that SSA textiles and clothing imports far exceed her exports; in 2016, imports
almost doubled exports.
Figure 9. Sub-Saharan Africa’s T&C exports and imports, 1990–2016
Nearly none of the African countries apply (negotiate) Voluntary Export Restraint (VER) to
protect their domestic industries. A resemblance of this measure was tried in South Africa.
China tried to limit the amount of textiles it exported to South Africa in 2006 to protect local
manufacturers from being completely overwhelmed by Chinese imports, but this policy stopped
in 2009 because of its ineffectiveness. During the period that Chinese imports were limited,
other Asian investors took the advantage to increase their presence in the South African market,
grabbing market shares from local manufacturers.
As Figure 10 illustrates the volume of Sub-Saharan Africa T&C imports from China more
than double SSA exports, and is expanding exponentially.
10 See Tang Xiaoyang (2014)
3.46 billion
6.2 billion
0
1000
2000
3000
4000
5000
6000
7000
8000
9000
10000
Export (US$ Million) Import (US$ Million)

20
Figure 10. Sub-Saharan Africa’s global exports of T&C and T&C imports from China
Why local apparel factories have managed to survive in some countries as Tang Xiaoyang
(2014) found out is because most of them specialize in segments that require fast response and
small quantity, such as fast fashion, uniforms, and work wear, which the Asian firms cannot be
able to provide. An as has been established, even in those countries with little apparel industry
remaining, like Zambia, several local companies are still producing clothing for mining
companies or uniforms for schools. This provides good lesson for African industries and policy
makers.
5 Conclusions and implications for policy
This paper examines the textile and clothing (T&C) industry in Lesotho to ascertain the initial
effects of the end of quotas and other restrictions on global trade in textile and clothing. Many
people had predicted that because textile products from Asian countries are no longer limited by
the quota system in the export destination markets, their low price would help them to quickly
grab a large portion of Africa’s export market in the United States and Europe. Consequently,
textile and apparel exports from Africa to the U.S. market would fall, and a large number of
factories could close down. Results show a dramatic decline in Lesotho’s T&C exports, both in
value terms and export share in major markets in industrialised countries: the U.S. and the EU
in the aftermath of the Agreement on Textile (ATC) phase–out. However, the decline in export
for Lesotho and Sub-Saharan African countries as a group has not been accompanied by
simultaneous or rapid shift of increasing T&C exports by Asian developing countries, who
SSA's T&C
Imports from
China US$2.793billion
SSA's T&C
Exports (Total)US$1.130 billion
0
500
1000
1500
2000
2500
3000
3500
4000

21
continue to export post-ATC at about the same levels of textile and clothing that they did before
ATC phase out. While T&C exports from Lesotho and other African countries continue to
decline, post-ATC, it is unclear if the end of the ATC quotas has been the main cause of that
decline. Results do not provide clear evidence that the termination of the ATC has been a major
contributing factor to the decline of Lesotho’s and Africa’s T&C exports. Instead, we find
evidence of simultaneous and rapid shift of increasing T&C exports from China to Lesotho and
other African markets. Compared with potential challenge from end of ATC quota, the influx of
Chinese products imposes greater danger to the textile and clothing sector in Lesotho and the
rest of Africa. Further to these, the utilisation of safeguard mechanisms by the U.S. and the
continued option to maintain tariffs and other non-tariff barriers means that the end of ATC did
not fully bring about “free trade” for clothing and textiles. These results raise important policy
issues that could be considered in the ongoing negotiations on rules: trade remedies, particularly
those dealing with safeguard and countervailing measures.
References
Ayoki, Milton, 2011. "Small is beautiful but vulnerable: the Swazi economy aftermath of the global financial crisis," MPRA Paper 81504, University Library of Munich, Germany, revised Dec 2016.
Ayoki, Milton, 2011. "Swaziland’s Fiscal Policy: The Choices Ahead," MPRA Paper 82058, University Library of Munich, Germany.
Ayoki, Milton. 2018. The impact of multi-fibre agreement phase-out on Sub-Saharan Africa’s textiles and clothing exports.
Goto, Junichi. 1989. "The multifibre arrangement and its effects on developing countries". The
World Bank Research Observer, vol. 4, no. 2 (July 1989), pp. 203-227. http://documents.worldbank.org/curated/en/355551468765857949/The-multifibre-arrangement-and-its-effects-on-developing-countries. Kingdom of Lesotho. (). Poverty reduction strategy, 2004/2005 – 2006/2007, Salm, Andrew (2002), Lesotho’s Industrial Garment Subsector: the sustainability of garment exportsand some of the constraints to further expansion.
Schuler, Philip (2002), The Initial Impact of AGOA on U.S. Imports from Lesotho, conference paper delivered at the National Conference on the Integrated Framework, March.
Steele, Peter (2002), "AGOA: New opportunities for the textile and clothing industries in Sub-Saharan Africa", Textile Outlook International, March-April 2002.
UNCTAD (2002), "Investment Policy Review of Lesotho", document UNCTAD/ITE/IPC/Misc.25. WTO. 2017. World Trade Statistical Review 2017, World Trade Organisation.
Dowlah, Caf. 2016. International Trade, Competitive Advantage and Developing Economies: How less developed countries are capturing global markets, New York: Routledge.

22
Table A5. Selected macroeconomic indicators, 2008-14
2008 2009 2010 2011 2012 2013
GDP at current prices (M million) 13,471 14,502 16,015 18,322 19,573 20,736
GDP at current prices (US$ million) 1,631 1,711 2,187 2,523 2,384 2,148
GDP growth rate (%, at 2004 constant prices) 5.7 3.4 7.9 4.0 5.0 4.6
GDP per capita at current prices (US$) 868 907 1,156 1,329 1,252 1,124
Population (million) 1.9 1.9 1.9 1.9 1.9 1.9
Unemployment, total (% of total labour force) 25.3 26.0 24.7 26.2 24.1 24.7
Inflation (CPI, % change) 10.7 7.4 3.6 5.0 6.1 4.9
GDP by expenditure at constant 2004 prices annual % change
GDP at purchasers' prices 5.7 3.4 7.9 4.0 5.0 4.6
Private consumption expenditure 4.5 3.6 8.3 7.5 1.4 0.3
Government consumption expenditure 8.9 -1.2 2.9 0.0 12.3 -0.9
Gross fixed capital formation 40.5 -8.7 14.8 1.2 21.2 16.9
Changes in inventoriesa -2.5 0.7 2.5 -6.2 0.0 1.3
Gross domestic expenditure 8.8 0.8 9.7 1.4 6.7 4.0
Exports of goods and services 10.5 -4.3 7.5 3.1 -1.2 -4.7
Imports of goods and services 11.5 -2.6 7.8 2.2 2.5 1.4
GDP by economic activity at constant 2004 prices
Agriculture, forestry and fishing 8.7 8.0 8.2 8.6 7.1 7.9
Mining and quarrying 4.3 5.1 4.9 5.6 6.6 6.0
Manufacturing 18.8 17.1 18.1 15.4 14.2 12.2
Food products and beverages 3.1 3.0 3.0 3.1 3.0 2.7
Textiles, clothing, footwear and leather 12.7 11.1 11.9 10.3 9.3 7.7
Other manufacturing 3.0 3.0 3.1 1.9 1.9 1.8
Electricity and water 4.9 5.0 4.7 4.6 4.5 4.4
Construction 5.7 5.8 6.9 6.9 8.2 9.6
Services 57.6 59.0 57.2 58.8 59.4 59.9
Wholesale and retail trade, repairs 7.8 7.6 7.6 7.9 8.4 8.9
Hotels and restaurants 1.4 1.3 1.3 1.3 1.3 1.3
Transport, and communication 7.9 8.6 8.7 9.1 9.2 9.2
(1) Transport and storage 3.2 3.2 3.1 3.1 3.1 3.2
(2) Post and telecommunications 4.7 5.4 5.6 6.0 6.0 6.1
Financial intermediation 5.6 6.2 6.6 7.2 7.4 8.2
Real estate and business services 14.6 15.0 13.6 13.6 13.5 13.2
Public administration 11.5 11.0 10.6 10.4 10.2 9.4
Education 7.4 8.0 7.8 7.7 7.3 7.0
Health and social work 1.8 1.9 1.8 2.7 3.2 3.7 Community, social and personal services 1.2 1.2 1.1 1.1 1.1 1.1 Total debt as a % of GDP 55.0 40.1 37.1 36.9 40.6 40.1 External debt as a % of GDP 49.9 36.1 31.4 31.3 34.7 35.1
Domestic debt as a % of GDP 5.1 4.0 5.7 5.6 5.9 5.0
External debt as a % of total debt 90.7 90.0 84.6 84.9 85.5 87.6
Domestic debt as a % of total debt 9.3 10.0 15.4 15.1 14.5 12.4 Debt service ratiod 5.3 4.7 1.8 2.9 2.3 5.7
a Changes in inventories as percentages of GDP of the previous year. b An increase represents an appreciation of the national currency. c Estimate for 2012 figures and CBL projection for 2013 figures. d Ratio of debt service to exports of goods and non-factor services. Source: Central Bank of Lesotho (2014), Annual Report 2013, March; Lesotho Bureau of Statistics online information. Viewed at: http://www.bos.gov.ls/; IMF online information, "International Financial Statistics". Viewed at: http://elibrary-data.imf.org/DataExplorer.aspx; and World Bank's World Development Indicator database. Viewed at: http://databank.worldbank.org/data/views/variableselection/selectvariables.aspx?source=worlddevelopment-indicators. Source: WTO

23
Table A6. Table A1.1 Merchandise exports by product group, 2008-12
(US$ million and %)
2008 2009 2010 2011 2012
Total (US$ million) 727 628 503 770 678 (% of total) Total primary products 14.4 12.5 22.4 18.0 20.6 Agriculture 14.1 12.4 21.8 17.6 20.1 Food 10.8 8.9 16.6 14.2 14.3 1110 Non-alcoholic beverages, n.e.s. 6.0 5.2 12.0 8.8 9.5 0564 Flours, meals, flakes of potatoes, fruit, veg., n.e.s. 2.0 1.2 1.7 2.4 1.6 Agricultural raw material 3.3 3.5 5.3 3.4 5.7 2681 Wool, greasy (including fleece-washed wool) 2.1 2.4 3.3 2.2 5.2 Mining 0.3 0.1 0.5 0.4 0.5 Ores and other minerals 0.3 0.1 0.4 0.2 0.4 Non-ferrous metals 0.0 0.0 0.0 0.0 0.0 Fuels 0.0 0.0 0.1 0.1 0.1 Manufactures 85.6 83.7 62.1 77.5 79.1 Iron and steel 0.0 0.0 0.0 0.0 0.0 Chemicals 0.2 0.6 0.1 0.1 0.1 Other semi-manufactures 5.4 2.9 3.4 3.7 4.1 6672 Diamonds (excl. industrial, sorted) not mounted/set 5.3 2.2 2.5 3.1 3.3 Machinery and transport equipment 13.8 12.7 10.7 8.2 11.4 Power generating machines 0.0 0.0 0.0 0.0 0.0 Other non-electrical machinery 0.1 0.0 0.0 0.0 0.0 Agricultural machinery and tractors 0.0 0.0 0.0 0.0 0.0 Office machines & telecommunication equipment 7.3 5.8 1.2 0.6 2.5 7611 Colour television receivers 7.3 5.6 0.8 0.2 2.1 Other electrical machines 6.4 6.8 9.5 7.6 8.9 7728 Parts for apparatus of 772.4, 772.5 and 772.6 4.9 5.8 7.9 5.2 5.1 7782 Electric filament or discharge lamps; arc lamps; and 0.0 0.0 0.2 1.5 2.8 parts thereof Automotive products 0.0 0.1 0.0 0.0 0.0 Other transport equipment 0.0 0.0 0.0 0.0 0.0 Textiles 3.0 4.9 4.1 4.6 3.5 6513 Cotton yarn, excluding thread 1.4 1.6 2.2 2.8 2.9 Clothing 60.1 57.7 36.3 55.8 55.6 8414 Trousers, bib and brace overalls, breeches and shorts 10.2 12.9 8.4 16.5 14.3 8442 Suits, ensembles, jackets, dresses, etc. 18.4 5.5 5.9 8.4 11.5 8454 T-shirts, singlets and other vests, knitted or 4.9 3.4 2.3 2.8 4.9 crocheted 8413 Jackets and blazers, men's/boys', not knitted or 1.1 0.8 1.8 1.5 1.6 crocheted
8437 Shirts, men's/boys', knitted or crocheted 2.6 4.3 2.6 4.7 6.4 8426 Trousers, breeches, etc., women's/girls', not 5.2 9.3 4.1 5.9 4.6 knitted/crocheted
8453 Jerseys, pullovers, cardigans, etc., knitted/crocheted 10.3 12.4 5.2 7.3 4.9 8432 Suits, ensembles, jackets, trousers, etc. 4.5 6.2 1.8 1.8 2.3 8451 Babies' garments and clothing accessories 0.3 0.3 0.5 1.0 1.2 Other consumer goods 3.1 4.9 7.5 5.0 4.5 8515 Other footwear with uppers of textile materials 1.1 1.7 1.5 1.1 1.5 8512 Sports footwear 0.8 1.8 2.9 1.6 1.2 8514 Other footwear, leather or composition leather 0.4 1.0 2.2 1.8 1.4 uppers Other 0.0 3.8 15.5 4.5 0.3
Source: WTO Secretariat's estimates, based on information provided by the authorities (2008) and UN Comtrade (SITC Rev.3).

24
Table A7. Merchandise imports by product group, 2008-12
(US$ million and %) 2008 2009 2010 2011 2012
Total (US$ million) 972 1,356 1,277 1,460 1,594
(% of total)
Total primary products 37.2 41.5 33.8 41.1 36.3
Agriculture 24.6 29.9 22.8 26.6 23.5
Food 22.5 28.1 20.6 23.5 20.8
0472 Cereal groat, meal, pellets 1.0 1.2 0.8 0.9 1.6
0123 Poultry, meat and offal 1.8 2.0 1.7 1.8 1.5
0449 Other maize, unmilled 0.3 0.5 1.2 1.3 1.4
0221 Milk and cream, not concentrated/sweetened 0.2 0.6 0.7 0.8 0.9
1222 Cigarettes containing tobacco 0.9 1.0 0.8 0.8 0.9
Agricultural raw material 2.1 1.8 2.2 3.1 2.7
2631 Cotton (other than linters), not carded or combed 0.8 0.2 1.3 2.2 1.8
Mining 12.6 11.6 11.1 14.5 12.9
Ores and other minerals 0.5 0.5 0.7 0.5 0.6
Non-ferrous metals 0.3 0.2 0.1 0.1 0.1
Fuels 11.8 10.9 10.2 13.8 12.1
3510 Electric energy 0.4 0.7 0.9 0.4 1.0
Manufactures 59.2 56.8 63.5 54.6 59.8
Iron and steel 0.9 1.0 1.2 1.6 2.2
Chemicals 9.3 8.5 11.0 10.3 10.1
5429 Medicaments, n.e.s. 0.3 0.3 2.3 1.6 0.8
5821 Self-adhesive of plastics, flat shapes, other than floor, 0.0 0.3 0.6 0.8 1.8
wall and ceiling coverings etc.
Other semi-manufactures 8.2 11.9 8.8 10.0 7.5
Machinery and transport equipment 21.9 20.3 19.4 16.8 18.2
Power generating machines 0.3 0.2 0.3 0.5 0.4
Other non-electrical machinery 3.2 3.6 3.3 4.4 4.6
Agricultural machinery and tractors 0.3 0.4 0.1 0.2 0.2
Office machines & telecommunication equipment 3.5 2.8 2.2 2.0 3.0
7649 Parts and accessories for apparatus of division 76 1.7 0.9 0.7 0.6 1.9
Other electrical machines 3.5 3.5 6.8 3.7 3.0
Automotive products 10.4 10.0 6.5 6.0 6.9
7812 Motor vehicles for the transport of persons, n.e.s. 0.8 0.7 1.6 2.0 2.6
7821 Goods vehicles 0.8 1.5 1.3 1.7 1.9
7843 Other motor vehicle parts and accessories of 722, 781 to 783 1.2 1.8 2.1 1.7 1.6
Other transport equipment 1.0 0.2 0.3 0.2 0.3
Textiles 3.1 3.7 10.8 5.4 10.1
6551 Pile fabric, knitted or crocheted, coated, covered, or 0.2 0.1 2.3 0.6 1.3
laminated
6524 Other fabrics, of 85% finished cotton > 200 g/m2 0.2 0.3 2.4 0.7 1.9
6552 Other knitted/crocheted fabrics, not impregnated/coated, etc. 0.1 0.0 0.2 0.6 2.0
6531 Fabrics, woven, of synthetic filament yarn, excl. pile/chenille 0.3 0.6 1.8 0.9 1.2
Clothing 2.8 2.7 3.8 2.7 2.6
Other consumer goods 12.9 8.8 8.4 7.9 9.2
8931 Plastics containers, stoppers, lids, etc. 0.3 0.5 1.2 1.0 2.4
8928 Printed matter, n.e.s. 0.5 0.4 0.6 0.4 0.9
Other 3.6 1.7 2.7 4.3 3.8
Source: WTO Secretariat's estimates, based on information provided by the authorities (2008) and
UN Comtrade (SITC Rev.3).

Table A8. Merchandise exports by destination, 2008-12
(US$ million and %) 2008 2009 2010 2011 2012
Total (US$ million) 727 628 503 770 678
(% of total)
America 53.5 47.1 23.0 46.4 44.9
United States 53.1 31.8 21.4 40.7 43.9
Other America 0.5 15.2 1.6 5.7 1.0
Canada 0.5 15.1 1.6 5.6 0.9
Mexico 0.0 0.0 0.0 0.0 0.1
Chile 0.0 0.0 0.0 0.0 0.0
Europe 5.4 2.0 0.2 4.0 3.7
EU(28) 5.4 1.9 0.2 3.8 3.7
Belgium 5.2 1.6 0.0 3.0 3.2
United Kingdom 0.1 0.1 0.1 0.2 0.2
Germany 0.0 0.0 0.0 0.4 0.1
The Netherlands 0.1 0.1 0.0 0.1 0.2
EFTA 0.0 0.0 0.0 0.0 0.0
Other Europe 0.0 0.1 0.0 0.1 0.0
Commonwealth of Independent States (CIS) 0.0 0.0 0.0 0.0 0.0
Africa 40.8 50.1 75.9 47.2 49.0
South Africa 39.9 48.9 74.9 44.9 47.3
Swaziland 0.0 0.1 0.2 0.7 0.7
Botswana 0.0 0.0 0.0 0.2 0.2
Kenya 0.3 0.2 0.1 0.0 0.1
Egypt 0.1 0.2 0.5 0.5 0.1
Morocco 0.0 0.0 0.0 0.0 0.0
Tanzania 0.0 0.0 0.0 0.1 0.1
Mauritius 0.0 0.0 0.2 0.4 0.3
Zimbabwe 0.0 0.1 0.1 0.1 0.0
Middle East 0.0 0.0 0.0 0.7 1.7
United Arab Emirates 0.0 0.0 0.0 0.7 1.6
Saudi Arabia 0.0 0.0 0.0 0.0 0.0
Asia 0.2 0.7 0.9 1.7 0.7
China 0.0 0.3 0.2 0.3 0.0
Japan 0.1 0.2 0.1 0.3 0.1
Six East Asian Traders 0.0 0.1 0.1 0.3 0.2
Hong Kong, China 0.0 0.0 0.1 0.2 0.2
Other Asia 0.1 0.1 0.4 0.8 0.4
Australia 0.0 0.1 0.1 0.3 0.3
Other 0.0 0.0 0.0 0.0 0.1
Source: WTO Secretariat's estimates, based on information provided by the authorities (2008) and UN Comtrade (SITC
Rev.3).

Table A9. Merchandise imports by origin, 2008-12
(US$ million and %) 2008 2009 2010 2011 2012
Total (US$ million) 972 1,356 1,277 1,460 1,594 (% of total)
America 0.8 0.2 2.0 0.6 0.5 United States 0.8 0.2 1.9 0.6 0.5 Other America 0.0 0.0 0.1 0.0 0.0
Europe 1.9 1.6 2.0 0.3 0.6 EU(28) 1.9 1.6 1.6 0.2 0.5 United Kingdom 0.3 0.4 0.4 0.0 0.1 France 0.0 0.0 0.1 0.0 0.0 The Netherlands 0.0 0.0 0.1 0.0 0.3 Germany 1.5 1.1 0.4 0.1 0.0 Belgium 0.0 0.0 0.1 0.0 0.0 EFTA 0.0 0.0 0.4 0.0 0.0 Other Europe 0.0 0.0 0.0 0.0 0.0
Commonwealth of Independent States (CIS) 0.0 0.0 0.0 0.0 0.0
Africa 95.1 95.6 79.9 97.4 89.4 South Africa 94.7 95.2 78.9 96.4 88.9 Zambia 0.0 0.0 0.1 0.5 0.1 Zimbabwe 0.0 0.0 0.2 0.2 0.1 Mauritius 0.0 0.0 0.1 0.1 0.1 Botswana 0.0 0.0 0.3 0.1 0.0 Mozambique 0.0 0.1 0.2 0.1 0.1 Namibia 0.1 0.0 0.0 0.0 0.0
Middle East 0.0 0.0 0.1 0.0 0.1 United Arab Emirates 0.0 0.0 0.0 0.0 0.0
Asia 2.2 2.7 15.9 1.7 9.5 China 0.1 0.1 2.6 0.4 2.8 Japan 2.0 2.5 0.9 0.0 0.2 Six East Asian Traders 0.0 0.0 9.8 0.5 5.6 Chinese Taipei 0.0 0.0 5.3 0.3 4.7 Hong Kong, China 0.0 0.0 1.1 0.2 0.7 Singapore 0.0 0.0 0.1 0.0 0.1 Thailand 0.0 0.0 0.1 0.1 0.1 Other Asia 0.1 0.0 2.5 0.7 0.9 India 0.0 0.0 1.6 0.6 0.5 Viet Nam 0.0 0.0 0.1 0.0 0.2 Pakistan 0.0 0.0 0.4 0.0 0.2
Source: WTO Secretariat's estimates, based on information provided by the authorities (2008) and UN
Comtrade (SITC Rev.3).