Embed Size (px)
Citation preview
A New Road
b y D A V I D F R I E D M A N
The Technologyand Potential of Hybrid Vehicles

Union of Concerned ScientistsJanuary 2003
A New Road
b y D A V I D F R I E D M A N
The Technologyand Potential of Hybrid Vehicles
© 2003 Union of ConcernedAll rights reserved
David Friedman is a senior analyst in the Unionof Concerned Scientists Clean Vehicles Program.
The Union of Concerned Scientists is a nonprofitpartnership of scientists and citizens combining rig-orous scientific analysis, innovative policy develop-ment and effective citizen advocacy to achievepractical environmental solutions.
The Union of Concerned Scientists CleanVehicles Program develops and promotes strategiesto reduce the adverse environmental impacts ofthe US transportation system.
More information about the Union ofConcerned Scientists is available on the UCSwebsite at www.ucsusa.org.
The full text of this report is available onlineat www.ucsusa.org or may be obtained from
UCS PublicationsTwo Brattle SquareCambridge, MA 02238-9105
Or email [email protected] or call 617-547-5552
DESIGN: DG Communications/NonprofitDesign.com
Printed on recycled paper
ii l The Union of Concerned Scientists
A New Road: The Technology and Potential of Hybrid Vehicles l iii
CONTENTS○ ○ ○ ○ ○ ○ ○ ○ ○ ○ ○ ○ ○ ○ ○ ○ ○ ○ ○ ○ ○ ○ ○ ○ ○ ○ ○ ○ ○ ○ ○ ○ ○ ○ ○ ○ ○ ○ ○ ○ ○ ○ ○ ○ ○ ○ ○ ○ ○ ○ ○ ○ ○ ○ ○ ○ ○ ○ ○ ○ ○
Acknowledgements iv
Figures & Tables v
Executive Summary 1
1. The Role of Hybrid Vehicles 5Why Hybrids?A New Road
2. Something New Under the Hood 11Defining HybridsEnergy and Environmental PerformanceAdded Consumer BenefitsEngineering ChallengesSafetyPaving the Way for Fuel Cell Vehicles
3. Tomorrow’s Hybrids 21Vehicles and TechnologiesA Fleet of Clean, Green MachinesCase Studies: Hybrid Compacts and SUVs
4. Realizing the Promise 39A Vision for the FutureGovernment and the VisionProviding the SupportPutting Technology to WorkA Cooler, Cleaner, More Secure Future
Bibliography 43
Appendices 47A. Modeling Methodology and AssumptionsB. Detailed Results for Five Car and Truck Classes

iv l The Union of Concerned Scientists
ACKNOWLEDGMENTS○ ○ ○ ○ ○ ○ ○ ○ ○ ○ ○ ○ ○ ○ ○ ○ ○ ○ ○ ○ ○ ○ ○ ○ ○ ○ ○ ○ ○ ○ ○ ○ ○ ○ ○ ○ ○ ○ ○ ○ ○ ○ ○ ○ ○ ○ ○ ○ ○ ○ ○ ○ ○ ○ ○ ○ ○ ○ ○ ○ ○
Major support for this work was provided by The Energy Foundation.Additional support was provided by The Martin Fabert Foundation,W. Alton Jones Foundation, The J.M Kaplan Fund, Steven and MicheleKirsch Foundation, Oak Foundation, V. Kann Rasmussen Foundation,Turner Foundation, Inc., and Wallace Global Fund.
The author is especially indebted to Andrew Burke, Brian Johnston,Daniel Sperling, and Jeff Bentley for mentorship and a fountain ofknowledge during the last ten years of learning about and workingunder the hood of hybrid vehicles.
The author also thanks Timothy E. Lipman, Feng An, Mark Delucchi,John DeCicco, and Marc Ross for their excellent cost and performancestudies, which have provided the foundation for this work. Thanks alsogo to Jason Mark for his advice and guidance throughout the processof bringing this report to life, to Michelle Robinson for helpful comments,and to Michael Silberman and Maria Gabriela Silvani for assistance withresearch and final touches. Additional thanks go to Anita Spiess for herwork in editing under a very tight deadline and to DG Communicationsfor layout.
The opinions expressed in this report do not necessarily reflect theopinions of the foundations that supported the work. Both the opinionsand the information contained here are the sole responsibility of theauthor.
FIGURES & TABLES○ ○ ○ ○ ○ ○ ○ ○ ○ ○ ○ ○ ○ ○ ○ ○ ○ ○ ○ ○ ○ ○ ○ ○ ○ ○ ○ ○ ○ ○ ○ ○ ○ ○ ○ ○ ○ ○ ○ ○ ○ ○ ○ ○ ○ ○ ○ ○ ○ ○ ○ ○ ○ ○ ○ ○ ○ ○ ○ ○ ○
Figures
Fuel Economy Potential for Hybrid Electric and Conventional Vehicles 3
1. The Potential for Conventional Technology to Address Oil Dependence 7
2. The Potential for Hydrogen Fuel Cell Vehicle Technology to AddressOil Dependence 8
3. Oil Security and Environmental Gap Left Without Applying HybridTechnology 9
4. Series Hybrid Electric Vehicle Drivetrain 12
5. Parallel Hybrid Electric Vehicle Drivetrain 12
6. Split-Parallel Hybrid Electric Vehicle Drivetrain 12
7. Toyota Series-Parallel Hybrid Electric Vehicle Drivetrain 12
8. Basic Series-Parallel Hybrid Electric Vehicle Drivetrain 13
9. An Attempt to Classify Hybrid Vehicles by the Amount of OnboardElectrical Power 14
10. Estimated Fuel Economy Potential and Technology Steps for VariousHybrid Classifications 17
11. Fuel Economy Cost Curves for Conventional and Hybrid VehiclesIncorporating Technological Progress 25
12. Environmental Cost Effectiveness for Conventional and Hybrid Vehicles 26
13. Oil Security Cost Effectiveness for Conventional and Hybrid Vehicles 27
14. Window Sticker for a Typical Model Year 2000 Compact Car(e.g., Chevrolet Cavalier) 28
15. Window Sticker for a Moderate Technology Mild Hybrid ElectricCompact Car (15% Peak Power) 29
16. Window Sticker for a Moderate Technology Full Hybrid ElectricCompact Car (40% Peak Power) 30
17. Window Sticker for an Advanced Technology Mild Hybrid ElectricCompact Car (15% Peak Power) 32
18. Window Sticker for a Advanced Technology Full Hybrid ElectricCompact Car (40% Peak Power) 33
A New Road: The Technology and Potential of Hybrid Vehicles l v
19. Window Sticker for a Advanced Technology Full Hybrid ElectricCompact Car (25% Peak Power) 34
20. Window Sticker for a Typical Model Year 2000 Mid-Size SUV(e.g., Ford Explorer) 34
21. Window Sticker for a Moderate Technology Mild Hybrid ElectricMid-Size SUV (15% Peak Power) 35
22. Window Sticker for a Moderate Technology Full Hybrid ElectricMid-Size SUV (40% Peak Power) 36
23. Window Sticker for a Advanced Technology Mild Hybrid ElectricMid-Size SUV (15% Peak Power) 37
24. Window Sticker for a Advanced Technology Full Hybrid ElectricMid-Size SUV (40% Peak Power) 37
25. Window Sticker for a Advanced Technology Full Hybrid ElectricMid-Size SUV (25% Peak Power) 38
vi l The Union of Concerned Scientists
The Technology and Potential of Hybrid Vehicles l vii
Tables
Hybrid Checklist 2
1. Economic, Oil Dependence, and Environmental Indicators of US
Passenger Vehicle Travel 6
2. Moderate and Advanced Technology Available for Fuel Economy
Improvement 22
3. Average Fuel Economy, Economic and Lifetime Environmental Impacts
of Model Year 2000 Conventional Vehicles 23
4. Average Fuel Economy and Lifetime Savings from Applying Conventional
and Hybrid Technology 24
A1. Battery Pack Initial Retail Price 48
A2. Emission Rates 49
B1. Fuel Economy and Lifetime Environmental Impacts of Model Year
2000 Conventional Vehicles 51
B2. Fuel Economy and Lifetime Savings from Moderate TechnologyConventional Gasoline Vehicles 52
B3. Fuel Economy and Lifetime Savings from Advanced TechnologyConventional Gasoline Vehicles (with Idle-Stop) 53
B4. Fuel Economy and Lifetime Savings from Moderate Technology MildHybrid Electric Vehicles (15% Peak Power) 54
B5. Fuel Economy and Lifetime Savings from Moderate Technology FullHybrid Electric Vehicles (40% Peak Power) 55
B6. Fuel Economy and Lifetime Savings from Advanced Technology MildHybrid Electric Vehicles (15% Peak Power) 56
B7. Fuel Economy and Lifetime Savings from Advanced Technology FullHybrid Electric Vehicles (25% Peak Power) 57
B8. Fuel Economy and Lifetime Savings from Advanced Technology FullHybrid Electric Vehicles (40% Peak Power) 58

viii l The Union of Concerned Scientists
A New Road: The Technology and Potential of Hybrid Vehicles l 1
EXECUTIVE SUMMARY○ ○ ○ ○ ○ ○ ○ ○ ○ ○ ○ ○ ○ ○ ○ ○ ○ ○ ○ ○ ○ ○ ○ ○ ○ ○ ○ ○ ○ ○ ○ ○ ○ ○ ○ ○ ○ ○ ○ ○ ○ ○ ○ ○ ○ ○ ○ ○ ○ ○ ○ ○ ○ ○ ○ ○ ○ ○ ○ ○ ○
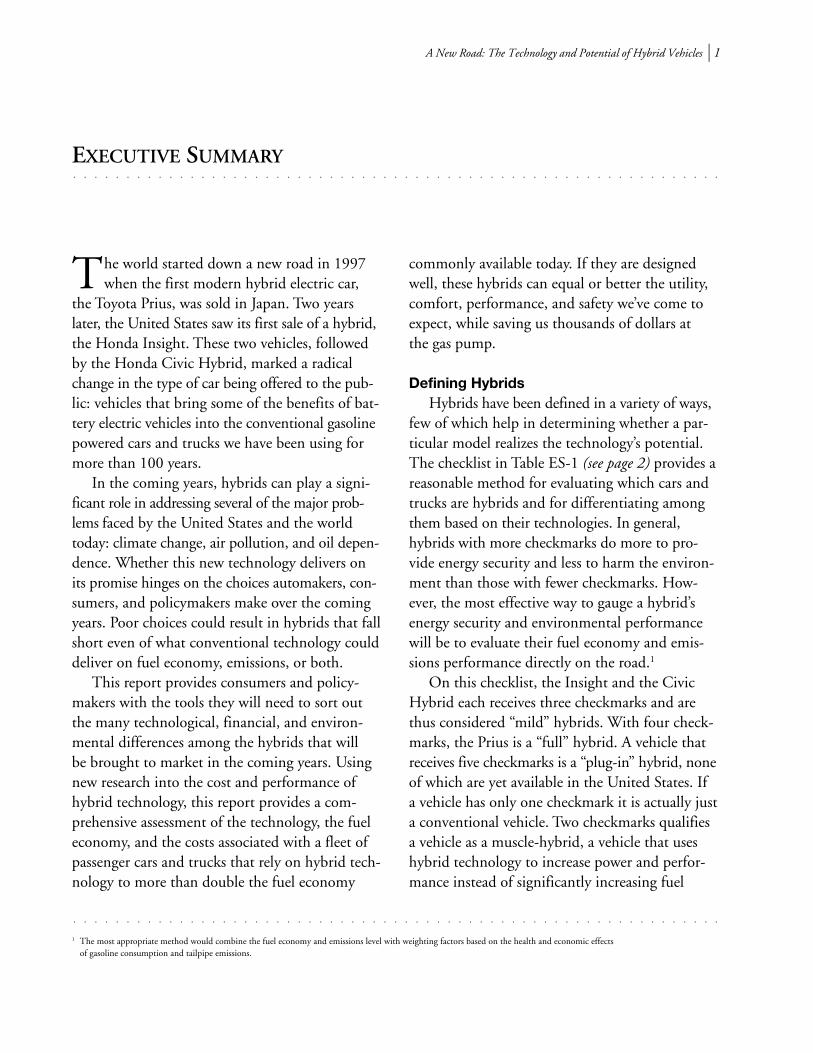
The world started down a new road in 1997when the first modern hybrid electric car,
the Toyota Prius, was sold in Japan. Two yearslater, the United States saw its first sale of a hybrid,the Honda Insight. These two vehicles, followedby the Honda Civic Hybrid, marked a radicalchange in the type of car being offered to the pub-lic: vehicles that bring some of the benefits of bat-tery electric vehicles into the conventional gasolinepowered cars and trucks we have been using formore than 100 years.
In the coming years, hybrids can play a signi-ficant role in addressing several of the major prob-lems faced by the United States and the worldtoday: climate change, air pollution, and oil depen-dence. Whether this new technology delivers onits promise hinges on the choices automakers, con-sumers, and policymakers make over the comingyears. Poor choices could result in hybrids that fallshort even of what conventional technology coulddeliver on fuel economy, emissions, or both.
This report provides consumers and policy-makers with the tools they will need to sort outthe many technological, financial, and environ-mental differences among the hybrids that willbe brought to market in the coming years. Usingnew research into the cost and performance ofhybrid technology, this report provides a com-prehensive assessment of the technology, the fueleconomy, and the costs associated with a fleet ofpassenger cars and trucks that rely on hybrid tech-nology to more than double the fuel economy
commonly available today. If they are designedwell, these hybrids can equal or better the utility,comfort, performance, and safety we’ve come toexpect, while saving us thousands of dollars atthe gas pump.
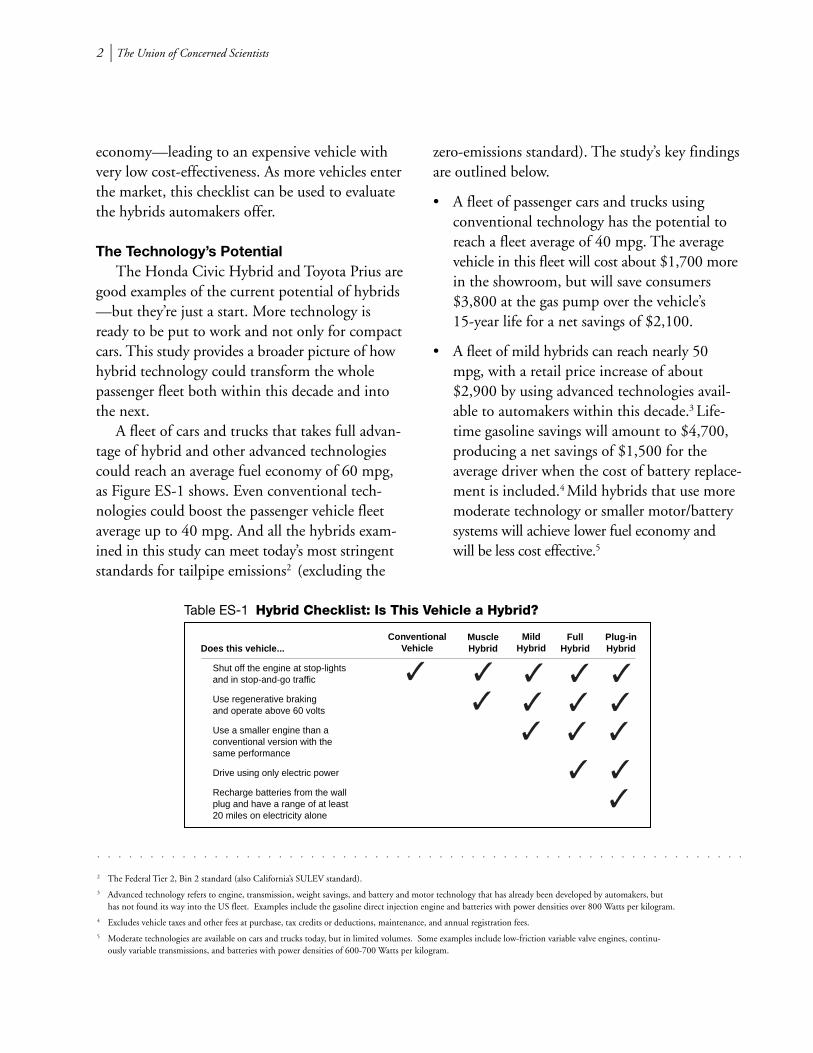
Defining HybridsHybrids have been defined in a variety of ways,
few of which help in determining whether a par-ticular model realizes the technology’s potential.The checklist in Table ES-1 (see page 2) provides areasonable method for evaluating which cars andtrucks are hybrids and for differentiating amongthem based on their technologies. In general,hybrids with more checkmarks do more to pro-vide energy security and less to harm the environ-ment than those with fewer checkmarks. How-ever, the most effective way to gauge a hybrid’senergy security and environmental performancewill be to evaluate their fuel economy and emis-sions performance directly on the road.1
On this checklist, the Insight and the CivicHybrid each receives three checkmarks and arethus considered “mild” hybrids. With four check-marks, the Prius is a “full” hybrid. A vehicle thatreceives five checkmarks is a “plug-in” hybrid, noneof which are yet available in the United States. Ifa vehicle has only one checkmark it is actually justa conventional vehicle. Two checkmarks qualifiesa vehicle as a muscle-hybrid, a vehicle that useshybrid technology to increase power and perfor-mance instead of significantly increasing fuel
1 The most appropriate method would combine the fuel economy and emissions level with weighting factors based on the health and economic effectsof gasoline consumption and tailpipe emissions.
○ ○ ○ ○ ○ ○ ○ ○ ○ ○ ○ ○ ○ ○ ○ ○ ○ ○ ○ ○ ○ ○ ○ ○ ○ ○ ○ ○ ○ ○ ○ ○ ○ ○ ○ ○ ○ ○ ○ ○ ○ ○ ○ ○ ○ ○ ○ ○ ○ ○ ○ ○ ○ ○ ○ ○ ○ ○ ○ ○ ○
2 l The Union of Concerned Scientists
economy—leading to an expensive vehicle withvery low cost-effectiveness. As more vehicles enterthe market, this checklist can be used to evaluatethe hybrids automakers offer.
The Technology’s PotentialThe Honda Civic Hybrid and Toyota Prius are
good examples of the current potential of hybrids—but they’re just a start. More technology isready to be put to work and not only for compactcars. This study provides a broader picture of howhybrid technology could transform the wholepassenger fleet both within this decade and intothe next.
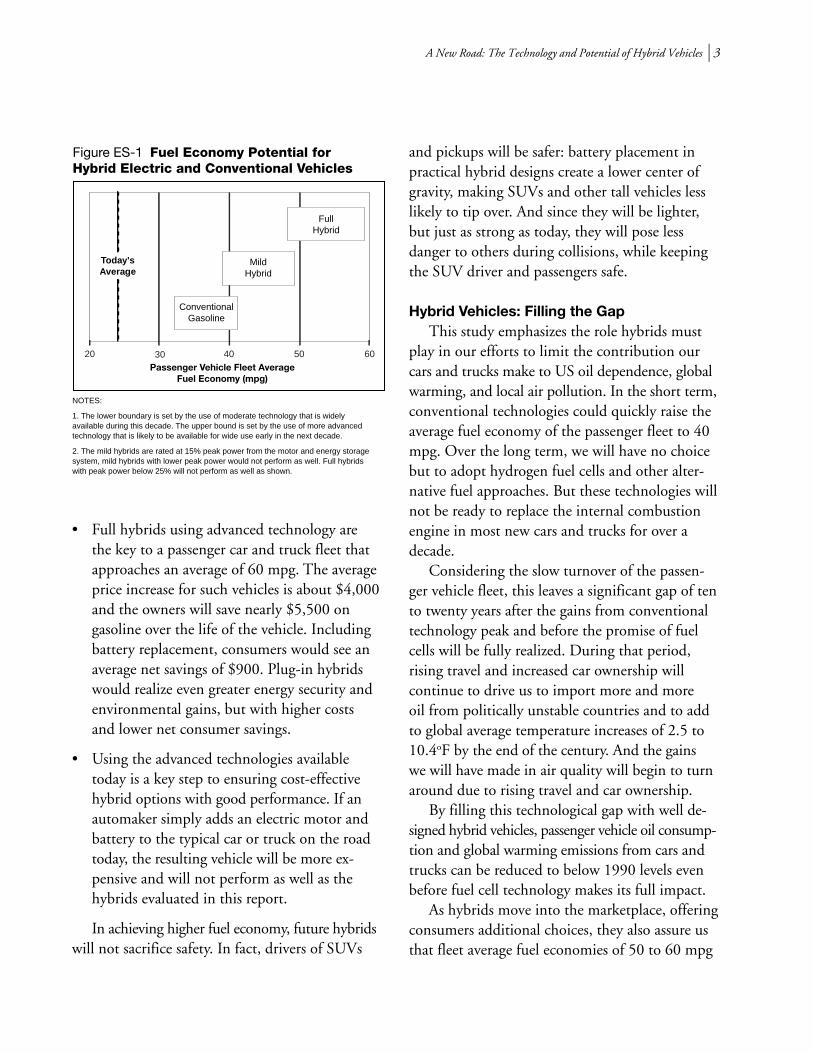
A fleet of cars and trucks that takes full advan-tage of hybrid and other advanced technologiescould reach an average fuel economy of 60 mpg,as Figure ES-1 shows. Even conventional tech-nologies could boost the passenger vehicle fleetaverage up to 40 mpg. And all the hybrids exam-ined in this study can meet today’s most stringentstandards for tailpipe emissions2 (excluding the
zero-emissions standard). The study’s key findingsare outlined below.
• A fleet of passenger cars and trucks usingconventional technology has the potential toreach a fleet average of 40 mpg. The averagevehicle in this fleet will cost about $1,700 morein the showroom, but will save consumers$3,800 at the gas pump over the vehicle’s15-year life for a net savings of $2,100.
• A fleet of mild hybrids can reach nearly 50mpg, with a retail price increase of about$2,900 by using advanced technologies avail-able to automakers within this decade.3 Life-time gasoline savings will amount to $4,700,producing a net savings of $1,500 for theaverage driver when the cost of battery replace-ment is included.4 Mild hybrids that use moremoderate technology or smaller motor/batterysystems will achieve lower fuel economy andwill be less cost effective.5
2 The Federal Tier 2, Bin 2 standard (also California’s SULEV standard).3 Advanced technology refers to engine, transmission, weight savings, and battery and motor technology that has already been developed by automakers, but
has not found its way into the US fleet. Examples include the gasoline direct injection engine and batteries with power densities over 800 Watts per kilogram.4 Excludes vehicle taxes and other fees at purchase, tax credits or deductions, maintenance, and annual registration fees.5 Moderate technologies are available on cars and trucks today, but in limited volumes. Some examples include low-friction variable valve engines, continu-
ously variable transmissions, and batteries with power densities of 600-700 Watts per kilogram.
○ ○ ○ ○ ○ ○ ○ ○ ○ ○ ○ ○ ○ ○ ○ ○ ○ ○ ○ ○ ○ ○ ○ ○ ○ ○ ○ ○ ○ ○ ○ ○ ○ ○ ○ ○ ○ ○ ○ ○ ○ ○ ○ ○ ○ ○ ○ ○ ○ ○ ○ ○ ○ ○ ○ ○ ○ ○ ○ ○ ○
Table ES-1 Hybrid Checklist: Is This Vehicle a Hybrid?
Does this vehicle...
Shut off the engine at stop-lights and in stop-and-go traffic
Use regenerative braking and operate above 60 volts
Use a smaller engine than aconventional version with the same performance
Drive using only electric power
Recharge batteries from the wallplug and have a range of at least20 miles on electricity alone
ConventionalVehicle
MuscleHybrid
MildHybrid
FullHybrid
Plug-inHybrid
✓✓✓
✓✓✓
✓✓✓
✓✓
✓
✓ ✓✓
A New Road: The Technology and Potential of Hybrid Vehicles l 3
• Full hybrids using advanced technology arethe key to a passenger car and truck fleet thatapproaches an average of 60 mpg. The averageprice increase for such vehicles is about $4,000and the owners will save nearly $5,500 ongasoline over the life of the vehicle. Includingbattery replacement, consumers would see anaverage net savings of $900. Plug-in hybridswould realize even greater energy security andenvironmental gains, but with higher costsand lower net consumer savings.
• Using the advanced technologies availabletoday is a key step to ensuring cost-effectivehybrid options with good performance. If anautomaker simply adds an electric motor andbattery to the typical car or truck on the roadtoday, the resulting vehicle will be more ex-pensive and will not perform as well as thehybrids evaluated in this report.
In achieving higher fuel economy, future hybridswill not sacrifice safety. In fact, drivers of SUVs
and pickups will be safer: battery placement inpractical hybrid designs create a lower center ofgravity, making SUVs and other tall vehicles lesslikely to tip over. And since they will be lighter,but just as strong as today, they will pose lessdanger to others during collisions, while keepingthe SUV driver and passengers safe.
Hybrid Vehicles: Filling the GapThis study emphasizes the role hybrids must
play in our efforts to limit the contribution ourcars and trucks make to US oil dependence, globalwarming, and local air pollution. In the short term,conventional technologies could quickly raise theaverage fuel economy of the passenger fleet to 40mpg. Over the long term, we will have no choicebut to adopt hydrogen fuel cells and other alter-native fuel approaches. But these technologies willnot be ready to replace the internal combustionengine in most new cars and trucks for over adecade.
Considering the slow turnover of the passen-ger vehicle fleet, this leaves a significant gap of tento twenty years after the gains from conventionaltechnology peak and before the promise of fuelcells will be fully realized. During that period,rising travel and increased car ownership willcontinue to drive us to import more and moreoil from politically unstable countries and to addto global average temperature increases of 2.5 to10.4oF by the end of the century. And the gainswe will have made in air quality will begin to turnaround due to rising travel and car ownership.
By filling this technological gap with well de-signed hybrid vehicles, passenger vehicle oil consump-tion and global warming emissions from cars andtrucks can be reduced to below 1990 levels evenbefore fuel cell technology makes its full impact.
As hybrids move into the marketplace, offeringconsumers additional choices, they also assure usthat fleet average fuel economies of 50 to 60 mpg
Figure ES-1 Fuel Economy Potential for Hybrid Electric and Conventional Vehicles
3020 40 50 60
Passenger Vehicle Fleet AverageFuel Economy (mpg)
MildHybrid
FullHybrid
ConventionalGasoline
Today'sAverage
NOTES:
1. The lower boundary is set by the use of moderate technology that is widely available during this decade. The upper bound is set by the use of more advanced technology that is likely to be available for wide use early in the next decade.
2. The mild hybrids are rated at 15% peak power from the motor and energy storage system, mild hybrids with lower peak power would not perform as well. Full hybrids with peak power below 25% will not perform as well as shown.
4 l The Union of Concerned Scientists
can be achieved by the end of the next decade.At the same time, growing hybrid sales will bringdown the cost of future hydrogen fuel cell vehicles,since they share many technologies, such as elec-tric motors, power electronics, and energy storage.
Realizing the PromiseThe role that hybrid vehicles can play is clear,
but their success at filling this role is not guaran-teed. Two key things are necessary to ensure thatthat they live up to their promise:
1. Hybrids with the best possible conventionaland electric technology need to be madeavailable to the public.
2. Production and sales of these hybrids needto reach mass-market levels in the hundredsof thousands per year.
These keys are in the hands of automakers,governments, and consumers.
Automakers hold the first key. With most of thenecessary hybrid and conventional technology intheir hands, they will be responsible for buildingthe best possible hybrid vehicles and sendingthem to the showrooms. Automakers that try tograft hybrid technology onto today’s conventionalvehicles will end up producing expensive, low-performance vehicles better left in the researchlab. The resulting lemons could tarnish the imageof hybrid technology and discourage consumers.
Automakers that take the practical approach ofputting the best available technology to work willprovide consumers with “no compromise” vehicles.And they’ll garner a profit as the vehicles reach mass-market production levels. By leading the industry,
these automakers will create a sound footing forfuture profitability and a solid image of environ-mental and corporate responsibility.
Automakers also hold some responsibility forhelping hybrids to reach mass-market levels. Theywill need to support hybrid sales by aggressivelyeducating dealers, service personnel, and consum-ers about their products. But unless educationand advertising campaigns are backed up withthe good products, they will simply be falseattempts at capturing a green image.
But automakers can’t do it alone.Government at all levels must act to help
hybrids sell well during this decade if automakersare to reach the economies of scale necessary forhybrids to become profitable. A variety of toolscan provide this support, such as regulations,including fleet purchase requirements, tax creditsand other financial or nonfinancial incentives,and education programs. All these measures mustbe carefully crafted to assure that they provide sup-port to hybrids in proportion to the energy secu-rity and environmental gains they offer. And theymust acknowledge the extent to which hybridshelp pave the way for hydrogen fuel cell vehicles.
Consumers also have a part to play in en-suring that hybrid sales reach mass-market levels.Assuming government and industry do theirparts, this should not be a challenging task. Recentmarket studies indicate that at least 25% to 30%of con-sumers are already interested in purchasinga hybrid instead of a conventional vehicle. Whenthey do, they will find themselves saving moneyover the life of their hybrid even as they do theirpart to reduce oil dependence and their impacton the environment.
A New Road: The Technology and Potential of Hybrid Vehicles l 5
THE ROLE OF HYBRID VEHICLES○ ○ ○ ○ ○ ○ ○ ○ ○ ○ ○ ○ ○ ○ ○ ○ ○ ○ ○ ○ ○ ○ ○ ○ ○ ○ ○ ○ ○ ○ ○ ○ ○ ○ ○ ○ ○ ○ ○ ○ ○ ○ ○ ○ ○ ○ ○ ○ ○ ○ ○ ○ ○ ○ ○ ○ ○ ○ ○ ○ ○
The world started down a new road in 1997when the first modern hybrid electric car,
the Toyota Prius, was sold in Japan. Two yearslater, the United States saw its first sale of a hybrid,the Honda Insight. These two vehicles, followedby the Honda Civic Hybrid, marked a radicalchange in the type of car being offered to thepublic: vehicles that bring some of the benefitsof battery electric vehicles into the conventionalgasoline-powered cars and trucks we have beenusing for more than 100 years.
While hybrids are not as clean and efficient asvehicles powered by hydrogen fuel cells or solelyby batteries, they offer both lower emissions thantoday’s conventional vehicles and dramaticallyhigher fuel economy. And they provide a stepping-stone to zero emission vehicles.
Today, four years after their introduction,many of us know something about hybrids, butmany of our questions remain unanswered: Whatexactly is a hybrid vehicle? How good will hybrids’fuel economy and environmental performance be?How fast will they go? What will they cost? Willpeople buy them? And where do you plug themin? The answer to the last question is simple: youdon’t have to! (For some this will be a disappoint-ment, for others, a relief.)1 The answers to the otherquestions are more complicated. This reportprovides some of those answers.
Why Hybrids?The primary importance of hybrid technology
for cars and trucks is its potential to increase fueleconomy dramatically while meeting today’s moststringent tailpipe emission standards (excludingthe zero emission vehicle standard). At the sametime, the performance of hybrid vehicles canequal or even surpass that of most conventionalvehicles. Moreover, hybrids can play a critical rolein helping bring the technology of motors, powerelectronics, and batteries to maturity and in reduc-ing their cost. Such changes are vital to the successof future hydrogen fuel cell and other zero emis-sion vehicles.
Thus hybrids could be a key element in USstrategies to address our growing energy insecurityand environmental problems. Whether hybridslive up to their potential hinges on automakersand governments embracing them as one meansof moving toward a secure energy future and ahealthier environment.
Oil Dependence and the Environment. The sizeof our oil dependence and its rate of growth, aswell as the environmental problems that are itsconsequence, require an immediate response. Thiscalls for both changes in conventional technologyand a longer-term investment in hybrid vehicles,hydrogen fuel cells, and alternative fuels.
In the year 2000, the United States consumednearly 20 million barrels of oil products every day.
1 While the hybrids available today do not need to be plugged in, some future hybrid models may actually be able to recharge their batteries from theelectricity grid, giving them superior environmental performance.
○ ○ ○ ○ ○ ○ ○ ○ ○ ○ ○ ○ ○ ○ ○ ○ ○ ○ ○ ○ ○ ○ ○ ○ ○ ○ ○ ○ ○ ○ ○ ○ ○ ○ ○ ○ ○ ○ ○ ○ ○ ○ ○ ○ ○ ○ ○ ○ ○ ○ ○ ○ ○ ○ ○ ○ ○ ○ ○ ○ ○
Chapter 1
6 l The Union of Concerned Scientists
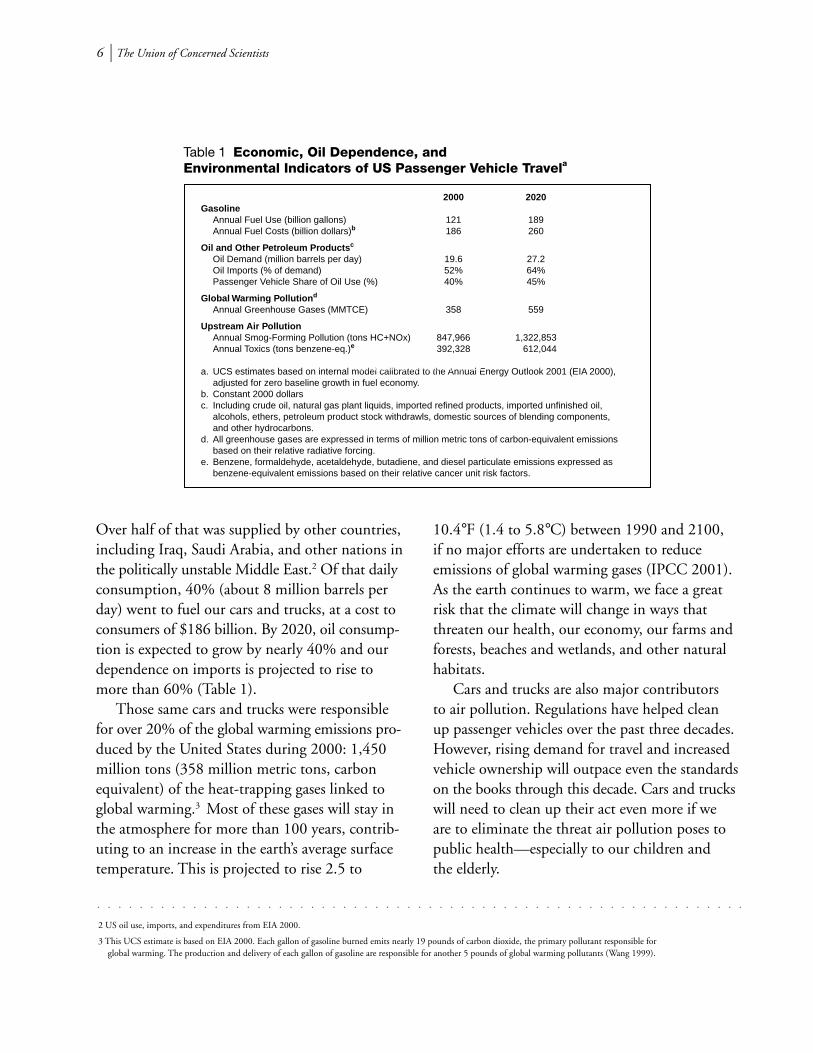
Over half of that was supplied by other countries,including Iraq, Saudi Arabia, and other nations inthe politically unstable Middle East.2 Of that dailyconsumption, 40% (about 8 million barrels perday) went to fuel our cars and trucks, at a cost toconsumers of $186 billion. By 2020, oil consump-tion is expected to grow by nearly 40% and ourdependence on imports is projected to rise tomore than 60% (Table 1).
Those same cars and trucks were responsiblefor over 20% of the global warming emissions pro-duced by the United States during 2000: 1,450million tons (358 million metric tons, carbonequivalent) of the heat-trapping gases linked toglobal warming.3 Most of these gases will stay inthe atmosphere for more than 100 years, contrib-uting to an increase in the earth’s average surfacetemperature. This is projected to rise 2.5 to
10.4°F (1.4 to 5.8°C) between 1990 and 2100,if no major efforts are undertaken to reduceemissions of global warming gases (IPCC 2001).As the earth continues to warm, we face a greatrisk that the climate will change in ways thatthreaten our health, our economy, our farms andforests, beaches and wetlands, and other naturalhabitats.
Cars and trucks are also major contributorsto air pollution. Regulations have helped cleanup passenger vehicles over the past three decades.However, rising demand for travel and increasedvehicle ownership will outpace even the standardson the books through this decade. Cars and truckswill need to clean up their act even more if weare to eliminate the threat air pollution poses topublic health—especially to our children andthe elderly.
Table 1 Economic, Oil Dependence, and Environmental Indicators of US Passenger Vehicle Travela
2000 2020Gasoline
Annual Fuel Use (billion gallons) 121 189Annual Fuel Costs (billion dollars)b 186 260
Oil and Other Petroleum Productsc
Oil Demand (million barrels per day) 19.6 27.2Oil Imports (% of demand) 52% 64%Passenger Vehicle Share of Oil Use (%) 40% 45%
Global Warming Pollutiond
Annual Greenhouse Gases (MMTCE) 358 559
Upstream Air PollutionAnnual Smog-Forming Pollution (tons HC+NOx) 847,966 1,322,853Annual Toxics (tons benzene-eq.)e 392,328 612,044
a. UCS estimates based on internal model calibrated to the Annual Energy Outlook 2001 (EIA 2000),adjusted for zero baseline growth in fuel economy.
b. Constant 2000 dollarsc. Including crude oil, natural gas plant liquids, imported refined products, imported unfinished oil,
alcohols, ethers, petroleum product stock withdrawls, domestic sources of blending components, and other hydrocarbons.
d. All greenhouse gases are expressed in terms of million metric tons of carbon-equivalent emissions based on their relative radiative forcing.
e. Benzene, formaldehyde, acetaldehyde, butadiene, and diesel particulate emissions expressed asbenzene-equivalent emissions based on their relative cancer unit risk factors.
Remaining Dependence on Oil
2 US oil use, imports, and expenditures from EIA 2000.
3 This UCS estimate is based on EIA 2000. Each gallon of gasoline burned emits nearly 19 pounds of carbon dioxide, the primary pollutant responsible forglobal warming. The production and delivery of each gallon of gasoline are responsible for another 5 pounds of global warming pollutants (Wang 1999).
○ ○ ○ ○ ○ ○ ○ ○ ○ ○ ○ ○ ○ ○ ○ ○ ○ ○ ○ ○ ○ ○ ○ ○ ○ ○ ○ ○ ○ ○ ○ ○ ○ ○ ○ ○ ○ ○ ○ ○ ○ ○ ○ ○ ○ ○ ○ ○ ○ ○ ○ ○ ○ ○ ○ ○ ○ ○ ○ ○ ○
A New Road: The Technology and Potential of Hybrid Vehicles l 7
Finally, producing and distributing the gasolinethat went to fuel our cars and trucks in the year2000 resulted in the emission of 848,000 tons ofsmog-forming pollutants and 392,000 tons ofbenzene-equivalent toxic chemicals, in addition tothe pollutants emitted from the tailpipes of vehicles.4
Altogether, cars and trucks are the largest singlesource of air pollution in most urban areas. Aswith US oil use and global warming emissions,upstream air pollution is expected to continue torise significantly over the next two decades, posingthe greatest health threat to children, the elderly,and other vulnerable members of our population(Table 1).
The situation is urgent, but not hopeless.A range of technological approaches can help us
break free of our oil habit and protect our healthand livelihood against the environmental problemsassociated with vehicle use. Hybrid technology isone of the most promising.
Investing in Our Future. No single silver bulletcan solve the problems posed by our use of carsand trucks. But if we choose now to invest in avariety of solutions, ranging from near to longterm, together they could eliminate the use of oilfor transportation. Hybrid technology can fill themidterm gap between immediate improvementsto conventional vehicle fuel economy and thelong-term hope offered by hydrogen fuel cellsand alternative fuels.
Conventional Fuel Economy Technology.
4 The production, refining, and delivery of each gallon of gasoline in the United States emit an estimated 6.4 grams (0.014 pounds) of smog-forming pollutants(Wang 1999). Upstream activities also release harmful toxic pollution into the air. This poses a major health hazard near refineries, along distribution routes,and at gasoline stations. For every gallon of gasoline delivered, 2.9 grams (0.0065 pounds) of benzene-equivalent toxic emissions are produced (Winebrake,He, and Wang 2000; Wang 1999).
○ ○ ○ ○ ○ ○ ○ ○ ○ ○ ○ ○ ○ ○ ○ ○ ○ ○ ○ ○ ○ ○ ○ ○ ○ ○ ○ ○ ○ ○ ○ ○ ○ ○ ○ ○ ○ ○ ○ ○ ○ ○ ○ ○ ○ ○ ○ ○ ○ ○ ○ ○ ○ ○ ○ ○ ○ ○ ○ ○ ○
020052000 2010 2015 2020 2025
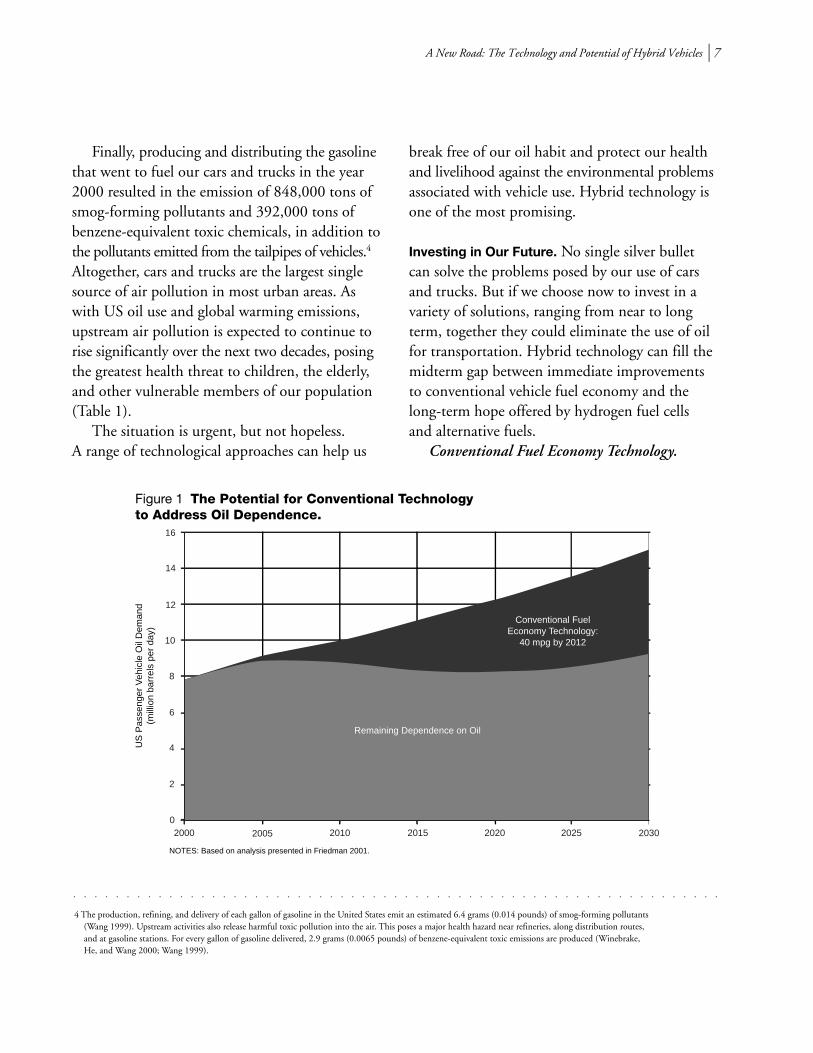
Figure 1 The Potential for Conventional Technology to Address Oil Dependence.
NOTES: Based on analysis presented in Friedman 2001.
2030
US
Pas
seng
er V
ehic
le O
il D
eman
d(m
illio
n ba
rrel
s pe
r da
y)
12
10
8
6
4
2
14
16
Remaining Dependence on Oil
Conventional FuelEconomy Technology:
40 mpg by 2012
8 l The Union of Concerned Scientists
The quickest and most effective way to limit oildependence during the next 10 to 15 years is toimprove the fuel economy of gasoline-fueled carsand trucks. Analysis of existing and emerging tech-nologies based on reports by the National Academyof Sciences, researchers at MIT, and others indi-cates that conventional fuel economy technologycan enable conventional cars and trucks to reachan average of 40 miles per gallon before the mid-dle of the next decade (DeCicco, An, and Ross2001, Friedman et al. 2001, NRC 2002, Weisset al. 2000). Moreover, this can be done costeffectively.
With more efficient engines, improved trans-missions, and better aerodynamics and tires,automakers could reach a fleet average of 40 mpgover the next ten years. At that rate of implemen-tation, passenger vehicle oil use would stop grow-ing by 2007, stabilizing at today’s level through2020 (Figure 1). This would save consumers billions
of dollars every year, effectively paying us to reduceour oil habit and our impact on the environment(Friedman et al. 2001).
Conventional fuel economy technologies arethus a good short-term investment in energysecurity and the environment. But if we stoppedthere, after 2020 increases in the number of milestraveled and the number of vehicles on the roadwould begin to overwhelm the fuel economyimprovements and oil use would again rise. Thusa long-term investment strategy is necessary.
Hydrogen Fuel Cells. Hydrogen fuel cells andalternative fuels are the most promising technolo-gies in the long run, since they could virtuallyeliminate oil use in cars and trucks. But they arenot yet available and are unlikely to reach signifi-cant market penetration for 10 to 15 years. More-over, while these technologies will shift us off oil,they will not make as rapid progress toward elim-inating cars’ and trucks’ global warming emissions.
020052000 2010 2015 2020 2025
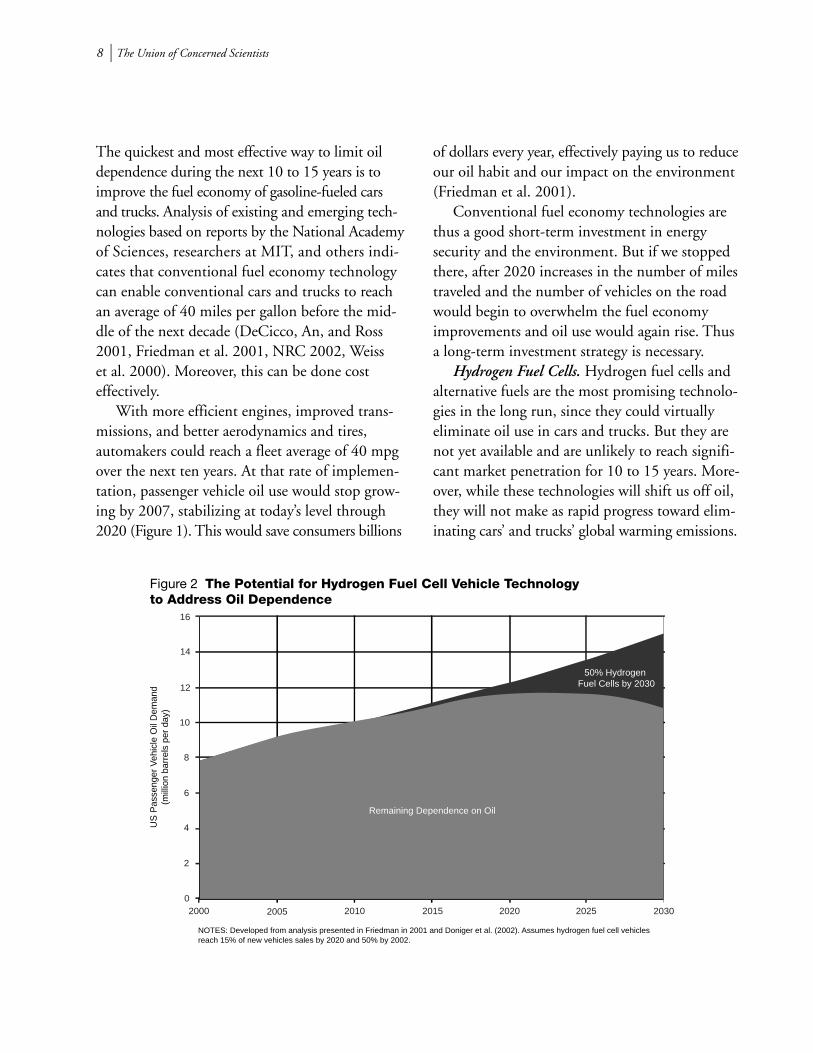
Figure 2 The Potential for Hydrogen Fuel Cell Vehicle Technology to Address Oil Dependence
NOTES: Developed from analysis presented in Friedman in 2001 and Doniger et al. (2002). Assumes hydrogen fuel cell vehicles reach 15% of new vehicles sales by 2020 and 50% by 2002.
2030
US
Pas
seng
er V
ehic
le O
il D
eman
d(m
illio
n ba
rrel
s pe
r da
y)
12
10
8
6
4
2
14
16
Remaining Dependence on Oil
50% Hydrogen Fuel Cells by 2030
A New Road: The Technology and Potential of Hybrid Vehicles l 9
For example, during the first decades after fuelcells are introduced, the hydrogen they use islikely to be produced from natural gas. This willresult in lower, but still substantial emissions ofglobal warming gases.
Today’s vehicles stay on the roads an average of15 years, so waiting 10 to 15 years for hydrogenfuel cell or other alternative fuel technologies wouldmean locking ourselves into a path of increasedoil dependence and environmental problems forthe next 20 to 30 years, as Figure 2 shows.
Since hydrogen fuel cells are not yet rightaround the corner, the best solution in the verynear term is to bring more advanced conventionaltechnologies to the marketplace. At the same time,we will need to prepare for the long term by in-vesting in developing and demonstrating hydrogenfuel cells and alternative fuels.
But that’s not enough. This scenario leaves agap of ten or more years without significant progressin reducing our oil dependence. While that’s not agood prospect, the consequence for climate changeis worse, since the severity of global warming is afunction of cumulative global warming gases.Every ton of global warming gas that could have
been avoided is another ton that will remain inthe atmosphere for the next 100 years. Since hydro-gen fuel cell vehicles are likely to deliver only modestglobal warming emission savings by 2030, anothertechnology is needed as the gains from conven-tional technology level off in the next decade.
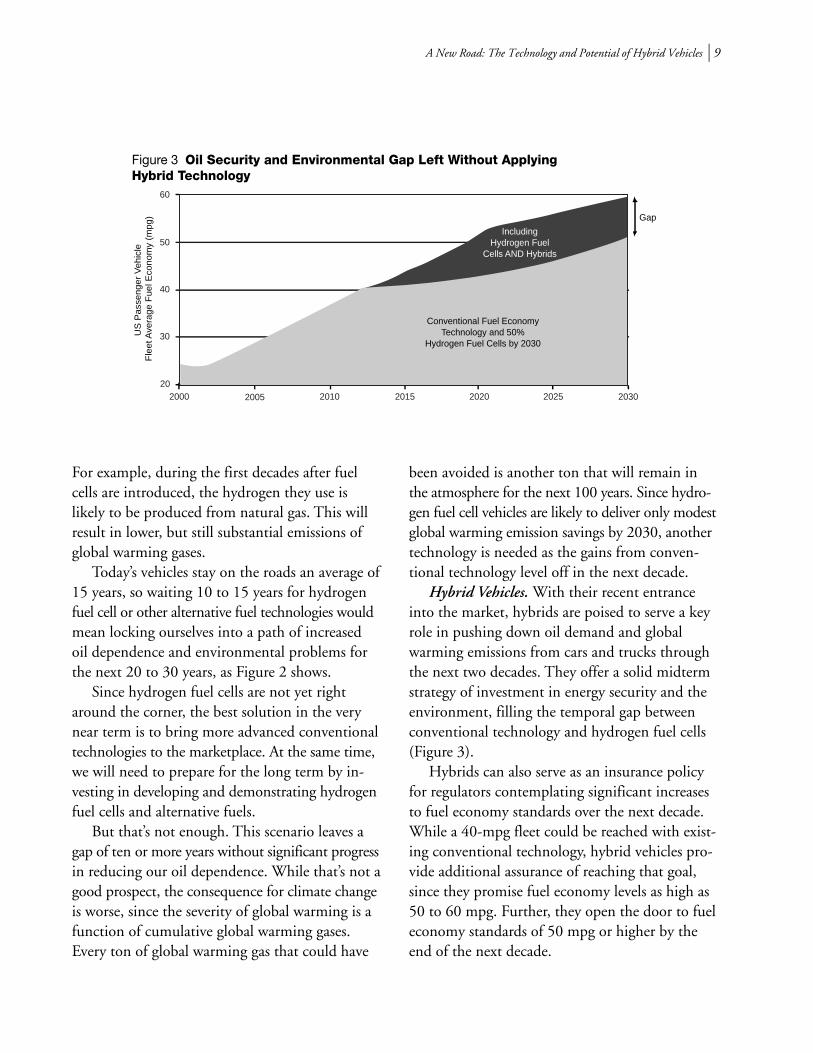
Hybrid Vehicles. With their recent entranceinto the market, hybrids are poised to serve a keyrole in pushing down oil demand and globalwarming emissions from cars and trucks throughthe next two decades. They offer a solid midtermstrategy of investment in energy security and theenvironment, filling the temporal gap betweenconventional technology and hydrogen fuel cells(Figure 3).
Hybrids can also serve as an insurance policyfor regulators contemplating significant increasesto fuel economy standards over the next decade.While a 40-mpg fleet could be reached with exist-ing conventional technology, hybrid vehicles pro-vide additional assurance of reaching that goal,since they promise fuel economy levels as high as50 to 60 mpg. Further, they open the door to fueleconomy standards of 50 mpg or higher by theend of the next decade.
2020052000 2010 2015 2020 2025
Figure 3 Oil Security and Environmental Gap Left Without Applying Hybrid Technology
2030
US
Pas
seng
er V
ehic
le
Fle
et A
vera
ge F
uel E
cono
my
(mpg
)
60
50
40
30
IncludingHydrogen Fuel
Cells AND Hybrids
Conventional Fuel EconomyTechnology and 50%
Hydrogen Fuel Cells by 2030
Gap
10 l The Union of Concerned Scientists
In addition, hybrid vehicles can mitigate therisk of delays in hydrogen fuel cell developmentand market success. They’ll also help ensure thesuccess of fuel cell vehicles by bringing down thecosts of the technologies—motors, batteries, andpower electronics—that the two share. And they’llhelp pave the way by acquainting consumerswith electric drive technology.
Given the necessity of continuing to reduce oiluse and global warming emissions over the comingdecades, hybrids are a key interim step, takingover where improved conventional technologiesleave off and before fuel cells can fulfill theirpromise.
The “Gee-Whiz” Factor. In addition to the logicof hybrids as a key part of investing in energysecurity and the environment, other factors, suchas consumer and automaker choice, could provecrucial to their success.
Consumer Choice. Despite automakers’ claimsto the contrary, consumers are showing interestin having an option to buy cars and trucks withbetter fuel economy. A consumer preference studyby J.D. Power and Associates found that 30% ofthe more than 5,000 recent new-vehicle buyersthey surveyed would definitely consider a hybridfor their next purchase. An additional 30% showedstrong consideration. The primary reason peoplenoted for considering a hybrid was their concernabout high fuel prices (J.D. Power 2002).
A second study, by Applied Decision AnalysisLLC, performed as part of larger study on hybridsby the Electric Power Research Institute, foundthat 25% of the 400 potential car and truck buyerssurveyed would purchase a hybrid vehicle insteadof a conventional vehicle when given informationon the potential costs, savings, and performanceof the hybrid (Graham 2001).
Clearly, consumers want automakers toprovide them with hybrid vehicles as additional
choices when they step into the showroom.Automaker Choice. Only Toyota and Honda
have so far offered hybrids for sale in the USmarket. Both are likely to offer more models verysoon, as are most other automakers. Ford intendsto enter the market with a hybrid SUV using adesign similar to the Prius. GM and Daimler-Chrysler are expected to offer hybrids in 2004or 2005.
These new vehicles will help build the hybridmarket, bringing in consumers interested in pickupsor SUVs as well as those who want compact andfamily cars. But if some of the automakers chooseto offer vehicles with hybrid nameplates just tocapitalize on the “gee whiz” factor or the “green”image of hybrids, much of the potential benefitsfrom hybrid technology will be lost. Automakershave a responsibility to society and consumersto market hybrids that provide the dramaticimprovements in fuel economy the technologypromises, along with substantially cleaner tailpipeemissions. And consumers must hold them toit, by putting their dollars where they will do themost good. Chapter 2 provides a checklist fordetermining whether a vehicle is a hybrid andwhat kind of hybrid it is. Chapter 3 evaluateshow much environmental benefit is providedby a variety of hybrid designs.
A New RoadThe next decade may see a revolution in which
the automobile industry offers consumers morechoices than ever before. But predicting the exactrole hybrid vehicles will play in transportation’sfuture is beyond the scope of this report. Instead,the following chapters explore the questions out-lined above: What exactly is a hybrid vehicle? Whatkind of fuel economy, cost, and vehicle performancecan we expect from hybrids? And what will ittake to help ensure that hybrids live up to theirpromise?
A New Road: The Technology and Potential of Hybrid Vehicles l 11
SOMETHING NEW UNDER THE HOOD○ ○ ○ ○ ○ ○ ○ ○ ○ ○ ○ ○ ○ ○ ○ ○ ○ ○ ○ ○ ○ ○ ○ ○ ○ ○ ○ ○ ○ ○ ○ ○ ○ ○ ○ ○ ○ ○ ○ ○ ○ ○ ○ ○ ○ ○ ○ ○ ○ ○ ○ ○ ○ ○ ○ ○ ○ ○ ○ ○ ○
From the outside, the Toyota Prius or theHonda Civic hybrid don’t look much differ-
ent from a Toyota Echo or a conventional HondaCivic. (Hint, besides the hybrid label on the back,the antennas of both hybrids sit at the center ofthe roof ’s front edge). Looking under the hooddoesn’t help much either. They still have anengine and some type of transmission along withseveral unidentifiable metal boxes, wires, andother gadgets.
The instrument panels on the dashboard providethe clearest indication that these are hybrids. Theyshow power going into and out of the batterypack and when it’s the engine or the motor thatis driving the wheels. It’s this sharing of drivingpower between the electric motor and the enginethat defines these vehicles as hybrids. Other thanthat, they are in many ways the same as theirconventional counterparts.
Defining HybridsThe hybrid vehicles on sale today are referred
to as hybrid electric vehicles (HEVs) or engine elec-tric hybrid vehicles. That means they obtain drivingpower from both an internal combustion engineand an electric motor powered by batteries.
Several other types of hybrid vehicles havereached the prototype phase. For example, in the1990s Chrysler combined a combustion enginewith a flywheel that stored mechanical energy andprovided power to the wheels (Lowell 1994). Cur-rently, Ford and the US Environmental ProtectionAgency are developing a hydraulic hybrid thatuses an internal combustion engine along witha hydraulic/nitrogen gas system that recovers
braking energy and can help launch a heavy-dutyvehicle from a stop (McElroy 2002).
Many other hybrid variations could undoubt-edly be envisioned, but the key to success lies increating a hybrid vehicle that provides consumers,at a reasonable cost, the performance they seekalong with improved fuel economy and decreasedemissions. So far, only hybrid electric vehicles meetthese criteria for success and have made it to market.The remainder of this report is about hybrid elec-tric vehicles and hereafter the term hybrid shouldbe understood to refer to hybrid electric vehicles.
Hybrid Electric Drivetrains. Just as combustionengines can be combined with a variety of tech-nologies to create hybrid vehicles, so too canhybrid electric vehicles result from mixing andmatching technologies. One major variation depends
hybrid vehicle
PRONUNCIATION: ‘hI-br&d vE-&-k&l
FUNCTION: noun
ETYMOLOGY: Latin hybrida and Frenchvéhicule (from Latin vehiculum carriage,conveyance, from vehere to carry).
DEFINITION: A means of transportationthat incorporates two or more methodsof providing power for movement.
SOURCE: Pronunciation and etymologyfrom Merriam-Webster 2002. Definitionby author.
Chapter 2
12 l The Union of Concerned Scientists
on whether the hybrid electric uses a series drive-train, or parallel drivetrain, or a bit of both.
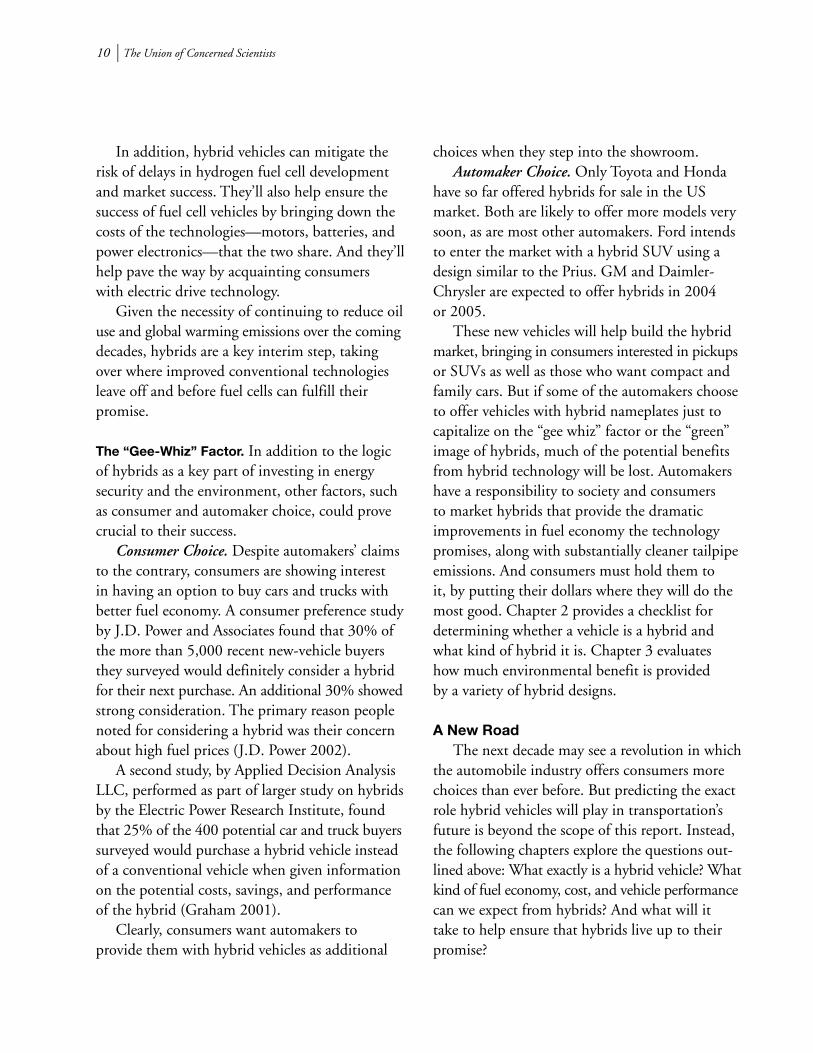
Series Drivetrains. In a series hybrid electricvehicle, an electric motor is the only means ofdriving the wheels (Figure 4). The motor obtainselectricity either from a battery pack or from agenerator powered by an engine in much thesame way as a portable generator. A controllerdetermines how power is shared between thebattery and the engine/generator set.
The batteries in a series hybrid are rechargedboth by the engine/generator set and by storingsome of the energy that is normally lost duringbraking (typically referred to as regenerativebraking).
Series drivetrains are the simplest hybridelectric configuration. Because the electric motoralone drives the wheels, no clutch or complicatedmultispeed transmission is required. At the sametime, the engine, since it is not connected to thewheels, can operate at or near optimum efficiency.This also opens the door to using unconventionalengine types such as gas turbine, Atkinson, orStirling engines, rather than more conventionalgasoline engines.
To gain the most advantage in efficiency fromusing a small engine, series drivetrains typicallyuse relatively large battery packs. But batteriesand motors cost more than engines for the sameamount of power, so series hybrids are generallymore expensive than the parallel hybrids describedbelow. The generator needed to produce electric-ity from the engine also adds to the cost.
Series hybrids show to their greatest advantageunder slower operating conditions characterizedby stop-and-go driving. During high-speed andhighway driving, the inefficiency of always con-verting the mechanical power from the engineinto electricity, storing some of it, and then con-verting it back to mechanical power through themotor takes its toll. For this reason, most of the
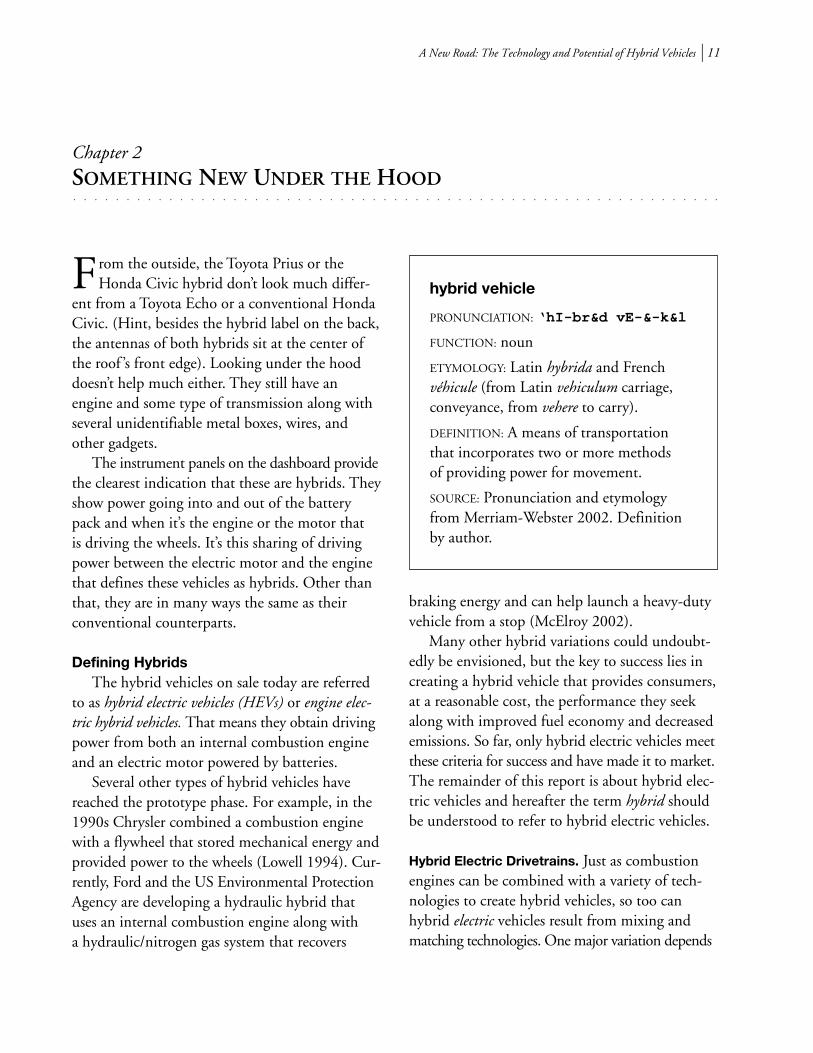
Figure 5 Parallel Hybrid Electric Vehicle Drivetrain
Power Electronics
Engine
Battery
TransmissionMotor
Figure 6 Split-Parallel Hybrid Electric Vehicle Drivetrain
EngineTransmission
Power Electronics
Battery
Motor
Figure 7 Toyota Series-Parallel Hybrid Electric Vehicle Drivetrain
Power Electronics
Engine
Generator
Battery Motor
PowerSplit
Device
Figure 4 Series Hybrid Electric Vehicle Drivetrain
Power Electronics
Engine Generator
Battery Motor
A New Road: The Technology and Potential of Hybrid Vehicles l 13
series hybrids currently under development arefor buses or other heavy-duty urban vehicles.
Parallel Drivetrains. In a parallel hybridelectric vehicle, both the engine and the motorcan drive the wheels (Figure 5). Both the HondaInsight and the Honda Civic Hybrid are parallelhybrids.
Parallel drivetrains are mechanically morecomplicated than series drivetrains. For one thing,a transmission is required to allow the engine todrive the wheels. Then there must be a means ofcoupling the engine, motor, and transmission.Finally, the controller necessary to make all thesecomponents work together is more complexthan in the series drivetrain.
Parallel drivetrains use a smaller engine than aconventional vehicle, though it is typically largerand somewhat more expensive than the engine ina series drivetrain. As in series hybrids, the batter-ies in parallel hybrids can be recharged throughregenerative braking. Since parallel drivetrainstypically use smaller battery packs, much of therecharging can be done this way. In addition, thedrive motor can be turned into a generator duringdriving to recharge the batteries, in much the sameway alternators do in conventional cars.
The smaller motors and battery packs used inparallel drivetrains help keep down the costs ofparallel hybrids relative to series hybrids. But thenecessity of transmissions and the need to coupleeverything together means their cost advantage
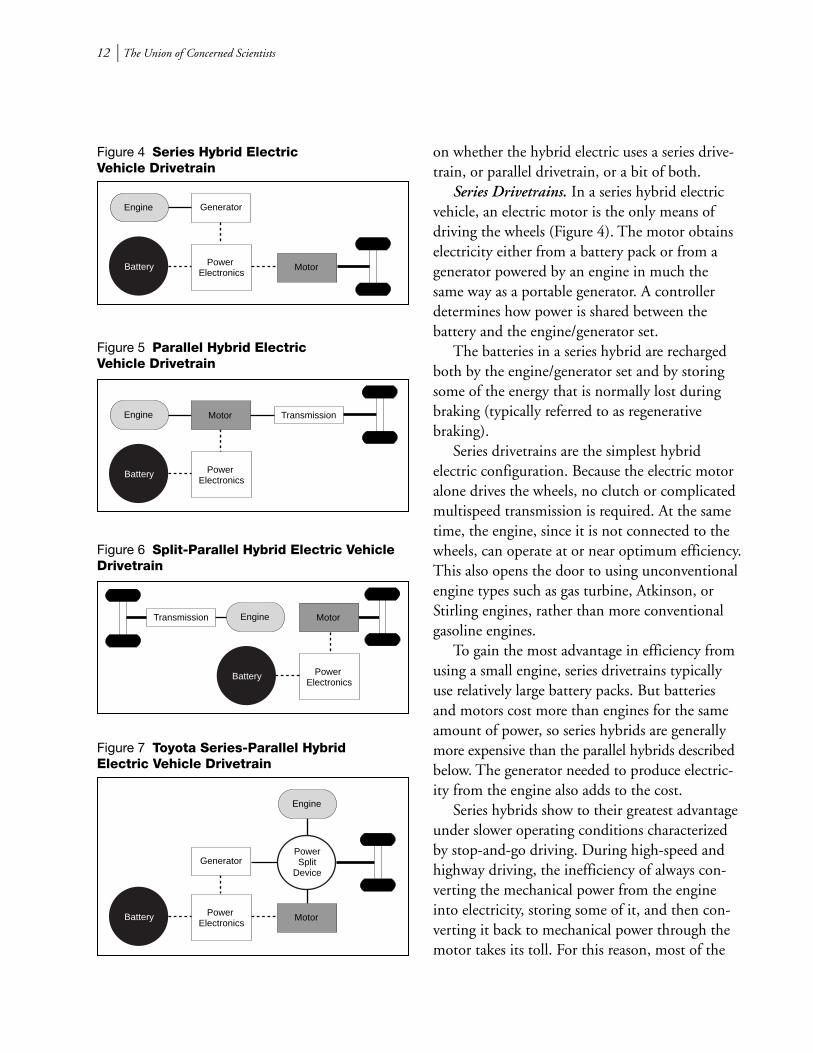
Figure 8 Basic Series-Parallel Hybrid Electric Vehicle Drivetrain
Engine Transmission
Power Electronics
Battery
MotorGenerator
Clutch
will diminish as battery and motor costs comedown over time.
Because the engine is connected directly to thewheels in parallel drivetrains, these hybrids do notsuffer the efficiency penalty series hybrids experi-ence on the highway. In the city, this same struc-ture will reduce, not eliminate, some of the effi-ciency benefits of a parallel drivetrain. As a result,parallel drivetrains provide some advantages inboth city and highway driving.
One special type of parallel hybrid uses a “split”drivetrain, in which the engine drives one set ofwheels, while an electric motor drives another(Figure 6). This can provide 4-wheel drive,although recharging the batteries by the engineis then more complicated since it involves operat-ing the front wheels in regenerative braking modewhile the engine is driving the rear wheels. Atone time, DaimlerChrysler planned to producea Dodge Durango SUV with such a system.
Series/Parallel Drivetrains. The Toyota Priusmade popular a new concept that combines manyof the advantages of the parallel drivetrain withthe series drivetrain’s ability to maintain engineoperation near its most efficient operating point(Figure 7) (Inoue et al. 2000). Variations on thisdesign (Figure 8) have shown up in the NissanTino Hybrid, which was sold for a short periodin Japan, and is being incorporated into a hybridvehicle developed by Paice Corporation (Matsuoet al. 2000, Severinsky et al. 2002).
14 l The Union of Concerned Scientists
This series/parallel design is similar to thebasic parallel drivetrain in that the engine candrive the wheels directly. What makes the designunique is that the engine can be effectively dis-connected from the transmission and operatedin the same way as a series drivetrains’ engine/generator set.
As a result, the engine can operate near optimumefficiency more often. During lower-speed driving,the engine is disconnected from the demandsof the wheels and the vehicle operates with manyof the efficiency benefits of a series drivetrain. Dur-ing higher-speed driving, when the engine canpower the wheels efficiently, the inefficient energy-conversion steps of the series drivetrain can beavoided or minimized.
The series/parallel drivetrain has the poten-tial to perform better than either the series or theparallel drivetrain. However, it inherits some ofthe higher costs of the series hybrid because it
needs a generator and a larger battery pack.The series/parallel drivetrain also inherits themechanical complexity of the parallel drivetrain,and be-cause it combines the two drivetrains,it requires more computing power to controlthe system.
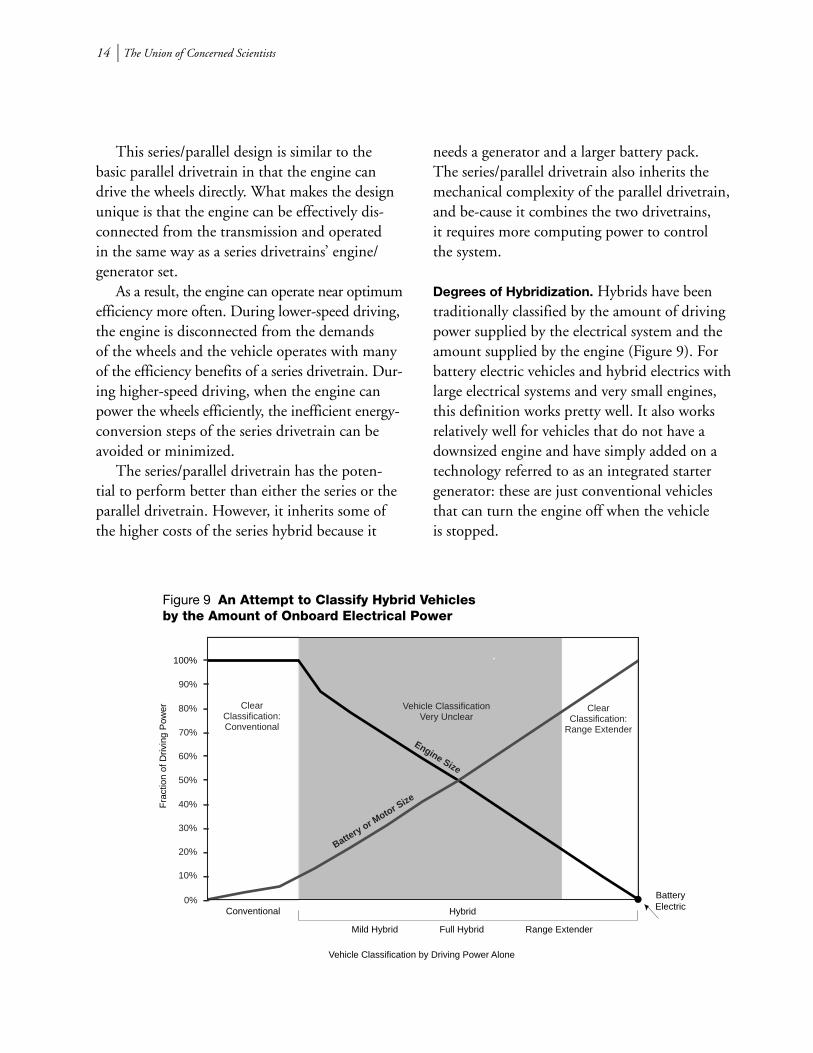
Degrees of Hybridization. Hybrids have beentraditionally classified by the amount of drivingpower supplied by the electrical system and theamount supplied by the engine (Figure 9). Forbattery electric vehicles and hybrid electrics withlarge electrical systems and very small engines,this definition works pretty well. It also worksrelatively well for vehicles that do not have adownsized engine and have simply added on atechnology referred to as an integrated startergenerator: these are just conventional vehiclesthat can turn the engine off when the vehicleis stopped.
0%
Vehicle Classification by Driving Power Alone
Figure 9 An Attempt to Classify Hybrid Vehicles by the Amount of Onboard Electrical Power
Fra
ctio
n of
Driv
ing
Pow
er
40%
30%
10%
20%
50%
60%
70%
80%
90%
100%
Clear Classification:Conventional
Vehicle ClassificationVery Unclear
Clear Classification:
Range Extender
Engine Size
Conventional
Battery or M
otor Size
Hybrid
Mild Hybrid Full Hybrid Range Extender
BatteryElectric
A New Road: The Technology and Potential of Hybrid Vehicles l 15
Once regenerative braking is included or theengine is downsized, how to classify the hybridbecomes less clear. What, for example, is thedividing line between a mild hybrid, as mostpeople call the Civic Hybrid, and a full hybrid, asmany call the Prius? More importantly, classifica-tion by the amount of electrical system powerdoes not necessarily indicate the level of environ-mental performance of the hybrid, since improve-ments in fuel economy correlate only weakly withthe amount of electrical power onboard.1
A more informative way to classify hybrids isaccording to the discrete technological steps thatmove them away from conventional vehicles andtoward battery electric vehicles. This classificationprovides a better indication both of how a parti-cular model of hybrid will operate on the roadand of how well it measures up to the technologyof a full function electric vehicle. The amount ofpower supplied by the electrical system can thenbecome an important secondary factor for evalua-tion within hybrid classes.
This method divides the space betweenconventional and battery electric vehicles intofive technology steps, each of which provides astep-increase in similarity to a fuel cell or batteryelectric vehicles and helps indicate potential forimproved environmental performance:
1. Idle-off capability2. Regenerative braking capacity3. Engine downsizing4. Electric-only drive5. Extended battery-electric range
Idle-Off. All hybrids can turn the engineoff when the vehicle is at a stop; however, not all
vehicles that are equipped with idle-off technol-ogy are hybrids. Conventional vehicles can achieveidle-off using an integrated starter-generator, abeefed up starter motor combined with an alter-nator, while a hybrid would use a larger, full func-tion electric motor. Therefore, the inclusion of idle-off is not sufficient to distinguish a hybrid froma conventional vehicle. In fact, a vehicle must alsoincorporate the next two steps, regenerative brakingand engine downsizing, to make the transitionfrom conventional vehicle to “mild” hybrid.
Regenerative Braking. “Regen,” or regenera-tive braking, requires an electric drive motor largeenough to take over some of the braking dutiesand a battery pack big enough to capture thebraking energy that is typically wasted.2 This isa key technology for battery electric vehicles andmarks an important step beyond conventionaltechnology. Some automakers have proposed addingregenerative braking to conventional vehicles thatincorporate the integrated starter-generators usedfor idle-off, but these systems typically operate atpower levels and voltages that are too low to recoverany significant braking energy to influence fueleconomy. A system that obtains about 10% of itspeak power from the electric motor will be neces-sary to ensure that regen technology is includedin more than just name only.
Engine Downsizing. In downsizing, a smallerengine is complemented by an electric motor thatboosts vehicle power to meet the same performanceas a larger engine. For example, reducing the enginesize allows a vehicle that would typically use a6-cylinder engine to gain the fuel economy of a4-cylinder engine while retaining the 6-cylinderperformance using the boost available from the
○ ○ ○ ○ ○ ○ ○ ○ ○ ○ ○ ○ ○ ○ ○ ○ ○ ○ ○ ○ ○ ○ ○ ○ ○ ○ ○ ○ ○ ○ ○ ○ ○ ○ ○ ○ ○ ○ ○ ○ ○ ○ ○ ○ ○ ○ ○ ○ ○ ○ ○ ○ ○ ○ ○ ○ ○ ○ ○ ○ ○
1 Some initial research indicates that the difference may be related in part to vehicle acceleration or other performance factors, but these do not fully explainthe discrepancies (Santini, Vyas, and Anderson 2002).
2 Motors and generators are effectively the same things, just operated in different directions. A motor uses electricity to generate mechanical power; agenerator uses a source of mechanical power to generate electricity.
16 l The Union of Concerned Scientists
electric motor. This is clearly a hybridization step,since it combines two technologies to achieve theperformance of one, while improving fueleconomy at the same time.
If an electric motor is added, but the engineis not downsized, such a vehicle may technicallybe a hybrid. But in that case, the technology isserving primarily to boost performance, not toimprove fuel economy. This wastes a significantbenefit of hybridization, failing to fulfill the promiseof hybrid technology and instead creating a musclehybrid.
If a vehicle’s technology includes both regenand engine downsizing, it can be classified as a“mild” hybrid.
Electric-Only Drive. Using the electric motorand battery pack for driving is the technology stepthat separates “mild” from “full” hybrids. Thistakes full advantage of the technology by turningthe engine off not just when the vehicle is stopped,but also while driving.
This takes a step beyond engine downsizing,moving toward electric vehicle technology. It alsohas the advantage of improving engine efficiency,since it eliminates engine operation in its mostinefficient low-power regions. Full hybrids thus usethe battery and motor to launch the vehicle anddrive until it reaches the speed at which the enginecan be operated more efficiently. Engine efficiencycan be improved significantly by driving with theelectric motor alone up to 10 to 15 miles per hour.Above these speeds, efficiency benefits begin todiminish, although similarity with electric vehiclescontinues to increase.
Extended Battery-Electric Range. The finallevel of hybridization extends the battery-electricrange by allowing the vehicle’s battery to be re-charged from a clean electricity grid. These “plug-
in” or “range extender” hybrids can operate asbattery-electric vehicles for 20 to 60 miles eachday, satisfying much of a consumer’s daily drivingneeds (Graham 2001). The remainder of a consu-mer’s driving needs can then be met by operatingthe vehicle as a typical full hybrid.3
By getting much of their driving energy fromthe electricity grid, plug-in hybrids can achievesuperior environmental performance relative toother hybrids, approaching the efficiency andcleanliness of purely electric vehicles. However,since plug-ins can still operate without rechargingfrom the electricity grid, these benefits are highlydependent on how often consumers plug them in.
Energy and Environmental PerformanceThe clearest and most direct way to evaluate theenvironmental performance of a hybrid electricvehicle is to measure its fuel economy and emis-sions directly. Since only a few hybrids are availabletoday, this is not practical for investigating thepotential for a full fleet made up of hybrid com-pact cars, family cars, SUVs, pickups and minivans.Chapter 3 provides findings based on computermodeling of the fuel economy and economics ofseveral hybrid designs in order to provide such ameasure for the variety of cars and trucks in today’spassenger vehicle fleet. However, the utility of thetechnology-based classification laid out above isthat it provides an indication of how similar avehicle is to a fuel cell or battery electric vehicle.It also provides a rough indication of a vehicle’senergy and environmental potential.
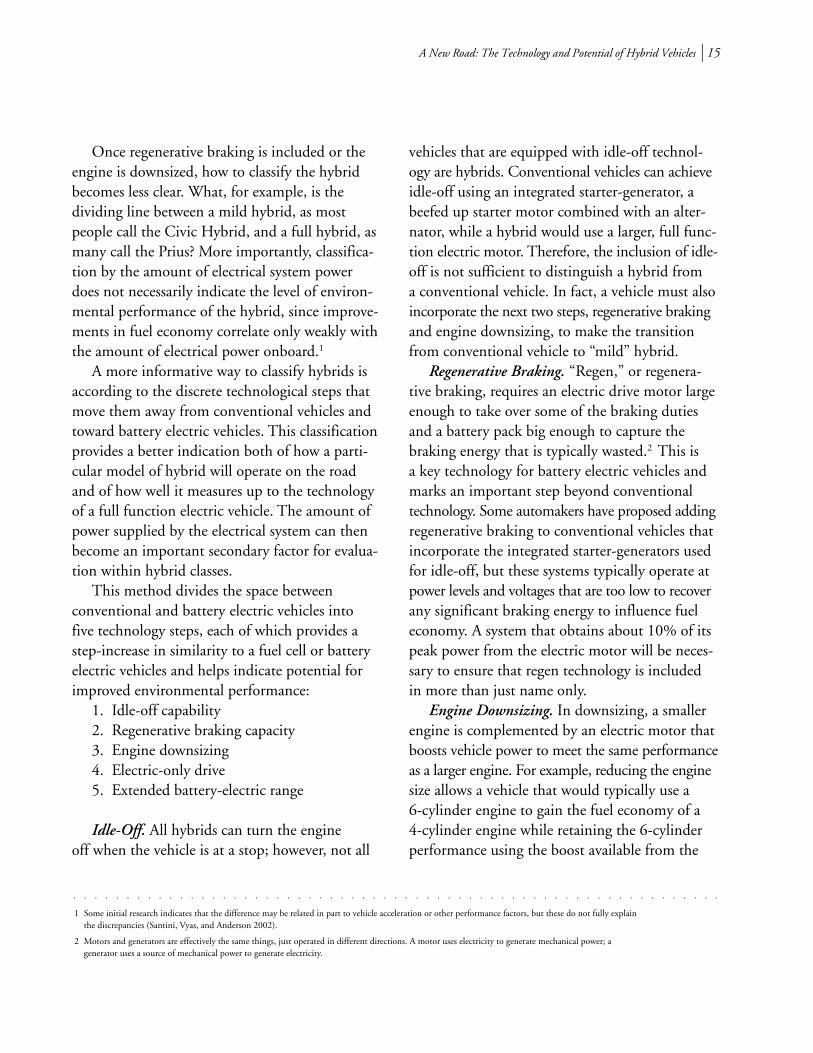
Fuel Economy. Figure 10 lays out the linksbetween the technologies, the hybrid classifications,and their potential to improve fuel economy for atypical mid-size family car. The gains shown for
3 For a plug-in hybrid, this is typically called the charge-sustaining mode, as the charge in the battery is kept up by the engine/generator set.
○ ○ ○ ○ ○ ○ ○ ○ ○ ○ ○ ○ ○ ○ ○ ○ ○ ○ ○ ○ ○ ○ ○ ○ ○ ○ ○ ○ ○ ○ ○ ○ ○ ○ ○ ○ ○ ○ ○ ○ ○ ○ ○ ○ ○ ○ ○ ○ ○ ○ ○ ○ ○ ○ ○ ○ ○ ○ ○ ○ ○
A New Road: The Technology and Potential of Hybrid Vehicles l 17
hybrids’ fuel economy are over and above thosethat can be achieved with advanced conventionalvehicles because, as chapter 3 will show, it is notcost effective to hybridize a vehicle without firstapplying many of the best conventional tech-nologies available.
In ranking the potential environmental perfor-mance of the various hybrid configurations, theclear trend is that the closer a vehicle is to a fullfunction battery electric vehicle, the better its fueleconomy. Note, however, that a vehicle which in-corporates the five technology steps laid out abovewill not necessarily have superior environmentalperformance. Figure 10 indicates only the potentialfor higher fuel economy: how an automaker actu-
ally applies the technology will determine how wellit performs. The only way to evaluate a vehicle’senvironmental performance is to actually test itsfuel economy and emissions under realisticdriving conditions.
Tailpipe Emissions. Unlike their fuel economyperformance, hybrids do not have substantialadvantages over conventional vehicles when itcomes to decreasing tailpipe pollution. Whilehybrids can meet the world’s most stringent non-zero tailpipe emissions standard, the federal Tier2-Bin 2 or California’s SULEV standard, severalconventional cars can do the same today.4 Forexample, the Toyota Prius and one version of the
0
Figure 10 Estimated Fuel Economy Potential for Various Hybrid Classifications
NOTES: Hybrid fuel economy levels assume specific engine and battery/motor sizing in a mid-sized vehicle parallel hybrid driveline configuration, altering that sizing, the driveline configuration, or the vehicle type will affect the fuel economy to some degree. This should only be used as a general guide.
Est
imat
ed M
id-S
ized
Car
Fue
l Eco
nom
y(m
pg)
60
50
40
30
20
10
70
80
90
Plug-inHybrid
Full Hybrid
Mild Hybrid
Idle Off
AdvancedConventional
Gasoline
ConventionalGasoline
~ 50 mile Pure Electric Range
Electric Drive
Regenerative Braking and Engine Downsizing
Advanced Conventional Technology
Baseline Conventional Vehicle
4 The federal Tier 2-Bin 2 standard and California’s Super Ultra Low Emission Vehicle (SULEV) standard require tailpipe emissions to be no greater, over the useful life ofthe vehicle, than the following: nonmethane organic gases: 0.01 grams per mile; oxides of nitrogen: 0.02 grams per mile; particulates: 0.01 grams per mile.
○ ○ ○ ○ ○ ○ ○ ○ ○ ○ ○ ○ ○ ○ ○ ○ ○ ○ ○ ○ ○ ○ ○ ○ ○ ○ ○ ○ ○ ○ ○ ○ ○ ○ ○ ○ ○ ○ ○ ○ ○ ○ ○ ○ ○ ○ ○ ○ ○ ○ ○ ○ ○ ○ ○ ○ ○ ○ ○ ○ ○
18 l The Union of Concerned Scientists
Honda Insight have garnered a SULEV rating inseveral states. However, SULEV-rated models ofthe conventional Nissan Sentra, Honda Accord,and BMW 325i are also available in several statestoday. In general, hybrids will have some emissionadvantages over conventional vehicles and someadded emission challenges.
Advantages. The primary emissions advantageof most hybrids is that they can use smaller, lighterengines, which heat up quickly. Faster heatingreduces start-up emissions, which are the primarychallenge in achieving lower exhaust levels.
Just as hybrids, especially series and series/parallel hybrids, will achieve higher fuel economyby ensuring their engines operate most often neartheir most fuel-efficient points, they can also runthe engine in ways that minimize emissions. Thiswill reduce average running emissions, but theeffect is not likely to be dramatic.
Finally, plug-in hybrids could dramaticallydecrease on-the-road emissions. Since they can re-charge from a clean electricity grid instead of rely-ing on the engine, a substantial amount of theiroperation could be in true zero-tailpipe-emissionmode. However, realizing this potential hinges onthe owner consistently recharging the batteriesfrom the grid.
Challenges. Hybrids face two key challenges inmeeting SULEV tailpipe emission levels: frequentengine restarting and the associated problem ofevaporative canister purging.
Until the engine is running on its own, thefuel does not burn well, producing a lot of pollu-tion. Thus the more often an engine is started andthe longer it takes for a successful start, the morepollution it produces. And while the engine andemissions control system are warming up, partiallyburned fuel escapes out the tailpipe. Automakershave made headway in controlling these emissions,but they remain challenging to control. In hybrids,the engines stop and start more often than in
conventional vehicles because of their idle-offfeature. Full hybrids may see even more frequentstop/start cycles because of their electric-onlydrive capability.
This issue, however, appears manageable.As noted above, the engines can heat up quicklybecause they are light and small. In addition, effec-tive control of the engine cooling system can keepthe engine warm for quite some time. For example,many modern engines stay warm between thetime we pull in to do our grocery shopping andwhen we drive away. Moreover, hybrids can restarttheir engines quickly because they have muchmore electrical power onboard than a conventionalvehicle. Electric power can also be used to heatthe emission-control system quickly.
The problem of evaporative canister purgingis also a function of the frequent engine starts andstops. When an engine turns off, unburned fuelvapor remains in the fuel system. Rather than letthose smog-forming hydrocarbons escape into theenvironment, today’s cars capture them in a specialcanister. When the engine next turns on, thecanister is purged, allowing the captured fuel tobe burned and then treated in the exhaust system.
Hybrids have less opportunity to purge thecanister, because the engine operates less frequentlyand for shorter periods of time than in conven-tional vehicles. If the canister is not fully purgedby the time the engine shuts off again, the evapo-rative canister may not be able to hold all of theunburned fuel vapor and some may escape intothe air. A larger evaporative control canister mightbe one method of dealing with this problem.Another alternative might be a completely sealedfuel system.
Toyota’s and Honda’s achievement of SULEVemission levels indicates that hybrids can overcomethese emissions challenges. However, while hybridscan clearly meet and probably exceed today’s tough-est emission standards, we cannot assume that a
A New Road: The Technology and Potential of Hybrid Vehicles l 19
vehicle is inherently clean just because it is a hybrid.The proof will have to come in real-worlddriving tests.
Added Consumer BenefitsIn addition to promising higher fuel economy
and improved tailpipe emissions, hybrids will havemany benefits that may raise additional consumerinterest. While these might cost extra if imple-mented in a conventional vehicle, they come freeas part of the hybrid package. Here’s a short list:
• Good low-end torque: That is car-talk for im-proved acceleration in lower speed ranges, suchas from 0 to 30 mph. This property is inherentin electric-drive vehicles because electric motorsproduce their best acceleration at low speeds(0–2,000 rpm). (Conventional engines producetheir best acceleration between 4,500 and6,000 rpm.)
• Reduced noise and vibration at stops: Becausethe engine turns off when the vehicle stops,there’s no vibration or engine noise.
• Smooth acceleration and reduced noise and vibra-tion at low speeds: On full hybrids, the electricdrive keeps the engine off until around 10 to15 mph.
• Reduced engine vibration: Unlike electric motors,combustion engines do not produce powercontinuously. In fact, each cylinder producespower about one quarter of the time (in a 4-cylinder engine). This produces a pulse, whichshows up as vibration. The more cylinders thevehicle has, the less vibration there is. A hybridcan dramatically reduce vibration by filling thespaces between engine pulses with the electricmotor. This requires modern control technol-ogy, but is well within the capability of ahybrid.
• Better shifting performance: An automatictransmission produces a short drop in powereach time it shifts. In a hybrid, the motor canmake up for much of this lost power. Thismakes less difference for continuously variabletransmissions.
• Added electrical capacity: Hybrids can be de-signed to provide 110 or even 220 volt power.This means a microwave could heat up break-fast on the way to work. Or, instead of a dirtydiesel generator, a series/parallel hybrid truckcould provide the power source for construc-tion equipment. This could, however, under-mine efficiency by increasing the amount ofenergy used while driving.
• Reduced engine and brake maintenance: A hybridrecovers much of the energy required to stopthrough regenerative braking. Thus its mech-anical brakes will see less wear than those ofa conventional vehicle and will need to beserviced or replaced less often.
• Fewer stops at the gas station: The hybrid’s goodfuel economy means that it may need to fillup only every 500 to 600 miles.
Engineering ChallengesOverall, hybrids can provide the same perfor-
mance as most of the vehicles consumers owntoday. In a few circumstances, however, differencesmay become noticeable. And in some extremecases, such as towing multiton loads, a hybridmay not be an appropriate choice. Several of theperformance challenges engineers face aresketched below:
• Reduced high-end torque: While the hybrid’selectric motor more than makes up for itsdownsized engine in accelerating at lowspeeds, it provides somewhat less torque at
20 l The Union of Concerned Scientists
high speed. This means that high-performancehighway passing may take as much as 1 secondlonger. Few drivers are likely to notice this.
• Sustained high-speed grade ability: A typicalperformance goal for a vehicle ascending agrade is to be able to sustain 60 miles per houron a steep 6% grade indefinitely. Using boththe engine and the motor, hybrids will be ableto sustain a 6% grade at 60 mph for a time.But if the grade lasts too long, the battery packcould be drained and the vehicle may have todownshift to allow the engine to take overmore of the load. Most drivers will neverencounter such a situation.
• Reduced high-speed towing capacity: As withascending a grade, towing a boat or trailer putsa significantly heavier load on a vehicle thannormal. Hybrid trucks can be designed to towa three-quarter or one-ton boat or camper trailer,but may not be the right choice for towing atwo-ton load.
SafetyIn achieving higher fuel economy, future
hybrids will not sacrifice safety. In fact, drivers ofSUVs and pickups will be safer: battery placementin practical hybrid designs creates a lower centerof gravity, making SUVs and other tall vehiclesless likely to tip over.
Overall, the key to a hybrid vehicle’s safety isthe same as for conventional vehicles: good engi-neering design. Recent analysis of safety data formodern cars and trucks highlights this fact, show-ing that well designed cars can be safer for theirdrivers than many of the trucks on the road todayare for theirs. For example, the model year 1995–1999 Toyota Camry, Honda Civic, and VolkswagenJetta are all safer for the driver and passengers than
the larger Chevrolet Blazer SUV, Dodge Rampickup, and Toyota 4Runner SUV from the sameyears (Ross and Wenzel 2002).
Automakers that incorporate good safetydesign will be able to produce safe hybrids thatalso get higher fuel economy. And hybrid SUVsand pickups that include high-strength steel andaluminum components will get better fuel econ-omy and pose less danger to others during collisions,while keeping their drivers and passengers safe.
Paving the Way for Fuel Cell VehiclesAs this chapter shows, hybrids incorporate
many of the technologies of electric vehicles. Asa result, they will pave the way for hydrogen fuelcell vehicles.
For each hybrid that is sold, another motorand another battery pack will be produced, drivingdown the cost of future electric motors and batteriesthat will be used in fuel cell vehicles. Thus hybridsales will help electric drive components achieveeconomies of scale sooner than if they had to waitfor fuel cell vehicles to reach the market in largenumbers. Hybrids with larger motors and advancedbattery technologies such as nickel metal-hydrideand lithium-ion, or even ultracapacitors, will domore for fuel cell vehicles than those with smallermotors and lead-acid batteries.
A minimum requirement for hybrids to sup-port fuel cell development is that they must operateabove 60 volts. Fuel cell vehicles will likely operateat 300 to 400 volts, requiring automakers to fol-low different codes and standards in selecting elec-tric components and in designing their vehicles.A typical dividing line in automotive designprocedure is 60 volts.5
How many hybrids automakers put on theroad will affect how soon and at what cost hydro-gen fuel cell vehicles arrive at market.
5 For example, Society of Automotive Engineers standards J1654, J1673, J1678 and J2183.
○ ○ ○ ○ ○ ○ ○ ○ ○ ○ ○ ○ ○ ○ ○ ○ ○ ○ ○ ○ ○ ○ ○ ○ ○ ○ ○ ○ ○ ○ ○ ○ ○ ○ ○ ○ ○ ○ ○ ○ ○ ○ ○ ○ ○ ○ ○ ○ ○ ○ ○ ○ ○ ○ ○ ○ ○ ○ ○ ○ ○
A New Road: The Technology and Potential of Hybrid Vehicles l 21
TOMORROW’S HYBRID
Today’s hybrids are already finding success inthe marketplace. Toyota has sold over 120,000
hybrids since 1997, with more than 40,000 Priussales in the United States and 50,000-plus in Japanas of December 31, 2002 (Kim 2002). Honda’sInsight has sold over 12,000 units and their main-stream Civic Hybrid appears close to meetingHonda’s sales goal of 2,000 cars per month sinceits introduction in April 2002 (Visnic 2002).
Each of the six major automakers selling carsand trucks in the United States today1 plans tointroduce at least one hybrid car or truck by 2006.But many of these will be first-generation vehicles.How will they perform on key fuel economy andenvironmental measures? To help evaluate andcompare the energy security and environmentalperformance of these vehicles, this study examinesthe promise of hybrid electric passenger vehiclesin the five major vehicle classes: compact cars,mid-size “family” cars, minivans, full-size pickups,and mid-size SUVs. This chapter provides a sum-mary of the findings to show the potential of tech-nologies that could be implemented over the next10 to 15 years to transform the fuel economy andenvironmental performance of conventional vehicles,mild hybrids, and full hybrids. It also determinesthe cost of achieving that performance. In addition,a set of case studies explores the challenges in hy-
bridizing compact cars. A second set demonstrateshow effectively hybridization can address the prob-lem of gas-guzzling SUVs. The broader set ofdetailed results for each of the five car and trucktypes considered is provided in Appendix B.2
Vehicles and TechnologiesMany technologies that could significantly
alter fuel economy are currently available, buthave not been widely implemented. This studyevaluates the effect of designing conventionalvehicles, mild hybrids, and full hybrids to takeadvantage of two different technology packages.Each of the hybrids considered uses a parallelhybrid drivetrain.3
The “moderate” technologies, outlined inTable 2, are conventional and electric technolo-gies already in limited use in cars and truckstoday.4 They could be widely implemented acrossthe passenger fleet by 2010. “Advanced” technolo-gies, also listed in Table 2, have yet to enter themarketplace, but have already passed out of theresearch and devel-opment stage and could enterproduction in the near term. They could be appliedthroughout the passenger fleet by 2015. These arethe technologies that will provide the bulk of theenergy security and environmental improvementsfrom passenger vehicles through 2015.
1 Sales from DaimlerChrysler, Ford, General Motors, Honda, Nissan, and Toyota made up about 90% of the US light-duty passenger vehicle market inmodel year 2001 (Mark 2002).
2 All manufacturers’ retail price values in this analysis come from the recent hybrid vehicle cost study by Lipman and Delucchi (2003). All fuel economyand vehicle performance results come from the recent hybrid vehicle performance study by Friedman and An (2003). All costs and savings are shownin year 2000 US dollars.
3 Recent work indicates that series hybrids are likely to be more expensive than parallel hybrids and will achieve lower fuel economy (Plotkin et al. 2001).For these reasons, this study does not analyze pure series hybrids.
4 The conventional moderate and advanced technology packages are drawn in part from earlier reports (DeCicco, An, and Ross 2001; An, Friedman, andRoss 2002) that investigated the potential for improving conventional vehicle technology.
○ ○ ○ ○ ○ ○ ○ ○ ○ ○ ○ ○ ○ ○ ○ ○ ○ ○ ○ ○ ○ ○ ○ ○ ○ ○ ○ ○ ○ ○ ○ ○ ○ ○ ○ ○ ○ ○ ○ ○ ○ ○ ○ ○ ○ ○ ○ ○ ○ ○ ○ ○ ○ ○ ○ ○ ○ ○ ○ ○ ○
○ ○ ○ ○ ○ ○ ○ ○ ○ ○ ○ ○ ○ ○ ○ ○ ○ ○ ○ ○ ○ ○ ○ ○ ○ ○ ○ ○ ○ ○ ○ ○ ○ ○ ○ ○ ○ ○ ○ ○ ○ ○ ○ ○ ○ ○ ○ ○ ○ ○ ○ ○ ○ ○ ○ ○ ○ ○ ○ ○ ○
Chapter 3
22 l The Union of Concerned Scientists
The analysis assumes that each of the vehiclesevaluated is in mass production, with each of theBig 6 automakers producing at least 200,000units per year of each model.
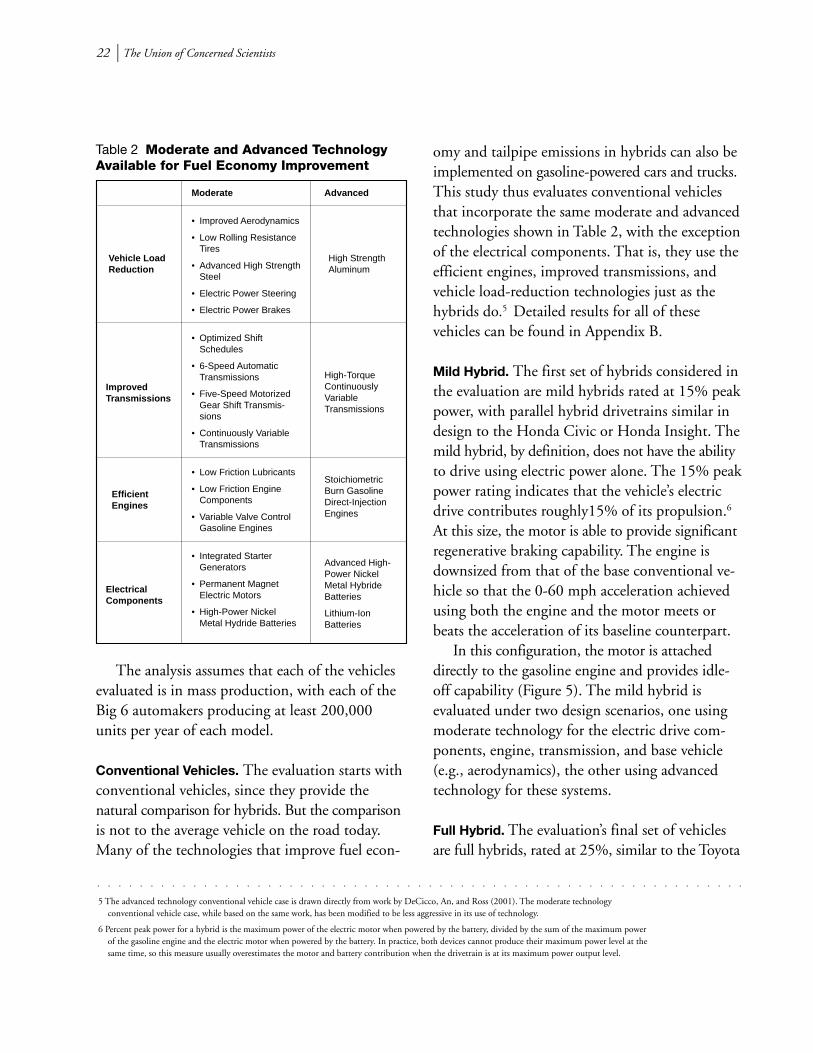
Conventional Vehicles. The evaluation starts withconventional vehicles, since they provide thenatural comparison for hybrids. But the comparisonis not to the average vehicle on the road today.Many of the technologies that improve fuel econ-
omy and tailpipe emissions in hybrids can also beimplemented on gasoline-powered cars and trucks.This study thus evaluates conventional vehiclesthat incorporate the same moderate and advancedtechnologies shown in Table 2, with the exceptionof the electrical components. That is, they use theefficient engines, improved transmissions, andvehicle load-reduction technologies just as thehybrids do.5 Detailed results for all of thesevehicles can be found in Appendix B.
Mild Hybrid. The first set of hybrids considered inthe evaluation are mild hybrids rated at 15% peakpower, with parallel hybrid drivetrains similar indesign to the Honda Civic or Honda Insight. Themild hybrid, by definition, does not have the abilityto drive using electric power alone. The 15% peakpower rating indicates that the vehicle’s electricdrive contributes roughly15% of its propulsion.6
At this size, the motor is able to provide significantregenerative braking capability. The engine isdownsized from that of the base conventional ve-hicle so that the 0-60 mph acceleration achievedusing both the engine and the motor meets orbeats the acceleration of its baseline counterpart.
In this configuration, the motor is attacheddirectly to the gasoline engine and provides idle-off capability (Figure 5). The mild hybrid isevaluated under two design scenarios, one usingmoderate technology for the electric drive com-ponents, engine, transmission, and base vehicle(e.g., aerodynamics), the other using advancedtechnology for these systems.
Full Hybrid. The evaluation’s final set of vehiclesare full hybrids, rated at 25%, similar to the Toyota
Moderate
• Improved Aerodynamics
• Low Rolling ResistanceTires
• Advanced High StrengthSteel
• Electric Power Steering
• Electric Power Brakes
• Optimized ShiftSchedules
• 6-Speed AutomaticTransmissions
• Five-Speed MotorizedGear Shift Transmis-sions
• Continuously VariableTransmissions
• Low Friction Lubricants
• Low Friction EngineComponents
• Variable Valve ControlGasoline Engines
• Integrated StarterGenerators
• Permanent MagnetElectric Motors
• High-Power NickelMetal Hydride Batteries
Table 2 Moderate and Advanced TechnologyAvailable for Fuel Economy Improvement
Vehicle LoadReduction
ImprovedTransmissions
EfficientEngines
ElectricalComponents
Advanced
High StrengthAluminum
High-TorqueContinuouslyVariableTransmissions
Advanced High-Power NickelMetal HybrideBatteries
Lithium-IonBatteries
StoichiometricBurn GasolineDirect-InjectionEngines
5 The advanced technology conventional vehicle case is drawn directly from work by DeCicco, An, and Ross (2001). The moderate technologyconventional vehicle case, while based on the same work, has been modified to be less aggressive in its use of technology.
6 Percent peak power for a hybrid is the maximum power of the electric motor when powered by the battery, divided by the sum of the maximum powerof the gasoline engine and the electric motor when powered by the battery. In practice, both devices cannot produce their maximum power level at thesame time, so this measure usually overestimates the motor and battery contribution when the drivetrain is at its maximum power output level.
○ ○ ○ ○ ○ ○ ○ ○ ○ ○ ○ ○ ○ ○ ○ ○ ○ ○ ○ ○ ○ ○ ○ ○ ○ ○ ○ ○ ○ ○ ○ ○ ○ ○ ○ ○ ○ ○ ○ ○ ○ ○ ○ ○ ○ ○ ○ ○ ○ ○ ○ ○ ○ ○ ○ ○ ○ ○ ○ ○ ○
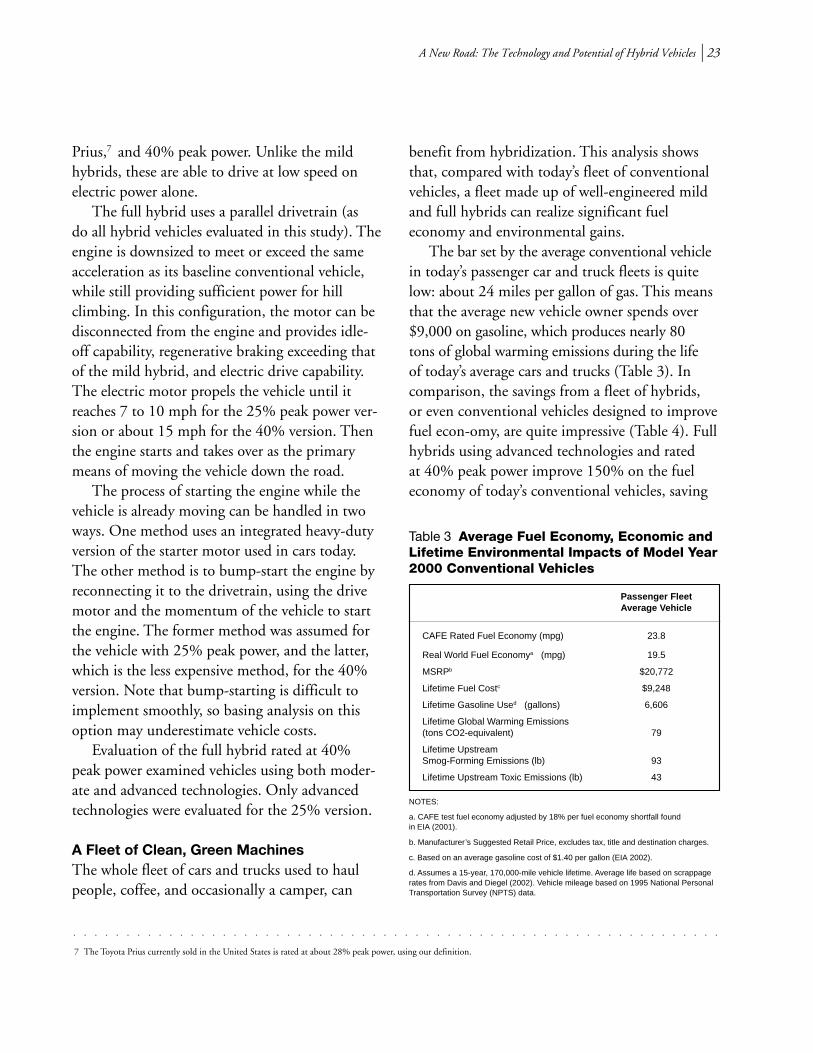
A New Road: The Technology and Potential of Hybrid Vehicles l 23
Prius,7 and 40% peak power. Unlike the mildhybrids, these are able to drive at low speed onelectric power alone.
The full hybrid uses a parallel drivetrain (asdo all hybrid vehicles evaluated in this study). Theengine is downsized to meet or exceed the sameacceleration as its baseline conventional vehicle,while still providing sufficient power for hillclimbing. In this configuration, the motor can bedisconnected from the engine and provides idle-off capability, regenerative braking exceeding thatof the mild hybrid, and electric drive capability.The electric motor propels the vehicle until itreaches 7 to 10 mph for the 25% peak power ver-sion or about 15 mph for the 40% version. Thenthe engine starts and takes over as the primarymeans of moving the vehicle down the road.
The process of starting the engine while thevehicle is already moving can be handled in twoways. One method uses an integrated heavy-dutyversion of the starter motor used in cars today.The other method is to bump-start the engine byreconnecting it to the drivetrain, using the drivemotor and the momentum of the vehicle to startthe engine. The former method was assumed forthe vehicle with 25% peak power, and the latter,which is the less expensive method, for the 40%version. Note that bump-starting is difficult toimplement smoothly, so basing analysis on thisoption may underestimate vehicle costs.
Evaluation of the full hybrid rated at 40%peak power examined vehicles using both moder-ate and advanced technologies. Only advancedtechnologies were evaluated for the 25% version.
A Fleet of Clean, Green MachinesThe whole fleet of cars and trucks used to haulpeople, coffee, and occasionally a camper, can
benefit from hybridization. This analysis showsthat, compared with today’s fleet of conventionalvehicles, a fleet made up of well-engineered mildand full hybrids can realize significant fueleconomy and environmental gains.
The bar set by the average conventional vehiclein today’s passenger car and truck fleets is quitelow: about 24 miles per gallon of gas. This meansthat the average new vehicle owner spends over$9,000 on gasoline, which produces nearly 80tons of global warming emissions during the lifeof today’s average cars and trucks (Table 3). Incomparison, the savings from a fleet of hybrids,or even conventional vehicles designed to improvefuel econ-omy, are quite impressive (Table 4). Fullhybrids using advanced technologies and ratedat 40% peak power improve 150% on the fueleconomy of today’s conventional vehicles, saving
7 The Toyota Prius currently sold in the United States is rated at about 28% peak power, using our definition.
○ ○ ○ ○ ○ ○ ○ ○ ○ ○ ○ ○ ○ ○ ○ ○ ○ ○ ○ ○ ○ ○ ○ ○ ○ ○ ○ ○ ○ ○ ○ ○ ○ ○ ○ ○ ○ ○ ○ ○ ○ ○ ○ ○ ○ ○ ○ ○ ○ ○ ○ ○ ○ ○ ○ ○ ○ ○ ○ ○ ○
Passenger FleetAverage Vehicle
CAFE Rated Fuel Economy (mpg) 23.8
Real World Fuel Economya (mpg) 19.5
MSRPb $20,772
Lifetime Fuel Costc $9,248
Lifetime Gasoline Used (gallons) 6,606
Lifetime Global Warming Emissions(tons CO2-equivalent) 79
Lifetime UpstreamSmog-Forming Emissions (lb) 93
Lifetime Upstream Toxic Emissions (lb) 43
Table 3 Average Fuel Economy, Economic andLifetime Environmental Impacts of Model Year2000 Conventional Vehicles
NOTES:
a. CAFE test fuel economy adjusted by 18% per fuel economy shortfall foundin EIA (2001).
b. Manufacturer’s Suggested Retail Price, excludes tax, title and destination charges.
c. Based on an average gasoline cost of $1.40 per gallon (EIA 2002).
d. Assumes a 15-year, 170,000-mile vehicle lifetime. Average life based on scrappagerates from Davis and Diegel (2002). Vehicle mileage based on 1995 National PersonalTransportation Survey (NPTS) data.
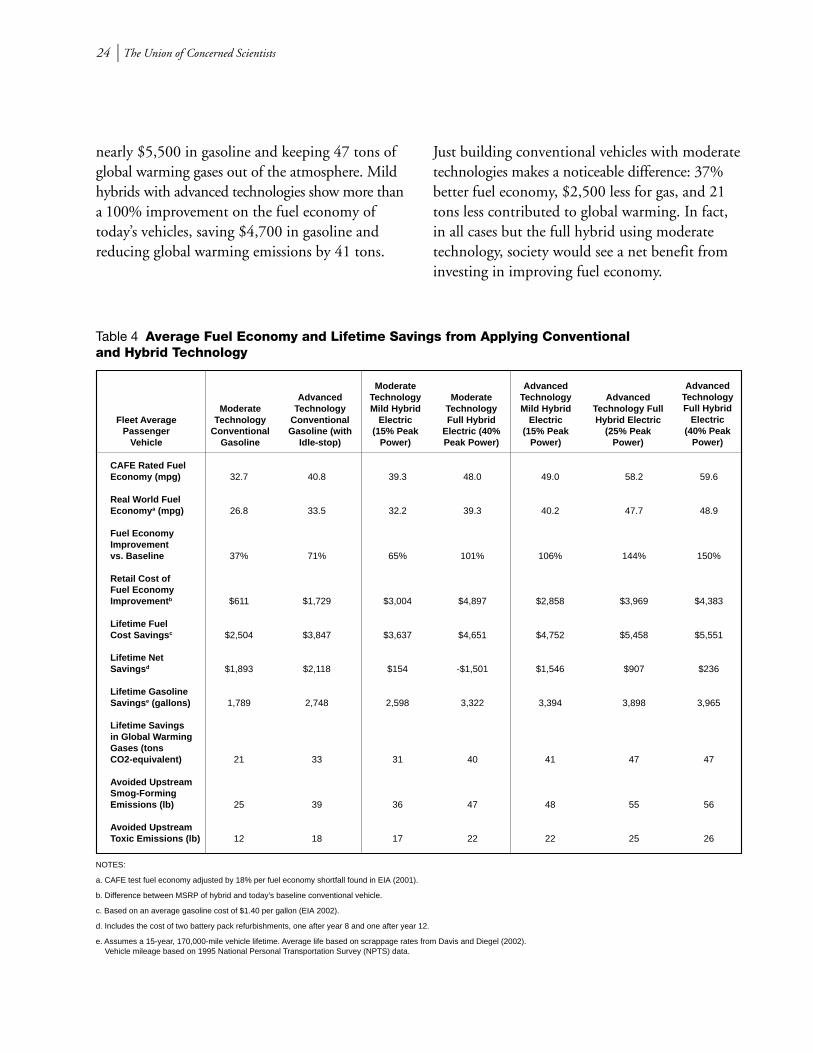
24 l The Union of Concerned Scientists
nearly $5,500 in gasoline and keeping 47 tons ofglobal warming gases out of the atmosphere. Mildhybrids with advanced technologies show more thana 100% improvement on the fuel economy oftoday’s vehicles, saving $4,700 in gasoline andreducing global warming emissions by 41 tons.
Just building conventional vehicles with moderatetechnologies makes a noticeable difference: 37%better fuel economy, $2,500 less for gas, and 21tons less contributed to global warming. In fact,in all cases but the full hybrid using moderatetechnology, society would see a net benefit frominvesting in improving fuel economy.
CAFE Rated FuelEconomy (mpg) 32.7 40.8 39.3 48.0 49.0 58.2 59.6
Real World FuelEconomy a (mpg) 26.8 33.5 32.2 39.3 40.2 47.7 48.9
Fuel EconomyImprovementvs. Baseline 37% 71% 65% 101% 106% 144% 150%
Retail Cost ofFuel EconomyImprovement b $611 $1,729 $3,004 $4,897 $2,858 $3,969 $4,383
Lifetime FuelCost Savings c $2,504 $3,847 $3,637 $4,651 $4,752 $5,458 $5,551
Lifetime NetSavings d $1,893 $2,118 $154 -$1,501 $1,546 $907 $236
Lifetime GasolineSavings e (gallons) 1,789 2,748 2,598 3,322 3,394 3,898 3,965
Lifetime Savingsin Global WarmingGases (tonsCO2-equivalent) 21 33 31 40 41 47 47
Avoided UpstreamSmog-FormingEmissions (lb) 25 39 36 47 48 55 56
Avoided UpstreamToxic Emissions (lb) 12 18 17 22 22 25 26
Table 4 Average Fuel Economy and Lifetime Savings from Applying Conventionaland Hybrid Technology
Fleet AveragePassenger
Vehicle
ModerateTechnology
ConventionalGasoline
AdvancedTechnology
ConventionalGasoline (with
Idle-stop)
ModerateTechnologyMild Hybrid
Electric(15% Peak
Power)
ModerateTechnologyFull Hybrid
Electric (40%Peak Power)
AdvancedTechnologyMild Hybrid
Electric(15% Peak
Power)
AdvancedTechnology FullHybrid Electric
(25% PeakPower)
AdvancedTechnologyFull Hybrid
Electric(40% Peak
Power)
NOTES:
a. CAFE test fuel economy adjusted by 18% per fuel economy shortfall found in EIA (2001).
b. Difference between MSRP of hybrid and today’s baseline conventional vehicle.
c. Based on an average gasoline cost of $1.40 per gallon (EIA 2002).
d. Includes the cost of two battery pack refurbishments, one after year 8 and one after year 12.
e. Assumes a 15-year, 170,000-mile vehicle lifetime. Average life based on scrappage rates from Davis and Diegel (2002). Vehicle mileage based on 1995 National Personal Transportation Survey (NPTS) data.
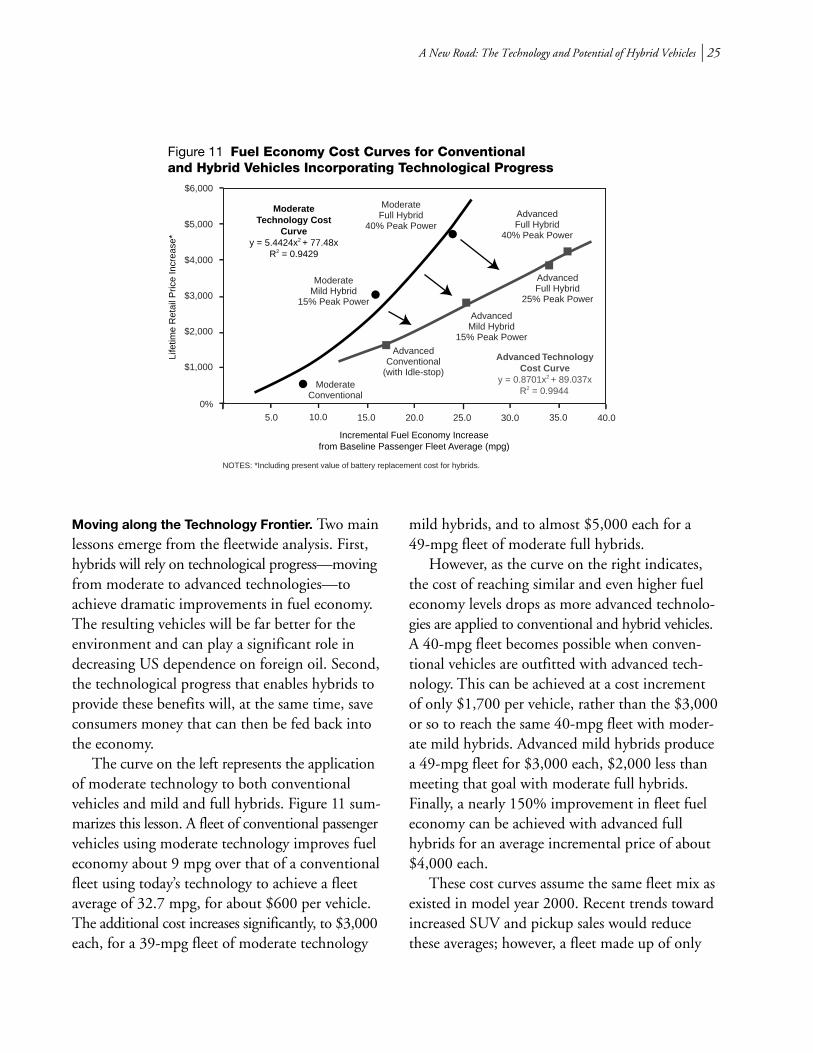
A New Road: The Technology and Potential of Hybrid Vehicles l 25
Moving along the Technology Frontier. Two mainlessons emerge from the fleetwide analysis. First,hybrids will rely on technological progress—movingfrom moderate to advanced technologies—toachieve dramatic improvements in fuel economy.The resulting vehicles will be far better for theenvironment and can play a significant role indecreasing US dependence on foreign oil. Second,the technological progress that enables hybrids toprovide these benefits will, at the same time, saveconsumers money that can then be fed back intothe economy.
The curve on the left represents the applicationof moderate technology to both conventionalvehicles and mild and full hybrids. Figure 11 sum-marizes this lesson. A fleet of conventional passengervehicles using moderate technology improves fueleconomy about 9 mpg over that of a conventionalfleet using today’s technology to achieve a fleetaverage of 32.7 mpg, for about $600 per vehicle.The additional cost increases significantly, to $3,000each, for a 39-mpg fleet of moderate technology
mild hybrids, and to almost $5,000 each for a49-mpg fleet of moderate full hybrids.
However, as the curve on the right indicates,the cost of reaching similar and even higher fueleconomy levels drops as more advanced technolo-gies are applied to conventional and hybrid vehicles.A 40-mpg fleet becomes possible when conven-tional vehicles are outfitted with advanced tech-nology. This can be achieved at a cost incrementof only $1,700 per vehicle, rather than the $3,000or so to reach the same 40-mpg fleet with moder-ate mild hybrids. Advanced mild hybrids producea 49-mpg fleet for $3,000 each, $2,000 less thanmeeting that goal with moderate full hybrids.Finally, a nearly 150% improvement in fleet fueleconomy can be achieved with advanced fullhybrids for an average incremental price of about$4,000 each.
These cost curves assume the same fleet mix asexisted in model year 2000. Recent trends towardincreased SUV and pickup sales would reducethese averages; however, a fleet made up of only
10.0 15.0 20.0 25.0 30.0 35.0 40.0
0%
Incremental Fuel Economy Increasefrom Baseline Passenger Fleet Average (mpg)
Figure 11 Fuel Economy Cost Curves for Conventional and Hybrid Vehicles Incorporating Technological Progress
Life
time
Ret
ail P
rice
Incr
ease
*
$4,000
$3,000
$1,000
$2,000
$5,000
$6,000
AdvancedFull Hybrid
25% Peak Power
5.0
AdvancedMild Hybrid
15% Peak Power
AdvancedConventional
(with Idle-stop)
ModerateMild Hybrid
15% Peak Power
ModerateFull Hybrid
40% Peak PowerAdvancedFull Hybrid
40% Peak Power
ModerateConventional
NOTES: *Including present value of battery replacement cost for hybrids.
Advanced Technology Cost Curve
y = 0.8701x2 + 89.037xR2 = 0.9944
ModerateTechnology Cost
Curvey = 5.4424x2 + 77.48x
R2 = 0.9429
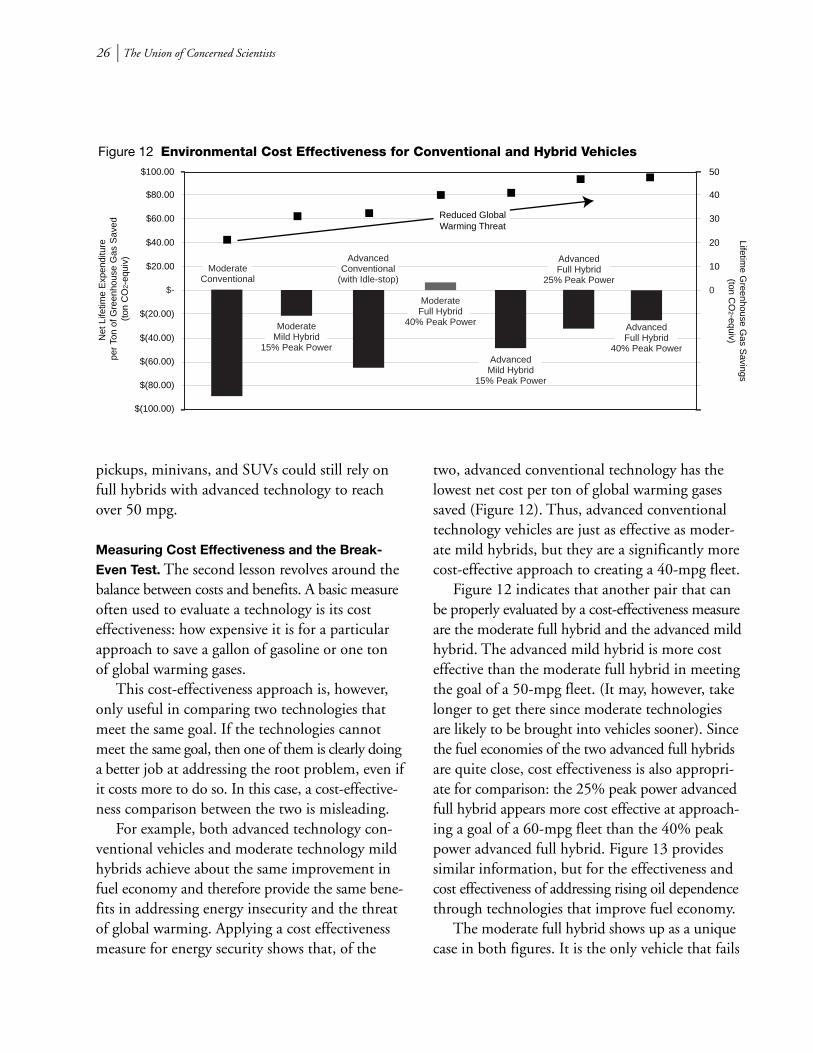
26 l The Union of Concerned Scientists
pickups, minivans, and SUVs could still rely onfull hybrids with advanced technology to reachover 50 mpg.
Measuring Cost Effectiveness and the Break-
Even Test. The second lesson revolves around thebalance between costs and benefits. A basic measureoften used to evaluate a technology is its costeffectiveness: how expensive it is for a particularapproach to save a gallon of gasoline or one tonof global warming gases.
This cost-effectiveness approach is, however,only useful in comparing two technologies thatmeet the same goal. If the technologies cannotmeet the same goal, then one of them is clearly doinga better job at addressing the root problem, even ifit costs more to do so. In this case, a cost-effective-ness comparison between the two is misleading.
For example, both advanced technology con-ventional vehicles and moderate technology mildhybrids achieve about the same improvement infuel economy and therefore provide the same bene-fits in addressing energy insecurity and the threatof global warming. Applying a cost effectivenessmeasure for energy security shows that, of the
two, advanced conventional technology has thelowest net cost per ton of global warming gasessaved (Figure 12). Thus, advanced conventionaltechnology vehicles are just as effective as moder-ate mild hybrids, but they are a significantly morecost-effective approach to creating a 40-mpg fleet.
Figure 12 indicates that another pair that canbe properly evaluated by a cost-effectiveness measureare the moderate full hybrid and the advanced mildhybrid. The advanced mild hybrid is more costeffective than the moderate full hybrid in meetingthe goal of a 50-mpg fleet. (It may, however, takelonger to get there since moderate technologiesare likely to be brought into vehicles sooner). Sincethe fuel economies of the two advanced full hybridsare quite close, cost effectiveness is also appropri-ate for comparison: the 25% peak power advancedfull hybrid appears more cost effective at approach-ing a goal of a 60-mpg fleet than the 40% peakpower advanced full hybrid. Figure 13 providessimilar information, but for the effectiveness andcost effectiveness of addressing rising oil dependencethrough technologies that improve fuel economy.
The moderate full hybrid shows up as a uniquecase in both figures. It is the only vehicle that fails
Figure 12 Environmental Cost Effectiveness for Conventional and Hybrid Vehicles
Net
Life
time
Exp
endi
ture
pe
r To
n of
Gre
enho
use
Gas
Sav
ed(t
on C
O2-
equi
v)
$(40.00)
$(60.00)
$(100.00)
$(80.00)
$(20.00)
$-
$20.00
$40.00
$60.00
$80.00
$100.00
0
10
20
30
40
50
Lifetime G
reenhouse Gas S
avings(ton C
O2-equiv)
Reduced GlobalWarming Threat
AdvancedConventional
(with Idle-stop)Moderate
Conventional
ModerateMild Hybrid
15% Peak Power
ModerateFull Hybrid
40% Peak Power
AdvancedMild Hybrid
15% Peak Power
AdvancedFull Hybrid
25% Peak Power
AdvancedFull Hybrid
40% Peak Power
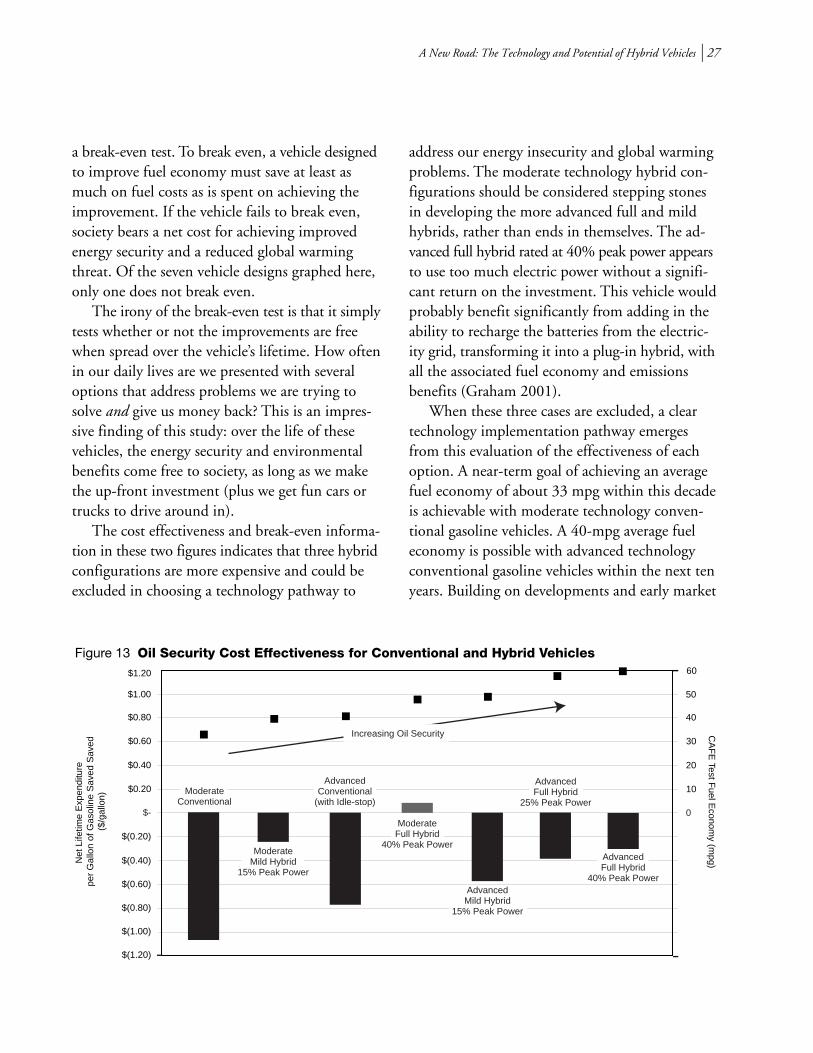
A New Road: The Technology and Potential of Hybrid Vehicles l 27
a break-even test. To break even, a vehicle designedto improve fuel economy must save at least asmuch on fuel costs as is spent on achieving theimprovement. If the vehicle fails to break even,society bears a net cost for achieving improvedenergy security and a reduced global warmingthreat. Of the seven vehicle designs graphed here,only one does not break even.
The irony of the break-even test is that it simplytests whether or not the improvements are freewhen spread over the vehicle’s lifetime. How oftenin our daily lives are we presented with severaloptions that address problems we are trying tosolve and give us money back? This is an impres-sive finding of this study: over the life of thesevehicles, the energy security and environmentalbenefits come free to society, as long as we makethe up-front investment (plus we get fun cars ortrucks to drive around in).
The cost effectiveness and break-even informa-tion in these two figures indicates that three hybridconfigurations are more expensive and could beexcluded in choosing a technology pathway to
address our energy insecurity and global warmingproblems. The moderate technology hybrid con-figurations should be considered stepping stonesin developing the more advanced full and mildhybrids, rather than ends in themselves. The ad-vanced full hybrid rated at 40% peak power appearsto use too much electric power without a signifi-cant return on the investment. This vehicle wouldprobably benefit significantly from adding in theability to recharge the batteries from the electric-ity grid, transforming it into a plug-in hybrid, withall the associated fuel economy and emissionsbenefits (Graham 2001).
When these three cases are excluded, a cleartechnology implementation pathway emergesfrom this evaluation of the effectiveness of eachoption. A near-term goal of achieving an averagefuel economy of about 33 mpg within this decadeis achievable with moderate technology conven-tional gasoline vehicles. A 40-mpg average fueleconomy is possible with advanced technologyconventional gasoline vehicles within the next tenyears. Building on developments and early market
Figure 13 Oil Security Cost Effectiveness for Conventional and Hybrid Vehicles
Net
Life
time
Exp
endi
ture
pe
r G
allo
n of
Gas
olin
e S
aved
Sav
ed($
/gal
lon)
$(0.40)
$(0.60)
$(1.00)
$(0.80)
$(0.20)
$-
$0.20
$0.40
$0.60
$0.80
$1.00
0
10
20
30
40
50
CA
FE
Test Fuel E
conomy (m
pg)
60$1.20
$(1.20)
Increasing Oil Security
ModerateConventional
ModerateMild Hybrid
15% Peak Power
AdvancedConventional
(with Idle-stop)
ModerateFull Hybrid
40% Peak Power
AdvancedMild Hybrid
15% Peak Power
AdvancedFull Hybrid
25% Peak Power
AdvancedFull Hybrid
40% Peak Power
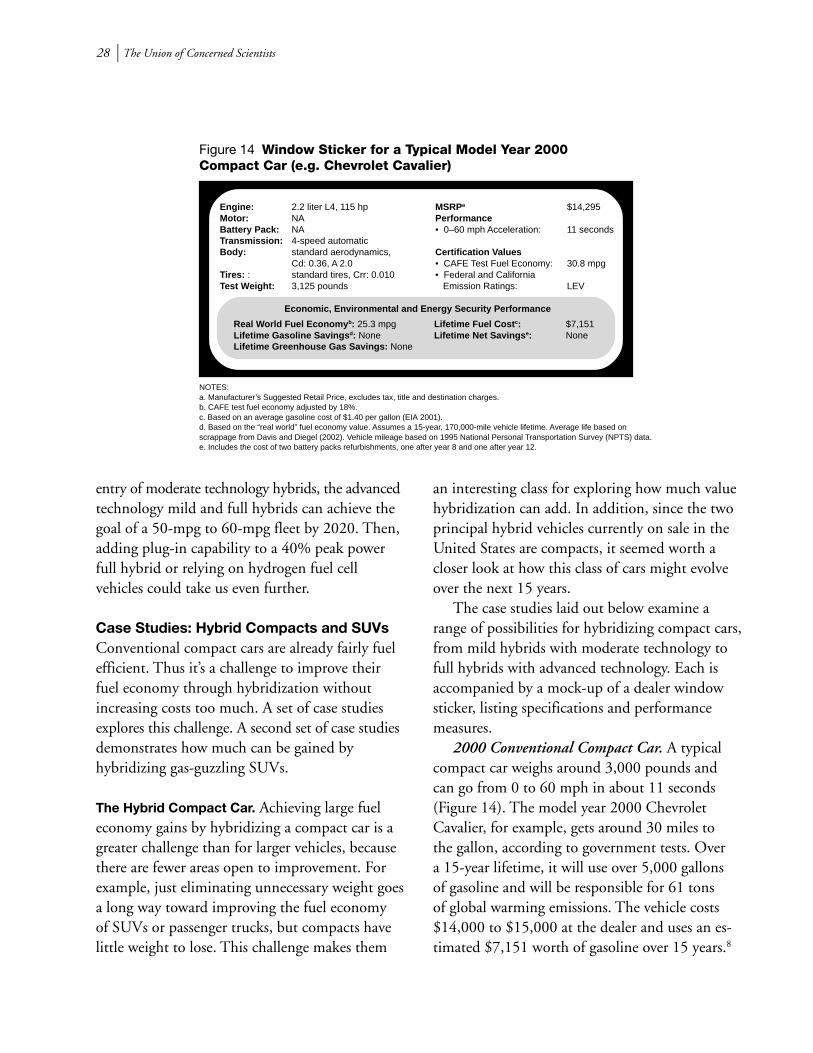
28 l The Union of Concerned Scientists
entry of moderate technology hybrids, the advancedtechnology mild and full hybrids can achieve thegoal of a 50-mpg to 60-mpg fleet by 2020. Then,adding plug-in capability to a 40% peak powerfull hybrid or relying on hydrogen fuel cellvehicles could take us even further.
Case Studies: Hybrid Compacts and SUVsConventional compact cars are already fairly fuelefficient. Thus it’s a challenge to improve theirfuel economy through hybridization withoutincreasing costs too much. A set of case studiesexplores this challenge. A second set of case studiesdemonstrates how much can be gained byhybridizing gas-guzzling SUVs.
The Hybrid Compact Car. Achieving large fueleconomy gains by hybridizing a compact car is agreater challenge than for larger vehicles, becausethere are fewer areas open to improvement. Forexample, just eliminating unnecessary weight goesa long way toward improving the fuel economyof SUVs or passenger trucks, but compacts havelittle weight to lose. This challenge makes them
an interesting class for exploring how much valuehybridization can add. In addition, since the twoprincipal hybrid vehicles currently on sale in theUnited States are compacts, it seemed worth acloser look at how this class of cars might evolveover the next 15 years.
The case studies laid out below examine arange of possibilities for hybridizing compact cars,from mild hybrids with moderate technology tofull hybrids with advanced technology. Each isaccompanied by a mock-up of a dealer windowsticker, listing specifications and performancemeasures.
2000 Conventional Compact Car. A typicalcompact car weighs around 3,000 pounds andcan go from 0 to 60 mph in about 11 seconds(Figure 14). The model year 2000 ChevroletCavalier, for example, gets around 30 miles tothe gallon, according to government tests. Overa 15-year lifetime, it will use over 5,000 gallonsof gasoline and will be responsible for 61 tonsof global warming emissions. The vehicle costs$14,000 to $15,000 at the dealer and uses an es-timated $7,151 worth of gasoline over 15 years.8
Figure 14 Window Sticker for a Typical Model Year 2000Compact Car (e.g. Chevrolet Cavalier)
Engine: 2.2 liter L4, 115 hp MSRPa $14,295Motor: NA PerformanceBattery Pack: NA • 0–60 mph Acceleration: 11 secondsTransmission: 4-speed automaticBody: standard aerodynamics, Certification Values
Cd: 0.36, A 2.0 • CAFE Test Fuel Economy: 30.8 mpgTires: : standard tires, Crr: 0.010 • Federal and CaliforniaTest Weight: 3,125 pounds Emission Ratings: LEV
NOTES:a. Manufacturer’s Suggested Retail Price, excludes tax, title and destination charges.b. CAFE test fuel economy adjusted by 18%.c. Based on an average gasoline cost of $1.40 per gallon (EIA 2001).d. Based on the “real world” fuel economy value. Assumes a 15-year, 170,000-mile vehicle lifetime. Average life based onscrappage from Davis and Diegel (2002). Vehicle mileage based on 1995 National Personal Transportation Survey (NPTS) data.e. Includes the cost of two battery packs refurbishments, one after year 8 and one after year 12.
Economic, Environmental and Energy Security Performance
Real World Fuel Economy b: 25.3 mpg Lifetime Fuel Cost c: $7,151Lifetime Gasoline Savings d: None Lifetime Net Savings e: NoneLifetime Greenhouse Gas Savings: None
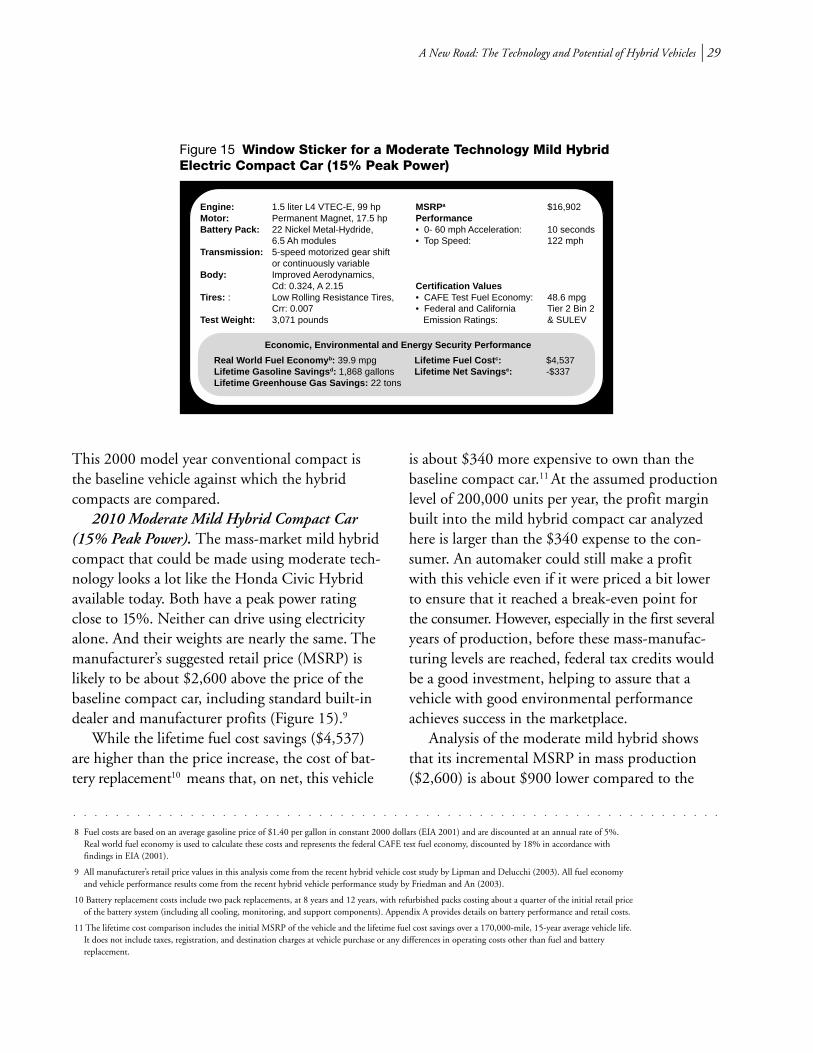
A New Road: The Technology and Potential of Hybrid Vehicles l 29
This 2000 model year conventional compact isthe baseline vehicle against which the hybridcompacts are compared.
2010 Moderate Mild Hybrid Compact Car(15% Peak Power). The mass-market mild hybridcompact that could be made using moderate tech-nology looks a lot like the Honda Civic Hybridavailable today. Both have a peak power ratingclose to 15%. Neither can drive using electricityalone. And their weights are nearly the same. Themanufacturer’s suggested retail price (MSRP) islikely to be about $2,600 above the price of thebaseline compact car, including standard built-indealer and manufacturer profits (Figure 15).9
While the lifetime fuel cost savings ($4,537)are higher than the price increase, the cost of bat-tery replacement10 means that, on net, this vehicle
is about $340 more expensive to own than thebaseline compact car.11 At the assumed productionlevel of 200,000 units per year, the profit marginbuilt into the mild hybrid compact car analyzedhere is larger than the $340 expense to the con-sumer. An automaker could still make a profitwith this vehicle even if it were priced a bit lowerto ensure that it reached a break-even point forthe consumer. However, especially in the first severalyears of production, before these mass-manufac-turing levels are reached, federal tax credits wouldbe a good investment, helping to assure that avehicle with good environmental performanceachieves success in the marketplace.
Analysis of the moderate mild hybrid showsthat its incremental MSRP in mass production($2,600) is about $900 lower compared to the
Figure 15 Window Sticker for a Moderate Technology Mild HybridElectric Compact Car (15% Peak Power)
Engine: 1.5 liter L4 VTEC-E, 99 hp MSRPa $16,902Motor: Permanent Magnet, 17.5 hp PerformanceBattery Pack: 22 Nickel Metal-Hydride, • 0- 60 mph Acceleration: 10 seconds
6.5 Ah modules • Top Speed: 122 mphTransmission: 5-speed motorized gear shift
or continuously variableBody: Improved Aerodynamics,
Cd: 0.324, A 2.15 Certification ValuesTires: : Low Rolling Resistance Tires, • CAFE Test Fuel Economy: 48.6 mpg
Crr: 0.007 • Federal and California Tier 2 Bin 2Test Weight: 3,071 pounds Emission Ratings: & SULEV
Economic, Environmental and Energy Security Performance
Real World Fuel Economy b: 39.9 mpg Lifetime Fuel Cost c: $4,537Lifetime Gasoline Savings d: 1,868 gallons Lifetime Net Savings e: -$337Lifetime Greenhouse Gas Savings: 22 tons
8 Fuel costs are based on an average gasoline price of $1.40 per gallon in constant 2000 dollars (EIA 2001) and are discounted at an annual rate of 5%.Real world fuel economy is used to calculate these costs and represents the federal CAFE test fuel economy, discounted by 18% in accordance withfindings in EIA (2001).
9 All manufacturer’s retail price values in this analysis come from the recent hybrid vehicle cost study by Lipman and Delucchi (2003). All fuel economyand vehicle performance results come from the recent hybrid vehicle performance study by Friedman and An (2003).
10 Battery replacement costs include two pack replacements, at 8 years and 12 years, with refurbished packs costing about a quarter of the initial retail priceof the battery system (including all cooling, monitoring, and support components). Appendix A provides details on battery performance and retail costs.
11 The lifetime cost comparison includes the initial MSRP of the vehicle and the lifetime fuel cost savings over a 170,000-mile, 15-year average vehicle life.It does not include taxes, registration, and destination charges at vehicle purchase or any differences in operating costs other than fuel and batteryreplacement.
○ ○ ○ ○ ○ ○ ○ ○ ○ ○ ○ ○ ○ ○ ○ ○ ○ ○ ○ ○ ○ ○ ○ ○ ○ ○ ○ ○ ○ ○ ○ ○ ○ ○ ○ ○ ○ ○ ○ ○ ○ ○ ○ ○ ○ ○ ○ ○ ○ ○ ○ ○ ○ ○ ○ ○ ○ ○ ○ ○ ○
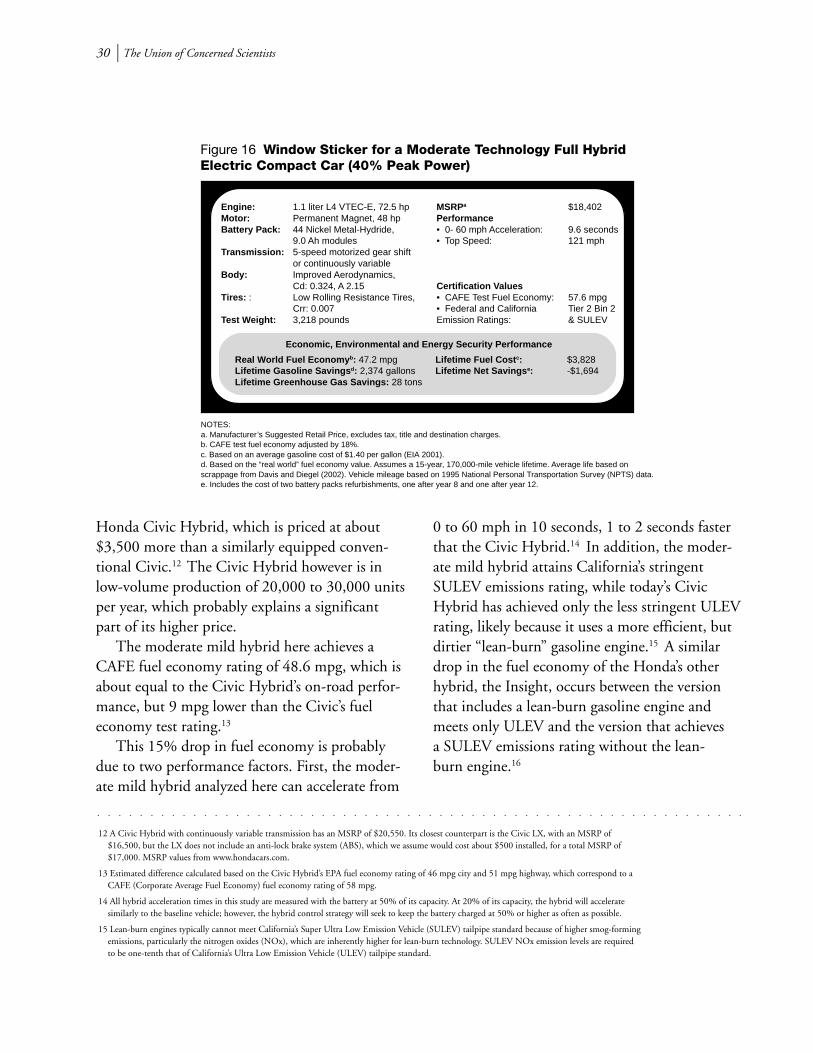
30 l The Union of Concerned Scientists
Honda Civic Hybrid, which is priced at about$3,500 more than a similarly equipped conven-tional Civic.12 The Civic Hybrid however is inlow-volume production of 20,000 to 30,000 unitsper year, which probably explains a significantpart of its higher price.
The moderate mild hybrid here achieves aCAFE fuel economy rating of 48.6 mpg, which isabout equal to the Civic Hybrid’s on-road perfor-mance, but 9 mpg lower than the Civic’s fueleconomy test rating.13
This 15% drop in fuel economy is probablydue to two performance factors. First, the moder-ate mild hybrid analyzed here can accelerate from
0 to 60 mph in 10 seconds, 1 to 2 seconds fasterthat the Civic Hybrid.14 In addition, the moder-ate mild hybrid attains California’s stringentSULEV emissions rating, while today’s CivicHybrid has achieved only the less stringent ULEVrating, likely because it uses a more efficient, butdirtier “lean-burn” gasoline engine.15 A similardrop in the fuel economy of the Honda’s otherhybrid, the Insight, occurs between the versionthat includes a lean-burn gasoline engine andmeets only ULEV and the version that achievesa SULEV emissions rating without the lean-burn engine.16
Figure 16 Window Sticker for a Moderate Technology Full HybridElectric Compact Car (40% Peak Power)
Engine: 1.1 liter L4 VTEC-E, 72.5 hp MSRPa $18,402Motor: Permanent Magnet, 48 hp PerformanceBattery Pack: 44 Nickel Metal-Hydride, • 0- 60 mph Acceleration: 9.6 seconds
9.0 Ah modules • Top Speed: 121 mphTransmission: 5-speed motorized gear shift
or continuously variableBody: Improved Aerodynamics,
Cd: 0.324, A 2.15 Certification ValuesTires: : Low Rolling Resistance Tires, • CAFE Test Fuel Economy: 57.6 mpg
Crr: 0.007 • Federal and California Tier 2 Bin 2Test Weight: 3,218 pounds Emission Ratings: & SULEV
Economic, Environmental and Energy Security Performance
Real World Fuel Economy b: 47.2 mpg Lifetime Fuel Cost c: $3,828Lifetime Gasoline Savings d: 2,374 gallons Lifetime Net Savings e: -$1,694Lifetime Greenhouse Gas Savings: 28 tons
12 A Civic Hybrid with continuously variable transmission has an MSRP of $20,550. Its closest counterpart is the Civic LX, with an MSRP of$16,500, but the LX does not include an anti-lock brake system (ABS), which we assume would cost about $500 installed, for a total MSRP of$17,000. MSRP values from www.hondacars.com.
13 Estimated difference calculated based on the Civic Hybrid’s EPA fuel economy rating of 46 mpg city and 51 mpg highway, which correspond to aCAFE (Corporate Average Fuel Economy) fuel economy rating of 58 mpg.
14 All hybrid acceleration times in this study are measured with the battery at 50% of its capacity. At 20% of its capacity, the hybrid will acceleratesimilarly to the baseline vehicle; however, the hybrid control strategy will seek to keep the battery charged at 50% or higher as often as possible.
15 Lean-burn engines typically cannot meet California’s Super Ultra Low Emission Vehicle (SULEV) tailpipe standard because of higher smog-formingemissions, particularly the nitrogen oxides (NOx), which are inherently higher for lean-burn technology. SULEV NOx emission levels are requiredto be one-tenth that of California’s Ultra Low Emission Vehicle (ULEV) tailpipe standard.
○ ○ ○ ○ ○ ○ ○ ○ ○ ○ ○ ○ ○ ○ ○ ○ ○ ○ ○ ○ ○ ○ ○ ○ ○ ○ ○ ○ ○ ○ ○ ○ ○ ○ ○ ○ ○ ○ ○ ○ ○ ○ ○ ○ ○ ○ ○ ○ ○ ○ ○ ○ ○ ○ ○ ○ ○ ○ ○ ○ ○
NOTES:a. Manufacturer’s Suggested Retail Price, excludes tax, title and destination charges.b. CAFE test fuel economy adjusted by 18%.c. Based on an average gasoline cost of $1.40 per gallon (EIA 2001).d. Based on the “real world” fuel economy value. Assumes a 15-year, 170,000-mile vehicle lifetime. Average life based onscrappage from Davis and Diegel (2002). Vehicle mileage based on 1995 National Personal Transportation Survey (NPTS) data.e. Includes the cost of two battery packs refurbishments, one after year 8 and one after year 12.
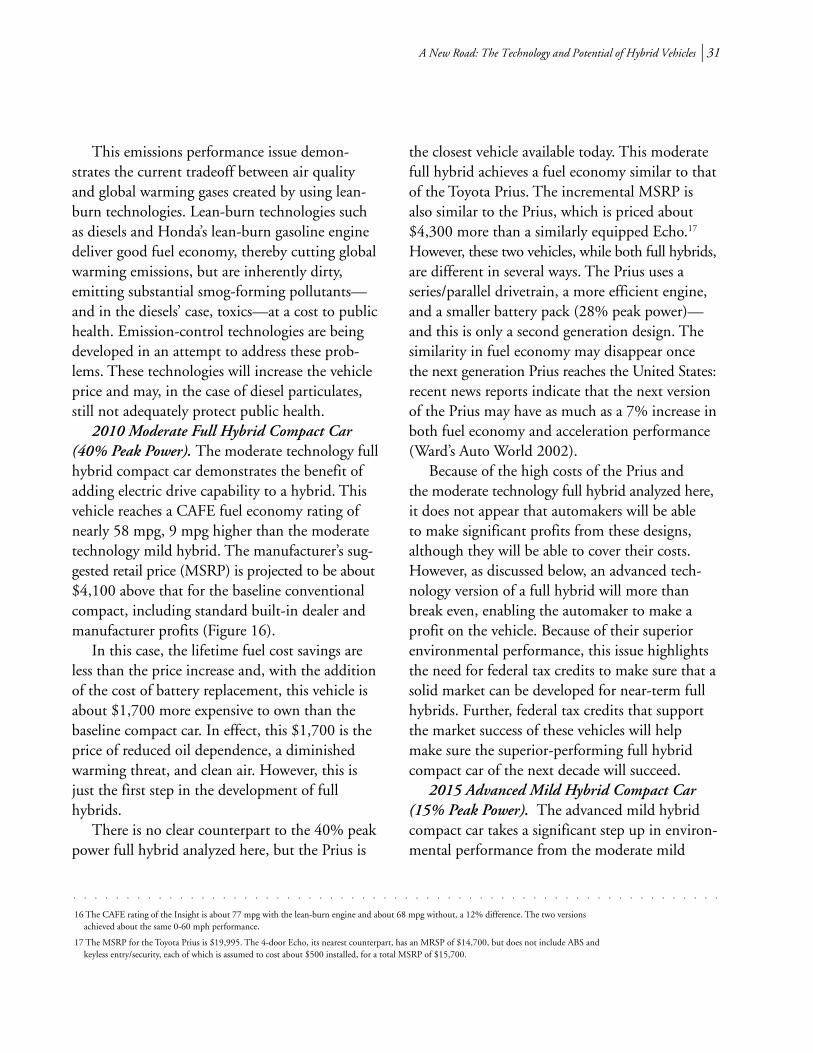
A New Road: The Technology and Potential of Hybrid Vehicles l 31
This emissions performance issue demon-strates the current tradeoff between air qualityand global warming gases created by using lean-burn technologies. Lean-burn technologies suchas diesels and Honda’s lean-burn gasoline enginedeliver good fuel economy, thereby cutting globalwarming emissions, but are inherently dirty,emitting substantial smog-forming pollutants—and in the diesels’ case, toxics—at a cost to publichealth. Emission-control technologies are beingdeveloped in an attempt to address these prob-lems. These technologies will increase the vehicleprice and may, in the case of diesel particulates,still not adequately protect public health.
2010 Moderate Full Hybrid Compact Car(40% Peak Power). The moderate technology fullhybrid compact car demonstrates the benefit ofadding electric drive capability to a hybrid. Thisvehicle reaches a CAFE fuel economy rating ofnearly 58 mpg, 9 mpg higher than the moderatetechnology mild hybrid. The manufacturer’s sug-gested retail price (MSRP) is projected to be about$4,100 above that for the baseline conventionalcompact, including standard built-in dealer andmanufacturer profits (Figure 16).
In this case, the lifetime fuel cost savings areless than the price increase and, with the additionof the cost of battery replacement, this vehicle isabout $1,700 more expensive to own than thebaseline compact car. In effect, this $1,700 is theprice of reduced oil dependence, a diminishedwarming threat, and clean air. However, this isjust the first step in the development of fullhybrids.
There is no clear counterpart to the 40% peakpower full hybrid analyzed here, but the Prius is
the closest vehicle available today. This moderatefull hybrid achieves a fuel economy similar to thatof the Toyota Prius. The incremental MSRP isalso similar to the Prius, which is priced about$4,300 more than a similarly equipped Echo.17
However, these two vehicles, while both full hybrids,are different in several ways. The Prius uses aseries/parallel drivetrain, a more efficient engine,and a smaller battery pack (28% peak power)—and this is only a second generation design. Thesimilarity in fuel economy may disappear oncethe next generation Prius reaches the United States:recent news reports indicate that the next versionof the Prius may have as much as a 7% increase inboth fuel economy and acceleration performance(Ward’s Auto World 2002).
Because of the high costs of the Prius andthe moderate technology full hybrid analyzed here,it does not appear that automakers will be ableto make significant profits from these designs,although they will be able to cover their costs.However, as discussed below, an advanced tech-nology version of a full hybrid will more thanbreak even, enabling the automaker to make aprofit on the vehicle. Because of their superiorenvironmental performance, this issue highlightsthe need for federal tax credits to make sure that asolid market can be developed for near-term fullhybrids. Further, federal tax credits that supportthe market success of these vehicles will helpmake sure the superior-performing full hybridcompact car of the next decade will succeed.
2015 Advanced Mild Hybrid Compact Car(15% Peak Power). The advanced mild hybridcompact car takes a significant step up in environ-mental performance from the moderate mild
16 The CAFE rating of the Insight is about 77 mpg with the lean-burn engine and about 68 mpg without, a 12% difference. The two versionsachieved about the same 0-60 mph performance.
17 The MSRP for the Toyota Prius is $19,995. The 4-door Echo, its nearest counterpart, has an MRSP of $14,700, but does not include ABS andkeyless entry/security, each of which is assumed to cost about $500 installed, for a total MSRP of $15,700.
○ ○ ○ ○ ○ ○ ○ ○ ○ ○ ○ ○ ○ ○ ○ ○ ○ ○ ○ ○ ○ ○ ○ ○ ○ ○ ○ ○ ○ ○ ○ ○ ○ ○ ○ ○ ○ ○ ○ ○ ○ ○ ○ ○ ○ ○ ○ ○ ○ ○ ○ ○ ○ ○ ○ ○ ○ ○ ○ ○ ○
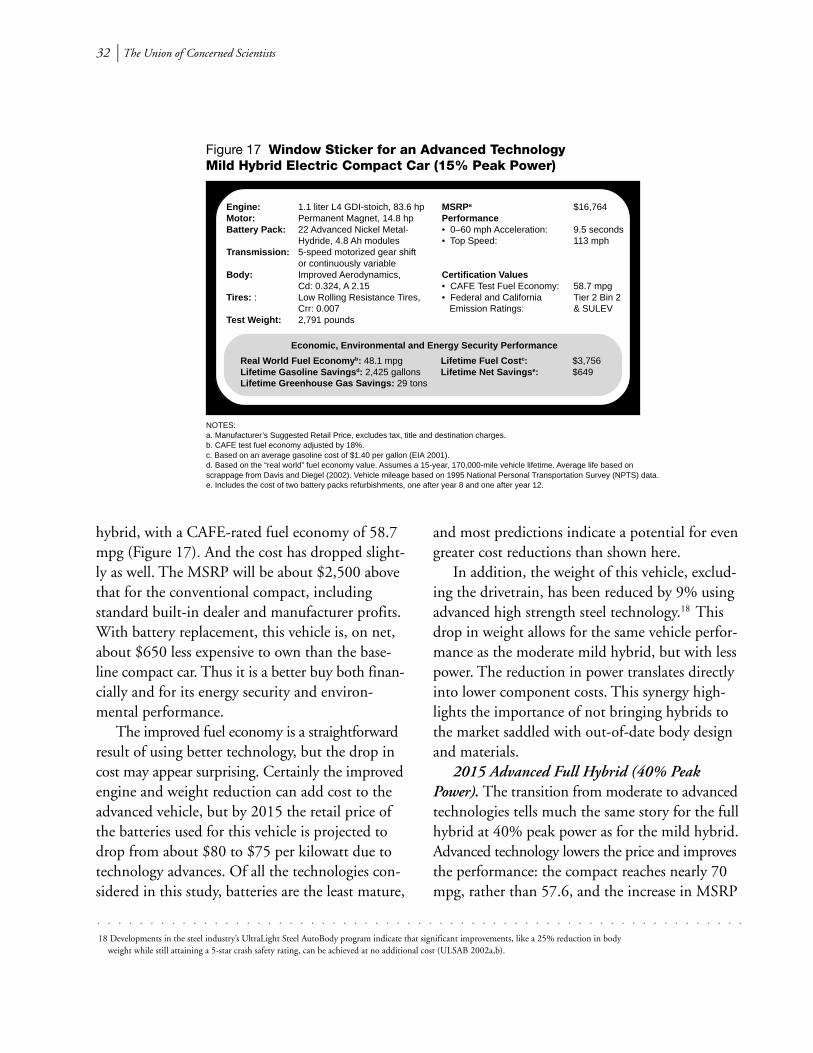
32 l The Union of Concerned Scientists
hybrid, with a CAFE-rated fuel economy of 58.7mpg (Figure 17). And the cost has dropped slight-ly as well. The MSRP will be about $2,500 abovethat for the conventional compact, includingstandard built-in dealer and manufacturer profits.With battery replacement, this vehicle is, on net,about $650 less expensive to own than the base-line compact car. Thus it is a better buy both finan-cially and for its energy security and environ-mental performance.
The improved fuel economy is a straightforwardresult of using better technology, but the drop incost may appear surprising. Certainly the improvedengine and weight reduction can add cost to theadvanced vehicle, but by 2015 the retail price ofthe batteries used for this vehicle is projected todrop from about $80 to $75 per kilowatt due totechnology advances. Of all the technologies con-sidered in this study, batteries are the least mature,
and most predictions indicate a potential for evengreater cost reductions than shown here.
In addition, the weight of this vehicle, exclud-ing the drivetrain, has been reduced by 9% usingadvanced high strength steel technology.18 Thisdrop in weight allows for the same vehicle perfor-mance as the moderate mild hybrid, but with lesspower. The reduction in power translates directlyinto lower component costs. This synergy high-lights the importance of not bringing hybrids tothe market saddled with out-of-date body designand materials.
2015 Advanced Full Hybrid (40% PeakPower). The transition from moderate to advancedtechnologies tells much the same story for the fullhybrid at 40% peak power as for the mild hybrid.Advanced technology lowers the price and improvesthe performance: the compact reaches nearly 70mpg, rather than 57.6, and the increase in MSRP
Figure 17 Window Sticker for an Advanced TechnologyMild Hybrid Electric Compact Car (15% Peak Power)
Engine: 1.1 liter L4 GDI-stoich, 83.6 hp MSRPa $16,764Motor: Permanent Magnet, 14.8 hp PerformanceBattery Pack: 22 Advanced Nickel Metal- • 0–60 mph Acceleration: 9.5 seconds
Hydride, 4.8 Ah modules • Top Speed: 113 mphTransmission: 5-speed motorized gear shift
or continuously variableBody: Improved Aerodynamics, Certification Values
Cd: 0.324, A 2.15 • CAFE Test Fuel Economy: 58.7 mpgTires: : Low Rolling Resistance Tires, • Federal and California Tier 2 Bin 2
Crr: 0.007 Emission Ratings: & SULEVTest Weight: 2,791 pounds
Economic, Environmental and Energy Security Performance
Real World Fuel Economy b: 48.1 mpg Lifetime Fuel Cost c: $3,756Lifetime Gasoline Savings d: 2,425 gallons Lifetime Net Savings e: $649Lifetime Greenhouse Gas Savings: 29 tons
NOTES:a. Manufacturer’s Suggested Retail Price, excludes tax, title and destination charges.b. CAFE test fuel economy adjusted by 18%.c. Based on an average gasoline cost of $1.40 per gallon (EIA 2001).d. Based on the “real world” fuel economy value. Assumes a 15-year, 170,000-mile vehicle lifetime. Average life based onscrappage from Davis and Diegel (2002). Vehicle mileage based on 1995 National Personal Transportation Survey (NPTS) data.e. Includes the cost of two battery packs refurbishments, one after year 8 and one after year 12.
18 Developments in the steel industry’s UltraLight Steel AutoBody program indicate that significant improvements, like a 25% reduction in bodyweight while still attaining a 5-star crash safety rating, can be achieved at no additional cost (ULSAB 2002a,b).
○ ○ ○ ○ ○ ○ ○ ○ ○ ○ ○ ○ ○ ○ ○ ○ ○ ○ ○ ○ ○ ○ ○ ○ ○ ○ ○ ○ ○ ○ ○ ○ ○ ○ ○ ○ ○ ○ ○ ○ ○ ○ ○ ○ ○ ○ ○ ○ ○ ○ ○ ○ ○ ○ ○ ○ ○ ○ ○ ○ ○
A New Road: The Technology and Potential of Hybrid Vehicles l 33
above baseline is $3,600, rather than $4,100(Figure 18). Its 0-60 mph acceleration equalsthat of the moderate full hybrid and betters thatof the baseline compact by over 1.5 seconds.
The lifetime fuel cost savings are greater thanthe price increase, but battery replacement makesthis car $340 more expensive to own than thebaseline compact. If the price of gasoline increasesby just $0.15, to $1.55 per gallon, this vehicle willbreak even, according to our economic measure.Moreover, factoring in even conservative estimatesof the costs of oil dependence and global warmingwould tip this vehicle even further to the positiveside on cost/benefit accounting, indicating thatit will provide a great deal of benefit to societyat no net cost.
2015 Advanced Full Hybrid (25% Peak Power).The 40% peak power advanced full hybrid is justat the edge of breaking even. How would thatchange if it used fewer batteries, and what wouldhappen to the performance? The full hybrid, ratedat 25% peak power has the same advanced tech-nologies as the 40% peak car, except that it usesa starter/generator system to start the engineinstead of bump starting it.
Reducing the battery and motor size has only
a small impact on fuel economy, dropping itfrom 70 to 67.3 mpg (Figure 19). But the effecton the cost is significant: the MSRP increases only$3,300 above the baseline vehicle, rather than$3,600 for the 40% peak power full hybrid.And acceleration remains the same as that ofthe 40% peak car.
As was noted in chapter 2, the key to theimprovement in a full hybrid’s fuel economy is itselectric drive capability. The increase from raisingthe peak power is slight, as shown here. The decreasein fuel economy is less than 4%, while the incre-mental change in MSRP drops by 8%. This initialdrop in cost, plus the reduced cost of replacing asmaller battery pack, means that this vehicle is$131 less expensive to own than the baseline com-pact car. That brings this lower-power full hybridacross the break-even line, according to our econ-omic measure. The Prius should, in the future, beable to meet these performance and cost levels,bringing Toyota significant profit.
The Hybrid SUV. At the other end of the spectrumfrom compact cars, gas-guzzling mid-size SUVsbring to the fore both the magnitude of our depen-dence on oil and the potential to apply technol-
Figure 18 Window Sticker for an Advanced TechnologyFull Hybrid Electric Compact Car (40% Peak Power)
Engine: 0.8 liter L4 GDI-stoich, 60.3 hp MSRPa $17,908Motor: Permanent Magnet, 40.2 hp PerformanceBattery Pack: 44 Advanced Nickel Metal- • 0–60 mph Acceleration: 9.3 seconds
Hydride, 6.2 Ah modules • Top Speed: 116 mphTransmission: 5-speed motorized gear shift
or continuously variableBody: Improved Aerodynamics, Certification Values
Cd: 0.324, A 2.15 • CAFE Test Fuel Economy: 69.6 mpgTires: : Low Rolling Resistance Tires, • Federal and California Tier 2 Bin 2
Crr: 0.007 Emission Ratings: & SULEVTest Weight: 2,854 pounds
Economic, Environmental and Energy Security Performance
Real World Fuel Economy b: 57.1 mpg Lifetime Fuel Cost c: $3,168Lifetime Gasoline Savings d: 2,845 gallons Lifetime Net Savings e: -$343Lifetime Greenhouse Gas Savings: 34 tons
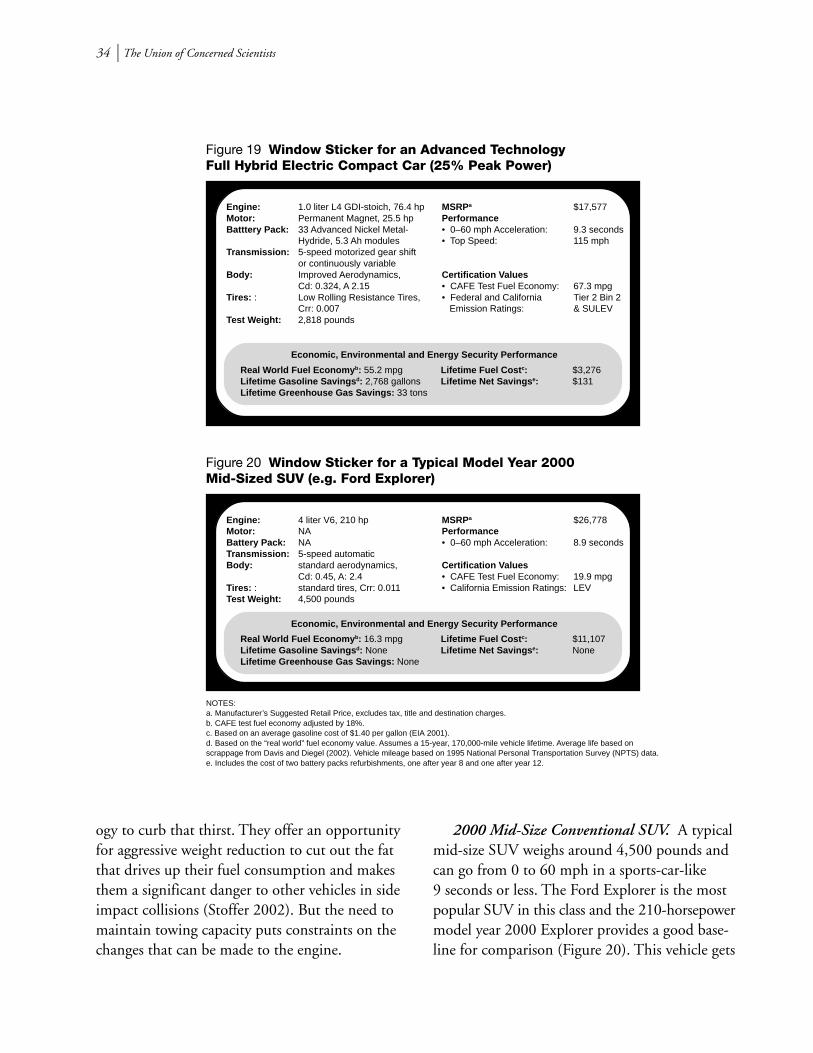
34 l The Union of Concerned Scientists
NOTES:a. Manufacturer’s Suggested Retail Price, excludes tax, title and destination charges.b. CAFE test fuel economy adjusted by 18%.c. Based on an average gasoline cost of $1.40 per gallon (EIA 2001).d. Based on the “real world” fuel economy value. Assumes a 15-year, 170,000-mile vehicle lifetime. Average life based onscrappage from Davis and Diegel (2002). Vehicle mileage based on 1995 National Personal Transportation Survey (NPTS) data.e. Includes the cost of two battery packs refurbishments, one after year 8 and one after year 12.
ogy to curb that thirst. They offer an opportunityfor aggressive weight reduction to cut out the fatthat drives up their fuel consumption and makesthem a significant danger to other vehicles in sideimpact collisions (Stoffer 2002). But the need tomaintain towing capacity puts constraints on thechanges that can be made to the engine.
2000 Mid-Size Conventional SUV. A typicalmid-size SUV weighs around 4,500 pounds andcan go from 0 to 60 mph in a sports-car-like9 seconds or less. The Ford Explorer is the mostpopular SUV in this class and the 210-horsepowermodel year 2000 Explorer provides a good base-line for comparison (Figure 20). This vehicle gets
Figure 19 Window Sticker for an Advanced TechnologyFull Hybrid Electric Compact Car (25% Peak Power)
Engine: 1.0 liter L4 GDI-stoich, 76.4 hp MSRPa $17,577Motor: Permanent Magnet, 25.5 hp PerformanceBatttery Pack: 33 Advanced Nickel Metal- • 0–60 mph Acceleration: 9.3 seconds
Hydride, 5.3 Ah modules • Top Speed: 115 mphTransmission: 5-speed motorized gear shift
or continuously variableBody: Improved Aerodynamics, Certification Values
Cd: 0.324, A 2.15 • CAFE Test Fuel Economy: 67.3 mpgTires: : Low Rolling Resistance Tires, • Federal and California Tier 2 Bin 2
Crr: 0.007 Emission Ratings: & SULEVTest Weight: 2,818 pounds
Economic, Environmental and Energy Security Performance
Real World Fuel Economy b: 55.2 mpg Lifetime Fuel Cost c: $3,276Lifetime Gasoline Savings d: 2,768 gallons Lifetime Net Savings e: $131Lifetime Greenhouse Gas Savings: 33 tons
Figure 20 Window Sticker for a Typical Model Year 2000Mid-Sized SUV (e.g. Ford Explorer)
Engine: 4 liter V6, 210 hp MSRPa $26,778Motor: NA PerformanceBattery Pack: NA • 0–60 mph Acceleration: 8.9 secondsTransmission: 5-speed automaticBody: standard aerodynamics, Certification Values
Cd: 0.45, A: 2.4 • CAFE Test Fuel Economy: 19.9 mpgTires: : standard tires, Crr: 0.011 • California Emission Ratings: LEVTest Weight: 4,500 pounds
Economic, Environmental and Energy Security Performance
Real World Fuel Economy b: 16.3 mpg Lifetime Fuel Cost c: $11,107Lifetime Gasoline Savings d: None Lifetime Net Savings e: NoneLifetime Greenhouse Gas Savings: None
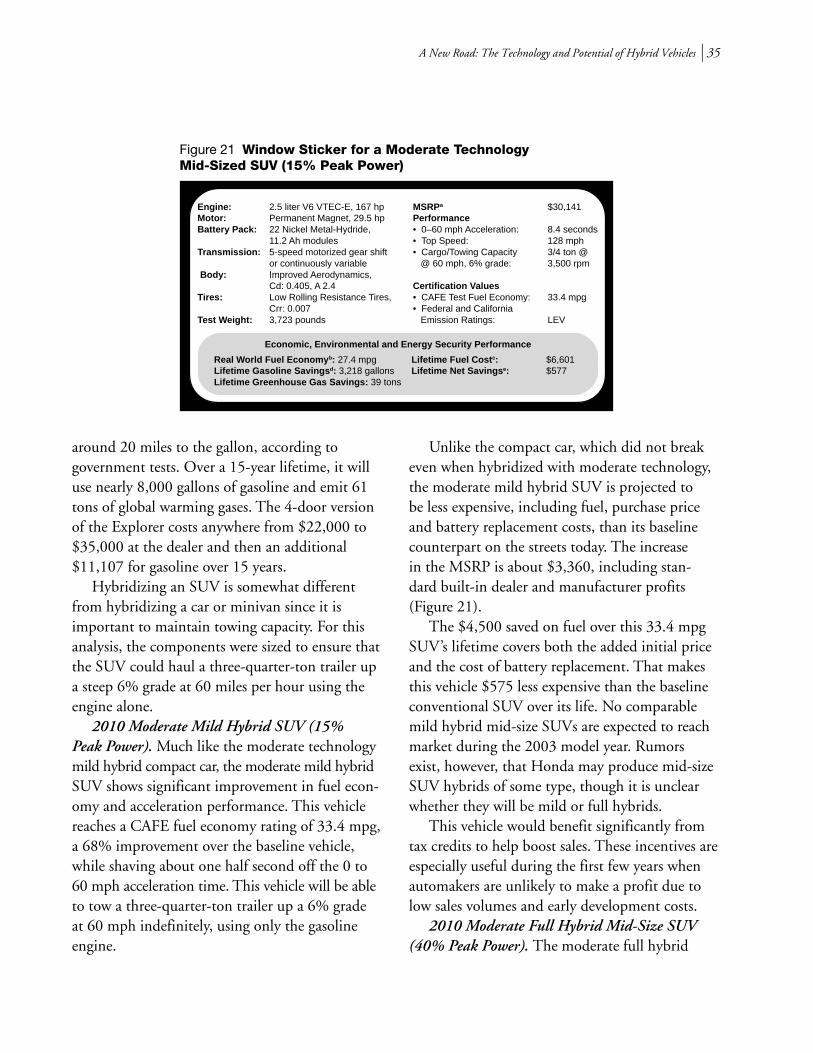
A New Road: The Technology and Potential of Hybrid Vehicles l 35
around 20 miles to the gallon, according togovernment tests. Over a 15-year lifetime, it willuse nearly 8,000 gallons of gasoline and emit 61tons of global warming gases. The 4-door versionof the Explorer costs anywhere from $22,000 to$35,000 at the dealer and then an additional$11,107 for gasoline over 15 years.
Hybridizing an SUV is somewhat differentfrom hybridizing a car or minivan since it isimportant to maintain towing capacity. For thisanalysis, the components were sized to ensure thatthe SUV could haul a three-quarter-ton trailer upa steep 6% grade at 60 miles per hour using theengine alone.
2010 Moderate Mild Hybrid SUV (15%Peak Power). Much like the moderate technologymild hybrid compact car, the moderate mild hybridSUV shows significant improvement in fuel econ-omy and acceleration performance. This vehiclereaches a CAFE fuel economy rating of 33.4 mpg,a 68% improvement over the baseline vehicle,while shaving about one half second off the 0 to60 mph acceleration time. This vehicle will be ableto tow a three-quarter-ton trailer up a 6% gradeat 60 mph indefinitely, using only the gasolineengine.
Unlike the compact car, which did not breakeven when hybridized with moderate technology,the moderate mild hybrid SUV is projected tobe less expensive, including fuel, purchase priceand battery replacement costs, than its baselinecounterpart on the streets today. The increasein the MSRP is about $3,360, including stan-dard built-in dealer and manufacturer profits(Figure 21).
The $4,500 saved on fuel over this 33.4 mpgSUV’s lifetime covers both the added initial priceand the cost of battery replacement. That makesthis vehicle $575 less expensive than the baselineconventional SUV over its life. No comparablemild hybrid mid-size SUVs are expected to reachmarket during the 2003 model year. Rumorsexist, however, that Honda may produce mid-sizeSUV hybrids of some type, though it is unclearwhether they will be mild or full hybrids.
This vehicle would benefit significantly fromtax credits to help boost sales. These incentives areespecially useful during the first few years whenautomakers are unlikely to make a profit due tolow sales volumes and early development costs.
2010 Moderate Full Hybrid Mid-Size SUV(40% Peak Power). The moderate full hybrid
Figure 21 Window Sticker for a Moderate TechnologyMid-Sized SUV (15% Peak Power)
Engine: 2.5 liter V6 VTEC-E, 167 hp MSRPa $30,141Motor: Permanent Magnet, 29.5 hp PerformanceBattery Pack: 22 Nickel Metal-Hydride, • 0–60 mph Acceleration: 8.4 seconds
11.2 Ah modules • Top Speed: 128 mphTransmission: 5-speed motorized gear shift • Cargo/Towing Capacity 3/4 ton @
or continuously variable @ 60 mph, 6% grade: 3,500 rpm Body: Improved Aerodynamics,
Cd: 0.405, A 2.4 Certification ValuesTires: Low Rolling Resistance Tires, • CAFE Test Fuel Economy: 33.4 mpg
Crr: 0.007 • Federal and CaliforniaTest Weight: 3,723 pounds Emission Ratings: LEV
Economic, Environmental and Energy Security Performance
Real World Fuel Economy b: 27.4 mpg Lifetime Fuel Cost c: $6,601Lifetime Gasoline Savings d: 3,218 gallons Lifetime Net Savings e: $577Lifetime Greenhouse Gas Savings: 39 tons
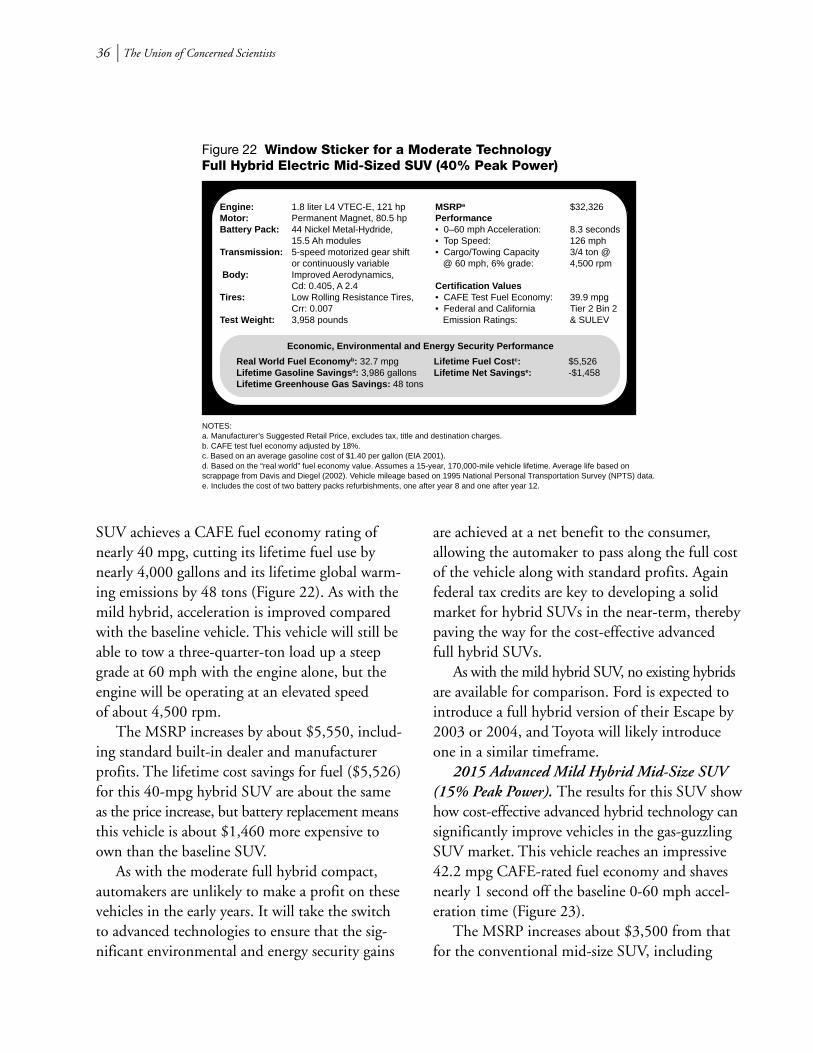
36 l The Union of Concerned Scientists
SUV achieves a CAFE fuel economy rating ofnearly 40 mpg, cutting its lifetime fuel use bynearly 4,000 gallons and its lifetime global warm-ing emissions by 48 tons (Figure 22). As with themild hybrid, acceleration is improved comparedwith the baseline vehicle. This vehicle will still beable to tow a three-quarter-ton load up a steepgrade at 60 mph with the engine alone, but theengine will be operating at an elevated speedof about 4,500 rpm.
The MSRP increases by about $5,550, includ-ing standard built-in dealer and manufacturerprofits. The lifetime cost savings for fuel ($5,526)for this 40-mpg hybrid SUV are about the sameas the price increase, but battery replacement meansthis vehicle is about $1,460 more expensive toown than the baseline SUV.
As with the moderate full hybrid compact,automakers are unlikely to make a profit on thesevehicles in the early years. It will take the switchto advanced technologies to ensure that the sig-nificant environmental and energy security gains
are achieved at a net benefit to the consumer,allowing the automaker to pass along the full costof the vehicle along with standard profits. Againfederal tax credits are key to developing a solidmarket for hybrid SUVs in the near-term, therebypaving the way for the cost-effective advancedfull hybrid SUVs.
As with the mild hybrid SUV, no existing hybridsare available for comparison. Ford is expected tointroduce a full hybrid version of their Escape by2003 or 2004, and Toyota will likely introduceone in a similar timeframe.
2015 Advanced Mild Hybrid Mid-Size SUV(15% Peak Power). The results for this SUV showhow cost-effective advanced hybrid technology cansignificantly improve vehicles in the gas-guzzlingSUV market. This vehicle reaches an impressive42.2 mpg CAFE-rated fuel economy and shavesnearly 1 second off the baseline 0-60 mph accel-eration time (Figure 23).
The MSRP increases about $3,500 from thatfor the conventional mid-size SUV, including
NOTES:a. Manufacturer’s Suggested Retail Price, excludes tax, title and destination charges.b. CAFE test fuel economy adjusted by 18%.c. Based on an average gasoline cost of $1.40 per gallon (EIA 2001).d. Based on the “real world” fuel economy value. Assumes a 15-year, 170,000-mile vehicle lifetime. Average life based onscrappage from Davis and Diegel (2002). Vehicle mileage based on 1995 National Personal Transportation Survey (NPTS) data.e. Includes the cost of two battery packs refurbishments, one after year 8 and one after year 12.
Figure 22 Window Sticker for a Moderate TechnologyFull Hybrid Electric Mid-Sized SUV (40% Peak Power)
Engine: 1.8 liter L4 VTEC-E, 121 hp MSRPa $32,326Motor: Permanent Magnet, 80.5 hp PerformanceBattery Pack: 44 Nickel Metal-Hydride, • 0–60 mph Acceleration: 8.3 seconds
15.5 Ah modules • Top Speed: 126 mphTransmission: 5-speed motorized gear shift • Cargo/Towing Capacity 3/4 ton @
or continuously variable @ 60 mph, 6% grade: 4,500 rpm Body: Improved Aerodynamics,
Cd: 0.405, A 2.4 Certification ValuesTires: Low Rolling Resistance Tires, • CAFE Test Fuel Economy: 39.9 mpg
Crr: 0.007 • Federal and California Tier 2 Bin 2Test Weight: 3,958 pounds Emission Ratings: & SULEV
Economic, Environmental and Energy Security Performance
Real World Fuel Economy b: 32.7 mpg Lifetime Fuel Cost c: $5,526Lifetime Gasoline Savings d: 3,986 gallons Lifetime Net Savings e: -$1,458Lifetime Greenhouse Gas Savings: 48 tons
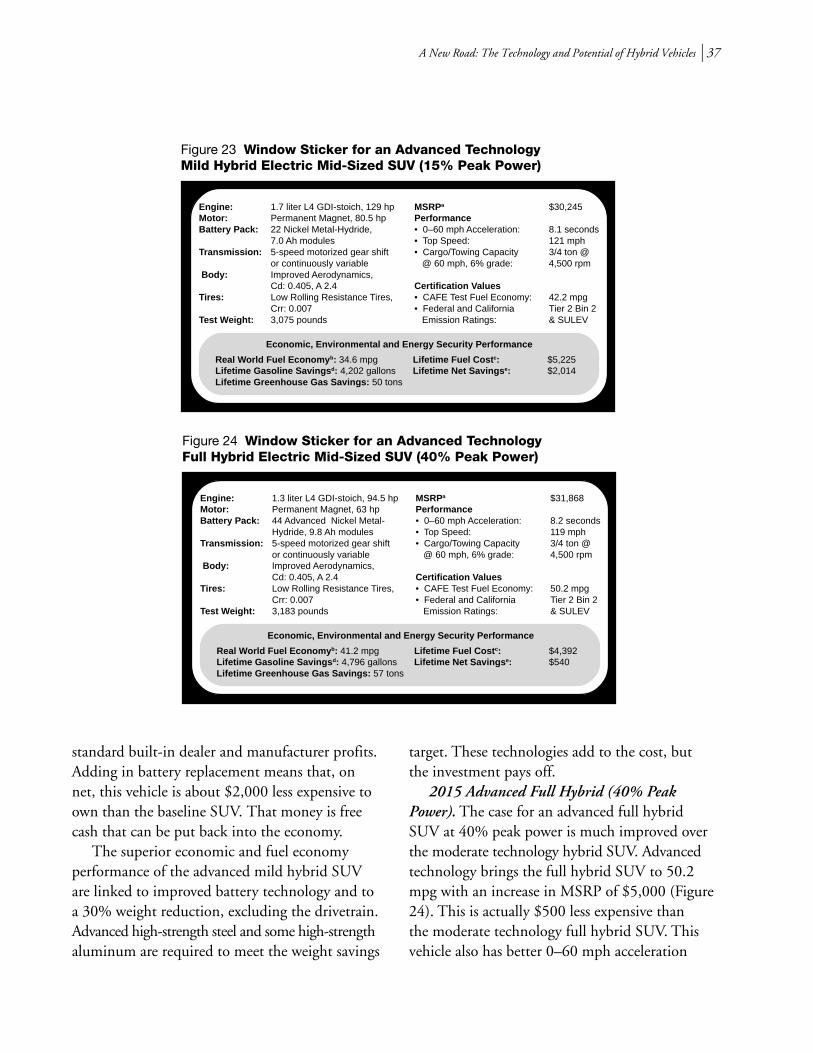
A New Road: The Technology and Potential of Hybrid Vehicles l 37
standard built-in dealer and manufacturer profits.Adding in battery replacement means that, onnet, this vehicle is about $2,000 less expensive toown than the baseline SUV. That money is freecash that can be put back into the economy.
The superior economic and fuel economyperformance of the advanced mild hybrid SUVare linked to improved battery technology and toa 30% weight reduction, excluding the drivetrain.Advanced high-strength steel and some high-strengthaluminum are required to meet the weight savings
target. These technologies add to the cost, butthe investment pays off.
2015 Advanced Full Hybrid (40% PeakPower). The case for an advanced full hybridSUV at 40% peak power is much improved overthe moderate technology hybrid SUV. Advancedtechnology brings the full hybrid SUV to 50.2mpg with an increase in MSRP of $5,000 (Figure24). This is actually $500 less expensive thanthe moderate technology full hybrid SUV. Thisvehicle also has better 0–60 mph acceleration
Figure 23 Window Sticker for an Advanced TechnologyMild Hybrid Electric Mid-Sized SUV (15% Peak Power)
Engine: 1.7 liter L4 GDI-stoich, 129 hp MSRPa $30,245Motor: Permanent Magnet, 80.5 hp PerformanceBattery Pack: 22 Nickel Metal-Hydride, • 0–60 mph Acceleration: 8.1 seconds
7.0 Ah modules • Top Speed: 121 mphTransmission: 5-speed motorized gear shift • Cargo/Towing Capacity 3/4 ton @
or continuously variable @ 60 mph, 6% grade: 4,500 rpm Body: Improved Aerodynamics,
Cd: 0.405, A 2.4 Certification ValuesTires: Low Rolling Resistance Tires, • CAFE Test Fuel Economy: 42.2 mpg
Crr: 0.007 • Federal and California Tier 2 Bin 2Test Weight: 3,075 pounds Emission Ratings: & SULEV
Economic, Environmental and Energy Security Performance
Real World Fuel Economy b: 34.6 mpg Lifetime Fuel Cost c: $5,225Lifetime Gasoline Savings d: 4,202 gallons Lifetime Net Savings e: $2,014Lifetime Greenhouse Gas Savings: 50 tons
Figure 24 Window Sticker for an Advanced TechnologyFull Hybrid Electric Mid-Sized SUV (40% Peak Power)
Engine: 1.3 liter L4 GDI-stoich, 94.5 hp MSRPa $31,868Motor: Permanent Magnet, 63 hp PerformanceBattery Pack: 44 Advanced Nickel Metal- • 0–60 mph Acceleration: 8.2 seconds
Hydride, 9.8 Ah modules • Top Speed: 119 mphTransmission: 5-speed motorized gear shift • Cargo/Towing Capacity 3/4 ton @
or continuously variable @ 60 mph, 6% grade: 4,500 rpm Body: Improved Aerodynamics,
Cd: 0.405, A 2.4 Certification ValuesTires: Low Rolling Resistance Tires, • CAFE Test Fuel Economy: 50.2 mpg
Crr: 0.007 • Federal and California Tier 2 Bin 2Test Weight: 3,183 pounds Emission Ratings: & SULEV
Economic, Environmental and Energy Security Performance
Real World Fuel Economy b: 41.2 mpg Lifetime Fuel Cost c: $4,392Lifetime Gasoline Savings d: 4,796 gallons Lifetime Net Savings e: $540Lifetime Greenhouse Gas Savings: 57 tons
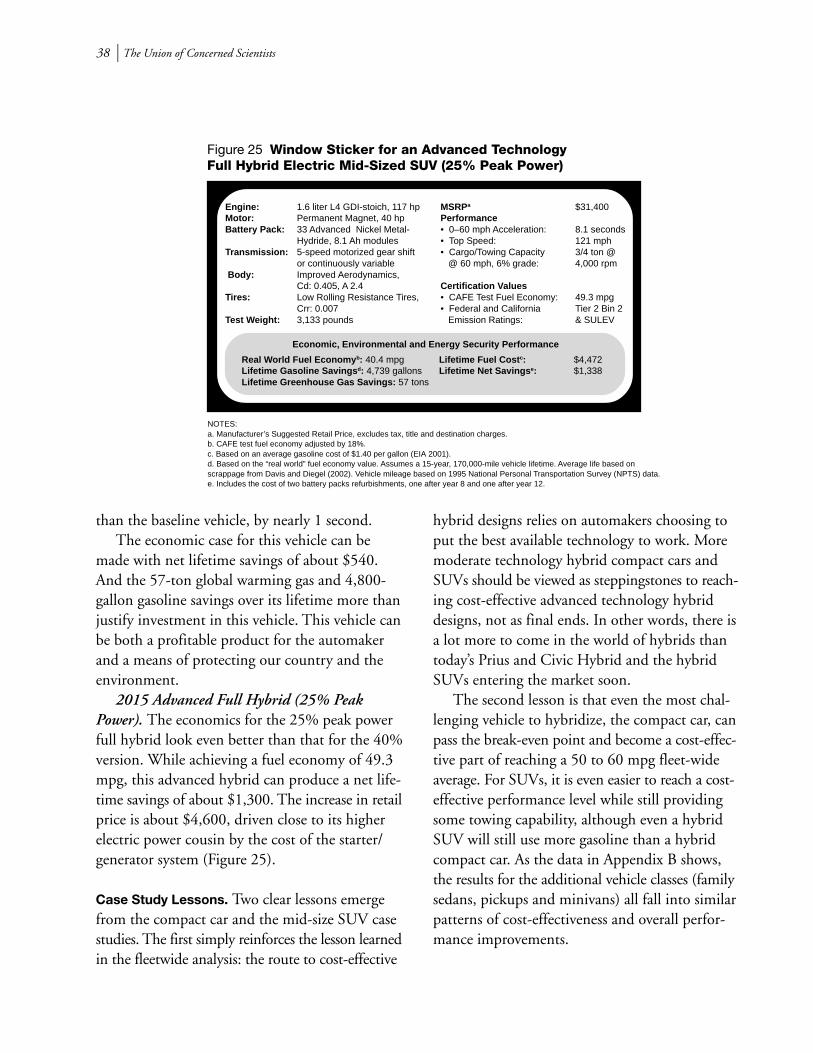
38 l The Union of Concerned Scientists
than the baseline vehicle, by nearly 1 second.The economic case for this vehicle can be
made with net lifetime savings of about $540.And the 57-ton global warming gas and 4,800-gallon gasoline savings over its lifetime more thanjustify investment in this vehicle. This vehicle canbe both a profitable product for the automakerand a means of protecting our country and theenvironment.
2015 Advanced Full Hybrid (25% PeakPower). The economics for the 25% peak powerfull hybrid look even better than that for the 40%version. While achieving a fuel economy of 49.3mpg, this advanced hybrid can produce a net life-time savings of about $1,300. The increase in retailprice is about $4,600, driven close to its higherelectric power cousin by the cost of the starter/generator system (Figure 25).
Case Study Lessons. Two clear lessons emergefrom the compact car and the mid-size SUV casestudies. The first simply reinforces the lesson learnedin the fleetwide analysis: the route to cost-effective
hybrid designs relies on automakers choosing toput the best available technology to work. Moremoderate technology hybrid compact cars andSUVs should be viewed as steppingstones to reach-ing cost-effective advanced technology hybriddesigns, not as final ends. In other words, there isa lot more to come in the world of hybrids thantoday’s Prius and Civic Hybrid and the hybridSUVs entering the market soon.
The second lesson is that even the most chal-lenging vehicle to hybridize, the compact car, canpass the break-even point and become a cost-effec-tive part of reaching a 50 to 60 mpg fleet-wideaverage. For SUVs, it is even easier to reach a cost-effective performance level while still providingsome towing capability, although even a hybridSUV will still use more gasoline than a hybridcompact car. As the data in Appendix B shows,the results for the additional vehicle classes (familysedans, pickups and minivans) all fall into similarpatterns of cost-effectiveness and overall perfor-mance improvements.
NOTES:a. Manufacturer’s Suggested Retail Price, excludes tax, title and destination charges.b. CAFE test fuel economy adjusted by 18%.c. Based on an average gasoline cost of $1.40 per gallon (EIA 2001).d. Based on the “real world” fuel economy value. Assumes a 15-year, 170,000-mile vehicle lifetime. Average life based onscrappage from Davis and Diegel (2002). Vehicle mileage based on 1995 National Personal Transportation Survey (NPTS) data.e. Includes the cost of two battery packs refurbishments, one after year 8 and one after year 12.
Figure 25 Window Sticker for an Advanced TechnologyFull Hybrid Electric Mid-Sized SUV (25% Peak Power)
Engine: 1.6 liter L4 GDI-stoich, 117 hp MSRPa $31,400Motor: Permanent Magnet, 40 hp PerformanceBattery Pack: 33 Advanced Nickel Metal- • 0–60 mph Acceleration: 8.1 seconds
Hydride, 8.1 Ah modules • Top Speed: 121 mphTransmission: 5-speed motorized gear shift • Cargo/Towing Capacity 3/4 ton @
or continuously variable @ 60 mph, 6% grade: 4,000 rpm Body: Improved Aerodynamics,
Cd: 0.405, A 2.4 Certification ValuesTires: Low Rolling Resistance Tires, • CAFE Test Fuel Economy: 49.3 mpg
Crr: 0.007 • Federal and California Tier 2 Bin 2Test Weight: 3,133 pounds Emission Ratings: & SULEV
Economic, Environmental and Energy Security Performance
Real World Fuel Economy b: 40.4 mpg Lifetime Fuel Cost c: $4,472Lifetime Gasoline Savings d: 4,739 gallons Lifetime Net Savings e: $1,338Lifetime Greenhouse Gas Savings: 57 tons
A New Road: The Technology and Potential of Hybrid Vehicles l 39
REALIZING THE PROMISE
This report highlights the significant potentialhybrid vehicles offer in addressing climate
change, air quality, and oil dependence. For thispromise to be realized, government at all levelsmust provide both vision and support. Automakerswill have to step up to the plate and set theirtalented design, engineering, production, market-ing, and sales force to the task of putting thecleanest and most efficient vehicles into the handsof con-sumers. Consumers have the easy part ofthe job, purchasing passenger cars and trucks thatwill, as Ford Motors said of their upcoming EscapeHybrid SUV, “offer the same functionality andperformance” as the conventional version avail-able in the showroom today (Ford 2002).
A Vision for the FutureBy the end of the next decade, most new pas-
senger cars and trucks in the United States couldbe full hybrid electric vehicles. This fleet of newpassenger cars and trucks could get close to 60mpg, saving consumers more than $5,000 on gaso-line over the lifetime of their vehicles and cuttingtheir contribution to global warming and oildependence by nearly 60%.
Making this vision a reality means takinga new road as automakers tap into technologiesthey are developing today. The route wouldstart with the use of cost-effective conventionaltechnology over the next ten years, while hybridsenter the market in larger and larger numbers.By the middle of the next decade, hybrids cantake over the market at the point where the energyand environmental gains from improved conven-tional vehicles start to lag and before hydrogen
fuel cells are ready to take us into a gasoline-freefuture.
Government and the VisionThere are many ways to build a hybrid, as previouschapters outline, but not all the hybrids offeredby automakers will provide the benefits vital forreducing oil dependence, providing cleaner air,and slowing global warming. This means that asthe government considers how passenger vehiclesmight be transformed to limit their contributionto these problems, its vision cannot be as simpleas “putting hybrids on the road.” The vision mustcapture the urgency of dealing with these problemsand provide realistic goals and timelines. It mustalso incorporate a means for differentiating amonghybrids according to how much they contributeto the solution of these problems. Finally, the visionmust be backed by the support necessary to builda successful hybrid market within this decade.
This vision and leadership will help consumersunderstand which choices will enable them to dotheir part in addressing these problems. And gov-ernment leadership can provide automakers bothdirection for their technology development effortsand regulatory certainty.
Providing the SupportWithout the necessary financial, regulatory, andother policy support, a vision of the hybrid futureis nothing more than window-dressing. Somestate governments, such as California, have takena lead in developing measures that recognize thebenefits of hybrids. However a broader and morecomprehensive set of state, national, and local
○ ○ ○ ○ ○ ○ ○ ○ ○ ○ ○ ○ ○ ○ ○ ○ ○ ○ ○ ○ ○ ○ ○ ○ ○ ○ ○ ○ ○ ○ ○ ○ ○ ○ ○ ○ ○ ○ ○ ○ ○ ○ ○ ○ ○ ○ ○ ○ ○ ○ ○ ○ ○ ○ ○ ○ ○ ○ ○ ○ ○
Chapter 4
40 l The Union of Concerned Scientists
tools is needed to support a strong market intro-duction for hybrids. Those tools will need to includeregulations, incentives, and education programs.But the first task is to develop performance metrics,since without them policies that support hybridtechnology run the risk of throwing good moneyand resources after bad technology.
Performance Metrics. The most important setsof performance metrics are those that gauge howeffectively the hybrid vehicle addresses energy secu-rity and environmental problems and the degreeto which it supports the future market successof hydrogen fuel cell vehicles.
A Pair of Energy Security and EnvironmentalMetrics. Metrics to identify a hybrid’s contributionto energy security and the environment can bebased on the vehicle’s fuel economy and emissionsperformance.
Since conventional technology can already meettoday’s strictest non-zero emission regulations, thefederal Tier 2-Bin 2 standard or California’s SULEVstandard,1 the levels set by those standards shouldbe a minimum tailpipe emissions performancerequirement for all hybrids that receive supportstarting in 2004. This will ensure that hybrids withemissions performance worse than the average newgasoline car or truck do not benefit from govern-ment incentives. If vehicles emerge that could becertified to tighter emissions standards, additionallevels of support might be appropriate.
A hybrid’s contribution to energy security,reduced global warming, and improved air qualitycan be determined directly by measuring its fueleconomy. This absolute scale could be based onimprovement over the fuel economy of today’saverage vehicle. If financial incentives were basedon fuel economy improvement, the metric would
act as a market feedback mechanism, providingconsumers with larger incentives when they buyvehicles of greater overall benefit to society.
Measuring Market Support for HydrogenFuel Cell Vehicles. Hybrids will support the futuremarket success of hydrogen fuel cell vehicles bydriving down the costs of the components theyshare, as well as by familiarizing consumers andlocal officials with electric drive technology.
The familiarization function is fulfilled princi-pally by hybrids that have some capacity to driveon electric power alone. The cost-reduction func-tion depends on both the specific electric technol-ogies used and the size of the components. Thus ametric that gauges hybrids’ contribution to futurefuel cell vehicle markets could include both mini-mum technology criteria and credit for the sizeof the electric components. The minimumtechnology criteria could be as follows:
• The vehicle incorporates sufficient technologyto qualify as a hybrid. This means it has idle-off capability, sufficient regenerative brakingcapability, and a downsized engine. It mustalso operate at greater than 60 volts, with atleast 10% peak power furnished by the electricmotor/battery system.
• The vehicle incorporates motor, controller,and battery technology similar to that used incurrent and future hydrogen fuel cell vehicledrive systems.
• Motor, controller, and battery componentscarry a significant warranty to ensure that theimage of electric drive is not compromisedby putting lemons on the road.
A vehicle that meets these minimum criteria couldreceive additional credit based on the power ofthe electric motor and battery system.
○ ○ ○ ○ ○ ○ ○ ○ ○ ○ ○ ○ ○ ○ ○ ○ ○ ○ ○ ○ ○ ○ ○ ○ ○ ○ ○ ○ ○ ○ ○ ○ ○ ○ ○ ○ ○ ○ ○ ○ ○ ○ ○ ○ ○ ○ ○ ○ ○ ○ ○ ○ ○ ○ ○ ○ ○ ○ ○ ○ ○
1 The “Bin 2” standard appears under the upcoming federal Tier 2 tailpipe emission regulations.
A New Road: The Technology and Potential of Hybrid Vehicles l 41
2 The IRS has determined that hybrid vehicles qualify for a “clean-fuel” vehicle tax deduction. This tax deduction is retroactive and will be $2,000through 2003, then $500 less each year thereafter until it is eliminated in 2007.
3 For example, as hybrids succeed in the marketplace, HOV lane access would have to phase out, otherwise HOV lanes would become clogged withhybrids, discouraging people from ride-sharing (which cuts fuel use by even more than hybrids).
Types of Government Support. Once performancemetrics have been created, they can be used toestablish comprehensive government policies tosupport hybrids. Typically, such policies takefour forms:
• Regulations• Financial and other incentives• Research, development, and demonstration
(RD&D)• Education
Regulations could take the form of higher fueleconomy standards. In the near term, that wouldencourage automakers to put conventional tech-nology that enhances fuel economy on the road.Such technologies are vital for hybrid design, asdiscussed in chapters 2 and 3. It will also encour-age automakers to plan to make hybrids a signifi-cant part of their vehicle sales mix further downthe road.
Other regulations might emulate the Californiazero emissions vehicle program, which supportstechnology advancement on clean air grounds.And hybrids might be added to federal, state,and local fleet purchase requirements.
Incentives could include tax deductions similarto the federal clean fuel deductions that currentlyapply to hybrids,2 or more effective measures suchas tax credits based on the performance metricsoutlined above. Other incentives, such as prefer-ential parking or access to high-occupancy vehicle(HOV) lanes may be proposed, but these willneed to be closely evaluated to address theirenvironmental impacts.3
Most hybrid technologies have passed the pointwhere government can play a significant role in
research, development, or demonstration: thetechnologies are already in the hands of automakers.The key now is building up sales volumes to bringdown costs and take advantage of economies ofscale. Still, government support might be of valuefor break-through battery and other energy storagetechnologies, but these will not be make-or-breaktechnologies for either hybrid or hydrogen fuelcell vehicles.
The development of codes and standards hasmostly been taken care of through past effortswith battery electric vehicles, though understand-ing and incorporating these codes and standardsat the local level will still be vital.
Finally, government has been playing a role ineducating the public about hybrids. These effortscould be ramped up to help consumers differenti-ate among hybrids and make informed purchases,as well as to highlight their availability.
Putting Technology to WorkAutomakers have the most important role in
ensuring the success of hybrids in the market-place. As the vehicle manufacturers, they can putthe best possible technology in the showrooms,providing “no compromises” vehicles that buildon existing hybrids to give consumers more choice.This means pulling fuel economy technology offthe shelf to ensure superior performance, not justadding a motor and battery system to garner ahybrid label.
Automakers are also the primary consumerinterface, which gives them the opportunity andthe responsibility to educate the public about thehybrid technology in their showrooms and theenvironmental performance these vehicles offer.
○ ○ ○ ○ ○ ○ ○ ○ ○ ○ ○ ○ ○ ○ ○ ○ ○ ○ ○ ○ ○ ○ ○ ○ ○ ○ ○ ○ ○ ○ ○ ○ ○ ○ ○ ○ ○ ○ ○ ○ ○ ○ ○ ○ ○ ○ ○ ○ ○ ○ ○ ○ ○ ○ ○ ○ ○ ○ ○ ○ ○
42 l The Union of Concerned Scientists
This requires developing a sales and maintenancestaff who are well informed and trained onhybrid technology.
A Cooler, Cleaner and More Secure FutureThe technology exists to build a future with a
significantly lower dependence on oil and a cleaner,cooler atmosphere. With sufficient political willand automaker participation, this future can arrivein time to address these significant and growingproblems.
Hybrids can play an important role in realiz-ing this future, filling the gap between immediateimprovements through conventional technologyand the long-term promise of hydrogen fuel cellsand alternative fuels. Building on a 40-mpg fleetthat relies on existing conventional technology,hybrids can help drive passenger vehicle oil con-sumption and global warming emissions fromcars and trucks below 1990 levels.
A New Road: The Technology and Potential of Hybrid Vehicles l 43
BIBLIOGRAPHY
An, F., D. Friedman, M. Ross. 2002. Near-TermFuel Economy Potential for Light-Duty Trucks. Warrendale,Penn.: Society of Automotive Engineers. 2002-01-1900. June.
Automotive News. 2002. Market Data Book.Detroit, Mich.: Automotive News. May 27.
Burke, A., E. Abeles, L. Zhou, D. Sperling, C.J.Brodrick. 2002. The Future of Hybrid-Electric ICEVehicles and Fuels Implications. Davis, Calif.:University of California, Davis. UCD-ITS-RR-02-09.August.
California Air Resources Board (CARB). 1998.Findings of the Scientific Review Panel on the Reportof Diesel Exhaust. Sacramento, Calif.: CARB. April.
Davis, S., S. Diegel. 2002. Transportation EnergyData Book. Oak Ridge, Tenn.: Oak Ridge NationalLaboratory. ORNL-6967. September.
DeCicco, J., F. An, M. Ross. 2001. Technical Optionsfor Improving the Fuel Economy of US Cars and LightTrucks by 2010~2015. Washington, D.C.: AmericanCouncil for an Energy-Efficient Economy. April.
Doniger, D. D. Friedman, R. Hwang, D. Lashof, J.Mark. 2002. Dangerous Addiction: Engine America’s OilDependence. New York, New York: Natural ResourcesDefense Council and Union of Concerned Scientists.January.
Energy Information Administration (EIA). 2001.Annual Energy Outlook 2002. Washington, D.C.Prepared by the Office of Integrated Analysis andForecasting, Energy Information Administration.DOE/EIA-0383(2002). December.
Energy Information Administration (EIA). 2000.Annual Energy Outlook 2001. Washington, D.C.Prepared by the Office of Integrated Analysis andForecasting, Energy Information Administration.DOE/EIA-0383(2001). December.
Environmental Protection Agency (EPA). 2000.Integrated Risk Information System. Cincinnati, Ohio:Office of Health and Environmental Assessment,Environmental Criteria and Assessment Office.
Environmental Protection Agency (EPA).1993. MotorVehicle-Related Toxics Study. Ann Arbor, Mich.: Officeof Mobile Sources. EPA420-D-99-002a. March.
Energy and Environmental Analysis (EEA). 1998.Briefing on Technology and Cost of Toyota Prius.Arlington, Va.: Department of Energy. April.
Fattic, G., J. Walters, F. Gunawan. 2002. Cold StartingPerformance of a 42-Volt Integrated Starter GeneratorSystem. Warrendale, Penn.: Society of AutomotiveEngineers. 2002-01-0523. March.
Ford Motor Company. 2001. “Aluminum OffersStructural Strength at Decreased Weight.” Pressrelease. On the Ford website at media.ford.com/article_display.cfm?article_id=6436.
Ford Motor Company. 2002. “Escape HEVDevelopment Work Has No Laboratory Boundaries.”Press release. January 8.
Friedman, D., J. Mark, P. Monahan, C. Nash, C.Ditlow. 2001. Drilling in Detroit: Tapping AutomakerIngenuity to Build Safe and Efficient Automobiles.Cambridge, Mass.: Union of Concerned Scientists.June.
Friedman, D., F. An. 2003. Hybrid Electric Vehicles:Possible Configurations, Fuel Economy Potential andPerformance. Cambridge, Mass.: Union of ConcernedScientists. January.
○ ○ ○ ○ ○ ○ ○ ○ ○ ○ ○ ○ ○ ○ ○ ○ ○ ○ ○ ○ ○ ○ ○ ○ ○ ○ ○ ○ ○ ○ ○ ○ ○ ○ ○ ○ ○ ○ ○ ○ ○ ○ ○ ○ ○ ○ ○ ○ ○ ○ ○ ○ ○ ○ ○ ○ ○ ○ ○ ○ ○
44 l The Union of Concerned Scientists
Graham, R. 2001. Comparing the Benefits and Impactsof Hybrid Electric Vehicle Options. Palo Alto, Calif.:Electric Power Research Institute. 1000349. July.
Inoue, T., M. Kusada, H. Kanai, S. Hino, Y. Hyodo.2000. Improvement of a Highly Efficient Hybrid Vehicleand Integrating Super Low Emissions. Warrendale, Penn.:Society of Automotive Engineers. 2000-01-2930.October.
Intergovernmental Panel on Climate Change (IPCC).2001. Climate Change 2001: Impacts, Adaptation,and Vulnerability. Summary for Policymakers. On theIPCC website at www.ipcc.ch/pub/wg2SPMfinal.pdf.
Jaura, A., W. Buschhaus, M. Tamor. 2000. SystemsApproach in Achieving Higher Fuel Economy in HybridVehicles. Warrendale, Penn.: Society of AutomotiveEngineers. 2000-01-1585. April.
J.D. Power and Associates. 2002. “Interest in HybridTechnology is High, Especially Among Women.”Press release. Agoura Hills, Calif.: J.D. Power andAssociates Reports. March 6.
Kim, C. 2002. “Update 3: Toyota <7201.T>,Nissan to Cooperate on Hybrids.” Reuters. Onthe WardsAuto.com website. September 2.
Levin, M., S. Kozarekar, J. Chottiner, E. Maucher,A. Karamavruc, R. Shankland. 2002. Hybrid Powertrainwith an Engine-Disconnecting Clutch. Warrendale,Penn.: Society of Automotive Engineers. 2002-01-0930. March.
Lipman, T., M. Delucchi, 2003, Retail and LifecycleCost Analysis of Hybrid Electric Vehicle Designs. Davis,Calif.: Institute of Transportation Studies, Davis.January.
Lowell, J. 1994. “Patriot Games.” Wired Magazine.Issue 2.11. on the Wired website at www.wired.com/wired/archive/2.11/patriot_pr.html.
Mark, J. 2002. Automaker Rankings: The Environmen-tal Performance of Car␣ Companies. Cambridge, Mass.:Union of Concerned Scientists. September.
Matsuo, I., S. Nakazawa, H. Maeda, E. Inada. 2000.Development of a High-Performance Hybrid PropulsionSystem Incorporating a CVT. Warrendale, Penn.: Societyof Automotive Engineers. 2000-01-0992. March.
McElroy, J. 2002. “Ford Develops HydraulicPowertrain for Heavy Duty Trucks.” On the Visteonwebsite at www.visteon.com/newsroom/autoline/2002/012302a.shtml.
Menjak, I., P. Gow, D. Corrigan, S. Dhar, S.Ovshinsky. 2000. Ovonic Power and Energy StorageTechnologies for the Next Generation of Vehicles. Warren-dale, Penn.: Society of Automotive Engineers. 2000-01-1590. April.
Merriam-Webster Dictionary. 2002. On the Merriam-Webster website at www.m-w.com/cgi-bin/dictionary.
National Research Council (NRC). 2002. Effectivenessand Impact of Corporate Average Fuel Economy (CAFE)Standards. Washington, D.C.: National AcademyPress.
Plotkin, S., D. Santini, A. Vyas, J. Anderson,M. Wang, J. He, D. Bharathan. 2001. Hybrid ElectricVehicle Technology Assessment: Methodology, AnalyticalIssues, and Interim Results. Argonne, Ill.: ArgonneNational Laboratory. October.
Ross. M., T. Wenzel. 2002. An Analysis of TrafficDeaths by Vehicle Type and Model. Washington, D.C.:American Council for an Energy-Efficient Economy.T021. March.
Santini, D., A. Vyas, J. Anderson. 2002. Fuel EconomyImprovement via Hybridization vs. Vehicle PerformanceLevel. Warrendale, Penn.: Society of AutomotiveEngineers. 2002-01-1901. June.
South Coast Air Quality Management District(SCAQMD). 1999. Multiple Air Toxics Exposure Studyin the South Coast Air Basin. Diamond Bar, Calif.:SCAQMD.
Severinsky, A., T. Louckes, R. Templin, N. Adamson,D. Polletta. 2002. Hyperdrive as Powertrain Successor.Warrendale, Penn.: Society of Automotive Engineers.2002-01-1909. June.
A New Road: The Technology and Potential of Hybrid Vehicles l 45
Stoffer, H. 2002. “Safe with Side Airbags? It’s NotThat Simple…” Automotive News. December 9.
UltraLight Steel Auto Body (ULSAB). 2002a.“ULSAB_AVC: Advanced Vehicle Concepts.”On the UltraLight Steel Autobody websiteat www.worldautosteel.org/body.htm.
UltraLight Steel Auto Body-Advanced Vehicle Concepts(ULSAB). 2002b. “New Steels Are Key Enablers ofTomorrow’s Safe, Affordable, Fuel Efficient Vehicles.”ULSAB-AVC Media Release 20011210. January 30.
US Department of Energy. “Technology SnapshotFeaturing the Toyota Prius.” On the DOE’s CleanCities website at www.ccities.doe.gov/pdfs/snapshot.pdf.
Visnic, B. 2002. “New Civic Not Last of HondaHybrids.” WardsAuto.com. March 15.
Wang, M. Q. 1999. GREET 1.5-Transportation Fuel-Cycle Model, Volume 1: Methodologies, Development,and Use. Argonne, Ill.: Argonne National Laboratory.ANL/ESD-39. [Updated model, GREET 1.5a on theArgonne website at www.anl.gov.]
Ward’s Auto World. 2002. “Toyota Improves PriusFuel Efficiency.” WardsAuto.com. August 6.
Ward’s Communications. 2000. Ward’s Motor VehicleFacts and Figures 2000. Southfield, Mich.: Ward’sCommunications.
Weiss, M. A., J. B. Heywood, E. M. Drake,A. Schafer, and F.F. AuYeung. 2000. On the Road in2020: A Life-Cycle Analysis of New Automobile Tech-nologies. Energy Laboratory Report #MIT EL 00-003.Cambridge Mass.: Massachusetts Institute of Tech-nology. October.
Winebrake, J., D. He, M. Wang. 2000. Fuel-CycleEmissions for Conventional and Alternative Fuel Vehicles:An Assessment of Air Toxics. Argonne, Ill.: ArgonneNational Laboratory. ANL/ESD-44. August.

46 l The Union of Concerned Scientists
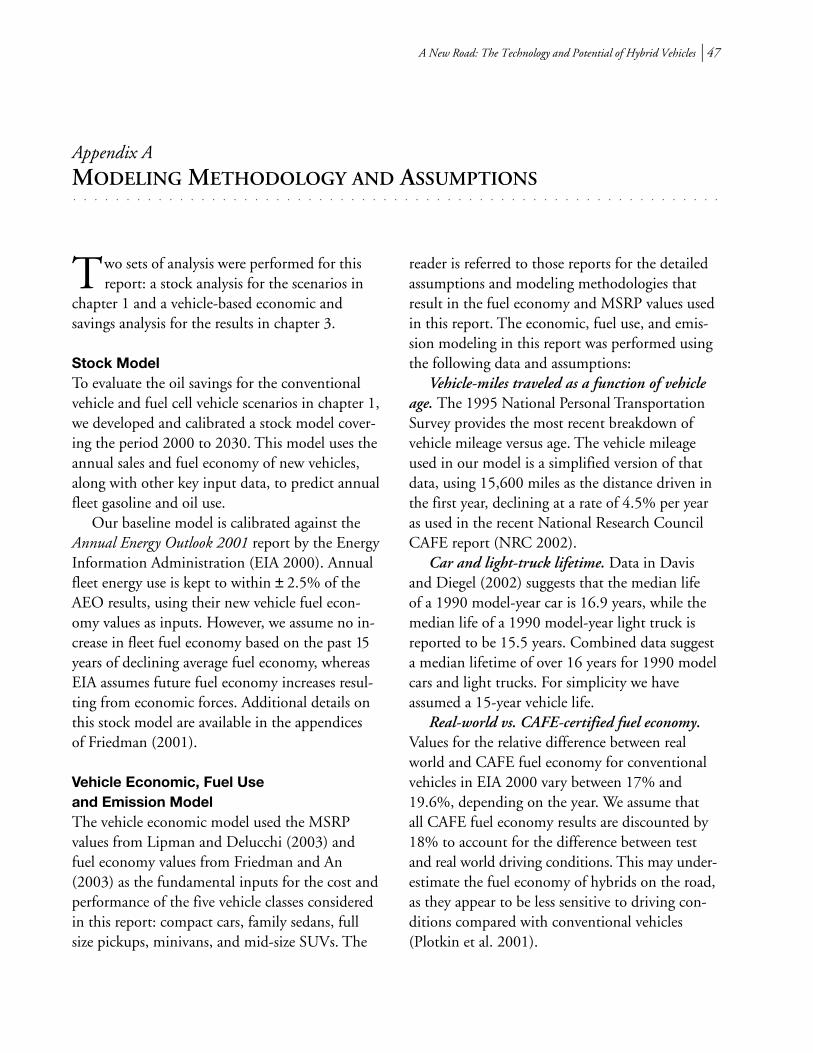
A New Road: The Technology and Potential of Hybrid Vehicles l 47
MODELING METHODOLOGY AND ASSUMPTIONS○ ○ ○ ○ ○ ○ ○ ○ ○ ○ ○ ○ ○ ○ ○ ○ ○ ○ ○ ○ ○ ○ ○ ○ ○ ○ ○ ○ ○ ○ ○ ○ ○ ○ ○ ○ ○ ○ ○ ○ ○ ○ ○ ○ ○ ○ ○ ○ ○ ○ ○ ○ ○ ○ ○ ○ ○ ○ ○ ○ ○
Two sets of analysis were performed for thisreport: a stock analysis for the scenarios in
chapter 1 and a vehicle-based economic andsavings analysis for the results in chapter 3.
Stock ModelTo evaluate the oil savings for the conventionalvehicle and fuel cell vehicle scenarios in chapter 1,we developed and calibrated a stock model cover-ing the period 2000 to 2030. This model uses theannual sales and fuel economy of new vehicles,along with other key input data, to predict annualfleet gasoline and oil use.
Our baseline model is calibrated against theAnnual Energy Outlook 2001 report by the EnergyInformation Administration (EIA 2000). Annualfleet energy use is kept to within ± 2.5% of theAEO results, using their new vehicle fuel econ-omy values as inputs. However, we assume no in-crease in fleet fuel economy based on the past 15years of declining average fuel economy, whereasEIA assumes future fuel economy increases resul-ting from economic forces. Additional details onthis stock model are available in the appendicesof Friedman (2001).
Vehicle Economic, Fuel Useand Emission ModelThe vehicle economic model used the MSRPvalues from Lipman and Delucchi (2003) andfuel economy values from Friedman and An(2003) as the fundamental inputs for the cost andperformance of the five vehicle classes consideredin this report: compact cars, family sedans, fullsize pickups, minivans, and mid-size SUVs. The
reader is referred to those reports for the detailedassumptions and modeling methodologies thatresult in the fuel economy and MSRP values usedin this report. The economic, fuel use, and emis-sion modeling in this report was performed usingthe following data and assumptions:
Vehicle-miles traveled as a function of vehicleage. The 1995 National Personal TransportationSurvey provides the most recent breakdown ofvehicle mileage versus age. The vehicle mileageused in our model is a simplified version of thatdata, using 15,600 miles as the distance driven inthe first year, declining at a rate of 4.5% per yearas used in the recent National Research CouncilCAFE report (NRC 2002).
Car and light-truck lifetime. Data in Davisand Diegel (2002) suggests that the median lifeof a 1990 model-year car is 16.9 years, while themedian life of a 1990 model-year light truck isreported to be 15.5 years. Combined data suggesta median lifetime of over 16 years for 1990 modelcars and light trucks. For simplicity we haveassumed a 15-year vehicle life.
Real-world vs. CAFE-certified fuel economy.Values for the relative difference between realworld and CAFE fuel economy for conventionalvehicles in EIA 2000 vary between 17% and19.6%, depending on the year. We assume thatall CAFE fuel economy results are discounted by18% to account for the difference between testand real world driving conditions. This may under-estimate the fuel economy of hybrids on the road,as they appear to be less sensitive to driving con-ditions compared with conventional vehicles(Plotkin et al. 2001).
Appendix A
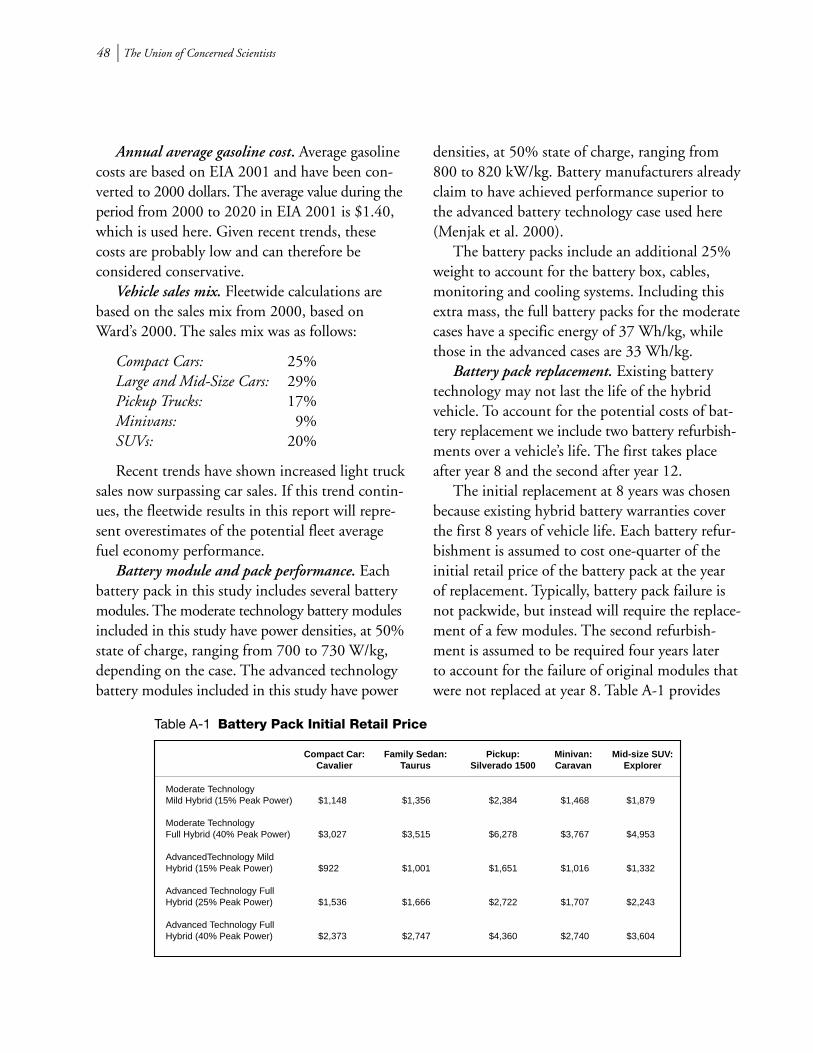
48 l The Union of Concerned Scientists
Annual average gasoline cost. Average gasolinecosts are based on EIA 2001 and have been con-verted to 2000 dollars. The average value during theperiod from 2000 to 2020 in EIA 2001 is $1.40,which is used here. Given recent trends, thesecosts are probably low and can therefore beconsidered conservative.
Vehicle sales mix. Fleetwide calculations arebased on the sales mix from 2000, based onWard’s 2000. The sales mix was as follows:
Compact Cars: 25%Large and Mid-Size Cars: 29%Pickup Trucks: 17%Minivans: 9%SUVs: 20%
Recent trends have shown increased light trucksales now surpassing car sales. If this trend contin-ues, the fleetwide results in this report will repre-sent overestimates of the potential fleet averagefuel economy performance.
Battery module and pack performance. Eachbattery pack in this study includes several batterymodules. The moderate technology battery modulesincluded in this study have power densities, at 50%state of charge, ranging from 700 to 730 W/kg,depending on the case. The advanced technologybattery modules included in this study have power
densities, at 50% state of charge, ranging from800 to 820 kW/kg. Battery manufacturers alreadyclaim to have achieved performance superior tothe advanced battery technology case used here(Menjak et al. 2000).
The battery packs include an additional 25%weight to account for the battery box, cables,monitoring and cooling systems. Including thisextra mass, the full battery packs for the moderatecases have a specific energy of 37 Wh/kg, whilethose in the advanced cases are 33 Wh/kg.
Battery pack replacement. Existing batterytechnology may not last the life of the hybridvehicle. To account for the potential costs of bat-tery replacement we include two battery refurbish-ments over a vehicle’s life. The first takes placeafter year 8 and the second after year 12.
The initial replacement at 8 years was chosenbecause existing hybrid battery warranties coverthe first 8 years of vehicle life. Each battery refur-bishment is assumed to cost one-quarter of theinitial retail price of the battery pack at the yearof replacement. Typically, battery pack failure isnot packwide, but instead will require the replace-ment of a few modules. The second refurbish-ment is assumed to be required four years laterto account for the failure of original modules thatwere not replaced at year 8. Table A-1 provides
Moderate TechnologyMild Hybrid (15% Peak Power) $1,148 $1,356 $2,384 $1,468 $1,879
Moderate TechnologyFull Hybrid (40% Peak Power) $3,027 $3,515 $6,278 $3,767 $4,953
AdvancedTechnology MildHybrid (15% Peak Power) $922 $1,001 $1,651 $1,016 $1,332
Advanced Technology FullHybrid (25% Peak Power) $1,536 $1,666 $2,722 $1,707 $2,243
Advanced Technology FullHybrid (40% Peak Power) $2,373 $2,747 $4,360 $2,740 $3,604
Table A-1 Battery Pack Initial Retail Price
Compact Car:Cavalier
Mid-size SUV:Explorer
Family Sedan:Taurus
Pickup:Silverado 1500
Minivan:Caravan
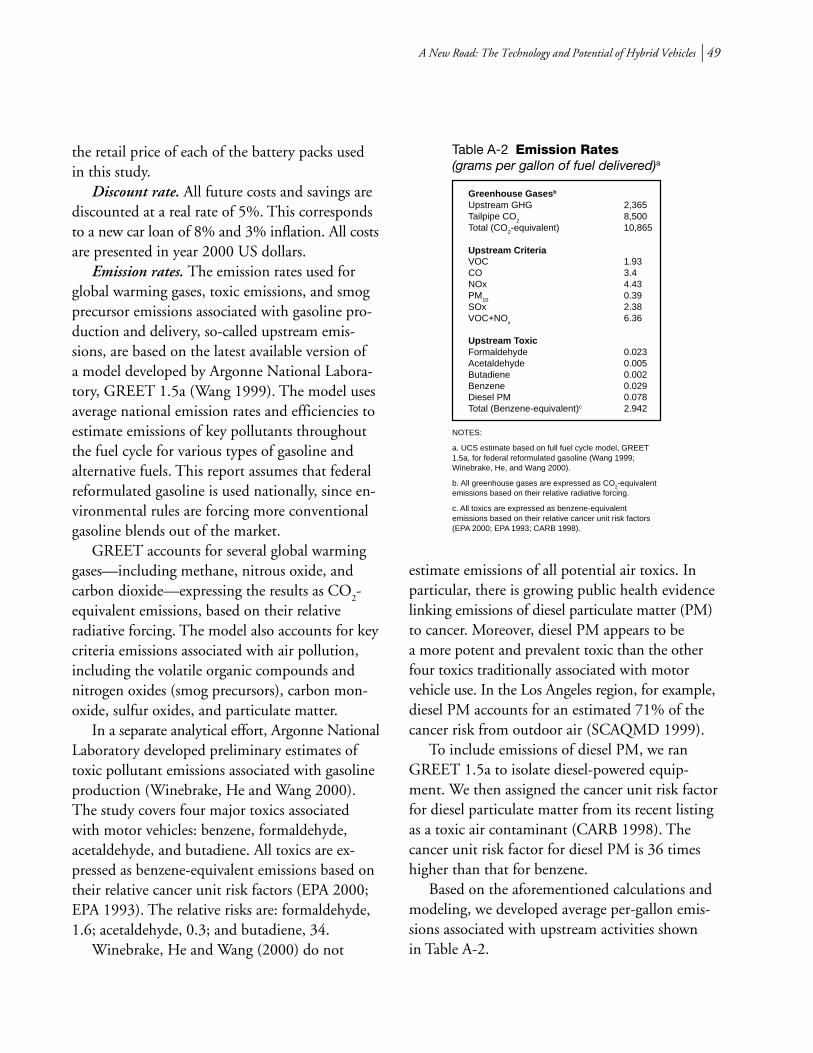
A New Road: The Technology and Potential of Hybrid Vehicles l 49
the retail price of each of the battery packs usedin this study.
Discount rate. All future costs and savings arediscounted at a real rate of 5%. This correspondsto a new car loan of 8% and 3% inflation. All costsare presented in year 2000 US dollars.
Emission rates. The emission rates used forglobal warming gases, toxic emissions, and smogprecursor emissions associated with gasoline pro-duction and delivery, so-called upstream emis-sions, are based on the latest available version ofa model developed by Argonne National Labora-tory, GREET 1.5a (Wang 1999). The model usesaverage national emission rates and efficiencies toestimate emissions of key pollutants throughoutthe fuel cycle for various types of gasoline andalternative fuels. This report assumes that federalreformulated gasoline is used nationally, since en-vironmental rules are forcing more conventionalgasoline blends out of the market.
GREET accounts for several global warminggases—including methane, nitrous oxide, andcarbon dioxide—expressing the results as CO
2-
equivalent emissions, based on their relativeradiative forcing. The model also accounts for keycriteria emissions associated with air pollution,including the volatile organic compounds andnitrogen oxides (smog precursors), carbon mon-oxide, sulfur oxides, and particulate matter.
In a separate analytical effort, Argonne NationalLaboratory developed preliminary estimates oftoxic pollutant emissions associated with gasolineproduction (Winebrake, He and Wang 2000).The study covers four major toxics associatedwith motor vehicles: benzene, formaldehyde,acetaldehyde, and butadiene. All toxics are ex-pressed as benzene-equivalent emissions based ontheir relative cancer unit risk factors (EPA 2000;EPA 1993). The relative risks are: formaldehyde,1.6; acetaldehyde, 0.3; and butadiene, 34.
Winebrake, He and Wang (2000) do not
Greenhouse Gases b
Upstream GHG 2,365Tailpipe CO
28,500
Total (CO2-equivalent) 10,865
Upstream CriteriaVOC 1.93CO 3.4NOx 4.43PM
100.39
SOx 2.38VOC+NOx 6.36
Upstream ToxicFormaldehyde 0.023Acetaldehyde 0.005Butadiene 0.002Benzene 0.029Diesel PM 0.078Total (Benzene-equivalent)c 2.942
NOTES:
a. UCS estimate based on full fuel cycle model, GREET1.5a, for federal reformulated gasoline (Wang 1999;Winebrake, He, and Wang 2000).
b. All greenhouse gases are expressed as CO2-equivalent
emissions based on their relative radiative forcing.
c. All toxics are expressed as benzene-equivalentemissions based on their relative cancer unit risk factors(EPA 2000; EPA 1993; CARB 1998).
Table A-2 Emission Rates(grams per gallon of fuel delivered)a
estimate emissions of all potential air toxics. Inparticular, there is growing public health evidencelinking emissions of diesel particulate matter (PM)to cancer. Moreover, diesel PM appears to bea more potent and prevalent toxic than the otherfour toxics traditionally associated with motorvehicle use. In the Los Angeles region, for example,diesel PM accounts for an estimated 71% of thecancer risk from outdoor air (SCAQMD 1999).
To include emissions of diesel PM, we ranGREET 1.5a to isolate diesel-powered equip-ment. We then assigned the cancer unit risk factorfor diesel particulate matter from its recent listingas a toxic air contaminant (CARB 1998). Thecancer unit risk factor for diesel PM is 36 timeshigher than that for benzene.
Based on the aforementioned calculations andmodeling, we developed average per-gallon emis-sions associated with upstream activities shownin Table A-2.

50 l The Union of Concerned Scientists
A New Road: The Technology and Potential of Hybrid Vehicles l 51
DETAILED RESULTS FOR FIVE CAR AND TRUCK CLASSES○ ○ ○ ○ ○ ○ ○ ○ ○ ○ ○ ○ ○ ○ ○ ○ ○ ○ ○ ○ ○ ○ ○ ○ ○ ○ ○ ○ ○ ○ ○ ○ ○ ○ ○ ○ ○ ○ ○ ○ ○ ○ ○ ○ ○ ○ ○ ○ ○ ○ ○ ○ ○ ○ ○ ○ ○ ○ ○ ○ ○
Chapter 3 presents the summary fleetwide results based on five car and truckclasses. The individual results for each of these classes, using each combination
of technology level, and conventional and hybrid drivetrain, are presented below.
Table B-1 Fuel Economy and Lifetime Environmental Impacts of Model Year 2000 ConventionalVehicles
CAFE Rated FuelEconomy (mpg) 30.8 26.2 19.6 22.3 19.9 23.8
Real World FuelEconomy a (mpg) 25.3 21.5 16.1 18.3 16.3 19.5
MSRPb $14,295 $19,344 $24,350 $23,264 $26,778 $20,772
Lifetime Fuel Cost c $7,151 $8,411 $11,240 $9,873 $11,107 $9,248
Lifetime GasolineUsed (gallons) 5,108 6,008 8,029 7,052 7,933 6,606
Lifetime Global WarmingGas Emissions (tonsCO2-equivalent) 61 72 96 84 95 79
Lifetime Upstream Smog-Forming Emissions (lb) 72 84 113 99 111 93
Lifetime UpstreamToxic Emissions (lb) 33 39 52 46 51 43
Compact Car:Cavailier
Family Sedan:Taurus
Pickup:Silverado 1500
Minivan:Caravan
Mid-Size SUV:Explorer
Passenger FleetAverage Vehicle
NOTES:
a. CAFE test fuel economy adjusted by 18%.
b. Manufacturer’s Suggested Retail Price, excludes tax, title and destination charges.
c. Based on an average gasoline cost of $1.40 per gallon (EIA 2001).
d. Assumes a 15-year, 170,000-mile vehicle lifetime. Average life based on scrappage rates from Davis and Diegel (2002).Vehicle mileage based on 1995 National Personal Transportation Survey (NPTS) data.
Appendix B
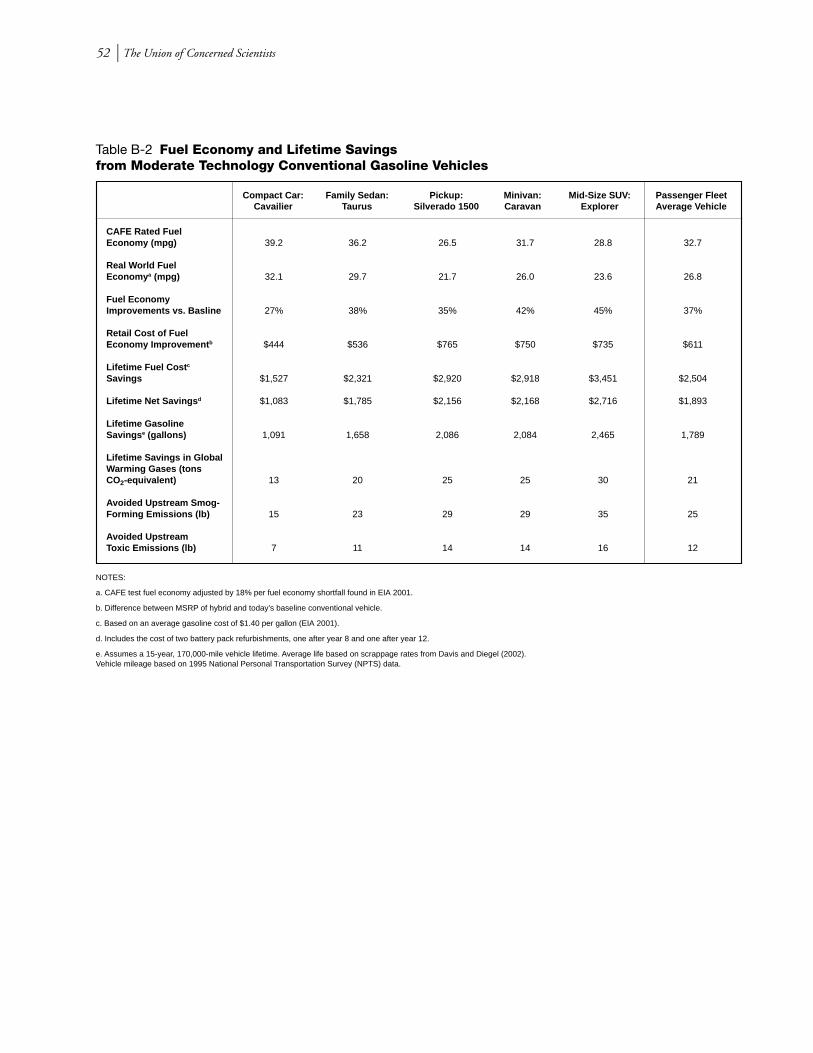
52 l The Union of Concerned Scientists
Table B-2 Fuel Economy and Lifetime Savingsfrom Moderate Technology Conventional Gasoline Vehicles
CAFE Rated FuelEconomy (mpg) 39.2 36.2 26.5 31.7 28.8 32.7
Real World FuelEconomy a (mpg) 32.1 29.7 21.7 26.0 23.6 26.8
Fuel EconomyImprovements vs. Basline 27% 38% 35% 42% 45% 37%
Retail Cost of FuelEconomy Improvement b $444 $536 $765 $750 $735 $611
Lifetime Fuel Cost c
Savings $1,527 $2,321 $2,920 $2,918 $3,451 $2,504
Lifetime Net Savings d $1,083 $1,785 $2,156 $2,168 $2,716 $1,893
Lifetime GasolineSavings e (gallons) 1,091 1,658 2,086 2,084 2,465 1,789
Lifetime Savings in GlobalWarming Gases (tonsCO2-equivalent) 13 20 25 25 30 21
Avoided Upstream Smog-Forming Emissions (lb) 15 23 29 29 35 25
Avoided UpstreamToxic Emissions (lb) 7 11 14 14 16 12
Compact Car:Cavailier
Family Sedan:Taurus
Pickup:Silverado 1500
Minivan:Caravan
Mid-Size SUV:Explorer
Passenger FleetAverage Vehicle
NOTES:
a. CAFE test fuel economy adjusted by 18% per fuel economy shortfall found in EIA 2001.
b. Difference between MSRP of hybrid and today’s baseline conventional vehicle.
c. Based on an average gasoline cost of $1.40 per gallon (EIA 2001).
d. Includes the cost of two battery pack refurbishments, one after year 8 and one after year 12.
e. Assumes a 15-year, 170,000-mile vehicle lifetime. Average life based on scrappage rates from Davis and Diegel (2002).Vehicle mileage based on 1995 National Personal Transportation Survey (NPTS) data.

A New Road: The Technology and Potential of Hybrid Vehicles l 53
Table B-3 Fuel Economy and Lifetime Savings from AdvancedTechnology Conventional Gasoline Vehicles (with Idle-stop)
CAFE Rated FuelEconomy (mpg) 48.4 45.8 33.7 41.3 34.6 40.8
Real World FuelEconomy a (mpg) 39.7 37.5 27.7 33.9 28.4 33.5
Fuel EconomyImprovements vs. Basline 57% 75% 72% 85% 74% 71%
Retail Cost of FuelEconomy Improvement b $1,125 $1,292 $2,291 $2,134 $2,458 $1,729
Lifetime Fuel Cost c
Savings $2,597 $3,593 $4,706 $4,538 $4,735 $3,847
Lifetime Net Savings d $1,472 $2,301 $2,415 $2,404 $2,277 $2,118
Lifetime GasolineSavings e (gallons) 1,855 2,567 3,361 3,241 3,382 2,748
Lifetime Savings in GlobalWarming Gases (tonsCO2-equivalent) 22 31 40 39 41 33
Avoided Upstream Smog-Forming Emissions (lb) 26 36 47 45 47 39
Avoided UpstreamToxic Emissions (lb) 12 17 22 21 22 18
Compact Car:Cavailier
Family Sedan:Taurus
Pickup:Silverado 1500
Minivan:Caravan
Mid-Size SUV:Explorer
Passenger FleetAverage Vehicle
NOTES:
a. CAFE test fuel economy adjusted by 18% per fuel economy shortfall found in EIA 2001.
b. Difference between MSRP of hybrid and today’s baseline conventional vehicle.
c. Based on an average gasoline cost of $1.40 per gallon (EIA 2001).
d. Includes the cost of two battery pack refurbishments, one after year 8 and one after year 12.
e. Assumes a 15-year, 170,000-mile vehicle lifetime. Average life based on scrappage rates from Davis and Diegel (2002).Vehicle mileage based on 1995 National Personal Transportation Survey (NPTS) data.
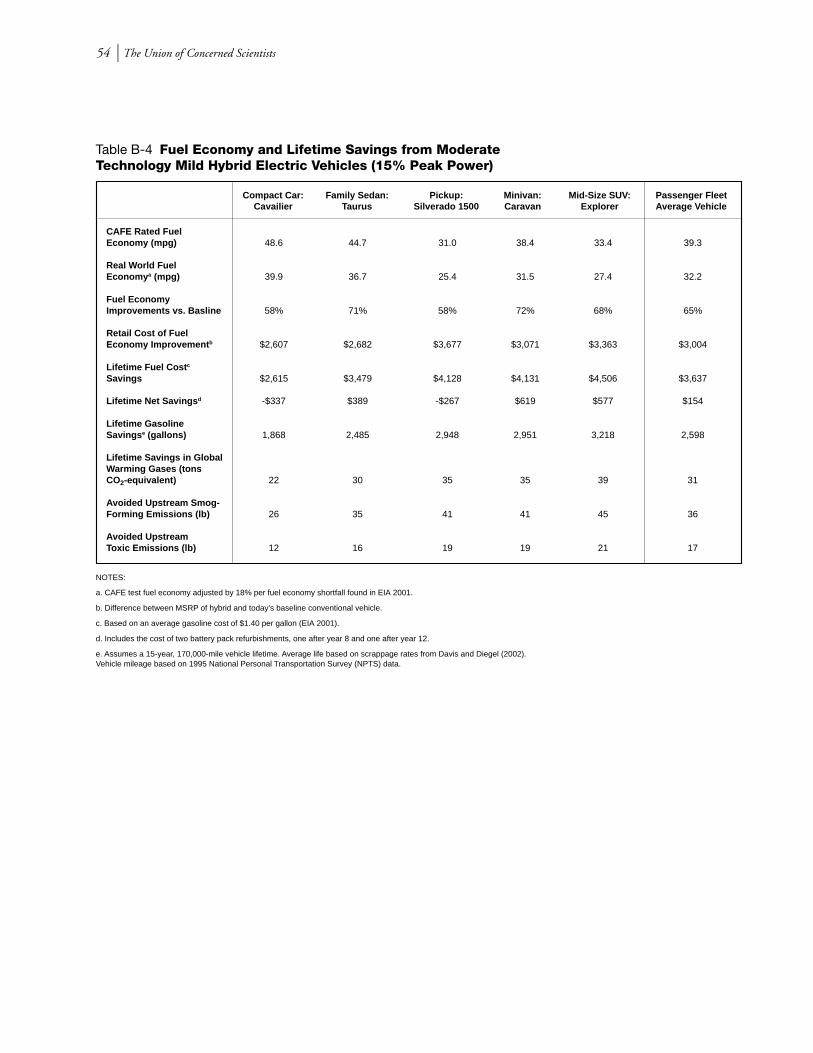
54 l The Union of Concerned Scientists
Table B-4 Fuel Economy and Lifetime Savings from ModerateTechnology Mild Hybrid Electric Vehicles (15% Peak Power)
CAFE Rated FuelEconomy (mpg) 48.6 44.7 31.0 38.4 33.4 39.3
Real World FuelEconomy a (mpg) 39.9 36.7 25.4 31.5 27.4 32.2
Fuel EconomyImprovements vs. Basline 58% 71% 58% 72% 68% 65%
Retail Cost of FuelEconomy Improvement b $2,607 $2,682 $3,677 $3,071 $3,363 $3,004
Lifetime Fuel Cost c
Savings $2,615 $3,479 $4,128 $4,131 $4,506 $3,637
Lifetime Net Savings d -$337 $389 -$267 $619 $577 $154
Lifetime GasolineSavings e (gallons) 1,868 2,485 2,948 2,951 3,218 2,598
Lifetime Savings in GlobalWarming Gases (tonsCO2-equivalent) 22 30 35 35 39 31
Avoided Upstream Smog-Forming Emissions (lb) 26 35 41 41 45 36
Avoided UpstreamToxic Emissions (lb) 12 16 19 19 21 17
Compact Car:Cavailier
Family Sedan:Taurus
Pickup:Silverado 1500
Minivan:Caravan
Mid-Size SUV:Explorer
Passenger FleetAverage Vehicle
NOTES:
a. CAFE test fuel economy adjusted by 18% per fuel economy shortfall found in EIA 2001.
b. Difference between MSRP of hybrid and today’s baseline conventional vehicle.
c. Based on an average gasoline cost of $1.40 per gallon (EIA 2001).
d. Includes the cost of two battery pack refurbishments, one after year 8 and one after year 12.
e. Assumes a 15-year, 170,000-mile vehicle lifetime. Average life based on scrappage rates from Davis and Diegel (2002).Vehicle mileage based on 1995 National Personal Transportation Survey (NPTS) data.
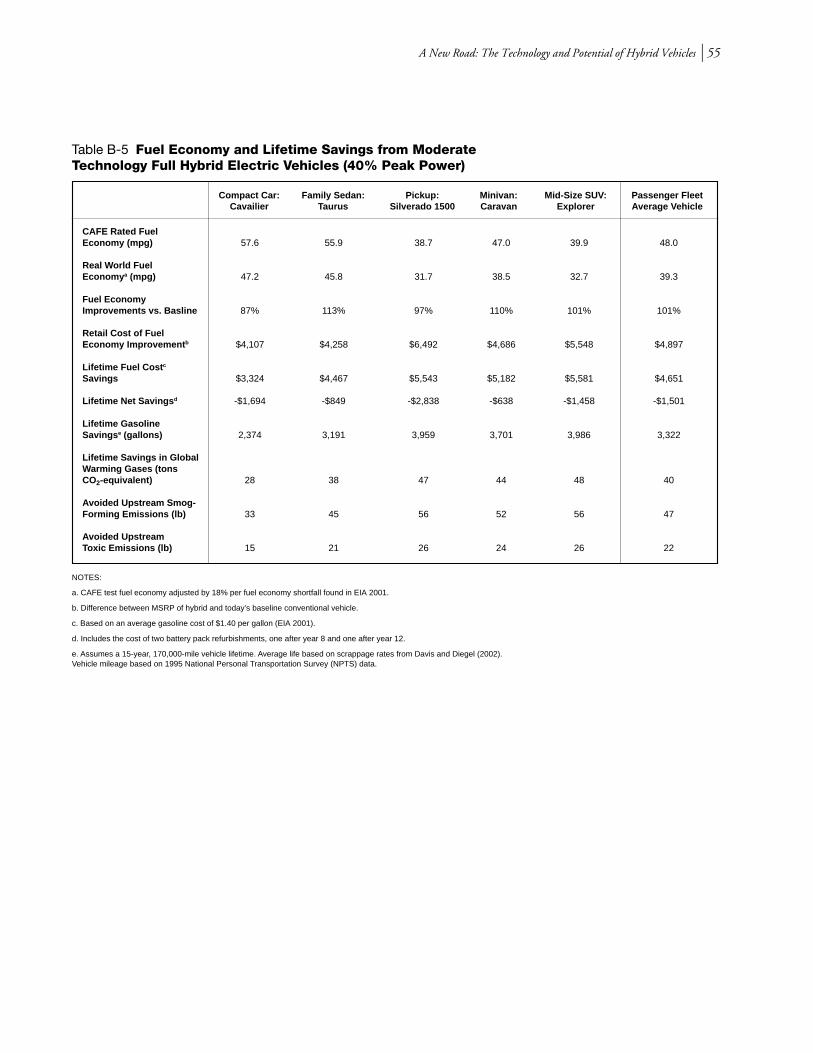
A New Road: The Technology and Potential of Hybrid Vehicles l 55
Table B-5 Fuel Economy and Lifetime Savings from ModerateTechnology Full Hybrid Electric Vehicles (40% Peak Power)
CAFE Rated FuelEconomy (mpg) 57.6 55.9 38.7 47.0 39.9 48.0
Real World FuelEconomy a (mpg) 47.2 45.8 31.7 38.5 32.7 39.3
Fuel EconomyImprovements vs. Basline 87% 113% 97% 110% 101% 101%
Retail Cost of FuelEconomy Improvement b $4,107 $4,258 $6,492 $4,686 $5,548 $4,897
Lifetime Fuel Cost c
Savings $3,324 $4,467 $5,543 $5,182 $5,581 $4,651
Lifetime Net Savings d -$1,694 -$849 -$2,838 -$638 -$1,458 -$1,501
Lifetime GasolineSavings e (gallons) 2,374 3,191 3,959 3,701 3,986 3,322
Lifetime Savings in GlobalWarming Gases (tonsCO2-equivalent) 28 38 47 44 48 40
Avoided Upstream Smog-Forming Emissions (lb) 33 45 56 52 56 47
Avoided UpstreamToxic Emissions (lb) 15 21 26 24 26 22
Compact Car:Cavailier
Family Sedan:Taurus
Pickup:Silverado 1500
Minivan:Caravan
Mid-Size SUV:Explorer
Passenger FleetAverage Vehicle
NOTES:
a. CAFE test fuel economy adjusted by 18% per fuel economy shortfall found in EIA 2001.
b. Difference between MSRP of hybrid and today’s baseline conventional vehicle.
c. Based on an average gasoline cost of $1.40 per gallon (EIA 2001).
d. Includes the cost of two battery pack refurbishments, one after year 8 and one after year 12.
e. Assumes a 15-year, 170,000-mile vehicle lifetime. Average life based on scrappage rates from Davis and Diegel (2002).Vehicle mileage based on 1995 National Personal Transportation Survey (NPTS) data.

56 l The Union of Concerned Scientists
Table B-6 Fuel Economy and Lifetime Savings from AdvancedTechnology Mild Hybrid Electric Vehicles (15% Peak Power)
CAFE Rated FuelEconomy (mpg) 58.7 54.4 40.2 49.1 42.2 49.0
Real World FuelEconomy a (mpg) 48.1 44.6 33.0 40.3 34.6 40.2
Fuel EconomyImprovements vs. Basline 90% 108% 105% 120% 113% 106%
Retail Cost of FuelEconomy Improvement b $2,469 $2,532 $3,342 $2,719 $3,467 $2,858
Lifetime Fuel Cost c
Savings $3,395 $4,359 $5,755 $5,383 $5,882 $4,752
Lifetime Net Savings d $649 $1,525 $1,917 $2,358 $2,014 $1,546
Lifetime GasolineSavings e (gallons) 2,425 3,113 4,111 3,845 4,202 3,394
Lifetime Savings in GlobalWarming Gases (tonsCO2-equivalent) 29 37 49 46 50 41
Avoided Upstream Smog-Forming Emissions (lb) 34 44 58 54 59 48
Avoided UpstreamToxic Emissions (lb) 16 20 27 25 27 22
Compact Car:Cavailier
Family Sedan:Taurus
Pickup:Silverado 1500
Minivan:Caravan
Mid-Size SUV:Explorer
Passenger FleetAverage Vehicle
NOTES:
a. CAFE test fuel economy adjusted by 18% per fuel economy shortfall found in EIA 2001.
b. Difference between MSRP of hybrid and today’s baseline conventional vehicle.
c. Based on an average gasoline cost of $1.40 per gallon (EIA 2001).
d. Includes the cost of two battery pack refurbishments, one after year 8 and one after year 12.
e. Assumes a 15-year, 170,000-mile vehicle lifetime. Average life based on scrappage rates from Davis and Diegel (2002).Vehicle mileage based on 1995 National Personal Transportation Survey (NPTS) data.

A New Road: The Technology and Potential of Hybrid Vehicles l 57
Table B-7 Fuel Economy and Lifetime Savings from AdvancedTechnology Full Hybrid Electric Vehicles (25% Peak Power)
CAFE Rated FuelEconomy (mpg) 67.3 66.3 48.8 57.6 49.3 58.2
Real World FuelEconomy a (mpg) 55.2 54.4 40.0 47.2 40.4 47.7
Fuel EconomyImprovements vs. Basline 118% 153% 149% 158% 148% 144%
Retail Cost of FuelEconomy Improvement b $3,282 $3,705 $4,729 $3,846 $4,622 $3,969
Lifetime Fuel Cost c
Savings $3,875 $5,086 $6,722 $6,045 $6,635 $5,458
Lifetime Net Savings d $131 $879 $1,174 $1,685 $1,338 $907
Lifetime GasolineSavings e (gallons) 2,768 3,633 4,801 4,318 4,739 3,898
Lifetime Savings in GlobalWarming Gases (tonsCO2-equivalent) 33 44 58 52 57 47
Avoided Upstream Smog-Forming Emissions (lb) 39 51 67 61 66 55
Avoided UpstreamToxic Emissions (lb) 18 24 31 28 31 25
Compact Car:Cavailier
Family Sedan:Taurus
Pickup:Silverado 1500
Minivan:Caravan
Mid-Size SUV:Explorer
Passenger FleetAverage Vehicle
NOTES:
a. CAFE test fuel economy adjusted by 18% per fuel economy shortfall found in EIA 2001.
b. Difference between MSRP of hybrid and today’s baseline conventional vehicle.
c. Based on an average gasoline cost of $1.40 per gallon (EIA 2001).
d. Includes the cost of two battery pack refurbishments, one after year 8 and one after year 12.
e. Assumes a 15-year, 170,000-mile vehicle lifetime. Average life based on scrappage rates from Davis and Diegel (2002).Vehicle mileage based on 1995 National Personal Transportation Survey (NPTS) data.
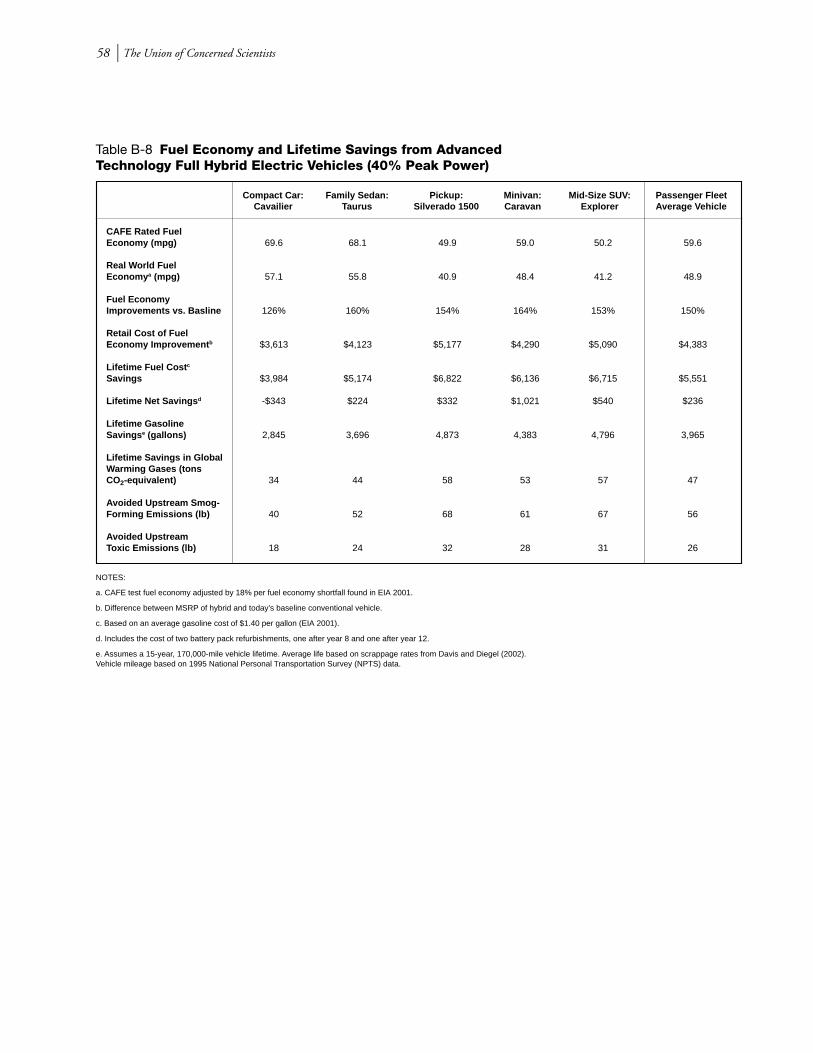
58 l The Union of Concerned Scientists
Table B-8 Fuel Economy and Lifetime Savings from AdvancedTechnology Full Hybrid Electric Vehicles (40% Peak Power)
CAFE Rated FuelEconomy (mpg) 69.6 68.1 49.9 59.0 50.2 59.6
Real World FuelEconomy a (mpg) 57.1 55.8 40.9 48.4 41.2 48.9
Fuel EconomyImprovements vs. Basline 126% 160% 154% 164% 153% 150%
Retail Cost of FuelEconomy Improvement b $3,613 $4,123 $5,177 $4,290 $5,090 $4,383
Lifetime Fuel Cost c
Savings $3,984 $5,174 $6,822 $6,136 $6,715 $5,551
Lifetime Net Savings d -$343 $224 $332 $1,021 $540 $236
Lifetime GasolineSavings e (gallons) 2,845 3,696 4,873 4,383 4,796 3,965
Lifetime Savings in GlobalWarming Gases (tonsCO2-equivalent) 34 44 58 53 57 47
Avoided Upstream Smog-Forming Emissions (lb) 40 52 68 61 67 56
Avoided UpstreamToxic Emissions (lb) 18 24 32 28 31 26
Compact Car:Cavailier
Family Sedan:Taurus
Pickup:Silverado 1500
Minivan:Caravan
Mid-Size SUV:Explorer
Passenger FleetAverage Vehicle
NOTES:
a. CAFE test fuel economy adjusted by 18% per fuel economy shortfall found in EIA 2001.
b. Difference between MSRP of hybrid and today’s baseline conventional vehicle.
c. Based on an average gasoline cost of $1.40 per gallon (EIA 2001).
d. Includes the cost of two battery pack refurbishments, one after year 8 and one after year 12.
e. Assumes a 15-year, 170,000-mile vehicle lifetime. Average life based on scrappage rates from Davis and Diegel (2002).Vehicle mileage based on 1995 National Personal Transportation Survey (NPTS) data.

A New Road: The Technology and Potential of Hybrid Vehicles l 59
60 l The Union of Concerned Scientists
The world started down a new road in 1997 with the sale of the firstmodern hybrid electric car. In the coming years, well-designed cars and trucks
that rely on hybrid technology can play a significant role in US strategiesto address climate change, air pollution, and oil dependence.
This report provides a comprehensive assessment of the technology,fuel economy, and costs associated with a fleet of hybrid passenger cars and
trucks. Integrating hybrid and advanced conventional technology, these vehiclescan more than double current fuel economy, while meeting or beating today’smost stringent non-zero tailpipe emission standards. The tools provided in this
report will help consumers and policymakers sort out the differencesamong the hybrid cars and trucks offered in the coming years.
A New Road
The Technology andPotential of Hybrid Vehicles
National HeadquartersTwo Brattle SquareCambridge, MA 02238-9105Phone: (617) 547-5552Fax: (617) 864-9405
West Coast Office2397 Shattuck Ave., Ste. 203Berkeley, CA 94704Phone: (510) 843-1872Fax: (510) 843-3785
Washington Office1707 H St. NW, Ste. 600Washington, DC 20006-3962Phone: (202) 223-6133Fax: (202) 223-6162
Website www.ucsusa.org Email [email protected]
Printed on recycled paper using soy-based inks.


![Impact van MRI informatieop de bestralingvan oligo … · 2017-03-29 · BED [Gy] EQD2 [Gy] BED [Gy] 5x 7 Gy 50 60 70 117 UMCU 5x 8.5 Gy 66 79 98 163 UMCU optie 5x 10 Gy 83 100 130](https://img.dokumen.tips/doc/110x75/5f6064b6ef80af0eb6638728/impact-van-mri-informatieop-de-bestralingvan-oligo-2017-03-29-bed-gy-eqd2-gy.jpg)