Embed Size (px)
Citation preview

The Swan Hill Region Workforce Development Strategy
The Current State – Manufacturing
Aug 2013
FINAL AUG 2013

Table of Contents
2
Table of Contents Page No.
Glossary
3
Executive Summary
4
About this Document 5
Employment Trends in Manufacturing (2006-2001) 6
Manufacturing Businesses by Region: No. and Size 7-9
Employment Trends in Manufacturing Occupations in Swan Hill (2006 – 2011) 10
Vic Govt Funded Enrolments in Manufacturing by Swan Hill Residents (2010 – 2012) 11-13
Manufacturing : SWOT Analysis 14
Risks and Suggested Strategies 15
References 16
FINAL AUG 2013

Glossary
Term Descrip+on ABS Australian Bureau of Statistics
DEEWR Department of Education, Employment and Workplace Relations
Mid Murray Employment Service Area A DEEWR area that includes the Swan Hill, Buloke and Gannawarra Local Government Areas
Working age population ABS uses 15+ and DEEWR uses 15-64
NILFET Not in the Labour Force, Employment or Training
MMLEN Murray Mallee Local Learning and Employment Network
LLEN Local Learning and Employment Network
LGA A Rural Council or Shire Region
Swan Hill LGA Swan Hill Local Government Area, used interchangeably with Swan Hill Rural City Council region
SHRCC Swan Hill Rural City Council
Swan Hill City The Swan Hill city segment of Swan Hill Rural City Council
The Steering Committee Swan Hill Region Workforce Development Strategy Steering Committee
FINAL AUG 2013 3

Executive Summary The Current State - Manufacturing
4
Industry Trends • Manufacturing is the fourth largest employing industry in the Swan Hill Rural City Council (SHRCC) region providing
employment for more than 720 people. Employment in the sector showed a small decline of 4% between 2006 and 2011. • The largest employing segments within manufacturing are ‘Meat Processing’ (e.g abattoirs) and ‘Other Food Processing’
category, which combined employ a conservative estimate of more than 200 people. Employers • The Swan Hill manufacturing sector is diverse. Employers are involved in the manufacturing of polymer products, vehicle
bodies and trailers, agricultural machinery and equipment, structural metal products, wine, and fruit and vegetable processing.
• Swan Hill is perceived to have some well run manufacturing companies that are considered ‘good employers’, and are known for their ‘can do’ attitudes, investment in equipment and training and willingness to train apprentices.
• One of the largest employers, the Abattoir is expanding and expecting to increase employment opportunities, particularly at the entry level.
• The SHRCC region has nearly 90 manufacturing businesses. Just over half have 4 or less people (ABS, 2011) Key Occupations • There are approximately 180 people working as structural steel workers, welders, metal fitters or machinists in SHRRC
region • Trades and technical roles are among the most difficult to fill and attract the fewest applicants of all roles according to the
November 2012 DEEWR survey. Employers report they don’t necessarily advertise these roles because they like job hunters to approach them.
• People with CAD and drafting skills are also hard to find. Workforce Development • In 2012, 75 secondary school students were enrolled in VETiS engineering, the highest number for the traditional trades. • Employers use a range of RTOs including local, interstate, regional and Melbourne providers.
Workforce Risks • A perception that young people have low awareness of the diversity of the local manufacturing base, roles and opportunities. • A perception that few local employers commit to training apprentices unlike other segments dominated by small business e.g.
motor mechanics.
FINAL AUG 2013c

About this document The Current State – Manufacturing is one of four industry specific snapshots that contributes to The Current State
5
The Current State – Manufacturing is one of eight documents that has been produced as part of the Swan Hill Region Workforce Development Strategy Project.
The Current State - Manufacturing contributes to the body of evidence on which the Swan Hill Region Workforce Development Strategy and Action Plan have been based. This document summarises relevant ABS data, local research and consultations with Swan Hill employers and training providers as well as the Swan Hill Region Workforce Development Strategy Steering Committee members. This Current State – Manufacturing focuses on the Fabrication, Welding and Meat Processing workforce in Swan Hill. Moving from general to more specific data it covers: • Growth segments in manufacturing • Number and size of businesses by Swan Hill regions • Enrolment in Certificate 1 - Diploma qualifications (State Government funded under the Victorian Training Guarantee) • A SWOT Analysis combining research with consultation findings • Risks and Suggested Strategies drawn from the SWOT Analysis • An Executive Summary covering key findings
The Process The Current State
The Current State
Agriculture
The Current State
Manufacturing
The Current State
Community Sector
The Current State
Aged Care The Future State Ac6on Plan
FINAL AUG 2013
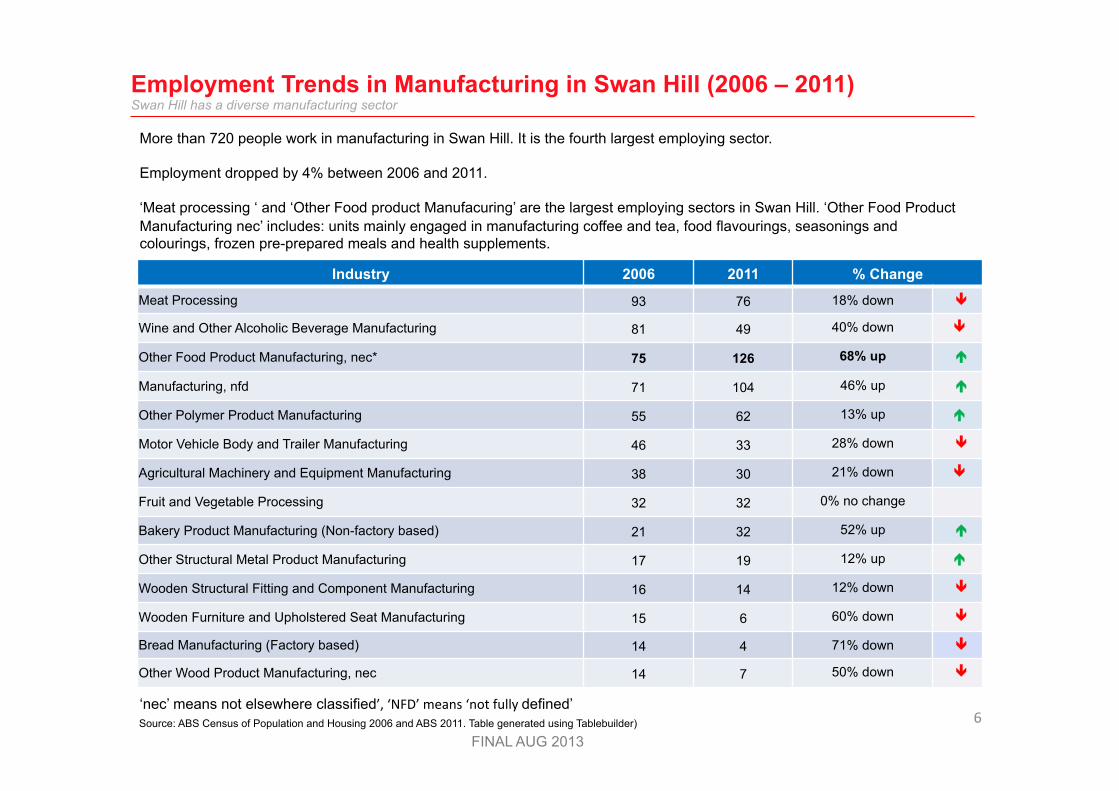
Employment Trends in Manufacturing in Swan Hill (2006 – 2011) Swan Hill has a diverse manufacturing sector
Source: ABS Census of Population and Housing 2006 and ABS 2011. Table generated using Tablebuilder)
Industry 2006 2011 % Change
Meat Processing 93 76 18% down !
Wine and Other Alcoholic Beverage Manufacturing 81 49 40% down !
Other Food Product Manufacturing, nec* 75 126 68% up "
Manufacturing, nfd 71 104 46% up "
Other Polymer Product Manufacturing 55 62 13% up "
Motor Vehicle Body and Trailer Manufacturing 46 33 28% down !
Agricultural Machinery and Equipment Manufacturing 38 30 21% down !
Fruit and Vegetable Processing 32 32 0% no change
Bakery Product Manufacturing (Non-factory based) 21 32 52% up "
Other Structural Metal Product Manufacturing 17 19 12% up "
Wooden Structural Fitting and Component Manufacturing 16 14 12% down !
Wooden Furniture and Upholstered Seat Manufacturing 15 6 60% down !
Bread Manufacturing (Factory based) 14 4 71% down !
Other Wood Product Manufacturing, nec 14 7 50% down !
More than 720 people work in manufacturing in Swan Hill. It is the fourth largest employing sector. Employment dropped by 4% between 2006 and 2011. ‘Meat processing ‘ and ‘Other Food product Manufacuring’ are the largest employing sectors in Swan Hill. ‘Other Food Product Manufacturing nec’ includes: units mainly engaged in manufacturing coffee and tea, food flavourings, seasonings and colourings, frozen pre-prepared meals and health supplements.
‘nec’ means not elsewhere classified’, ‘NFD’ means ‘not fully defined’
FINAL AUG 2013 6

Manufacturing Businesses in Swan Hill City – No. and Size The number of manufacturing grew between 2009 and 2011
Non employing 1-‐4 5-‐19 20-‐199 200+ Total 2009 13 16 19 7 0 55
2010 15 18 14 10 3 60
2011 14 18 17 10 3 62
0
10
20
30
40
50
60
70
Num
ber o
f businesses
Manufacturing -‐ Swan Hill
Between 2009 and 2011 the total number of businesses located in the Swan Hill city grew from 55 to 62. In 2011 of the 62 manufacturing businesses, half of them employed 4 people or less.
FINAL AUG 2013 7

Manufacturing Businesses in Robinvale – No. and Size Robinvale has a handful of small manufacturing businesses
Source: Australian Bureau of Sta+s+cs, Counts of Australian Businesses, including entries and exits Businesses by Industry Division by SLA 2 by employments size ranges
Non employing 1-‐4 5-‐19 20-‐199 200+ Total 2009 0 0 0 0 0 0
2010 3 3 0 0 0 6
2011 6 6 0 0 0 12
0
2
4
6
8
10
12
14
Num
ber o
f businesses
Manufacturing -‐ Robinvale
Between 2009 and 2012, Robinvale went from having no small manufacturing businesses to 12 businesses.
Half are sole operators and half employ four or less people.
FINAL AUG 2013 8

Manufacturing Businesses in Swan Hill Region (excluding Swan Hill City) – No. and Size The number of manufacturing businesses outside Swan Hill and Robinvale is dropping
Source: Australian Bureau of Sta+s+cs 2011 Census of Popula+on and Housing, Table builder to 2 digit level , Businesses by Industry Division by SLA 2 by employments size ranges
Non employing 1-‐4 5-‐19 20-‐199 200+ Total 2009 13 4 3 0 0 20
2010 9 9 0 3 0 21
2011 9 0 3 3 0 15
0
5
10
15
20
25
Num
ber o
f businesses
Manufacturing -‐ Swan Hill Region
Between 2009 and 2011, the number of manufacturing businesses reduced by 5, from 20 to 15. In 2011 three businesses employed 20 or more staff and 9, or 60%, of the businesses were non-employing.
FINAL AUG 2013 9

Employment Trends: Manufacturing/engineering related occupations in Swan Hill (2006-2011) Employment trends have varied between the occupations
Occupation 2006 2011 Change
Motor Mechanics 155 152 2% !
Electricians 70 96 37% "
Structural Steel and Welding Trades Workers 90 89 1% !
Metal Fitters and Machinists 87 81 7% !
Plumbers 59 66 12% "
Carpenters and Joiners 46 40 13 % !
Labourers nfd 39 37 5% !
Packers 50 36 28% !
Meat Boners and Slicers, and Slaughterers 29 35 21% "
Painting Trades Workers 20 31 55% "
Handypersons 37 27 27% !
Food and Drink Factory Workers 28 17 39% !
Architectural, Building and Surveying Technicians 6 20 233% ""
Source: ABS Census of population and Housing, 2006 and 2011. Table generated using Tablebuilder FINAL AUG 2013
10

Vic Govt Funded Enrolments in Food Manufacturing by Swan Hill Residents (2010 – 2012) Enrolments in Meat processing courses dropped in 2011
Source: DEECD report on Swan Hill selected industry sectors table 1
Cer6ficate III in Meat
Processing (Slaughtering)
Cer6ficate II in Meat
Processing (AbaRoirs)
Cer6ficate III in Meat
Processing (Food
Services)
Cer6ficate III in Meat
Processing (Boning Room)
Cer6ficate III in Meat
Processing (Rendering)
Cer6ficate III in Food
Processing (Retail Baking
-‐ Bread)
Cer6ficate IV in Meat
Processing (Quality
Assurance)
Cer6ficate II in Food
Processing
Cer6ficate III in Retail
Baking (Bread)
2010 21 16 13 9 3 2
2011 19 13 11 6 4 3 2 1
2012 3 10 5 2 4 2 1
0 5
10 15 20 25
Course enrolments for Food Manufacturing by learners residing in Swan Hill, by qualifica+on, Government Funded only, 2010-‐2012
This table shows the number of SHRCC residents enrolled in Food Manufacturing and the qualifications they are studying. It does not indicate where they are studying, the provider, or the mode of study. Enrolments in Meat Processing qualifications declined each year between 2010 and 2012. This can reflect a stable staffing i.e. once people are trained, if they stay the need to train more people in these areas reduces.
FINAL AUG 2013 11

Vic Govt Funded Enrolments in Metal, Machinery and Engineering related courses by Swan Hill Residents (2010 – 2012) Enrolments in Fabrication courses have increased
Source: DEECD report on Swan Hill selected industry sectors table 1
Cer6ficate III in Engineering -‐
Fabrica6on Trade
Cer6ficate IV in Compe66ve
Manufacturing
Cer6ficate III in Engineering -‐
Mechanical Trade
Cer6ficate III in Engineering -‐
Produc6on Systems
Cer6ficate IV in Engineering
Diploma of Engineering -‐
Advanced Trade
Cer6ficate II in Engineering Studies
2010 23 2 4 2 5 3
2011 34 2 8 4 3 2 7
2012 35 9 4 3 3 3 3
0 5
10 15 20 25 30 35 40
Course enrolments for Metal, Machinery and Engineering related manufacturing by learners residing in Swan Hill, by qualifica+on,
Government Funded only, 2010-‐2012
This table shows the number of Swan Hill residents enrolled in Engineering qualifications and what they are studying. It does not indicate where they are studying, the provider, or the mode of study. Between 2010 and 2012 Engineering-Fabrication enrolments increased.
FINAL AUG 2013 12

Vic Govt Funded Enrolments in Metal, Machinery and Engineering related courses by Swan Hill Residents (2010 – 2012) There are small numbers enrolled in higher level engineering VET qualifications
Source: DEECD report on Swan Hill selected industry sectors table 1
Diploma of Engineering -‐ Technical
Diploma of Process Plant Technology
Advanced Diploma of Electrical -‐ Technology
Advanced Diploma of Engineering Technology
Advanced Diploma of Engineering Technology (Principal
Technical Officer)
Cer6ficate II in Engineering
Cer6ficate II in Engineering -‐ Produc6on Technology
Diploma of Engineering Technology
2010 1 1 1
2011 1 2 1 1
2012 1 1
0
1
2
3
Course enrolments for Metal, Machinery and Engineering related manufacturing by learners residing in Swan Hill, by qualifica+on,
Government Funded only, 2010-‐2012
There have been a small number of enrolments in the higher level VET qualifications.
FINAL AUG 2013 13

Manufacturing : SWOT Analysis ABS data, local research and consultations with employers and RTOs were considered in this SWOT analysis
Strengths Weaknesses/challenges Diverse sector • 16% of region’s workforce work in manufacturing
730 Swan Hill residents working in manufacturing • There are 81 businesses, of which 63 employ people • In 2011, 89 people worked as structural steel or welding
trades workers, one less than in 2006 • Food manufacturing (including meat processing) is the
largest segment. It employs 350 people • 35 Swan Hill residents enrolled in Cert III Engineering
(Fabrication) in 2012. received Vic Govt subsidies (DEECD, 2013)
Good business examples Swan Hill is perceived as having some well run engineering businesses, whose owners : • have a ‘can do’ attitude and are ‘good employers’ and believe in investment in facilities, staff, equipment/IT • focus on improving the work environment • show a willingness to train, including apprentices, and offer
opportunities for promotion • offer competitive salaries in some cases Pockets of Growth • Abattoir is expanding and increasing output • Abattoir provides entry level roles and is open to employing
anyone from any background
Work fluctuations • Quiet periods means there is a reluctance to put on more
staff • Many sole person /small businesses don’t take on
apprentices Difficult-to-fill-roles • Can be hard to find people for entry level/unskilled roles in
the abattoir, partly because of nature of work e.g. Lifting involved
• Difficult to fill roles include slaughterman, supervisor, leading hands and inspector roles
• Lack of interest by some groups to move into higher skilled and supervisory roles
• Difficult to find specialist trades people such as CAD/drafting skills and estimators (to build work pipeline), welders, machinist (e.g. took 3-6 months to recruit one)
• Civil engineers and motor mechanics are difficult to find (DEEWR, Nov 2012)
Attraction of schools leavers • Employers have an openness to connecting with local
schools. This could strengthened be so that school leavers understand local opportunities in manufacturing
• Perception that a small group of employers employ trainees and apprentices
14 FINAL AUG 2013

Manufacturing : SWOT Analysis ABS data, local research and consultations with employers and RTOs were considered in this SWOT analysis
Opportunities Threats
Transferable skills • People from farms are seen as a good source of labour
for manufacturing, if they don’t mind working indoors • School leavers who are good with technology have
worked well in local engineering firms
• ‘Farm kids’ are seen as having transferable skills for engineering/manufacturing work .One firm provides meaningful work experience in the holidays.
Skills needed in manufacturing to support growth • Mechanical knowledge and aptitude (assembly/use of
routing tools, fitting) • Forklift driving, ‘confined space entry’ • Plastics moulding • Driving and Literacy • CAD/drafting skills
Availability of flexible training options • Employers have access to a range of training options: in
house e.g. UBT Brethren training programs; external providers, including University of Ballarat, AIM, TAFESA and SuniTAFE
Visa Changes • Changes to the 457 and 857 visa rules have reduced the
availability of unskilled workers
Operating Costs • Costs of staff • Cost of freight
Training • Organisations want to release small numbers of people
for training at a time, which requires flexibility on the part of the RTO
• Apprentices have ‘been attracted to the mines’
Employability issues • Literacy issues are common. Issue is disguised when
applicant has not prepared their own CV • The perception of alcohol/drugs issues among some
pockets of workers Willingness to take on apprentices • Small engineering businesses have been less interested
in taking on apprentices than other small business operators, such as motor mechanics
15 FINAL AUG 2013

Manufacturing - Risks to be prioritised and Suggested Strategies During the consultations participant suggested solutions to address risk and issues
Risks Relevant to other industries
Ideas and Sugges+ons from consulta+ons
Inadequate staff to support the growth of industries (abattoir) No Improve the image of manufacturing, particularly meat processing work to attract a wider pool of workers Highlight opportunities to ‘tree changers’ and encourage them to ‘knock on doors’ Need to ‘sell Swan Hill’
Inadequate literacy levels among new recruits (not just school leavers)
Yes
School students lack an understanding of the diverse opportunities available locally for those interested in manufacturing work
Yes Update and educate career teachers, the parent community and students on roles, opportunities and careers pathways Develop a programs for school students similar to the ‘Set your Heart on a Career in Accounting’ developed by Swan Hill Inc. Develop stronger link between engineering firms and the local secondary colleges
Reluctance of many small employers to take on apprentices No
Perception of drug and alcohol usage among low skilled/entry level staff impacts on the image of the workplace.
Yes A drug and alcohol policy for workplaces
16 FINAL AUG 2013

References The following documents were reviewed in this Project
1. Australian Bureau Of Statistics, Census of Population and Housing, 2006 and 2011
2. Australian Bureau of Statistics, Counts of Australian Businesses, 2009, 2010 2011
3. DEECD, Higher Education Skills Group (HESG) Data provided on Victorian Government Funded enrolments in VET courses
4. DEEWR, Labour Market Research and Analysis branch, Nov 2012, Mid Murray Employment Service Area, presentation by Sandra Taylor-Steele
5. DEEWR , Australian Jobs 2013
6. Sunraysia Institute of TAFE, 2012, Start your Career at SuniTAFE 2012
17 FINAL AUG 2013

Contact Us: Workforce Planning Australia GPO Box 381 MELBOURNE VIC 3001 (03) 9206 8000
Disclaimer
The material contained in this report has been prepared for the Swan Hill Region Workforce Development Strategy Steering Committee by Workforce Planning Australia who aims to provide high quality content and has endeavoured to ensure the information was correct and current at the time of publication. Workforce Planning Australia does not guarantee or accept any legal liability or responsibility for the accuracy, completeness, or usefulness of any information disclosed. To the extent permitted by law, Workforce Planning Australia and its employees exclude all liability for any loss or damage (including indirect, special or consequential loss or damage) arising from the use of, or reliance on, the information whether or not caused by any negligent act or omission. If any law prohibits the exclusion of such liability, Workforce Planning Australia limits its liability to the extent permitted by law, to the re-supply of the information.
18 FINAL AUG 2013