Embed Size (px)
Citation preview
The Sustainable Development Goals and their trade-offsFortunate Machingura and Steven Lally
February 2017
Case Study Report
developmentprogress.org
Overseas Development Institute203 Blackfriars RoadLondon SE1 8NJ
The Institute is limited by guaranteeRegistered in England and WalesRegistration no. 661818Charity no. 228248
Contact [email protected]: +44 (0)20 7922 0300
Sign up for our e-newsletterdevelopmentprogress.org/sign-our-newsletter
Follow us on Twittertwitter.com/dev_progress
DisclaimerThe views presented in this paper are those of the author(s) and do not necessarily represent the views of ODI.
© Overseas Development Institute 2017. Readers are encouraged to quote or reproduce material for non-commercial use. For online use, please link to the original resource on the Development Progress website. As copyright holder, ODI requests due acknowledgement and a copy of the publication.
Cover image: Farmer on flood plain in Mongu, Western Zambia, © Felix Clay.

Contents
Acknowledgements 7
Abbreviations 8
Executive summary 9
1. Background and introduction 14
2. Approach and methodology 16
2.1 Building the context of Progressia 16
2.2 Selected SDG targets and indictors 17
3. Contextualising development in Progressia 20
3.1 Overview 20
3.2 Life in Progressia in the year 2016 20
3.3 Progressia’s food security and environment in a changing global climate 21
3.4 Poverty, inequality and sustainable human development 22
3.5 Political settlements and governance institutions 23
3.6 Economic development trajectory 23
4. The trade-off: environmental sustainability or ending hunger? 26
4.1 Overview 26
4.2 Social development and environmental sustainability 26
4.3 A grand compromise: SDG trade-offs and synergies 27
4.4 Ending hunger while protecting the environment: What are the possible future scenarios? 28
4.5 Reconciling ending hunger and environmental sustainability: policy implications 33
5. The trade-off: economic growth or sustainable environments? 36
5.1 Overview 36
5.2 Economic growth and environmental sustainability 37
5.3 The grand compromise in the economic–environment nexus 37
The Sustainable Development Goals and their trade-offs 3

5.4 Future scenarios in southern Africa: combining economic growth and environmental policies in Progressia 40
5.5 Reconciling economic growth and sustainable environments: policy implications 45
6. The paradox of social and economic development goals 48
6.1 Overview 48
6.2 Income inequality and economic growth 48
6.3 The grand compromise between social and economic development 49
6.4 Future scenarios in southern Africa: combining economic growth and income equality 50
6.5 Trade-offs and paradoxes in the income-inequality nexus: the oxymoron of sustainable development, or a reality? 52
7. How can improvements in the poorest people’s lives be sustained and not reversed in an era of environmental, economic, political and social instability?
7.1 How can a win-win outcome between ending hunger and halting deforestation be sustained?
7.2 How can economic growth be reconciled with environmental sustainability? 58
7.3 How can growing inequality be tackled with the consent of global and national elites? 60
8. Conclusion 63
References 66
Appendices 72
1 Study methodology 72
2 Scenario-mapping and analysis 74
3 Development Progress case studies 75
4 Development Progress Case Study
56
56

The Sustainable Development Goals and their trade-offs 5
List of tables, figures and boxes
Tables
Table 1: Combining SDG targets 19
Table 2: Forest reduction versus agricultural productivity – what are the trade-offs? 58
Figures
Figure 1: Regional shares of the world’s extreme poor population (%) 16
Figure 2: 2x2 normative scenario matrix 18
Figure 3: 1980-2014 HDI data comparison of Progressia with selected countries 22
Figure 4: Country comparison of GDP growth (annual %) 24
Figure 5: Typical environmental Kuznets curve 38
Figure 6: Trade-offs for land use and ecosystem services 57
Figure 7: Policy trade-offs of deforestation and per capita income 59
Figure 8: Social and environmental targets 72
Figure 9: Economic and environmental targets 73
Figure 10: Social and economic targets 74
Boxes
Box 1: Tensions in scenario-building 9
Box 2: Dependency paths 27
Box 3: Scenario 1: Ending hunger and environmental development outcomes are reconcilable and can be sustained 29
Box 4: Scenario 2: Ending hunger and environmental development outcomes present conflicting outcomes 30
Box 5: Scenario 3: Ending hunger and environmental development outcomes are difficult to reconcile 31
Box 6: Scenario 4: Ending hunger and environmental development outcomes are simply irreconcilable 32
Box 7: Scenario 1: Economic and environmental development outcomes are reconcilable and can be sustained 40
Box 8: Scenario 2: Economic and environmental development outcomes present conflicting outcomes 42

6 Development Progress Case Study
Box 9: Scenario 3: Sustainable economic and environmental development outcomes are difficult to reconcile 43
Box 10: Scenario 4: Economic and environmental development outcomes are simply irreconcilable 44
Box 11: Scenario 1: High economic growth and low income inequality are reconcilable outcomes and can be sustained 50
Box 12: Scenario 2: High economic growth and reduced income inequality present conflicting outcomes 51
Box 13: Scenario 3: High economic growth and reduced income inequality are paradoxical outcomes 51
Box 14: Scenario 4: Economic growth and income inequality are an unsustainable combination 52
Box 15: What is PSIA? 61

The Sustainable Development Goals and their trade-offs 7
AcknowledgementsThe authors wish to thank all those who took the time to provide feedback and comments on this paper. In particular, we want to thank Elizabeth Stuart (ODI), Susan Nicolai (ODI), Ha-Joon Chang (University of Cambridge), Duncan Green (Oxfam GB), David Watson (ODI) and Mathilde Bouyé (World Resources Institute) for their invaluable and timely contributions. Thanks go to Nile Davies for design and layout and to Angela Hawke and Jo Fottrell for
editing. This report was funded by the Bill & Melinda Gates Foundation as part of Development Progress, a four-year research project that aims to better understand, measure and communicate what has worked in development and why. The findings and conclusions are those of the authors, and do not necessarily reflect the positions or policies of the Bill & Melinda Gates Foundation or the Overseas Development Institute (ODI).
Photo: Schoolchildren in Kabwe, Zambia. © Francesco Volpi.

Abbreviations
AfDB African Development Bank
AIDS Acquired Immune Deficiency Syndrome
ARVs Antiretroviral drugs
BAU Business as usual
BTVET Business, technical and vocational education and training
CBD Convention on Biological Diversity
CBO Community-based organisation
EEN Economic-environmental
EKC Environmental Kuznets curve
ERP Economic recovery programme
EPZ Economic processing zone
EU European Union
FAO Food and Agriculture Organization of the United Nations
FDI Foreign direct investment
GDI Gender Development Index
GII Gender Inequality Index
GDP Gross domestic product
GHG Greenhouse gas
GNI Gross national income
HDI Human Development Index
HIV Human Immunodeficiency VirusIAEG-SDGs Inter-Agency Expert Group on SDG Indicators
ICSU International Council for Science
ICT Information and communications technology
IHDI Inequality-adjusted Human Development Index
IISD International Institute for Sustainable Development
IMF International Monetary Fund
INDC UNFCCC Intended Nationally Determined Contribution
IPCC Intergovernmental Panel on Climate Change
ISSC International Social Science Council
NAPA UNFCCC Natonal Adaption Plan of Action
NGO Non-governmental organisation
NLP National Land Policy
ODI Overseas Development Institute
OECD Organisation for Economic Co-operation and Development
PEM Protein energy malnutrition
PPP Purchasing power parity
PSIA Poverty and Social Impact Analysis
PSNP Productive Safety Net Programme
R&D Research and development
REE Renewable Energy and Energy Efficiency
SADC Southern African Development Community
SDG Sustainable Development Goal
SEC Social-economic
SEE Social, economic and environmental
SEN Social-environmental
SMEs Small and medium-sized enterprises
SSA Sub-Saharan Africa
STEM Science, technology, engineering and mathematics
TEEB The Economics of Ecosystems and Biodiversity
TFP Total factor productivity
UK United Kingdom
UN United Nations
UNCED United Nations Conference on Environment and Development
UNDP United Nations Development Programme
UNFPA United Nations Population Fund
UNFCCC United Nations Framework Convention on Climate Change
UNIDO United Nations Industrial Development Organization
UNStats United Nations Statistics Division
US United States
VET Vocational education and training
WEF World Economic Forum
WRI World Resources Institute
WSSD World Summit on Sustainable Development
XGDR X-treme Green Development Revolution
8 Development Progress Case Study

The Sustainable Development Goals and their trade-offs 9
Welcome to Progressia. The year is 2030, and the people of this land-locked country in the heart of southern Africa are taking stock of national progress since the adoption of the Sustainable Development Goals (SDGs) in 2015. Are people in Progressia celebrating transformative improvements across the spheres of social development, economic growth and environmental protection? Are they wondering why some aspects of their country’s national agenda have worked so well? Or are they looking back on 15 years of lost opportunities, missed targets and wasted efforts?
This case study imagines a country in southern Africa, a region of particular importance because its total share of poor individuals doubled between 1981 (205 million) and 2010 (404 million), despite a global decline in poverty rates (Olinto and Uematsu, 2013). Its wider region, sub-Saharan Africa (SSA), accounts for more than a third of the world’s extreme poor, and constitutes the largest proportion of populations and individuals ‘left behind’ (World Bank, 2013a).1 Many of the development challenges here also apply to other developing-country contexts, of course.
Progressia cannot be found on any map, but nevertheless in its portrayal of putative SDG progress, helps to explore the trade-offs, synergies and dilemmas that confront policy-makers each day as they juggle the demands of potentially competing – and even conflicting – development goals and targets. Under a business as usual scenario, Progressia may benefit from new opportunities, but there is a clear danger that it may not. Southern Africa is on course to experience accelerated environmental change, widening income inequalities and rising youth unemployment (SDSN, 2013). But a sustainable
development scenario is technically and practically possible, if based on principles of economic progress and convergence in living standards, support of populations left behind, and successful decoupling of economic progress from environmental use and degradation. Such a scenario requires an urgent shift from the business as usual scenario, towards sustained mobilisation of actors around a shared framework of what works.
While Progressia is fictional, its characteristics are all too familiar and are rooted in hard realities, drawn from 49 case studies produced by the Overseas Development Institute’s (ODI) Development Progress project – an unprecedented pool of analysis on what really works, and what doesn’t – as well as broader development literature and theory in human development.
The case study aims to start a conversation on how improvements in the poorest people’s lives can be sustained and not reversed in an era of environmental, economic, political and social instability. It highlights the potential trade-offs between individual goals and the SDGs’ target-level indicators. By combining the two, we map out potential outcomes and, where possible, identify synergies. Although there are many combinations that could be analysed, this case study purposively selects SDG targets that help to answer the following questions:
• How can ending hunger be reconciled with environmental sustainability? (SDG targets 2.3 and 15.2)
• How can economic growth be reconciled with environmental sustainability? (SDG targets 9.2 and 9.4)
• How can income inequality be reconciled with economic growth? (SDG targets 10.1 and 8.1).
1 ‘The idea that “no goal should be met unless it is met for everyone” is well established in the rhetoric around the new goals. In theory, of course, this means ensuring that every individual achieves the full package of rights and opportunities the SDGs express’ (Melamed, 2015).
• This is a case study about the trade-offs between the Sustainable Development Goals, through the lens of an imaginary country: Progressia. This may not be a place on the map, but the facts on which it is based, and the dilemmas it faces, are real.
• The report shows the complexities around integration of individual, often competing or conflicting, SDGs or their targets, setting out possible scenarios that combine measures to
achieve the triple bottom line of economic development, environmental sustainability and social inclusion.
• It is an exercise designed to help governments, academia and development professionals to actualise individual SDGs and minimise the negative impact of trade-offs, and consider and mitigate the negative effects of distributional issues.
Key messages
Executive summary
10 Development Progress Case Study
Development theory has tried to consider the implications of such trade-offs, but has often concluded that ‘we don’t know’ or ‘further research is needed’ or ‘we don’t have the data’ (Arsham, 2006). For policy-makers, however, these are not theoretical questions: they are part of everyday reality, and the answers cannot wait for theory to catch up. A planning minister, or other civil servant tasked with delivering across the spectrum of national policy-making, needs to prioritise and deal with the implications of that prioritisation process today. The possibility that goals and their negative externalities could cancel each other out is – and will increasingly become – a major issue for SDG implementation. For that reason, this case study is aimed at the policy-makers who must navigate these trade-offs, as well as development practitioners, academia and wider civil society. It is not an exhaustive examination of every potential trade-off or complication: rather, it aims to encourage hard thinking about the pros and cons of future SDG policies and implementation.
BackgroundThe SDGs include key targets for developing an integrated approach to their implementation, such as the SDG target 17.14 on policy coherence for sustainable development. Indeed, the 2030 agenda can’t be achieved through BAU policy-making, and will require deep transformation of existing development patterns. However, the risk of inconsistencies persists with the new goals. While the SDG framework shows remarkable balance through the triple bottom line when looked at as a whole, that balance is not necessarily reflected within every SDG because they have been designed as independent goals. This creates the risk of policy loopholes, whereby policy-makers and practitioners continue to cherry-pick the elements of SDGs they want to implement, while others fall victim to political expediency, or unnecessary and poorly thought-out trade-offs, with no mitigation policies in place to ease harmful impacts.
This case study conceptualises trade-offs as the positive and negative consequences of choices. It is not an argument against trade-offs. On the contrary, trade-offs amongst SDGs will be necessary. But an understanding of the causal basis of the trade-offs, and mitigating unpreventable negative externalities they throw up, requires significant shifts in policy planning.
1. Reconciling ending hunger with environmental sustainability (SDG targets 2.3 and 15.2): The potential conflict between protecting forests and food/nutrition security is a particular concern in the light of our existing growth, production and consumption patterns; yet little is known about the nature and extent of the
repeatedly claimed incompatibility between these two goals and especially in low-income countries (see Stern et al., 1996). Policy-makers need to solve these complex equations simultaneously.
2. Reconciling economic growth with environmental sustainability (SDG targets 9.2 and 9.4): There has been a decades-long argument that sustainable economic growth is an oxymoron, because it has an inverse relationship to ecological sustainability (see Redclift, 2005). However, this challenge has not been addressed sufficiently to date. After reviewing the SDG framework, the International Council for Science (ICSU) and the International Social Science Council (ISSC) criticised it as inconsistent and unsustainable, especially if the complex and often conflicting interactions between goals are not taken seriously (ICSU and ISSC, 2015).
3. Reconciling income inequality with economic growth (SDG targets10.1 and 8.1): The increasingly widening inequalities between and within countries prompt a new analysis of their economic costs. Income inequality could impair growth if the lower income quintiles suffer poor health and low productivity as a result. It could threaten public confidence in future economic policies and could sow the seeds of a crisis. More unequal countries tend to develop larger social groups who are excluded from opportunities that the wealthier enjoy – and who therefore do not develop their full productive capacity. But, while this is known in theory, pinning down the exact relationship between economic growth and income inequality is a challenge. The potential conflict between economic growth and income inequality is not simply an outcome of the (in-)efficiency of a country’s economy (Ferreira, 1999). There still much more to be explored on the nature and impact of trade-offs between goals to achieve economic growth and reduce income inequality
The report is designed to help governments, academia, development professionals and other stakeholders work through options to actualise individual SDGs in ways that have the most catalytic effects across the goals and across the economic, social and environmental dimensions of sustainable development. Drawing from country examples of progress, the case study uses normative scenario mapping to illustrate the trade-offs and synergies involved by combining two or more selected SDG targets. This reveals the complexities around the integration of individual goals or targets, and highlights the importance of understanding, predicting and handling potentially negative externalities of these trade-offs.

The case study approachThis case study is informed by evidence from broader development literature, and ODI’s six-year Development Progress project (2010-2016), which conducted 49 case studies from more than 35 countries. Combining such hard evidence from developing-country contexts with normative future-scenario analysis has produced snapshots of progress for selected development targets, spanning different dimensions of well-being. The work provides a rich understanding of the key drivers of progress, patterns of change and, in some cases, tackles assumptions about measurement criteria to inform policy-makers on prioritisation and planning for the achievement of the SDGs. The evidence and lessons learned across the Development Progress case studies suggests the need to highlight paradoxes across goals, which, if left unchecked, may present serious implementation challenges.
Specifically, the case study:
• critically examines key drivers of progress, and how they have worked together or in opposition to advance or undermine economic, social and/or environmental development.
• examines major synergies and trade-offs that are likely in the future by mapping alternative future scenarios using foresight approaches.
• facilitates informed policy dialogues that assess policy responses critically to address the negative impacts of trade-offs, and strengthen synergies.
What needs to happenThree recommendations emerge from our case study on Progressia:
1. Plan for policy trade-offs and in particular their social, economic and environmental distributional impacts to balance out policy choices that negatively impact the poor and marginalised
Governments need to consider the implications of trading off one policy area against another, and plan accordingly. This means discussing the potential outcomes of policies with stakeholders to ensure that the likely distributional impacts are fully understood – especially for the poorest and marginalised who are most vulnerable to change – and
The Sustainable Development Goals and their trade-offs 11
Photo: A farmer in the Barotse floodplain, Zambia. © Clayton Smith.
ensuring that complementary policies are in place to compensate the immediate losers from a specific policy.
One tool for doing this kind of scenario planning is Poverty and Social Impact Analysis (PSIA), which can make explicit the complex links between poverty and policies, and thus promote a debate on trade-offs between policy choices to reconcile income inequality with – in the example of this case study – economic growth or to end hunger while sustaining the environment.
Although a comprehensive analysis of the negative effects of trade-offs between individual SDGs can be complex; and may not be definitive, PSIA provides the entry point to understanding the potential consequences of policy choices, even in countries like Progressia, where data is limited, and therefore contribute to a more informed and progressive policy debate and design. The IMF case studies have shown excellent results in countries that have adopted such an approach. For example:
• In Ghana, PSIA assessed the distributional benefits and losses of Ghana’s 2005 Energy Subsidy Reform, and demonstrated consequences of policy trade-offs. In particular, PSIA findings demonstrated how the then new reform would benefit the government to recover costs (benefits), but were a poor policy measure against poverty (costs). The latter was due to reports that only 2.3% of outlays of the cost recovery programme benefitted the poor. Thus, on the one hand, the government of Ghana had to recover costs and facilitate economic growth, by increasing prices. On the other hand, this reform had dire consequences on the economic outcomes of vulnerable populations. The findings from PSIA suggested some mitigating interventions particularly for the poor, which were considered by the government. These included free primary and secondary school education at all government-run schools; investments in rural electrification; increased funding to facilitate access to public transport and health care.
Developing countries would benefit from more systematic PSIA and, going forward, country reviews on SDG progress should report more on the potential policy trade-offs and poverty outcomes based on PSIA.
2. Factor in the cost of environmental inaction as economic and social policy choices are made
There is an urgent need for developing countries to consider inclusion of policies that price nature into their financial decisions because so many of the impacts of inaction in environmental policies are not reflected in economic plans. But, valuing the cost of inaction can be complex – partly because of uncertainties involved in placing a cost value on the negative externalities of
trade-offs between the environmental and economic policy choices; and partly because of difficulties in establishing both the baseline and the boundaries for such estimates. For example, in Progressia, as is the case in countries such as South Africa, Malawi and Zimbabwe, the cost of droughts (e.g. due to El Niño) on food security, will be incurred locally (and the impact experienced immediately). While other costs, such as the likelihood of such droughts becoming a permanent state, in these countries; and the sheer magnitude of the impacts, will fall on citizens in the medium-to-long term).
Similarly, some costs may be reflected in less obvious terms (e.g. expenditures on health care), while others will be more concrete (e.g. hunger and suffering). These impacts, which can be exacerbated by inaction are complicated by the fact that they potentially lead to irreversible damage. Despite the measurement difficulties, this paper shows that the costs of policy inaction in some environmental areas can be considerable, with implications for hunger eradication – representing a significant ‘drag’ on developing economies. Research should be intensified to reduce some of the uncertainties involved in defining and measuring the marginal social and economic costs of environmental inaction, so that comparisons against costs of action can be robust.
3. Enact holistic and integrated policies which cut across sectoral boundaries and exploit synergies
To meet the challenge of achieving SDGs, governments in developing countries, and donors in their support, will need to design holistic policies that minimise impacts that adversely affect the prospects of achieving goals in other sectors, or that derail development prospects of other nations. Achieving this objective entails exploiting synergies across different policy areas that have high cross-sector dimensions. Such dimensions will include areas of agriculture, health, trade, education, environment, migration and development partnerships, to create favourable development conditions. A siloed policy approach would be, for example, one that provides Progressia’s foreign and domestic investors with opportunities for large-scale land acquisitions aimed at boosting extensive commercial agriculture at the expense of small scale farmers. The latter are often displaced from their land with little compensation, violating their human rights as in the case of Tanzania where over a third of children under five are undernourished and the county loses nearly 3% of its GDP each year to the long-term impacts of child malnutrition despite the increasing trend in large-scale land acquisitions. Conversely, a holistic policy would, for example be one which emphasises infrastructure and agricultural development, while maintaining fiscal discipline, arresting corruption and implementing and sustaining fertiliser subsidy programmes
12 Development Progress Case Study
along with massive political support such as the case of Malawi’s president Bingu wa Mutharika’s 2004-2009 integrated policy model of growth.
Development Progress case studies have shown excellent results in countries that have adopted holistic and integrated policy approaches. For example,
• Ethiopia took a holistic and integrated approach, centring government policy on the goal of poverty eradication and taking a multidimensional approach to its achievement. This encouraged different line ministries to work together more comprehensively and consistently on poverty-reduction measures leading to the integration of social sectors into broader economic planning, and tremendous successes in the reduction of poverty from 63% in 1995 to 37% in 2011. There were also gains in education, health and employment.
• Costa Rica’s government in the driving seat and with strong partnerships among donors, the private sector, and civil society, the country established a holistic policy for Conservation Areas. This entailed effective legislation, including a ban on future land-use change on all forested land along with innovative incentive structures which provided direct financial incentives to landowners to conserve forests instead of converting them to agricultural land. This policy approach improved not only the country’s total forest cover, but also household nutrition security.
This paper sees a holistic policy approach as one that facilitates and enables the integration of multiple dimensions of social, economic and environmental development at all stages of decision-making, within and between countries. The approach will exploit the potential of positive synergies across policies to support development, pursuing win-win situations and mutual benefits while simultaneously increasing governments’ capacities to deal with possible divergent policy objectives. This approach helps to place the local contexts in the global picture and aids decision-makers to reconcile sub-national with national policy objectives, while avoiding or minimising the negative side-effects and impacts of policy trade-offs – towards a pathway of inclusive, sustainable growth.
A word of caution: the topics outlined in this report are broad and our work is not exhaustive. This report represents a systematic way of pulling together well-informed hunches on the kind of trade-offs required (and that need further investigation), rather than a fully tried and tested set of conclusions. One thing, however, is clear: the ability to make a wise choice regarding trade-off is one of the most important yet challenging skills for policy-makers.
The Sustainable Development Goals and their trade-offs 13
The 2030 agenda of the Sustainable Development Goals (SDGs) is an ambitious global vision of transformation, which demands problem-solving on an unprecedented scale to ensure the welfare of humans and the planet on which we live. As complex social, economic and environmental challenges cut horizontally across sectors and vertically across levels of government, it is time to get serious about integrated approaches that deal with the linkages between different goals and policy fields, and their related trade-offs (Casado-Asensio and Steurer, 2014). These linkages are well articulated in the Preamble of the 2030 Agenda, which signals a deliberate effort to integrate thinking, are further highlighted in the accompanying Declaration, and clearly seen in the overlaps between goals.
The linkages can also be seen in the 49 case studies carried out in more than 35 countries through ODI’s Development Progress project. Two significant findings that relate to trade-offs emerge from these case studies, which have explored the factors in major development successes at national level. Both of these findings have implications for SDG implementation.
First, countries have not been able to reconcile significant trade-offs in the implementation of development goals. For example, the linkages between the goals of human development (we’ve focused on ending hunger in this paper), economic growth and equality show catalytic effects on each other when policies to support these goals are implemented simultaneously, and the trade-offs across these different dimensions of progress should be interrogated further. One Development Progress report (Steer et al., 2011) which summarises evidence of progress in 24 developing countries – as do 48 other Development Progress case studies (see Appendix 10.3) – provides evidence demonstrating the key drivers of progress in various development aspects, and also the need to cross-examine potential conflict between individual goals. We argue that while greater well-being will require more economic diversification as well as more and better public services, it will also mean addressing the negative impacts of economic progress, such as environmental degradation and climate change to sustain win-win outcomes and avoid the risk of reversing improvements on the poorest people’s lives.
Second, very little is known about countries that have successfully navigated the different dimensions of trade-offs. Although some Development Progress case studies illustrate the trade-offs between the goals, for instance on inclusiveness and equity (see Rabinowitz and Prizzon, 2015), others identify the causal paths of single elements of success – such as slum upgrading in Ahmedabad, India
(Bhatkal et al., 2011) – and have not examined the possible trade-offs that were necessary to achieve this.
Lessons from other cities suggest that if slum-dwellers are to be assimilated into urban life without being further ostracised, city planners cannot just bulldoze slums and pile up the inhabitants in apartment blocks. Sustainable solutions involve building various types of housing in the current slum areas so that those who benefit from such housing programmes become more integrated with the rest of their city. The impact can be maximised if they can continue to work in their original jobs, close to home, rather than being moved to a new home in a new area far from their original location (Bento et al., 2006). This is where we see a prime example of a trade-off: slum dwellers may be displaced by slum-upgrading efforts as new infrastructure is built to accommodate them, and this can break their social ties, disrupt their livelihoods and cause destitution and desperation. With women and children bearing the brunt of such disruption, it reverses gains in areas critical to sustainable human development, including maternal and child mortality, gender equity and women’s economic empowerment. This is just one example, but there are many others, including what to focus on given resource constraints and competing priorities.
This fictional case study aims to address the evidence gap around such trade-offs by considering the countries that have had success in some individual areas of development, and drawing these together to build a fictional national ‘picture’, framed as a series of possible scenarios. It touches on three hard questions that have not been tackled to date through sectoral approaches:
• How can ending hunger be reconciled with environmental sustainability? (SDG targets 2.3 and 15.2)
• How can economic growth be reconciled with environmental sustainability? (SDG targets 9.2 and 9.4)
• How can income inequality be reconciled with economic growth? (SDG targets 10.1 and 8.1).
Development theory has tried to consider such questions and the implications of trade-offs, but has often concluded that ‘we don’t know’ or ‘further research is needed’ or ‘we don’t have the data’. For policy-makers, however, these are not theoretical questions: they are part of everyday reality. The possibility that goals and their strong trade-offs could cancel each other out is – and will increasingly become – a major issue for SDG implementation. This paper and its fictional case study attempt to give policy-makers some tools in their efforts for their own country.
14 Development Progress Case Study
1. Background and introduction

The Sustainable Development Goals and their trade-offs 15
Report outlineThe remainder of this report is organised around seven chapters as follows:
Chapter Two provides the methodological framework used to select SDG targets. It also presents an analytical framework used to build and analyse possible 2030 future scenarios in the fictional country Progressia and explores possible adverse consequences of trade-offs between specific SDG targets.
Chapter Three sets the scene of Progressia, by analysing the broad political economy that characterises most countries in southern Africa. It combines evidence from real countries in southern Africa to contextualise this political economy within the SDG framework, providing a deeper base for country-level analysis.
Chapter Four commences the presentation and analysis of possible future scenarios focusing on ending hunger while sustaining the environment. It presents four possible scenario outcomes (Good and Good; Good and Bad; Bad and Good; and Bad and Bad) that may result from combining two SDG targets, one on ending hunger (target 2.3) and another on halting deforestation (target 15.2). Drawing on Development Progress case studies and other development literature, the chapter concludes by summarising the policy implications for reconciling ending hunger with environmental sustainability.
Chapter Five, like Chapter Four, presents four possible scenario outcomes that may result from combining the SDG target on sustainable industrialisation (target 9.2) with another to upgrade sustainable infrastructure and adoption of environmentally sound technologies and industrial processes (target 9.4). The chapter discusses the interlocking nature of these peculiar targets when combined, and their implications for policy. It concludes by exploring whether the targets are reconcilable, and what, if any, tensions exist between Progressia’s policies to increase the share of the manufacturing sector in total employment, while combating carbon emissions in efforts to achieve SDG 9.
Chapter Six is the final Scenarios section. Using a series of four possible scenarios, it attempts to illustrate the negative impact of trade-offs and synergies in the interaction between the social and economic SDG targets 8.1 and 10.1. Like Chapters Four and Five, it uses country examples to analyse these scenarios, and concludes by demonstrating how lessons learned from real countries could help Progressia navigate trade-offs and capitalise on synergies.
Chapter Seven revisits discussions from the four Scenario chapters (Four to Six) and makes reflections on how policy-makers can consider sustaining win-win outcomes to ensure that improvements in the poorest people’s lives can be sustained and not reversed in an era of environmental, economic, political and social instability.
Chapter Eight provides recommendations to policy-makers and analytical conclusions of the study.

2.1 Building the context of ProgressiaThis case study is set in fictional Progressia, with policy priorities and demographic profiles based on an amalgamation of existing developing countries. Such a case study can be a pathway into serious developmental, political and geographical thought – both historical and forward-looking.
Those who come from a background of hard-nosed realist epistemology have criticised fiction as a diversion from a more sober, serious understanding of the world (Jacobs and Hanrahan, 2008). This suspicion of a fictional approach can be seen most clearly, perhaps, in today’s development literature, which emphasises the need to separate fact from fiction. Those using fictional country contexts, often working in fictional entertainment-based genres, have also made a clear distinction between hard facts and entertainment. However, the creators of fictional
country contexts claim a distinctive role in civil society, asserting that they are better at capturing the emotion and the drama of real-life experiences (McHale, 2003).
Fiction emerges as an epistemological approach interwoven seamlessly to support everyday life. We would like to believe in such well-designed visions of the future as those proposed by Mazé and Jacobs (2003) in their seminal work, ‘Underdogs and Superheroes’, where they demonstrate how fictional characters and space can empower individuals and communities to examine and analyse evolving lifestyles. Specifically, they argue ‘We have found that [fiction can] help engage users’ imaginations by representing reality [through gaming] without limiting expectations to what’s possible here and now; engaging experiential and personal perspectives (the “whole” person); and opening the creative process to hands-on user participation through low/no-tech materials and
16 Development Progress Case Study
2. Approach and methodology
Figure 1: Regional shares of the world’s extreme poor population (%)
Source: Olinto and Uematsu (2013), based on World Bank estimates.
The Sustainable Development Goals and their trade-offs 17
a widely understood approach’ (ibid.: 1). Despite such evidence that fictional approaches actively engage publics, little development thought has, to date, blended such approaches with sound policy-oriented studies. This case study aims to help close the gap between the two.
First, to construct a realistic context for Progressia, we selected the savannah region of southern Africa as its location. Southern Africa is of particular relevance because its total share of the world’s poor people doubled between 1981 (205 million) and 2010 (404 million), despite a global decline in poverty rates (Olinto and Uematsu, 2013). The wider region, sub-Saharan Africa (SSA), accounts for more than one third of the world’s extreme poor (Figure 1) – the largest proportion of populations and individual people left behind by the development progress of recent decades.
We explored literature across disciplines to create a narrative about Progressia that embodies the geography, climate, politics, and social and economic characteristics of southern Africa. We reviewed Development Progress case studies, drawing out key lessons of progress. We used several indicators and attributes that typify southern Africa to provide a nuanced and realistic context. See Appendix 10.1 for a full study methodology. The description and presentation of the context of Progressia is outlined in Chapter 3.
In an attempt to constrain what could have become an unmanageably large exercise, we explored only one target under each SDG triple bottom line approach – by combining two of each of the economic development, environmental sustainability and social inclusion goals (see Table 1).
2.2 Selected SDG targets and indictorsMethodological framework: trade-offs and synergies between selected SDG targetsTable 1 is not an exhaustive framework, as it only selects some but not all targets that precisely aim at reconciling the long-term objectives of economic growth, social and environmental sustainability. We selected these because of data availability, given the limited time and resources we had to build this case study.
Framing and analysing scenariosFollowing analysis and prioritisation of key drivers of progress for each of the targets, the ‘scenario-axes of uncertainty’ technique was used as a structuring device. The technique provides a structured approach that
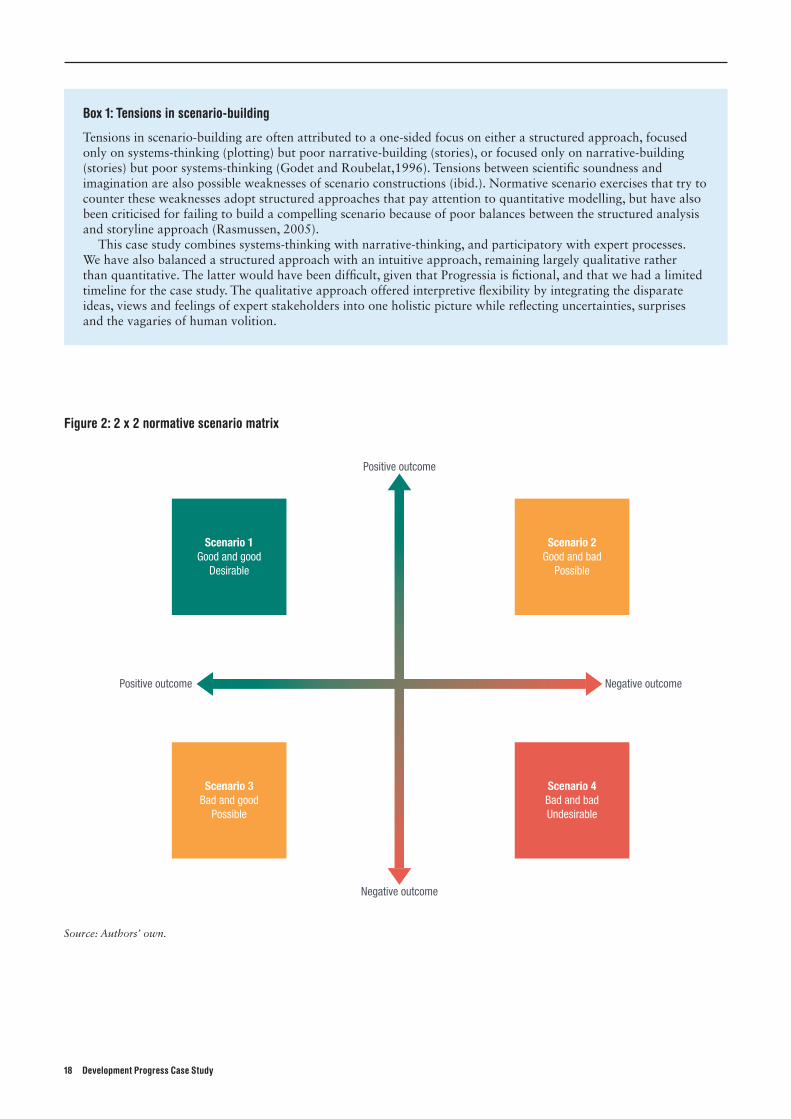
combines perspectives on economic growth and inequality, and social development and environmental sustainability. It does so while fostering alignment of diverging views, despite the conflicting data that so often confront practitioners (Van ‘t Klooster and van Asselt, 2006). The scenarios show how the future could unfold, based on how possible outcomes are (and could be) influenced by the ways in which key drivers of progress interact with each other in the scenario contexts. Two selected SDG targets then became the axes of a 2x2 scenario matrix (huge outcomes, high uncertainty), which produces four quadrants of scenario logics (see Figure 2). The x-axis forms the strand for one of the selected targets (high impact or low impact), and the y-axis forms the second combination target (high impact or low impact). The axes are framed into four different possible future scenarios.
To formulate the four scenarios we:
• assess how key drivers interact to produce outcomes in each specific scenario context
• assess the trade-offs in each scenario context and their possible negative impact
• assess positive outcomes that manifest between individual goals
• assess the social groups that might benefit and or lose out.
Of course it is not possible for a project to conduct an exhaustive assessment of every key driver, opportunity or trade-off identified, or the inherent uncertainty around the impacts of global drivers of change. However, even though the case study does not provide the likely scenarios for a real country, it does identify a range of scenarios that could be signposts for action (especially in developing contexts) and form the basis for further, more detailed analysis. Finally, we recognise the long-term nature of sustainable development itself, but we also acknowledge that the future will have twists and turns that could not have been foreseen and that may change the future radically, such as the impact of new technologies on service provision. Also, although Progressia is a fictional country, we use real-country case examples, future trends, and general characteristics of southern Africa to frame the arguments. This case study is not, therefore, a comprehensive review of key drivers of progress or of policy. It aims to begin a critical conversation on trade-offs and synergies contained in SDG implementation to highlight several pathways or alternatives that can strengthen implementation of integrative policies.
18 Development Progress Case Study
Box 1: Tensions in scenario-building
Tensions in scenario-building are often attributed to a one-sided focus on either a structured approach, focused only on systems-thinking (plotting) but poor narrative-building (stories), or focused only on narrative-building (stories) but poor systems-thinking (Godet and Roubelat,1996). Tensions between scientific soundness and imagination are also possible weaknesses of scenario constructions (ibid.). Normative scenario exercises that try to counter these weaknesses adopt structured approaches that pay attention to quantitative modelling, but have also been criticised for failing to build a compelling scenario because of poor balances between the structured analysis and storyline approach (Rasmussen, 2005).
This case study combines systems-thinking with narrative-thinking, and participatory with expert processes. We have also balanced a structured approach with an intuitive approach, remaining largely qualitative rather than quantitative. The latter would have been difficult, given that Progressia is fictional, and that we had a limited timeline for the case study. The qualitative approach offered interpretive flexibility by integrating the disparate ideas, views and feelings of expert stakeholders into one holistic picture while reflecting uncertainties, surprises and the vagaries of human volition.
Figure 2: 2 x 2 normative scenario matrix
Positive outcome
Negative outcome
Positive outcome Negative outcome
Scenario 1Good and good
Desirable
Scenario 4Bad and badUndesirable
Scenario 2Good and bad
Possible
Scenario 3Bad and good
Possible
Source: Authors’ own.

The Sustainable Development Goals and their trade-offs 19
Soci
al a
nd e
nviro
nmen
tal d
evel
opm
ent (
SEN)
Econ
omic
and
env
ironm
enta
l dev
elop
men
t (EE
N)So
cial
and
eco
nom
ic d
evel
opm
ent (
SEC)
Inte
grat
ion
ques
tion
Pote
ntia
lly c
ontra
dict
ory
outc
omes
: wha
t are
the
trade
-offs
and
syn
ergi
es?
Pote
ntia
lly c
ontra
dict
ory
outc
omes
: wha
t are
the
trade
-offs
and
syn
ergi
es?
Pote
ntia
lly c
ontra
dict
ory
outc
omes
: wha
t are
the
trade
-offs
and
syn
ergi
es?
Rese
arch
que
stio
nHo
w c
an p
over
ty re
duct
ion,
par
ticul
arly
endi
ng
hung
er, b
e re
conc
iled
with
env
ironm
enta
l su
stai
nabi
lity?
How
can
eco
nom
ic g
row
th b
e re
conc
iled
with
en
viro
nmen
tal s
usta
inab
ility?
How
can
inco
me
ineq
ualit
y be
reco
ncile
d w
ith
econ
omic
gro
wth
?
Met
hodo
logy
que
stio
n: 1
Whi
ch c
ount
ries
are
succ
essf
ully
redu
cing
food
in
secu
rity?
How
? SD
G ta
rget
2.3
: By
203
0, d
oubl
e th
e ag
ricul
tura
l pro
duct
ivity
and
in
com
es o
f sm
all-s
cale
food
pro
duce
rs,
Whi
ch c
ount
ries
are
succ
essf
ully
pro
mot
ing
econ
omic
gro
wth
? Ho
w?
SDG
targ
et 9
.2: P
rom
ote
incl
usive
and
sus
tain
able
in
dust
rialis
atio
n an
d, b
y 20
30, s
igni
fican
tly ra
ise
indu
stry
’s s
hare
of e
mpl
oym
ent a
nd g
ross
dom
estic
pr
oduc
t, in
line
with
nat
iona
l circ
umst
ance
s, a
nd
doub
le it
s sh
are
in le
ast-
deve
lope
d co
untri
es.
Whi
ch c
ount
ries
are
succ
essf
ully
tack
ling
ineq
ualit
y? H
ow?
SDG
targ
et 1
0.1:
By
2030
, pro
gres
sive
ly ac
hiev
e an
d su
stai
n in
com
e gr
owth
of t
he b
otto
m 4
0% o
f the
po
pula
tion
at a
rate
hig
her t
han
the
natio
nal a
vera
ge.
Met
hodo
logy
que
stio
n: 2
Whi
ch c
ount
ries
are
succ
essf
ully
redu
cing
de
fore
stat
ion?
How
? SD
G ta
rget
15.
2:By
202
0, p
rom
ote
the
impl
emen
tatio
n of
sus
tain
able
m
anag
emen
t of a
ll ty
pes
of fo
rest
s, h
alt d
efor
esta
tion,
re
stor
e de
grad
ed fo
rest
s an
d su
bsta
ntia
lly in
crea
se
affo
rest
atio
n an
d re
fore
stat
ion.
Whi
ch a
re th
e co
untri
es s
ucce
ssfu
lly re
duci
ng
carb
on e
mis
sion
s? H
ow?
SDG
targ
et 9
.4: B
y 20
30, u
pgra
de in
frast
ruct
ure
and
retro
fit in
dust
ries
to m
ake
them
sus
tain
able
, w
ith in
crea
sed
reso
urce
-use
effi
cien
cy a
nd g
reat
er
adop
tion
of c
lean
and
env
ironm
enta
lly s
ound
te
chno
logi
es a
nd in
dust
rial p
roce
sses
, with
all
coun
tries
taki
ng a
ctio
n in
acc
orda
nce
with
thei
r re
spec
tive
capa
bilit
ies.
Whi
ch c
ount
ries
are
succ
essf
ully
del
iver
ing
econ
omic
gro
wth
? Ho
w?
SDG
targ
et 8
.1: S
usta
in p
er c
apita
eco
nom
ic g
row
th
in a
ccor
danc
e w
ith n
atio
nal c
ircum
stan
ces
and,
in
parti
cula
r, at
leas
t 7%
gro
ss d
omes
tic p
rodu
ct g
row
th
per a
nnum
in th
e le
ast-
deve
lope
d co
untri
es.
Anal
ysis
que
stio
nIf
Prog
ress
ia w
as d
oing
bot
h at
the
sam
e tim
e, w
hat
wou
ld th
is lo
ok li
ke?
If Pr
ogre
ssia
was
doi
ng b
oth
at th
e sa
me
time,
wha
t w
ould
this
look
like
?If
Prog
ress
ia w
as d
oing
bot
h at
the
sam
e tim
e, w
hat
wou
ld th
is lo
ok li
ke?
Disc
ussi
on q
uest
ions
on
key
driv
ers
of c
hang
eHo
w c
an im
prov
emen
ts in
the
poor
est p
eopl
e’s
lives
be
sus
tain
ed a
nd n
ot re
vers
ed in
an
era
of g
row
ing
ineq
ualit
y, en
viron
men
tal,
econ
omic
, pol
itica
l and
so
cial
inst
abilit
y?
Tabl
e 1:
Com
bini
ng S
DG ta
rget
s

3.1 OverviewThis chapter has two tasks. First, it sets the scene of Progressia by analysing the broad political economy that characterises most countries in southern Africa. It expands this analysis to encompass the contexts of human development, economic landscape and environmental issues as seen and learned from policies implemented in the sub-region. Second, it combines evidence from real countries in southern Africa to contextualise this political economy within the SDG framework, providing a deeper base for country-level analysis. We consider the interaction of political and economic processes that distribute and sustain power and wealth between institutions, groups and individuals.
The chapter begins by painting a broader picture of what Progressia looks like. Section 3.3 highlights environmental sustainability, delving into the country’s geography, climate and its food/nutrition security situation. The poverty and inequality indicators of development
are explored in Section 3.4, highlighting the struggle for sustainable human development. Section 3.5 explores the country’s protracted political struggles, tracing the landscape of democracy and kleptocracy. Finally, Section 3.6 sets out the economic development trajectory of Progressia.
3.2 Life in Progressia in the year 2016Progressia, located in southern Africa, is a tale of two countries forged into one. On the one hand, Progressia enjoys great wealth and has, over the years, increased its chances of accessing open markets, growing incomes and creating a more sustainable and secure world for its wealthier citizens. They tend to have access to the best health facilities and the best education, and enjoy a power that sits uneasily alongside the powerlessness of the majority of their fellow citizens, most of whom are far poorer and increasingly discontent.
20 Development Progress Case Study
3. Contextualising development in Progressia
Photo: Weeding in a field of maize in Mongu, Western Zambia. © Felix Clay.
The Sustainable Development Goals and their trade-offs 21
2 Kwashiorkor, marasmus and stunting are serious forms of protein energy malnutrition. See http://www.fao.org/docrep/W0073e/w0073e05.htm
They enjoy luxury holidays in places like Dubai, as well as luxurious weekend mini-breaks, where they mix with those from similar social groups from neighbouring countries. They are willing to travel as far as the United Kingdom (UK), Sweden, and to one of the rising Asian giants for routine medical checks. For those living with HIV, such trips may give them better access to branded antiretrovirals (ARVs), so that they don’t have to rely on local generic ARVs. Although the gap in HIV prevalence between the rich and poor is not so significant in Progressia, the rich are less likely to die early as a result of HIV/AIDS, and most of the rich who are living with HIV can expect to reach old age, with a life expectancy of 70 to 100 years.
On the other hand, we see a very different population also living in Progressia, where most people do not live beyond 40 years of age, and where over 30% of children under the age of five experience the worst forms of protein energy malnutrition (PEM) including kwashiorkor,2 marasmus and stunting. This Progressia exists almost as a parallel world, where citizens from different social groups share the same space but experience life very differently.
Here is a country where millions have died as a result of HIV/AIDS, where poverty forces girls into marriage before puberty, and where women are drawn into sex work as a way to earn an income. It is a country where cholera and typhoid often take one or more members of a family and assure its bankruptcy and poverty. The costs of health care, and of secondary and tertiary education, remain prohibitive for millions, and household nutrition insecurity is as prevalent as tuberculosis and under/unemployment.
These two very different countries meet on the street, at the bank and in the markets. They may enjoy the same tropical weather and the same type of music, and they may both complain occasionally about air pollution and litter. Their children may have similar life goals, with children from rich families and poor wanting to become, for example, pilots, doctors or teachers. But their close proximity does little, if anything, to bridge the massive gaps in life experiences that so often shape their life outcomes.
It is not merely that these two countries can be seen so clearly in the woeful evidence of an economic divide. It is also that this gap is getting deeper and wider. These inequalities have been well documented, and the SDGs seek to tackle inequality and poverty in ways that ensure the environmental, economic and social sustainability of the poorest communities in Progressia.
The country is incorporating the SDG agenda into its national-level strategic plans, and will, inevitably, have to confront trade-offs if it is to implement policies successfully. But there are synergistic policies that can produce catalytic outcomes to better the lives of the
poorest and most vulnerable citizens. When combined, the trade-offs and synergies emerging from policies that support the achievements of SDGs make it possible to build alternative futures for Progressia.
These alternative futures depend not only on how policy-makers operationalise their in-country SDG plans to meet the set targets, but also on the political, environmental, social, economic and gender drivers of change. In what follows, we map the various contextual background elements in Progressia for each of these dimensions.
3.3 Progressia’s food security and environment in a changing global climate
Like Botswana, Malawi and Zambia, Progressia is characterised by a semi-arid climate and fragile ecosystems, both of which make it highly vulnerable to climate change and adds to its socio-economic and environmental stresses. Droughts continue to compound existing vulnerabilities in agriculture, food security, water, woodland forests, health and economic growth. Over 70% of the country’s cultivated land is occupied by traditional farming systems. In the past three decades, however, climate change has severely undermined agricultural production and the increased frequency and intensity of droughts and floods has only aggravated the country’s food security problems. With over 65% of the country’s population dependent on agriculture for employment, income and food poverty are expected to rise, jeopardising many years of hard-won gains in development.
Such problems extend beyond food insecurity to increased levels of severe acute malnutrition. An estimated 40% of children are stunted and, therefore, unable to reach their full mental and physical potential. Coupled with difficulties in accessing potable water – with children spending hours each day to walk to the nearest source – Progressia has experienced increased rates of school drop-outs, higher incidences of reported communicable diseases, and accelerating rural to urban migration.
As Progressia remains one of the countries hit hardest by HIV/AIDS (with one in every seven adults living with tuberculosis and/or HIV/AIDS), food insecurity continues to hamper its HIV response. People living with tuberculosis and/or HIV/AIDS cannot take treatment on empty stomachs, and many prioritise their meagre financial resources to buy food, rather than pay for travel to the health facility. It is clear, therefore, that the country’s environmental context, which has had a direct impact on agricultural production in the past three decades, has also undermined the country’s 10-year ARV therapy programme as patients have dropped out of treatment.

3.4 Poverty, inequality and sustainable human development
Progressia has made visible progress in social development outcomes, with the country’s Human Development Index (HDI) value having increased by around 1.5% a year between 1980 and 2014. During this time period, life expectancy at birth increased by 20 years; the average years of education increased by three; and gross national income (GNI) per capita rose by about 7%.
Despite this progress, however, Progressia’s HDI value for 2014 positioned the country in the bottom-15 category of human development worldwide, well below the averages for sub-Saharan Africa (UNDP, 2016). The progress in social development outcomes had masked serious
inequalities in the distribution of human development across the population. For example, when inequalities in Progressia are accounted for in all three of the main HDI dimensions using the UN inequality-adjusted HDI (IHDI), the 2014 HDI falls from 0.445 to 0.299, a loss of 33% in the distribution of the HDI’s three indicators.3 The country’s loss in human development as a result of inequality is similar to the observed average loss for SSA, at 33% (ibid.).
Despite the availability of HDI data over decades in Progressia, very little is known about how to assess human development outcomes and progress at a finer level of detail. This is particularly important, as Progressia has adopted the 2030 agenda for the achievement of the SDGs, and the need to consider how inequality of opportunity
22 Development Progress Case Study
Figure 3: 1980-2014 HDI data comparison of Progressia with selected countries
0
0.1
0.2
0.3
0.4
0.5
0.6
0.7
0.8
0.9
1
1980 1985 1990 1995 2000 2005 2010 2011 2012 2013 2014
China Mozambique United States Zambia Zimbabwe Progressia
Source: Data for other countries are drawn from UNDP (2016). Data for Progressia are formulated to mimic countries in southern Africa.
3 The IHDI was introduced by the UNDP in the Human Development Report of 2010 to factor in the effect of inequality in the three main dimensions of HDI: life expectancy, education and standard of living. The IHDI discounts average values in the three dimensions of HDI according to levels of inequality. The observed ‘loss’ in human development as a result of including inequality is a calculation of the difference between the HDI and the IHDI, expressed as a percentage. Therefore, when inequality increases, the loss in human development is seen to increase.

The Sustainable Development Goals and their trade-offs 23
and outcomes for different social groups is more important than ever.
For instance, Progressia’s existing sex-disaggregated HDI (Gender Development Index (GDI)) for gender equality and women’s empowerment in the realms of health, education and income goes beyond assessing the quantity of indices to illustrating the quality of human development by gender. In 2014, the country’s female HDI value estimated at 0.421 was far less than that of males estimated at a value of about 0.469. While both indices for women and men are far from the maximum attainable value of 1, males seem to fare better than females. But because the differences are not that great, the final GDI figure (0.89) is much closer to 1, suggesting greater progress relative to the maximum attainable on the aggregate of factors entering the GDI.
In comparison, 2014 GDI values for other southern African countries, such as Malawi and Zambia, are 0.907 and 0.917 respectively, while the average for SSA is 0.872. Although male to female sex differentials in Progressia in health, education and income suggest gender gaps, they cannot be used on their own to reveal the extent to which gender inequality erodes national achievements in gender equality and women’s empowerment (Klasen and Schüler, 2011). However, a closer analysis of Progressia’s losses of achievement as a result of gender inequality (Gender Inequality Index (GII)) in reproductive health, empowerment and participation in the labour market shows that Progressia sits among the world’s bottom five countries. For every 100,000 live births, an estimated 550 women die during pregnancy or childbirth. Women hold only 15% of parliamentary seats, and barely 10% of adult females (compared to 20% of men) have completed primary school. Although more females (86%) than males (80%) participate in economic activities, women’s work is often lower paid – if any pay is received at all.
3.5 Political settlements and governance institutions
By 1900, Progressia, like most countries in southern Africa, had been conquered and colonised by a European power. Following its conquest, a colonial state formed the administrative machinery of domination, with its effective control, oppression and exploitation of the country. The colonial state was as authoritarian as it was bureaucratic because it imposed itself upon the people and ruled by force without their consent.
This was possible because, on the one hand, the colonial state had all the advantages of the technologies of warfare. On the other, it tapped into the weakening political geography of Progressia, characterised by the demise of old African chiefdoms and empires, and their reconfiguration into different political entities – a change that weakened the traditional organisations of its native people.
The dominant racist ideology of the imperialist enterprise created a colonial state that lacked the legitimacy and democracy of a normal state. As a result, two parallel societies existed in one space: subjects and citizens. In one of these societies, citizenship was defined by factors such as race, urbanity, rights and participation, which benefited the Europeans. In the other, subjects (Progressia’s Africans) languished under the despotism of a combination of local government and customary law. Local government structures institutionalised a policy of divide and rule to sustain the oppression of the native population, while customary law meant their indirect control through traditional leaders, such as Chiefs and Village Heads. Subjects had few rights, if any, and were routinely dispossessed and exploited.
This type of divided society can still be seen in post-colonial Progressia. Two communities co-exist: the haves and the have-nots. The ruling elite have driven the political agenda to stay in power and reap most of the country’s economic benefits – a system modelled along the lines of colonial domination. Although social development indicators have shown steady progress over time, macro indicators of development mask a far more complicated political reality. In short, Progressia presents a complex and mixed picture of political development: three steps forward, two steps back; one side-step and then forward (or back) again.
The elites that inherited political largesse from the colonial state moved quickly to consolidate it, attempting to marginalise economically and to neutralise politically those who might compete for control of the apparatus of government. Many years of single-party rule in Progressia curtailed freedom of the press and speech, and those who disagreed with ruling-party policies suffered ferocious persecution. Government power became the dominant means of wealth accumulation as the diversion of development funds into offshore personal bank accounts became routine. The very idea of democracy was seen as a far-fetched construct, as Progressia increasingly defined itself as a kleptocracy, with political elites reaping income they had not earned, and profiteering from the efforts of others.
Today’s kleptocracy continues to promote the most malleable and corrupt leadership, which has allowed ambitious individuals and groups to hang on to positions of status, power, dominance and wealth. Years of corruption and policy distortion in favour of the country’s elites have undermined its development progress.
3.6 Economic development trajectoryProgressia, has enjoyed slow but visible economic growth over the past 12 years (2004-2016). Its recent claim to a decade of uninterrupted economic progress is reflected by a gross domestic product (GDP) annual growth rate close to 6%, exceeding the averages for SSA and Latin America of 5% and 4% respectively in 2014 (World Bank, 2016a).

24 Development Progress Case Study
The country has managed to sustain growth since 2004, despite the global recession and environmental instability.
Progressia has also experienced an increasingly equitable distribution of income, especially in the 1990s, with a Gini coefficient falling from 59 to 40 between 1994 and 2004. Here, the share of income held by the poorest 20% of the population increased from 4.7% in 1997 to 6.9% in 2004, while the share held by the richest 20% fell from 52% to 47%. This is significant as it suggests wealth redistribution to the poorest quintiles and falling income poverty.
Income growth was driven, in large part, by agricultural subsidies to smallholder farmers in the traditional reserves and trust lands. The subsidies included Compound D4 and Ammonium Nitrate fertiliser, seed and, very importantly, greater land-tenure security for the rural poor. Land-tenure security in Progressia is necessary not only for smallholder agricultural production and the future of the country’s
predominantly rural people: it also enables the poorer quintiles to negotiate their own future equitably, and strengthen their capacity to undertake viable, alternative off-farm activities.
Land-tenure security has helped the rural poor to use their land as collateral, in some cases renting it out as farmers realised the real value of their land. Fertiliser, seed and land, combined with increased capacity in horticulture and increased maize production, have resulted in higher farm incomes, and greater household food and nutrition security.
Like its neighbours Malawi, Swaziland and Zambia, Progressia has enjoyed good relations with development partners and the donor community, notably the governments of Germany, Switzerland, the UK and United States (US), and the European Union (EU), all of whom have increased their commitments to the country. Emerging
Figure 4: Country comparison of GDP growth (annual %)
2.7
5.2
5.4
5.7
7.8
4.6
11.6
2.9
-5.8
3.2
5.5
5.7
3.6
7.4
1.5
4.6
2.5
3.8
Botswana
Progressia
Malawi
Mauritius
Mozambique
South Africa
Sub-Saharan Africa
Swaziland
Zimbabwe
2014 2004
Source: World Development Indicators (World Bank, 2016a).
4 Compound D fertilisers and ammonium nitrate are the most commonly used fertilisers on maize.
The Sustainable Development Goals and their trade-offs 25
partners, such as China and Japan, have also increased their contributions in Progressia. Overall, the progress on human development (see Section 3.4 on poverty and inequality) has placed Progressia among the top 30 performers on several development indicators in terms of both absolute and relative improvements.
However, although Progressia has made significant economic strides in recent years, development progress has been undermined by political, environmental and social factors. Weak fiscal discipline, for example, has driven the country’s wider macroeconomic instability. In the wake of public financial management scandals in 2010, 2012 and 2015, Progressia has seen sharp reductions in the amount of development assistance it receives. As a result, the government has run massive fiscal deficits, standing at 6% in the 2015/16 financial year, with growing pressure on expenditure to service debt costs and satisfy rising wage demands across the public sector.
Other macro-level challenges include foreign-exchange constraints, a continued over-reliance on agriculture, the shortage of skilled human resources, and a weak investor environment, which scares investors away and hampers the growth of the private sector. Deforestation, soil erosion, siltation, floods, and prolonged droughts also contribute to a volatile economic situation.
Progressia’s impressive economic growth is unlikely to be sustainable, given that it has been driven, in part, by consumption – a factor that has stimulated excessive imports and suppressed the country’s export base. The lack of transportation, power supply, and information and communications technology (ICT) infrastructure could undermine future economic growth. Taken in combination, these factors continue to raise valid concerns about the sustainability of development outcomes in Progressia.

26 Development Progress Case Study
4.1 OverviewThis chapter sets out some of the ways in which social development interacts with goals that aim to sustain the environment. By mapping four possible future scenarios that may result from combining policies that aim to improve both social development and environmental sustainability, the chapter highlights the challenges that Progressia (and, in reality, other developing countries) encounter when trying to advance social development in a way that is environmentally sustainable. As the chapter will show, attempts to meet these twin objectives simultaneously have several limitations in practice, especially in developing-country contexts. The chapter also reflects on the extent to which improvements to end hunger and improve forest management are (in)compatible and how policy-makers struggle with such contradictions.
The chapter has five sections. In Section 4.2 we set out the ‘double-edged nexus’ between social development and environmental sustainability. Section 4.3 highlights the grand compromise between the seemingly contradictory implementation of objectives. It also flags up other contextual variables and key drivers that have the potential
to change future outcomes, and that policy-makers could consider when combining goals to improve agricultural output and forest management. Section 4.4 introduces four scenarios resulting from combining SDG indicators 2.3.1 and 15.2.1, which are discussed in more detail in Section 4.5.
4.2 Social development and environmental sustainability
Nothing in the ambitious global SDGs steers development thinkers, policy-makers, planners and communities towards either environmental protection or sustainable social development. Instead, these stakeholders already work with the tension generated between these two fundamental aims – a tension that presents what we call, the ‘double-edged nexus’ with sustainability at its heart. This heart – while being a vague concept – can and must be grasped, even if only approximately and indirectly, through a fair and honest period of confronting and resolving the trade-offs inherent in implementing the goals simultaneously.
4. The trade-off: environmental sustainability or ending hunger?
Photo: A chilli-pepper farmer in Southern Malawi. © Sara A. Fajardo/Catholic Relief Services.

The Sustainable Development Goals and their trade-offs 27
4.3 A grand compromise: SDG trade-offs and synergies
There is a grand compromise at the core of sustainable development between those who prioritise the environment, those who prioritise social development, and those who prioritise economic development. Within this, we find competing interest groups who have negotiated a workable compromise. Globally, this compromise has engaged developed and developing countries in a common endeavour (CBD, 1992; UN, 1992c). Before the 1992 UN Conference on Environment and Development (UNCED)5 formally adopted this compromise, there were tensions between the poorer and the richer countries, with the former seeing demands for environmental protection as a threat to their ability to develop, while the rich countries saw some of the development in poor countries as a threat to valued environmental resources. In developing countries, however, and especially in SSA, the tensions at the local level still remain and are now even greater.
The hard questions have yet to be answered on which trade-offs to confront when implementing goals that may conflict. For example: With Africa’s growing population, which suggests increased demands for land, food, wood fuel and new ways to end hunger, how can such competing demands on the Earth’s resources be reconciled with sustainable forest management?
Achieving increased farm volumes per capita and especially for indigenous populations will not be any easier in the future than it has been in the past. On the contrary: water resources and land for farming, especially for small-scale farmers, are under far more pressure than in the past and are becoming scarcer, both in quantitative terms (per capita) and qualitative ones. Local food prices are likely to become increasingly chained to highly unstable and volatile global commodity prices, as we have seen in recent global trends (see Food and Agriculture Organization (FAO), 2011a; Alexandratos and Bruinsma, 2012). The scarcity of water and land stems from the changing climate, soil degradation, salinisation of irrigated areas, and competition for land uses other than for food production, such as growing cities and protected areas (FAO, 2011b).
It is often the poorer quintiles – particularly their women and children – who are hit first and hardest by both the costs of resources and their scarcity. In southern Africa, poorer households already spend more than half their income on food and will struggle to pay any more (Save the Children, 2012). There are also fears that the downward trend of growth of crop yields may not reverse (see Alexandratos and Bruinsma, 2012). The problem is not whether small-scale farm yields will return to their
previous higher rates of growth, as this is unlikely in any more than a few individual countries. Rather, the tension is whether the lower yield potential, together with modest increases in cultivated land, is adequate to meet increased demands (see Place and Meybeck, 2013). The continued change in climate is another looming risk that may negatively affect agricultural resources.
Examining the sustainability of the food-production system, the trade-offs and/or synergies raise doubts about the possibility of continuing to do what has been done in the past: increasing inputs in production, expanding irrigation and cultivated land, and long-distance transportation of farm yields. Many scientists, agricultural economists and environmental experts advocate for intensified production that is, above all, sustainable, which raises doubts about whether it will be possible to achieve the quantities of food the world will need for its growing population, given the stringent resource constraints for agricultural production (see Government Office for Science, 2011; FAO, 2013; Gregory et al., 2013; Maggio et al., 2015; Hassan et al., 2016; Nijbroek and Andelman, 2016). This is one of the primary reasons for fears that increased volume per capita among smallholder farmers to meet future food and income requirements may conflict with the simultaneous management and sustainability of forests.
These challenges do not happen in a vacuum, but rather in continuous interactions with other independent
5 The 1992 Earth Summit /UNCED marked formal adoption and global consensus on the values, goals and strategies to achieve a new development agenda beyond the 1990s. The summit’s Rio Convention resulted in documents that bound States to commit to a number of treaties, including the Convention on Biological Diversity (CBD, 1992), the UN Framework Convention on Climate Change (UNFCCC) (UN, 1992a) and the UN Convention to Combat Desertification (UN, 2002). Other outcome documents included the Rio Declaration on Environment and Development (UN, 1992b), Agenda 21 (UN, 1992c) and Forest Principles (UN 1992d). The UNFCCC led to the Kyoto Protocol (UN, 1998) and the Paris Agreement (UN, 2015).
Box 2: Dependency paths
Dependency paths refer to the idea that events occurring at an earlier point in time will affect events happening at a later point in time. In the strict sense path dependency means there are contingent events in history that create institutional patterns with deterministic properties. Dependencies used here are events or existing context variables, that tie the present to the past, and to the future (Gáspár, 2011). These variables include the political, social, economic, environmental decisions that, while not included in the scenarios in Section 4.4 do shape the possible future outcomes. The driving forces of path dependency do not stop at the present but influence the future to a greater or lesser extent. All in all, dependencies enrich the future scenario mapping process, where in many cases the past experiences frame the context background characteristics that interact with the present, to create dynamics to the processes in the future (Gáspár, 2011).

28 Development Progress Case Study
variables, such as the infrastructure of politics and governance, technology penetration and uptake, and geographic context. These independent variables have a direct influence on development outcomes, but also influence each other. Indeed, there may be considerable overlaps in the ability of these independent variables to explain outcomes. There is, therefore, no single truth in the manner in which they interact with the volume of agricultural output or forest management. In the next sections we summarise how these few selected independent variables create a dependency path.
Politics and governance dependency Achieving volume of output per labour unit, especially for women smallholder farmers, can be a factor in broader country political settlements and the governance of resources. For example, in some southern African contexts, improved access to land (especially for women) has been associated with the formalisation of land-tenure reform processes. This has given women more access to land where, across most of southern Africa, land tenure has been based traditionally on patriarchal rules and practices. But even where land tenure is based on matrilineal lines, as it is in central Malawi and parts of Namibia, Zambia and Zimbabwe, children may be disadvantaged as societies change.
While governments in southern Africa are increasingly considering the importance of the land-tenure rights of women and indigenous populations, the process of ensuring land security has been associated with livelihood destruction, with commercial plantations and big international corporations seizing small-scale farms without consulting or compensating locals, dispossessing them of not only their livelihoods but also family ties and work opportunities (Carmody, 2017). While it could be argued that this is only an indirect trade-off, given that the trade-off is not intrinsic to the volume of farm production per labour unit, the issue is how land for smallholder farmers is governed. The impact on local communities is likely to be dire, when politics favours profit and when governance systems are weak (Carmody, 2017).
Technology dependency There is a global consensus that the use of technology to improve agricultural outputs can help to meet the food needs of a booming global population and decrease food and nutrition insecurity (Dobberman et al., 2013; Shirsath, et al., 2017). There is, however, little consensus on how to achieve this sustainably. There are, for example, trade-offs in terms of how to increase food production while minimising the costs of some technological advancements. These include agricultural nutrients that pollute groundwater and aquatic habitats, bio-accumulating pesticides, or pollutants and antibiotic-resistant pathogens linked to certain animal production practices that can harm human health. These particular technologies may
generate high yields at the expense of the environment (Huesemann, 2011; Davies et al., 2017)
Other technologies, however, can mitigate the negative consequence of these trade-offs. They include the technological transitions towards zero-emission farming, which might shift a negative interaction between technology and the environment to a more positive one. In reality, achieving such scenarios represents a big challenge for development and policy practitioners, given the trade-offs among competing goals.
Geographical context dependency For each scenario map, some relationships are generic and are based on trends in southern Africa and general socio-economic trends, while others are highly country-specific and context-dependent. For example, the trade-off between deforestation and food production, which is likely to seize more attention in policy-making, is not commonly understood as an issue in the southern Africa region. On the contrary: smallholder farmers have benefited from extending the amount of land they farm to produce more (staple) food, and diversify their markets by growing soya beans and other oilseeds to expand their markets, reducing the vulnerability of their local supply chains (Johnson et al., 2016). However, such relationships that are often country-specific can have significant spill-over effects, given the broader environmental patterns.
4.4 Ending hunger while protecting the environment: what are the possible future scenarios?
What would it look like, if Progressia combined agriculture and environmental policies to reduce deforestation and address hunger and the livelihoods of the impoverished people who depend on these areas for food production and income generation?
Four possible normative future scenarios are mapped below.
1. Scenario 1 (Good and Good outcomes): Ending hunger and environmental development outcomes are reconcilable and can be sustained.
2. Scenario 2 (Good and Bad outcomes): Ending hunger and environmental development outcomes present conflicting outcomes.
3. Scenario 3 (Bad and Good outcomes): Ending hunger and environmental development outcomes are difficult to reconcile.
4. Scenario 4 (Bad and Bad outcomes): Ending hunger and environmental development outcomes are simply irreconcilable.

The Sustainable Development Goals and their trade-offs 29
Box 3: Scenario 1: (Good and Good outcomes): Ending hunger and environmental development outcomes are reconcilable and can be sustained
Desirable future outcomes: increased agricultural productivity and reduced deforestation
It is 2030, and Progressia has doubled the agricultural output and incomes of small-scale women food producers, while sustaining local mechanisms for forest management. Its agriculture now uses about 10% less farmland and 40% less labour than in 2010. Agricultural productivity, measured by the total output per unit of aggregate input – total factor productivity (TFP) – has been largely responsible for the increased production. Between 2010 and 2027 oilseed yields, especially for soya beans, doubled per acre, while maize yields doubled, and labour productivity increased by nearly five times. TFP in 2027 was about 1.5 times larger than it was in 2010. With improved productivity, real prices of agriculture commodities (adjusted for inflation) have fallen in the past three decades. The lower prices of commodities have benefited low-income households, which often spend most of their income on food.
The intensive use of machinery and agricultural chemicals has been driven in large part by the rising costs for labour and land. But investments in roads have also contributed to agricultural productivity, making it possible to get new technologies to farmers while significantly reducing marketing costs. Both the public and private sectors have invested heavily in research and development (R&D) in agriculture. Although the industry and market of Progressia were not large enough for private for-profit research activities, collaboration with the African Development Bank (AfDB) has, since 2020, helped to build an enabling policy environment for the private sector to guarantee returns and strengthen the science infrastructure. The Ministry of Agriculture, working with the AfDB, has improved agriculture extension services to boost productivity still further. Since 2018, for example, the extension services have disseminated new technology to mostly rural smallholder farmers and provided farming support services in planting, irrigation, weeding, harvesting and market processes.
Subsidies to smallholder farmers for irrigation and drainage infrastructure have not only enhanced water efficiency, but have also helped farmers gain an economic advantage while reducing environmental burdens, with new irrigation mechanisms integrating the management of both water and nutrients. This approach has minimised the much-feared problems of agro-chemical run-off and leaching. Community-led environment protection schemes have improved awareness on current and future environmental hazards related to agriculture. Stakeholders in these community environmental schemes have discussed options for better practices and there is now a respectable space for knowledge-exchange. This process has, in turn, provided enabling conditions and incentives for all relevant stakeholders to share greater responsibility for agricultural water management across the entire water-supply chain, including farm-level practices as well as drainage and leach-out management.
The schemes have also extended the village-centred environment support system where local communities take on proactive forest management. Although donors provided the initial support to establish and strengthen community-based forest management schemes, today Progressia has nearly 250 formally declared and village-led forest reserves on unreserved village lands, ranging from three to 10,000 ha, all of them managed by communities.
Progressia’s Forest Act of 2022 supported the legal process of village management through an agreement to devolve management responsibility of forests to the lowest village tiers. The Ministry of Environment and Natural Resources has continued to provide oversight management and provided the technical guidelines used by community-based forest management teams in government, community and village-led land forest reserves. Almost 50 village land reserves co-manage with the government, with 30% of community forests reserves managed by women in stark contrast to four decades ago when land rights were enjoyed primarily by men. There has been clear and progressive enforcement of the National Land Policy (NLP). As well as recognising women’s customary and statutory rights of land occupancy, the Ministry of Land has over the past decade provided mechanisms for the registration of land title, and especially to women – married, unmarried, divorced or widowed – to ensure equal and equitable access to land for all citizens. The NLP acknowledged that under customary law, women’s access to land was insecure and indirect. It therefore provided women with the right to acquire land in their own right through purchase and allocation.
The resulting social stability is visible in the increased school attendance of girls; increased antenatal care visits; and in greater food and nutrition security as incomes from agricultural productivity increase. Multiple soya bean processing units have been established in most districts across the country in partnership with the private sector, guaranteeing more local jobs.

30 Development Progress Case Study
Box 4: Scenario 2: (Good and Bad outcomes): Ending hunger and environmental development outcomes present conflicting outcomes
Could play out! Reduced agricultural productivity and increased deforestation
It is 2030 and Progressia has reduced deforestation significantly, but small-scale producers continue to lose their jobs, livelihoods and food security. Some of the costs of the country’s Reforestation and Forest Restoration Initiative that have fallen on small-scale farm producers have included their displacement from their communities, rapid changes in the traditional land-tenure systems, restricted access to resources, loss of employment, crop damage and livestock loss. The movement to new resettlement areas not only damaged their livelihoods, but also undermined their access to health and education services. Displacement to areas with poorer soils, three hours away from water and forest resources, has resulted in the collapse of the local livestock market and economy.
Intensified timber extraction followed resettlement in the land surrounding protected areas as families built new homes. Farmers were not adequately or fairly compensated for their displacement with land or money; no alternative income-generating projects were set up to off-set their loss of livelihoods. Firewood restrictions in protected forests continue to force members of the community – particularly women – to walk long distances to collect firewood from unprotected woods. These problems continue to create tension between the community and the government, and breed disregard for forest protection regulations. In addition, restrictions in access to indigenous medical plants, fruits and vegetables have caused significant dietary changes in most rural households, leading to a decline in overall nutrition as families now depend on purchased items and, as a result, are failing to meet their minimum income requirements. The changes in land-tenure systems from traditional property rights to state-owned land policies have had a significant livelihood cost. The new designation of protected forest areas has ignored traditional African systems and boundaries of land tenure, robbing community institutions of their power to control land use. This loss of power continues to weaken local community structures, as well as traditional community institutions and cultures. This, in turn, has awakened old conflicts, as different groups fight for the control of natural resources.
Although the forest protection policies have had significant benefits in Progressia, the prominent members of society who bear less of the costs have reaped most of the benefits. The Government channelled massive capital subsidies and resource rents to companies with close ties to state elites in a process that facilitated corruption and financial fraud. The design and implementation of the initiative has been guided by the forest rent-distribution practices of state forestry bureaucracies and corporate accumulation strategies linked to globalised commodity chains. The Forest Management Initiative has, therefore, exacerbated existing inequities because it has concentrated resources among powerful political and economic actors, to the detriment of forest-dependent communities. The absence of rights-based spatial planning, lack of equitable and accountable distribution of financial incentives, and poor financial governance to prevent corruption and fraud have undermined the economic benefits and safeguards for small-holders. Although the Government provided financing schemes through subsidised loans (not as compensation) to local communities for the restoration of degraded forests and productivity increases, the policy approach had three major limitations.
First, agriculture extension officers lacked the technical and financial capacity to build adequate projects and this generated mixed results for rural smallholders. As a result, they were often locked in inequitable agreements with plantation companies, and in other cases, the process offered these companies leeway for enhanced tenure security. Local communities continue to refuse to recognise or value the environmental protection benefits of the Reforestation and Afforestation Initiative, given that it helps the powerful: the benefits are felt at the national, regional and global scales, and the costs of protection are felt at the local level. Second, the Government’s short reimbursement period of five years was considered premature, especially for pasture reform; small-scale producers would only benefit if the timeframe were 10 years or longer. Third, outputs were lowered by the high costs of agriculture inputs, especially seeds or mechanised equipment. Unusual weather patterns, such as drought, also lowered productivity. The Government’s reforestation programme not only competes with food production and livestock grazing, but also living space for further economic growth. Taken together, all of these factors combined have lowered agricultural productivity and undermined the social and economic well-being of the poor.
The comparison is often made in everyday policy work between what has happened as the result of a particular measure, and what would happen in its absence. Here, it can be difficult to define the counter-factual, and so we ask, what changes? What difference did the achievements in environmental development really make if progress in this area creates social and economic inequalities and contributes to the widening gap between the haves and the have-nots?

The Sustainable Development Goals and their trade-offs 31
Box 5: Scenario 3: (Bad and Good outcomes): Ending hunger and environmental development outcomes are difficult to reconcile
Not too bad? Increased agricultural productivity but increased deforestation
It is 2030, and Progressia’s environmental protection laws have been difficult to enforce in the past 15 years. There has, however, been notable progress in agricultural productivity, partly because of intensive farming systems and the rise in agriculture technology. The rural electrification project, which has now covered 60% of rural areas (up from 30% in 2010) has also helped to boost crop productivity and, as a result, some farmers have shifted from cattle ranching to crop cultivation. Intensive farming systems have been promoted as indirect policy mechanisms to reduce deforestation, but increasing productivity has had two ambiguous effects on forest protection. First, it has expanded the overall scope of farming in Progressia, a process that has harmed the forest and its ecosystems. Second, it has induced farmers to shift from land-intensive cattle grazing towards less harmful crop cultivation.
While there has been notable agricultural progress in TFP among small-scale farmers, the main beneficiaries have been the major commercial farms. The small-scale farmers, especially women, tell a different story. They engage in both cultivation and grazing by domestic animals (particularly goats and donkeys). Although agriculture authorities and extension workers have discouraged the use of donkeys for draught power and promoted tractor power, donkeys have been critical for rural transport, trade, draught power and water collection. In 1990, one survey of over 1,000 households in the northern rural district found that 30% cultivated by hand using hoes, 20% with oxen, 38% with donkeys and 12% with tractors. There was variation, with one other rural area reporting over 70% of small-scale farmers using donkeys for ploughing. But over 40% of farmers in the main peri-urban centres used tractor power. The use of tractor power, other machinery and electrification has now penetrated rural areas, but the impact is more favourable for urban and commercial farmers who can afford new technologies.
Donkeys are cheaper than oxen, seldom consumed and, therefore, less likely to be stolen. The grazing of donkeys, goats and cattle is extremely land intensive as, like all free-range domestic animals, they overgraze on community or state lands, and, if left unchecked, they can damage forests and degrade soils by removing vegetation and trampling the ground. This is an area where creative choices and wise trade-offs can smooth out competing objectives. Instead of trying only to reduce the number of domestic animals because they degrade the environment, small-scale farmers can assess the trade-offs, embrace potential loss and, just as important, establish mechanisms to increase agricultural productivity. While domestic animal grazing is land-intensive, crop cultivation requires more capital, both physical and human, and demands more human skills. In short, the typical cattle-grazing farm requires lower levels of capital investments than crop farming, which motivates small-scale farmers to do both, clearing new land for crop cultivation and for cattle and goat pens. This leads to deforestation and, in the long-term, desertification.

32 Development Progress Case Study
Box 6: Scenario 4: (Bad and Bad outcomes): Ending hunger and environmental development outcomes are simply irreconcilable
Oh snap! Reduced agricultural productivity and increased deforestation
It is 2030, and Progressia faces the challenge of managing trade-offs between the immediate needs for human development and maintaining the ecological capacity to provide goods and services to its population now, and in the future. There is a logical paradox here. On the one hand, land use has provided significant social and economic benefits for Progressia. On the other, it has led to declines in human welfare through altered ecosystem functioning.
The country’s incomplete perception of the problems of poverty and environmental degradation, and its confusion about the role of economic growth and the concepts of sustainability and participation, has resulted in inadequacies and contradictions in policy-making, seen most clearly in the context of international trade, agriculture and forestry. Politically fuzziness continues to prevail, rather than intellectual expediency. As a result, Progressia is experiencing reduced agricultural productivity and increased deforestation. What has happened? Why is the country in this situation today? For Progressia, like many other SSA countries, the direct causes of forest destruction have included the shift from natural forest conservation to cropping land, logging and timber extraction, fuelwood consumption, bushfires, human settlement and mining in those forests. Although some of this has been caused by exploitation by poor small-scale subsistence farmers who depend on the forests close to their homes for their livelihoods, the greatest destruction has been driven by those who exploit the forests for profits but who do not live near them. They have acquired forest resources cheaply, made quick profits and left, without putting in place any measures to sustain the environment or to benefit local people.
But, they are not solely responsible. The conversion of large chunks of forests into agricultural concerns under food-crop and crop plantations is a real problem, with the major offender being crop cultivation to meet external needs. Large pieces of land have been claimed as plantations to supply primary products elsewhere. This has been accompanied by the export of outputs from timber production and logging to developed countries. Loggers in Progressia now have concessions for long periods, sometimes more than 50 years. And with little or no monitoring of their operations, the damage has been significant. Fuelwood still accounts for over 70% of rural energy consumption, meaning that firewood and charcoal continue to be heavily extracted – and not only for local use, but also for export.
The drivers of these problems include Progressia’s fiscal policy and its debt burden, unfair international trade, vague local forest policy, poor governance and poverty. The country’s economic policies have provided bait for forest destruction. As also seen in Ghana, its economic recovery programme (ERP) has exacerbated the exploitation of timber resources. Timber export earnings increased from 2% of export earnings in 2010 to 7% in 2014i (5.9% in 1986 to 13.2% in 1990 for Ghana) (Okrah, 1999). Although there was economic recovery through export revenue, the cost of environmental degradation imposed on the economy could not off-set the profits earned from exports. The problem was made worse by Progressia’s debt burden. Despite the pressing need for action to conserve the environment, the country’s desperate bid to service debt led to the plunder of its ecosystem, not only through timber extraction but also selling wildlife such as elephants and encouraging hunting to finance the deficit through domestic public spending.
The poverty levels in Progressia heightened this onslaught on the natural environment. Although Progressia can harness enormous resources in natural biodiversity and indigenous knowledge systems for sustainable food and environmental systems, poverty remains the main cause and consequence of environmental degradation and food insecurity. Without significant advances in the living conditions and livelihoods of the poor, environmental policies and programmes have achieved little success. Thousands of small-scale farm producers in the low-rainfall regions of the country starve as a result of environmental degradation, while millions more face imminent disasters because most of their water sources have dried up, their land is too denuded to rear livestock, and the soil so depleted it cannot be cultivated. Soil erosion, declining soil fertility, deforestation, pollution and siltation of water supplies, and the loss of biodiversity are daily, real and critical struggles for the rural poor. Pollution, poor sanitation, and insect, water and soil-transmitted diseases have all increased, adding heavily to the burden of illness and undermining the ability of poor farmers to earn a living from the land. All of these have combined to result in today’s lowered productivity in agriculture and poor health outcomes. At the same time, the country’s unique species of animals and plants are under threat, as are biological resources that are depleting rapidly as a result of climate variability and habitat loss.
To sum up, while it is laudable to link the goals of managing deforestation and poverty reduction through sustainable small-scale agricultural productivity, doing so is another story. Achieving these twin goals implies locally negotiated trade-offs between forest and other land uses in the quest for improved livelihoods, which happens either at the expense of poor local communities or the environment. But in this case, the costs cut both ways: an onslaught on the environment and the undermining of the livelihoods and household food/nutrition security of smallholder farmers.
i Trends based on Ghana time-series analysis on timber extraction.
The Sustainable Development Goals and their trade-offs 33
4.5 Reconciling ending hunger and environmental sustainability: policy implications
Drawing on the possible future outcomes mapped in Section 4.4, this section will discuss the implications of ending hunger while sustaining the environment for national government policies and international policy-making. It will identify key drivers of progress from country experiences, which provide a basis for assessing the implications for policy.
Agriculture, poverty and international tradeDespite the ongoing transformation of economies across SSA, agriculture remains a crucial sector and provides livelihoods for millions of people. Rapid population growth, urbanisation and rural diversification are key drivers of SSA’s agricultural sector, providing farm jobs but also stimulating off-farm employment. Ideally, this would be accompanied by nutritional interventions such as vitamin and mineral supplementation of basic foods, while improvements in health, water and sanitation access would, at the same time, reduce the effects of illness on food absorption.
International and regional trade will continue to play a significant role in improving food security and fostering agriculture. However, if future reforms focus too narrowly on the removal of subsides in developing countries, it is consumers in these nations who will reap most of the gains (FAO, 2015). But internal reforms are critical if international trade is to contribute to poverty reduction in southern Africa. Such reforms may include opening borders for long-term foreign investments and improving the transparency of markets through information on available stocks, including information on the food market to better inform policy responses (Townsend, 2015). Such policies should be accompanied by schemes to support the improvement of food quality and safety, roads and irrigation infrastructure, seeds, equipment, technology and skills, alongside social safety nets for the poorer quintiles who struggle with higher food prices.
ODI’s Development Progress case study examining progress in Ghana’s sustained agricultural growth ‘has shown excellent results in countries that have adopted such an approach. For example, Ghana implemented comprehensive economic reforms to stabilise the wider macro economy while restoring producer incentives, including export-oriented small-scale farmers. Among others, the key drivers included devaluation of the cedi, control of inflation, reduced input subsidies, reform of cocoa marketing and trade liberalisation’ (Wiggins and Leturque, 2011: 11). There were also gains in agriculture employment as more land was put under cultivation; at the same time, both land and labour became more productive (ibid.).
Agriculture and the broader food system must be viewed as a key part of the jobs agenda. This makes it imperative – particularly in Africa – to revisit the role of multinational food companies who could disempower farmers in many countries. Those in southern Africa need the legal and administrative frameworks to ward off such threats while reaping the benefits of reforms.
Crop productivity, food and nutritionGlobal undernourishment is expected to fall from the 2015 estimate of 11% of populations in developing countries to an estimated 6% in 2030 (FAO, 2015). By 2030, about 75% of populations in developing countries are projected to be living in countries where no more than 5% of people are malnourished, in contrast to the 8% who live in such countries at present. Today, however, most of the world’s hungry people are chronically hungry, and they are so hungry because they are chronically poor (African Union et al., 2014). An estimated 78% of the world’s poor are heavily dependent on agriculture not only for their food, but also for their livelihoods (FAO, 2015). Agricultural productivity represents, therefore, one of the most powerful tools that exists to end extreme poverty. For instance, in their Development Progress paper examining Thailand’s progress in agriculture, Leturque and Wiggins (2011) show that since 1960, Thailand facilitated the country’s transformation into an urbanised economy based on rapid agricultural growth. Growth through agriculture was based on the utilisation of underused land and labour, and led to falling poverty from more than 60% in the early 1960s to barely more than 10% in the new century. Resultantly, food prices have halved, and hunger and child malnutrition have reduced greatly (ibid.).
There are three key drivers of growth in crop production: yield-boosting, land-area expansion, and water and irrigation for more frequent crops (see OECD/FAO, 2016).
Technology improvements There has been some notable progress in agricultural technology (Lenhardt et al., 2014). For instance, the no-till or conservation agriculture technologies that integrate the management of pests and nutrients and promote organic cultivation promise growth in the agricultural sector as well as improvements in environmental management (ibid.). Lenhardt et al.’s (2014) Development Progress report on ‘Sustainable farming techniques, land reclamation and improved livelihoods in Burkina Faso’ argues that traditional technological techniques, such as Zaï, the stone bunds and the demi-lunes, spurred the adoption of sustainable agricultural practices in Burkina, because technological improvements to these farming methods emerged through bottom-up participation led by local communities and small-scale farmers. The benefits not only included and increased food production

34 Development Progress Case Study
by between 25% and 75%, but also improved farming practices, including the integration of cattle farming and tillage, and well-managed natural resource use preventing overexploitation despite population growth (ibid.). Evidently, new and improved technology is needed for areas with shortages of land or water, or with particular problems of soil or climate. Such areas often have a high concentration of poor people, for whom technology could play a fundamental role in improving food security (Doczi et al., 2014).
The FAO suggests that even without significant advances in modern biotechnology, agricultural production could meet expected demand in the years to 2030 (OECD/FAO, 2016). Nevertheless, new techniques of molecular analysis could still provide a much-needed boost to productivity and, therefore, improve the incomes of the poor. New and emerging technologies should not only be accessible, but also affordable and tailored to meet the needs of small-scale farm producers, women and the malnourished (Townsend, 2015). While productivity advances remain vital, they must also be combined with forest restoration and environmental protection. Policy-makers must address the perceived environmental threats from biotechnology, despite its potential for greater agricultural production.
Genetically modified food crop varieties such as those that are drought resilient, that do not succumb to salinity and fluctuating temperatures, have the potential to sustain agricultural productivity and to restore degraded lands. Similarly, pest-resistant crops can reduce demand for pest-control chemicals. But the widespread use of genetically modified crops must be backed by national capacity to address adequately concerns about food, health and environmental safety. Improved food and food standards acts, chemical testing, and chemical safety protocols need to be robust and taken seriously (OECD/FAO, 2016).
ForestryFAO crop projections suggest that land for crop cultivation needs to expand, alongside the expansion of cities (ibid.). It is likely that forest clearance will provide the much-needed extra land. Although the FAO argues that the rate of deforestation is likely to decline before 2030 and that a crisis in wood supply is unlikely, this will depend on the availability of technologies to produce efficient wood-based materials.
The forest sector faces multiple challenges, such as finding ways to safeguard biodiversity, managing and sustaining natural and cultivated forests, while increasing agricultural productivity, boosting energy supply and sustaining the food and nutrition security of the poor. This presents a paradox. On the one hand, there is a need to boost energy supply to millions of people who have, at present, no access to energy. On the other hand, there is
an equal need to decarbonise the world’s energy systems, which account for about 73% of greenhouse gas (GHG) emissions globally (Newborne, 2014; WRI, 2016).
Similarly, as the World Bank (2015a) argues, electricity supply must be decarbonised by 2050 to meet the 2100 global goal of zero carbon emissions. But, Szabó et al. (2011) and Bailis et al. (2005) see this as a false paradox. They argue that technologically advanced forms of lighting or cooking, and predominantly renewable energy technologies, will increase household energy consumption but relieve pressure on forests, save time spent fetching firewood, and make cooking more efficient. When combined, these benefits end up reducing GHG emissions.
Policy recommendations to achieve the seemingly conflicting aims of forestry and environmental management will vary and depend on context. But, lessons learned from countries such as the Gambia, Ghana, and Tunisia that demonstrate the opportunities for ending hunger while combating deforestation all point to a similar set of tools. First, governments must provide effective legal frameworks that ascertain secure land tenure to protect small scale farm producers. For instance, the significant rise in large-scale land acquisitions by foreign and domestic investors who exploit weak land tenure systems continue to undermine the economic outcomes of small scale framers. In Tanzania for example, while the government’s objective in selling large pieces of land to investors is to boost extensive commercial agriculture and accelerate economic growth, these large scale land acquisitions come at the expense of small scale farmers who are often displaced and with little compensation (Curtis, 2014). In addition to insecure land tenure systems and poor legal frameworks to protect small scale farmers, the country has over a third of its children under age five undernourished and it loses nearly 3% of its GDP each year to the long-term impacts of child malnutrition (ibid) designing legal frameworks that govern any change in land use is imperative, and these must formally recognise rights based on customary tenure systems, to provide certainty on land tenure and protect those who depend on forests for their livelihoods (FAO, 2016). Secondly, consideration of funding should be a government priority for sustainable agriculture and forestry (see FAO, 2016). Sources of such funding may include government budgets, payments for environmental services (PES) mechanisms, export levies and official development assistance, among others. Newborne (2014), Newborne and Welham (2014), as well as Granoff and Hogarth (2015), suggest in their Development Progress reports that distribution of technologies should be accompanied by government efforts to reduce up-front costs and provide secure and affordable loans for consumers.
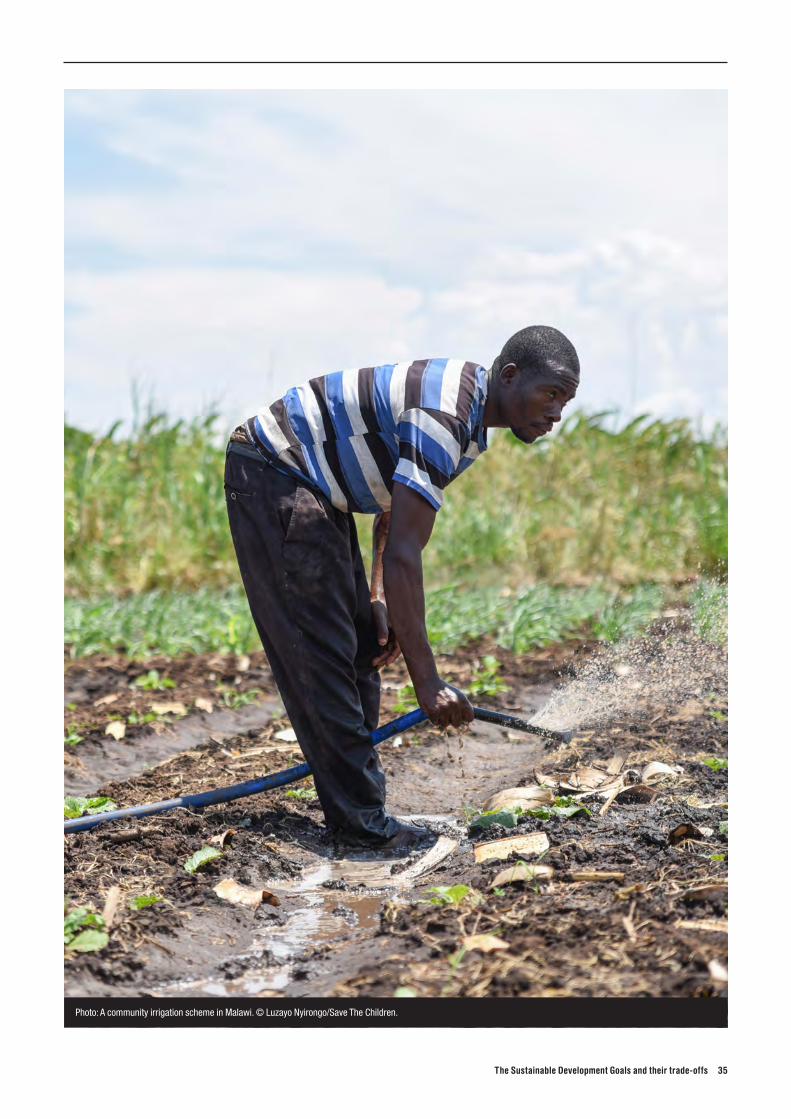
The Sustainable Development Goals and their trade-offs 35
Photo: A community irrigation scheme in Malawi. © Luzayo Nyirongo/Save The Children.
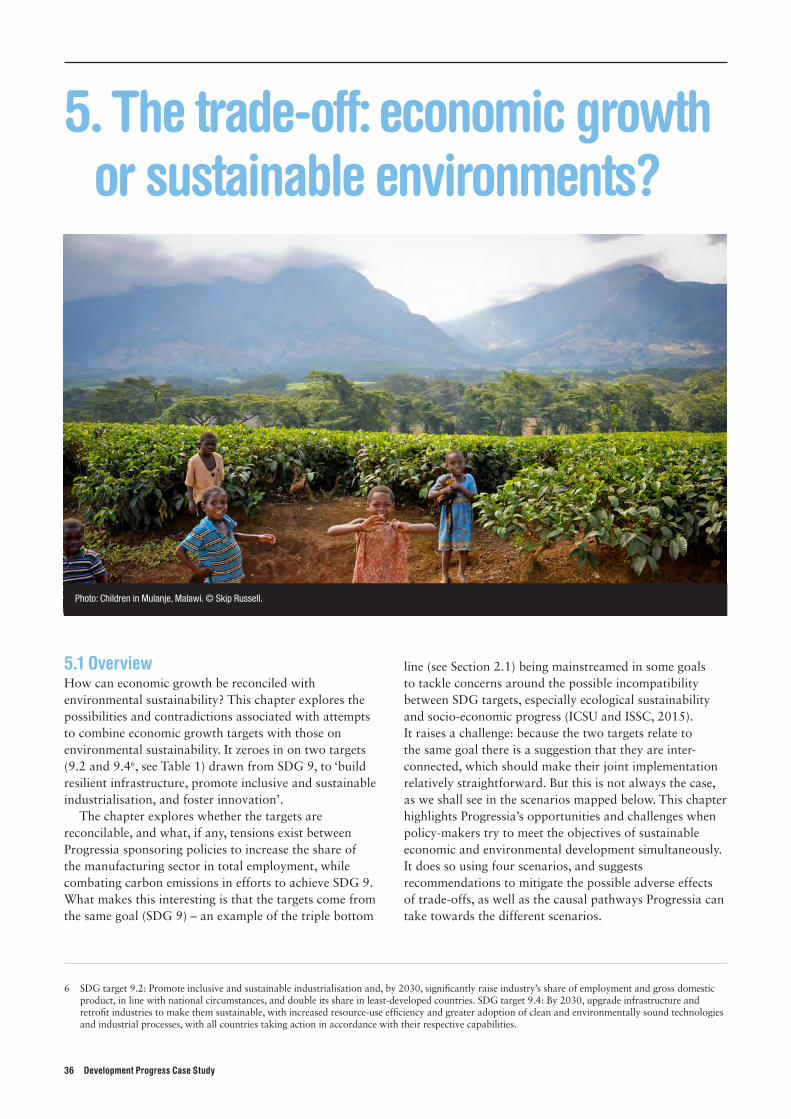
36 Development Progress Case Study
6 SDG target 9.2: Promote inclusive and sustainable industrialisation and, by 2030, significantly raise industry’s share of employment and gross domestic product, in line with national circumstances, and double its share in least-developed countries. SDG target 9.4: By 2030, upgrade infrastructure and retrofit industries to make them sustainable, with increased resource-use efficiency and greater adoption of clean and environmentally sound technologies and industrial processes, with all countries taking action in accordance with their respective capabilities.
Photo: Children in Mulanje, Malawi. © Skip Russell.
5. The trade-off: economic growth or sustainable environments?
5.1 OverviewHow can economic growth be reconciled with environmental sustainability? This chapter explores the possibilities and contradictions associated with attempts to combine economic growth targets with those on environmental sustainability. It zeroes in on two targets (9.2 and 9.46, see Table 1) drawn from SDG 9, to ‘build resilient infrastructure, promote inclusive and sustainable industrialisation, and foster innovation’.
The chapter explores whether the targets are reconcilable, and what, if any, tensions exist between Progressia sponsoring policies to increase the share of the manufacturing sector in total employment, while combating carbon emissions in efforts to achieve SDG 9. What makes this interesting is that the targets come from the same goal (SDG 9) – an example of the triple bottom
line (see Section 2.1) being mainstreamed in some goals to tackle concerns around the possible incompatibility between SDG targets, especially ecological sustainability and socio-economic progress (ICSU and ISSC, 2015). It raises a challenge: because the two targets relate to the same goal there is a suggestion that they are inter-connected, which should make their joint implementation relatively straightforward. But this is not always the case, as we shall see in the scenarios mapped below. This chapter highlights Progressia’s opportunities and challenges when policy-makers try to meet the objectives of sustainable economic and environmental development simultaneously. It does so using four scenarios, and suggests recommendations to mitigate the possible adverse effects of trade-offs, as well as the causal pathways Progressia can take towards the different scenarios.
The Sustainable Development Goals and their trade-offs 37
Section 5.2 explains the conflicting views on the SDG approach and implementation of the selected targets and their indicators. Section 5.3 highlights the grand compromise between the targets, highlighting other context dependent and independent variables and key drivers that could impact future outcomes. These must be considered when policy-makers make strategic decisions around, in general, combining economic growth and environmental sustainability and, in particular, when considering how to increase manufacturing’s job market share while managing carbon emissions. Section 5.4 introduces, and Section 5.5 discusses, four scenarios resulting from combining SDG indicators 9.2.2 and 9.4.2.
5.2 Economic growth and environmental sustainability
Despite bold declarations from leading development specialists that this is the age of sustainable development (Sachs, 2015), there is a widespread view that economic development and environmental sustainability are incompatible. Dismissive critiques have called the SDGs a useless exercise to pursue the political correctness of ‘development by declaration’, with short-term approaches to development sponsored, at the expense of longer-term investments (Szirmai, 2015).
Endle et al. (2012), however, argue that the SDGs’ holistic approach breaks down the siloed approaches to development in the past – with separate pursuits of social, economic and environmental agendas – which led to policy cherry-picking instead of prioritisation between competing goals. They argue that attempting to progress social, economic and environmental goals together, through appropriate institutional and policy interventions, ends the false dichotomy of conflict between goals (ibid.). This reasoning has not been tested empirically for developing countries, but is a sound building block for compromise based on the reality of the interconnectedness of economic growth interests and the environmental interest in achieving zero emissions of GHGs to save the planet.
It is the natural environment, after all, that provides the resources needed to produce goods and services, and absorbs and processes industry’s unwanted by-products in the form of pollution and waste (Everett, 2010), so it must be preserved. At the same time, it is adequate income that provides the resources to support improvement in people’s lives, socially and economically (Melamed, 2013), so people must access adequate income.
5.3 The grand compromise in the economic-environment nexus
Global consensus and compromise have been developing through UN platforms, like the 1992 UNCED, which resulted in the creation of the UNFCCC, the Kyoto Protocol of 1998 on reducing GHGs (UN, 1998) (and its Doha amendments of 2012), the World Summit on Sustainable Development (WSSD, Johannesburg, 2000) and the Paris Agreement of 2015 (UN, 2015).
Although there is clear global consensus on the need for both economic development and environmental protection, tensions remain at many levels of the conversation. At the international level, debates around responsibility for action on climate change and economic development stem from historical imbalances around culpability on both issues. Developed countries, it is argued, developed at a tremendous cost to the environment, and their championship of environmental protection is seen as kicking away the ladder for countries aiming for similar levels of development, which includes virtually all of SSA.7 SSA is arguably the region most vulnerable to climate change, yet its own carbon emissions are negligible when compared with typical European emissions that are 50 to 100 times higher, and American emissions that are 100 to 200 times higher (Grida-Arundale Center and UNEP, 2016).
This chapter examines attempts to mediate this debate, reviewing the effects of the interactions between economic growth and environmental sustainability targets and their allied indicators. We ask, given this reality: How can we reconcile economic growth with environmental sustainability, in a fashion that increases the manufacturing sector’s job creation while keeping carbon emissions in check?
The dual importance and interconnected nature of economic growth and environmental sustainability, and the concomitant trade-offs (short- and long-term) are often explained theoretically using the Environmental Kuznets Curve (EKC)8 (Yandle et al., 2004). The EKC was hypothesised as a step-change hypothesis where 1) as GDP per capita rises, so does environmental degradation, and 2) increases in GDP per capita beyond a certain point, lead to reductions in environmental damage (Grossman and Krueger, 1991 and 1994; Yandle et al., 2004) (see Figure 5, overleaf).
Dependencies mapped below highlight some of the social, economic and environmental factors in Progressia that are likely to affect the future scenario outcomes of policies that aim to reconcile economic development with environmental sustainability (see Box 2 on dependencies).
7 ‘Kicking away the ladder’ as a concept was popularised by Cambridge development economist Ha-Joon Chang through his 2002 book, Kicking away the ladder: development strategy in historical perspective, where he broadly argued that developed countries were forbidding third-world countries from using methods and processes that they used.
8 In theory, the EKC is used to show that the two objectives can be pursued together, with increased economic growth auguring well for future environmental sustainability. It suggests that as economies grow they go through the structural transformation promoted by growth from primary production to manufacturing, and then to services.
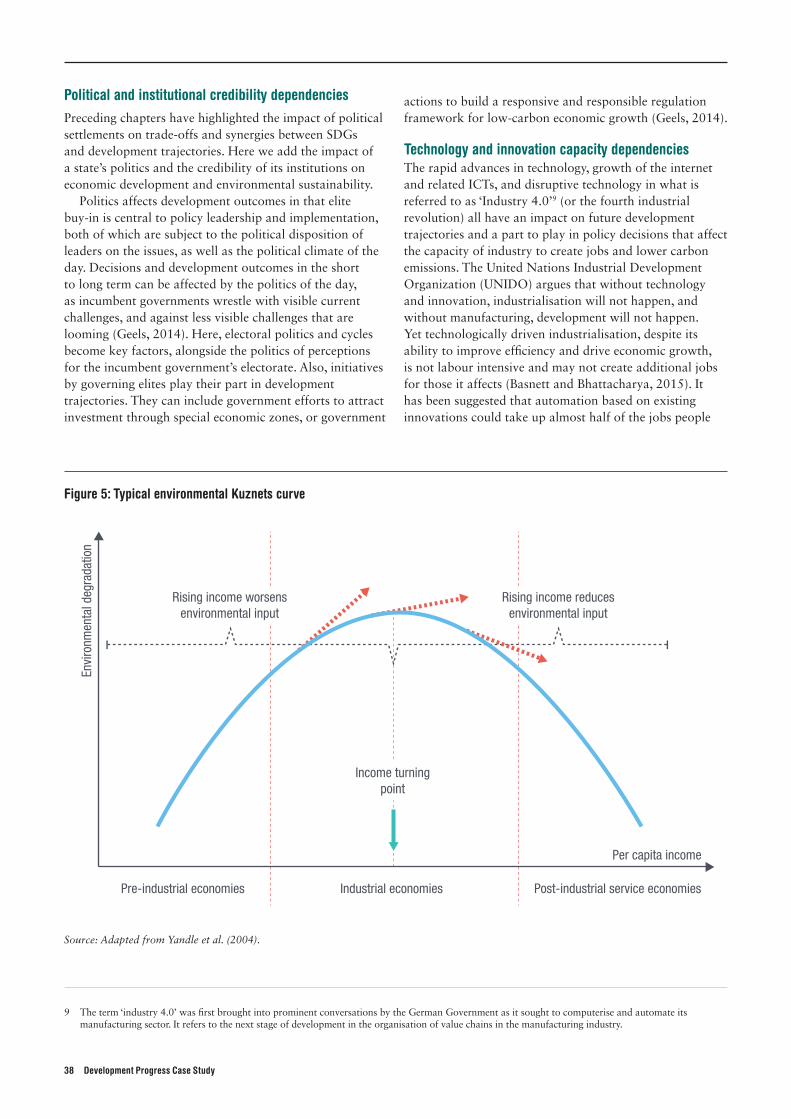
38 Development Progress Case Study
Political and institutional credibility dependenciesPreceding chapters have highlighted the impact of political settlements on trade-offs and synergies between SDGs and development trajectories. Here we add the impact of a state’s politics and the credibility of its institutions on economic development and environmental sustainability.
Politics affects development outcomes in that elite buy-in is central to policy leadership and implementation, both of which are subject to the political disposition of leaders on the issues, as well as the political climate of the day. Decisions and development outcomes in the short to long term can be affected by the politics of the day, as incumbent governments wrestle with visible current challenges, and against less visible challenges that are looming (Geels, 2014). Here, electoral politics and cycles become key factors, alongside the politics of perceptions for the incumbent government’s electorate. Also, initiatives by governing elites play their part in development trajectories. They can include government efforts to attract investment through special economic zones, or government
actions to build a responsive and responsible regulation framework for low-carbon economic growth (Geels, 2014).
Technology and innovation capacity dependenciesThe rapid advances in technology, growth of the internet and related ICTs, and disruptive technology in what is referred to as ‘Industry 4.0’9 (or the fourth industrial revolution) all have an impact on future development trajectories and a part to play in policy decisions that affect the capacity of industry to create jobs and lower carbon emissions. The United Nations Industrial Development Organization (UNIDO) argues that without technology and innovation, industrialisation will not happen, and without manufacturing, development will not happen. Yet technologically driven industrialisation, despite its ability to improve efficiency and drive economic growth, is not labour intensive and may not create additional jobs for those it affects (Basnett and Bhattacharya, 2015). It has been suggested that automation based on existing innovations could take up almost half of the jobs people
Figure 5: Typical environmental Kuznets curve
Envi
ronm
enta
l deg
rada
tion
Per capita income
Post-industrial service economiesIndustrial economiesPre-industrial economies
Income turningpoint
Rising income worsensenvironmental input
Rising income reducesenvironmental input
Source: Adapted from Yandle et al. (2004).
9 The term ‘industry 4.0’ was first brought into prominent conversations by the German Government as it sought to computerise and automate its manufacturing sector. It refers to the next stage of development in the organisation of value chains in the manufacturing industry.

The Sustainable Development Goals and their trade-offs 39
perform manually at present (McKinsey and Company, 2016). But, Gelb and Khan (2017) refute, arguing that while there will be job losses, they are likely to be far less than previously projected. Instead, jobs will take new forms, and will be reorganised across sectors. While industrialisation that is not high-tech may be labour intensive, it is also less energy efficient and will come with costs to the environment through increased carbon emissions. Policy-makers must grapple with these dilemmas, which will influence the way forward for the achievement of low-carbon economic growth, or will increase the market share of the manufacturing sector in global employment.
It is easy to tout technology and innovation as solutions to late industrialisation, but their adoption assumes that the technical capacity is in place or can be shared and that innovation is a given, without understanding that it follows on from incentives. Given the constant under-pricing of the environment in the current market system (since losses are not proximate), innovators have little incentive to develop technologies that reduce environmental depreciation (Dasgupta and Ehrlich, 2013), while the profit motive that can be bolstered by disruptive innovation (associated with BAU per capita growth) is clear to the innovator. This challenge is heightened by the lack of opportunities and capacity for African innovation – a lack that can be seen across the bulk of the continent, with the exceptions of Kenya and South Africa. There are 13 SSA countries in the World Economic Forum’s (WEF, 2016a) list of the world’s bottom 20 countries for innovation rankings. Low innovation capacity is tied to deficiencies in education systems. Despite expanding the quantity of education, which has led to improved human-development performance, these systems have not focused enough on STEM education (science, technology, engineering and mathematics) and their quality is often found wanting, which is a problem for manufacturing development and jobs (Jamme, 2015).
Labour-market dependenciesThere are several labour-market dependencies that will impact on the ability of African countries to meet targets for economic and environmental development. The first is that the African labour market is set to increase as the result of a demographic transition, which will see an increase in a productive age group that will outpace the rest of the world by 2160, and account for 80% of the world’s working-age population by 2100. As the United Nations Population Fund (UNFPA, 2014) notes, however, the big numbers come with significant opportunities, as well as big challenges. The demographic transition could become a dividend through the enlarged work force and, up to a certain point, its likely associations with economic growth. It could also become a burden if no measures are taken to invest in the youth bulge, especially through health, education and skills training. This is particularly
true given the labour-market realities in SSA, where some economies have low labour-absorption capacities and widespread unemployment and underemployment. The reality of this demographic transition needs to spark thinking about better prospects for jobs led by low-carbon economic growth.
Environmental and climate dependenciesSouthern Africa has always been a low emitter of GHGs and accounts for nearly 2.2% of the emissions worldwide (USAID, 2011). South Africa is the biggest emitter (accounting for over one third of Africa’s 3% share of global energy-related CO2 emissions) as a result of its use of fossil fuels in thermal power stations and cement manufacturing (OECD/IEA, 2015). Yet most African countries have signed international conventions on climate change, such as the UNFCCC and its attendant protocols, and at least 23 countries in SSA had submitted the UNFCCC National Adaptation Plans of Action (NAPA) by 2014 (UNFCCC, 2016). Such commitment could be put down to the fact that the impact of climate change is so close to home (recurrent droughts, heat waves, desertification, changing rainfall patterns, falling agricultural yields) for most African economies, which still rely on agriculture for economic growth and significant employment, as well as food security and sovereignty.
Even though it is a low emitter, Africa has a stake in climate change adaptation and mitigation debates and strategies – a stake that will become higher if reports are correct that temperature rises across the continent will exceed the global average (James and Washington, 2013), at possibly between 3 and 6°C (Intergovernmental Panel on Climate Change, 2014). The environmental costs of climate change are bound to be high, adding to the existing problems of recurrent droughts related to El Niño in southern Africa (Beilfuss, 2012) and extreme precipitation in eastern Africa (Hamadudu and Killingtveit, 2012) leading to rising sea levels. These changes will have dire economic, ecological and social costs inland and at the coasts, and in southern Africa they will create downstream problems related to hydro-electric power supply. This, in turn, may result in unmet power needs that will have an impact on industry’s productivity, with negative effects on its ability to increase its market share in employment.
At the same time, however, and as Granoff and Hogarth (2015) note, clean electricity energy will have a positive impact not just on people’s quality of life, but also on SDG targets around health, education and climate change. Lack of such energy would, of course, have an adverse impact on all of these. This, coupled with the reality that the biggest carbon-emissions culprits remain developed countries, is part of a decision-making context in which policies will aim to generate both manufacturing jobs and low-carbon economic growth. African leaders and policy-makers will have to overcome the temptations presented by political opportunities for grand-standing presented by the

historical record on the developed world’s culpability on carbon emissions.
The four dependencies outlined in this section are just some of the many variables that policy-makers need to consider as they think through their decisions on how to balance economic growth that produces jobs with environmental sustainability. The next section sets out four scenarios to delve more deeply into some of the puzzles and paradoxes that confront them.
5.4 Future scenarios in southern Africa: combining economic growth and environmental policies in Progressia
What would it look like if Progressia combined economic growth and environmental policies to increase manufacturing jobs as a contribution to overall jobs in the GDP while reducing carbon emissions?
This section explores four possible scenarios.
1. Scenario 1 (Good and Good outcomes): economic and environmental development outcomes are reconcilable and can be sustained.
2. Scenario 2 (Good and Bad outcomes): economic and environmental development outcomes present conflicting outcomes.
3. Scenario 3 (Bad and Good outcomes): sustainable economic and environmental development outcomes are difficult to reconcile.
4. Scenario 4 (Bad and Bad outcomes): economic and environmental development outcomes are simply irreconcilable.
40 Development Progress Case Study
Box 7: Scenario 1 (Good and Good outcomes): Economic and environmental development outcomes are reconcilable and can be sustained
Desirable: increased manufacturing jobs as a proportion of full economy jobs AND lowered environmental degradation and carbon emissions.
It is 2030, and a national holiday has been declared in Progressia to celebrate its progress towards sustainable development through its documented attainment of three quarters of the SDGs, and its firm position as an upper-middle-income country. The bulk of this achievement is attributed to the country’s visionary leadership, which in 2010 started an ambitious 20-year project to restructure the economy around high labour-absorbing low-carbon industrialisation, dubbed the ‘X-treme Green Development Revolution’ (XGDR). The project was conceptualised as a legacy project by the Government, and benefited from mainstreaming technological innovation in industry and ‘no regrets’ climate change policies. These incorporated the economics of ecosystems and biodiversity (TEEB) approach across different sectors of the economy. None of this would have been possible if Progressia had not created enabling legislation, which it did in 2016 on Renewable Energy and Energy Efficiency (REEE), becoming the first country in the region to move beyond policies and plans to legislating a legal framework for a low-carbon economy. As well as freeing public resources for a low-carbon agenda, the law has provided the legal safeguards that allow investments to pour into the energy and manufacturing sectors.
The legacy XGDR project captured the imagination of citizens with its references to ‘revolution’ from the outset, given the memories of Progressia’s national democratic revolution of the late 1980s. Young people were closely involved, leading various campaigns and using social media to share ideas. The ‘cool’ outlook and allusions to green development trended with more environmentally conscious and globally connected millennials and young adults, and the participatory nature of this group during the 2010-15 inception phase is credited with the success of the project. Evidence in 2030 shows that it has led to a cultural shift towards a green economy and climate-conscious responsibility among citizens. At the heart of the celebrations is the tremendous progress made in reducing unemployment from 32% in 2010 to just 7% by 2030, with the contribution of manufacturing jobs to the national jobs market rising from just over 9% in 2010 to 24% today. The nature of work has also changed. In 2010, most workers were found in the precarious informal economy, falling to 52% by 2020, and slumping even further, to 30%, by 2030, with millions more people in formal employment. This shift was allied to changes in work settings through a surge in manufacturing jobs between 2015 and 2025, which saw a significant proportion of workers leaving primary sectors such as agriculture to join the burgeoning manufacturing industry. This was also characterised by a growing emphasis on processing the goods supplied by primary sectors, based on refining grains, canning fruits and other agricultural outputs, as well as adding value to various mining products. As a result, industry’s contribution to GDP increased from 12% in 2010 to well over a quarter of GDP (28%) by 2027, where it has hovered ever since, plus or minus 1%. The economic story of Progressia has been dubbed the ‘X-treme Miracle’ for two reasons.
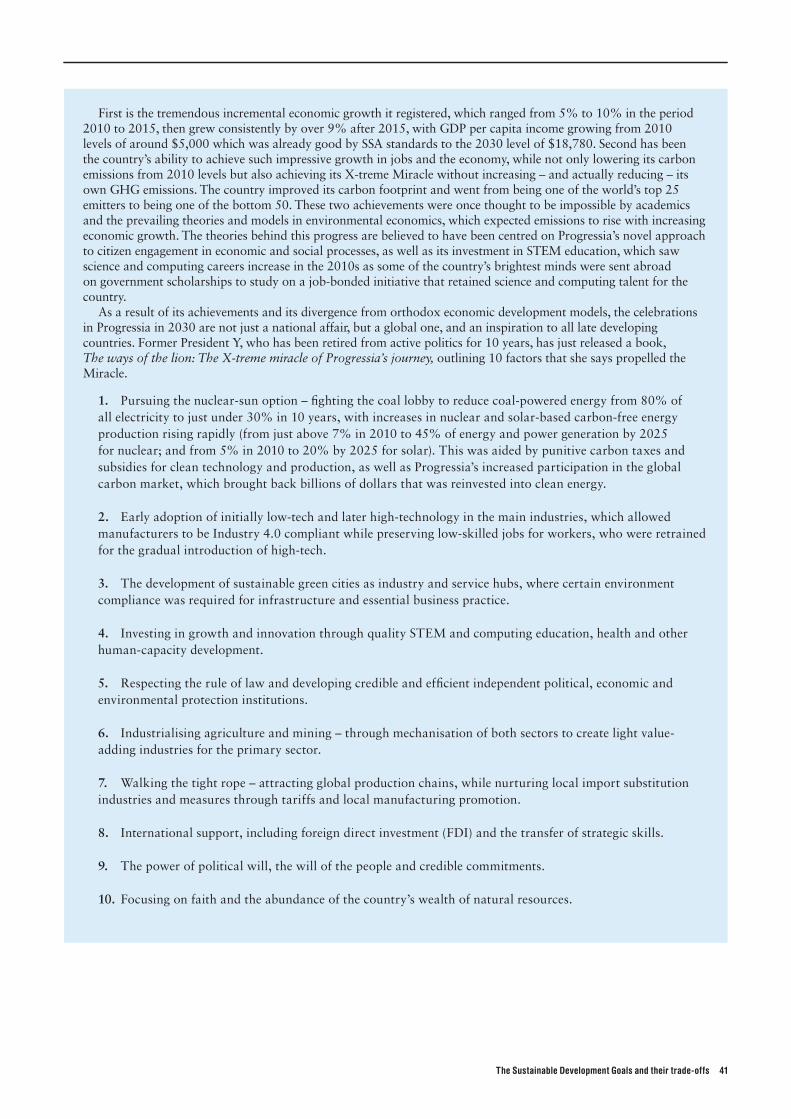
The Sustainable Development Goals and their trade-offs 41
First is the tremendous incremental economic growth it registered, which ranged from 5% to 10% in the period 2010 to 2015, then grew consistently by over 9% after 2015, with GDP per capita income growing from 2010 levels of around $5,000 which was already good by SSA standards to the 2030 level of $18,780. Second has been the country’s ability to achieve such impressive growth in jobs and the economy, while not only lowering its carbon emissions from 2010 levels but also achieving its X-treme Miracle without increasing – and actually reducing – its own GHG emissions. The country improved its carbon footprint and went from being one of the world’s top 25 emitters to being one of the bottom 50. These two achievements were once thought to be impossible by academics and the prevailing theories and models in environmental economics, which expected emissions to rise with increasing economic growth. The theories behind this progress are believed to have been centred on Progressia’s novel approach to citizen engagement in economic and social processes, as well as its investment in STEM education, which saw science and computing careers increase in the 2010s as some of the country’s brightest minds were sent abroad on government scholarships to study on a job-bonded initiative that retained science and computing talent for the country.
As a result of its achievements and its divergence from orthodox economic development models, the celebrations in Progressia in 2030 are not just a national affair, but a global one, and an inspiration to all late developing countries. Former President Y, who has been retired from active politics for 10 years, has just released a book, The ways of the lion: The X-treme miracle of Progressia’s journey, outlining 10 factors that she says propelled the Miracle.
1. Pursuing the nuclear-sun option – fighting the coal lobby to reduce coal-powered energy from 80% of all electricity to just under 30% in 10 years, with increases in nuclear and solar-based carbon-free energy production rising rapidly (from just above 7% in 2010 to 45% of energy and power generation by 2025 for nuclear; and from 5% in 2010 to 20% by 2025 for solar). This was aided by punitive carbon taxes and subsidies for clean technology and production, as well as Progressia’s increased participation in the global carbon market, which brought back billions of dollars that was reinvested into clean energy.
2. Early adoption of initially low-tech and later high-technology in the main industries, which allowed manufacturers to be Industry 4.0 compliant while preserving low-skilled jobs for workers, who were retrained for the gradual introduction of high-tech.
3. The development of sustainable green cities as industry and service hubs, where certain environment compliance was required for infrastructure and essential business practice.
4. Investing in growth and innovation through quality STEM and computing education, health and other human-capacity development.
5. Respecting the rule of law and developing credible and efficient independent political, economic and environmental protection institutions.
6. Industrialising agriculture and mining – through mechanisation of both sectors to create light value-adding industries for the primary sector.
7. Walking the tight rope – attracting global production chains, while nurturing local import substitution industries and measures through tariffs and local manufacturing promotion.
8. International support, including foreign direct investment (FDI) and the transfer of strategic skills.
9. The power of political will, the will of the people and credible commitments.
10. Focusing on faith and the abundance of the country’s wealth of natural resources.

42 Development Progress Case Study
Box 8: Scenario 2 (Good and Bad outcomes): Economic and environmental development outcomes present conflicting outcomes
Could play out! Reduced environmental degradation and carbon emissions BUT reduced economic growth and low proportion of manufacturing jobs
It is 2030, and Progressia finds itself on the horns of a dilemma, wondering how some parts of its national agenda can go so right while others go so wrong. After a period of continuous economic growth over 10 years, growth stalled in 2017 and has been vacillating between zero and negative growth ever since. The slowing down of the economy and its constant vulnerability to recession indicates the low production of its industries, which have been operating at less than 50% of capacity for some time because of financial challenges related to access to resources. As a result, many jobs in the sector have been lost, reducing manufacturing’s share of global employment from 9% to 7%, and its contribution to GDP has fallen from 12% in 2010 to 9% in 2030.
The Government has tried to industrialise, using fast catch-up approaches, and has invested major resources in supporting local businesses to retool factories. It struck a deal with Malaysia, which sent some of its manufacturing equipment to Progressia at subsidised rates, and organised a few training sessions on how to operate the machinery in manufacturing sectors covered in the bilateral agreement. However, the high-tech equipment soon became redundant, as a result of limited skills for its use and a lack of capacity to repair equipment when it broke down.
Progressia instituted a regime of strict investment conditions that included requirements for environmental protection and jobs creation. However, a combination of factors limit FDI: a low skills base; an under-developed manufacturing sector; punitive tax laws (including carbon-tax incentives); poor transport and communications infrastructure; unpredictable policy, political and business practices; and inflexible labour laws. The Chinese and Russians were able to negotiate separate bilateral agreements, which have brought in some FDI, but this has been targeted at natural resource extraction, with no local value addition and, therefore, no manufacturing industry jobs. As a result of the skills gap, the few skilled manufacturing jobs that exist are filled by skilled personnel from other SSA countries, and the few foreign manufacturing concerns that have aided job creation and the economy in the past are leaving because of the constraints listed above and the increasingly challenging business environment. The rest of the economy continues to be based on the primary sectors of mining and agriculture, but the country has remained a net exporter of raw materials, with no visible capacity for value-adding initiatives on its raw materials.
All of this has stunted growth, and pushed more of Progressia’s citizens into employment in the informal sector. There are now more protests, a signal that the Government has failed the performance legitimacy test, and its treatment of dissent suggests its lack of respect for civil liberties. Some ‘progress’ has, however, been made on environmental protection and lowering carbon emissions. Various factors have contributed to emissions decline, including the implementation of a sound climate change adaptation ‘no regrets’ policy, the introduction of carbon taxes to stem carbon emissions and subsidies for industries using clean energy, and the development of low-tech household appliances based on clean-energy. The country has also benefited from a huge endowment for climate change adaptation from various western countries, which it has put to good use.
Another factor in the success in lowering carbon emissions has been the commitment of the Government to climate change adaptation and mitigation. This has been clear through the current President’s involvement in global climate change platforms and his leadership in promoting new agricultural methods that support the environment. This strong show of political will has led to government and its allied bodies falling into line, and has seen the mainstreaming of climate change policies across all sectors. While there have been dividends in the environmental and (partly) agricultural sectors, these have not spread to other areas of the economy. Hence the bittersweet state of affairs in the country. While the environmental changes are noteworthy, one school of thought suggests that more is needed than the execution of good policy; Progressia’s emissions-reduction strategy was an unwitting beneficiary of the slowdown in manufacturing. As such, some climate change watchdogs in Progressia argue that the use of fossil fuels has not been reduced, but that the entities that use them have been cut, while other critics have blamed the Government for its lack of a big-picture mentality and its tendency to cherry-pick projects based not on national interest but on the President’s whims.
The Sustainable Development Goals and their trade-offs 43
Box 9: Scenario 3 (Bad and Good outcomes): Sustainable economic and environmental development outcomes are difficult to reconcile
Not too bad? Increased environmental degradation and carbon emissions BUT increased economic growth and manufacturing jobs
It is 2030 and Progressia’s economy seems to be ticking all the right boxes. GDP has held steady, growing at a rate of 5-9% since 2015, on the strength of performances by the productive sectors of the economy, especially manufacturing. This sector has seen its contribution to GDP increase from 12% in 2010 to 32% in 2030, while its employment participation has increased from 14% in 2015 to 29% today.
The Asia-inspired economic boom has centred on serious promotion by the Government of heavy and light industries concentrated around major sub-sectors of food processing, automobile assembly, clothing, cement production and chemicals. Given its central location within southern Africa, Progressia has become a manufacturing hub for these sub-sectors for the entire region of the Southern African Development Community (SADC), because of its clear comparative advantage over its regional peers. Some, however – particularly international bodies – have warned that the country’s economic growth is not sustainable as it is based on the heavy use of fossil fuels, and have urged it to make a structural shift in its economic activities to reduce global carbon emissions. These warnings have fallen on deaf ears, or have been met with a political narrative in which the former imperialists want to impede national growth through hypocrisy (warning it not to use the methods that they used to develop) and their fear of Progressia as a ‘rising star’.
This view has gained traction in Progressia and in other African countries that admire its growth and ability to take on the developed world. In other markets, however, its products are beginning to be shunned by consumers who prefer commodities from countries where it is evident that manufacturing has more care for the environment, and where better-quality products are made thanks to the introduction of technology into production lines. Its position has been to limit technological interventions in its industries to avert job losses, which the Government calculates carry heavy political risks.
As a result, Progressia has been reneging on its INDC on adaptation, mitigation (and finance and investment requirements for both) since 2025, falling foul of the international spirit of the 2015 Paris Declaration of ‘no-backsliding’ and ‘progressive’ approaches to climate change. This disregard of international commitments has made investors nervous about its ability to stick to agreements. This fear, together with consumer boycotts abroad, are eating away at its exports and experts have warned that this trend will escalate, but the country has blamed the emerging downturn on enemy action by former imperialists. There is now ample evidence of environmental degradation through the nondescript environmental exploitation that has spurred national economic development. As a result, Progressia has become a major emitter of carbon, contributing almost half of the SADC’s emissions, and its forests and green spaces are disappearing. Carbon emissions are rising as a result of the extensive and unregulated use of fossil fuels, especially coal, which the country has in abundance, and in which some members of Government are rumoured to have interests.
Environmental economists have warned that current economic growth is unsustainable, and that the lack of state regulations, policies or interest in climate realities could have dire consequences, including the contamination of water bodies, polluted cities with high carbon emissions, and new gases produced by the heavy industries that have been spurring growth. Other economists have argued in support of Progressia, claiming that the process of increased carbon emissions is a natural part of economic growth, which should pave the way for greater environmental concerns in the near future.
44 Development Progress Case Study
Box 10: Scenario 4 (Bad and Bad outcomes): Economic and environmental development outcomes are simply irreconcilable
Oh snap! Limited economic growth and no increase in manufacturing jobs as a proportion of total employment BUT decreased environmental degradation and reduced carbon emissions
It is 2030, and Progressia has struggled to implement policies and programmes that encompass the creation of manufacturing jobs that, in turn, create economic growth AND low carbon emissions. The economy flat-lined in 2017, after 10 years of limited growth, and went into recession in 2025. This led to slumps in the manufacturing industry’s production capacity and to job losses, with its share of employment falling from 9% in 2010 to just 7% in 2030, and a reduction in the sector’s contribution to GDP from 12% in 2010 to 7% in 2030.
The urgent economic situation has led to a series of short-term (average: two years) economic programmes since 2018, focusing on sectors that Progressia thought would kick-start its economy: agriculture, mining, industry and tourism. The programmes and sectors did not have the rapid success that had been expected. Investors saw short-term measures as signs of uncertainty and decided to wait for clearer long-term programmes.
In 2021, the Ministry of International Trade started a global ‘Invest in X’ campaign, staging international road shows to showcase country opportunities, which attracted some potential investors in iron and steel, and telephone manufacturing companies. Unfortunately, there was a major and public row in national papers between the Ministry of Mines and Ministry of Finance in 2023, with the Mines Ministry accusing the Finance Ministry of not giving enough support to the mining sector. The Ministry of Finance responded by saying it could not give what it didn’t have, and accused the Mines Ministry of colluding with foreign mining concerns to rob the country through tax avoidance and secret payments to Mining Ministry officials. The Ministry of Finance advocated that several mining claims of foreign companies be withdrawn. This argument alarmed potential investors: Brazilian investors who had planned to invest in the iron and steel industries walked away from the deal.
Although the Government of Progressia has tried to industrialise using fast catch-up approaches and spent major resources on support for local businesses to retool factories, the flat-lining economy has meant that several ambitious programmes around industry, energy, education and the environment have had to be put on hold.
The country also instituted a regime of strict investment conditions that included requirements for environmental protection and jobs creation. However, a combination of factors limit FDI: a low skills base; an under-developed manufacturing sector; punitive tax laws (including carbon-tax incentives); poor transport and communications infrastructure; unpredictable policy, political and business practices; and an inflexible labour-law regime.
As a result of its stymied economic growth, it is seeing more protests against the Government’s economic stewardship, and these protests are calling ever more loudly for the country’s leadership to step down. The Government has responded swiftly, arresting dissenters and silencing critics by criminalising their efforts, alongside the enforced disappearance of dissidents.
Progressia has been reneging on its INDC on adaptation, mitigation (and finance and investment requirements for both) since 2025, falling foul of the international spirit of the 2015 Paris Declaration of ‘no-backsliding’ and ‘progressive’ approaches to climate change. This disregard of international commitments has made investors nervous about the country’s ability to stick to agreements. This fear, together with consumer boycotts abroad, is eating away at its exports, and experts have warned that this trend will escalate.
There is now ample evidence of environmental degradation and higher carbon emissions. The Ministry of Environment has attempted to introduce climate change policies and a law based on the Ministry’s Green Growth Development Plan, following best practice from Uganda’s 2016 experiences and South Africa’s constitutionalisation of environment and climate change concerns. Other ministries, however, have been resistant, arguing that such policies and their restrictions will hamper investment and development in their areas. The Minister of Industry and the Minister of Energy are the biggest critics, arguing that Progressia needs to spur development using the fossil fuels that it has in such abundance. Other attempts by the Environment Ministry to get the rest of the Government behind a ‘no regrets’ infrastructural development plan based on energy-efficient and environmentally friendly structures have also faced resistance.
Some sectors of the Government have argued that the framework is based on supposition, and that no government should waste resources on ‘what ifs’ when there are immediate challenges to be tackled. Some, however, see the efficacy of the plans, and have begun to encourage their mainstreaming at sectoral level. However, erratic and haphazard implementation means that the results, on the whole, are unimpressive and fraught with too many variations.
Leading economists and scholars in the country have warned that environmental challenges need to be taken seriously and that if the Government doesn’t act now, the costs will be 20-fold within the decade. They have been dismissed as nay-sayers and opposition elements that are trying to cause trouble and fuel the protests taking place. Nondescript environmental exploitation is now the order of the day, with the Environmental Protection Authority hamstrung because of government intervention to protect unscrupulous polluters and exploiters of the environment.

The Sustainable Development Goals and their trade-offs 45
5.5 Reconciling economic growth and sustainable environments: policy implications
This section aims to discuss the scenarios using real-country examples of where trade-offs have been delivered. Scenarios 1 to 4 showed the different futures that are possible in the nexus between economic development to create jobs and environmental development to reduce carbon emissions. Each scenario highlighted different synergies and trade-offs.
Scenario 1 paints a desirable future where economic growth creates jobs in the manufacturing sector without harming the environment and reducing carbon emissions. Much of the scholarship on the nexus between the environment and economic growth suggests that this desirable outcome is not achievable because of the inherent trade-offs between naturally competing interests (Redclift, 2005; Brown et al., 2014; Brown, 2015; Spaiser et al., 2016). This argument benefits from theoretical and empirical findings associated with the environmental Kuznets curve and historical precedents. These have shown that economic development, and structural transitions from primary to secondary production through industrialisation, have harmed the environment and increased carbon emissions even as they have improved access to jobs and led to increases in both GDP and GDP per capita (Grossman and Krueger, 1994), before reducing environmental damage as economies make the transition to the services sector.
This is not in dispute. What is, is continuing to base future outcomes on such conclusions in a context that is changing so rapidly. So, how do we reconcile historical facts on economic and environmental development progress, with today’s pursuit of dual gains for the economy and job creation tied to protecting the environment through reducing emissions?
In 2001, futurist and Google Chief Engineer Ray Kurzweil (Kurzweil, 2004) remarked that the world was changing at such a fast rate because of computing and technology that 20,000 years of progress would be crammed into the next 100 years. If true, this means the redundancy of historical lessons learned in some areas, as there are technologies developed in the past decade that could drive economic growth and development while limiting economic degradation. As we have noted, UNIDO (2016) argues that industrialisation will not happen without technology and innovation, and development will not happen without industrialisation. The question that creates headaches for policy-makers is: will such development and economic growth include growth in manufacturing jobs?
The four scenarios present possible synergies and trade-offs between economic growth and environmental protection centred on building low-carbon economies. They highlight key elements that can foster or impede
synergies between the two goals and that planners and policy-makers need to bear in mind. In the next section we highlight some of these issues that are interconnected, cut across scenarios, and emerged as key lessons from ODI’s Development Progress case studies.
Holistic/integrated approachesA holistic approach to development is the starting point for successful futures with limited trade-offs and more catalytic synergies between economic growth interests and climate change adaptation (Endle et al., 2012). Part of the unintended trade-offs between goals emanates from silo-based approaches to development. A comprehensive approach allows different sectors to take on board and calculate in advance the trade-offs and synergies likely to be faced by various sectoral interests, making it possible to factor in mitigation well before implementation to limit negative impacts. For example, rather than looking at low carbon emissions as an industry or energy problem, it is seen as a national challenge because of the cross-cutting benefits of a healthy environment and the cross-cutting impacts of climate change. Such a perspective can foster the mainstreaming of low carbon emissions or their position at the centre of economic, social and political development, as in Progressia, with its national focus on building a low-carbon economy.
Development Progress case studies have shown excellent results in countries that have adopted such an approach.
• Ethiopia, for example, took a holistic and integrated approach, centring government policy on the goal of poverty eradication and taking a multidimensional approach to its achievement. This encouraged different line ministries to work together more comprehensively and consistently on poverty-reduction measures. This led to the integration of social sectors into broader economic planning, and tremendous successes in the reduction of poverty from 63% in 1995 to 37% in 2011. There were also gains in education, health and employment (Granoff et al. 2015; Lenhardt, 2015).
• Costa Rica in the driver’s seat and with strong partnerships among donors, the private sector, and civil society, the country established a holistic policy for Conservation Areas. This entailed effective legislation, including a ban on future land-use change on all forested land along with innovative incentive structures which provided direct financial incentives to landowners to conserve forests instead of converting them to agricultural land. This policy approach not only improved the country’s total forest cover, but also household nutrition security (Brown and Bird, 2011).
Economic restructuring for carbon reductionThe holistic or integrated approach can allow policy-makers to tackle entrenched interests that may present

46 Development Progress Case Study
barriers to structural shifts. In Africa, for example, where the production of fossil fuels attracts government subsidies of over $25 billion each year (Whitley and van der Burg, 2015), vested interests are entrenched and change will not be easy. Integrated and holistic approaches can, however, allow for the redeployment of national resources and assets towards clean energy by promoting private-sector renewable energy development for use in industries. The subsidies can then be removed, and actors are incentivised to invest in other energy sources, taking care of their own interests while redeploying public assets towards green growth. South Africa, for example, still relies on fossil fuels in its industry and transport sectors, but has begun to increase clean energy through nuclear, solar and other renewable sources of energy. It has also begun to encourage private energy suppliers to invest in such forms of energy through its Renewable Energy Independent Power Producer Procurement Programme (REI4P) to supply the nation. This initiative has already approved 79 renewable energy projects, which have attracted private investment of over $16 billion (South Africa INDC, 2016).
Long-term planning and phasingTechnology will, no doubt, drive economic development and the new shape of Manufacturing (see Deloitte, 2016; KPMG, 2016; UNIDO, 2016). However, accepting this reality means accepting that the rates of uptake of technology or even the appropriateness of these rates must be phased. Making optimum use of technology is about more than just accessing and using technology: it means adapting to it and knowing when to use it in the manufacturing sector. Long-term plans allow policy-makers to phase processes. Byiers and colleagues’ (2015a) case study, which examines manufacturing and employment progress in Sri Lanka, is an excellent illustration of a long-term planning and phasing approach. In their case study, Byiers et al. (2015a: 9) touch on some of the critical questions regarding trade-offs and tensions faced in achieving employment progress:
• What is a suitable balance of government intervention in the economy?
• How can an economy sustainably attract investment and promote employment through incentives?
• What is needed to develop effective systems for upgrading human capital and matching skills to jobs?
• How can an economy capitalise on labour migration while promoting inclusive labour markets?
In their findings, they argue that long-term adherence to a hybridised manufacturing policy agenda of outward market orientation reflected the combination of policies that supported state-owned enterprises, public employment, public investment policies, and policies to promote domestic and foreign investment into export processing zones, despite a state-led market intervention.
But for a holistic progress picture, a deliberate long-term attention to education and vocational training provided the much-needed policy consistency and predictability despite a civil war in 1983-2009. This long-term planning and phasing policy approach characterised by promoting a market economy alongside large, state-led interventions has proven beneficial for employment growth (ibid.). This can allow policy-makers to plan for redundancies in employment, while the private sector and the public sector invest in building an up-skilled workforce to deal with the new technological prerequisites. Phasing that allows technology’s trade-offs to be negotiated and, where possible, negated, is a critical factor in the decisions made by policy-makers grappling with trade-offs between different goals. In addition, well-phased technological insertion in industrial manufacturing depends on the sector and phase of manufacturing development.
For most countries in SSA, the good economic performance of the past 15 years provides the basis to move on to industrial development. However, the transition is not from agriculture to heavy industry, but to light manufacturing industry around agro-processing. Most light manufacturing sectors that are often the starting point of industrialisation (such as clothing, food processing agribusiness, metal products and so on), could generate high incomes and more jobs, and may not be as technology-heavy as the talk about Industry 4.0 may suggest, while this would be the case for the transitioning from light to heavy manufacturing.
Political will and elite buy-inThe central role of political will in success cannot be under-rated in countries where institutions are still finding their way towards independence (Vandemoortele and Bird, 2011). The scenarios for Progressia highlight this dynamic, and show that trade-offs are better when they are guided not by a leader’s personal whims but by strategic calculation, while synergies function better when leaders are collectively on board. Any other approach creates noise in the economic environment, which affects the ability of policy-makers to implement synergistic policies, and signals investment inertia at home and abroad (ibid).
For example, Ethiopia’s climate change adaptation processes, allied to industry and job creation, demonstrate the importance of leadership will and buy-in. Although Jones and Carabine (2013) note some challenges around capacity and process design, they laud the pioneering work of the Ethiopian Government on mainstreaming climate strategy into broader development frameworks through its Climate Resilient Green Growth national strategy. The strong leadership and support of the process from politicians at the highest levels of government was one of the factors that drove the successful development of this holistic strategy. Jones and Carabine point, in particular, to the championing role played by Prime Minister Meles Zenawi in the development of this ambitious 15-year

The Sustainable Development Goals and their trade-offs 47
low-carbon economic strategy as being central to galvanising government and the nation.
Similar trends are also reported in the Development Progress case studies in Malawi (Vandemoortele and Bird, 2011a) and Costa Rica (Brown and Bird, 2011). In Malawi President Bingu wa Mutharika’s development policy emphasises infrastructure and agricultural development (aimed at food security), while maintaining fiscal discipline, arresting corruption and implementing public sector fertiliser subsidy – all demonstrative of a widespread political support (Vandemoortele and Bird, 2011). In Costa Rica, the support of local government and national leaders built the much celebrated, decades-long Protected Area system. At the end of 2010, an estimated 24% of the country’s protected lands were in the public domain and under absolute protection. Brown and Bird (2011) argue that political will and elite buy-in, alongside sustained growth and overall continuation of the Protected Area system for ecotourism and environmental benefits, is likely to be sustained in the future.
The primacy of institutionsThe Progressia scenarios also highlight the importance of institutions. While structural change to economies and the processes that drive low-carbon growth may be driven by in-country factors, external factors like FDI and climate change adaptation and mitigation support are encouraged or dissuaded on the basis of in-country developments. This is critical for SSA countries, given the high costs of both economic development and environmental sustainability. The costs of meeting the climate challenge and sponsoring
low-carbon economic growth for Africa within the SDG 2030 timeframe are estimated at between $52 billion and $68 billion (Africa Carbon Asset Development Facility) (UNEP, 2009) and UNEP DTU Partnership (formerly UNEP Riso Center (UNEPDTU Partnership, 2016)), and between $510 billion and $675 billion, respectively (Pan African Climate Justice Alliance, 2016).
While African governments can look to private funds to sponsor part of this agenda, the bulk of funds required would need FDI. Mobilising the kind of resources necessary from private and foreign capital depends on the credibility of African political and economic, as well as environmental, institutions. Capital requires predictability, consistency and integrity. If institutions lack credibility and integrity, and the policy environment is not predictable and consistent, capital shies away or takes flight. Therefore, the integrity of the rules of the political and economic processes and allied property protection regimes have to be attractive to capital. In addition, the rule-of-law institutions and environmental sustainability requirements – taxation, expectations and penalties – as well as business and political ethics and financial institutions, all have to be credible and predictable (Jones and Carabine, 2013). In the absence of these conditions, the cost of doing business rises, and the dangers associated with erratic rules and policy implementation will keep FDI at arm’s length, blocking the chances of getting the requisite resources to combat climate change, promote jobs and create low-carbon economic growth (Pan African Climate Justice Alliance, 2016).
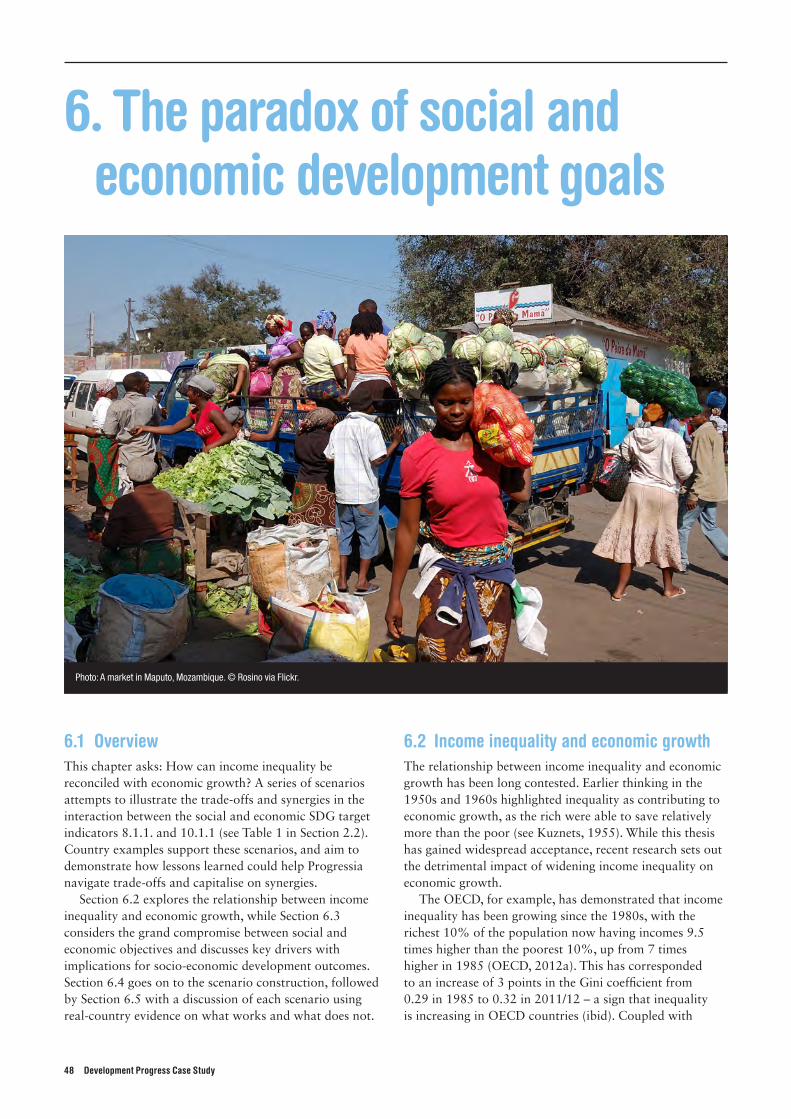
48 Development Progress Case Study
6. The paradox of social and economic development goals
Photo: A market in Maputo, Mozambique. © Rosino via Flickr.
6.1 Overview This chapter asks: How can income inequality be reconciled with economic growth? A series of scenarios attempts to illustrate the trade-offs and synergies in the interaction between the social and economic SDG target indicators 8.1.1. and 10.1.1 (see Table 1 in Section 2.2). Country examples support these scenarios, and aim to demonstrate how lessons learned could help Progressia navigate trade-offs and capitalise on synergies.
Section 6.2 explores the relationship between income inequality and economic growth, while Section 6.3 considers the grand compromise between social and economic objectives and discusses key drivers with implications for socio-economic development outcomes. Section 6.4 goes on to the scenario construction, followed by Section 6.5 with a discussion of each scenario using real-country evidence on what works and what does not.
6.2 Income inequality and economic growthThe relationship between income inequality and economic growth has been long contested. Earlier thinking in the 1950s and 1960s highlighted inequality as contributing to economic growth, as the rich were able to save relatively more than the poor (see Kuznets, 1955). While this thesis has gained widespread acceptance, recent research sets out the detrimental impact of widening income inequality on economic growth.
The OECD, for example, has demonstrated that income inequality has been growing since the 1980s, with the richest 10% of the population now having incomes 9.5 times higher than the poorest 10%, up from 7 times higher in 1985 (OECD, 2012a). This has corresponded to an increase of 3 points in the Gini coefficient from 0.29 in 1985 to 0.32 in 2011/12 – a sign that inequality is increasing in OECD countries (ibid). Coupled with
The Sustainable Development Goals and their trade-offs 49
this, economic growth was estimated to have declined by 0.35% per year for the same 25-year period, which equates to an overall loss of 8.5% of GDP across OECD countries. The biggest difference seen was between households in the bottom 40% of incomes and the rest of the population. This reveals an inverse relationship between the social and economic SDGs: more specifically, that economic growth declines as inequality increases (OECD, 2012b).
It falls to governments to address the balance between economic growth and income inequality, through the use of redistributive policies such as taxes and social protection systems. Redistribution scholars such as Ostry et al. (2014) argue that redistribution of economic growth has no harmful effect. Indeed, they find inequality harmful for economic growth, even when controlling for redistribution. The debate around suitable forms of redistribution is an important one, but our scenario aims to demonstrate how high and low economic growth affects income inequality, and what countries can do to avert trade-offs and harness synergies.
It is possible to achieve sustained and strong economic growth through diversification, a skilled labour force, developing industry and manufacturing, technological innovation, tapping natural resources and increasing exports. Synergies can be created through policies that improve access to education and employment, and social protection mechanisms that target the poor.
6.3 The grand compromise between social and economic development
Many countries have undergone difficult trade-offs and have emerged from periods of stagnation and lack of growth. Transitioning to scenarios where synergies are maximised and trade-offs are handled is ideal, but this may take longer or may not happen at all in particular countries, depending on their approach. Our scenarios aim to address some of the key drivers that are thought to have an impact on economic growth and income inequalities, and consider how countries can manage trade-offs and promote synergies. To begin, we address some of the key dependencies that have an independent influence on economic growth and income inequality (see Box 2 on dependency paths).
Technological dependencies Recent advancements in technology have allowed greater economic growth, and this will likely continue to be an important growth sector in developing countries. Global retail sales via the internet, for example, reached $700 billion in 2013 and this figure is expected to more than double by 2018 to $1.5 trillion. Though total sales are expected to rise consistently, the rate of growth is thought to be slowing, particularly in countries where internet penetration is already very high and a large proportion of the population use it to buy goods and
services (Euromonitor, 2014). In the UK, for example, over 70% of the population uses the internet to buy goods and services, compared to less than 5% of the population in South Africa (UNCTAD, 2015). There are clear inequalities in access to technology, however, which raises questions about how technological advancements can aid economic growth while benefiting the bottom 40% of the population. In SSA, for example, there are currently 370 million mobile subscribers – a figure set to reach 400 million by 2020 – yet this is still less than half of the total population (GSMA, 2015). It is estimated that 4 billion of the world’s 7 billion people still do not have access to the internet and are therefore unlikely to feel the benefits of technology-driven growth (WEF, 2016b). Many of those without access to services are in rural areas, and it is likely that, given the lack of investment in rural infrastructure, they will not benefit from increased economic growth or access to improved public services that are supported by mobile proliferation.
Demographic dependenciesCities continue to be the locus of economic growth for countries, therefore ever more people will move to urban areas for work. At the same time, this growth will fuel inequalities in the form of informal work, poor quality services, and housing and wage gaps. In Uganda, for example, the wages of people working in urban versus rural employment were roughly 1.5 times higher in 2005. By 2010, their wages were nearly three times higher – a doubling of the gap (Young, 2013). This trend seems to increase in cities that are larger economic hubs, such as Kampala, where the ratio of income relative to other urban areas in Uganda increased by 30% during the same period (Buckley and Simet, 2016). This familiar trend in developing countries continues to create trade-offs related to standards and affordability of housing in urban centres, and raises the question of how demographic shifts such as urbanisation can aid economic growth while benefiting the bottom 40% of the population.
Political and governance dependenciesUnemployment is one of the biggest challenges facing developing countries, particularly in SSA where roughly 40% of the population is under the age of 15, and nearly 70% is under 30 (Lin, 2012). Demographic issues aside, the political dimension to youth unemployment often lies in strong education policy, in particular vocational education and training (VET), as well as active labour market policies.
Contexts with high economic growth cannot guarantee jobs for youth, as witnessed in Uganda where the government has not invested sufficiently in vocational training for youth despite broad macroeconomic stability. While entrepreneurship was introduced as a subject within higher and further education, as well as the creation of business, technical and vocational education and training

50 Development Progress Case Study
Box 11: Scenario 1 (Good and Good outcomes): High economic growth and low income inequality are reconcilable outcomes and can be sustained
Desirable: increased economic growth and reduced income inequality
It is 2030, and Progressia is generating large inflows of FDI through well-developed manufacturing, financial and ICT sectors. The manufacturing sector has progressed from large-scale, low-quality products to lower-scale but higher-quality goods. The finance and ICT sectors have grown and now account for the largest proportion of national income.
These developments, combined with progressive fiscal policies implemented over the past 15 years, have seen the economy grow consistently by more than 7% every year for the past decade, in line with the SDG targets set in 2015. The development of special economic zones has given businesses tax incentives to set up, and has helped to drive economic growth and encourage the growth of a productive labour force. International trade agreements and greater liberalisation have removed import and export duties on particular goods and boosted exports. The result has been a growth of small and medium-sized enterprises (SMEs) around high-quality manufactured goods, such as textiles and machinery. The country has also paid off its foreign debt, thanks to years of careful public spending, which has generated beneficial synergies in the form of adequate spending on the quality of public services.
Other synergies include investment in education. This has improved the quality of services on offer as new schools have been built to keep pace with the growing youth population, alongside greater investments in educational materials, facilities and teachers. Investment has also ensured access to education for all girls, with enrolment rates at 100% for girls under the age of 16. As a result, a progressive, highly educated, gender-balanced labour force has emerged, which has allowed the country to sustain its growth in the technology and finance sectors. Many of the working-age population have improved their financial positions and are now out-performing their parents in terms of their education and income.
This innovative and entrepreneurial generation has developed new technologies, such as exercise and nutritional apps, which have improved living standards and reduced inequalities for people. Given the continued investments in the health system, life expectancy has improved for the entire population and the gap between rich and poor is narrowing. Pensioners can expect to retire in moderate comfort with state pensions, which would have been a distant dream for their parents’ generation in the 1990s.
Such positive growth has also resulted in the reinvestment of profits back into the economy, which has helped to redistribute wealth. Progressive taxation systems have ensured that public funds have been redistributed evenly across society, and, as part of this, social protection systems have been state funded to support those in the greatest need to escape from poverty.
(BTVET) schemes (Ahaibwe and Mbowa, 2014), these schemes are often run by small private enterprises with insufficient government funding and suffer from low enrolment rates. It has been suggested, therefore, that governments invest in improving the skills of youth, remove constraints faced by the private sector, and prioritise industrialisation to improve economic growth and income inequality (ibid.).
6.4 Future scenarios in southern Africa: combining economic growth and income equality
Does inequality in the distribution of income rise or fall during Progressia’s economic growth or decline?
This section sets out four possible scenarios:
1. Scenario 1 (Good and Good outcomes): high economic growth and low income inequality are reconcilable outcomes and can be sustained.
2. Scenario 2 (Good and Bad outcomes): high economic growth and reduced income inequality present conflicting outcomes.
3. Scenario 3 (Bad and Good outcomes): high economic growth and reduced income inequality are paradoxical outcomes.
4. Scenario 4 (Bad and Bad outcomes): economic growth and income inequality are an unsustainable combination.
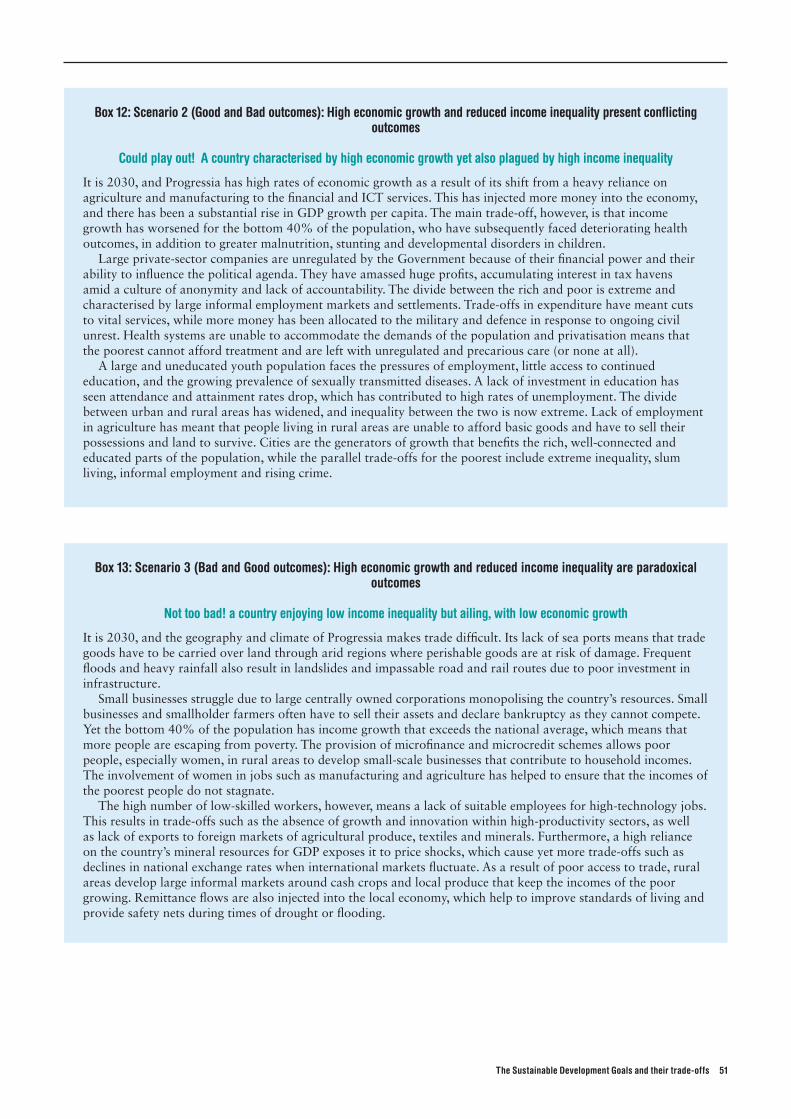
The Sustainable Development Goals and their trade-offs 51
Box 12: Scenario 2 (Good and Bad outcomes): High economic growth and reduced income inequality present conflicting outcomes
Could play out! A country characterised by high economic growth yet also plagued by high income inequality
It is 2030, and Progressia has high rates of economic growth as a result of its shift from a heavy reliance on agriculture and manufacturing to the financial and ICT services. This has injected more money into the economy, and there has been a substantial rise in GDP growth per capita. The main trade-off, however, is that income growth has worsened for the bottom 40% of the population, who have subsequently faced deteriorating health outcomes, in addition to greater malnutrition, stunting and developmental disorders in children.
Large private-sector companies are unregulated by the Government because of their financial power and their ability to influence the political agenda. They have amassed huge profits, accumulating interest in tax havens amid a culture of anonymity and lack of accountability. The divide between the rich and poor is extreme and characterised by large informal employment markets and settlements. Trade-offs in expenditure have meant cuts to vital services, while more money has been allocated to the military and defence in response to ongoing civil unrest. Health systems are unable to accommodate the demands of the population and privatisation means that the poorest cannot afford treatment and are left with unregulated and precarious care (or none at all).
A large and uneducated youth population faces the pressures of employment, little access to continued education, and the growing prevalence of sexually transmitted diseases. A lack of investment in education has seen attendance and attainment rates drop, which has contributed to high rates of unemployment. The divide between urban and rural areas has widened, and inequality between the two is now extreme. Lack of employment in agriculture has meant that people living in rural areas are unable to afford basic goods and have to sell their possessions and land to survive. Cities are the generators of growth that benefits the rich, well-connected and educated parts of the population, while the parallel trade-offs for the poorest include extreme inequality, slum living, informal employment and rising crime.
Box 13: Scenario 3 (Bad and Good outcomes): High economic growth and reduced income inequality are paradoxical outcomes
Not too bad! a country enjoying low income inequality but ailing, with low economic growth
It is 2030, and the geography and climate of Progressia makes trade difficult. Its lack of sea ports means that trade goods have to be carried over land through arid regions where perishable goods are at risk of damage. Frequent floods and heavy rainfall also result in landslides and impassable road and rail routes due to poor investment in infrastructure.
Small businesses struggle due to large centrally owned corporations monopolising the country’s resources. Small businesses and smallholder farmers often have to sell their assets and declare bankruptcy as they cannot compete. Yet the bottom 40% of the population has income growth that exceeds the national average, which means that more people are escaping from poverty. The provision of microfinance and microcredit schemes allows poor people, especially women, in rural areas to develop small-scale businesses that contribute to household incomes. The involvement of women in jobs such as manufacturing and agriculture has helped to ensure that the incomes of the poorest people do not stagnate.
The high number of low-skilled workers, however, means a lack of suitable employees for high-technology jobs. This results in trade-offs such as the absence of growth and innovation within high-productivity sectors, as well as lack of exports to foreign markets of agricultural produce, textiles and minerals. Furthermore, a high reliance on the country’s mineral resources for GDP exposes it to price shocks, which cause yet more trade-offs such as declines in national exchange rates when international markets fluctuate. As a result of poor access to trade, rural areas develop large informal markets around cash crops and local produce that keep the incomes of the poor growing. Remittance flows are also injected into the local economy, which help to improve standards of living and provide safety nets during times of drought or flooding.
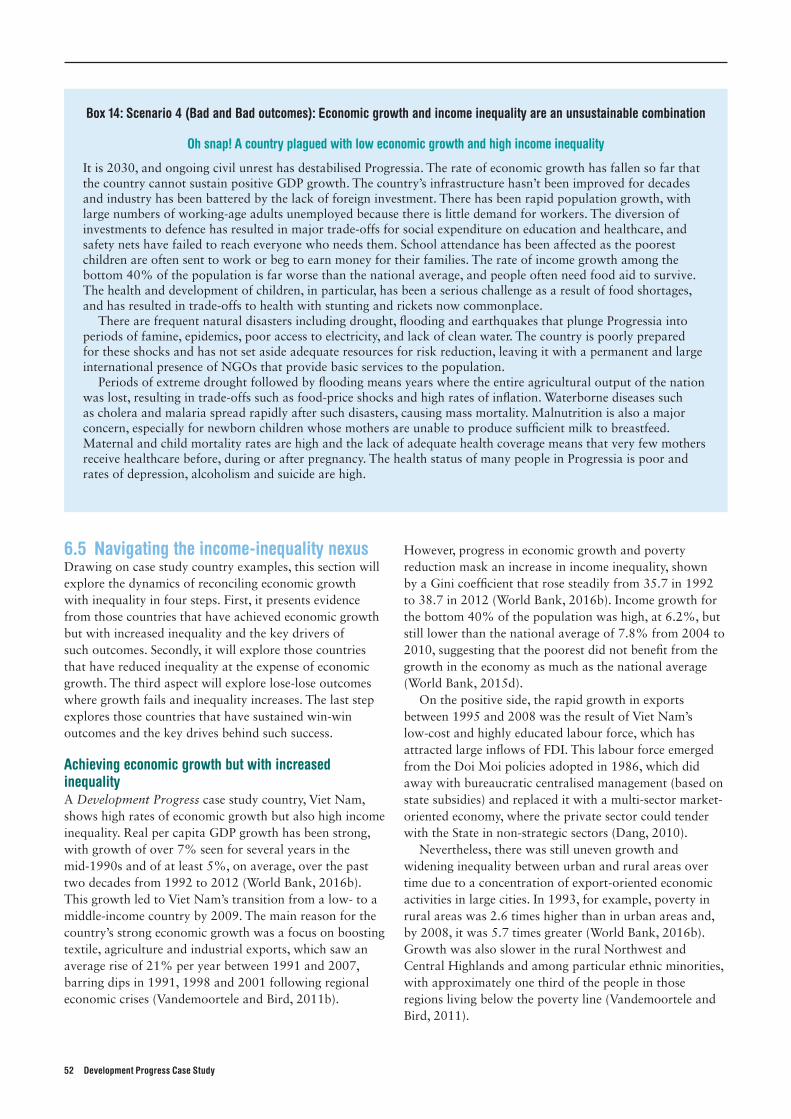
52 Development Progress Case Study
Box 14: Scenario 4 (Bad and Bad outcomes): Economic growth and income inequality are an unsustainable combination
Oh snap! A country plagued with low economic growth and high income inequality
It is 2030, and ongoing civil unrest has destabilised Progressia. The rate of economic growth has fallen so far that the country cannot sustain positive GDP growth. The country’s infrastructure hasn’t been improved for decades and industry has been battered by the lack of foreign investment. There has been rapid population growth, with large numbers of working-age adults unemployed because there is little demand for workers. The diversion of investments to defence has resulted in major trade-offs for social expenditure on education and healthcare, and safety nets have failed to reach everyone who needs them. School attendance has been affected as the poorest children are often sent to work or beg to earn money for their families. The rate of income growth among the bottom 40% of the population is far worse than the national average, and people often need food aid to survive. The health and development of children, in particular, has been a serious challenge as a result of food shortages, and has resulted in trade-offs to health with stunting and rickets now commonplace.
There are frequent natural disasters including drought, flooding and earthquakes that plunge Progressia into periods of famine, epidemics, poor access to electricity, and lack of clean water. The country is poorly prepared for these shocks and has not set aside adequate resources for risk reduction, leaving it with a permanent and large international presence of NGOs that provide basic services to the population.
Periods of extreme drought followed by flooding means years where the entire agricultural output of the nation was lost, resulting in trade-offs such as food-price shocks and high rates of inflation. Waterborne diseases such as cholera and malaria spread rapidly after such disasters, causing mass mortality. Malnutrition is also a major concern, especially for newborn children whose mothers are unable to produce sufficient milk to breastfeed. Maternal and child mortality rates are high and the lack of adequate health coverage means that very few mothers receive healthcare before, during or after pregnancy. The health status of many people in Progressia is poor and rates of depression, alcoholism and suicide are high.
6.5 Navigating the income-inequality nexusDrawing on case study country examples, this section will explore the dynamics of reconciling economic growth with inequality in four steps. First, it presents evidence from those countries that have achieved economic growth but with increased inequality and the key drivers of such outcomes. Secondly, it will explore those countries that have reduced inequality at the expense of economic growth. The third aspect will explore lose-lose outcomes where growth fails and inequality increases. The last step explores those countries that have sustained win-win outcomes and the key drives behind such success.
Achieving economic growth but with increased inequality A Development Progress case study country, Viet Nam, shows high rates of economic growth but also high income inequality. Real per capita GDP growth has been strong, with growth of over 7% seen for several years in the mid-1990s and of at least 5%, on average, over the past two decades from 1992 to 2012 (World Bank, 2016b). This growth led to Viet Nam’s transition from a low- to a middle-income country by 2009. The main reason for the country’s strong economic growth was a focus on boosting textile, agriculture and industrial exports, which saw an average rise of 21% per year between 1991 and 2007, barring dips in 1991, 1998 and 2001 following regional economic crises (Vandemoortele and Bird, 2011b).
However, progress in economic growth and poverty reduction mask an increase in income inequality, shown by a Gini coefficient that rose steadily from 35.7 in 1992 to 38.7 in 2012 (World Bank, 2016b). Income growth for the bottom 40% of the population was high, at 6.2%, but still lower than the national average of 7.8% from 2004 to 2010, suggesting that the poorest did not benefit from the growth in the economy as much as the national average (World Bank, 2015d).
On the positive side, the rapid growth in exports between 1995 and 2008 was the result of Viet Nam’s low-cost and highly educated labour force, which has attracted large inflows of FDI. This labour force emerged from the Doi Moi policies adopted in 1986, which did away with bureaucratic centralised management (based on state subsidies) and replaced it with a multi-sector market-oriented economy, where the private sector could tender with the State in non-strategic sectors (Dang, 2010).
Nevertheless, there was still uneven growth and widening inequality between urban and rural areas over time due to a concentration of export-oriented economic activities in large cities. In 1993, for example, poverty in rural areas was 2.6 times higher than in urban areas and, by 2008, it was 5.7 times greater (World Bank, 2016b). Growth was also slower in the rural Northwest and Central Highlands and among particular ethnic minorities, with approximately one third of the people in those regions living below the poverty line (Vandemoortele and Bird, 2011).

The Sustainable Development Goals and their trade-offs 53
Reducing inequality at the cost of economic growthPakistan provides an example of a country with low economic growth and low income inequality. The country’s economic history has been volatile, with repeated cycles of growth followed by stagnation. GDP growth per capita declined from 1.47% in 1990 to -0.21% in 2001 (Khan et al., 2015; World Bank, 2016b), which resulted in trade-offs in national spending and a drop in government revenues from 17% of GDP in 1991 to 16% by 1999 (World Bank, 2002). Despite this low level of economic growth and the subsequent trade-offs, from 2004 to 2010 Pakistan was able to sustain higher levels of income growth in the bottom 40% of the population (3.76%) than the national average (2.69%), out-performing other large South Asian countries including Bangladesh (1.73%) and India (3.20%) (World Bank, 2015d).
Pakistan’s lack of progress on economic growth was the result of several factors, including a lack of diversification in trade policy and a focus on low value-added items rather than more sophisticated products. Manufacturing exports as a share of total world exports remained at 0.15% for Pakistan between 1974 and 2008.
Nevertheless, income inequality has fallen as a result of the transformation of rural areas over the past three decades. Improvements in infrastructure and better telecoms connectivity have allowed rural areas to increase their access to information and business opportunities (Sánchez-Triana et al., 2014; Khan et al., 2015). The higher prices of wheat have also benefited rural people, although it is the larger-scale rather than subsistence farmers who have gained the greatest benefits.
This low level of broad economic growth is unlikely to be sustained, as 80% of Pakistan’s GDP outside agriculture comes from SMEs, most of which (87%) have five or fewer employees (Sánchez-Triana et al., 2014). This has resulted in constraints to accessing foreign and many local markets, as well as limited access to vendors. However, women are increasingly involved in the agricultural sector and this has also contributed to household income growth for rural populations. Microfinance initiatives have also allowed the rural population, particularly the poor and women, to undertake income-generating activities (Kemal, 2006; Khan et al., 2015).
The growth of the informal sector and inflows of remittances have improved living standards for the poor where government funding has been absent. Yet, there have been trade-offs in the lack of training opportunities and, therefore, a lack of skilled workers in Pakistan for SMEs. Poor levels of innovation and low levels of high-technology exports, as well as discriminatory tax regimes and a deteriorating legal and security environment, constrain businesses and have deterred further investment (Sánchez-Triana et al., 2014).
Botswana has also suffered from low economic growth but has not compromised income equality. With the exception of 2013, the country was unable to achieve
7% real per capita GDP growth over the period 2000-14 (World Bank, 2016b). The drivers of low economic growth have included the lower contribution of agriculture to GDP (falling from 6% of GDP in 1988 to 2% in 2008), as a result of climate change and lack of rainfall, lack of arable land, and poor water-resource management (UNDP, 2012).
The mining industry is one of the main sources of GDP for Botswana and has been able to avoid large declines in its contribution to GDP. However, it employs only 5% of the working population (World Bank, 2014b). The contribution of manufacturing to GDP also declined from 1988 and has contributed less than 8% to GDP (World Bank, 2016b) ever since. The services sector has improved its share of GDP from 28.5% in 1988 to 45% in 2008, as well as its investments in healthcare, education and training (World Bank, 2014b). This improvement has included mining and government services (e.g. construction, ICT, financial services) but they rely on a diamond industry that accounts for more than 70% of GDP and half of the government’s revenue. Fluctuations in the diamond market have resulted in inconsistent spending on these services and in low-quality infrastructure.
Despite its poor progress in economic growth, Botswana’s national poverty rates declined sharply from 30.6% in 2003 to 19.4% in 2010, with the improvements felt across all spatial and demographic groups (World Bank, 2015e). Income growth was also strongly pro-poor, and the consumption per capita of the bottom 40% of the population grew 4.9% annually in real terms between 2003 and 2010, higher than the average of just 2.1% for the total population (ibid.). Rates of growth were much stronger in rural areas for all income deciles than in urban areas, where growth declined for the highest 40% of the population.
However, the reliance on the diamond industry exposed Botswana to trade-offs in the form of economic shocks. Economic diversification has been on the policy agenda for the past two decades, but has not been taken up because there is little internal demand. Botswana’s geography is responsible for other trade-offs in the form of barriers to trade and production through its lack of connections to sea ports and of a suitable climate and land for agriculture (World Bank, 2014b).
Losing both ways: increased inequality and reduced economic growthUganda is one Development Progress case study country that has witnessed low economic growth leading to greater income inequality. Except for one year in 2006, the country has been unable to achieve 7% per capita GDP growth over the period 2000-2014 (World Bank, 2016b). Income inequality has also worsened, with the top 10% of the population holding an income share that is twice the size of the share held by the poorest 40% in 2011/12, up from a share 1.35 times higher in 1999/2000 (Byiers et al., 2015b).
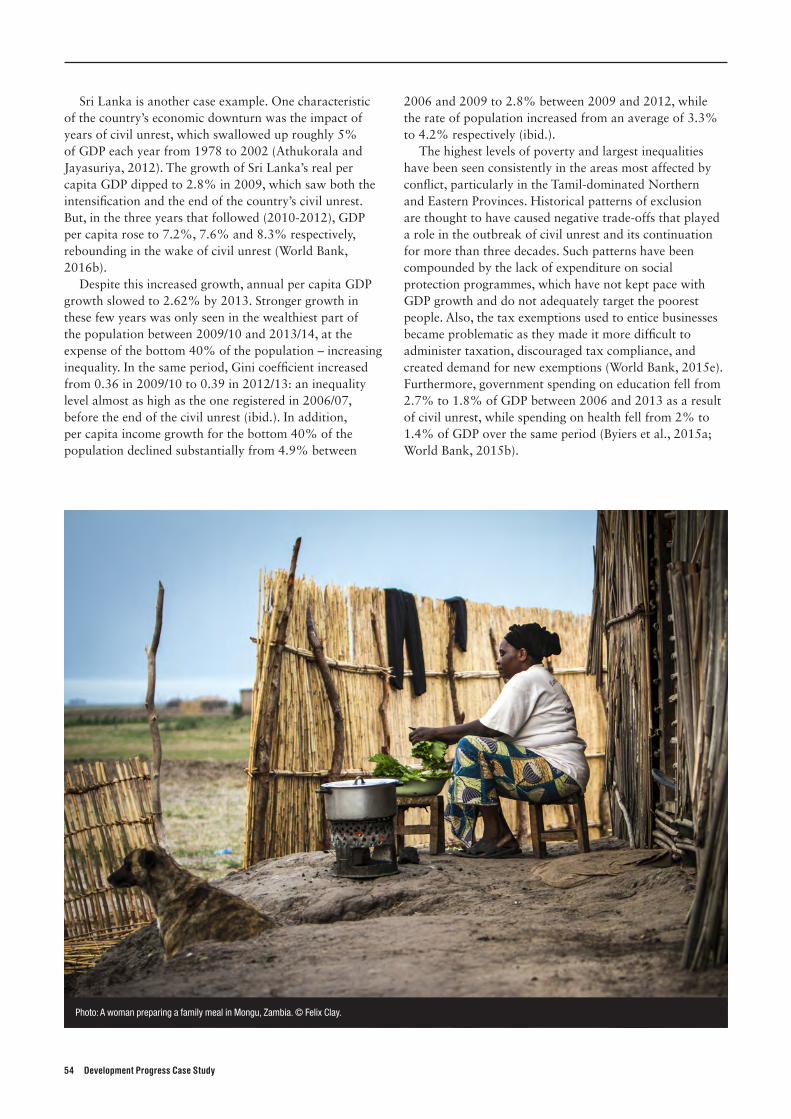
54 Development Progress Case Study
Sri Lanka is another case example. One characteristic of the country’s economic downturn was the impact of years of civil unrest, which swallowed up roughly 5% of GDP each year from 1978 to 2002 (Athukorala and Jayasuriya, 2012). The growth of Sri Lanka’s real per capita GDP dipped to 2.8% in 2009, which saw both the intensification and the end of the country’s civil unrest. But, in the three years that followed (2010-2012), GDP per capita rose to 7.2%, 7.6% and 8.3% respectively, rebounding in the wake of civil unrest (World Bank, 2016b).
Despite this increased growth, annual per capita GDP growth slowed to 2.62% by 2013. Stronger growth in these few years was only seen in the wealthiest part of the population between 2009/10 and 2013/14, at the expense of the bottom 40% of the population – increasing inequality. In the same period, Gini coefficient increased from 0.36 in 2009/10 to 0.39 in 2012/13: an inequality level almost as high as the one registered in 2006/07, before the end of the civil unrest (ibid.). In addition, per capita income growth for the bottom 40% of the population declined substantially from 4.9% between
2006 and 2009 to 2.8% between 2009 and 2012, while the rate of population increased from an average of 3.3% to 4.2% respectively (ibid.).
The highest levels of poverty and largest inequalities have been seen consistently in the areas most affected by conflict, particularly in the Tamil-dominated Northern and Eastern Provinces. Historical patterns of exclusion are thought to have caused negative trade-offs that played a role in the outbreak of civil unrest and its continuation for more than three decades. Such patterns have been compounded by the lack of expenditure on social protection programmes, which have not kept pace with GDP growth and do not adequately target the poorest people. Also, the tax exemptions used to entice businesses became problematic as they made it more difficult to administer taxation, discouraged tax compliance, and created demand for new exemptions (World Bank, 2015e). Furthermore, government spending on education fell from 2.7% to 1.8% of GDP between 2006 and 2013 as a result of civil unrest, while spending on health fell from 2% to 1.4% of GDP over the same period (Byiers et al., 2015a; World Bank, 2015b).
Photo: A woman preparing a family meal in Mongu, Zambia. © Felix Clay.
The Sustainable Development Goals and their trade-offs 55
Sustaining win-win outcomes: achieving growth and reducing inequalitiesThe Development Progress case study on Sri Lanka shows that it is feasible for Progressia to develop strong economic growth through large inflows of FDI and investments in industry and the workforce. Sri Lanka has witnessed periods of high economic growth that have contributed to lower income inequality. Real GDP per capita (purchasing power parity (PPP), current international US$) has grown consistently, from $2,370 in 1990 to $11,700 in 2015 (World Bank, 2016b), demonstrating some of the highest economic growth in South Asia. This growth may have fluctuated, but it has increased over time, from 5.3% in 2000 to 7.6% in 2011, and topped 7% in the three consecutive years from 2010 to 2012 (ibid.).
Some of the key drivers in Sri Lanka were employment progress and FDI, which grew from $172 million in 2001 to $956 million in 2011 (ibid.). Employment progress was rooted in the encouragement of labour demand through key policies that began in the late 1970s, such as increasing market exports. Combined with the promotion of export processing zones (EPZs), businesses were attracted through tax and customs duty exemptions as well as employment incentives (Byiers et al., 2015a). These policies boosted demand for labour by encouraging the growth of an export market around clothing (ready-made garments) that began in the 1970s and expanded rapidly after the liberalisation of the economy well into the 1990s. By 2002, Sri Lanka’s textile and garment sector accounted for 6% of GDP, 30% of industrial production, 33% of manufacturing employment, 52% of total exports and 67% of industrial exports (BOI, 2016). As a result of this enabling business environment and labour demand, the number of people employed in the textiles and clothing industry in Sri Lanka grew from 42% of manufacturing employment in 2006 to 53% in 2012.
Sri Lanka has also reformed its vocational training programmes to meet employment needs and the supply needs of industry. Unemployment dropped from 14% in 1992 to 4% in 2012 (UNIDO, 2016), and subsequently Sri Lanka witnessed a reduction in the share of the
population living in poverty from 29% in 1996 to 7% in 2013 (World Bank, 2016b). The privatisation of many tea estates, which has seen estate incomes increase ten-fold since 1992 as a result of collective bargaining and political representation of estate workers, has also been influential here. In addition, income growth for the bottom 40% of the population (2.21%), though moderate, was greater than the national average (1.66%) from 2006 to 2012, indicating that income inequality was lower and growth was stronger for the poorest parts of the population (World Bank, 2015b).
Ethiopia has also maintained high rates of economic growth while reducing income inequality. In terms of economic growth, the country’s real per capita GDP annual growth has risen considerably, from 3.0% in 2000 to 7.2% in 2014, maintaining a rate of at least 7% over nine of these years (World Bank, 2016b). This growth was largely the result of structural economic changes in Ethiopia’s economy and the movement of productive resources from traditional low-productivity sectors (low-input agriculture) to internationally competitive high-productivity sectors (manufacturing and formal sector services, such as the financial and ICT sectors) (Lenhardt et al., 2015).
Between 1995 and 2011, the poverty rate in Ethiopia fell faster than the average for SSA and for low-income countries worldwide, from roughly 65% to 40%. The Gini coefficient also declined from 0.40 in 1995 to 0.29 in 2005, showing greater income equality. While it increased again to 0.34 in 2011 (World Bank, 2016b), Ethiopia’s Gini coefficient has remained one of the lowest in the region since its 1995 peak.
Improvements in inequality have been supported by Ethiopia’s Productive Safety Net Programme (PSNP), which is the largest social protection programme in Africa and a key driver of poverty reduction and the prevention of impoverishment. The programme is mainly donor-funded and, by employing people who live in rural areas, has contributed to poverty reduction with poverty estimated to have reduced by 7% since 2005 (Lieuw-Kie-Song, 2011; World Bank, 2014a; Lenhardt, 2015).
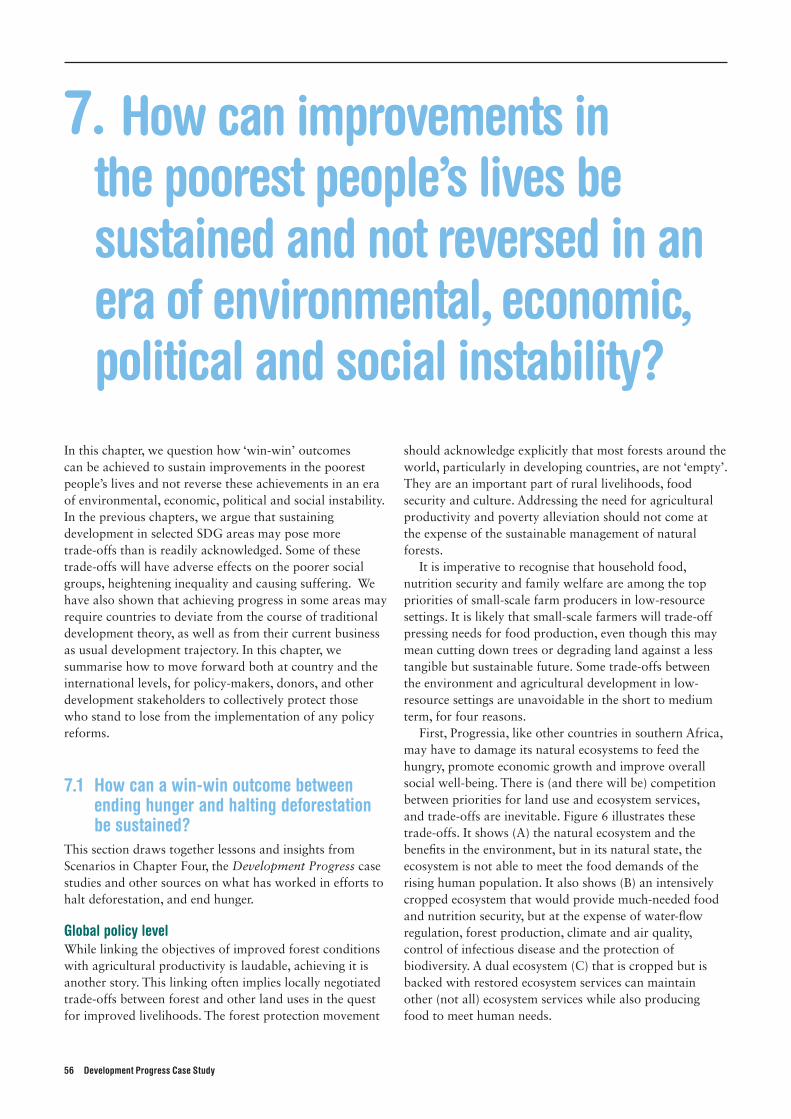
56 Development Progress Case Study
7. How can improvements in the poorest people’s lives be sustained and not reversed in an era of environmental, economic, political and social instability?
In this chapter, we question how ‘win-win’ outcomes can be achieved to sustain improvements in the poorest people’s lives and not reverse these achievements in an era of environmental, economic, political and social instability. In the previous chapters, we argue that sustaining development in selected SDG areas may pose more trade-offs than is readily acknowledged. Some of these trade-offs will have adverse effects on the poorer social groups, heightening inequality and causing suffering. We have also shown that achieving progress in some areas may require countries to deviate from the course of traditional development theory, as well as from their current business as usual development trajectory. In this chapter, we summarise how to move forward both at country and the international levels, for policy-makers, donors, and other development stakeholders to collectively protect those who stand to lose from the implementation of any policy reforms.
7.1 How can a win-win outcome between ending hunger and halting deforestation be sustained?
This section draws together lessons and insights from Scenarios in Chapter Four, the Development Progress case studies and other sources on what has worked in efforts to halt deforestation, and end hunger.
Global policy levelWhile linking the objectives of improved forest conditions with agricultural productivity is laudable, achieving it is another story. This linking often implies locally negotiated trade-offs between forest and other land uses in the quest for improved livelihoods. The forest protection movement
should acknowledge explicitly that most forests around the world, particularly in developing countries, are not ‘empty’. They are an important part of rural livelihoods, food security and culture. Addressing the need for agricultural productivity and poverty alleviation should not come at the expense of the sustainable management of natural forests.
It is imperative to recognise that household food, nutrition security and family welfare are among the top priorities of small-scale farm producers in low-resource settings. It is likely that small-scale farmers will trade-off pressing needs for food production, even though this may mean cutting down trees or degrading land against a less tangible but sustainable future. Some trade-offs between the environment and agricultural development in low-resource settings are unavoidable in the short to medium term, for four reasons.
First, Progressia, like other countries in southern Africa, may have to damage its natural ecosystems to feed the hungry, promote economic growth and improve overall social well-being. There is (and there will be) competition between priorities for land use and ecosystem services, and trade-offs are inevitable. Figure 6 illustrates these trade-offs. It shows (A) the natural ecosystem and the benefits in the environment, but in its natural state, the ecosystem is not able to meet the food demands of the rising human population. It also shows (B) an intensively cropped ecosystem that would provide much-needed food and nutrition security, but at the expense of water-flow regulation, forest production, climate and air quality, control of infectious disease and the protection of biodiversity. A dual ecosystem (C) that is cropped but is backed with restored ecosystem services can maintain other (not all) ecosystem services while also producing food to meet human needs.
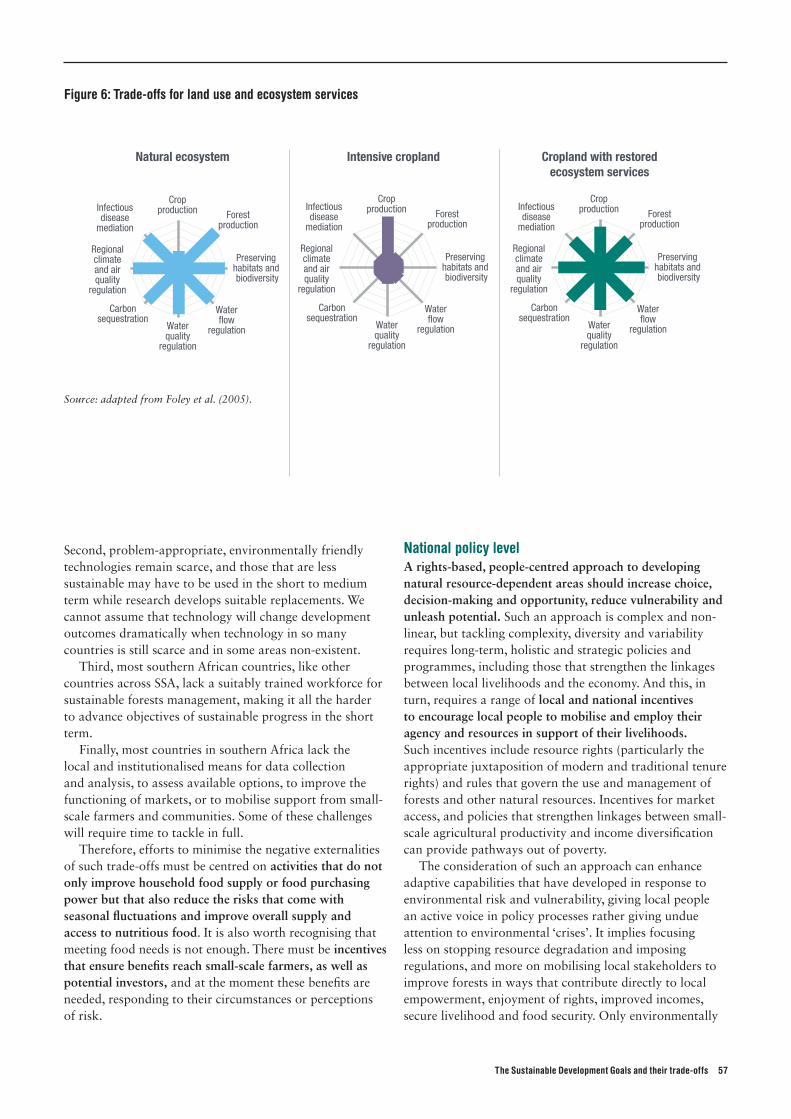
The Sustainable Development Goals and their trade-offs 57
Second, problem-appropriate, environmentally friendly technologies remain scarce, and those that are less sustainable may have to be used in the short to medium term while research develops suitable replacements. We cannot assume that technology will change development outcomes dramatically when technology in so many countries is still scarce and in some areas non-existent.
Third, most southern African countries, like other countries across SSA, lack a suitably trained workforce for sustainable forests management, making it all the harder to advance objectives of sustainable progress in the short term.
Finally, most countries in southern Africa lack the local and institutionalised means for data collection and analysis, to assess available options, to improve the functioning of markets, or to mobilise support from small-scale farmers and communities. Some of these challenges will require time to tackle in full.
Therefore, efforts to minimise the negative externalities of such trade-offs must be centred on activities that do not only improve household food supply or food purchasing power but that also reduce the risks that come with seasonal fluctuations and improve overall supply and access to nutritious food. It is also worth recognising that meeting food needs is not enough. There must be incentives that ensure benefits reach small-scale farmers, as well as potential investors, and at the moment these benefits are needed, responding to their circumstances or perceptions of risk.
National policy levelA rights-based, people-centred approach to developing natural resource-dependent areas should increase choice, decision-making and opportunity, reduce vulnerability and unleash potential. Such an approach is complex and non-linear, but tackling complexity, diversity and variability requires long-term, holistic and strategic policies and programmes, including those that strengthen the linkages between local livelihoods and the economy. And this, in turn, requires a range of local and national incentives to encourage local people to mobilise and employ their agency and resources in support of their livelihoods. Such incentives include resource rights (particularly the appropriate juxtaposition of modern and traditional tenure rights) and rules that govern the use and management of forests and other natural resources. Incentives for market access, and policies that strengthen linkages between small-scale agricultural productivity and income diversification can provide pathways out of poverty.
The consideration of such an approach can enhance adaptive capabilities that have developed in response to environmental risk and vulnerability, giving local people an active voice in policy processes rather giving undue attention to environmental ‘crises’. It implies focusing less on stopping resource degradation and imposing regulations, and more on mobilising local stakeholders to improve forests in ways that contribute directly to local empowerment, enjoyment of rights, improved incomes, secure livelihood and food security. Only environmentally
Figure 6: Trade-offs for land use and ecosystem services
Infectiousdisease
mediation
Cropproduction Forest
production
Preserving habitats and biodiversity
Water�ow
regulation
Carbonsequestration
Waterquality
regulation
Regionalclimateand airquality
regulation
Natural ecosystem Cropland with restoredecosystem services
Intensive cropland
Infectiousdisease
mediation
Cropproduction Forest
production
Preserving habitats and biodiversity
Water�ow
regulation
Carbonsequestration
Waterquality
regulation
Regionalclimateand airquality
regulation
Infectiousdisease
mediation
Cropproduction Forest
production
Preserving habitats and biodiversity
Water�ow
regulation
Carbonsequestration
Waterquality
regulation
Regionalclimateand airquality
regulation
Source: adapted from Foley et al. (2005).
58 Development Progress Case Study
Table 2: Forest reduction versus agricultural productivity – what are the trade-offs?
Agricultural productivity increase Agricultural productivity reduction
Forest reduction A: The smallholder farmers do not benefit from unsustainable use of forest resources
B: Forest conversion (extensive farming, agroforestry) reduces poverty
Forest increase C: Smallholder farmers are affected by reduced access to land and forests
D: Less pressure on forest as a result of agricultural intensification, agroforestry or employment opportunities outside forests or in environmentally friendly forest enterprises
cooperative enterprises can sustain livelihoods, boost agricultural productivity and reduce pressure on forests (see Table 2, situation D). The other conditions (A, B, and C) are likely to increase any separation between forests and their people. With these elements in place, many environmental challenges can be solved while simultaneously improving the lives of small-scale farmers.
Programmatic levelAny strategy must be framed around a distinct legal and policy basis with clearly articulated rules for resource utilisation. Sustainability strategies must, therefore, articulate responsibilities and define the allocation of rights of access to or use of environmental resources (see Chapters 5 and 6). These responsibilities, along with the policy and legal framework, must also be context-appropriate, culturally responsive, socially acceptable, politically correct and equitable and be well within the implementation capacity of both farmers and governments. However, governments must be willing to allow active community participation, and to exert their sovereign responsibilities for action for two reasons.
First, political will must be ready to address negative public reactions to trade-offs that are perceived to restrict agricultural productivity by small-scale farmers. Second, governments must ensure that both public and private institutional arrangements exist to provide the services needed to minimise the negative impacts of trade-offs on farmers and communities. Governments should be prepared to respond (quickly) to any significant social stresses arising from the need to, for example, move people out of farming activities to off-farm activities. Similarly, local communities must be involved in decisions regarding their forests and livelihoods, and this should be framed as a human-rights issue. These rights, among others, should include access to decision-making, information and justice.
The denial of local people to their rights over forests will make it difficult for these forest resources to become part of their choices about livelihoods. The implementation of forest management schemes without the consent or meaningful participation of locals will make it impossible
for local people to benefit from the resources. Therefore, the resources will be seen not as resources, but as constraints on systems from which they can benefit.
Similarly, while real reforms such as the elimination of marketing boards and price controls have taken place (e.g. see Ezealaji and Adenegan, 2014 for Nigeria), failures persist and markets have yet to work for the poor. Markets for small-scale farm producers are either non-existent, weak or captured and tend to be segmented and characterised by state and private monopoly and monopsony domination.10 Such power colludes and manipulates prices as regulatory frameworks work to exclude further or discriminate against small-scale producers. For this reason, their barriers to market entry are widespread and include lack of access to technology, little (if any) credit, inadequate information and small market networks.
7.2 How can economic growth be reconciled with environmental sustainability?
The relationship between economic growth and the environment is complex and non-linear. While there may be no conclusive empirical evidence to pin down future scenarios on the outcomes of economic growth and environmental degradation, the scenarios on future speculation framed on past lessons in Chapter 5 provide a useful starting point for thinking about the key drivers of change and policy trade-offs between competing objectives. As we demonstrated in that chapter, these involve policy trade-offs at different stages of economic growth (per capita income). Of course, these mimic the Kuznets curve (see Figure 5 in Chapter 5), but we can divide these into three effects (see Figure 7).
Although the current development context of Progressia, as well as for most of Sub-Saharan Africa presents an exciting terrain full of opportunities to harness improvements that have taken place on peace and security as well as economic and political institutions, the biggest challenge is on industrial technology. Technology that creates new jobs, but without polluting its environments,
10 A monopsony is a market structure in which only one buyer interacts with many would-be sellers of a particular product.
The Sustainable Development Goals and their trade-offs 59
Figure 7: Policy trade-offs of deforestation and per capita income
Defo
rest
atio
n
Per capita income
Per capita income grows at the expense of environmental protection. Increased industrialisation and consumption leads to environmental degradation.
Defo
rest
atio
n
Per capita income
As economic growth and industrialisation �ourish, there is a shift from agriculture to processed products, resulting in further damage to the environment. But the balance shifts from manufacturing to service provision, reducing environmental damage in the long term.
Defo
rest
atio
n
Per capita income
Some advances in technology, such as improvements in energy ef�ciency, reduce pressure on the environment. But some result in environmental degradation, e.g. increased energy use.
The scale effect The turning effect The technological effect
widening income gaps, and without further hollowing out an already sparse working class. Win-win outcomes, can be sustained through:
• careful integrated long-term planning, • leadership with the will to transform more than the will
to power, • strengthening of accountability trails through credible
institutions, and • collective conversations on the present and future
challenges of ignoring climate realities.
In today’s world with its natural, intellectual and technological endowments, environmentally sustainable economic growth that creates jobs need not be an oxymoron. But to avoid the calamity of it being one, measures have to be put in place and policy-makers in Africa and elsewhere need to be more circumspect about the decisions they make around adverse effects of trade-offs and opportunities they might miss if they fail to promote synergies, no matter how unusual and ahistorical they may be. So win-win approaches in today’s sustainable development challenge lie in creativity:
• creative leadership, • collective problem solving, and • innovative implementation.
All this may not be found in government, so collective national conversations that allow citizens to participate and map their paths will be essential. After all, people support what they are party to creating and resist things that are forced on them.
Specifically, the following summary highlights the key drivers of progress that help to sustain win-win outcomes between creating new jobs and keeping the environment clean.
1. Long-term integrated planningThe SDG agenda 2030 is a 15-year programme: we see no reason why one would approach it with a plan which doesn’t match or surpass that duration. Such planning approaches can always be phased and have different sectorial tracks, to allow for progress checks and milestones, but they need to be long term and will need to be integrated or holistic, if they are to stand a chance of meeting the ambitious targets, like the Ethiopian Green Economy visions.
2. Respect for international obligationsThis will be important as a confidence measure but also as a buffer for policy-makers. Respecting international obligations allows decision makers to have some firm ground to stand on or start from, and can provide the impetus for domestication of provisions, principles, rules and laws that can facilitate structural transitions necessary for low-carbon growth and job creation.

60 Development Progress Case Study
3. Institutions and regulationTo ensure that jobs creating economic growth and low carbon environmental sustainability are achieved, institutions must be credible, preferably independent, and business and political behaviour must be beyond reproach. This will send the right signals to both domestic and international stakeholders that it is no longer ‘business as usual’ in Africa where business as usual was difficult. Regulations in support of or stemming from institutions must then be tailored to facilitate rather than impede progressive action. Policy-makers must view regulation as more of a key, rather than a lock.
4. Policy consistencyAllied to point 2 above is the need to ensure that, beyond fluency of plans and clarity and integrity of institutions, policy and regulations are pronounced and implemented consistently. This will assist in affirming predictability, which is a critical element of any growth and development processes, but even more so for newer initiatives and approaches like the low carbon jobs creating economic growth.
5. Leadership at every levelThe visions of low carbon economic growth that creates employment are noble, but like every other vision they need champions to be shared and well implemented. Policy-makers must endeavour to ensure that their visions are led at every level by passionate champions, but more important are shared through diffusion and cross-pollination of ideas with different stakeholders from society.
6. Reduce the fiscal burden of subsidies on highly pollutant agentsIntegrated environmental sustainability with economic growth does entail trade-offs, but it also implies trade-offs between the past and the future staged in the present. Gradual breaks will need to be instituted with regards to use and subsidisation of fossil fuels that increase emissions to pave the way for a low-carbon future. The reduced fiscal burden can allow for the investment of resources in energy sources for the future. But, progressive costing of nature should be encouraged and included in financial plans. In general terms, policies to price nature into financial decisions could raise costs in the short run. But consideration of the costs of such policies should be set against the incentives they can provide for innovation and efficiency. Policy reforms should consider the costs of inaction, i.e. what would occur under a business-as-usual scenario. For example, the work of Stern (2006) shows that reducing carbon emissions by keeping temperature rises within 2°C limits would cost around 1% of global GDP by 2050. In contrast, the cost of inaction would be about 5-20% of GDP.
7. Invest in innovation and the futureThis can be done through investing in research or through promoting the next generation of innovators through social investments in education and health.
7.3 How can a win-win outcome between income inequality and economic growth be sustained?
Huge differences in income distribution slow down physical and human capital accumulation, the primary sources of economic growth (Colman and Nixson, 1986; IMF, 2015). A recent International Monetary Fund (IMF) (ibid.) paper on causes and consequences of inequality shows that when the income shares of the top 20% (the rich) increase, GDP growth declines over the near to medium term, suggesting that economic benefits fail to trickle down. In contrast, an increase in the income share of the bottom 20% (the poor) is associated with higher GDP growth. Therefore, the elimination of widespread poverty and the growing income inequality caused by undesirable economic growth are major challenges for development (OECD, 2012a and b). Economic growth that is unwanted is that which increases income inequality and widespread poverty, leading to social tension and political discontent that threatens the well-being of society (see Chapter 6). The poor and the middle class are the most important for economic growth, and a focus on them should be the main objective of development policy.
Policy-makers need to focus on the bottom 40% who include the lower-middle classes at risk of becoming poorer by failing to benefit from future growth. Poverty reduction interventions alone will not be enough. Not only cash transfers but also increasing access to public services, such as education, training, health care, and well-targeted social policies, constitute long-term social investment to create greater equality of opportunities in the long run. Strategies to strengthen any skill must include improved job-related training and education for the low skilled, over their entire working lives. Equally important is to ensure that the labour market institutions do not exploit or penalise the poor excessively and that they foster action to raise the income share of the poor and the middle class.
Drawing from our Scenarios in Chapter 6, and from Stiglitz’s (2012) work, we reiterate that inequality has a negative impact on long-term growth, and thus a relevant policy question is how to promote a win-win approach to reducing inequalities and address negative externalities of trade-offs between reducing inequality and boosting growth. We acknowledge that this is a difficult question and there is no one-size-fits-all approach to tackling inequality, and thus the nature of appropriate policies depends on the underlying drivers and country-specific policy and institutional settings. But, the primary, direct, policy tool to reduce market income inequality could be
The Sustainable Development Goals and their trade-offs 61
through taxes and social benefits, which however may also have a direct adverse effect on growth (IMF, 2014). This effect would happen, for example, if high levels of taxes and transfers lead to resource loss and generate aggregate inefficiencies as in the ‘equity-efficiency trade-off’ in Okun’s leaky bucket analogy (Okun, 1975). If this is the case, the specification should account for the fact that reaching a given income level, inequality would entail a stronger drag on growth. Therefore, policies should focus on making tax systems more progressive and ensuring greater financial inclusion and creating incentives for lowering informality. More generally, policies aimed at raising average living standards can also influence the distribution of income and ensure a more inclusive prosperity pushing forward the complementarities between objectives of growth and income equality.
An important policy question to also consider is how the political framework of low resource countries can withstand the strain which could generate from the widening of income inequality. Can institutional arrangements including economic growth, industrialisation and the politics in Progressia, and other sub-Saharan African countries alike, be modified and strengthened to favour a sustained rise to higher levels of economic performance, and yet avoid the simple remedy of fatal authoritarian political settlements that could use people as cannon fodder in the struggle for economic achievement? From our Scenarios, we have established that widening of income inequality results in pressures and conflicts which may necessitate drastic changes in the social and political organisation. This policy question is significant as it helps to lay bare the nature of the trade-offs that policy-makers may concede to minimise the cost of transition and avoid paying the hefty price in internal tensions. It also shows the likelihood of long-run inefficiency in meeting social and economic demands as a result of absolute authoritarian political power (Saez, 2014; Jaumotte and Buitron, 2015).
Facing these acute problems, one is cognisant of the dangers of taking an extreme position. There is danger in simple generalising analogies; in arguing that because an unequal income distribution in Western Europe in the past led to the accumulation of savings and financing of primary capital formation, the preservation or accentuation of existing income inequalities in the developing countries is necessary to secure the same result. It is dangerous to think that free markets, lack of penalties implicit in progressive taxation, are indispensable factors for the economic growth of southern countries. Arguing that past foreign investment provided financial resources to boost economic progress in Latin America (Tsounta and Osueke, 2014) and so similar effects are therefore expected today in Sub-Saharan African countries is misleading. Equally dangerous is to take the opposite position and claim that current challenges are entirely new and that we must create solutions that are unrestrained by past knowledge or experience. What we need is a clear perception of past trends, trade-offs conceded, and the context under which problems and solutions occurred, as well as knowledge of the context and experiences of poor people south of the Sahara. With this as a starting point, we can then attempt to understand the policy trade-offs, externalities, costs, and benefits between development objectives of a properly understood past and translating these into the conditions of an adequately understood present, to inform a future yet to come.
One way of doing this is through the utilisation of Poverty and Social Impact Analysis (PSIA). PSIA provides an analytical means to ‘assess the distributional and social impacts of policy reforms on different groups’ see Box 15. (World Bank, 2015g).
In countries that have adopted such an approach, World Bank and IMF case studies have shown excellent results. For example:
In Ghana, through a process that led to a transparent policy discussion on the costs and benefits of policy reform on the low-income segments of society, the PSIA assessed the distributional impacts of the 2005 Ghana Energy Subsidy Reform. Ghana had implemented energy subsidy programmes as far back as 2000, following increases in petroleum pump prices aimed at restoring the financial capacity of the state-led Tema Oil Refinery (TOR), which till 2004 had held a monopoly on both the production and importation of refined petroleum products. TOR’s financial challenges and losses estimated at 7% of Ghana’s GDP had emanated from delays in adjusting petroleum prices in 2000 in the wake of rising world prices, and a depreciating currency (IMF, 2013). The state-owned Ghana Commercial Bank absorbed TOR’s massive losses, risking its own solvency in the process. To address TOR’s and the commercial bank’s financial crises, the government of Ghana hiked fuel pump prices in 2003 as a cost recovery adjustment plan. However, massive opposition from the general public led to the cost-recovery adjustment plan
Box 15: What is PSIA?
Poverty and Social Impact Analysis (PSIA) is an analytical approach that can be used by countries to assess ‘the distributional and social impacts of policy reforms’ (World Bank, 2015) on society and various social groups. Drawing on various sets of methods, it can be implemented before or during a policy reform process, to provide evidence on the distribution of losses and benefits that will result from a proposed policy change. It can also be taken after a policy reform to examine policy impacts on different social groups and also facilitates public debate on trade-offs between policy choice. The findings aid decision makers with interventions that can mitigate challenges and/or help to understand the likely impacts of future policy reforms (World Bank, 2015g).
62 Development Progress Case Study
being abandoned, and forcing the Ghana Commercial Bank to introduce subsidies and lending to support TOR operations in the run-up to the 2004 elections (IMF, 2005). These delays in price increases, and under-pricing of petroleum products saddled TOR with significant losses, with spill over effects into the financial sector in the form of non-performing loans. By 2005, the government was forced to clear the TOR’s arrears to the banking sector at a considerable budget cost. Desperate to recover costs, the government of Ghana increased petroleum prices through the 2005 Energy Subsidy Reform programme. PSIA findings demonstrated how the new reforms would benefit the government to recover costs (benefits), but were a poor policy measure against poverty (costs). The latter was due to reports that only 2.3% of outlays of the cost recovery programme benefitted the poor (ibid). Thus, on the one hand, the government of Ghana had to recover costs and facilitate economic growth, by increasing prices. On the other hand, this reform had dire consequences on the economic outcomes of vulnerable populations. The
findings from PSIA suggested some mitigating interventions particularly for the poor, which were considered by the government. These included free primary and secondary school education at all government-run schools; investments in rural electrification; increased funding to facilitate access to public transport and health care.
Nepal analysed the distributional impact of hiking power tariffs on political and social outcomes using PSIA. The PSIA findings showed how the higher tariffs benefited the government but negatively impacted the poorer segments of society. The negotiations that ensued led to multi-sectoral discussions of the Financial Recovery Plan for Electric Utility which aims to understand how best to change the tariff structure (see World Bank, 2012). Thus, PSIA provides evidence on the effects of poverty and social policy reforms on different social groups and creates the much needed multi-sectoral space for transparent dialogue in policy-making (World Bank, 2015g).
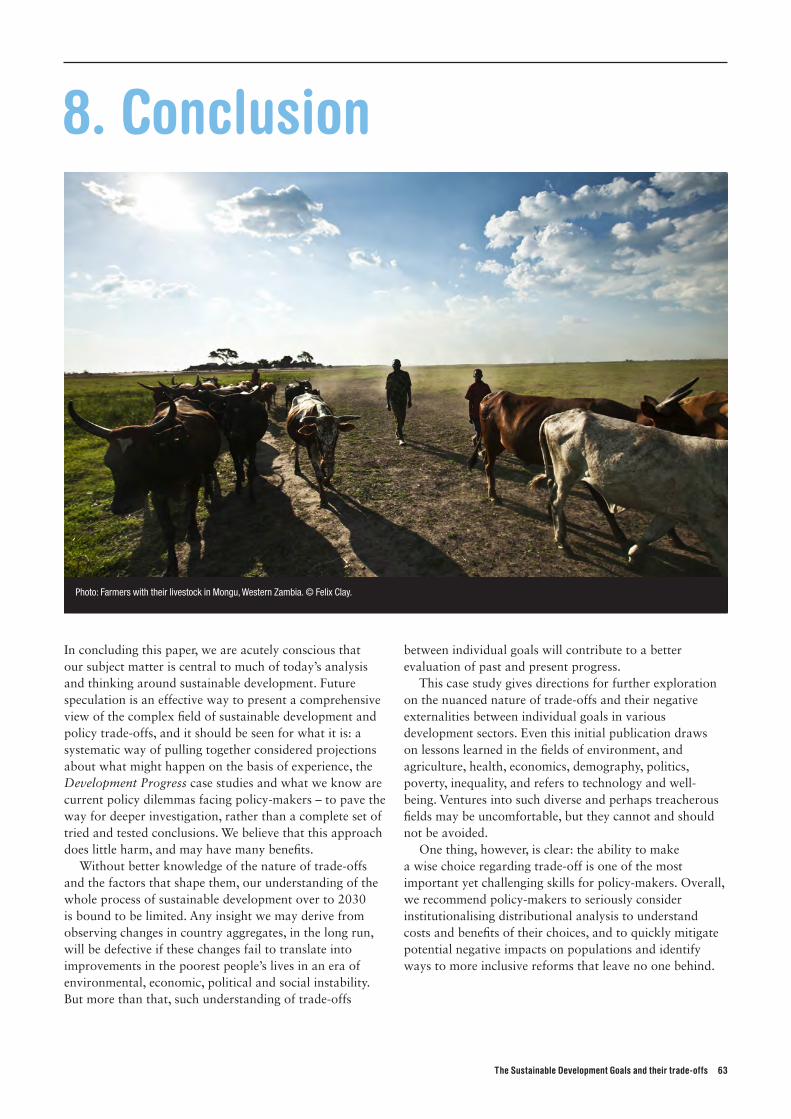
The Sustainable Development Goals and their trade-offs 63
In concluding this paper, we are acutely conscious that our subject matter is central to much of today’s analysis and thinking around sustainable development. Future speculation is an effective way to present a comprehensive view of the complex field of sustainable development and policy trade-offs, and it should be seen for what it is: a systematic way of pulling together considered projections about what might happen on the basis of experience, the Development Progress case studies and what we know are current policy dilemmas facing policy-makers – to pave the way for deeper investigation, rather than a complete set of tried and tested conclusions. We believe that this approach does little harm, and may have many benefits.
Without better knowledge of the nature of trade-offs and the factors that shape them, our understanding of the whole process of sustainable development over to 2030 is bound to be limited. Any insight we may derive from observing changes in country aggregates, in the long run, will be defective if these changes fail to translate into improvements in the poorest people’s lives in an era of environmental, economic, political and social instability. But more than that, such understanding of trade-offs
between individual goals will contribute to a better evaluation of past and present progress.
This case study gives directions for further exploration on the nuanced nature of trade-offs and their negative externalities between individual goals in various development sectors. Even this initial publication draws on lessons learned in the fields of environment, and agriculture, health, economics, demography, politics, poverty, inequality, and refers to technology and well-being. Ventures into such diverse and perhaps treacherous fields may be uncomfortable, but they cannot and should not be avoided.
One thing, however, is clear: the ability to make a wise choice regarding trade-off is one of the most important yet challenging skills for policy-makers. Overall, we recommend policy-makers to seriously consider institutionalising distributional analysis to understand costs and benefits of their choices, and to quickly mitigate potential negative impacts on populations and identify ways to more inclusive reforms that leave no one behind.
8. Conclusion
Photo: Farmers with their livestock in Mongu, Western Zambia. © Felix Clay.
64 Development Progress Case Study
Specifically, we note:
1. Plan for policy trade-offs and in particular their social, economic and environmental distributional impacts to balance out policy choices that negatively impact the poor and marginalised Governments need to consider the implications of trading off one policy area against another, and plan accordingly. This means discussing the potential outcomes of policies with stakeholders to ensure that the likely distributional impacts are fully understood – especially for the poorest and marginalised who are most vulnerable to change – and ensuring that complementary policies are in place to compensate the immediate losers from a specific policy.
One tool for doing this kind of scenario planning is Poverty and Social Impact Analysis (PSIA), which can make explicit the complex links between poverty and policies, and thus promote a debate on trade-offs between policy choices to reconcile income inequality with – in the example of this case study – economic growth or to end hunger while sustaining the environment.
Although a comprehensive analysis of the negative effects of trade-offs between individual SDGs can be complex, and may not be definitive, PSIA provides the entry point to understanding the potential consequences of policy choices, even in countries like Progressia, where data is limited, and therefore contributes to a more informed and progressive policy debate and design. The IMF case studies have shown excellent results in countries that have adopted such an approach. For example:
• In Ghana, PSIA assessed the distributional benefits and losses of Ghana’s 2005 Energy Subsidy Reform, and demonstrated consequences of policy trade-offs. In particular, PSIA findings demonstrated how the then new reform would benefit the government to recover costs (benefits), but was a poor policy measure against poverty (costs). The latter was due to reports that only 2.3% of outlays of the cost recovery programme benefitted the poor (ibid). Thus, on the one hand, the government of Ghana had to recover costs and facilitate economic growth, by increasing prices. On the other hand, this reform had dire consequences on the economic outcomes of vulnerable populations. The findings from PSIA suggested some mitigating interventions particularly for the poor, which were considered by the government. These included free primary and secondary school education at all government-run schools; investments in rural electrification; increased funding to facilitate access to public transport and health care.
Developing countries would benefit from more systematic PSIA and, going forward, country reviews on SDG progress should report more on the potential policy trade-offs and poverty outcomes based on PSIA.
2. Factor in the cost of environmental inaction as economic and social policy choices are made There is an urgent need for developing countries to consider inclusion of policies that price nature into their financial decisions because so many of the impacts of inaction in environmental policies are not reflected in economic plans. But, valuing the cost of inaction can be complex – partly because of uncertainties involved in placing a cost value on the negative externalities of trade-offs between the environmental and economic policy choices; and partly because of difficulties in establishing both the baseline and the boundaries for such estimates. For example, in Progressia, as is the case in countries such as South Africa, Malawi and Zimbabwe, the cost of droughts (e.g. due to El Niño) on food security, will be incurred locally (and the impact experienced immediately). While other costs, such as the likelihood of such droughts becoming a permanent state in these countries, and the sheer magnitude of the impacts, will fall on citizens in the medium-to-long term).
Similarly, some costs may be reflected in less obvious terms (e.g. expenditures on health care), while others will be more concrete (e.g. hunger and suffering). These impacts, which can be exacerbated by inaction are complicated by the fact that they potentially lead to irreversible damage. Despite the measurement difficulties, this paper shows that the costs of policy inaction in some environmental areas can be considerable, with implications for hunger eradication – representing a significant ‘drag’ on developing economies. Research should be intensified to reduce some of the uncertainties involved in defining and measuring the marginal social and economic costs of environmental inaction, so that comparisons against costs of action can be robust.
3. Enact holistic and integrated policies which cut across sectoral boundaries and exploit synergies To meet the challenge of achieving SDGs, governments in developing countries, and donors in their support, will need to design holistic policies that minimise impacts that adversely affect the prospects of achieving goals in other sectors, or that derail development prospects of other nations. Achieving this objective entails exploiting synergies across different policy areas that have high cross–sector dimensions. Such dimensions will include areas of agriculture, health, trade, education, environment, migration and development partnerships, to create favourable development conditions. A siloed policy approach would be, for example, one that provides Progressia’s foreign and domestic investors with opportunities for large-scale land acquisitions aimed at boosting extensive commercial agriculture at the expense of small scale farmers. The latter are often displaced from their land with little compensation, violating their human rights as in the case of Tanzania where over a third of children under five are undernourished and the county
The Sustainable Development Goals and their trade-offs 65
loses nearly 3% of its GDP each year to the long-term impacts of child malnutrition despite the increasing trend in large-scale land acquisitions. Conversely, a holistic policy would, for example be one which emphasises infrastructure and agricultural development, while maintaining fiscal discipline, arresting corruption and implementing and sustaining fertiliser subsidy programmes along with massive political support such as the case of Malawi’s president Bingu wa Mutharika’s 2004-2009 integrated policy model of growth.
Development Progress case studies have shown excellent results in countries that have adopted holistic and integrated policy approaches. For example,
• Ethiopia took a holistic and integrated approach, centring government policy on the goal of poverty eradication and taking a multidimensional approach to its achievement. This encouraged different line ministries to work together more comprehensively and consistently on poverty-reduction measures leading to the integration of social sectors into broader economic planning, and tremendous successes in the reduction of poverty from 63% in 1995 to 37% in 2011. There were also gains in education, health and employment.
• Costa Rica’s government in the driving seat and with strong partnerships among donors, the private sector, and civil society, the country established a holistic policy for Conservation Areas. This entailed effective legislation, including a ban on future land-use change on all forested land along with innovative incentive structures which provided direct financial incentives to landowners to conserve forests instead of converting them to agricultural land. This policy approach not only improved the country’s total forest cover, but also household nutrition security.
This paper sees a holistic policy approach as one that facilitates and enables the integration of multiple dimensions of social, economic and environmental development at all stages of decision-making, within and between countries. The approach will exploit the potential of positive synergies across policies to support development, pursuing win-win situations and mutual benefits, while simultaneously increasing governments’ capacities to deal with possible divergent policy objectives. This approach helps to place the local contexts in the global picture and aids decision makers to reconcile sub-national with national policy objectives, while avoiding or minimising the negative side-effects and impacts of policy trade-offs – towards a pathway of inclusive, sustainable growth.
66 Development Progress Case Study
ReferencesAhaibwe, G. and Mbowa, S. (2014) ‘Youth Unemployment
Challenge in Uganda and the Role of Employment Policies in Jobs Creation’. Washington, DC: Brookings. Available at: https://www.brookings.edu/blog/africa-in-focus/2014/08/26/youth-unemployment-challenge-in-uganda-and-the-role-of-employment-policies-in-jobs-creation/ [Accessed 28 August 2016].
Alexandratos, N. and Bruinsma, J. (2012) World Agriculture Towards 2030/2050: Working Paper No. 12-03. Rome: Food and Agriculture Organization of the United Nations.
Arsham, H. (2006) ‘Tools for Decision Analysis: Analysis of Risky Decisions’. Available at: https://home.ubalt.edu/ntsbarsh/opre640a/PartIX.htm [Accessed 8 December 2016.
Athukorala, P.C. and Jayasuriya, S. (2012) ‘Economic policy shifts in Sri Lanka: the post-conflict development challenge’, Asian Economic Papers 12(2): 1-28.
AU (African Union Commission), NEPAD Planning and Coordinating Agency, UN Economic Commission for Africa, and UN World Food Programme (2014) The Cost of Hunger in Africa: Social and Economic Impact of Child Undernutrition in Egypt, Ethiopia, Swaziland and Uganda. Addis Ababa: UNECA.
Bailis, R., Ezzati, M. and Kammen, D. (2005) ‘Mortality and GHG Impacts of Biomass and Petroleum Energy Futures in Africa, Science 308(5718): 98-103.
Basnett, Y. and Bhattacharya, D. (2015) ‘Exploring spaces for economic transformation in the Sustainable Development Goals’. London: Overseas Development Institute.
Beilfuss, R. (2012) A Risky Climate for Southern African Hydro: Assessing hydrological risks and consequences for the Zambezi River Basin dams. Berkeley, CA: International Rivers.
Bento, A., Takeuchi, A. and Cropper, M. (2006) ‘The Welfare Effects of Slum Improvement Programs: The Case of Mumbai’. Policy Research Working Papers. Washington, DC: World Bank.
Bhatkal, T., Avis, A. and Nicolai, S. (2011) ‘Towards A Better Life? A cautionary tale of progress in Ahmedabad’, Urban Poverty Report. London: Overseas Development Institute, Development Progress.
Bishop, P., Hines, A. and Collins, T. (2007) ‘The current state of scenario development: an overview of techniques’, Foresight 9(1): 5-25.
BOI (Board of Investment of Sri Lanka) (2016) ‘Key Sectors for Investment – Apparel,’ BOI SriLanka. Available at: http://www.investsrilanka.com/key_sector/apparel/apparel_overview [Accessed 28 August 2016].
Bradfield, R. (2005) ‘The origins and evolution of scenario techniques in long range business planning’, Futures 37(8): 795-812.
Bradfield, R., Wright, G., Burt, G., Cairns, G., and van der Heiden, K. (2005) ‘The Origins and Evolution of Scenario Techniques in Long Range Business Planning’, Futures 37: 795-812.
Brown, J.H. (2015) ‘The Oxymoron of Sustainable Development’, Bioscience 65(10): 1027-1029.
Brown, J.H., Burger, J.R., Burnside, W.R., Chang, M., et al. (2014) ‘Macroecology meets macroeconomics: Resource scarcity and global sustainability’, Ecological Engineering 65: 24-32.
Brown, J. and Bird, N. (2011) Costa Rica’s sustainable resource management: Successfully tackling tropical deforestation. London: Overseas Development Institute, Development Progress.
Buckley, R.M. and Simet, L. (2016) ‘An agenda for Habitat III: urban perestroika’, Environment and Urbanization 28(1): 64-76.
Byiers, B., Krätke, F., Jayawardena, P., Takeuchi, L.R. et al. (2015a) Manufacturing progress? Employment creation in Sri Lanka. London: Overseas Development Institute, Development Progress.
Byiers, B., Takeuchi, L.R. and Rosengren, A. et al. (2015b) Work in progress: Productive employment and transformation in Uganda. London: Overseas Development Institute, Development Progress.
Casado-Asensio, J. and Steurer, R. (2014) ‘Integrated strategies on sustainable development, climate change mitigation and adaptation in Western Europe: Communication rather than coordination’, Journal of Public Policy 38(3): 437-473.
CBD (Convention on Biological Diversity) (1992) ‘Convention on Biological Diversity’, CBD. Available at https://www.cbd.int/history/default.shtml [Accessed 25 September 2016].
Chang, H.-J. (2002) Kicking away the ladder: Development strategy in historical perspective. London: Anthem Press.
Chermack, T.J., Lynham, S.A. and van der Merwe, L. (2006) Exploring the relationship between scenario planning and perceptions of learning organization characteristics’, Futures 38(7): 767-777.
Colman, D. and Nixson, F.I. (1986) Economics of change in less developed countries. London: Rowman and Littlefield.
Dang, D.A. (2010) ‘Trade liberalization and institutional quality: Evidence from Vietnam.’ MPRA Paper No. 26346.
Dasgupta, P. and Ehrlich, P. R. (2013) ‘Pervasive Externalities at the Population, consumption, and environment nexus’, Science 340: 324-328.
Deloitte (2016) Industry 4.0: Is Africa ready for digital transformation? Johannesburg: Deloitte South Africa.
Devarajan, S., Go, D.S., Robinson, S., Thierfelder, K. (2009) Tax Policy To Reduce Carbon
The Sustainable Development Goals and their trade-offs 67
Emissions In South Africa. Policy Research Working Paper No. WPS 4933. Washington, DC: World Bank. Available at: http://documents.worldbank.org/curated/en/727741468113058335/Tax-policy-to-reduce-carbon-emissions-in-south-Africa
Doczi, J., Calow, R. and d’Alançon, V. (2014) Growing more with less: China’s progress in agricultural water management and reallocation. London: Overseas Development Institute, Development Progress.
Endle, A., Berger, G. and Sedlacko, M. (2012) ‘Renewing the commitment for SD: stocktaking of international and European SD objectives and goals pre-Rio+ 20’, ESDN Quarterly Report 24. Vienna: European Sustainable Development Network Office at the Research Institute for Managing Sustainability, Vienna University of Economics and Business.
Euromonitor (2014) ‘Global Retail E-Cmmerce Index,’ A.T. Kearney, ‘Global Retail E-Commerce Keeps On Clicking (206 Eds),’ ATKearney. Available at: https://www.atkearney.com/documents/10192/5691153/Global+Retail+E-Commerce+Keeps+On+Clicking.pdf/abe38776-2669-47ba-9387-5d1653e40409 [Accessed 28 August 2016].
Everett, T., Ishwaran, M., Ansaloni, G.P. and Rubin, A. (2010) Economic Growth and the Environment. Defra Evidence and Analysis Series. London: UK Department for Food, Environment and Rural Affairs.
Ezealaji, N.L.O. and Adenegan, K.O. (2014) ‘The role of Agricultural market reform in enhancing farmer’s income in Nigeria’, African Journal of Marketing Management 6(3): 27-32.
FAO (Food and Agriculture Organization of the United Nations) (2011a) Recent trends in world food commodity prices: costs and benefits. Past and future trends in world food prices. Rome: Food and Agriculture Organization of the United Nations.
FAO (2011b) The State of the World’s Land and Water Resources for Food and Agriculture: Managing Systems at Risk. Rome: Food and Agriculture Organization of the United Nations.
FAO (2013) ‘Policy Support Guidelines for the Promotion of Sustainable Production Intensification and Ecosystem Services’. Rome: Plant Production and Protection Division Food and Agriculture Organization of the United Nations, Integrated Crop Management 19-2013.
FAO (2015) World Agriculture: Towards 2015/2030. An FAO perspective. Paris: FAO.
Ferreira, F.H. (1999) Inequality and economic performance: a brief overview to theories of growth and distribution. Washington, DC: World Bank.
Foley, J.A., DeFries, R., Asner, G.P., Barford, C., Bonan, G., et al. (2005) ‘Global Consequences of Land Use,’ Science 309(5734): 570–574
Geist, H.J., and Lambin, E.F. (2002) ‘Proximate causes and underlying driving forces of tropical deforestation’. BioScience 52: 143-150.
Glenn, J.C. and Gordon J.T. (2001) Factors required for successful implementation of futures research in decision making. Washington, DC: Millennium Project. Available at http://www.millennium-project.org/millennium/applic-exsum.html [Accessed 24 May 2016].
Godet, M. and Roubelat, F. (1996) ‘Creating the future: The use and misuse of scenarios’, Long Range Planning 29: 164-171.
Government Office for Science, UK (2011) Future of food and farming: final project report. London: UK Government Office for Science.
Granoff, I. and Hogarth, J.R. (2015) Universal energy access: can we make it sustainable? London: Overseas Development Institute, Development Progress.
Gregory, P.J., Atkinson, C.J., Bengough, A.G. Else, M.A., et al. (2013) ’Contributions of roots and rootstocks to sustainable, intensified crop production’, Journal of Experimental Botany 64(5): 1209-1222.
Grida-Arundale Center and UNEP (United Nations Environment Programme) (2016) ‘Vital Climate Graphics Africa: African emissions: African primary sources of GHG, emissions per capita, and comparison with emissions from other countries’. Available at http://www.grida.no/publications/vg/africa/page/3113.aspx [Accessed 29 October 2016].
Grossman, G.M., and Krueger, A.B. (1991) Environmental impacts of a North American free trade agreement (No. w3914). Cambridge, MA: National Bureau of Economic Research.
Grossman, G.M. and Krueger, A.B. (1994) Economic growth and the environment (No. w4634). Cambridge, MA: National Bureau of Economic Research.
GSMA (Groupe Speciale Mobile) (2015) ‘The Mobile Economy Sub-Saharan Africa 2015’, GSMA Connected Women. Available at: https://www.gsmaintelligence.com/ [Accessed 28 August 2016].
Hamududu, B. and Killingtveit, A. (2012) ‘Assessing climate change impacts on global hydropower’, Energies 5(2): 305-322.
Hassan, A., Ijaz, S.S., Lal, R., Barker, D., et al. (2016) ‘Tillage effect on partial budget analysis of cropping. intensification under dryland farming in Punjab, Pakistan’, Archives of Agronomy and Soil Science 62(2): 151-162.
IAEG-SDGs (Inter-agency Expert Group on SDG Indicators) (2016) ‘Compilation of Metadata for the Proposed Global Indicators for the Review of the 2030 Agenda for Sustainable Development: Metadata compilation for Goal 2’, IAEG-SDGs. Available at http://unstats.un.org/sdgs/files/metadata-compilation/Metadata-Goal-2.pdf [Accessed 23 September 2016].
ICSU (International Council for Science) and International Social Science Council (ISSC) (2015) Review of the Sustainable Development Goals: The Science Perspective. Paris: International Council for Science (ICSU).

68 Development Progress Research Report
IMF (International Monetary Fund) (2015) ‘Causes and Consequences of Income Inequality: A Global Perspective’, Strategy, Policy, and Review Department. Washington, DC: IMF. Available at https://www.imf.org/external/pubs/ft/sdn/2015/sdn1513.pdf [Accessed 27 October 2016].
IPCC (Intergovernmental Panel on Climate Change) (2006) 2006 IPCC Guidelines for National Greenhouse Gas Inventories. Bonn: Intergovernmental Panel on Climate Change.
Jacobs, M.D. and Hanrahan, N.W. (2008) The Blackwell companion to the sociology of culture. Oxford: John Wiley and Sons.
James, R. and Washington, R. (2013) ‘Changes in African temperature and precipitation associated with degrees of global warming’, Climatic change 117(4): 859-872.
Johnson, M.E., Edelman, B. and Kazembe, C. (2016) A farm-level perspective of the policy challenges for export diversification in Malawi. Washington, DC: International Food Policy Research Institute.
Jones, L. and Carabine, E. (2013) Exploring political and socio-economic drivers of transformational climate policy: Early insights from the design of Ethiopia’s Climate Resilient Green Economy Strategy. ODI Working Paper. London: Overseas Development Institute.
Kemal, A.R. (2006) ‘Income Inequalities in Pakistan and a Strategy to Reduce Income Inequalities’, Background Paper for PRSP-II, PRSP Secretariat. Islamabad: Government of Pakistan.
Khan, A., Naveed, A., Samman, E., Sarwar, M.B. et al. (2015) ‘Progress under scrutiny: Poverty reduction in Pakistan’. London: ODI, Development Progress.
Klasen, S. and Schüler, D. (2011) ‘Reforming the gender-related development index and the gender empowerment measure: Implementing some specific proposals’, Feminist Economics 17(1): 1-30.
KPMG. (2016) ‘Sector Report: Manufacturing in Africa’, KPMG. Available at www.kpmg.com/africa [Accessed 31 October 2016].
Kurzweil, R. (2004) ‘The law of accelerating returns’ in C. Teuscher (ed.) Alan Turing: Life and Legacy of a Great Thinker, (pp. 381-416). Berlin: Springer-Verlag.
Kuznets, S. (1955) ‘Economic growth and income inequality’, The American economic review 45(1): 1-28.
Lenhardt, A. (2015) In quest of inclusive progress: exploring intersecting inequalities in human development. London: Overseas Development Institute.
Lenhardt, A., Glennie, J., Intscher, N., Ali, A. et al. (2014) ‘A greener Burkina: sustainable farming techniques, land reclamation and improved livelihoods’. London: Overseas Development Institute, Development Progress.
Lenhardt, A., Rogerson, A., Guadagno, F., Berliner, T. et al. (2015) ‘One foot on the ground, one foot in the air Ethiopia’s delivery on an ambitious development agenda’. London: Overseas Development Institute.
Leturque, H. and Wiggins, S. (2011) ‘Thailand’s progress in Agriculture: Transition and sustained productivity growth’. London: Overseas Development Institute, Development Progress.
Lieuw-Kie-Song, M. (2011) ‘Integrating public works and cash transfers in Ethiopia: implications for social protection, employment and decent work’ (No. 84). Brasilia: International Policy Centre for Inclusive Growth.
Light, P. C. (2005) The four pillars of high performance: How robust organisations achieve extraordinary results. New York: McGraw-Hill.
Lin, J. (2012) Youth bulge: a demographic dividend or a demographic bomb in developing countries? Washington, DC: World Bank.
Maggio A., Van Criekinge T. and Malingreau, J-P. (2015) Global Food Security 2030- Assessing Trends in View of Guiding Future EU Policies. Luxembourg: Publications Office of the European Union.
Mazé, R. and Jacobs, M. (2003) ‘Underdogs and superheroes: Designing for new players in public space’ in Proceedings of cost. Göteborg: PLAY, Interactive Institute.
McHale, B. (2003) Postmodernist fiction. London: Routledge.
McKinsey and Company (2016) ‘Automation, jobs, and the future of work’. Available at http://www.mckinsey.com/global-themes/employment-and-growth/automation-jobs-and-the-future-of-work [Accessed 28 October 2016].
Melamed, C. (2013) ‘Economic Growth and Transformation in The Post-2015 Agreement: Background Paper Prepared for The 3rd Meeting of The High Level Panel Of Eminent Persons On Post-2015 Agenda, in Monrovia, Liberia’. London: Overseas Development Institute.
Melamed, C. (2015) ‘Leaving no one behind: How the SDGs can bring real change’. London: Overseas Development Institute.
Müller, A. W. (2008) Strategic Foresight – Prozesse strategischer Trend – und Zukunftsforschung in Unternehmen. Dissertation, St Gallen University.
Newborne, P. (2014) ‘Advancing hydropower sustainability from project design to sector planning’. London: Overseas Development Institute, Development Progress.
Newborne, P., and Welham, B. (2014) ‘Joining the grid: Sustainable energy in Brazil’. London: Overseas Development Institute, Development Progress.
Nijbroek, R.P. and Andelman, S.J. (2016) ‘Regional suitability for agricultural intensification: a spatial analysis of the Southern Agricultural Growth Corridor of Tanzania’, International Journal of Agricultural Sustainability 14(2): 231-247.
OECD (Organisation for Economic Co-operation and Development) (2012a) ‘Inequality in Labour Income: What Are Its Drivers and How Can It Be Reduced?’,

The Sustainable Development Goals and their trade-offs 69
OECD Economics Department Policy Note 8. Paris: OECD.
OECD (2012b) ‘Reducing Income Inequality While Boosting Economic Growth: Can It Be Done?’, in Economic Policy Reforms: Going for Growth. Paris: OECD.
OECD (2015) ‘Aligning Policies for the Transition to a Low-Carbon Economy’. Meeting of the OECD Council at Ministerial Level Paris, 3-4 June 2015. Paris: OECD.
OECD/FAO (2016) OECD-FAO Agricultural Outlook 2016-2025. Paris: OECD.
Okrah, L. (1999) The Bane of Sustainable Forest Management in Africa: The Case of Ghana. Uruguay: World Rainforest Management.
Olinto, P. and Uematsu, H. (2013) ‘The state of the poor: where are the poor and where are they poorest?’, World Bank Poverty and Equity Department. Washington, DC: World Bank.
Ostry, M.J.D., Berg, M.A. and Tsangarides, M.C.G. (2014) ‘Redistribution, inequality, and growth’. Washington, DC: International Monetary Fund.
Pan African Climate Justice Alliance (2016) ‘Economic Cost of Climate Change in Africa’. Available at http://www.christianaid.org.uk/images/economic-cost-of-climate-change-in-africa.pdf [Accessed 21 October 2016].
Place, F. and Meybeck, A. (2013) ‘Food security and sustainable resource use –what are the resource challenges to food security? Background paper for the conference: Food Security Futures: Research Priorities for the 21st Century’. Conference paper, 11-12 April 2013, Dublin, Ireland.
Rabinowitz, G. and Prizzon, A. (2015) ‘Financing for development: Lessons from Development Progress case studies’. London: Overseas Development Institute, Development Progress.
Rasmussen, L., B. (2005) ‘The narrative aspect of scenario building – How story telling may give people a memory of the future’, AI and Society 19:229-249.
Redclift M. (2005) ‘Sustainable development (1987-2005): an oxymoron comes of age’, Sustain Dev. 13:212-227.
Sachs, J.D. (2015) The age of sustainable development. Columbia: Columbia University Press.
Sanchez-Triana, E., Biller, D., Nabi, I., Ortolano, L., Dezfuli, G., Afzal, J. and Enriquez, S. (2014) Revitalizing industrial growth in Pakistan: Trade, infrastructure, and environmental performance. World Bank Publications.
Save the Children (2012) ‘A High Price to Pay The impact of rising and volatile food prices on children’s nutrition and food security’. London: Save the Children.
SDSN (Sustainable Development Solutions Network) (2013) ‘The Structural Transformations towards Sustainable Development’. Geneva: Secretariat of the Sustainable Development Solutions Network.
Shepherd, A., Mariotti, C. and Rogriguez-Takeuchi, L. (2016) ‘What policy lessons can be learnt from cases
of pro-poorest growth?’ London: Chronic Poverty Advisory Network.
South Africa INDC (Intended Nationally Determined Contribution) (2016) ‘South Africa’s Intended Nationally Determined Contribution’. Bonn: UNFCCC. Available at http://www4.unfccc.int/ndcregistry/PublishedDocuments/South%20Africa%20First/South%20Africa.pdf
Spaiser, V., Ranganathan, S., Swain, R.B. and Sumpter, D.J. (2016) ‘The Sustainable Development Oxymoron: Quantifying and Modelling the Incompatibility of Sustainable Development Goals’, International Journal of Sustainable Development and World Ecology.
Steer, L., Engel, J., McWilliam, A. and Vandemoortele, M. (2011) ‘Mapping Progress: Evidence for A New Development Outlook’. London: Overseas Development Institute.
Stern, D.I., Common, M.S. and Barbier, E.B. (1996) ‘Economic growth and environmental degradation: the environmental Kuznets curve and sustainable development’, World Development 24: 1151-1160.
Stern, N. (2006) The Stern Review: The Economics of Climate Change. London: HM Treasury.
Szabó, S., Bodis, K., Huld, T., Pinedo, I., et al. (2011) ‘Energy options in rural Africa: solar and diesel distributed systems vs grid extension’. Ispra: Joint Research Centre, European Commission.
Szirmai, A. (2015) ‘How Useful Are Global Development Goals?’. Tokyo: United Nations University. Available at http://unu.edu/publications/articles/reflection-on-global-goals.html [Accessed 26 October 2016].
Townsend, R. (2015) ‘Ending poverty and hunger by 2030: an agenda for the global food system’. Washington, DC: World Bank Group.
UN (United Nations) (1992a) ‘United Nations Framework Convention On Climate Change,’ United Nations, [Online] Available at http://unfccc.int/files/essential_background/background_publications_htmlpdf/application/pdf/conveng.pdf [Accessed 18 December 2016]
UN (United Nations) (1992b) ‘Rio Declaration on Environment and Development’, United Nations, [Online] Available at http://www.un.org/documents/ga/conf151/aconf15126-1annex1.htm [Accessed 4 January 2017].
UN (United Nations) (1992c) ‘United Nations Conference on Environment and Development Rio de Janerio, Brazil, 3 to 14 June 1992: Agenda 21,’ United Nations Sustainable Development, [Online] Available at https://sustainabledevelopment.un.org/content/documents/Agenda21.pdf [Accessed 4 January 2017]
UN (United Nations) (1992d) Report of the United Nations Conference on Environment and Development Rio De Janeiro, 3-14 June 1992: Annex III: Non-Legally Binding Authoritative Statement of Principles For A Global Consensus On The Management,

70 Development Progress Case Study
Conservation and Sustainable Development of all Types of Forests, ‘United Nations, [Online] Available at http://www.un.org/documents/ga/conf151/aconf15126-1annex1.htm [Accessed 4 January 2017]
UN (United Nations) (1998) ‘Kyoto Protocol to The United Nations Framework Convention on Climate Change,’ United Nations, [Online] Available at http://unfccc.int/resource/docs/convkp/kpeng.pdf [Accessed 24 December 2016]
UN (United Nations) (2002) ‘United Nations Convention to Combat Desertification,’ United Nations, [Online] Available at http://www.unccd.int/Lists/OfficialDocuments/cric1/8eng.pdf [Accessed 18 December 2016]
UN (United Nations) (2015) ‘Paris Agreement,’ United Nations, [Online] Available at ‘http://unfccc.int/files/essential_background/convention/application/pdf/english_paris_agreement.pdf [Accessed 4 January 2017]
UNCTAD (United Nations conference on Trade and Development) (2015) ‘Information Economy Report 2015 - Unlocking the Potential of E-commerce for Developing Countries’. Geneva: UNCTAD. Available at: http://unctad.org/en/PublicationsLibrary/ier2015_en.pdf [Accessed 28 August 2016].
UNData (2016) ‘UN Data’ New York: UNstats. Available at http://data.un.org/ [Accessed 28 October 2016].
UNDESA (United Nations Department of Economic and Social Affairs, Statistics Division) (2016a) ‘SDG Indicators Metadata repository: Goal 15 Protect, restore and promote sustainable use of terrestrial ecosystems, sustainably manage forests, combat desertification, and halt and reverse land degradation and halt biodiversity loss’. Rome: UNDESA. Available at http://unstats.un.org/sdgs/files/metadata-compilation/Metadata-Goal-15.pdf [Accessed 23 September 2016].
UNDESA (2016b) ‘Sustainable Development Goal 8: Promote sustained, inclusive and sustainable economic growth, full and productive employment and decent work for all’. Rome: UNDESA. Available at: https://sustainabledevelopment.un.org/sdg8 [Accessed 28 August 2016].
UNDESA (2016c) ‘Sustainable Development Goal 10: Reduce inequality within and among countries’. Rome: UNDESA. Available at: https://sustainabledevelopment.un.org/sdg10 [Accessed 28 August 2016].
UNDP (United Nations Development Programme) (1996) Human Development Report 1996. New York: Oxford University Press for UNDP.
UNDP(United Nations Development Programme) (2012) ‘Agriculture and Food Security Policy Brief Reflecting on the Challenges of Attaining a Green Economy for Botswana’. New York: UNDP. Available at: https://sustainabledevelopment.un.org/content/documents/1008National%20Report%20(Agriculture)%20-%20Botswana.pdf [Accessed 28 August 2016].
UNDP (United Nations Development Programme) (2016) ‘Human Development Data (1980-2015)’. New York: UNDP. Available at http://hdr.undp.org/en/data (Accessed 18 September 2016).
UNEP (United Nations Environment Programme) (2009) ‘Africa Carbon Asset Development (ACAD) Facility,’ UNEP- Climate Change Finance, [Online] Available at http://www.unep.org/climatechange/finance/CarbonFinance/ACAD/tabid/29564/Default.aspx [Accessed 4 January 2017]
UNEPDTU Partnership (2016) ‘The UNEP DTU Partnership,’ UNEPDTU Partnership, [Online] Available at http://www.unepdtu.org/ [Accessed 4 January 2017]
UNFCCC (United Nations Framework Convention on Climate Change) (2016) ‘NAPAs received by the secretariat’. Bonn: UNFCC. Available at http://unfccc.int/adaptation/workstreams/national_adaptation_programmes_of_action/items/4585.php [Accessed 20 October 2016].
UNFPA (United Nations Population Fund) (2014) ‘The power of 18 billion: Adolescents, youth and the transformation of the future’ in State of world population. New York: UNFPA. Available at: http://www.unfpa.org/sites/default/files/pub-pdf/EN-SWOP14-Report_FINAL-web.pdf. [Accessed 18 October 2016].
UNIDO (United Nations Industrial Development Organization). (2016) ‘Employment, Wages and related Indicators by Industry, at current prices, for selected years in Sri Lanka’. Vienna: UNIDO. Available at: http://www.unido.org/Data1/IndStatBrief/E_Employement_Wages_and_Employment_Share_per_Sector.cfm?print=no&ttype=C4&Country=SRL&Group [Accessed 28 August 2016].
UNMP (United Nations Millennium Project) (2005) Halving Hunger: It Can Be Done. New York: The Earth Institute at Columbia University.
Van ‘t Klooster, S. A. and van Asselt, M. B. A. (2006) ‘Practising the scenario-axes technique’, Futures 38:15-30.
Vandemoortele, M. and Bird, K. (2011a) ‘Malawi’s story: Improved economic conditions in Malawi: progress from a low base’. London: Overseas Development Institute, Development Progress.
Vandemoortele, M. and Bird, K. (2011b) ‘Viet Nam’s Progress on Economic Growth and Poverty Reduction: Impressive improvements’. London: Overseas Development Institute, Development Progress.
Waggoner, P. E. (1995) ‘How much land can ten billion people spare for nature? Does technology make a difference?’, Technology in Society 17(1): 17-34.
WCED (World Commission on Environment and Development) (1987) Report of the World Commission on Environment and Development: Our Common Future (‘The Brundtland Report’). WCED, Oslo, March 1987.

The Sustainable Development Goals and their trade-offs 71
WEF (World Economic Forum) (2016a) ‘The Global Competitiveness Index 2015–2016 Rankings’. Cologne: World Economic Forum. Available at http://reports.weforum.org/global-competitiveness-report-2015-2016/report-highlights/#regions [Accessed 23 October 2016].
WEF (2016b) ‘The Global Risks Report 2016, 11th Edition’. Cologne: WEF. Available at http://www3.weforum.org/docs/Media/TheGlobalRisksReport2016.pdf [Accessed 10 November 2016].
Whitley, S. and van der Burg, L. (2015) ‘Fossil fuel subsidy reform in sub-Saharan Africa: from rhetoric to reality’. London and Washington, DC: New Climate Economies.
Wiggins, S. and Leturque, H. (2011) ‘Ghana’s sustained agricultural growth: Putting underused resources to work’. London: Overseas Development Institute, Development Progress.
World Bank (2002) ‘Poverty in Pakistan: Vulnerabilities, Social Gaps, and Rural Dynamics,’ Poverty Reduction and Economic Management Sector Unit, World Bank - South Asia Region, [Online] Available at http://documents.worldbank.org/curated/en/282761468775155766/pdf/multi0page.pdf [Accessed 4 January 2017]
World Bank (2014a) Ethiopia poverty assessment report 2014. Addis Ababa: World Bank.
World Bank (2014b) Botswana: Skills for Competitiveness and Economic Growth. Washington, DC: World Bank.
World Bank (2015a) ‘Decarbonizing Development: Three Steps to a Zero Carbon Future’ in Fay, M., Hallegatte, S., Vogt-Schilb, A. et al. (eds) (2015) Decarbonizing development: three steps to a zero-carbon future. Washington, DC: World Bank.
World Bank (2015b) Sri Lanka: Ending Poverty and Promoting Shared Prosperity. Systematic Country Diagnostic. Washington, DC: World Bank.
World Bank (2015c) World Development Report: Mind, Society, and Behaviour. Washington, DC: World Bank.
World Bank (2015d) The Global Database of Shared Prosperity. Washington, DC: World Bank.
World Bank (2015e) Botswana: Systematic Country Diagnostic. Systematic Country Diagnostic. Washington, DC: World Bank.
World Bank (2015f) ‘From Evidence to Policy - Innovations in Shaping Reforms in Africa’, conference July 21-24, 2015, Cape Town, South Africa. Available at: http://www.worldbank.org/en/events/2015/06/25/from-evidence-to-policy-innovations-in-shaping-reforms-in-africa [Accessed 9 December 2016].
World Bank (2016a) ‘Data: GDP Growth (Annual %)’. Washington, DC: World Bank. Available at http://data.worldbank.org/indicator/NY.GDP.MKTP.KD.ZG?locations=ZG-MW-NA-MG-MU-ZA-LS-BW-ZW-ZM-SZ&start=2004&end=2004&view=bar (Accessed 20 September 2016).
World Bank (2016b) ‘World Development Indicators’. Washington, DC: World Bank. Available at: http://data.worldbank.org/data-catalog/world-development-indicators [Accessed 28 August 2016].
WRI (World Resources Institute) (2016) Climate Analysis Indicators Tool 2.0. Washington, DC: WRI. Available at: http://www.wri.org/our-work/project/cait-climate-data-explorer] Accessed 21 October 21, 2016.
Yandle, B., Bhattarai, M. and Vijayaraghavan, M. (2004) ‘Environmental Kuznets Curves: A Review of Findings, Methods, and Policy Implications’. PERC Research Studies. RS-02-1a. Bozeman, MT: Property and Environment Research Center.
Yin, R. (2012) Applications of case study research (3rd edn). Thousand Oaks, CA: Sage.
Young, A. (2013) ‘Inequality, the Urban-Rural Gap and Migration’, Quarterly Journal of Economics 128(4): 1727-1785.
Zaza, S., Wright-De Agüero, L.K., Briss, P.A., Truman, B.I., et al. (2000) ‘Data collection instrument and procedure for systematic reviews in the Guide to Community Preventive Services,’ American journal of preventive medicine, 18(1) 44-74.

Appendices
1 Study methodology
1.1 Study design
We used a cumulative case-study design that, according to Yin (2012), draws findings from many case studies to answer a question, whether normative, descriptive, or cause-and-effect. This is particularly important for this fictional case study because it draws from lessons learned in other – real – countries. To develop alternative future scenarios, the study employed normative scenarios. In broad terms, scenario analysis develops a range of possible pathways about how the future could unfold, before identifying optimal policy tools to achieve the preferred outcomes (Chermarck et al., 2006; Müller, 2008). Rooted in foresight studies, scenario analysis has proved useful in informing strategic governmental policy-making (Glenn and Gordon, 2001; Light, 2005; Bradfield, 2005; Bishop et al., 2007). For this case study, scenario-mapping was adapted as a thinking framework to develop and clarify practical choices, policy trade-offs and alternative actions for a given combination of SDGs. Also, by displaying the consequences of particular key drivers, scenarios can inform frameworks to evaluate possible outcomes through their multiple hypotheses (Bradfield et al., 2005).
Through this approach, we were able to build on what is known while incorporating the uncertainties and emerging issues that may have as much impact as today’s known trends. Each scenario considered a different set of outcomes for contextual risks and uncertainties, which meant they could be managed proactively. The aim of scenario-mapping was, therefore, to envisage alternative pathways for development thinking and approaches for future policy solutions that are integrative and balanced around the economic, social and environmental dimensions of sustainable development.
1.2 Social and environmental (SEN) targets and indicatorsEnding hunger and achieving food and nutrition security (SDG 2) is a complex, multidimensional goal because it couples environmental, economic and social processes. Although sustainable agricultural practices for food production are critical for the achievement of SDG 2, other equally important factors include reducing inequality and improving access to safe drinking water and sanitation. But for Progressia, like other countries in the savannah region of southern Africa, the clearing of forests for subsistence agriculture is the main cause of deforestation (Geist and Lambin, 2002). Most deforestation areas are also hot spots of poverty and hunger (UNMP, 2005).
We narrowed our analysis to SDG target 2.3 and its indicator 2.3.1 (See Table 1) because this is one of the few indicators that has data available. Consistent with the indicator definition provided by the Inter-Agency Expert Group on SDG Indicators (IAEG-SDGs, 2016), indicator 2.3.1 refers to the value of production per labour unit operated by small-scale producers in the farming (or pastoral and forestry) sectors. Although the lack of a common conceptualisation of ‘small-scale producer’ may hinder the understanding of this indicator, the IAEG-SDGs metadata suggests tabulation of data by size of the farm, and the gender and age of the farmer. Here, an increase in the number of individuals owning or managing small-scale farms, coupled with an increased volume of farm output would suggest progress on local food/nutrition security and on income.
On the environment goal, we reviewed SDG target 15.2 and its indicator 15.2.1 because of data availability. The latter monitored changing trends in the history, ecological circumstances, and competing land uses in forest areas, including uncontrolled deforestation (UNDESA, 2016a). Specifically, we combined indicators 2.3.1 and 15.2.1 to represent the social and environmental dimension (SEN) (see Table 1).
72 Development Progress Case Study
Figure 8: Social and environmental targets
What would it look like if Progressia combined agriculture and
environmental policies to reduce deforestation and to address hunger,
while improving the livelihoods of impoverished people who depend
on these areas for food production and income generation?
† SDG2 does include the environmental dimension of sustainable
development i.e. SDG targets 2.4, and 2.5. Although we have catego-
rised it as social, it must be noted that such overlaps do exist and must
be acknowledged. For purposes of this paper, we have categorised
these under the social dimension of sustainable development.
1.3 Economic and environmental (EEN) targets and indicators How can economic growth in Progressia be reconciled with environmental sustainability, in a fashion that increases the manufacturing sector’s jobs contributions while keeping carbon emissions in check?
For economic and environmental targets we considered the impacts of merging SDG 9 target 9.2 on inclusive and sustainable industrialisation and its indicator of significantly raising manufacturing/industry’s share of employment in the economy, and 9.4 on upgrading industrial infrastructure to meet urgent environmental sustainability, and its indicator of reducing GHGs.
Target 9.2 looks at how economic development is influenced by outputs of industry or manufacturing as key productive sectors in developing-world economies. UNStats defines manufacturing as the physical or chemical transformation of materials into new products, whether by machines or by hand, in a factory or in a home, for sale (UN Data, 2016). Rather than use the suggested indicator for this target, manufacturing value added (MVA) as a percentage of GDP, our analysis (see Chapter 5) introduces a human dimension into the equation by opting for manufacturing’s contribution to the economy’s global tally of employment.
Using this indicator allows SDG 9 and its target 9.2 to escape the usual sanction against conflating economic growth with better lives. This chimes with the arguments set out as long ago as in the UNDP Human Development Report 1996, that economic growth is simply a means – the end is human development. Economic growth should, therefore, be managed to avoid growth that is jobless, voiceless, ruthless, rootless and futureless (UNDP, 1996). This approach, while adding a social element to the economic focus of SDG 9 and target 9.2, also adds complexity to the anticipated synergies and trade-offs, as it allies the target and indicator to SDG 8 and target 8.1 (discussed in Chapter 6).
Target 9.4 is a facilitator target, aiming to reduce the impact of industrialisation on the environment by promoting the upgrading of industrial infrastructure. This could be done through retrofitting to make infrastructure eco-friendly, as a sustainability measure that increases the
efficient use of resources, preferably via clean energy that has a more limited impact on the environment.
We focus on the GHG emissions indicator, which tracks total GHG emissions in tons of CO2 equivalent (tCO2e). The indicator aims to track carbon emissions across sectors like petroleum refining, electricity and heat production, manufacturing, construction, transport, commercial and residential buildings as outlined in the Intergovernmental Panel on Climate Change (IPCC) 2006 guidelines for the national GHG inventory (IPCC, 2006).
We also, however, focus on trade-offs related to the impact of emission reductions on target 9.2 as a result of measures to tackle emissions from manufacturing industries. While not immediately apparent, the trade-offs and synergies will also have impacts on progress towards other goals like SDGs 7, 11 and 13 on alternative energy use, sustainable human settlements and climate change adaptability, respectively.
This matters, given the views expressed in development literature and elsewhere that SDGs 8 and 9 are not goals in themselves, but enablers and critical elements of the theory of change for the attainment of other SDGs. This train of thought argues that the two goals are responses to criticisms about the lack of answers to the ‘how’ questions in the previous development era of the MDGs (Spaiser et al., 2016).
The Sustainable Development Goals and their trade-offs 73
Figure 9: Economic and environmental targets
How can economic growth in Progressia be reconciled with environ-
mental sustainability, in a fashion that increases the manufacturing
sector’s jobs contributions while keeping carbon emissions in check?

1.4 Social and economic (SEC) targets and indicators The economic dimension, represented by SDG target 8.1, was selected to allow comparability with the social dimension: sustain per capita economic growth in accordance with national circumstances and, in particular, at least 7% gross domestic product growth per annum in the least developed countries. This target was supported with data from indicator 8.1.1 variables: annual growth rate of real GDP per capita. Achieving consistent GDP growth per capita of 7% has been a difficult feat for most countries. China is one of the very few countries that managed to maintain this pace of growth between 2000 and 2013. The global annual growth rate of real GDP per capita increased by only 1.3% in 2014, far lower than the 2.8% in 2010 and 3.0% in 2000 (UNDESA, 2016b). Given that the achievement of this target has, to date, been sporadic and far from the norm, our analysis focuses on shorter periods where countries were able to achieve this level of growth.
On SDG 10, reducing inequalities, we selected target 10.1, which focuses on growth rates of household expenditure or income per capita among the bottom 40% of the population and the total population. This social dimension target was selected because of its relationship to (and ability to highlight) trade-offs and synergies with the economic growth target. While this target indicator is income related, it does not look at economic growth per se, since broader GDP growth does not necessarily imply that the incomes of the bottom 40% will rise. Similarly, it is possible for the incomes of the bottom 40% to rise even when GDP growth stagnates (UNDESA, 2016c).
2 Scenario-mapping and analysis
2.1 Evidence reviewDrawing from Development Progress case studies in developing countries (see the full list in Appendix 10.3), we identified countries that performed well in all or one of the targets selected. We also identified the social-economic-environmental (SEE) drivers that had the greatest impact on selected targets. An analysis of these case studies and other secondary data sources through an extensive desk review of the literature helped us to synthesise and understand the factors that drive change and success, and assess trade-offs between individual goals.
2.2 Inclusion and exclusion criteria The review centred on aspects of progress around the selected targets or their indicators and it excluded evidence on progress areas that did not fall in the goals or targets listed in Table 1. This enabled the team to focus on the analysis and to go into greater detail in understanding the inherent trade-offs and synergies between selected individual goals. In light of the differences in definitions of success or what progress entails, the review focused on published Development Progress case studies and other development-focused published and peer-reviewed articles.
2.3 The evidence collection protocol and abstraction toolThe evidence review was conducted through three clearly outlined steps. First: the identification of all relevant studies that spoke to the selected SDG targets. Second: the assessment of the inclusion and exclusion criteria of these studies. And third: a critical evaluation of the best studies so that their evidence could be summarised. This process enabled the critical evaluation and review of a large body of evidence, policy recommendations and key drivers of success. As well as increasing the precision of evidence, it also enabled a synchronised approach towards the summarising of relevant policies implemented in the various countries for the selected target areas. We adapted the evidence abstraction protocol from the recommendations of Zaza et al. (2000) on how to conduct systematic reviews.
74 Development Progress Case Study
Figure 10: Social and economic targets
How can economic growth in Progressia be reconciled with environ-
mental sustainability, in a fashion that increases the manufacturing
sector’s jobs contributions while keeping carbon emissions in check?

3 Development Progress case studies
Country Case study title and link
Africa
Benin Benin's progress in education: expanding access and narrowing the gender gap
Burkina Faso Progress in urban water supply in Burkina Faso
Burkina Faso A greener Burkina: sustainable farming techniques, land reclamation and improved livelihoods
Burkina Faso Pipes and people: progress in water supply in Burkina Faso's cities
Eritrea Progress in health in Eritrea: cost-effective inter-sectoral interventions and a long-term perspective
Ethiopia One foot on the ground, one foot in the air: Ethiopia’s delivery on an ambitious development agenda
Ethiopia Ethiopia's progress on education: a rapid and equitable expansion of access
Ghana Ghana, the rising star: progress in political voice, health and education
Ghana Ghana's sustained agricultural growth: putting underused resources to work
Kenya Beyond basics: the growth of post-primary education in Kenya
Liberia Progress in small steps: security against the odds in Liberia
Malawi Improved economic conditions in Malawi: progress from a low base
Mauritius Progress in economic conditions in Mauritius: success against the odds
Morocco The road to reform: women's political voice in Morocco
Mozambique Against the odds: Mozambique's gains in primary health care
Namibia Sustainable natural resource management in Namibia: successful community-based wildlife conservation
Rwanda Rwanda's progress in health: leadership, performance and health insurance
Sierra Leone No longer neglected: tackling Sierra Leone's neglected tropical diseases
Somaliland Somaliland's progress on governance: a case of blending the old and the new
South Africa South Africa's social security system: expanding coverage of grants and limiting increases in inequality
Tunisia Building momentum: women’s empowerment in Tunisia
Uganda Work in progress: productive employment and transformation in Uganda
Uganda Rural water supply in Uganda: major strides in sector coordination and performance
Asia
Bangladesh Bangladesh's progress in health: healthy partnerships and effective pro-poor targeting
Bhutan Valuing the contribution of the environment to Gross National Happiness in Bhutan
Cambodia Neglected tropical diseases: the case of Cambodia
Cambodia Rebuilding basic education in Cambodia: establishing a more effective development partnership
China Growing more with less: China’s progress in agricultural water management and reallocation
India Progress in providing employment for the poor: the national public works programme in India
India Towards a better life? A cautionary tale of progress in Ahmedabad
Indonesia Towards better education quality: Indonesia’s promising path
Indonesia Indonesia's progress on governance: state cohesion and strategic institutional reform
Lao Unsung progress in rural sanitation: building the foundations in Lao PDR
Mongolia From decline to recovery: post-primary education in Mongolia
The Sustainable Development Goals and their trade-offs 75
Nepal Nepal's story: understanding improvements in maternal health
Pakistan Progress under scrutiny: poverty reduction in Pakistan
Sri Lanka Manufacturing progress? Employment creation in Sri Lanka
Thailand Community-driven development in the slums: Thailand's experience
Thailand Thailand's progress in agriculture: transition and sustained productivity growth
Timor-Leste After the buffaloes clash: moving from political violence to personal security in Timor-Leste
Viet Nam Turning the lights on: sustainable energy and development in Viet Nam
Viet Nam Viet Nam's progress on economic growth and poverty reduction: impressive improvements
Latin America
Costa Rica Costa Rica sustainable resource management: successfully tackling tropical deforestation
El Salvador El Salvador's progress on governance: negotiation, political inclusion and post-war transition
Brazil Joining the grid: sustainable energy in Brazil
Chile Improvements in the quality of basic education: Chile’s experience
Colombia Progress despite adversity: women's empowerment and conflict in Colombia
Ecuador Sharing the fruits of progress: poverty reduction in Ecuador
Peru On the path to progress: improving living conditions in Peru’s slum settlements
76 Development Progress Case Study

The Sustainable Development Goals and their trade-offs 77
Photo: Webby Kahyata with his son at a fishing camp in Barotse floodplain, Zambia. © Clayton Smith.


Overseas Development Institute 203 Blackfriars Road London SE1 8NJ
Tel: +44 (0)20 7922 0300 Email: [email protected]
facebook.com/developmentprogressproject twitter.com/dev_ progress
Designed by Soapbox, www.soapbox.co.uk
This is one of a series of Development Progress Case Studies available at developmentprogress.org Development Progress is a four-year research project which aims to better understand, measure and communicate progress in development. Building on an initial phase of research across 24 case studies, this second phase continues to examine progress across countries and within sectors, to provide evidence for what’s worked and why over the past two decades.
This publication is based on research funded by the Bill & Melinda Gates Foundation. The findings and conclusions contained within are those of the authors and do not necessarily reflect positions or policies of the Bill & Melinda Gates Foundation.
ODI is the UK’s leading independent think tank on international development and humanitarian issues. Further ODI materials are available at odi.org.uk
developmentprogress.org


![Trade-offs between Economic Benefits and Ecosystem Services … · 2020-04-22 · sustainable development [4]. While several Sustainable Development Goals (SDGs) relate to urban expansion,](https://img.dokumen.tips/doc/110x75/5f21f0e73cbc317a7c1024f2/trade-offs-between-economic-benefits-and-ecosystem-services-2020-04-22-sustainable.jpg)