Embed Size (px)
Citation preview

Journal of Coastal Research 1-17 Fort Lauderdale, Florida Winter 1994
The Submarine Equilibrium Profile: A Physical Model
Paul Zi-Fang Lee
Florida Department of Environmental Regulation2600Blair Stone RoadTallahassee, FL 32399, U.S.A.
ABSTRACT••••••••••••••••••
.tflllllll:.esse •
e ,e, TJ"
LEE, P.ZI-F., 1994. The submarine equilibrium profile: A physical model. Journal of Coastal Research.10(1). 1-17. Fort Lauderdale (Florida). ISSN 0749-0208
The Submarine Profile (SP) is the sea floor profile normal to the coast line, located between the surf zoneand wave base. and formed by wave action on the clastic sediment. The Submarine Equilibrium Profile(SEP) is a SP where geometry and sediment movement are in a quasi equilibrium status with offshorenominal waves (the large swell dominating this area). The geometry of the SEP has been identifiedqualitatively and conceptually as a concave upward smooth curve. The slope of SEP becomes gentler andgentler offshore until it is almost horizontal at the so-called wave base. Some empirical equations havebeen proposed and are used widely in engineering. This report summarizes previous field observations,lab experiments and theories concerning mechanisms involved in the formation of this geometry. A seriesof physical equilibrium conditions, including the major mechanical forces involved in particle movement,are used to derive an analytical modeL. This model expresses the geometry of the SEP in an explicit formwhere x is a function of y, in relation with the offshore wave period (or wave length). The basic idea hasbeen qualitatively tested in a wave tank experiment. The final equation was then tested and calibratedon a number of submarine profiles pLotted from three marine basins around the U.S. using a non-linearregression algorithm. The profiles located on the U.S. coasts along the Gulf of Mexico and on southeastU.S. Atlantic coasts were selected following geological and visual criteria which previous researches usedto characterize the SEP concept. The comparison between the theoretical equation and the selected Gulfof Mexico and Atlantic profiles by a non-linear computer regression process showed a satisfactory matchwith high correlation coefficients. The Pacific profiles, located in an area with ongoing active tectonicmovement are generally not in SEP status and have more features deviating from the conceptual andSEP physical models. The wave periods obtained from the nonlinear regression process for some SEP'son the Gulf of Mexico coast are further compared with the available hindcast offshore wave data publishedin 1989. The results of these comparisons are generally encouraging, except those comparisons involvingSP's on the lJ .S. Pacific coast.
ADDITIONAL INDEX WORDS: Breaker zone, shore profile, submarine equilibrium profile, submarineprofile, wave tank experiments.
INTRODUCTION
The submarine profile (SP) and the submarineequilibrium profile (SEP) are widely acceptedterms and concepts (FENNEMAN, 1902; JOHNSON,1919; KUENEN, 1950; PRICE, 1954; FISCH, 1960;BRUUN, 1962; ZENKOVITCH, 1967; DEAN, 1977, 1983,1987; FRIEDMAN and SANDERS, 1978; SWIFT andPALMER, 1976).
The author divides a SP into four large sections,according to the major mechanical forces involvedin forming their geometries (cf Figure 3).
(1) The breaker section, the geometry of whichis mainly determined by the bottom shearforce posed by the shoaling waves, plungingand breaking actions of the breakers and swashand back wash actions;
(2)and (3) The shoaling section and the platformsection, which are beyond the breaker zoneand above so-called 'wave base'. On these SPsections, fluidization of the water-saturated
91052received 3 June 1991; accepted in revision 3 August 1992.
top layer of sediment, caused by the vibratoryfield of the wave action, tends to cancel thefriction and dilatancy to form a perfectly horizontal interface between water and sediment.In the meantime, the shoreward shear forcecaused by the Cornaglia effect is imposed onthe fluidized surface to form a slope.
(4) The repose section, which is the section located beyond the influence of the local swells,where the sediment forms an almost constantrepose slope caused by the interactions between gravity, dilatancy and friction betweenthe grains.
In addition, it is important to keep in mind thatthe general sediment movement direction on thewhole section is from the source on the land toward the marine basin.
The SEP model in this article, especially themathematic expression, is limited in reference tothe SP geometry on sections 2 and 3, where clasticmaterial movement has reached a dynamic balance so that the geometry is undergoing a minimal

2
change; in other words, it is in equilibrium withthe local offshore waves traveling toward the shore.The summary of the past researches in terms ofdescriptive features related to the general geological settings and the geometry of SEP can be regarded as the conceptual model of SEP, and presented as follows;
(1) The SEP is located in areas with minimalpresent tectonic movements.
(2) The SEP is not located in areas associatedwith strong erosional and depositional factors, such as a major river mouth, under anerosional sea cliff, etc.
(3) The SEP has a balanced longshore and onoffshore sediment budget; therefore, no netaccretion or erosion occurs on the profile.
(4) The SEP is indefinitely under the constantactivity of a swell with constant wave parameters.
(5) The SEP is smooth and concave upward, flattening out towards the offshore direction andreaches an almost horizontal platform at adepth of the so-called wave base.
(6) The depth of the wave base is somehow related to the wave length of local large swells.
(7) The SEP geometry is also related to the grainsize of the clastic sediment material; the finerthe grain size, the gentler the profile and itsSEP extends farther from the shore.
The previous researchers found that SP's withthese features are likely to be in an equilibriumcondition and should be called SEP's.
Most of the submarine profiles in the real worldare in either depositional or erosional status, orsome sections are under erosional process whilethe others are receiving sediment. The verticalstructure of the wave activity implies that theupper section of a profile receives larger amountsof wave activity and may more easily reach equilibrium with the recent wave condition than thedeeper part of the same profile. An ideal equilibrium profile must be a very rare case, in whichthe whole profile is in equilibrium with a uniquewave condition.
In the past, a number of investigators have conducted extensive field and laboratory observations and others have suggested empirical equations to describe the wave condition changes dueto bathymetric changes (BAGNOLD, 1940, 196~);
BASCOM, 1951; BRUUN, 1962, 1983; CHEONG, 198:3;COLLINS, 1976; CORNAGLlA, 1887; DAVIS, 1976;DEAN, 1983, 1987, 1990; EAGLESON, 1958, 1961,
Lee
1963; FISHER, 1977; HORIKAWA, 1967; INMAN, 1966;IpPEN, 1955; IWAGAKI, 1963; JOHNSON, 1919; KING,1972; KOMAR, 1973, 1975, 1983; KURIAN, 1950;LONGUET-HIGGINS, 1953; MANOBAR, 1955; MAY,1973,1974; McLEAN, 1969; MURRAY, 1967; PRICE,1954,1969; RANCE, 1969; RECTOR, 1954; SAVILLE,1957; SHEPARD, 1950b; SHORT, 1979; SILVESTER,1971; SONU, 19n; SOULSBY, 1987; SWIFT, 1976;TANNER, 1974, 1988; WATTS, 1954; ZENKOVICH,1967) or the profile response to the sea level change(PER BRUUN, 1962). However, what are the basicmechanisms involved in the formation of the original SEP? Why is it concave upward? Why is ita smooth curve? Why does it become horizontalat a certain depth? Is it possible to devise anequation to express the profile involving somephysical wave conditions? Per Bruun's modelabout the profile upshift associated with sea levelrise is based on kinetic symmetry. Per Bruun'srule is always valid despite the original geometryof SEP.
The profile including the breaker zone has beenstudied by many authors. In many cases, whenthe geometry was attempted by a simple equation,the beach processes acting in the breaker zoneand on the submarine profile were not distinguished or well defined. Dean's equation and PerBruun's profile, also called Beach EquilibriumProfile, are expressed with a continuous andsmooth curve-both include the breaker zone.
Dean's equation
y = Ax
where y is the depth of any point on the bottomprofile,
x is the horizontal distance from theshoreline to the point,
A is a constant related to grain size,
representing a beach equilibrium profile, is an empirical model. This model was applied with anassumed criterion that the equilibrium conditionis established when the wave energy dissipationrate per unit volume of water stays constant during the shoaling process.
However, the hypothesis to relate the wave energy dissipation with a particle-movement-controlled-geometry is a vague one because energy isa scalar (non directional) quantity, not a vector.A random disturbance of sand and water maydissipate a great amount of energy without anynecessary bottom geometry change (especially howthe dynamic energy carried by water waves would
Journal of Coastal Research. Vol. 10, No.1, 1994

The Submarine Equilibrium Profile
.1--_>
00000000000000000000ooooo~oooo000 0 0 a 0 0 0 0
• •000 0 0 ROO 0 00000000 0 0 0
water particle movement under waves
wave form on water surface
3
wave form after 1/8 period ----water particle movement envelope _. _.
Figure J. Airy wave theory.
transfer to the top of the sand particle aggregationhas not been explicitly explained). Similarly, anysymmetrical cyclic movement within a fluid maybe attenuated by dissipating its energy into heat,without changing the shape of its 'container' (theshape confining the volume, in this case the airwater interface, consists of one side of the container, and the bottom profile consists of the othersideof the container) into another definite shape.
Therefore, a dynamic model of SEP may bemorereasonable than an energetic model becausethe former is based on the balance of forces whicharevectors which relate to the shape of the profilewith definite mechanisms. Through these mechanisms, the shape and the forces interact. Wheth-
er the dissipation rate of wave energy changes orkeeps constant is the result of the shoaling processupon the equilibrium profile, but not the cause.
This article proposes a model to relate the geometry of the equilibrium profile as a whole withthe basic wave theory in a logical and semi-quantitative fashion.
THE ANALYTICAL MODEL
Airy's wave theory teaches that the water particles in traveling waves are making cyclic movement in a vertical plane along the direction ofwave propagation. The water particle orbitalmovement diameter attenuates through the increasing depth (Figure 1). For deep water waves,
Journal of Coastal Research, Vol. 10, No.1, 1994

4
IIIillo~o...,0...III
Lee
- -----
Bottom water particle velocity:
when wove activity just touches the bottom
when wove reaches shallower bottom
t r e s h o ld velocity for c o o r s e or h e o vv s o n d _
Ireshold velocity for medium sand ._•.
Figure 2. Cornaglia effect.
the orbital diameter at a depth of y is expressedas:
(1)
where H, is the water particle orbital diameterat the depth of y,
H" is the wave height, the water particleorbital diameter at the water surface,
e is the base of natural logarithm,y is the depth, always negative,k is a constant representing 27r/L, where
L is wave length.
On a vertical plane parallel to the wave raydirection, the water particle orbital movement diameter can be expressed as a horizontal vectorplotted on a vertical axis y of the correspondingdepth, forming a wedge shaped curve. This is calledan orbital diameter envelope. The width of thewedge at any depth represents the intensity ofwave activity at that depth.
When the water particle movement reaches themarine floor, the circular movement is flattenedand becomes an elliptical, then a back-and-forthoscillating movement. Under waves traveling toward the shore, the back-and-forth movement isnot symmetrical. The onshore movement is morepowerful but lasts a shorter time, whereas theoffshore movement is weaker but lasts longer. Thenet. effect of this asymmetrical interaction between the water and t.he sediment. causes a shoreward shear force on t.he bottom which is knownas t.he Cornaglia Effect. (COKNAGLIA, 1887) (Figure2).
The null point hypothesis t.heory based on theCornaglia Effect. suggested that. a sediment. grainof a cert.ain size will stay at. a certain depth onthe profile, and the grains of the same size willmove onshore if it is locat.ed on the onshore sideof the null point and move offshore if it is locatedon the offshore side of the null point..
Journal of Coastal Research, Vol. 10, No. I, 1994

z
The Submarine Equilibrium Profile
MSL
5
ZWB
2 ----+-3 ----j--- 4
Mode linq ond sectioninq of Submarina Equilibrium Profile
(2)
4 SectionsBreaker secrion on-wash, backwash and plunging
ocTivily~"""" very complicaTed tobe analysed, nor represented byThe equaTion.
2 Shoaling secnoo shoreward stress t vibration fieldt grovily
closer 10 The shor e, the sleeper theslope.
Figure 3. Overall sectional model.
The author disagrees with part of the null pointhypothesis. He reasons that if a submarine profileis formed on a single sized sediment, any net effectof asymmetrical back-and-forth movement of individual sand grains will eventually reach an equilibrium with the geometry of the marine ttoor.Simply stated, any onshore movement of sand willform a steeper slope until the shear force in theonshore (up-slope) direction available at that pointis balanced by the offshore (down-slope) force derived from gravity on a slope. On the other hand,any offshore movement of sediment will reducethe steepness of the slope at the point. Therefore,the entire geometry in balance must relate to theslope with the depth at each and everyone ofthese points. This can be easily explained withthe vertical structure of the wave activity. In themeantime, this oscillating movement ttuidizes thevery top layer of the water saturated sediment.The fluidization alone tends to form a horizontalinterface between the water and the bottom sediment. However, if the shoreward shear force isapplied on the bottom at the same time, the twoeffects will form a slope. According to basic physics, if the shear force is in balance with the down-
of the Model3. PlaHorm secTion: neqtlqib!a shear stress t vibration tiek
+grovilynear horizontal Vlater - sedimentInTerface.
" Hepos e section; qr nvity , sediment ct r epcse angle( submerged repose angle)
slope component of gravity, the sine of the slopeangle should be proportional to the shear force.A reasonable first approximation to relate the waveaction with the shear force at any depth can behypothesized as proportional to the water particleorbital diameter at that depth.
For a grain or a layer of grains on the top ofthe SEP, the force needed to keep them on a slopeagainst gravity (because of fluidization, frictionand dilatancy alone cannot keep the grains on anyslope) should be proportional to the sine of theslope angle (Figure 4). When the slope angle isvery small, the sine value approaches the tangentvalue of the slope angle which is dy/dx or s', thefirst derivative of y.
The above balance condition leads to a differential equation. At any point on the SEP, therelationship expressed by the following differential equation is valid.
dy ::'.".,- = kH e'-dx "
where dy/dx is the slope at any point on theprofile,
y is the depth, always negative,
Journal of Coastal Research, Vol. 10, No.1, 1994

As a boundary condition when depth is zero,the SEP should intercept the shoreline and Xshould be zero, too. Then the value of By becomeszero and the value of I'll, becomes 1. Applying theboundary condition, y = 0 and X o~ 0, to equation(6),
o = A + C, or -C = A
is established. Replacing C with - A following thisrelationship, we get the solution of the differentialequation which represents a functional relationship between x and y versus the offshore wavelength.
6
gp/o p~-- 9 )Sin
o
On a slope, the asymmetrical Cornaqlia Effect
results dS d net shear force against gravity,
Lee
x = A(e"' - 1) (7)
dnd keeps the grain on the slope. In equilibrium
state, thp force n~pded is proportional to the
s i nr- of the slope. The force available from the
waves at t he c o r r-e apcmd i ng depth is proportional
to the intensity ot the wave activity at the depth.
Figure 4. Analytical model derivation.
where A is a constant, named extension factor,which may be related to grain size. Dimension = L.
B is a parameter assigned as - 21r/L,where L is the offshore wave length. ora function of a corresponding offshorewave period T. Since L = gT'/21r, B =-4Jr"/gT'. Dimension ~c L I.
If we assign l/K,B= A, and -C"K , = C, then weget:
For a wave with a constant offshore wave height,
KH,,= K ,
where K , is another proportionality, a constant.Assign B = 21r/L. Rearrange the differential
equation:
x is the horizontal distance from theshore,
H" is the wave height of the offshoreswell,
e is the base of natural logaruhm,K is a proportionality, a constant,L is the wave length of the offshore
swell.
I'"' dy = K , dx
After integrating both sides, we get:
1-e"' = K x + CB 1 "
or,
x = Ae'': + C
(4)
(5)
(6)
The construction of Equation 7 takes into account all of the involved mechanical forces (gravity, Cornaglia Effect, and Huidization by the periodical vibratory field derived from the wavewhich works against dilatancy and friction)through a logical reasoning process. It is based ona physical condition that t he net shoreward shearforce imposed on the ftuidized sediment surfaceand available at a certain depth is proportionalto the intensity of the water particle orbital movement at the corresponding depth. So far, the model has not been involved with any statistics.
The thresholds for X should range from zeroto positive infinity, and y should range from zeroto negative infinity. In geological reality, y shouldbe no deeper than the depth at which the locallarge swell is unable to effectively fluidize the sediment there. This limit of depth may be viewedas the threshold limit of the SEP model and thebeginning of the repose section, where the slopeof the profile is controlled hy repose angle of thewater-saturated sediment, not by the onshoreshear force. The repose angle is steeper than thenear horizontal slope at the end of the SEP wherethe influence of the wave action can barely fluidizethe sediment, but no significant shear force isavailable at that depth. The slope at that transition zone will demonstrate a sudden change ora kink. This is perhaps where some of the submarine landslides and mudflows occur.
.Iournal of Coastal Research, Vol. 10, No.1, 1994

The Suhmarine Equilibrium Profile
Since parameter B is rigidly connected with thewave length, B = -21r/L, by using a fixed arbitrarily selected parameter A value, we can examine the general shape of the theoretical profile.With different wave length values, we can createa series of curves in a X -Y coordinate system. Weobserve that:
(1) These curves are smooth and continuous.(2) The X and Y relationship is monotonous; i.c.,
the further the distance from the shore (largerX value), the deeper the sea floor.
(:3) These curves are upwardly concave with asteeper and steeper slope when approachingthe shore line. They approach near horizontalat a distance from the shore.
(4) If we assume all the otfshore swells have thesame range of wave steepness, we can alsoassume that the wave height is linearly connected with wave length. Then, the wave energy will be a function of the wavelength. Thewaves with a higher value of wavelength (larger L, smaller absolute value of B) will carvemore deeply into the sea floor and create asteeper slope, when compared with the profilein an area of lower wave energy with smallerwave length.
All these features match quite well with the general concept of SEP.
Theoretically, the waves with a uniform suiteof wave parameters should act on a SEP for anindefinite time. In the real world, the waves characterized by parameter B and responsible forforming the SEP may be those "very frequent andquite large swells" (SOTHEBY, 1987) occurring inthe area.
NONLINEAR REGRESSION PROCESS
Every SEP should have a fixed pair of parameter A and parameter B. Using a nonlinear regression to match some real world conceptuallyrecognized SEP's with the equation would revealhow close the connections are between Equation7 and the conceptual SEP. In the meantime, apair of A and B will be obtained for each profile;B can be compared with the field measured meanpeak wave period in the area where the profile islocated. Through these two procedures, the modelwould be verified and calibrated.
The nonlinear regression uses a SIMPLEX algorithm (CACE('[ e t al., 1984) re-written inGWBASIC by the author. The SIMPLEX algorithm follows the "least sum of the squared re-
siduals" criterion to determine the best fit between the field data and the curve created by theequation, while trying different values of A andB. The regression was performed on an IBM compatible personal computer. The result of the regression was printed in graphic form (Figures 5and 6).
B is a function of offshore wavelength or waveperiod, but the physical relationship between parameter A and grain size and/or other physicalparameters is pending further studies.
The regression process illustrated good matchbetween the equation and some profiles locatedin the Gulf of Mexico and the southeast U.S. Atlantic coast (R" = 0.95-0.99). These profiles areselected following the SEP conceptual model. Thewave periods translated from the B parametersare in the same order of magnitude as the available measured mean peak wave periods in theGulf area (HUBERTZ, 1989) (Table 1 and Figure8).
Profiles from the U.S. Pacific coast were plottedonly for comparison purposes; they do not meetmost of the selection criteria for SEP. These profiles carry significant erosional features. The tectonic activities along the Pacific coast do not allowenough time to form SEP's. Besides, the sedimentamount on the narrow continental shelf does notallow a clastic platform to build up. The profilesappearing as almost straight lines predominantlyrepresent the repose section. The application ofnon-linear regression to these profiles yields a verysmall absolute value of B (less than 0.001); thecorresponding wave length should be over severalthousands of feet which has not been observed.These conditions plus the limited detail of theavailable Pacific coastal bathymetric maps excluded most of the Pacific profiles from the SEPmodel. Perhaps only in some pockets of the shoreline, certain Pacific profiles may demonstrate thestate of SEP; i.e., those that extend only a shortdistance from the shoreline, then are immediatelyfollowed by the repose section. For these reasons,the U.S. Pacific profiles do not qualify for thisSEP model.
wAVE TANK EXPERIMENT
The fundamental mechanism from which themodel is derived is whether the vertical attenuation of wave activity is related to the availableshear force along the depth in the water body. Inother words, the shear force should attenuate withthe increasing depth. Further, the slope on which
Journal of Coastal Research. Vol. 10, No. I, 1994

8
100
90
.j.J(l)
00(l)
.....'0
70
c~ 40Ul~0 lIO..c::.j.J
40
~:::> )0H0<e-
~O
0< 10
0
Lee
PARAMETER A
o PACIFIC + ATLANTIC o GULF OF M.EXICO
Figure 5. Comparison of parameter A for profiles from different marine basins around U.S.
the sand is in balance with the wave activity shouldbe related to the depth. At a deeper location, thisslope of balance should be gentler.
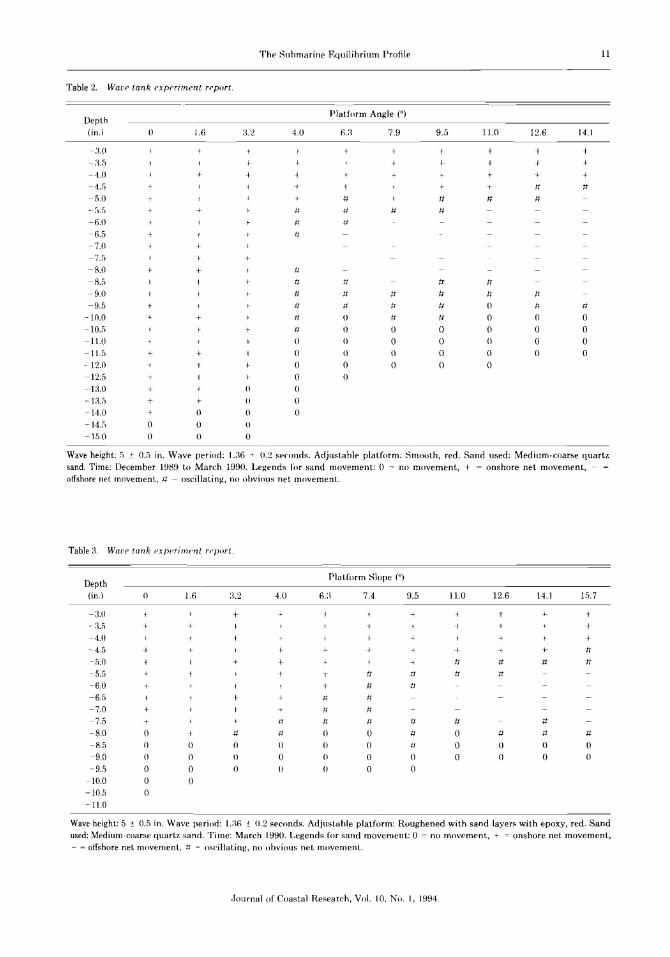
A 16 ft (W) x :32 ft. (L) x 5.G ft (D) wave tankwas built for the purpose. On one end, there is awave generator driven by a 1.5 H.P. motor. Theexperiment is conducted on a submerged adjustable platform. The slope and the depth of theplatform can be adjusted independently (Figure7). A patch of sand (] -:3 grams) as an almost singlelayer was put on the platform and the net movement of sand was observed under the influence oftraveling waves when the platform was set on different slopes and at different depths. The resultsof the experiment are shown in Tables 2 and :3.The experiments exclude breaker condition.
The results illustrated that:
(1) When a horizontal platform is lifted from thedeepest position under a traveling wave, thesand grains start to move shoreward at a certain depth. Beyond the threshold depth, the
sand grains are not affected by the travelingwaves.
(2) The shoreward movement of sand becomesmore and more significant with decreasingdepth. The sand movement is always shoreward on a horizontal platform under shoreward traveling waves.
(:3) When a tilted platform with a constant slopethrough the lifting process is lifted from thedeepest position, the threshold depth at whichthe sand grains start to move shoreward becomes shallower. This means that a strongershear force is needed to move sand grains upslope against the gravity. Under the samewaves, the steeper the slope setting is, theshallower the threshold depth becomes.
(4) On a platform tilted at an even steeper slope,the sand grains tirst move toward the offshoredirection when the platform is gradually liftedfrom the deepest position. This means thatthe sand grains under the influence of thevibratory disturbance of waves will move off-
.Iournal of Coastal Research. Vol. 10. No.1. 1994

0
- 0.01
-0.02
- 0.0)
-0.04
-0.05
I -0.0&
-+J .. 0,0"Q)Q) -0.0.
~ -0.0.
- e . ~~ -o.U::lH - 0.12
ICl:; . 0.1:\:::-
-0.14
t:Q -o,U
- O. l~
. 0.17
-o.l'·o,U
- 0,2
The Submarine Equilibrium Profile
PARAMETER B
9
o PACIFIC + ATLANTIC o GULF OF MEXICO
Figure 6. Comparison of parameter B for profiles from ditferent marine basins around U.S.
platform alop e control Jcrew handwheel
depth conlrol scrow handwhool
crossheod
oak frame
plolform, with \'orlel( conlrol kni ...el
/--
"
• I
threaded crosshead
-,
~~==~~ rolary crossheod
Figure 7. Depth and slope independently adjustable platform for wave tank experiment.
Journal of Coastal Research, Vol. 10, No.1, 1994

10 Lee
Table 1. Comparison of Walle periods.
WIS TR (sec] Tp (sec)
Profile Station Calcltd. Field
Name No. B Value from H Measrd.
ARANSAS2 fl --0.028098 6.61 li.:1
CHOC4 :1O -O.042G78 5.:J7 5.4
CHOC6 29 -O.04:J182 5.:J:J 5.2
GALVA2 II -0.062226 4.44 4.8
GALVA:J II - O.O7:l82:l 4.08 4.8
LUIS3 10 -O.O:J2012 6.19 6.2
LUlS4 9 -ll.O49127 5.00 5.7
MADREl :l -0.0:J4525 ',.96 6.6
MADRE4 2 -O.0:1:J!118 6.01 68
MATABAYI 9 0.0498:19 4.96 ;).7
MATABAY2 9 -O.O5:1:l77 4.79 fl.7
ROLLI 14 -O.06l:J58 4.47 5.2
Note: The profile names are based on the names of NOAA maps.Each profile is plotted between two points which are recordedwith their latitudes and longitudes. The profile names do nothave any physical significance to the readers. Readers can choosetheir own profiles according to the SEP concept model andobtain regression results by running the computer program. TheSIMPLEX program written in GWBASIC is available to thereaders. Please mail a formatted blank 1.44 MB floppy disk andan envelope with return address and postage stamp to: Dr. PaulLee, Dept. of Environmental Regulation, 2600 Blair Stone Road,Tallahassee, FL :12:199-2400. B parameter values obtained throughregression carry six decimal points. This is due to the conventions set up in GWBASIC. The maximum number of effectivedigits through such a process would be no better tban the original bathymetric data which have 2-:1 effective digits.
shore if the shear stress available at that depthcannot compensate for the downslope component of gravity at that slope, When theplatform of the same steeper slope is gradually lifted, the sand grain movement directionchanges from offshore to standstill to onshore.
(,5) These observations lead us to conclude thatthe balance condition where a sand grain remains on a position must never be referred toas only the depth, or only to onshore/offshoredirection, it must be referred to the combination of a definite depth with a definite slope.
(6) For a given set of wave parameters, there isno shear force at certain depth. With decreasing depth (lifting the platform), the shear forceavailable increases until the depth reaches thebreaker condition.
These findings justified the construction of thedifferential equation. The adjustable platformeliminates the need for a large amount of sand,in the order of tons, to conduct a wave tank experiment. This experiment broke the paradox ofnull point hypothesis and the dilemma raised by
MllfUV\Y (1967). MURRAY concluded that "... inall but two of the twenty-one cases, the net transport was onshore, ..." and "the stronger thenear-bottom orbital motions under the waves(calculated), the lesser the tendency for onshoremovement of all grain sizes." These conclusionsmade without referring to the original slope anddepth where the involved sediment particles arelocated are misleading. If, in almost all the cases,the net transport was onshore, it implies that allthe beaches should always be under accretion andthe source of sediment is from offshore. As a result, marine basins such as the Gulf of Mexicowould never have any deposition (> :3,000 ft ofthickness in reality), which is obviously not true.
The wave tank experiment reveals a series ofphenomena strongly supporting the analysis ofmechanisms involved in this physical model.However, the wave tank experiment has some limitations. First., the simulation of swells is impossible in a wave tank of this size, as the wave generator is only 15 feet from the platform. Becauseof the different proportions between the physicalparameters of the seas versus swells, direct calibrat.ion of the model with the wave tank experiment becomes impossible. Secondly, after the wavegenerator has produced about 6 to 10 wave periods, the whole wave tank will establish a standing wave regime. The sand behavior under sucha condition will be irrelevant to our SEP model.Therefore, it is impossible to obtain an equilibrium with an extremely tine-tuned delicacy thatwould enable us to see an equilibrium as the endresult of an indefinitely long period of time underthe same waves.
CONCLUSIONS
(1) This research attempts to establish a theoretical physical model for SEP based on an analysis of the major mechanical forces involved informing an SEP and the equilibrium conditions.This first order linear approach and simplifiedbasic physical model of SEP yields an explicitequation of SEP.
(2) This physical model attempts to relate thewave parameters with the geometry of the SEP.
(:3) Through a non-linear regression computerprogram written in BASIC following a SIMPLEXalgorithm, the theoretical equation has been compared with real world SEP's selected from theU.S. Gulf of Mexico coast and the southeast U.S.Atlantic coast according to the criteria derivedfrom the conceptual model ofSEP. The regression
Journal of Coastal Research, Vo!' 10, No.1. 1994
The Submarine Equilibrium Profile 11
Table 2. Wave tank experiment report.
DepthPlatform Angle (0)
(in.) 0 1.6 :J.2 4.0 1i.:1 7.9 9.5 11.0 12.6 14.1
-:UJ + f + + + + + +-:J.5 + + + + + + +-4.0 + + + f + + + +-4.5 + + + + It It
--5.0 + f + It # It It_. ;1.;, + + it It It it
-6.0 f It #-6..5 + iI-7.0 + +-7.5 +-8.0 + j Ii
-8.5 + iI # It It
-9.0 It It It If It It
-9.5 + + 11 It It # () It It
-10.0 + + it () It # 0 0 0-10.5 + It () 0 0 o 0 0-11.0 -t + 0 () 0 0 0 o 0-11.5 + + I 0 0 0 0 0 0 0- 12.0 + + 0 0 0 0 0-12.5 I 0 0-l:J.O + () 0-1:J.5 + + 0 0-14.0 + 0 0 0-145 () 0 ()
-1.5.0 0 0 0
Wave height: ;, ± 0.5 in. Wave period: I.:J6 T 0.2 seconds. Adjustable platform: Smooth. red. Sand used: Medium-coarse quartzsand. Time: December 1989 to March 1990. Legends for sand movement: () - no movement, + = onshore net movement, - ~
offshore net movement, ++ - oscillating, no obvious net movement.
Table 3. Wave tank experiment report.
DepthPlatform Slope (0)
(in.) 0 Ui :J.2 4.0 Ii.:\ 7.4 9.5 11.0 12.1i 14.1 15.7
-:J.O + + + , + + +-3.5 + + I + t + + +-4.0 + j + + + + + +--4.5 + + + + + + It
-5.0 + + + + It It It #-5.5 + + It It iI it
-6.0 + t + It it
-6.5 + It II-7.0 + + /I It
-7.5 + + Ii It It It It It
-8.0 () + iI it 0 0 it 0 It It It
-8.5 () () 0 0 () 0 II 0 0 0 0-90 () () 0 0 () () () 0 0 0 0-9.5 0 0 0 () 0 0 0
-10.0 0 0-10.5 0-11.0
Wave height: 5 t. 0.5 in. Wave period: 1.:\6 ± 0.2 seconds. Adjustable platform: Roughened with sand layers with epoxy. red. Sandused: Medium-coarse quartz sand. Time: March 1990. Legends for sand movement: 0 ~ no movement, + = onshore net movement,- = offshore net movement. .tt = oscillating, no obvious net movement.
Journal of Coastal Research. Vol. 10. No. I, 1994

12 Lee
WAVE PERIOD CO~;fPARISON
Tp - 0.71179 Tb + 1.9506310.0
9.0
8.0
..7.0';;:
a(f1
6.0~
>-mrr 5.0t:iz
4.0uu~a. 3.0f-
2.0
1.0
0.0
0.0 2.0 4.0 6.0 8.0 10.0
Tb(SEC). Cl\l.CULATED F"ROM B
Figure 8. Correlation analysis of wave periods obtained by calculation from parameter Band by field observation.
process demonstrates a good fit between the theoretical equation and the selected SEP's (Figures8-11 are examples), and the parameter H's calibrated through this process are within the reasonable range reflecting the physical wave conditions in these areas.
(4) Some SP profiles on the U.S. Pacific coast,though deviating from the conceptual SEP model,are also treated with the regression process. Thatthe parameters obtained through the regressionprocess are out of range from the observed waveparameters further indicates that with the givendata and scale, in general, the SP's along the U.S.Pacific coast are not compatible with this SEPmodel.
(5) Some of the offshore wave lengths (periods)obtained through regression of the profiles in theGulf of Mexico (which were completed in 1988)are then compared with the field data publishedin 1989 measured in some areas in the Gulf ofMexico by NOAA through the past 20 years. Theresult of the comparison is quite encouraging. Thecomparison of the two sets of data has one significant advantage because they are independent,one from the marine floor profile geometry and
the other from observation of the waves throughthe field automatic stations. The comparison ofthe two sets of data also has one significant disadvantage: the locations of the wave stations andthe profiles are not coordinated. Therefore, notall the data in one set are comparable with datain the other set. The locations of wave stationsdo not keep a consistent distance from the shore;some profiles are located nowhere near any wavestation that can provide relevant wave information. Also. the distance between the profiles andthe available nearby stations are not consistent.
(6) A wave tank and a unique adjustable platform were designed and constructed for this research. The wave tank experiments strongly support the mechanisms in structuring this physicaland analytical model. The design ofthe adjustableplatform provides a new tool to facilitate futurestudies on sediment/wave interaction.
(7) This physical model is a simplified, firstapproach, linear model. The model provides someinsight into how the surface of the bottom sediment would behave under the influence of gravity,friction, dilatancy, vibratory field and shear forceposed by the waves. However, the model does not
-lournal of Coastal Research, Vo!' 10, No.1, 1994

30
2.0
The Submarine Equilibrium Profile
Profile SABANK2Reol(S'l.};Colc( + );%Error(<»
13
L0a
tw
~ -10
i -2.0.<c'+'a.v -300
-4{)
-50
-60
0 20 40 60 80(Th oueorida)
Di:rtonce Off"hore.ft.
100 120 140
Figure 9. A regression match between the physical model of SEP and a submarine profile. R = O.98il4:!O.
involve the grain size change and wave parameterchange on the shoaling process.
FUTURE STUDIES
(1) Among the physical parameters which mayhave decisive influence on the geometry of theSEP, the following have been identified by previous investigators: wave length, wave height (ifthe offshore wave steepness is assumed a constant,then wave height and wave length are interlocked), grain size (assuming uniform shape andsize),and the mass density of the sand (assumingquartz sand, then mass density is not a variable).
Therefore, in Equation 7 derived from thismodel,
x = Ate'': - 1)
B is known as a function of wave length, then Amust be a function of grain size and may includewave length.lfwe compare Equation 7 with Dean'sequation, we will find certain similarities, especiallyparameter A in Equation 7, and factor Ain Dean's equation. Both are multiplication factors between a function of x and a function of y.
Therefore, calibration efforts for parameter Amay be reasonable to concentrate on for data collection on the grain size.
(2) To test the validity of this dynamics modelwith any known energetics models, the wave energy attenuation rates on some real world SEP'sshould be collected and compared with the energyattenuation rates on an idealized SEP. The energetics criterion used by Dean and Per Bruun onthe nearshore profile section including the surfingzone is that the wave energy attenuation rate perunit volume of water should stay constant (DEAN,1990). The preliminary assumption must be suchthat during surfing, because of the extreme chaosin the water body, the energy can only be assumedhomogeneously distributed at any depths witbinthe water body. This attenuation rate is also notclear, whether it is based on attenuation rate referred to unit time or referred to unit distancethe wave travels. More important is the fact whenthe wave propagates onshore from deep water, thewave energy contained in unit volume is very different at different depths. The calculation is asfollows:
.lournal of Coastal Research, Vol. 10, No. I, 1994

14 Lee
Profile ROLL 1Reol(Sq.);Colc( + );%Error(<»
12010040 60 BO(Thouacnde}
Diston ce Otfehore,ft...
20
-,-----------------20
10
0
g-10w
~
-20;:!
i -30a.tJa
-4{)
-50
-600
Figure 10. A regression match between t.he physical model of SEP and a submarine profile, H ~ 0.971477.
The wave energy density E is the total waveenergy contained in a column of water within aunit square area of infinite depth.
The integration of E, from minus infinity tozero should be the total energy density.
I I"8PgH,,' = ,Q(H)" dy
where p is the water mass density,g is the gravitational acceleration,
H" is the wave height,E is energy density, energy per unit area
on the surface of the sea and with aninfinite depth.
The energy contained in a unit thickness ofwater body within a unit volume at a depth of yshould be:
Because H, = H"e"';', where L is offshore wavelength,
1 J" ,1,-
8PgH,/ = ,QH,,'e' dy
From this equation, we obtain
Q = Jrpg2L
where E, is tbe energy contained in a unit thickness of a unit volume of water body ata depth of y,
Q is a proportionality,H, is the water orbital diameter at the
depth of y under a wave with a waveheight of H".
Energy contained in unit volume at the depth ofy must be:
Jrll<fE =QH'=--"'H'
v v 2L'
or,
7fpg ~E, = 2L H,« I
.Iournal of Coastal Research, Vo!. 10, No. I, 1994

The Submarine Equilibrium Profile 15
Profile OCRA3Re al(Sq.};Calc( + );%Error(<»
403020(ThDu,.ands)
Distance Otfaho re .f i.
10
----,------,-------r------,-----,------,-----,-------1
,-----------------------------------20
10
0
L-10
eLw
-20
~
-30
i:5 -40u,u0
~50
-60
-70
-80
0
Figure 11. A regression match between the physical model of SEP and a submarine profile. IF ~ 0.9~7:)72.
It is very difficult to test a dynamic model byusing an energetics criterion based on an assumption that an energetics model better reflectsthe natural situation. This is especially unfavorablewhen the energetics model has no solid physical reasoning by itself. We may only compareeach with empirical approaches.
(3) Applications
(a) Calibration of parameter A can be achievednumerically through the nonlinear regression process, empirically using different profiles withknown grain size characteristics, or through theoretical derivation following the hydrodynamiccondition for balance on a slope.
(b) Assuming that Equation 7 really representsthe SEP in balance with the waves having a wavelength of L and with a fixed nominal offshore wavesteepness (which states that the wave height is asimple function of the wave length), then usingnonlinear regression, parameter A of the specificprofile of interest can be obtained (calibrated).
With this now available parameter A, idealizedSEP's in different wave conditions can be predicted for this specific location. A real time sequential model, therefore, is possible to predictthe responses of a real world profile to a wavecondition. A computer program can be written toprocess such responses in a time sequence in whichdetails of wave conditions in each time intervalwould be reasonably predictable from the meteorological forecast. The trilogy expressing the relationship of wind condition-wave condition-sediment movement has long been the goal of modernsedimentology studies. This model may bring thisgoal a step closer to reality.
(c) The idealized SEP can be used as a reference for assessment of profile stability and forpredicting which sections of a profile may be undergoing deposition or erosion by the influence ofthe forecast wave conditions.
(d) The same principles applied to (c) can beapplied to help site selection for offshore dredgeand fill.
Journal of Coastal Research. Vol. 10, No. I. 1994

16
(e) A ring-shaped new wave flume with a syn
chronized regenerative wave generator and an adjustable platform is proposed for future study of
the behavior of loose sand on different slopes andat different depths under the influence of continuous traveling waves. This wave tank can providea complete suite of information on sand behavior
under the waves following a systematic variationof parameters, such as grain size, grain mass den
sity, wave height, wave length, slope, depth andother bottom features such as the influence ofripple marks, the origin of ripple marks, etc.
ACKNOWLEDGEMENTS
I want to thank Dr. William P. Tanner for his
initial provocation of my interest in Per Bruun'srule and for many inspiring discussions during theformation of the model. I am obliged to Mr. PeterWilkens for helping me to program the SIMPI .EXin BASIC language and to Drs. Robin Kung andRichard Pfeffer for allowing me to use their ma
chine shop and electronic lab at the GeophysicalFluid Dynamics Institute, F.S.U. lowe my deep
est gratitude to my wife Gabrielle, for her all-outspiritual and financial support, helping me withher income as a lab technician for the constructionof the wave tank and for the expenses of the entireresearch, including a round trip to observe thecoasts along the three marine basins around the
United States.
LITERATlJRE CITED
AIRY, G.B., 1845. Tides and waves. Encyclopedia Metropolitana, 192, 241-396.
BA{;NOLIl, R.A., 1940. Beach formation hy waves: Somemodel experiments in a wave tank. Journal of thelnstitutum of Civil Engineering, Vi, 27-52.
BA<;NOLIl, R.A., 196:3. Mechanisms of marine sedimentation. In: HILL, M.H. (ed.), The Sea. New York: Interscience, pp. (:3) 507-528.
BASCOM, W.H., 19[,1. The relationship between sand sizeand beach face slope. Transactions of the AmericanGeophysical I Inion; :J2, 866-874.
BIWIIN. P~:H F.. 1962. Spa-level rise as a cause of shoreerosion. .lournal of Waterways and Harbors Division.Procecdiru;» o] the American S()ciety of Engineer»,pp. 117-I:iO.
BRlillN, PER F., 198:1. Review of conditions for uses ofthe Bruun rule of erosion. Coast.a! Enuincerirui. 7.77-89.
CACEl'l, M.S. and CACHEIUS, W.P .. HJ84. F'it.tim; curvesto data. BYTE (May 1984), pp. :340-:362.
CHEON(i. H.F. and RAJ, S.P., I98:J. A study of equilibrium beach profile. Sixth Australia Conference onCoant a! and Ocean Engineering (Institute of Engineering), Brisbane, Australia.
Lee
COLLINS, ,J. I., 1976. Wave Modeling and Hvdrodynamics. Society of Economic Palaeontologists and Mincralogists, Special Publication 11'24. pp. 54-68.
COOl-" D.C. and (;OHSI.IN~:I{, D.S., 1972. Field observations of sand transport by shoaling waves. MarineGeolu/.JY, I~, :~ I -t){).
CORNA(iI.IA, 1'., 1887. SuI regime della spiagge e sullaregulazione dei portio Turin.
DAVIS, RA., ,Jr. and ETHlN(iTON, R.I", (eds.), 1976. Beachand Nearshore Sedimentation. Society of EconomicPalaeontologists and Mineralogists, Special Publication tf24.
D~:AN, RG., 197:3. Heuristic models of sand transportin the surf zone. Conference on Engineerirui Dynamics in the Surf Zonc, Sydney, Australia, 7p.
DEAN, R.G., 1977. Equilibrium beaeh profiles. U.S. Atlantic and Gulf coasts. Technical Report No. 12, University of Delaware, Newark.
DEAN, RG., 1987. Additional sediment input to thenearshore region. Shore and Beach. 55, (:J-4), 76-81.
DEAN, RG., 1990. Equilibrium Beach Profiles: Charact erist ics and Applications. Gainesville: Department of Coastal Engineering, University of Florida.70p.
DEAN, RG. and M,WRMEYEH, E.M .. 198:3. Models forbeach prohle response. In: KOMAH, P.D. (ed.). Handbook of Coastal Processes and Erusion. Boca Raton,Florida: CRe Press, Inc., pp. 151 -166.
Dl ll\OIS, R.N., 1972. Inverse relation between foreshoreslope and mean grain size as a function of the heavymineral content. Geological Society of America Bulletin, 8:3, 871-876.
EA{;I.~;SON, P.S. and DEAN. RG., 1961. Wave-inducedmotion of bottom sediment particles. Transactionsof the American Society ofCivil Engineers. 126. Part1,1162-1189.
EA"L~;SON, P.S.; DEAN, R.G., and I'I-:HALTA, L.A., 1958.The mechanism of t.he motion of discrete sphericalbottom sediment particles due to shoaling waves. U.S.Army Corps of Engineers, Reach Erosion BoardTechnical Memo., 1tI04, 41p.
EA<:I.ESON, P.S.; GLI':NN, R., and DRAl'lI', .I.A., 196:1.Equilibrium characteristics of sand beaches. Journalof Hydraulics, Division of American Society of CivilEngineers 89, no. HYl, pp. :i;'-G7.
FENNEMAN, N.M., 1902. Development of the profile ofequilibrium of the subaqueous shore terrane. Journalof Geology, 10, 1-:12.
FISH~;H. ,I.S. and DOLAN, R.. 1977. Coastal Hvdrodyno.mu:s and Beach Prcrccsno«. Stroudsburg, Pennsylvania: Dowden, Hutchinson & Ross.
FI{IEDMAN, C.M. and SANDEI{S, .I.E., 197K. Principles of,"'edimentology. Somerset, New .Iersey: Wiley, 792p.
HORIKAWA, K. and WATANABE, A., 1967. Astudy on sandmovement due t.o wave action. Coastal Engineeringin Japan, 10, :i9-57.
Hl1m:lnz, ,I.M. and BIWOKS, RM., 1989. Gull of Mexicollindca«t Wau" lnjormuiion, l l.S. Army Corps of Engineers, WIS Report.
Hlil;HES, M.e. and COWELl., 1'..1. 19<97. Adjustment ofreflective beaches to waves. -lournul of Coast a! Research, :3(2), 15:1.
INMAN, D.L. and BOWEN, A.,J., 196:3. Littoral processes.111: HII.L, M.H. (ed.}, The Sc«. New York: l nterscience, pp. (:J) 52\J-(l:J:J.
.lournal of Coastal Research, Vo!. 10, No. l. 1994

The Submarine Equilibrium Profile 17
INMAN, D.L. and FltAlI'I'SCHV, .J.D., 1966. Littoral processes and the development of shorelines, Proceedings of the Coastal Engineering Conference, American Society of Civil Engineers, Santa Barbara,California, pp. :1121-51:i6.
IpPEN, A.T. and EA(;L~:SON, P.S., 1955. A study of sediment sorting by waves shoaling on a plane beach.U.S. Army Corps of Engineers, Beach Erosion HoardTechnical Memo., 116:3, 88p.
IWAGAKI, Y. and NOIlA, N., 196:3. Laboratory study ofscale effects in two-dimensional beach processes. Proceedings of the St h Conierence on Coastal Engineering, Mexico City, pp. 194-210.
JOHNSON, D.W., 1919. Shore Processes and ShorelineDevelopment. New York: Wiley, fl84p. (Facsimile. NewYork: Hafner, 19(5).
KING, C.A.M., 1972. Hench and C(lasts-~SecrllldEdition. New York: St. Martin's Press, 570p.
KOMAR, P.D, (ed.) 1983. Handbook of Coastal Processesand Erosion. Boca Raton, Florida: CRC Press, Inc.
KOMAR, P.D. and MILLER, M.e., Ifln. The tbreshold ofsediment movement under oscillatory water waves.Journal of Sedimentary Petrology, 4:J, 1101-1110.
KOMAR, P.D. and MILum, M.C., 1fl75. Sediment threshold under oscillatory waves. Proceedings of the 14thConference on Coastal Engineering, Copenhagen,Denmark, pp. 756-775.
KUENEl':, P.H., 1950. Marine Gcolog», New York: Wiley,508p.
KURIAN, N.l'. and BABA, M., Ifl87. Wave attenuationdue to bottom friction across tbe Southwest Indiacontinental shelf. -lournul of Coastal Research, :3(4),485-490.
LONGUET~H,,;(aNS, N.S., 195:J. Mass transport in waterwaves. London: Philosophical Transactions of theRoyal Society, Series A, 245, 5:3,'1-581.
MANORAR. M., 19,55. Mechanics of bottom sedimentmovement due to wave action. U.S. Army Corps ofEngineers, Reach Erosion Board Technical Memo.,#75, 121p.
MAV, ,J.P., 197:3. Selective transport of beavy mineralsby shoaling waves. Sedimcnt ologv, 20, 20:J-211.
MAV, J.F., 1974. WAVENRG-A computer program todetermine the distribution of energy dissipation inshoaling water waves with examples from coastalFlorida. Sediment Transport in the Nearshore Zon(',Proceedings of a Symposium. Department of Geology, Florida State University, p. 2:J.
McLEAN, R.F. and Kill", R.N., 1fl69. Relationship between grain size, size sorting and foreshore slope onmixed sand-shingle beaches. Neui Zealand Journalof Geolog» and Geophysics, 12, I:J8-155.
MUNC'H~PETEIlSON,T., 1938. Littoral drift formula. U.S.
Army Corps of Engineers, Beach Erosion Board Bullet in, 4(4)(lflf)0), 1-:36.
MUItHAV,S.P., I fl67. Control of grain dispersion by particle size and wave state. Journal of Geoloey, 75, 612G:34.
PIll<'E, W.A., 1954. Dynamic environments: Reconnaissauce mapping geologies and geomorphies of continental shelf of Gulf of Mexico. Transaction Gulf CoastAssociation of Geological Societies, 4, 75-107.
PIlICE, W.A .. 1969. Variable dispersion and its effectson the movements of tracers on beaches. Proceedingsof the 11th Conference on Coastal Engineering, pp.:J2fl-:1:34.
RANCE, P.,J. and W AHREN, N.F.. 19Gfl. The thresholdmovement of coarse material in oscillatory fiow. Proccedings of the 11th Conference on Coastal Engincering, pp. 487-491.
RECTOH, R.L., 1954. Laboratory study of the equilibriumprofiles of beaches. U.S. Army Corps of Engineers,Beocli Erosion Board Techrucal Memo., 441, 38p.
SHEPAIW, F.P., 1950b. Beach cycles in Southern California. U.S. Army Corps of Engineers, Beacli ErosionBoard Technical Memo., it15, :Hp.
SIlOHT,A.D., 1979. Three dimensional beach stage model. Journoi of GeoloRY, 87, 55:1-571.
SII,VESTEI(, R and MO(;I(\D(;~:,G.R., 1971. Beach of wavesto the bed of the continental shelf. Proceedings of the12th Conference on Coastal Engineering, Washington, D.C., pp. 651-667.
SONI), C..J., 1fl7:J. Three dimensional beach changes.Journul of Geology, 81, 42--64.
SOULSHY, R.L., 1987. The relative contributions of wavesand tidal currents to marine sediment transport, Report SR 125. Wallingford: Hydraulics Research Ltd.
SWIFT, l Ll.P, and PALMER, H.D. (eds.), 1fl76. CoastalSedimentation. Stroudsburg, Pennsylvania: Dowden,Hutchingson & Ross, :3:3flp.
TANNER, W.F., 1974. The "a-h-e ... " model. Proceedings of a Symposium. Tallahassee. Florida: Department of Geology, Florida State University, pp. 12-22.
'l'ANNEIt, W.F., 1988. Beach ridge data and sea levelhistory from the Americas. •Journal of Coastal Research, 4(1), 81-91.
WATTS, F.N., 1954. Laboratory study on the effect ofvarying wave periods on the beach profiles. U.S. ArmyCorps of Engineers, Beach Erosion Board TechnicalMemo.. 1t5:J, 21p.
WRH;IlT, L.D. and COLEMAN, ,J.M., lfl72. River deltamorphology: Wave climate and the role of the subaqueous profile. Science 176, 282-284.
ZENKOVICH, V.P., 1967. Process of Coastal Deoelapmerit. New York: John Wiley and Sons, Inc. Interscience Publishers, n8p.
Journal of Coastal Research, Vol. ]0, No. I, ]994