Embed Size (px)
Citation preview

THE STUDY OF TAIWANESE STUDENTS’ EXPERIENCES WITH
GEOMETRIC CALCULATION WITH NUMBER (GCN) AND
THEIR PERFORMANCE ON GCN AND GEOMETRIC PROOF (GP)
by
Hui-Yu Hsu
A dissertation submitted in partial fulfillment of the requirements for the degree of
Doctor of Philosophy (Education)
in The University of Michigan 2010
Doctoral Committee:
Professor Edward A. Silver, Chair Professor Hyman Bass Associate Professor Patricio G. Herbst Associate Professor Priti Shah

Hsu-Yu Hsu
All rights reserved
2010

ii
DEDICATION
This dissertation is dedicated to my husband, Yu-Sheng Lin, to my daughter, Heng-Ting
Lin, and to my parents, Ms. Shu-Chen Tsai, Mr. Chun-Ho Hsu, Ms. Hsiu-Hua Chang, Mr.
Chen-Hsiung Lin for their support and encouragement throughout my graduate studies.

iii
ACKNOWLEDGEMENTS
I would like to thank those persons who have helped me develop this
dissertation in various ways. With their help, I would not have been able to complete this
work.
I want to thank teacher Nancy (pseudonym) and her students who participated in
the first two studies and the students who took part in the third study of the dissertation.
Also thanks to principals, administrators and teachers in Wesley Girls’ High school,
Hsin-Pu Junior High School, and Jubei Junior High School for their administrative
assistance. Although the teacher and students must remain anonymous, without their
participation, I would not have had data for the analysis of teaching and learning in
Taiwan. Particular thanks to Yu-Ping Chang and Hui-Fen Shiu for their work and
feedback on coding the curriculum materials and students’ survey responses.
I thank Professor Edward Silver for his work as my advisor and for chairing my
dissertation committee. My appreciation goes to his generosity of providing invaluable
advices on my work and his scholarship and administrative attributes. I also want to
thank my other dissertation committee members. Particular thanks to Professor Patricio
Herbst for his insightful comments which have inspired my investigation and have
encouraged me the value of the work. I also acknowledge Professor Hyman Bass and
Professor Priti Shah for investing time and efforts to shape this dissertation. Among the
iv
other Michigan faculties and students who have sharpened my thinking of mathematics
education through discussions are Professor Vilma Mesa, Professor Magdalene Lampert,
Professor Jay Lemki, Chialing Chen, Wendy Aaron, Gloriana Gonzalez, Sean Delaney,
Ching-I Chang, and Takeshi Miyakawa. I am also grateful to my friends in Ann Arbor.
They are important for me not only because of their priceless friendship at any special
moments but also because of their support in taking care of my daughter at any time
when needed.
I have been fortunate to take writing courses with Dr. Christine Feak and to have
her help in shaping the writing through the studies. She has always encouraged me so that
I can have confidence to keep going on. I owe her a great debt of gratitude. I am also
grateful to Professor Fou-Lai Lin, Professor Yi-Hao Cheng, and Professor Chia-Yi Wu
Yu in Taiwan for their advices specific to research on education in Taiwan. Their critical
comments have deepened my thinking in conducting this dissertation.
Finally, I owe much to my family for their love and practical assistance through
these years. I want to give special thanks to my mom, who did not know any English but
came to Ann Arbor for taking care of my daughter Heng-Ting in my first year. Her great
support made the transition for Heng-Ting and me much easier. My appreciation always
goes to my husband Yu-Sheng and my lovely daughter Heng-Ting who deeply believed
in me. They have always been the most important source of encouragement for me.

v
TABLE OF CONTENTS
DEDICATION.................................................................................................................... ii
ACKNOWLEDGEMENTS............................................................................................... iii
LIST OF TABLES............................................................................................................. ix
LIST OF FIGURES ......................................................................................................... xiii
LIST OF ABBREVIATIONS.......................................................................................... xvi
ABSTRACT.................................................................................................................... xvii
CHAPTER ONE ................................................................................................................. 1
INTRODUCTION .............................................................................................................. 1
Rationale............................................................................................................................. 1
Significance of the Dissertation ....................................................................................... 10
Overview of the Dissertation............................................................................................ 10
CHAPTER TWO .............................................................................................................. 23
LEARNING OPPORTUNITIES AFFORDED BY GEOMETRIC CALCULATIONS
WITH NUMBER (GCN) USED BY A TAIWANESE MATHEMATICS TEACHER.. 23
Introduction ...................................................................................................................... 23
Literature Review ............................................................................................................. 27
Methods ............................................................................................................................ 32
Operative Definitions of the Terms Used ................................................................ 32

vi
Framework Development......................................................................................... 35
Data .......................................................................................................................... 46
Coding Procedure..................................................................................................... 48
Inter-Rater Reliability .............................................................................................. 52
Limitations ............................................................................................................... 53
Findings ............................................................................................................................ 55
GCN Tasks Used in Nancy’s Class ......................................................................... 55
GCN Tasks Situated in Different Curricular/Instructional Materials ...................... 59
Summary.................................................................................................................. 66
Discussion ........................................................................................................................ 66
Developed Framework............................................................................................. 66
GCN Tasks in Curricular/Instructional Materials.................................................... 68
CHAPTER THREE ........................................................................................................ 100
SUNTAINING THE COGNITIVE DEMAND OF MATHEMATICAL TASKS: AN
EXAMINATION OF ONE TAIWANESE TEACHER’S SEQUENCING OF
GEOMETRIC CALCULATION WITH NUMBER (GCN) TASKS ............................ 100
Introduction .................................................................................................................... 100
Literature Review ........................................................................................................... 104
Mathematical Task................................................................................................. 104
Gestures as Semiotic Aid to Facilitate Student Learning ...................................... 107
Methods .......................................................................................................................... 109
Rationale for Teacher Selection............................................................................. 109
Data Source and Episode Selection ....................................................................... 111

vii
Background of the Two Selected Episodes ........................................................... 112
Mode of Data Analysis .......................................................................................... 115
Findings ...........................................................................................................................116
Episode One ........................................................................................................... 116
Episode Two .......................................................................................................... 123
Discussion ...................................................................................................................... 127
Sustaining the Cognitive Demand of GCN tasks................................................... 127
Use of Gestures to Facilitate Student Learning ..................................................... 129
CHAPTER FOUR........................................................................................................... 139
CONCEPTUALIZATION OF THE RELATIONSHIP BETWEEN GEOMETRIC
CALCULATION WITH NUMBER (GCN) AND GEOMETRIC PROOF (GP).......... 139
Introduction .................................................................................................................... 139
Theoretical Comparison between GCN and GP............................................................. 145
Methods .......................................................................................................................... 151
Rationale for Survey Design.................................................................................. 151
Survey Structure..................................................................................................... 157
Survey Procedure ................................................................................................... 157
Student Sample and Procedure to Answer the Survey Items................................. 159
Coding Scheme Used to Analyzed the Response on the GCN and GP Items ....... 161
List of Sub-research Questions for the Study ........................................................ 163
Findings .......................................................................................................................... 165
Comparison between GCN and GP Items ............................................................. 165
Comparison on Individual Pair Items .................................................................... 168
viii
Comparison of Students’ Responses Between Pair 1 and Pair 4 Items ................. 169
Comparison between Two Grade Levels ............................................................... 171
Comparison between Two Survey Procedures ...................................................... 172
Comparison on the Timing Effect.......................................................................... 173
Comparison between Correct Calculations and Correct Calculation with Reasons
................................................................................................................................. 174
Comparison of “No Responses” ............................................................................ 181
Analysis of Students’ Error Responses.................................................................. 181
Summary................................................................................................................ 188
Discussion ...................................................................................................................... 190
CHAPTER FIVE ............................................................................................................ 212
GENERAL DISCUSSION ............................................................................................. 212
Using GCN Tasks to Facilitate Taiwanese Students’ Competence in Constructing GP. 212
Investigations of Students’ Performance in East Asian Countries ................................. 215
Using the MTF Framework to Investigate Student Learning Outcomes ....................... 217

ix
LIST OF TABLES
Table 1.1 GCN (above) and GP tasks (below) used to survey Germany students’
performance (Heinze, Ufer et al., 2008) ..................................................................... 6
Table 1.2 The compared GCN task................................................................................... 18
Table 1.3 The compared GCA task................................................................................... 19
Table 2.1 GCN task diagram and a reference diagram embedded in the diagram ........... 38
Table 2.2 Changes of reference diagram by deleting segments........................................ 38
Table 2.3 The addition of segments and its influence on vertices .................................... 39
Table 2.4 Reference diagram and its changes in GCN task diagram after segment deletion
................................................................................................................................... 41
Table 2.5 The new angles created because of the two added segments ........................... 42
Table 2.6 Distribution of frequency and percentage of diagram complexity ................... 56
Table 2.7 Descriptive analysis of categories in diagram complexity dimension per
diagram ..................................................................................................................... 57
Table 2.8 Distribution of frequency and percentage of solution steps ............................. 58
Table 2.9 Distribution of frequency and percentage of geometric properties needed ...... 58
Table 2.10 Distribution of frequency and percentage of transformation actions required 59
Table 2.11 Descriptive analysis of different types of curricular/instructional materials .. 61
x
Table 2.12 ANOVA analysis for diagram complexity and the three components of
problem-solving complexity ...................................................................................... 63
Table 2.13 Chi-Square Test for auxiliary lines in problem-solving complexity ............... 63
Table 2.14 Post hoc analyses for diagram complexity, solution steps, required geometric
properties and diagram transformations.................................................................... 65
Table 2.15 Posteriori comparisons for auxiliary lines ...................................................... 65
Table 2.16 GCN task used to analyze the number of geometric property related to the
geometric statement listed above. ............................................................................. 77
Table 2.17 Solution for the GCN task in Table 2.16 ........................................................ 77
Table 2.18 Sub-constructs with corresponding geometric properties embedded ............. 79
Table 2.19 Task Description (selected from the tests used by Nancy)............................. 83
Table 2.20 A solution for the GC task in Table 2.19........................................................ 84
Table 2.21 Description of the GCN task selected from the tests ...................................... 85
Table 2.22 The solution for the GCN task in Table 2.21.................................................. 86
Table 2.23 Reference diagrams corresponding to the geometric properties required in the
solution...................................................................................................................... 90
Table 2.24 Transformation actions required to map each reference diagram onto part of
given GCN task diagram configuration .................................................................... 91
Table 3.1 The GCN task used to illustrate the analysis of gestures................................ 113
Table 3.2 Solution Steps with geometric reasons to GCN task in Table 3.1 .................. 137
Table 4.1 The examples of GCN task (above) and GP task (below) used to survey
students’ performance between German and Taiwan (Heinze, Ufer et al., 2008).. 142

xi
Table 4.2 GP (above) and GCN (below) with the same diagram configurations and the
same requirements of geometric properties for obtain a solution........................... 147
Table 4.3 The process of visualizing sub-constructs of the diagram for corresponding
geometric properties................................................................................................ 150
Table 4.4 Pair 1 items included in the survey................................................................. 152
Table 4.5 Pairs of items with diagrams designed in the pilot study ............................... 155
Table 4.6 Details of the four survey conditions.............................................................. 158
Table 4.7 Distributions of students in two grade levels assigned to condition treatments
................................................................................................................................. 161
Table 4.8 Comparison of students’ performance on GCN and GP in general................ 165
Table 4.9 Comparison of GCN and GP responses between two grade levels ................ 166
Table 4.10 Correlation analysis on GCN and GP for both grades together, 8th grade, and
9th grade................................................................................................................... 167
Table 4.11 Chi-square tests and p values of comparing GCN and GP items for two
grades ...................................................................................................................... 168
Table 4.12 Paired-samples tests and p values for individual pair of items for two grade
levels ....................................................................................................................... 169
Table 4.13 Related-samples tests for comparing on Pair 1 and Pair 4 items.................. 170
Table 4.14 T tests for comparing grade differences for GCN and GP items.................. 171
Table 4.15 T tests for comparing survey procedures on GCN and GP items................ 172
Table 4.16 T tests for comparing the timing effect......................................................... 174
Table 4.17 Percentages of correct calculation and correct calculation with reasons...... 175
Table 4.18 Percentages of correct calculations within the five coding categories ........ 176

xii
Table 4.19 Percentages of correct calculation and of correct calculation with reasons for
two grade levels ...................................................................................................... 178
Table 4.20 Distributions of correct answers for four GCN items between two grade levels
................................................................................................................................. 179
Table 4.21 Percentage of “No responses” on GCN and GP items.................................. 181
Table 4.22 The GCN example used to elaborate shallow learning................................ 194
Table 4.23 A solution to the GCN example in Table 4.22 ............................................. 194
xiii
LIST OF FIGURES
Figure 1.1 A group of GCN tasks assigned in Japanese classroom (Stigler & Hiebert,
1999, p.39) .................................................................................................................. 3
Figure 1.2 The Mathematical Tasks Framework (Stein, Smith, Henningsen, & Silver,
2000, p. 4; Silver, 2009, p. 829).................................................................................. 8
Figure 1.3 The plan tree for the GCN task in Table 1.2................................................... 18
Figure 1.4 The plan tree for the GCA shown in Table 1.3............................................... 20
Figure 2.1 A group of GCN tasks assigned in Japanese classroom (Stigler & Hiebert,
1999, p.39) ................................................................................................................ 25
Figure 2.2 Different mental images of a parallelogram.................................................... 34
Figure 2.3 Reference diagrams for the isosceles triangle definition (on the left side) and
for the equilateral triangle definition (on the right side) (Nan-I, vol. 4, p. 39)......... 35
Figure 2.4 The developed framework with (sub) categories ............................................ 36
Figure 2.5 Flowchart for the coding procedure ................................................................ 49
Figure 2.6 The drawing of auxiliary line AO on the given diagram................................. 85
Figure 3.1 The Mathematical Tasks Framework (Stein, Smith, Henningsen, & Silver,
2000, p. 4; Silver, 2009, p. 829).............................................................................. 103
Figure 3.2 A sequence of GCN tasks set up by Nancy................................................... 113
Figure 3.3 One of the methods to draw auxiliary lines on the diagram.......................... 114

xiv
Figure 4.1 The plan trees of the GP (on the left side) and the GCN (on the right side). 149
Figure 4.2 The plan trees of the Pair 1 GCN (left side) and GP (right side) items......... 153
Figure 4.3 Procedure of complicating Pair 1 diagram into Pair 4 diagram .................... 154
Figure 4.4 Mean scores of GCN and GP for both grades ............................................... 167
Figure 4.5 Mean scores for Pair 1 and Pair 4 items ........................................................ 170
Figure 4.6 Mean scores for 8th grade and 9th grade on GCN and GP items.................... 171
Figure 4.7 Mean scores for GCN and GP under two survey procedures........................ 173
Figure 4.8 Mean scores for two time arrangement conditions........................................ 174
Figure 4.9 Percentage of correct calculation and correct calculation with reasons ........ 175
Figure 4.10 Distributions of correct calculation ............................................................. 176
Figure 4.11 Percentages of correct calculation and correct calculation with reasons for
two grades ............................................................................................................... 178
Figure 4.12 Distributions of the two grade students who can provide correct calculations
in the four GCN items............................................................................................. 180
Figure 4.13 Percentage of No Responses ....................................................................... 181
Figure 4.14 Using perceptual images on the diagram to find the solution ..................... 183
Figure 4.15 Misinterpreting the geometric property on the diagram.............................. 185
Figure 4.16 Using correct geometric property but labeling the property incorrectly on the
diagram ................................................................................................................... 186
Figure 4.17 Error response of correct interpretation of configurations of the diagram but
with incorrect geometric property........................................................................... 187
Figure 4.18 Example of type 4 error response................................................................ 188

xv
Figure 4.19 Sub-construct of an isosceles triangle in the given diagram (on the left side)
and prototype of an isosceles triangle (on the right side) ....................................... 195
Figure 4.20 Sub-construct of the diagram for the corresponding angles property ......... 196
Figure 4.21 Plan trees for Pair 1 items (GCN on the left side and GP on the right side) 207
Figure 4.22 Plan trees for Pair 2 items (GCN on the left side and GP on the right side) 207
Figure 4.23 Plan trees for Pair 3 items (GCN on the left side and GP on the right side) 208
Figure 4.24 Plan trees for Pair 4 items (GCN on the left side and GP on the right side) 208

xvi
LIST OF ABBREVIATIONS
GC Geometric Calculation
GCN Geometric Calculation with Number
GCA Geometric Calculation with Algebra
GP Geometric Proof

xvii
ABSTRACT
In Taiwan, students have considerable experience with tasks requiring geometric
calculations with number (GCN) prior to their study of geometric proof (GP). This
dissertation examines closely the opportunities provided to Taiwanese students with GCN
tasks and the performance they exhibit on GCN and GP tasks. Three sequential studies
were conducted, corresponding roughly to key aspects of the Mathematical Tasks
Framework (MTF); namely, GCN tasks as found in curriculum materials and other
instructional resources, GCN tasks as enacted by students and their teacher, and student
performance on GCN tasks and related GP tasks.
Study One found that the GCN tasks used by one Taiwanese mathematics teacher
were drawn from a wide variety of sources – not only the textbook series but also other
sources (e.g., tests) – and the tasks varied with respect to cognitive complexity, with the
tasks additionally included by the teacher being generally more demanding than those
found in the textbook series. The high demand GCN tasks appeared to afford
opportunities for Taiwanese students to master the types of knowledge, the reasoning and
problem-solving skills that are essential not only for proficiency with GCN tasks but also
for creating GP. Study Two examined how the Taiwanese mathematics teacher set up and
enacted GCN tasks with her students. Of particular interest were the ways that the teacher
sustained the cognitive demand levels by making the diagram configurations more
complex and using gestural moves to scaffold students' visualization of the diagram
xviii
configurations so that they could sustain their work on the tasks. Through scaffolded
experiences with GCN tasks containing complex diagrams, the teacher appeared to
nurture students’ competence in constructing and reasoning about geometric relationships
in ways that are likely to support their later work with GP. Study Three presents the
results of an analysis of Taiwanese students’ performance on matched pairs of GCN and
GP tasks, both of which use the same diagrams and require the same geometric properties
to obtain solutions. The findings of this analysis strongly support the hypothesis that
students’ prior experience of working on GCN tasks can support their developing
competence in constructing GP.
Taken together the three studies offer a glimpse at classroom instruction in
Taiwan involving GCN tasks and sketch a plausible pathway through which Taiwanese
students might gain competence with GP tasks through their experiences with GCN tasks.
The three studies also suggest why it might be the case that Taiwanese students would
both develop competence in constructing GP before formal instruction to do so in schools
and develop high levels of proficiency with geometric proving and reasoning. In addition,
the use of a sequence of three studies that examine different aspects of students’
experiences with mathematical tasks appears to have utility as a model for other research
that seeks to understand cross-national differences in mathematics performance.

1
CHAPTER ONE
INTRODUCTION
Rationale
For the last two decades, cross-national comparisons have been a common
approach to understanding how mathematics is taught and learned in different countries.
Of the many countries included in these comparisons, Taiwan has consistently scored
better than others in mathematics. For example, on the TIMSS (Trends in International
Mathematics and Science Study) Taiwanese 8th grade students ranked first in 2008 and
fourth in 2003 (Mullis, Martin, & Foy, 2008; Mullis, Martin, Gonzalez, & Chrostowski,
2004). Taiwanese students also performed well on problems requiring the construction of
geometric proof (GP). In their study on geometric proving and reasoning, Heinze, Cheng,
and Yang (2004) compared Germany and Taiwanese students and found that Taiwanese
students performed significantly better than Germany students.
Heinze et al. also noticed a special phenomenon about Taiwanese students who
demonstrated the potential to do GP before having formally learned the GP content in
schools. To explore this phenomenon, I propose that Taiwanese students’ considerable
experience with solving geometric calculations (GC) is one of the key factors
contributing to their outstanding ability to do GP. In particular, I focus on examining the

2
geometric calculations with number (GCN)1, a type of geometric calculations (GC) that is
frequently used in Taiwanese classroom. Here a GCN is generally described as numerical
calculation done in relation to mental or physical geometric diagrams on the basis of
geometric principles or formulae (e.g., calculating an angle measure in a triangle given
that measures of the other two angles are 30˚ and 100˚, respectively) (Aleven, Koedinger,
Sinclair, & Snyder, 1998; Ayres & Sweller, 1990; Lulu Healy & Celia Hoyles, 1998;
Küchemann & Hoyles, 2002; Lawson & Chinnapan, 2000).
I particularly argue that working with GCN task diagrams is critical to gaining
geometric intuition and being able to solve GP tasks. This is because GCN task diagrams
used in Taiwan are often diverse and complex, thus, providing students different
opportunities to learn2, an affordance which is worthy of investigation. To explain how
GCN task diagrams can be complex, the TIMSS video study provides the following
example (Stigler & Hiebert, 1999). In their investigation, Stilger and Hiebert showed that
GCN tasks implemented in mathematical lessons that may influence the differences in
performance of students in the U.S., Germany, and Japan. Representing the highest
performance among the three countries, Japanese students were required to solve the
GCN tasks that were different from those given to the U.S. and German students. A
group of GCN tasks with complex diagrams (see Figure 1.1) were given to the Japanese
1 GCN is one type of geometric calculation (GC). Other types include geometric calculation in algebra (GCA) and geometric calculations in coordinate system (Lang & Ruane, 1981). As GCN and GCA tasks are similar and are frequently used in Taiwanese classrooms, I detail the similarities and differences between the two types of GC tasks in Appendix 1.1. 2 In this study, opportunity to learn refers to a factor that contributes to students’ learning outcomes (Tornroos, 2005). In particular, the study focuses on exploring the learning opportunities afforded by the mathematical tasks situated in the curricular or instructional materials that teacher and students may enact in classroom. The enactment of the tasks may expand or degrade the cognitive demand of the tasks (Stein, Grover, & Henningsen, 1996) and in turn influence students’ learning outcomes.

3
students to solve, whereas in Germany and the U.S., however, geometric tasks usually
were assigned to students one by one.
Figure 1.1 A group of GCN tasks assigned in Japanese classroom (Stigler & Hiebert, 1999, p.39)
Figure 1.1 shows the GCN tasks given in the Japanese lessons. As can be seen,
these GCN diagrams are diverse and complex. Although each of the GCN task diagrams
contains a pair of parallel lines, the differences in the number of segments and
transversals as well as their orientations and positions in the GCN diagrams make them
complex and different from each other. As the complexity of the GCN task diagrams
increases, so does the cognitive demand of these tasks, because most of them cannot be
solved by a single geometric property or a well-known procedure (Stein, Grover, &
Henningsen, 1996). To solve GCN tasks accompanying by complex diagrams, students
need to visualize the sub-constructs of the diagrams and decide which corresponding
geometric properties can be used to generate a solution (Zykova, 1975a). In addition,
such GCN tasks also require students to draw auxiliary lines to create new sub-constructs
and geometric properties to obtain solutions, which in turn also increase the cognitive
demand (Hsu, 2007). As a result, the GCN tasks provide opportunities to learn beyond
practicing numerical calculations with the application of a single geometric property. The

4
latter characteristic of GCN tasks has been recognized in the literature (Schumann &
Green, 2000). What learning opportunities beyond the practice of calculations and
geometric properties that GCN tasks used in East Asian will be investigated in this
dissertation. In particular, the dissertation focuses on exploring the ways that GCN tasks
were set up and enacted by the classroom students and how the enactment of the GCN
tasks can facilitate student competence in constructing GP tasks.
Another work that will be carried out in this dissertation is to examine how the
role of diagram influences the relationship between GCN and GP tasks. Researchers have
provided the implications regarding why geometric diagram can be the key to transferring
students’ experiences of solving GCN tasks to their competence in proving GP tasks. A
diagram is the location where the problem solving happens (Larkin & Simon, 1987) and
the schemes by which students remember the steps in solving a problem, the given
statements, and the diagram labels (Lovett & Anderson, 1994). Diagrams can be parsed
into chunks to cue the geometric knowledge for solutions, which mirrors how experts
solve geometric tasks (Koedinger & Anderson, 1990). Moreover, diagrams can also
function as artifacts in scaffolding students in learning proofs. Cheng and Lin (2006;
2007) reported that junior high school students’ performance on constructing proofs were
improved greatly by asking students themselves to read the given information and then
color these properties on the diagrams. The colored parts of the diagram help students
visualize the useful geometric properties to generate an acceptable proof. Furthermore,
Fujita, Jones, and Yamamoto (2004) also indicated that creating and manipulating
geometric diagrams mentally or physically can nurture students’ intuition in geometric
problem solving. Thus, diagrams can bring GCN much closer to GP and can be the key to

5
influence students’ performance on those two types of tasks. Another relevant focus of
the geometric diagram is the requirement of geometric properties. No matter if they are
solving GCN or doing GP, students need to visualize the geometric diagrams and identify
the needed geometric properties in order to set up calculating sentences or form logical
proving statements, but the work has been recognized as one of the main difficulties in
learning geometry (Duval, 1995; Fischbein & Nachlieli, 1998; Zykova, 1975a; 1975b).
As a result, diagrams can be a crucial key to establishing the relationship between GCN
and GP, and creating a closer relationship between the two types of tasks, which is
worthy of further investigation.
Actually, treating geometric diagrams as the crucial key to the relationship
between GCN and GP has not been carefully investigated yet. Even though researchers
have articulated the connection between calculations and proofs in general (Tall, 2002,
2006a, 2006b, 2007), they do not particularly deal with the relations between GCN and
GP, nor the role that a geometric diagram can play in influencing the relations. Nor does
the famous theory proposed by van Hiele (Fuys, Geddes, & Tischler, 1988). Furthermore,
the linkage between GCN and GP also cannot be articulated in empirical studies by
surveying students’ performance on GCN and GP (Healy & Hoyles, 1998; Lin, Cheng, &
et al., 2003), because diverse factors can confound the comparisons (e.g., the geometric
properties required to obtain a solution, the number of inferring steps to solutions).
Moreover, some other studies have directly treated GCN as low-level cognitive demand
tasks only for the application of properties and rules and have used this perspective to
compare students’ performance on the two types of tasks to assess the relations (Heinze,
Cheng, Ufer, Lin, & Reiss, 2008; Heinze, Cheng, & Yang, 2004; Heinze, Ufer, Cheng, &

6
Lin, 2008). For example, using the two tasks in Table 1.1, Heinze, Ufer, Cheng, and Lin
(2008) characterized the GCN tasks (in above part of the table) as the one requiring the
application of basic knowledge, and the other (in below part of the table) as GP tasks.
Table 1.1 GCN (above) and GP tasks (below) used to survey Germany students’ performance (Heinze, Ufer et al., 2008)
Diagram Givens
The triangle is isosceles with |AC| = |BC|. Calculate the missing angles.
C and D are points on the line BE. We have |BD| = |EC|, γ = δ and β = ε. Prove that |AB| = |EF| Give reasons for all steps of your proof
As shown in Table 1.1, the GCN task focuses on calculating unknown angle
measures, whereas the GP task requires proving that two segments are congruent
(AB=EF). These two tasks are different from each other in terms of the geometric
properties necessary to obtain the solutions, demands on diagram visualization, and the
number of proving or calculating steps. Solving the GCN task requires the triangle angle
sum property and the properties related to an isosceles triangle to find the measures,
whereas solving the GP task necessitates the use of the Angle-Side-Angle triangle
congruence postulate to prove the conclusion. The visualization demands also differ
between the two tasks. Proving the GP task requires one to recognize the sub-constructs
(two overlapping triangles) in the given diagram, the work of which can be more
demanding than that needed to identify the GCN task diagram as an isosceles triangle. In
addition, the reasoning steps required to generate the solution in each of the two tasks are
7
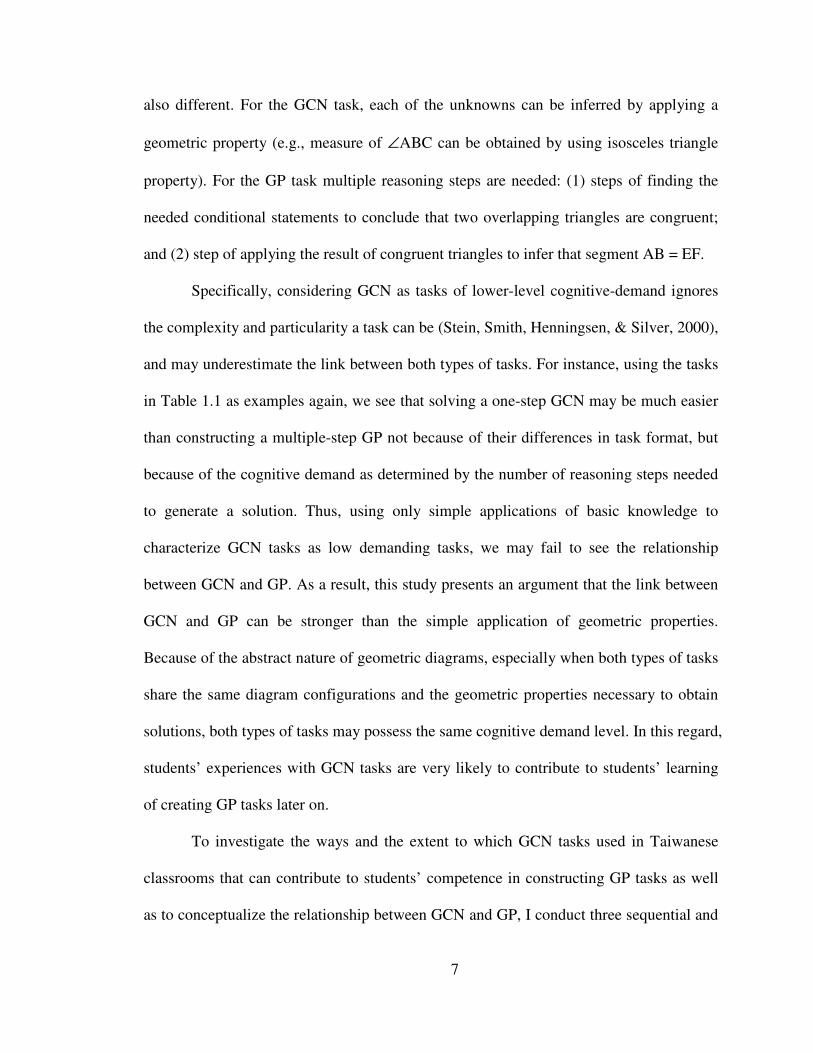
also different. For the GCN task, each of the unknowns can be inferred by applying a
geometric property (e.g., measure of ∠ABC can be obtained by using isosceles triangle
property). For the GP task multiple reasoning steps are needed: (1) steps of finding the
needed conditional statements to conclude that two overlapping triangles are congruent;
and (2) step of applying the result of congruent triangles to infer that segment AB = EF.
Specifically, considering GCN as tasks of lower-level cognitive-demand ignores
the complexity and particularity a task can be (Stein, Smith, Henningsen, & Silver, 2000),
and may underestimate the link between both types of tasks. For instance, using the tasks
in Table 1.1 as examples again, we see that solving a one-step GCN may be much easier
than constructing a multiple-step GP not because of their differences in task format, but
because of the cognitive demand as determined by the number of reasoning steps needed
to generate a solution. Thus, using only simple applications of basic knowledge to
characterize GCN tasks as low demanding tasks, we may fail to see the relationship
between GCN and GP. As a result, this study presents an argument that the link between
GCN and GP can be stronger than the simple application of geometric properties.
Because of the abstract nature of geometric diagrams, especially when both types of tasks
share the same diagram configurations and the geometric properties necessary to obtain
solutions, both types of tasks may possess the same cognitive demand level. In this regard,
students’ experiences with GCN tasks are very likely to contribute to students’ learning
of creating GP tasks later on.
To investigate the ways and the extent to which GCN tasks used in Taiwanese
classrooms that can contribute to students’ competence in constructing GP tasks as well
as to conceptualize the relationship between GCN and GP, I conduct three sequential and
8
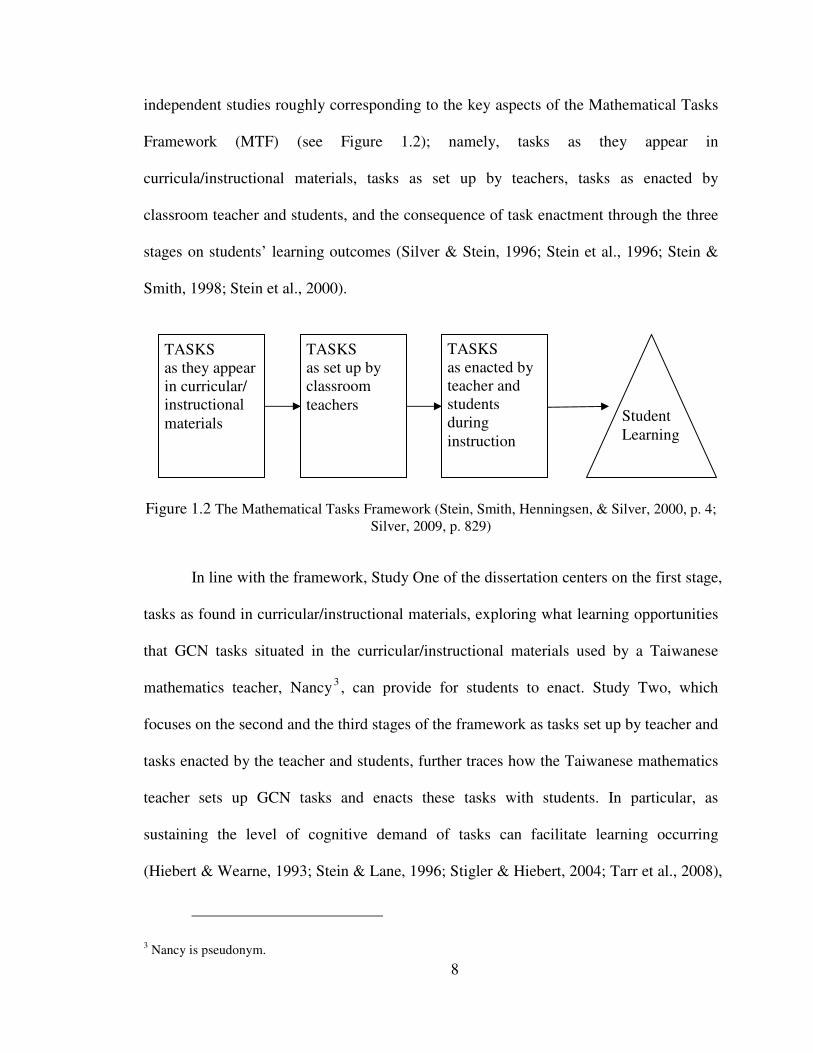
independent studies roughly corresponding to the key aspects of the Mathematical Tasks
Framework (MTF) (see Figure 1.2); namely, tasks as they appear in
curricula/instructional materials, tasks as set up by teachers, tasks as enacted by
classroom teacher and students, and the consequence of task enactment through the three
stages on students’ learning outcomes (Silver & Stein, 1996; Stein et al., 1996; Stein &
Smith, 1998; Stein et al., 2000).
Figure 1.2 The Mathematical Tasks Framework (Stein, Smith, Henningsen, & Silver, 2000, p. 4;
Silver, 2009, p. 829)
In line with the framework, Study One of the dissertation centers on the first stage,
tasks as found in curricular/instructional materials, exploring what learning opportunities
that GCN tasks situated in the curricular/instructional materials used by a Taiwanese
mathematics teacher, Nancy3 , can provide for students to enact. Study Two, which
focuses on the second and the third stages of the framework as tasks set up by teacher and
tasks enacted by the teacher and students, further traces how the Taiwanese mathematics
teacher sets up GCN tasks and enacts these tasks with students. In particular, as
sustaining the level of cognitive demand of tasks can facilitate learning occurring
(Hiebert & Wearne, 1993; Stein & Lane, 1996; Stigler & Hiebert, 2004; Tarr et al., 2008),
3 Nancy is pseudonym.
Student Learning
TASKS as they appear in curricular/ instructional materials
TASKS as set up by classroom teachers
TASKS as enacted by teacher and students during instruction
9
the investigation is of interest in how Nancy sustains or increases the level of cognitive
demand and facilitates student learning. Study Three emphasizes on the learning
outcomes as the consequence of the enactment of GCN tasks through the three stages,
examining the extent to which students’ experiences with solving GCN tasks can
contribute to their competence in constructing GP.
To this end, an overarching research question with three corresponding research
questions (RQs) is proposed as follows.
Overarching Research Question
What are GCN tasks used and enacted in a Taiwanese mathematics teacher and to which
extent can Taiwanese students’ experiences with GCN tasks contribute to their
competence in constructing GP?
RQ1. What opportunities are provided by the GCN tasks used by a Taiwanese
mathematics teacher, Nancy, for her students to learn to handle complex
geometric diagrams and solve these complex GCN tasks?
RQ2. In what ways does Nancy sustain the levels of cognitive demand and facilitate
students’ learning by setting up and enacting the GCN tasks with classroom
students?
RQ3. To what extent is Taiwanese students’ performance on GCN similar to that on GP
when controlling the diagram configurations and requirements of geometric
properties necessary for a solution?

10
Significance of the Dissertation
In this dissertation I conduct three sequential studies to investigate how GCN
tasks are used and enacted by a Taiwanese mathematics teacher and her students, and
how students’ experiences with GCN tasks can contribute to their competence in
constructing GP. Taken together the three studies that comprise the dissertation can
provide insights into why it might be the case that Taiwanese students can develop
potential competence in creating GP before formal instruction to do so in schools and can
outperform students in other countries on geometric proving and reasoning, as has been
shown in the specific case of Germany (Heinze, Cheng, & Yang, 2004). The findings
taken together from the three studies can also provide implications for other research that
might seek to understand cross-national differences in mathematics performance. In
addition, the investigation of the key aspects in the MTF framework can also provide
insight into why the framework might be the core frame for an investigation of factors
accounting for the differences in students’ performance in cross-national comparisons.
Overview of the Dissertation
In this chapter I provide a rationale and for the need of conducting the three
sequential studies in this dissertation, as well as the research questions and significance of
this study. In Chapter Two I present Study One which involves the analysis of GCN tasks
situated in curricular/instructional materials, not only the official textbooks but also
auxiliary materials that the mathematics teacher, Nancy, includes in a Taiwanese
classroom. I discuss the diverse opportunities that the GCN tasks used by Nancy can
provide for students to enact. In Chapter Three I further demonstrate Study Two as how
the GCN tasks are set up and enacted by Nancy and her students. In particular, the
11
analysis focuses on exploring the ways Nancy sustains the cognitive demand of the GCN
tasks and how she uses different instructional strategies to facilitate students’ learning. In
Chapter Four I detail Study Three which investigates the extent to which students’
experiences of solving GCN tasks can contribute to their performance on constructing GP
when both the diagram configurations and the geometric properties needed to obtain
solutions are controlled. In the last chapter I provide general discussions regarding how
the dissertation contributes to the understanding of the role of GCN tasks to the learning
of GP, how the dissertation together with the three studies can provide alternative
perspectives with respect to cross-national comparisons, and an example to support the
MTF framework in exploring the factors accounting for differences in students’
performance in cross-national comparisons.

12
REFERENCES
Aleven, V., Koedinger, K., Sinclair, H., & Snyder, J. (1998). Combatting shallow
learning in a tutor for geometry problem solving. Paper presented at the intelligent tutoring systems: Fourth International Conference, ITS '98, Berlin.
Anderson, J., Greeno, J., Kline, P., & Neves, D. (1981). Acquisition of Problem-Solving Skill. In J. R. Anderson (Ed.), Cognitive Skills and Their Acquisition (pp. 191-230). New Jersey: Lawrence Erlbaum Associates.
Ayres, P., & Sweller, J. (1990). Locus of difficulty in multistage mathematics problems. The American Journal of Psychology, 103(2), 167-193.
Cheng, Y.-H., & Lin, F.-L. (2006). Using reading and coloring to enhance incomplete prover's performance in geometry proof. In J. Novotna, H. Moraova, M. Kratka, & N. Stehlikova (Eds.), Proceedings of the 30
th Conference of the International
Group for the Psychology of Mathematics Education (vol. 2, pp. 289-296). Prague, Czech Republic.
Cheng, Y.-H., & Lin, F.-L. (2007). The effectiveness and limitation of reading and coloring strategy in learning geometry proof. In J. H. Woo, H. C. Lew, K. S. Park, & D. Y. Seo (Eds.), Proceedings of the 31
st Conference of the International
Group for the Psychology of Mathematics Education (vol. 2, pp. 113-120). Seoul, Korea.
Duval, R. (1995). Geometrical pictures: Kinds of representation and specific processings. In R. Sutherland & J. Mason (Eds.), Exploiting mental imagery with computers in
mathematics education (pp. 142-157). Berlin: Springer.
Fischbein, E., & Nachlieli, T. (1998). Concepts and figures in geometrical reasoning. International Journal of Science Education, 20(10), 1193-1211.
Fujita, T., Jones, K., & Yamamoto, S. (2004). Geometrical intuition and the learning and
teaching of geometry. Paper presented at the ICME 10, Denmark.
Fuys, D., Geddes, D., & Tischler, R. (1988). The van Hiele model of thinking in geometry
among adolescents (Vol. 3). Reston, VA: NCTM.
Healy, L., & Hoyles, C. (1998). Justifying and proving in school mathematics. London: Institute of Education.
Healy, L., & Hoyles, C. (1998). Justifying and Proving in School Mathematics. Technical
Report on the Nationwide Survey. London.
Heinze, A., Cheng, Y.-H., Ufer, S., Lin, F.-L., & Reiss, K. (2008). Strategies to foster students' competencies in constructing multi-steps geometric proofs: Teaching experiments in Taiwan and Germany. ZDM-The International Journal on
Mathematics Education, 40(3), 443-453.
Heinze, A., Cheng, Y.-H., & Yang, K.-L. (2004). Students' performance in reasoning and proof in Taiwan and Germany: Results, paradoxes and open questions. ZDM-The
International Journal on Mathematics Education, 36(5), 162-171.

13
Heinze, A., Ufer, S., Cheng, Y.-H., & Lin, F.-L. (2008). Geometric proof competence
and its individual predictors: A Taiwanese-German study, paper presented at 11th ICME. Monterrey, Mexico.
Hiebert, J., & Wearne, D. (1993). Instructional tasks, classroom discourse, and students' learning in second-grade arithmetic. American Educational Research Journal,
30(2), 393-425.
Hsu, H.-Y. (2007). Geometric calculations are more than calculations. In J. H. Woo, H. C. Lew, K. S. Park, & D. Y. Seo (Eds.), Proceedings of the 31
st Conference of the
International Group for the Psychology of Mathematics Education (vol. 3, pp. 57-64). Seoul, Korea.
Katz, V. J. (1993). A history of mathematics: An introduction. New York: HarperCollins College.
Kieran, C. (1981). Concepts associated with the equality symbol. Educational Studies in
Mathematics, 12, 317-326.
Koedinger, K., & Anderson, J. (1990). Abstract planning and perceptual chunks: Elements of expertise in geometry. Cognitive Science, 14, 511-550.
Küchemann, D., & Hoyles, C. (2002). The quality of students' reasons for the steps in a geometric calculation. Proceedings of the British Society for Research into
Learning Mathematics, 22(2), 43-48.
Lang, B., & Ruane, P. (1981). Geometry in English secondary schools. Educational
Studies in Mathematics, 12(1), 123-132.
Larkin, J., & Simon, H. (1987). Why a diagram is (sometimes) worth ten thousand words. Cognitive Science, 11, 65-99.
Lawson, M. J., & Chinnapan, M. (2000). Knowledge connectedness in geometry problem solving. Journal for Research in Mathematics Education, 31(1), 26-43.
Lin, F.-L., Cheng, Y.-H., & et al. (2003). The competence of geometric argument in Taiwan adolescents, International Conference on Science & Mathematics
Learning. Taipei, Taiwan.
Lovett, M. C., & Anderson, J. R. (1994). Effects of solving related proofs on memory and transfer in geometry problem solving. Journal of Experimental Psychology:
Learning, Memory, and Cognition, 20(2), 366-378.
Mullis, I. V. S., Martin, M. O., & Foy, P. (2008). TIMSS 2007 international mathematics
report. Chestnut Hill, MA: TIMSS & PIRLS International Study Center, Boston College.
Mullis, I. V. S., Martin, M. O., Gonzalez, E. J., & Chrostowski, S. J. (2004). TIMSS 2003
international mathematics report: Findings from the IEA's Trends in
International Mathematics and Sciences Study at the fourth and eighth grades. Chestnut Hill, MA: TIMSS & PIRLS International Study Center.

14
Schliemann, A., Carraher, D., & Brizuela, B. (2007). Bringing out the algebraic
character of arithmetic-from children's ideas to classroom practice. Lodon: Lawrence Erlbaum Associates.
Schumann, H., & Green, D. (2000). New protocols for solving geometric calculation problems incorporating dynamic geometry and computer algebra software. International Journal of Mathematical Education in Science and Technology,
31(3), 319-339.
Sfard, A., & Linchevski, L. (1994). The gains adn the pitfalls of reification-The case of algebra. Educational Studies in Mathematics, 26, 191-228.
Silver, E., & Stein, M. (1996). The Quasar project: The "revolution of the possible" in mathematics instructional reform in urban middle schools. Urban Education,
30(4), 476-521.
Silver, E. (2009). Cross-national comparisons of mathematics curriculum materials: What might we learn? ZDM-The International Journal on Mathematics Education, 41, 827-832.
Stein, M., Grover, B., & Henningsen, M. (1996). Building student capacity for mathematical thinking and reasoning: An analysis of mathematical tasks used in reform classrooms. American Educational Research Journal, 33, 455-488.
Stein, M. K., & Lane, S. (1996). Instructional tasks and the development of student capacity to think and reason: An analysis of the relationship between teaching and learning in a reform mathematics project. Educational Research and Evaluation,
2, 50-80.
Stein, M., & Smith, M. (1998). Mathematical tasks as a framework for reflection: From research to practice. Mathematics Teaching in the Middle School, 3, 268-275.
Stein, M., Smith, M., Henningsen, M., & Silver, E. (2000). Implementing standards-
based mathematics instruction: A casebook for professional development. New York, NY: Teachers College Press.
Stigler, J., & Hiebert, J. (1999). The teaching gap: Best ideas from the world's teachers
for improving education in the classroom. New York: Free Press.
Stigler, J., & Hiebert, J. (2004). Improving mathematics teaching. Educational
Leadership, 61(5), 12-16.
Tall, D. (2002). Differing modes of proof and belief in mathematics. Paper presented at the International Conference on Mathematics: Understanding proving and proving to understand, Taipei, Taiwan.
Tall, D. (2006a). A life-times' journey from definition and deduction to ambiguity and
insight. Paper presented at the Retirement as Process and Concept: A festschrift for Eddie Gray and David Tall, Prague.
Tall, D. (2006b). A theory of mathematical growth through embodiment, symbolism and proof, International Colloquium on Mathematical learning from early childhood
to adulthood. Nivelles, Belgium: Centre de Recherche surl'Enseignement des Mathematiques.

15
Tall, D. (2007). Embodiment, symbolism, argumentation and proof, The conference on
Reading, Writing and Argumentation
Tarr, J., Reys, R., Reys, B., Chavez, O., Shih, J., & Osterlind, S. (2008). The impact of middle-grades mathematics curricula and the classroom learning environment on student achievement. Journal for Research in Mathematics Education, 39, 247-280.
Tornroos, J. (2005). Mathematics textbooks, opportunity to learn and student achievement. Studies in Educational Evaluation, 31, 315-327.
Zykova, V. I. (1975a). Operating with concepts when solving geometry problems. In J. Kilpatrick & I. Wirszup (Eds.), The learning of mathematical concepts (Vol. 1, pp. 93-148). Chicago: University of Chicago.
Zykova, V. I. (1975b). The Psychology of Sixth-Grade Pupils' Mastery of Geometric Concepts. In J. K. I. Wirszup (Ed.), The Learning of Mathematics Concepts (Vol. I, pp. 149-188). Chicago: University of Chicago.
16
Appendix 1.1
Clarification of Geometric Calculation with Number (GCN) and Geometric
Calculation with Algebra (GCA)
As discussed in the literature, a GC can be generally described as calculations
done within mental or physical geometric diagrams on the basis of geometric principles
or formulae. In line with this general definition, the most frequently used types of GC
tasks in geometric lessons are geometric calculation with number (GCN) and geometric
calculation with algebra (GCA). Such a distinction is revealed because the special
characteristics of each type of GC can influence its relation to GP. Specifically, even
though both types of GC tasks all involve a variety of geometric diagram shapes and
require geometric properties needed to generate solutions, the extra algebra work
necessary in solving GCA tasks can increase the cognitive demand of the tasks and
confound the conceptualization of the relations between GC and GP, especially when
algebra work is a difficult learning topic for students (Kieran, 1981; Schliemann,
Carraher, & Brizuela, 2007; Sfard & Linchevski, 1994).
In order to further illustrate the special characteristics of GCN and GCA as well
as the influence of extra algebra work with respect to conceptualizing the relationship
between GC and GP, two comparable examples representing each type of tasks are
analyzed. These two examples are similar because they use the same geometric diagram,
the same written information about diagram details, and the same unknown that students
have to figure out. The only difference is that the GCN task describes the length measures
with numerical information, whereas the GCA task indicates givens and unknown using

17
algebraic expressions. The comparison of the two tasks focuses on the problem-solving
process which is demonstrated using the concept of plan tree developed based on the
ACT-R theory (Anderson, Greeno, Kline, & Neves, 1981).
Anderson et al. (1981) define a plan tree as “an outline for actions” (p. 193) that
is generated based on the logically separate stages. Using geometry proofs as subject
content to exemplify the thinking mechanisms, Anderson et al. state that stages in the
plans are a set of geometric rules, allowing students to get from the givens of the task
through intermediate levels of statements then to the to-be-proved statements. The plan
tree for proof is a knowledge structure in the head generated by unpacking various links
of relevant knowledge and re-organizing the links and knowledge into a logic sequence.
Hence, reasoning solution paths is usually a mixed forward and backward process. In this
process, on the one hand, students must search forward from the givens to find sets of
solution paths that can yield the to-be-proven statements. On the other hand, students also
have to infer backward steps from the to-be-proven statements that may be related to the
givens. The process of reasoning forward and backward gradually maps out a solution
path containing relevant geometric knowledge that can link with both the givens and the
conclusion statements.
Geometric Calculation with Number (GCN)
GCN is a geometric task in which numerical information and diagrammatic
information are provided in the givens. A diagram shape usually accompanies a GCN
task. The goal of such task is to use geometric properties embedded in the diagrams or in
the givens to infer the unknowns by setting up relationships among the relevant measures.
The inferring process commonly involves numerical calculations.
18
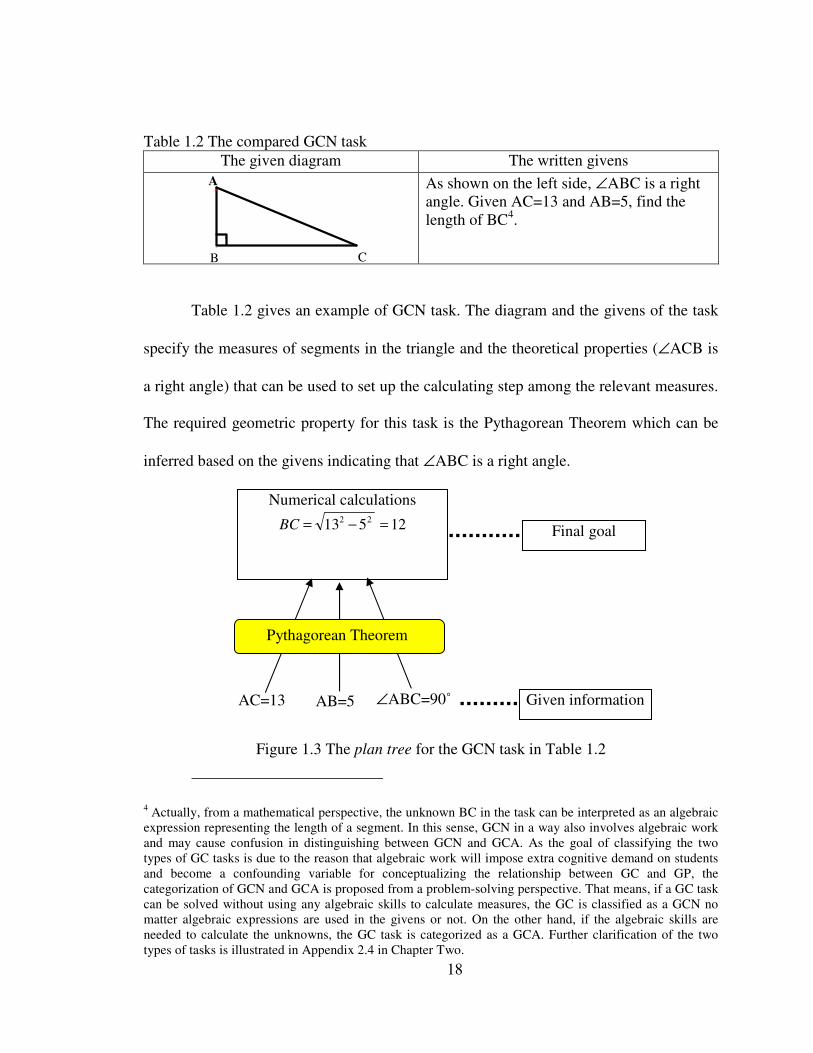
Table 1.2 The compared GCN task The given diagram The written givens
A
B C
As shown on the left side, ∠ABC is a right angle. Given AC=13 and AB=5, find the length of BC4.
Table 1.2 gives an example of GCN task. The diagram and the givens of the task
specify the measures of segments in the triangle and the theoretical properties (∠ACB is
a right angle) that can be used to set up the calculating step among the relevant measures.
The required geometric property for this task is the Pythagorean Theorem which can be
inferred based on the givens indicating that ∠ABC is a right angle.
Figure 1.3 The plan tree for the GCN task in Table 1.2
4 Actually, from a mathematical perspective, the unknown BC in the task can be interpreted as an algebraic expression representing the length of a segment. In this sense, GCN in a way also involves algebraic work and may cause confusion in distinguishing between GCN and GCA. As the goal of classifying the two types of GC tasks is due to the reason that algebraic work will impose extra cognitive demand on students and become a confounding variable for conceptualizing the relationship between GC and GP, the categorization of GCN and GCA is proposed from a problem-solving perspective. That means, if a GC task can be solved without using any algebraic skills to calculate measures, the GC is classified as a GCN no matter algebraic expressions are used in the givens or not. On the other hand, if the algebraic skills are needed to calculate the unknowns, the GC task is categorized as a GCA. Further clarification of the two types of tasks is illustrated in Appendix 2.4 in Chapter Two.
Numerical calculations 22 513 −=BC 12=
AC=13 AB=5
Final goal
Given information
Pythagorean Theorem
∠ABC=90˚
19
The plan tree in Figure 1.3 illustrates the stages of solving this task, in which the
arrows indicate the connections of the stages. To solve this GCN task, students need to
use two measures (e.g., AC=13) and the theoretical property ∠ABC=90˚ from the givens
to set up a calculating sentence on the basis of the Pythagorean Theorem. The remaining
work involves the numerical calculations in order to find the answer to this task.
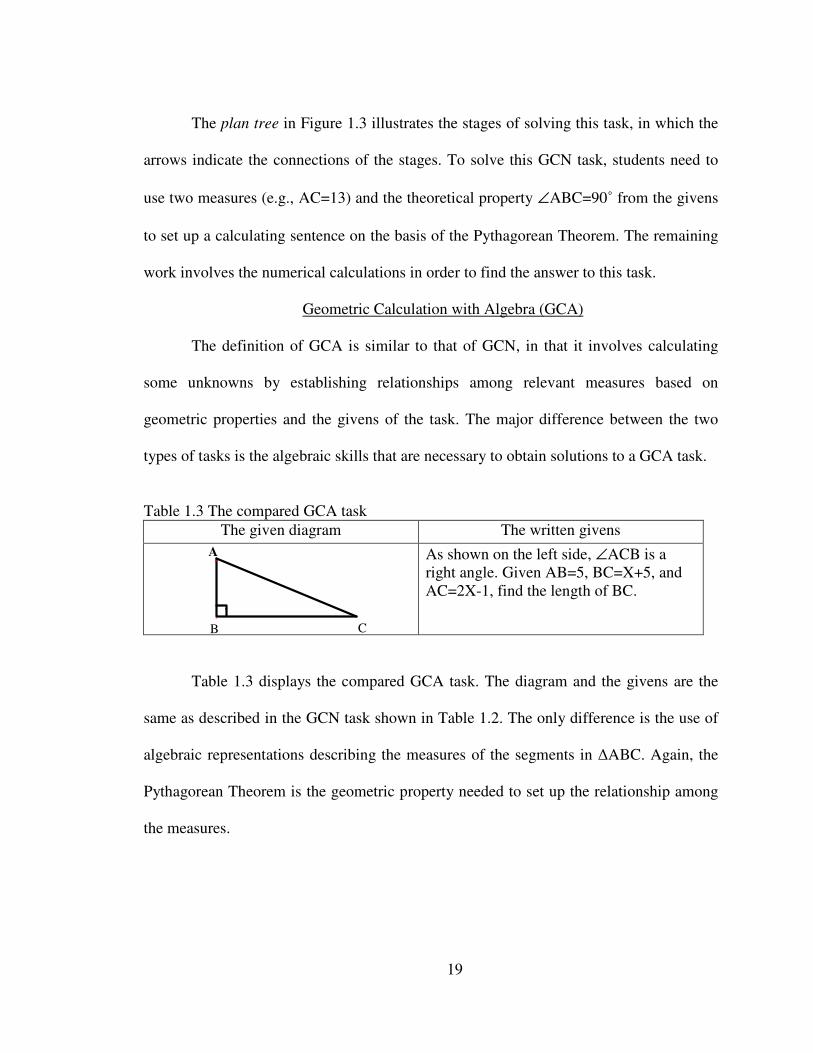
Geometric Calculation with Algebra (GCA)
The definition of GCA is similar to that of GCN, in that it involves calculating
some unknowns by establishing relationships among relevant measures based on
geometric properties and the givens of the task. The major difference between the two
types of tasks is the algebraic skills that are necessary to obtain solutions to a GCA task.
Table 1.3 The compared GCA task
The given diagram The written givens
A
B C
As shown on the left side, ∠ACB is a right angle. Given AB=5, BC=X+5, and AC=2X-1, find the length of BC.
Table 1.3 displays the compared GCA task. The diagram and the givens are the
same as described in the GCN task shown in Table 1.2. The only difference is the use of
algebraic representations describing the measures of the segments in ∆ABC. Again, the
Pythagorean Theorem is the geometric property needed to set up the relationship among
the measures.

20
Figure 1.4 The plan tree for the GCA shown in Table 1.3
The plan tree in Figure 1.4 shows that the first step is to use three measures and
the theoretical property ∠ABC=90˚ from the givens to set up the algebraic equation on
the basis of the Pythagorean Theorem. The next step is to solve the equation using
algebraic skills, which in turn create the intermediate stage in the plan tree because
students have to find the value of X before calculating length of the segment BC. In
addition, the plan tree in Figure 1.4 also illustrates that the algebraic calculations are
demanding as students have to factorize the polynomials in the equation.
Despite similarities of the GCN and the GCA tasks in terms of the given diagrams,
the written givens, and the geometric property needed to obtain the solutions, the plan
Final goal
Algebraic calculations
0)7)(73(
049143
252510144
5)5()12(
2
22
222
=−+
=−−
+++=+−
++=−
XX
XX
XXXX
XX
Hence, X=7 or X= −7
3. However, only X=7 can be the
answer because the lengths of a triangle must be positive.
Intermediate stage
Given information
BC=X+5=12 Because X=7
Pythagorean Theorem
AB=5 BC= X+5 AC=2X-1 ∠ABC=90˚

21
trees shown in Figure 1.3 and Figure 1.4 highlight differences in the problem-solving
processes for the two types of tasks. The first difference centers on the algebraic work.
The GCA task requires extra work of students since they not only need to make
inferences using the geometric property to set up the relation for the calculations, but also
need to master algebraic skills to find the value of X, the intermediate stage shown in
Figure 1.4. Thus, as suggested by comparing the problem-solving processes for the two
tasks, the cognitive demand of the GCA task should be higher than for the paired GCN
task5.
The second difference between the GCN task and the GCA task is the uncertainty
regarding the use of algebraic expressions to represent the segment measures on the
diagram, which may impede students’ ability to infer solutions (Koedinger & Anderson,
1990). In this regard, Koedinger and Anderson indicated that inferring from the diagram
is simple a step involving recognition of the diagram configuration, but this may require
several steps if algebra variables are involved. Algebraic variables impose a demand on
students because they not only need to make inferences from the diagrams but also to
consider how the algebra variables may regulate the inferences. Taking the GCA task in
Figure 1.4 as an example, students need to evaluate the values of X (X=7 and X=3
7− )
because they will influence in reasoning the measure of segment BC.
The third difference has to do with the use of given information in setting up the
calculating sentences. Setting up the calculating sentence in the GCN task requires two
measures from the givens, whereas that in the GCA task requires three variables. The
5 The comparison on the two GCN and GCA tasks rests on the assumption that middle school students can manage the numerical calculations so that such work does not impose extra cognitive demand on students.

22
reason for using three measures in the GCA task instead of two measures is that the
algebraic expression itself is a variable, thus decreasing a degree of freedom for setting
up an equation relation similar to that of the GCN task.
To sum up, GCN and GCA can be quite different in terms of the need to apply
algebraic skills to obtain solutions, the complexity of making inferences considering both
the diagram and the algebraic expressions, and the number of measures from the givens
needed to set up calculating sentences. While the assumption of this dissertation is that
both diagram and geometric properties required to obtain the solutions are keys to
students’ performance on GC and GP, the algebraic work may impose the extra cognitive
demands, thus, becoming a confounding variables in examining the proposed assumption.
In other words, it is possible that students could not successfully solve a GCA task not
because they can not visualize the diagram and retrieve geometric properties needed to
obtain solutions but because they have difficulties in calculating the algebraic equations.
Students’ difficulties in algebra will influence the comparisons of their performance on
GC and GP tasks, and cause limitations in interpreting the results from the comparisons.
Hence, while exploring the relationship between GC and GP aligned with the proposed
assumption, this dissertation narrows the investigation only on GCN tasks.

23
CHAPTER TWO
LEARNING OPPORTUNITIES AFFORDED BY GEOMETRIC
CALCULATIONS WITH NUMBER (GCN) USED BY A TAIWANESE
MATHEMATICS TEACHER
Introduction
For the last two decades, cross-national comparisons have been a common
approach to understanding how mathematics is taught and learned in different countries.
Of the many countries included in these comparisons, Taiwan has consistently scored
better than others in mathematics. For example, on the TIMSS (Trends in International
Mathematics and Science Study) Taiwanese 8th grade students ranked first in 2008 and
fourth in 2003 (Mullis, Martin, & Foy, 2008; Mullis, Martin, Gonzalez, & Chrostowski,
2004). Taiwanese students also performed well on problems requiring the construction of
GP. In their study on geometric proving and reasoning, Heinze, Cheng, and Yang (2004)
compared Germany and Taiwanese students and found that Taiwanese students
performed significantly better than Germany students.
Heinze et al. also noticed a special phenomenon about Taiwanese students who
demonstrated the potential to do GP before having formally learned the GP content in
schools. To explore this phenomenon, I propose that Taiwanese students’ considerable
experience in solving geometric calculations (GC) is one of the key factors contributing

24
to their outstanding ability to do GP. In particular, I focus on examining the geometric
calculations with number (GCN) 6 , a type of geometric calculations (GC) that is
frequently used in Taiwanese classroom. Here a GCN is generally described as numerical
calculation done in relation to mental or physical geometric diagrams on the basis of
geometric principles or formulae (e.g., calculating an angle measure in a triangle given
that measures of the other two angles are 30˚ and 100˚, respectively) (Aleven, Koedinger,
Sinclair, & Synder, 1998; Ayres & Sweller, 1990; Chinnapan, 2000; Healy & Hoyles,
1998; Küchemann & Hoyles, 2002).
I specifically argue that working with GCN task diagrams7 is critical to gaining
geometric intuition and being able to solve GP tasks. This is because GCN task diagrams
used in Taiwan are often diverse and complex, thus, providing students different
opportunities to learn8, an affordance which is worthy of investigation. To explain how
GCN task diagrams can be complex, the TIMSS video study provides the following
example (Stigler & Hiebert, 1999). In their investigation, Stigler and Hiebert showed that
GCN tasks implemented in mathematical lessons that may influence the differences in
performance of students in the U.S., Germany, and Japan. Representing the highest
performance among the three countries, Japanese students were required to solve the
6 GCN is one kind of geometric calculation (GC). Other kinds include geometric calculation in algebra (GCA) and geometric calculations in coordinate system (Lang & Ruane, 1981). GCA is similar GCN but the major difference between the two types of tasks is that GCA necessities the application of algebraic skills to obtain the solution whereas GCN excludes the use of algebraic skills. 7 Not all GCN tasks provide a diagram. For these GCN tasks in which a diagram is not given, the tasks either specify the geometric shapes or describe diagram construction so that students can create diagram mentally or physically to generate a solution. 8 In this study, opportunity to learn refers to a factor that contributes to students’ learning outcomes (Tornroos, 2005). In particular, the study focuses on exploring the learning opportunities afforded by the mathematical tasks situated in the curricular or instructional materials that teacher and students may enact in classroom. The enactment of the tasks may expand or degrade the cognitive demand of the tasks (Stein, Grover, & Henningsen, 1996) and in turn influence students’ learning outcome.

25
GCN tasks that were different from those given to the U.S. and German students. A
group of GCN tasks with complex diagrams (see Figure 2.1) were given to the Japanese
students to solve, whereas in Germany and the U.S., however, geometric tasks were
usually assigned to students one by one.
Figure 2.1 A group of GCN tasks assigned in Japanese classroom (Stigler & Hiebert, 1999, p.39)
Figure 2.1 shows the GCN tasks given in the Japanese lessons. As can be seen,
these GCN diagrams are diverse and complex. Although each of the GCN task diagrams
contains a pair of parallel lines, the differences in the number of segments and
transversals as well as their orientations and position in the GCN diagrams make them
complex and different from each other. As the complexity of the GCN task diagrams
increases, so does the cognitive demand of these tasks, because most of them cannot be
solved by a single geometric property or a well-known procedure (Stein, Grover, &
Henningsen, 1996). To solve GCN tasks accompanying by complex diagrams, students
need to visualize the sub-constructs of the diagrams and decide which relevant geometric
properties can be used to generate the solutions (Zykova, 1975). In addition, such GCN
tasks also require students to draw auxiliary lines to create new geometric properties to
obtain solutions, which may involve using a transformational proof scheme (Hsu, 2007).
26
As a result, the GCN tasks provide opportunities to learn beyond practicing numerical
calculations with the application of a single geometric property. The latter characteristic
of GCN tasks has been recognized in the literature (Schumann & Green, 2000).
To explore what additional learning opportunities are afforded by GCN tasks with
complex diagrams enacted in Taiwanese classrooms, I examine the curriculum materials
used in an 8th grade mathematics class. Particularly, the materials include both textbooks
and auxiliary curricular/instructional materials that Taiwanese mathematics teachers may
use in their instruction. Analysis of both textbooks and auxiliary curricular/instructional
materials is important because each contains GCN tasks for students to enact and thus
influences the learning outcomes (Stein & Smith, 1998). Accordingly, I selected a
Taiwanese mathematics teacher, Nancy 9 , and examined GCN tasks situated in the
curricular/instructional materials that she used and implemented in her classroom.
Taiwan has a very strong examination culture, which is another reason to analyze
both textbooks and auxiliary curricular/instructional materials such as tests. Because of
this examination culture, Taiwanese instruction at the middle school level can be
described as examination-driven teaching style with instruction generally aimed at
helping students get good grades on the high school entrance examination. In this regard,
practice on tests plays an important role in helping students obtain good scores because
the tests usually consist of diverse and demanding tasks. Given their contribution, the
auxiliary curricular/instructional materials (e.g., tests) should be included in the analysis
of the GCN tasks used in Nancy’s class.
9 Nancy is a pseudonym.

27
To understand the nature and contribution of GCN tasks, especially the
contribution to the learning of GP, this study investigates two research questions.
1. What opportunities are provided by the GCN tasks used by a Taiwanese mathematics
teacher, Nancy, for her students to learn to handle complex geometric diagrams and
solve these complex GCN tasks?
2. To what extent and in what ways do the learning opportunities afforded by the GCN
tasks used in Nancy’s class differ according to curricular/instructional sources?
Literature Review
Diagram is a type of representation involving “a data structure in which
information is indexed by two-dimensional location” (Larkin & Simon, 1987, p. 68). A
diagram in geometry is more than a representation conveying spatial information by its
appearance of data structure. In a way, a geometric diagram can be viewed as an abstract
object that possesses, mentally or externally, conceptual (theoretical) and figural (spatio-
graphical) properties simultaneously (Fischbein, 1993; Laborde, 2005).
The abstract nature of a geometric diagram can be more deeply understood in
terms of the notion of apprehension, which is used to describe the cognitive work of
“several ways of looking at a drawing or a visual stimulus array” (Duval, 1995, p. 143).
Duval further used the term, discursive apprehension, to refer to the reasoning of
geometric properties that are embedded in a diagram as a result of the givens. Duval
introduced the more specific concept of operative apprehension to describe the various
mental or physical operations on the diagram to obtain an intuitive sense of solutions.
These operations typically include such activities as dividing the whole diagram into
parts of shapes, regrouping parts to create another diagram, enlarging or shrinking the

28
given diagrams, changing the position of the diagrams, and inserting auxiliary lines.
Operative apprehension is similar to the concept of transformational observation (Harel
& Sowder, 1998), which involves “operations on the objects and anticipations of
operations’ results” (p. 258) as well as the generative mode of interaction (Herbst, 2004).
The generative mode of interaction is used to describe how diagrams can be manipulated
to create new referents (e.g., drawing something on the diagrams) and new signs (e.g.,
new labels) to make reasonable conjectures. Because of the abstract nature of geometric
diagram, these manipulations involve transformation observations and are often
necessary to solve GCN tasks. For instance, transformation observations are particularly
relevant when auxiliary lines need to be drawn on diagrams to create new angles and
segments to obtain solutions (Hsu, 2007).
To solve geometric tasks students need to identify relevant diagrammatic
information. This involves tapping into both figural and conceptual properties of
diagrams, which Fischbein and Nachlieli (1998) argued should emerge together when
students learn geometric reasoning. On the one hand, figural properties are important for
students to determine the diagrammatic information to obtain intuitive senses of a
solution. On the other hand, students also need to rely on conceptual properties to
validate each reasoning step related to the diagram. Regarding the cognitive work related
to the transitions between the two diagrammatic properties, Duval (1998) used the term
“anchorage change” to elaborate this transition. Anchorage change refers to the
transitions from visual (figural) to discursive (conceptual) perspective and vice versa. To
elaborate anchorage change associated with the visual and discursive perspectives, the
following geometric task is useful. “In a parallelogram ABCD, if the measures of ∠BAD

29
are 30˚, find the measures of ∠ABC”. Solving the task requires students to observe the
visual (figural) perspective, gestalt organization of the diagram, either as a two-
dimension object (e.g., the appearance of the parallelogram as a roof) or as one-
dimension object (e.g., the sides constituted the shape). Given these observations,
students need to change their anchorage from the gestalt organization of the diagram,
visual perspective, to the specific geometric properties embedded in the gestalt shape,
discursive perspective, (e.g., opposite sides of a parallelogram are parallel). Alternatively,
instead of working from a gestalt observation, students may start from the theoretical
properties related to a parallelogram and then visualize how these theoretical properties
are embedded in the diagram sub-constructs. Thus, the anchorage changes back and forth
between the visual perspective on gestalt organization of the diagram and discursive
perspective on the embedded theoretical properties provide students geometric intuition,
and in turn enable them to envisage a path to generate a solution plan in the diagram.
Given the movement between the visual perspective and the discursive
perspective, properties of the diagram, generating a geometric solution can proceed
smoothly on the basis of diagram information, but not as a result of written information
(Larkin & Simon, 1987). This is because a diagram is organized in terms of locations that
can lead to information needed for the next inferring step, which is often in an adjacent
location in the diagram. However, inferences for the next step in an adjacent location
cannot easily be made when reasoning on the basis of written statements. If reasoning
rests on written statements, students first have to apply the sentential information to the
diagram in order to understand what these written sentences mean and then integrate both
sentential information and diagrammatic information to determine the next reasoning step
30
in the diagram. This reasoning process usually results in a heavy cognitive load because
of the split-attention effect (Mousavi, Low, & Sweller, 1995). This effect arises when
students must divide their attention among different information (both the diagrammatic
information and sentence information in working memory) when inferring the solutions.
The resulting heavy cognitive load can prevent students from obtaining solutions, which
could otherwise be achieved if students simply make references to the key location on the
diagram.
Geometric diagrams are potentially more helpful than written statement in solving
geometric tasks because diagrams can serve as the underlying structure for remembering
solutions (Lovett & Anderson, 1994). In their study exploring student memory of
solutions to geometric tasks, Lovett and Anderson (1994) controlled two factors:
similarity of the diagram used in geometric tasks and the similarity of reasoning structure
in written sentences from the givens to the proving statements. They then examined how
these two factors influence student recall of geometric solutions. Lovett and Anderson
found that if two geometric tasks use the same diagram, students’ experience in solving
the first task can facilitate their ability to obtain a solution of a subsequent task. The
reason is that students can remember solution steps in the diagram and use the diagram to
cue relevant reasoning steps to generate solutions in the subsequent task. However, if two
geometric tasks have a similar reasoning structure based on written sentences beginning
with the givens and leading to proving statements, students’ experience with solving the
first task can not successfully transfer to their work on the second task. Lovett and
Anderson’s findings, to some extent, suggest that students’ experiences with solving

31
GCN tasks can transfer to their work on GP tasks later if both types of tasks are based on
similar diagram configurations.
Further evidence supporting the conclusion that diagram similarity is central to
students’ problem solving can be found in Koedinger and Anderson. Koedinger and
Anderson (1990) noticed that geometry experts usually parse geometric diagrams into
perceptual chunks and use these perceptual chunks to cue relevant geometric knowledge.
According to their investigation, the diagram configurations are used as operation
schemes in the abstract planning stage as well as in remembering a complex combination
of geometric properties (e.g., SAS congruence triangle postulate). Based on the operation
schemes, geometry experts can focus on key steps and ignore less important ones when
generating solutions.
Diagrams are even more central to geometry tasks because they can also function
as artifacts that can scaffold students as they learn proofs. In this regard, Cheng and Lin
(2006; 2007) reported that junior high school students’ construction of proofs was greatly
improved after an instructional intervention that had students read the given information
and then color the property information on the diagrams. They concluded that the colored
parts of the diagram facilitate students’ ability to visualize useful geometric properties
and then use these properties to generate proof solutions.
Finally, diagrams are also the key to developing geometry intuition. According to
Fujita, Jones, and Yamamoto (2004), the development of student intuition can be
achieved by creating and manipulating geometric diagrams mentally or physically. Such
manipulations of geometric diagrams can direct students to visualize relevant geometric
properties and relative images and relate them to geometric concepts and theorems.

32
Manipulations of geometric diagrams also help students decide where and how to start
solving a problem. As a result, Fujita et al. concluded that using a series of well-designed
tasks with diverse diagrams can nurture students’ geometry intuition.
Methods
The methods contain five sections. The first section offers the operative
definitions of terms relevant to the framework development and the coding procedure.
The second section describes the framework with its (sub) categories specific to
geometric diagrams for capturing diverse learning opportunities afforded by GCN tasks.
The following two sections further detail the data and the procedure in analyzing the data.
The final section demonstrates the process of establishing the reliability of the (sub)
categories in the framework.
Operative Definitions of the Terms Used
A Task
Tasks identified in this study include both worked examples in the instructional
blocks used to scaffold students understanding mathematics and facilitating skill
acquisition (Renkl, 2002) and problems in the exercise blocks planned to be solved by
students. Considering that the lengths and requirements of tasks situated in
curricular/instructional materials may vary, thus causing the inconsistency of coding, this
study defines tasks as problems asking for an answer (Charalambous, Delaney, Hsu, &
Mesa, 2010; Zhu & Fan, 2006). For instance, if a GCN problem listed in curricular
materials requires of inferring three different unknown measures, then the problem is
coded as three tasks.
A Geometric Property
33
Geometric properties refer to those geometric statements or definitions formally
introduced in the textbooks. In particular, this study defines a geometric property as that
which supports a problem-solving step to visualize a specific location or a relation in a
diagram configuration (e.g., two congruent segments in an isosceles triangle) so that a
solution can be obtained. Thus, a geometric statement described in the textbook may
contain more than one geometric property. Further clarification of a geometric property
in regard to a geometric statement listed in textbooks is provided in Appendix 2.1.
Solution Steps
A reasoning step is defined as a calculating step set up by applying a geometric
property. Recognizing that a GCN task usually can be solved by multiple solutions,
which may require different reasoning steps, the coding will cause inconsistency. To
solve this problem, this study defines the solution identified in a GCN task as the one that
requires the minimum number of reasoning steps to obtain the answer. Also important
here is that each reasoning step in the solution identified should be supported by a
geometric property that students have learned.
Reference Diagram
A reference diagram is defined as the geometric diagram accompanying a
geometric property that is formally introduced in textbooks. With the idea of treating a
diagram as an external representation (Laborde, 2005), this definition is important
because it can prevent inconsistencies in coding as it does not consider differences in the
mental images of a diagram concept processed by individuals. For example, Figure 2.2
provides different images of a parallelogram that one may possess.

34
Figure 2.2 Different mental images of a parallelogram The term “reference” is borrowed from the notion of reference examples
(Michener, 1978), conveying the special characteristics that the diagram accompanying a
geometric property has. Michener elaborates reference examples as
“…examples that one refers to over and over again. They are basic, widely applicable and provide a common point of contact through which many results and concepts are linked together” (p. 366)
According to Michener, an example of a reference diagram can be an isosceles
triangle in Figure 2.3 that not only conveys the definition of a shape with two congruent
segments, but is also linked to other geometric properties (e.g., the sum of interior angles
of a triangle is 180˚).
Moreover, a reference diagram also possesses salient features, which can help
distinguish other relevant geometric properties. For example, the reference diagram for
an isosceles triangle (see the diagram on left side in Figure 2.3) shows that the lengths of
two congruent legs stand symmetrically on the two sides with the base side on the bottom
parallel to the horizontal axis. Thus, the congruence of the segments in the isosceles
triangle is visible and easy to be perceived. The reference diagram for an isosceles
triangle also reveals the difference in lengths between the congruent segments and the
bottom segment so that there can be no confusion with the reference diagram for an
equilateral triangle (the diagram on the right side in Figure 2.3).

35
Figure 2.3 Reference diagrams for the isosceles triangle definition (on the left side) and
for the equilateral triangle definition (on the right side) (Nan-I, vol. 4, p. 39)
Framework Development
This study developed an innovative framework because existing frameworks
employed in textbook analysis studies associated with geometry are often too general to
depict the specific characteristics of diagrams and to capture how diagrams influence
opportunities for students to learn geometry (Fujita, Jones, & Kunimune, 2009; Haggarty
& Pepin, 2002; Schmidt, McKnight, Valverde, Houang, & Wiley, 1996; Valverde,
Bianchi, Wolfe, Schmidt, & Houang, 2002). The framework developed contains diagram
complexity and problem-solving complexity with (sub) categories. The diagram
complexity aims to describe the characteristics of a complex GCN task diagram that in
turn may prevent students from generating a solution because of the visual obstacles. The
problem-solving complexity focuses on exploring the kinds of cognitive work associated
with geometric diagrams that students have to do when solving a GCN task. Details of
developing the framework with corresponding (sub) categories are described as follows.

36
Figure 2.4 The developed framework with (sub) categories
36

37
Diagram complexity
The initial idea of developing diagram complexity with corresponding categories
was to use segments and vertices, essential elements in constituting a diagram, to
describe how a diagram given in GCN task can be complicated. In particular, this study
illustrates the diagram complexity representing a GCN task as changes of the vertices and
segments by comparing the GCN task diagram with a reference diagram10. Analyzing
GCN task diagrams through a comparison to a reference diagram can provide information
regarding possible visual obstacles that students may encounter when identifying the
reference diagram along with its corresponding geometric property in the given GCN task
diagram.
Accordingly, by applying the grounded-theory approach (Strauss & Corbin, 1998),
this study developed five categories11 to describe the complexity of a diagram given in a
GCN task (see Figure 2.4) including: (1) the number of deleted segments in reference
diagram; (2) the number of original vertices influenced because of the deleted segments;
(3) the number of segments added to reference diagram; (4) the number of original
vertices influenced because of the added segments; and (5) the number of new vertices
created because of the segments added.
To clarify the analysis used to categorize GCN task diagrams with respect to the
five categories, a comparison of a GCN task diagram with a reference diagram embedded
in the diagram is illustrated here.
10 The reference diagram used for the comparison with a GCN task is the one that represents a particular geometric property necessary to obtain the selected solution to the GCN task. Detail of the criteria for determining the reference diagram for a GCN task is described in the coding procedure section. 11 The framework does not consider changes to diagram positions and those to angle or segment measures as another category in diagram complexity because these changes does not alter the numbers of vertices or segments in the original diagram.
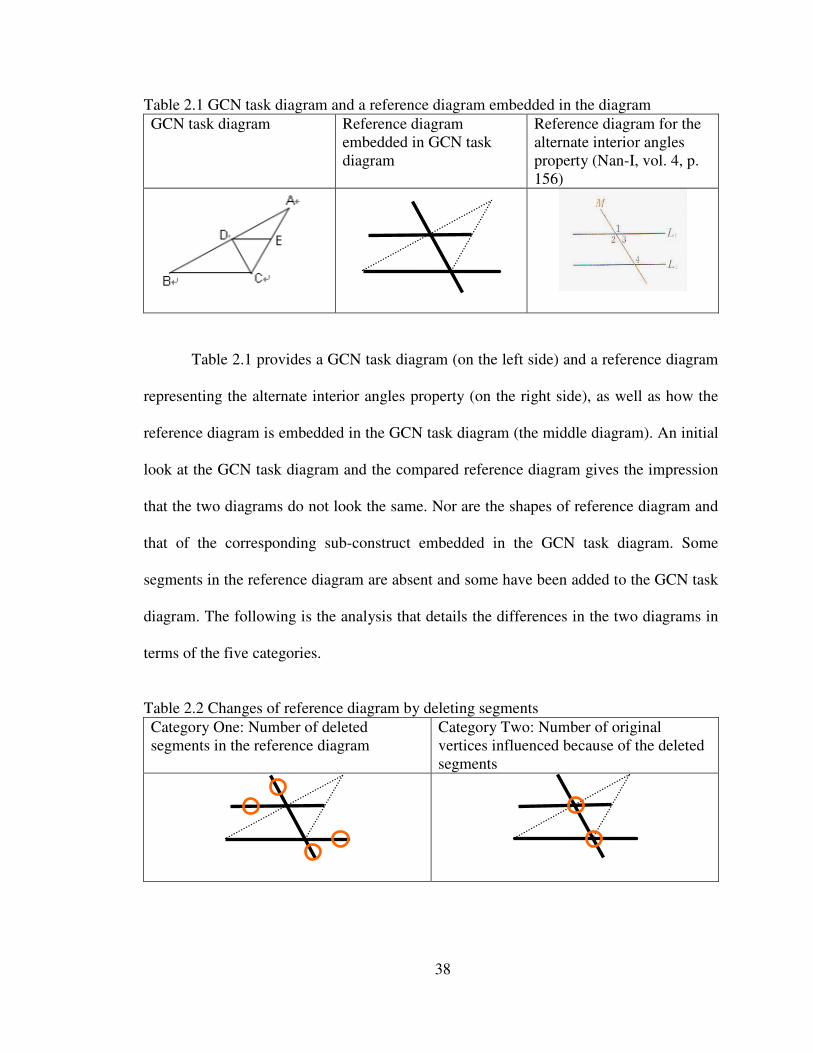
38
Table 2.1 GCN task diagram and a reference diagram embedded in the diagram GCN task diagram Reference diagram
embedded in GCN task diagram
Reference diagram for the alternate interior angles property (Nan-I, vol. 4, p. 156)
Table 2.1 provides a GCN task diagram (on the left side) and a reference diagram
representing the alternate interior angles property (on the right side), as well as how the
reference diagram is embedded in the GCN task diagram (the middle diagram). An initial
look at the GCN task diagram and the compared reference diagram gives the impression
that the two diagrams do not look the same. Nor are the shapes of reference diagram and
that of the corresponding sub-construct embedded in the GCN task diagram. Some
segments in the reference diagram are absent and some have been added to the GCN task
diagram. The following is the analysis that details the differences in the two diagrams in
terms of the five categories.
Table 2.2 Changes of reference diagram by deleting segments Category One: Number of deleted segments in the reference diagram
Category Two: Number of original vertices influenced because of the deleted segments
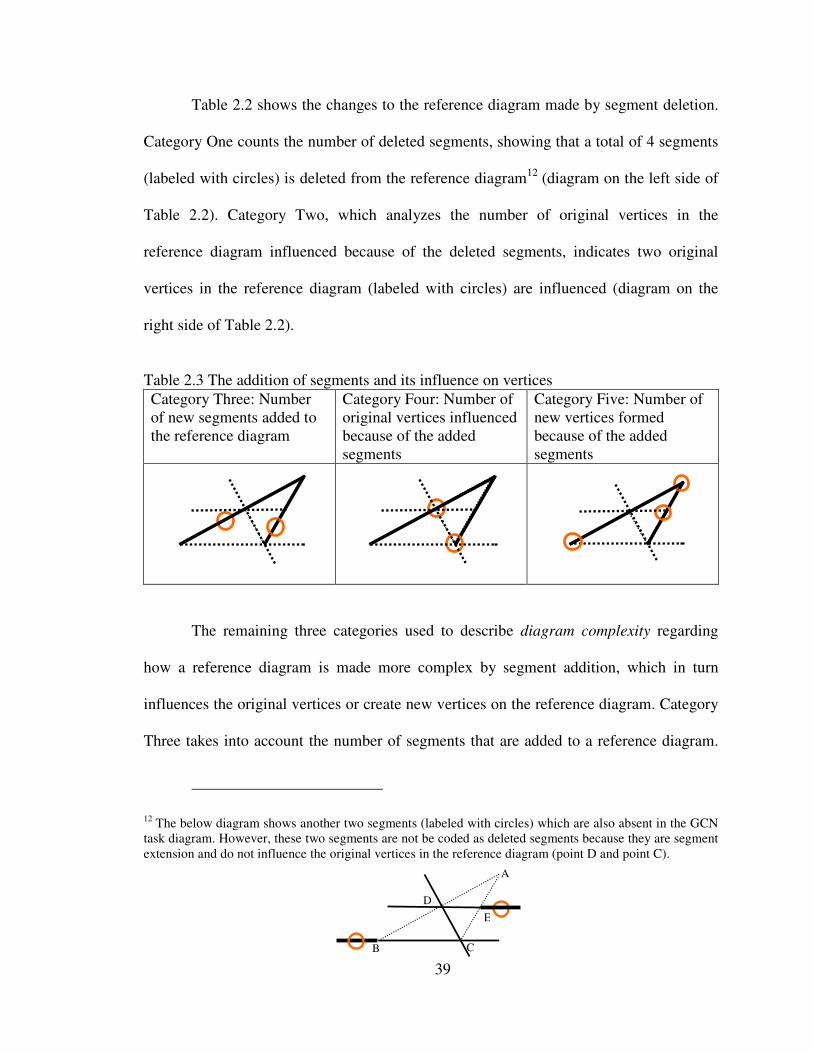
39
Table 2.2 shows the changes to the reference diagram made by segment deletion.
Category One counts the number of deleted segments, showing that a total of 4 segments
(labeled with circles) is deleted from the reference diagram12 (diagram on the left side of
Table 2.2). Category Two, which analyzes the number of original vertices in the
reference diagram influenced because of the deleted segments, indicates two original
vertices in the reference diagram (labeled with circles) are influenced (diagram on the
right side of Table 2.2).
Table 2.3 The addition of segments and its influence on vertices Category Three: Number of new segments added to the reference diagram
Category Four: Number of original vertices influenced because of the added segments
Category Five: Number of new vertices formed because of the added segments
The remaining three categories used to describe diagram complexity regarding
how a reference diagram is made more complex by segment addition, which in turn
influences the original vertices or create new vertices on the reference diagram. Category
Three takes into account the number of segments that are added to a reference diagram.
12 The below diagram shows another two segments (labeled with circles) which are also absent in the GCN task diagram. However, these two segments are not be coded as deleted segments because they are segment extension and do not influence the original vertices in the reference diagram (point D and point C).
B C
D
E
A
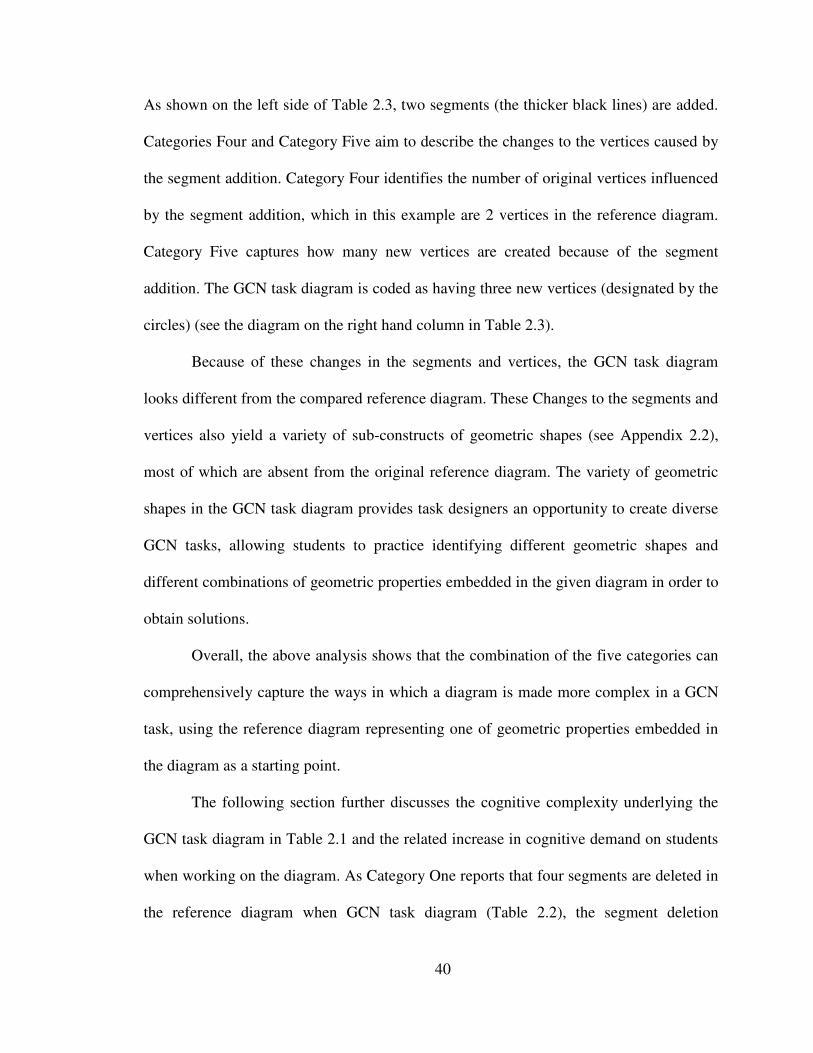
40
As shown on the left side of Table 2.3, two segments (the thicker black lines) are added.
Categories Four and Category Five aim to describe the changes to the vertices caused by
the segment addition. Category Four identifies the number of original vertices influenced
by the segment addition, which in this example are 2 vertices in the reference diagram.
Category Five captures how many new vertices are created because of the segment
addition. The GCN task diagram is coded as having three new vertices (designated by the
circles) (see the diagram on the right hand column in Table 2.3).
Because of these changes in the segments and vertices, the GCN task diagram
looks different from the compared reference diagram. These Changes to the segments and
vertices also yield a variety of sub-constructs of geometric shapes (see Appendix 2.2),
most of which are absent from the original reference diagram. The variety of geometric
shapes in the GCN task diagram provides task designers an opportunity to create diverse
GCN tasks, allowing students to practice identifying different geometric shapes and
different combinations of geometric properties embedded in the given diagram in order to
obtain solutions.
Overall, the above analysis shows that the combination of the five categories can
comprehensively capture the ways in which a diagram is made more complex in a GCN
task, using the reference diagram representing one of geometric properties embedded in
the diagram as a starting point.
The following section further discusses the cognitive complexity underlying the
GCN task diagram in Table 2.1 and the related increase in cognitive demand on students
when working on the diagram. As Category One reports that four segments are deleted in
the reference diagram when GCN task diagram (Table 2.2), the segment deletion

41
occludes the reference diagram embedded in the diagram of GCN task because the
reference diagram does not resemble its original shape. If students recognize the diagram
only based on its appearance of shape, which Duval (1995) terms perceptual
apprehension, they will not be able to identify or they will misinterpret which part of the
configurations of the GCN task diagram represents the reference diagram. Nor can they
figure out the geometric properties that correspond to the reference diagram in the GCN
task diagram.
Another challenge for students is that, as discussed earlier, the segment deletion
also influences the original vertices of reference diagram; thus, these constituted angles in
the original reference diagram are also changed. Detail is illustrated as follows.
Table 2.4 Reference diagram and its changes in GCN task diagram after segment deletion Reference Diagram for the alternate interior angles property with angle labels
The reference diagram embedded in part of the GCN task diagram configurations
Table 2.4 shows cognitive complexity of the GCN task diagram when compared
to the reference diagram after segment deletion. The reference diagram is constituted by a
pair of parallel lines and a transversal with eight angles, two of which (∠3 and ∠6, ∠4
and ∠5) represent the alternate interior angles property. The right side of Table 2.4 shows
what happens to the reference diagram after segment deletion. As can be seen, only two
of the original eight angles are retained in the GCN task diagram, namely ∠4 and ∠5.
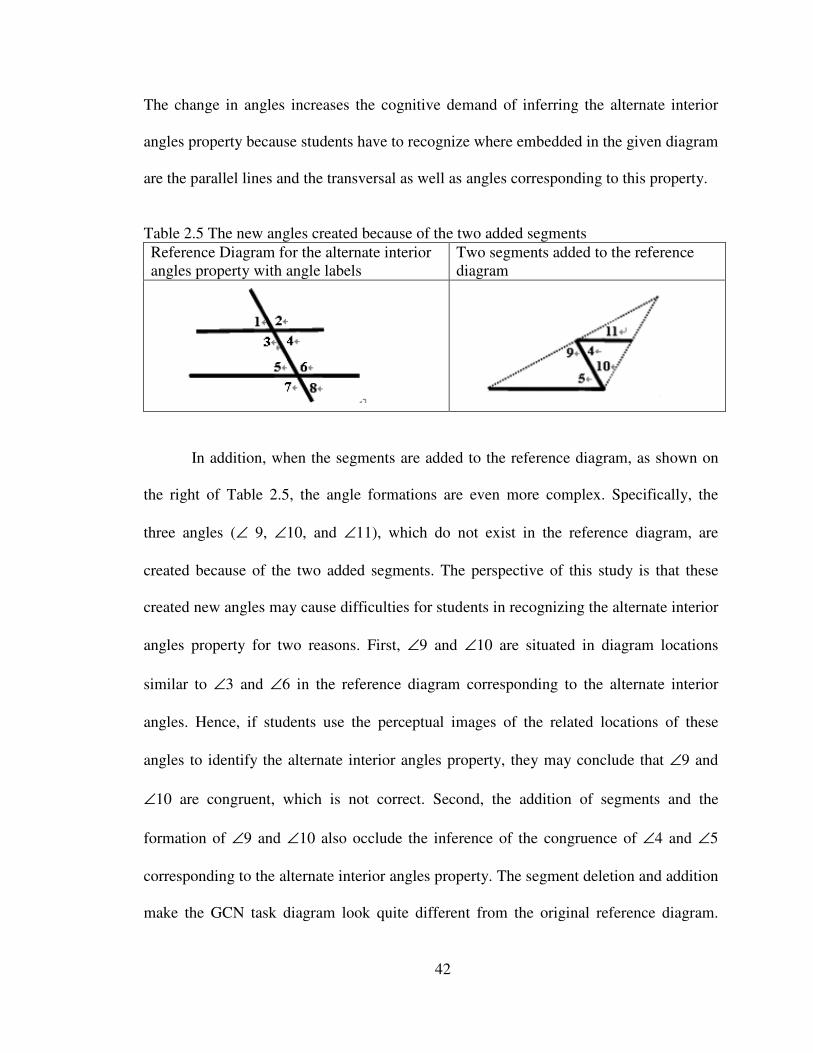
42
The change in angles increases the cognitive demand of inferring the alternate interior
angles property because students have to recognize where embedded in the given diagram
are the parallel lines and the transversal as well as angles corresponding to this property.
Table 2.5 The new angles created because of the two added segments Reference Diagram for the alternate interior angles property with angle labels
Two segments added to the reference diagram
In addition, when the segments are added to the reference diagram, as shown on
the right of Table 2.5, the angle formations are even more complex. Specifically, the
three angles (∠ 9, ∠10, and ∠11), which do not exist in the reference diagram, are
created because of the two added segments. The perspective of this study is that these
created new angles may cause difficulties for students in recognizing the alternate interior
angles property for two reasons. First, ∠9 and ∠10 are situated in diagram locations
similar to ∠3 and ∠6 in the reference diagram corresponding to the alternate interior
angles. Hence, if students use the perceptual images of the related locations of these
angles to identify the alternate interior angles property, they may conclude that ∠9 and
∠10 are congruent, which is not correct. Second, the addition of segments and the
formation of ∠9 and ∠10 also occlude the inference of the congruence of ∠4 and ∠5
corresponding to the alternate interior angles property. The segment deletion and addition
make the GCN task diagram look quite different from the original reference diagram.

43
Consequently, students have to physically or mentally decompose and recompose the
given diagram (Gal & Linchevski, 2010) in order to identify the sub-construct with the
alternate interior angles in the GCN task diagram.
In sum, this section compares a GCN task diagram with a reference diagram to
elaborate the coding with respect to the five categories and how complicating a diagram
may cause visual obstacles in recognizing the sub-constructs of the diagrams with
corresponding geometric properties.
Problem-Solving Complexity
Problem-solving complexity developed in the framework consists of four
categories: auxiliary lines required or not, number of solution steps, number of geometric
properties required, and number of diagram transformations (slides, flips, and turns)
required in a solution. The four categories are included because they represent the kinds
of cognitive work essential for solving a GCN task.
Auxiliary lines
The first category included in problem-solving complexity captures cognitive
demand of drawing auxiliary lines necessarily to obtain the solution with minimum
number of reasoning steps in a GCN task. For some GCN tasks, geometric properties
embedded in a GCN task diagram are not sufficient to generate the solution, thus creating
cognitive work on adding lines to create new sub-constructs and new geometric
properties helpful for solution generation. Pólya (1945) indicates that to construct
auxiliary lines students need to recall prior knowledge and previous problem-solving
experiences, which help them decide the locations of the lines in diagrams that can
contribute to the solution generation. Yerushalmy and Chazan (1990) further specify that

44
constructing the new lines facilitates students to “generate new insights into the diagram,
both questions and conjectures” (p. 213). However, the work of drawing auxiliary lines
on a diagram usually is highly demanding because it forces students to anticipate the
creation of sub-constructs associated with corresponding geometric properties that can be
used to form a solution plan. This anticipation further requires students to view the
diagram dynamically and apply the transformational observation (Harel & Sowder, 1998)
to visualize a solution generated with the help of such auxiliary lines (Hsu, 2007).
Solution steps
The second category contained in problem-solving complexity involves analyzing
the solution steps, i.e. the minimum number of reasoning steps that are necessary to
obtain the solution in a GCN task. Here, a reasoning step is a problem-solving action set
up by applying a geometric property.
Previous studies have addressed number of solution steps that can influence the
cognitive demand of a task because generating a multiple-step solution requires students
not only to retrieve geometric properties for each reasoning step based on either the
diagram or the givens, but also to chain the reasoning steps into a logic sequence (Ayres
& Sweller, 1990; Cheng & Lin, 2008; Heinze, Reiss, & Rudolph, 2005; Ufer & Heinze,
2008). Specially, inferring the intermediate reasoning steps for a multiple-step GCN task
is usually more challenging for students than obtaining the answer to the task (Ayres &
Sweller, 1990). This is because the intermediate steps require students to reason forward
and backward between the givens and the conclusion statements in order to map out a
solution path that satisfies both the givens and the conclusion statements, the cognitive
work termed as “hypothetical bridge” (Cheng & Lin, 2008).

45
However, textbook analysis studies usually categorize solutions steps for tasks in
a binary matter as single-step verses multiple-step (Li, 2000; Son & Senk, 2010; Stigler,
Fuson, Ham, & Kim, 1986; Zhu & Fan, 2006). This binary classification scheme provides
very limited information regarding cognitive demand of tasks situated in curricular or
instructional materials because the classification could not elaborate the differences in
cognitive demand for different number of solution steps. In contrast to these studies, the
present framework can systematically determine the number of solution steps and use the
coding result to describe the cognitive demand that a GCN task requires.
Required geometric properties
In addition to determining solution steps for a GCN task, problem-solving
complexity also analyzes the minimum number of geometric properties required in a
solution. Three considerations underline the decision to include this category in the
framework. First, the number of geometric properties necessary to obtain a solution for a
GCN task may not be same as that of solution steps because different reasoning steps in a
solution may require the use of the same geometric property. Therefore, analyzing
required geometric properties can provide richer information regarding the opportunities
that a GCN task can provide students to learn. Second, the coding of the required
geometric properties for GCN tasks also influences the subsequent identification of
reference diagrams because these are necessarily the diagrams representing the geometric
properties needed to obtain the solution with minimum reasoning steps. Third, analyzing
the geometric properties are also significantly related to the examination of diagram
transformations, which compare the transformation actions involved in mapping

46
reference diagrams representing these geometric properties necessary to obtain the least-
step solution onto the given GCN task diagram.
Diagram Transformation
The fourth category included in analyzing the complexity of problem-solving
process is minimum number of diagram transformations (e.g., rotating) because it reveals
the cognitive work created when students are required to map reference diagrams onto a
GCN task diagram in order to retrieve geometric properties that are necessary to generate
the fewest-step solution to the task. During this mapping process, students may need to
mentally or physically transform the reference diagrams (e.g., rotating) to check if they
resemble a part of the diagram configurations in a GCN task. This manipulation causes
cognitive difficulties for students because the orientation and position of a GCN task
diagram may influence the identification of corresponding reference diagrams (Fischbein
& Nachlieli, 1998). In this process, three types of manipulative activities are relevant for
the extant study: slides (translations), turns (rotations), and flips (reflections) (Kidder,
1976; Piaget & Inhelder, 1967; Williford, 1972). These actions leave a diagram
unchanged except for its position and orientation.
Data
This study focuses on a geometry chapter with the content of properties related to
parallel lines and quadrilaterals as the data boundary to collect both textbook materials
and auxiliary instructional materials from the mathematics teacher, Nancy, when she
taught an 8th grade class with about 40 students in a private girls’ high school in Taiwan.
The reason to select Nancy is that she represents a typical expert Taiwanese teacher at the
middle school level because she has several attributes that are part of the cultural script

47
(Stigler & Hiebert, 1999) of Taiwan instruction, including the profound understanding of
subject content knowledge for mathematics (Ma, 1999); good mathematics knowledge for
teaching (MKT) (Ball, Hill, & Bass, 2005); and, the most important, examination-
oriented teaching style. The high-stakes entrance examination plays a crucial role in
influencing Nancy’s instruction because she aims to help her students obtain high scores
in the entrance examination and believes that students’ success on the examination is a
very important criterion for evaluating the quality of teaching.
The reason for selecting this geometry chapter is because of its particular role in
facilitating students’ cognitive movement from empirical explorations into formal GP. In
line with the National Curriculum Standard (Ministry of Education, 2003), this geometry
chapter not only aims to help students become familiar with geometric content (e.g.,
definition, properties), but also to gradually introduce students to the concept of GP
through different instructional activities (e.g., hands-on activities). Accordingly,
mathematics textbooks for this grade level contain GP that show students what a GP
looks like and how to make general inferences based on geometric properties in a proof
construction. However, students at this stage are not expected to construct formal proofs
themselves; rather, they only complete already partly-constructed proof tasks (e.g.,
writing down one of the proving sentences) or to figure out the geometric properties that
support a proving sentence. To achieve the curricular goal, a high proportion of GCN
tasks are used as alternative materials that help students acquire the geometric knowledge
and solution skills that can be used to solve GP later.
Totally four types of curricular/instructional materials were collected when Nancy
taught this geometry chapter in an 8th grade class, including the textbook series, the

48
supplemental materials, the tests, and the tasks created by Nancy that she used when
teaching this geometry chapter. Details of the four types of curricular/instructional
materials are provided in Appendix 2.3.
Coding Procedure
Figure 2.5 provides a flowchart showing the procedure for coding geometric tasks
collected from Nancy’s class.

49
Figure 2.5 Flowchart for the coding procedure

50
The coding procedure started with determining whether a geometric task was a
GCN task. A problem related to the determination of a GCN task was encountered when
a GC task does not use any algebraic expressions in the givens but requires the
application of algebraic calculations to obtain the solution with the fewest reasoning steps.
To solve this problem, this study clarified a GC as a Non-GCN task if its solution
requires the application of algebraic skills whether or not the givens use algebraic
expressions. Further details regarding the problem and the coding decision are illustrated
in Appendix 2.4.
The next coding procedure centered on the problem-solving complexity with its
four categories (auxiliary lines required or not, minimum number of solution steps,
minimum number of geometric properties required in a solution, and diagram
transformations). In particular, the coding began with the determination of minimum
number of solution steps, which in turn affected the next steps of analysis. Therefore,
Step Two of the coding procedure examined solution steps necessary to obtain the answer
requiring the fewest reasoning steps. After the number of the solution steps for a GCN
task was identified, Step Three checked if the solution required the drawing of auxiliary
lines. Step Four assessed the number of geometric properties used to support minimum
number of reasoning steps in the identified solution. Specifically, the geometric
properties were those that were formally introduced in textbooks previously. Any
geometric properties that had not been learned were excluded even if these properties
could be used to generate the solution to a GCN task.
Step Five of the coding procedure furthered the investigation of transformation
together with its three sub-categories. Because the coding of diagram transformations

51
necessitated the present of given diagrams in the task presentation, GCN tasks without
accompanying diagrams were excluded from the analysis. The coding computed the
minimum number of transformation actions that were required to map the reference
diagrams representing the geometric properties identified in the solution onto the given
GCN task diagram.
The final two coding steps focused on diagram complexity dimension. Again, as
the analyses of diagram complexity also required the presence of given diagrams in the
GCN tasks, these tasks in which diagram were not provided were excluded from the
analysis. Step Six determined the reference diagram that was the basis for examining the
complexity of a diagram given in a GCN task. Several steps were carried out to determine
the reference diagram represented in a GCN task. First of all, the reference diagram used
to analyze the complexity of a GCN task diagram must be one of the reference diagrams
corresponding to the geometric properties that were necessary to obtain the minimum
number of solution steps in this task. Secondly, when several reference diagrams were
identified in a GCN task, reference diagram representing the geometric property that was
one of the to-be-learned properties in the current teaching unit was selected as the one
used to analyze the diagram complexity with corresponding categories. After a reference
diagram was identified for a GCN diagram task, Step Seven of the coding procedure
furthered to analyze the diagram complexity with its five coding categories based on the
reference diagram identified. After coding the five categories, this study computed
coding results as the minimum number of changes needed to transform a reference
diagram into the diagram that accompanied the task. This minimum number was used an
indicator to describe the complexity for a GCN task diagram.
52
Inter-Rater Reliability
Inter-rater reliability for the sets of (sub) categories in the framework was
established with a coder who has master’s degree in mathematics education and has
teaching experience in Taiwan. To ensure the consistency of the coding results, several
steps were taken. First, we selected tasks from each unit of the geometry chapter and each
type of curricula/instructional material to examine if the categorizations in the framework
could capture the characteristics of a GCN task in terms of its diagram and the kinds of
cognitive work involving the diagram when solving the task. We deliberately selected
tasks that were difficult to classify and used the coding from these tasks to validate and
modify the (sub) categories.
Secondly, about 10 % of the tasks selected from each unit of the geometry chapter
were coded by the author and the coder individually. In the first trial, very good inter-
rater reliability13 was achieved for the categories of auxiliary lines, and the sub-category
of slide in diagram transformation category (kappa statistics (κ) =0.95 for auxiliary lines,
κ=1.00 for slide) (Altman, 1991). For the coding of the five categories used to access the
diagram complexity, the strength of inter-rater agreements was good (κ=0.73 for deleted
segments in reference diagram; κ=0.70 for original vertices influenced because of deleted
segments; κ=0.71 for new segments added to reference diagram; κ=0.69 for original
vertices influenced because of the added segments; and κ=0.75 for new vertices formed
because of the added segments). But for the rest of (sub) categories in the framework—
the solution steps, required geometric properties, and rotation and flip in diagram
13 The Cohen’s κ was used to assess the inter-rater agreement. According to Altman (1991), κ=<0.20 reflects poor strength of agreement, 0.21-0.41 fair, 0.41-0.60 moderate, 0.61-0.80 good, and 0.81-1.00 indicates very good strength of agreement.

53
transformation category—the reliability was low. The discrepancies can be attributed to
the fact that the answer to a GCN task could be obtained in different ways. Even though
this study defined the solution to a GCN task as the one requiring the fewest number of
reasoning steps, identifying this solution was still demanding because the fewest-step
solution could be identified only when all solutions to a task could be determined. To
address this difficulty, we proposed an alternative approach to ensure the coding
reliability for those (sub) categories by discussing all the possible solutions to a GCN task
before formally coding the task with respect to (sub) categories and calculating the inter-
rater agreements. The author and the coder analyzed each task individually and then
discussed together to merge our knowledge of a GCN task to determine the fewest-step
solution to the task. After achieving consistency in selecting the solution for a GCN task,
we re-coded the low-reliability (sub) categories separately again. Importantly,
recognizing that coding of the five categories in diagram complexity dimension was also
related to determination of the fewest-step solution to a GCN task, we also re-coded these
five categories. The calculations of inter-rater reliability showed that the recoding of
these (sub) categories all achieved very good strength of agreement. For the solution
steps and required geometric properties, kappa statistics (κ) was 0.98 and 0.97
respectively. Regarding both the rotation and flip sub-categories, we had kappa statistics
(κ) =1.00. We also achieved outstanding reliability for the coding of the five sub-
categories of diagram complexity (κ=1 for all the five categories in diagram complexity).
Limitations
The major limitation of this study originates from the decision to select one
Taiwanese mathematics teacher of teaching an 8th grade class with a population of 40
54
students and collect the curricular/instructional materials from one geometry chapter.
Although well-justified, selecting a Taiwanese mathematics teacher and her instruction
related to a single geometry chapter limits any generalization because the study cannot
capture how learning opportunities are afforded to students engaged in other geometry
chapters or with other geometric teachers. As a result, the results cannot be generalized to
other Taiwanese mathematics teachers or to other grade levels. Different teachers may
have different viewpoints regarding what tasks from which curricular/instructional
materials should be chosen for students to enact. Furthermore, considering students’
naïve competencies in learning the mathematics and the pressures from students and their
parents aimed at influencing teacher’s choice of the curricular materials (Herbel-
Eisenmann, Lubienski, & Id-Deen, 2006), it is also very possible that the same teacher
may use different curricular/instructional materials for a different student population.
Another limitation of this study is the focus on middle school level. While
recognizing the role of examination in influencing the curricular/instructional materials
given to students to enact at this level, the use of auxiliary curricular/instructional
materials at the elementary school level14 may be very different from those found in this
study. In addition, a limitation may also derive from the geometry content analyzed in
this study. As each geometry topic has its special characteristics in terms of shapes,
properties, and relation to calculations and proofs, it is possible that the analysis of GCN
tasks associated with other geometry topics may generate results different from those in
this study.
14 For high school level, because students also need to take the university entrance examination, the use of auxiliary curricular/instructional materials may be similar to those used in middle school level. However, the use of curricular/instructional materials implemented in high school classes requires further investigation.

55
Findings
GCN Tasks Used in Nancy’s Class
A total of 1084 geometric tasks were identified in the curricular/instructional
materials as available for use by Nancy when she taught the geometry material that is the
focus of this study. Among these geometric tasks, about one-half (529 tasks) were
categorized as GCN tasks and the remaining half were non-GCN tasks (e.g., GCA,
construction, exploration, or GP). In general, given that this dissertation focuses on GCN
tasks, the analyses presented here focused on those 529 tasks. More specifically, some
analyses (e.g., diagram complexity and diagram transformations) required the presence of
given diagram in the task presentation, so these analyses found on the 423 of the 529
GCN tasks in which a diagram was provided15 . First, I report the results regarding
diagram complexity, after which I detail the analyses regarding problem-solving
complexity.
Diagram Complexity
The analysis of diagram complexity was based on the 423 tasks that included a
given diagram. Diagram complexity was determined by the minimum number of changes
needed to transform a reference diagram into the diagram that accompanied the task. The
number of changes (i.e., segment addition or segment deletion) ranged from 0-22. Table
2.6 gives the observed frequencies for the changes. A very high percentage (81.7%) of
GCN task diagrams used in this class involved at least one change from a reference
15 For these GCN tasks in which a diagram is not provided, their written information either indicates the geometric shape or elaborate the diagram constructions for the tasks. In this regard, students require to mentally or physically construct the geometric shapes themselves in order to set up the calculating steps to obtain solutions.

56
diagram16. In general, these changes to the reference diagram influenced the original
vertices or created new vertices. As can be seen in Table 2.6, about 55% of the GCN
tasks involved diagrams with at least 6 changes from a reference diagram.
Table 2.6 Distribution of frequency and percentage of diagram complexity
Numbers of changes Frequency Percent (%)
0 80 18.3 1-5 117 26.8
6-10 178 40.8 11 through the highest (22) 61 14.1
Total 436 100
A total of 356 GCN tasks had diagrams that involved at least one change from a
reference diagram. For these diagrams, I identified five categories of changes from a
reference diagram and tabulated the frequency of each type of change. Table 2.7
summarizes the means and standard deviations for each category of change. Several
observations can be made from the data reported in the table. First, the GCN task
diagrams were more likely to be obtained by adding segments to reference diagrams
(mean value=2.04) than by deleting original segments from the diagrams (mean
value=1.04). Second, segment additions to a reference diagram were more likely to create
new vertices (mean value=2.19) rather than to influence the original vertices (mean
value=1.17) of the diagram. Third, the number of original vertices in a reference diagram
influenced by segment deletion was less than those affected by segment addition. In
addition, the analysis shows that, on average, GCN task diagram had about 7 changes
(mean value=7.38) involving segments and vertices.
16 Though the diagrams used in about 18% of the GCN tasks did not involve changing a reference diagram by adding or deleting segments, these diagrams were sometimes different from the corresponding reference diagrams because of the changes in diagram positions or measures of angles and segments.

57
Table 2.7 Descriptive analysis of categories in diagram complexity dimension per diagram
Category Mean Std. D Deleted segments in reference diagram 1.04 1.390 Vertices influenced because of the deleted segments .95 1.386 New segments added to reference diagram 2.04 1.438 New vertices formed because of the added segments 2.19 1.699 Original vertices influenced because of the added segments 1.17 1.243 Sum of the five categories for a GCN task diagram 7.38 4.438
Problem-Solving Complexity
In this section, I present the analysis of complexity of problem-solving complexity
of the GCN tasks. This analysis consisted of four components: whether auxiliary lines
required or not, the minimum number of solution steps, the minimum number of
geometric properties required in a solution, and whether diagram transformations (slides,
flips, and turns) were required or not and if required, how many frequencies. The first
three components were investigated for the set of 529 GCN tasks, but the analysis of
transformations used only the 436 tasks that contained diagrams. An example of a GCN
task and the analysis of this task with respect to each of the four components can be
found in Appendix 2.5.
Auxiliary lines
About one in four of the 529 GCN tasks required students to draw auxiliary lines
in order to obtain a solution. In general, the solutions to the GCN problems used in
Nancy’s classroom required the drawing of at most one auxiliary line.
Solution Steps
Table 2.8 gives the distribution for the frequency and percentage of the minimum
number of solution steps for the GCN tasks. The number of required solution steps
ranged from 0 to 17. More than 70% of the GCN tasks required multiple solution steps

58
with nearly half of the tasks requiring 2-4 steps. About one task in five required at least 5
solution steps.
Table 2.8 Distribution of frequency and percentage of solution steps
Number of solution steps Frequency Percent (%) 0 4 0.8 1 152 28.7
2-4 260 49.1 5-7 75 14.2
8 through the highest (17) 38 7.2 Total 529 100
Required geometric properties
Similar to the analysis of the minimum number of solution steps, I also analyzed
the minimum number of geometric properties required for a solution of a GCN task.
Table 2.9 displays the distribution for frequency and percentage of the minimum number
of geometric properties for the GCN tasks. The number of required geometric properties
ranged from 0 to 13. About two-thirds of the tasks required students to apply at least two
geometric properties in order to obtain a solution. In addition, one can notice the
similarity of frequencies in Table 2.8 and Table 2.9 which indicate that most GCN tasks
situated in Nancy’s class require of different geometric properties to obtain solutions.
Table 2.9 Distribution of frequency and percentage of geometric properties needed
Required geometric properties Frequency Percent (%) 0 4 0.8 1 172 32.5
2-4 285 53.9 5-7 47 8.9
8 through the highest (13) 21 4.0 Total 529 100

59
Diagram Transformations
For the 436 GCN tasks that had accompanying diagrams, I examined whether a
solution required a transformation of diagram using a rigid transformation (i.e., slide, flip,
or rotation). Table 2.10 gives the distribution for the frequency and percentage of
required transformations for the GCN tasks. The number of required transformation
actions ranged from 0 to 10. More than two-thirds of these tasks required students to
perform at least one transformation action. Nearly four in ten of these GCN tasks
required at least 2 transformation actions.
Table 2.10 Distribution of frequency and percentage of transformation actions required
Number of required transformation actions Frequency Percent 0 132 30.3 1 142 32.6 2 78 17.9
3 through the highest (10) 84 19.2 Total 436 100.0
An examination of the specific transformation actions required for the GCN tasks
used by the Taiwanese teacher, Nancy, revealed that (a) none of GCN tasks required the
action of sliding, because the diagrams in the GCN tasks were static and did not indicate
any dynamic changes in location; and (b) the GCN task diagrams that required
transformations were almost twice as likely to require a turn (mean value=0.91) than a
flip (mean value=0.52).
GCN Tasks Situated in Different Curricular/Instructional Materials
Here I further discuss the GCN tasks situated in different curricular/instructional
materials used by the Taiwanese teacher, Nancy. In her classroom, four types of
curricular/instructional sources were used, including the textbook series, the

60
supplemental materials, the tests, and the tasks created by her. Of the 529 GCN tasks
analyzed, more than three-fourths (414 tasks) were situated in the auxiliary
curricular/instructional materials that Nancy added for her students to practice. Almost
one-half (256 GCN tasks) were found in the tests and roughly 29% (151 tasks) were in
the supplemental materials. Very few tasks (1%) were created by Nancy.

61
Table 2.11 Descriptive analysis of different types of curricular/instructional materials
Problem-Solving Complexity Diagram Complexity Auxiliary
lines Solution Steps
Required Geometric properties
Transformation
N Mean Std. D N Needed N Mean Std. D N Mean Std. D N Mean Std. D
Textbook series
115 3.94 3.726 115 8
(7.0%)* 115 1.92 1.874 115 1.69 1.314 115 0.63 .755
Supplemental materials
125 5.73 4.500 151 26
(17.2%) 151 2.85 2.523 151 2.33 1.719 125 1.14 1.150
Tests 189 7.47 4.291 256
81 (31.6%)
256 4.07 3.027 256 3.19 2.047 189 2.08 1.754
Tasks created by Nancy
7 6.86 4.180 7 4
(57.1%) 7 3.14 1.215 7 2.43 1.134 7 1.18 .378
Total 436 6.03 4.438 529
119 (22.5%)
529 3.24 2.786 529 2.61 1.903 436 1.42 1.495
* Number of tasks and percentages in (parenthesis)
61

62
Table 2.11 presents a summary of the number of GCN tasks used by Nancy, the
mean values, and standard deviations for different curricular/instructional materials with
respect to diagram complexity and the four components of problem-solving complexity
(auxiliary lines, minimum number of solution steps, minimum number of geometric
properties required in a solution, and diagram transformations). Several observations can
be made from the data reported in the above table. First of all, the GCN tasks in the
textbook series had the lowest mean values or percentage in all of the categories analyzed.
Second, GCN tasks included on the tests had the highest mean values for most of
categories analyzed, except for the category of auxiliary lines. For the category of
auxiliary lines, the percentage of GCN tasks on the tests ranked the second highest
among the four types of curricular/instructional materials. Third, the mean values or
percentage for the supplemental materials in the categories analyzed are all higher than
those for the textbook series and lower than those for the tests and the tasks created by
Nancy.
The statistical analyses provide further information regarding cognitive
complexity of GCN tasks used in the types of curricular/instructional materials. As
presented in Table 2.12 and Table 2.13, ANOVA analysis for GCN tasks with respect to
diagram complexity and the three components of problem-solving complexity (minimum
number of solution steps, minimum number of geometric properties required in a solution,
and diagram transformations) as well as Chi-square test for auxiliary line category in
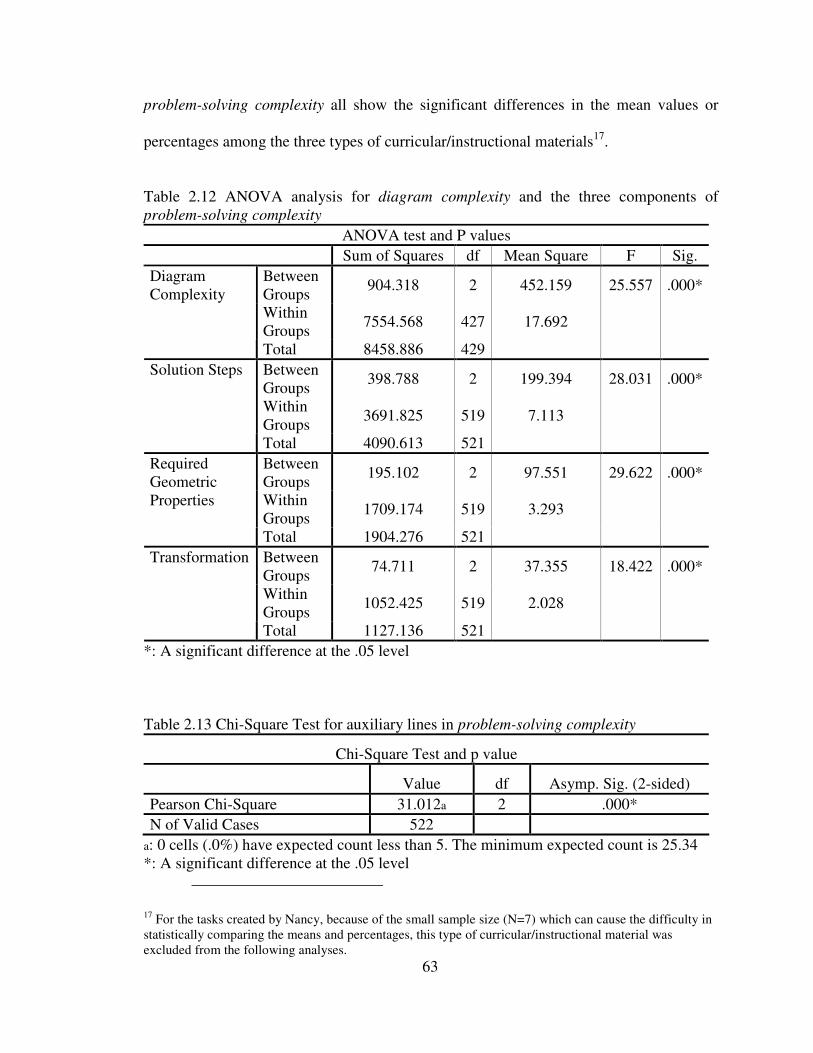
63
problem-solving complexity all show the significant differences in the mean values or
percentages among the three types of curricular/instructional materials17.
Table 2.12 ANOVA analysis for diagram complexity and the three components of problem-solving complexity
ANOVA test and P values Sum of Squares df Mean Square F Sig.
Between Groups
904.318 2 452.159 25.557 .000*
Within Groups
7554.568 427 17.692
Diagram Complexity
Total 8458.886 429 Between Groups
398.788 2 199.394 28.031 .000*
Within Groups
3691.825 519 7.113
Solution Steps
Total 4090.613 521 Between Groups
195.102 2 97.551 29.622 .000*
Within Groups
1709.174 519 3.293
Required Geometric Properties
Total 1904.276 521 Between Groups
74.711 2 37.355 18.422 .000*
Within Groups
1052.425 519 2.028
Transformation
Total 1127.136 521 *: A significant difference at the .05 level
Table 2.13 Chi-Square Test for auxiliary lines in problem-solving complexity
Chi-Square Test and p value
Value df Asymp. Sig. (2-sided) Pearson Chi-Square 31.012a 2 .000* N of Valid Cases 522
a: 0 cells (.0%) have expected count less than 5. The minimum expected count is 25.34 *: A significant difference at the .05 level
17 For the tasks created by Nancy, because of the small sample size (N=7) which can cause the difficulty in statistically comparing the means and percentages, this type of curricular/instructional material was excluded from the following analyses.

64
Post hoc tests for the diagram complexity and the three components of problem-
solving complexity (see Table 2.14) as well as posteriori comparisons for auxiliary lines
(see Table 2.15) further show that any two of the three curricular/instructional materials
all achieved significant differences, except for the comparison of the supplemental
materials and the textbook series in the diagram transformations. The mean values or
percentages for the tests are all significantly higher than the textbook series and the
supplemental materials in diagram complexity and components of problem-solving
complexity. The mean values or percentages for the supplemental materials are also
significantly higher than the textbook series in the coding categories, except for the
diagram transformations. The statistical analysis confirms that GCN tasks used in the
tests were the most cognitively complex, whereas those situated in the textbook series
were the least demanding.
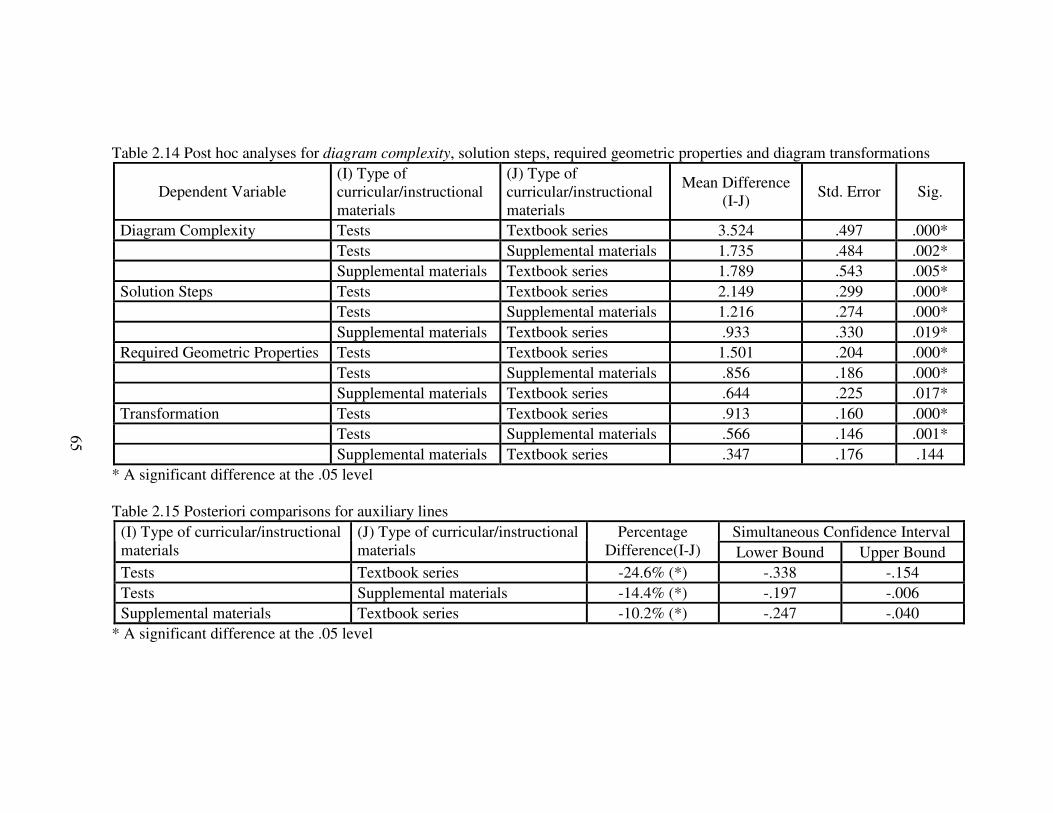
65
Table 2.14 Post hoc analyses for diagram complexity, solution steps, required geometric properties and diagram transformations
Dependent Variable (I) Type of curricular/instructional materials
(J) Type of curricular/instructional materials
Mean Difference (I-J)
Std. Error Sig.
Diagram Complexity Tests Textbook series 3.524 .497 .000* Tests Supplemental materials 1.735 .484 .002* Supplemental materials Textbook series 1.789 .543 .005* Solution Steps Tests Textbook series 2.149 .299 .000* Tests Supplemental materials 1.216 .274 .000* Supplemental materials Textbook series .933 .330 .019* Required Geometric Properties Tests Textbook series 1.501 .204 .000* Tests Supplemental materials .856 .186 .000* Supplemental materials Textbook series .644 .225 .017* Transformation Tests Textbook series .913 .160 .000* Tests Supplemental materials .566 .146 .001* Supplemental materials Textbook series .347 .176 .144
* A significant difference at the .05 level
Table 2.15 Posteriori comparisons for auxiliary lines Simultaneous Confidence Interval (I) Type of curricular/instructional
materials (J) Type of curricular/instructional materials
Percentage Difference(I-J) Lower Bound Upper Bound
Tests Textbook series -24.6% (*) -.338 -.154 Tests Supplemental materials -14.4% (*) -.197 -.006 Supplemental materials Textbook series -10.2% (*) -.247 -.040
* A significant difference at the .05 level
65

66
Summary
These analyses of the GCN tasks used in Nancy’s classroom indicate that her
students had frequent opportunities to encounter tasks that embodied diagram complexity
and problem-solving complexity. The GCN tasks in her classroom frequently required
students to use two or more geometric properties to solve a problem, and they often
required multiple solution steps. A portion of GCN tasks also required the drawing of an
auxiliary line or a transformation of a diagram by flipping or rotating. In addition, the
vast majority of tasks were accompanied by diagrams that were complex variants of
reference diagrams obtained by adding or deleting segments in the reference diagrams.
Furthermore, the analyses also show that a high portion of the GCN tasks
involving diagram complexity and problem-solving complexity came from the auxiliary
curricular/instructional materials, especially the tests, that Nancy added for her students
to enact. These GCN tasks situated in the auxiliary curricular/instructional materials had
more complex diagrams and higher problem-solving requirements than those in the
textbook series. Among the three types of auxiliary curricular/instructional materials, the
GCN tasks in the supplemental materials had the lowest complexity in terms of the
diagram and problem-solving requirements.
Discussion
Developed Framework
This study demonstrates that the innovative framework consisting of (sub)
categories can capture specific relevant characteristics of GCN tasks with respect to
geometric diagrams and the cognitive work involving diagrams. No previous study has
undertaken this work (Fujita, Jones, & Kunimune, 2009; Haggarty & Pepin, 2002;

67
Valverde, Bianchi, Wolfe, Schmidt, & Houang, 2002). In particular, since the
construction of GP tasks involves geometric diagrams and the kinds of cognitive work
analyzed, the proposed framework can also be applied to examinations of GP.
Another contribution of the framework is that it allows investigators to
systematically and scientifically analyze the geometric tasks without the consideration of
students’ prior knowledge, which may influence the coding of mathematical tasks.
Numerous studies have proposed frameworks for classifying cognitive levels of
mathematical tasks (Doyle, 1983; Li, 2000; Stein, Smith, Henningsen, & Silver, 2000;
Valverde, Bianchi, Wolfe, Schmidt, & Houang, 2002), and have used these levels to
categorize the cognitive demand of mathematical tasks situated in curricular materials.
However, applying these frameworks based on levels to analyze mathematical tasks often
are limited in their ability to determine the cognitive demand of mathematical tasks
because of students’ prior knowledge and experiences. As Stein et al. (2000) pointed out
factors relevant to
“...deciding the level of challenge provided by a task is the students (their age, grade level, prior knowledge and experiences) and the norms and expectations for work in their classroom” (p. 17-18)
The proposed levels of cognitive demand of a task can be debated when
considerations are made with regard to students’ age, level, prior knowledge and
experiences. These considerations are important, but they may cause problems in coding
mathematical tasks in textbooks. For example, as Stein et al. (2000) suggest, tasks
involving a well-established procedure be categorized as procedures without connections.
However, in a textbook analysis, it is difficult to determine whether an established

68
procedure is targeted at a particular group of students as well as aimed at distinguishing
between a procedure without connection and procedure with connection. The difficulty
arises due to the challenges in examining the extent to which tasks drew connections to
the meaning of the underlying procedures or not (Charalambous, Delaney, Hsu, & Mesa,
2010). The framework proposed in this study can avoid this coding dilemma because the
basis for analyses is the geometric properties and diagrams in the textbooks which are not
related to students’ prior knowledge or previous learning experiences.
GCN Tasks in Curricular/Instructional Materials
Tasks play a very important role in mathematics learning because they can
structure the way students think about mathematics, direct students’ attention to a
particular perspective of mathematics, and specify ways to process the information
(Doyle, 1988; Henningsen & Stein, 1997; Silver, 2009). In line with this viewpoint, the
analyses in this study show that the tasks used in Nancy’s class not only helped students
to become familiar with certain geometric properties and numerical calculations, which
were possibly treated only as a minor instructional goal, but aimed to offer opportunities
to learn geometry specifically in the following areas: (1) visualizing the sub-constructs in
complex diagram configurations; (2) determining if auxiliary lines are necessary to solve
the tasks; (3) generating solutions that require multiple reasoning steps; (4) retrieving sets
of geometric properties needed to obtain solutions; and (5) transforming corresponding
reference diagrams to map them onto the GCN task diagrams. Because of these learning
opportunities the GCN tasks used in Nancy’s class are likely to play a particularly
important role in sharpening students’ geometry thinking and reasoning, especially in
relation to geometry proofs.
69
Of particular interest are the GCN tasks that Nancy added to her instruction to
supplement the tasks found in the textbook series. Though we do not know all of the
reasons for this teacher’s decision to supplement the textbook tasks as she did, there are
some plausible motivations that are worth noting. One reason is very likely related to the
examination culture in Taiwan (Lin & Tsao, 1999; Lin & Li, 2009). Nancy stated that the
goal of instruction is to help students obtain high grades on the high school entrance
examination. Given that she perceived the Taiwanese high school examinations as
requiring diverse problem-solving knowledge and skills beyond that likely to be acquired
only through the practice of the textbooks problems, it is reasonable to conclude that
Nancy decided to include auxiliary instructional materials containing highly demanding
GCN tasks as opportunities for her students to learn.
A closely related question is how the students in this classroom managed to learn
to solve the high demand GCN tasks. Though this study did not directly investigate this
issue, the findings of this study and a companion investigation (see Chapter Three of this
dissertation) point to three possible explanations. The first relates to Nancy’s instructional
skill in sustaining students’ intellectual work and in motivating the students to take on
intellectually demanding work, which will be discussed in Chapter Three. The second
explanation pertains to the use of the supplemental materials. Although the basis for
Nancy’s decision to include the supplemental materials as a major source of instructional
material was not directly investigated here, the findings requiring the cognitive demand
of the GCN tasks in the supplemental materials were that the cognitive demand fell
between the low-demand tasks that were abundant in the textbook and the very high-
demand tasks created by the teacher and those found on the tests. Thus, it seems

70
reasonable that the teacher would include the supplemental materials tasks because these
would scaffold students’ learning of how to solve the tasks she created and the highly
demanding tasks on the tests. The analysis of cognitive demand suggested that the
supplemental materials contained both low-level—providing students opportunities to
practice using geometric properties by solving simple and single-step tasks—and tasks of
higher cognitive demand that could help them become accustomed to the very
challenging tasks included on the classroom tests, as well as those they might be likely to
encounter on the high school entrance examination.
A third explanation may be related to the philosophy of “practice make perfect”
(Fwu & Wang, 2006), an ancient Chinese proverb, that sums up the rationale for asking
students to work on highly demanding tasks. This belief emphasizes that the more
students practice on high demanding tasks, the greater the possibility they will understand
the mathematics and solve challenging tasks themselves in the future. In line with this
belief is also the notion that students may not succeed in their initial attempts to solve
GCN tasks. Rather, through repeated practice on those demanding tasks, Nancy expected
her students to develop intuitions for finding solutions and understanding the
mathematics. This expectation is widely held among other Taiwan mathematics teachers
as well.
We cannot conclude from the findings of this study that solving highly demanding
tasks during classroom lessons will necessarily ensure that all students in Nancy’s class
learn mathematics well. Nevertheless, the findings of this study does suggest possible
ways that students’ mathematics proficiency might be leveraged through their
experiences in solving many cognitively demanding tasks, especially given evidence that

71
Chinese students can learn mathematics effectively by repeatedly working on
mathematical tasks (Zhu & Simon, 1987). Practice on well-arranged mathematical tasks,
according to Zhu and Simon, helps Chinese students internalize mathematics knowledge
and skills with understanding even though classroom teachers do not lecture or teach
these students. On the other hand, the findings of other research suggest that teaching
mathematics using many challenging tasks may not be effective for low-ability students
(e.g., Gal, Lin, & Ying, 2009). In fact, Gal et al. (2009) reported that low-achieving
students in Taiwan often could not participate in classroom discussions. Thus, those
students may have little chance to learn mathematics through an approach that requires
students to solve frequently high cognitive demand tasks.
While cross-national comparisons have consistently reported the outstanding
ability of East Asian students as demonstrated by their superb achievements in
mathematics, the curriculum, especially the curriculum embodied in textbook materials,
is treated as having a significant influence on learning and teaching (Charalambous,
Delaney, Hsu, & Mesa, 2010; Li, Chen, & An, 2009; Son & Senk, 2010; Stevenson &
Bartsch, 1992; Valverde, Bianchi, Wolfe, Schmidt, & Houang, 2002; Zhu & Fan, 2006).
However, in line with the Mathematical Tasks Framework (MTF), the argument
proposed is that relying on textbook analysis as predictor of students’ learning outcomes
may fail to identify the actual reasons for the differences in students’ performances in
cross-national comparisons. A reliance on textbook analyses alone is risky because it
ignores how teachers adopt the textbook and include auxiliary materials for their
instructional activities, especially in Asian countries where instruction is often strongly
influenced by an examination culture.
72
REFERENCES
Aleven, V., Koedinger, K. R., Sinclair, H. C., & Synder, J. (1998). Combatting shallow
learning in a tutor for geometry problem solving. Paper presented at the Intelligent tutoring systems: Fourth International Conference, ITS ’98, Berlin.
Altman, D. (1991). Practical statistics for medical research. Lodon: Chapman and Hall.
Ayres, P., & Sweller, J. (1990). Locus of difficulty in multistage mathematics problems. The American Journal of Psychology, 103(2), 167-193.
Ball, D., Hill, H., & Bass, H. (2005). Knowing mathematics for teaching: Who knows mathematics well enough to teach third grade, and how can we decide? American
Educator, 14-17 & 20-22 &43-46
Charalambous, C. Y., Delaney, S., Hsu, H.-Y., & Mesa, V. (2010). A comparative analysis of the addition and subtraction of fractions in textbooks from three countries. International Journal for Mathematical Thinking and Learning, 12(2), 117-151.
Chen, M. (2008). 8th-Grade Mathematics (Vol. 4). Tainan, Taiwan: Nan-I.
Cheng, Y.-H., & Lin, F.-L. (2007). The effectiveness and limitation of reading and coloring strategy in learning geometry proof. In J. H. Woo, H. C. Lew, K. S. Park, & D. Y. Seo (Eds.), Proceedings of the 31
st Conference of the International
Group for the Psychology of Mathematics Education (vol. 2, pp. 113-120). Seoul, Korea.
Cheng, Y.-H., & Lin, F.-L. (2008). A study on left behind students for enhancing their competence of geometry argumentation. In O. Figueras, J. L. Lortina, S. Alatorre, T. Rojano, & A. Sepulveda (Eds.), Proceedings of the Joint Meeting of 32
nd
Conference of the International Group for the Psychology of Mathematics
Education (PME) and PME-NA XXX (vol. 2, pp. 305-312). Morelia, Mexico.
Lawson, M., & Chinnapan, M. (2000). Knowledge connectedness in geometry problem solving. Journal for Research in Mathematics Education, 31 (1), 26-43.
Doyle, W. (1983). Academic work. Review of Educational Research, 53(2), 159-199.
Doyle, W. (1988). Work in mathematics classes: The context of students’ thinking during instruction. Educational Psychologist, 23(2), 167-180.
Duval, R. (1995). Geometrical pictures: Kinds of representation and specific processings. In R. Sutherland & J. Mason (Eds.), Exploiting mental imagery with computers in
mathematics education (pp. 142-157). Berlin: Springer.
Duval, R. (1998). Geometry from cognitive point of view. In C. Mammana & V. Villani (Eds.), Perspectives on the teaching of geometry for 21
st century (pp. 37-52).
Dordrecht: Kluwer.
Fischbein, E. (1993). The theory of figural concepts. Educational Studies in Mathematics, 24(2), 139-162.
Fischbein, E., & Nachlieli, T. (1998). Concepts and figures in geometrical reasoning.

73
Instructional Journal of Science Education, 20(10), 1193-1211.
Fujita, T., Jones, K., & Kunimune, S. (2009). The design of textbooks and their influence on students’ understanding of ‘proof’ in lower secondary school. In F.-L. Lin, F.-J. Hsieh, G. Hanna, & M. de Villiers (Eds.), Proceedings of the ICMI Study 19
Conference: Proof and Proving in Mathematics Education (vol. 2, pp. 172-177). Taipei, Taiwan.
Fujita, T., Jones, K., & Yamamoto, S. (2004). Geometrical intuition and the learning and
teaching of geometry. Paper presented at the ICMI 10, Denmark.
Fwu, B.-J., & Wang, H.-H. (2006). Practice makes perfect on the blackboard: A cultural analysis of mathematics instructional patterns in Taiwan. ZDM-The International
Journal on Mathematics Education, 38(5), 368-375.
Gal, H., Lin, F.-L., & Ying, J.-M. (2009). Listen to the silence: The left-behind phenomenon through the lens of problematic learning situations. International
Journal of Science and Mathematics Education, 7, 405-429.
Gal, H., & Linchevski, L. (2010). To see or not to see: Analyzing difficulties in geometry from the perspective of visual perception. Educational Studies in Mathematics, 74, 163-183.
Haggarty, L., & Pepin, B. (2002). An investigation of mathematics textbooks and their use in English, French and German classrooms: Who gets an opportunity to learn what? British Educational Research Journal, 28(4), 567-590.
Harel, G., & Sowder, L. (1998). Students’ proof schemes: Results from exploratory studies. CBMS Issues in Mathematics Education, 7, 234-283.
Healy, L., & Hoyles, C. (1998). Justifying and proving in school mathematics. London: Institute of Education.
Heinze, A., Cheng, Y.-H., & Yang, K.-L. (2004). Students’ performance in reasoning and proof in Taiwan and German: Results, paradoxes and open questions. ZDM-The
International Journal on Mathematics Education, 36(5), 162-171.
Heinze, A., Reiss, K., & Rudolph, F. (2005). Mathematics achievement and interest in mathematics from a differential perspective. ZDM-The International Journal on
Mathematics Education, 37(3), 212-220.
Henningsen, M., & Stein, M. K. (1997). Mathematical tasks and student cognition: Classroom-based factors that support and inhibit high-level mathematical thinking and reasoning. Journal for Research in Mathematics Education, 28(5), 524-549.
Herbel-Eisenmann, B. A., Lubienski, S. T., & Id-Deen, L. (2006). Reconsidering the study of mathematics instructional practices: The importance of curricular context in understanding local and global teacher change. Journal of Mathematics
Teacher Education, 9, 313-345.
Herbst, P. (2004). Interactions with diagrams and the making of reasoned conjectures in geometry. ZDM-The International Journal on Mathematics Education, 36(5), 129-139.

74
Hsu, H.-Y. (2007). Geometric calculations are more than calculations. In J. H. Woo, H. C. Lew, K. S. Park, & D. Y. Seo (Eds.), Proceedings of the 31
st Conference of the
International Group for the Psychology of Mathematics Education (vol. 3, pp. 57-64). Seoul, Korea.
Kidder, F. R. (1976). Elementary and middle school children’s comprehension of Euclidean transformations. Journal for Research in Mathematics Education, 7(1), 40-52.
Koedinger, K., & Anderson, J. (1990). Abstract planning and perceptual chunks: Elements of expertise in geometry. Cognitive Science, 14, 511-550.
Kuchemann, D., & Hoyles, C. (2002). The quality of students’ reasons for the steps in a geometric calculations. Proceedings of the British Society for Research into
learning Mathematics, 22(2), 43-48.
Laborde, C. (2005). The hidden role of diagrams in students’ construction of meaning in geometry. In J. Kilpatrick, C. Hoyles, O. Skovsmose & P. Valero (Eds.), Meaning
in mathematics education (vol. 37, pp. 157-179). New York: Springer.
Lang, B., & Ruane, P. (1981). Geometry in English secondary schools. Educational
Studies in Mathematics, 12(1), 123-132.
Larkin, J., & Simon, H. (1987). Why a diagram is (sometimes) worth ten thousand words. Cognitive Science, 11, 65-99.
Li, Y. (2000). A comparison of problems that follow selected content presentation in American and Chinese mathematics textbooks. Journal for Research in
Mathematics Education, 31(2), 234-241.
Li, Y., & Chen, X., & An, S. (2009). Conceptualizing and organizing content for teaching and learning in selected Chinese, Japanese and US mathematics textbooks: The case of fraction division. ZDM-The International Journal on Mathematics
Education, 41, 809-826.
Lin, F.-L., & Tsao, L.-C. (1999). Exam math re-examined. In C. Hoyles, C. Morgan & G. Woodhouse (Eds.), Rethinking mathematics curriculum (pp. 228-239). London: Falmer Press.
Lin, P.-J., & Li, Y. (2009). Searching for good mathematics instruction at primary school level valued in Taiwan. ZDM-The International Journal on Mathematics
Education, 41, 363-378.
Lovett, M., & Anderson, J. (1994). Effects of solving related proofs on memory and transfer in geometry problem solving. Journal of Experimental Psychology:
Learning, Memory, and Cognition, 20(2), 366-378.
Ma, L. (1999). Knowing and teaching elementary mathematics. New Jersey: Lawrence Erlbaum.
Michener, E. (1978). Understanding understanding mathematics. Cognitive Science, 2, 361-383.
Ministry of Education. (2003). Grades 1-9 curriculum guidelines. Taipei, Taiwan: Author.

75
Mousavi, S., Low, R., & Sweller, J. (1995). Reducing cognitive load by mixing auditory and visual presentation modes. Journal for Educational Psychology, 87(2), 319-334.
Mullis, I., Martin, M. & Foy, P. (2008). TIMSS 2007 international mathematics report. Chestnut Hill: TIMSS & PIRLS International Study Center.
Mullis, I., Martin, M., Gonzalez, E., & Chrostowski, S. (2004). TIMSS 2003 international
mathematics report. Chestnut Hill: TIMSS & PIRLS International Study Center.
Piaget, J., & Inhelder, B. (1967). The child’s conception of space. New York: the Norton Library.
Polya, G. (1945). How to solve it. New Jersey: Princeton University Press.
Renkl, A. (2002). Worked-out examples: Instructional explanations support learning by self-explanations. Learning and Instruction, 12, 529-556.
Schmidt, W., McKnight, C., Valverde, G., Houang, R., & Wiley, D. (1996). Many visions,
many aims: A cross-national investigation of curricular intensions in school
mathematics (vol. 1). Dordrecht: Kluwer.
Schumann, H., & Green, D. (2000). New protocols for solving geometric calculation problems incorporating dynamic geometry and computer algebra software. International Journal of Mathematical Education in Science and Technology, 31(3), 319-339.
Silver, E. (2009). Cross-national comparisons of mathematics curriculum materials: What might we learn? ZDM-The International Journal on Mathematics Education, 41, 827-832.
Son, J.-W., & Senk, S. (2010). How reform curricula in the USA and Korea present multiplication and division of fractions. Educational Studies in Mathematics, 72(4), 117-142.
Stein, M., Grover, B., & Henningsen, M. (1996). Building student capacity for mathematical thinking and reasoning: An analysis of mathematical tasks used in reform classrooms. American Educational Research Journal, 33, 455-488.
Stein, M., & Smith, M. (1998). Mathematical tasks as a framework for reflection: From research to practice. Mathematics Teaching in the Middle School, 3, 268-275.
Stein, M., Smith, M., Henningsen, M., & Silver, E. (2000). Implementing standards-
based mathematics instruction: A casebook for professional development. New York, NY: Teachers College Press.
Stevenson, H., & Bartsch, K. (1992). An analysis of Japanese and American textbooks in
mathematics. Ann Arbor: Center for Japanese Studies, University of Michigan.
Stigler, J., Fuson, K., Ham, M., & Kim, M. (1986). An analysis of addition and subtraction word problems in American and Soviet elementary mathematics textbook. Cognition and Instruction, 3(3), 153-171.
Strauss, A., & Corbin, J. (1998). Basics of qualitative research: Techniques and
procedures for developing grounded theory. Thousand Oaks, California: SAGE

76
Publications.
Tornroos, J. (2005). Mathematics textbooks, opportunity to learn and student achievement. Studies in Educational Evaluation, 31, 315-327.
Ufer, S., & Heinze, A. (2008). Development of geometric proof competence from grade 7
to 9: A longitudinal study. Paper presented at the ICMI 11. Mexico.
Valverde, G., Bianchi, L., Wolfe, R., Schmidt, W., & Houang, R. (2002). According to
the Book: Using TIMSS to investigate the translation of policy into practice
through the world of textbooks. Dordrecht: Kluwer.
Williford, H. J. (1972). A study of transformational geometry instruction in the primary grades. Journal for Research in Mathematics Education, 3(4), 260-271.
Yerushalmy, M., & Chazan, D. (1990). Overcoming visual obstacles with the aid of the Supposer. Educational Studies in Mathematics, 21, 199-219.
Zhu, X., & Simon, H. A. (1987). Learning mathematics from examples and by doing. Cognition and Instruction, 4(3), 137-166.
Zhu, Y., & Fan, L. (2006). Focus on the representation of problem types in intended curriculum: A comparison of selected mathematics textbooks from mainland China and The United States. International Journal of Science and Mathematics
Education, 4, 609-626.
Zykova, V. I. (1975). Operating with concepts when solving geometry problems. In J. Kilpatrick & I. Wirszup (Eds.), The learning of mathematical concepts (Vol. 1, pp. 93-148). Chicago: University of Chicago.
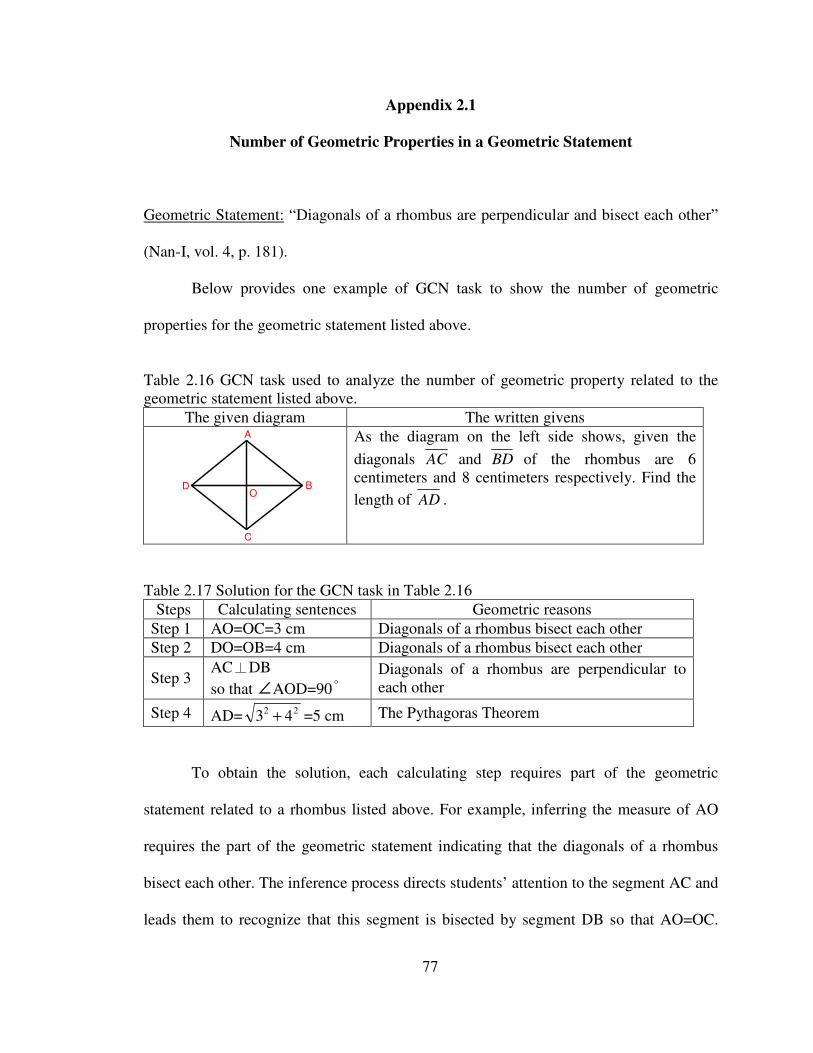
77
Appendix 2.1
Number of Geometric Properties in a Geometric Statement
Geometric Statement: “Diagonals of a rhombus are perpendicular and bisect each other”
(Nan-I, vol. 4, p. 181).
Below provides one example of GCN task to show the number of geometric
properties for the geometric statement listed above.
Table 2.16 GCN task used to analyze the number of geometric property related to the geometric statement listed above.
The given diagram The written givens A
C
DO
B
As the diagram on the left side shows, given the
diagonals AC and BD of the rhombus are 6 centimeters and 8 centimeters respectively. Find the
length of AD .
Table 2.17 Solution for the GCN task in Table 2.16 Steps Calculating sentences Geometric reasons
Step 1 AO=OC=3 cm Diagonals of a rhombus bisect each other Step 2 DO=OB=4 cm Diagonals of a rhombus bisect each other
Step 3 AC⊥DB so that ∠AOD=90˚
Diagonals of a rhombus are perpendicular to each other
Step 4 AD= 22 43 + =5 cm The Pythagoras Theorem
To obtain the solution, each calculating step requires part of the geometric
statement related to a rhombus listed above. For example, inferring the measure of AO
requires the part of the geometric statement indicating that the diagonals of a rhombus
bisect each other. The inference process directs students’ attention to the segment AC and
leads them to recognize that this segment is bisected by segment DB so that AO=OC.

78
This process is a problem-action involving a specific location of the diagram (segment
AC). Similarly, students have to apply the same geometric property to infer another
segment DO=OB, which is treated as another reasoning step because inferring segment
DO=OB involves visualizing segment DB, which is a different location in the diagram. In
addition, since the givens of the GCN task indicate only that AC and DB are diagonals,
the task requires students to infer that these two diagonals are perpendicular. As a result,
the geometric statement related to a rhombus involves three geometric properties that can
be applied to set up different calculating sentences.

79
Appendix 2.2
List of Sub-Constructs Embedded in the GCN Task Diagram
Table 2.18 demonstrates the sub-constructs labeled by thick bold lines with
corresponding geometric properties embedded in the GCN task diagram in Table 2.1.
Table 2.18 Sub-constructs with corresponding geometric properties embedded
Triangle (1) Triangle (2) Triangle (3) Triangle (4)
Triangle (5) The alternate interior angles
property
The corresponding angles property (1)
The corresponding angles property (2)
The exterior angle
property (1) The exterior angle
property (2) The consecutive interior angles property (1)
The consecutive interior angles
property(2)
Property of angle bisector (1)
Property of angle bisector (2)
Quadrilateral Property of linear pair (1)
Property of linear
pair (2)

80
Appendix 2.3
Four Types of Curricular/Instructional Materials Collected from Nancy’s Class
Four different types of curricular/instructional materials were collected during
Nancy’s teaching of this geometry chapter. The first type is the textbook series18 which
includes the student textbook and the student workbook (Chen, 2008). The student
textbook contains both instructional blocks that comprise of diverse mathematical
activities (e.g., paper folding activity, diagram construction, proving, and measuring) and
exercise blocks. The student workbook encloses only exercises for students to practice. A
total of 55 pages in the student textbook and 14 pages in the student workbook associated
with this geometry chapter were analyzed in this study.
The second type of instructional material is the supplemental materials.
Supplemental materials used in Nancy’s classroom contain not only the sequence of
mathematical topics but also the content and exercises for students to practice. Although
every student in Nancy’s class had the textbook series, she rarely used the mathematical
tasks in the textbook series for her instruction. Alternatively, she taught from the
supplemental materials which were written by her school mathematics teachers as the
major instructional materials. She taught some of tasks in the supplemental materials and
asked her students to practice others. Sometimes, she also assigned a portion of the
exercise tasks in the supplemental materials as student homework. The supplemental
materials were available to all mathematics teachers and all 8th grade students in the
18 The teacher guide book was excluded because it is to be used by class teachers and could not be accessed by class students.

81
school, but the mathematics teachers had the right to decide whether or not they wanted
to use it in their instruction.
The supplemental materials written for this geometry chapter contain 18 dense
pages, each of which covers either many geometric properties and definitions or many
geometric tasks. For example, one of pages in supplemental materials associated with the
second unit of this chapter consists of 31 tasks. To understand more of the supplemental
materials, several characteristics of the supplemental materials need to be highlighted.
First of all, the supplemental materials designed for this chapter are divided into the same
number of units as those listed in the textbooks. Each unit in the supplemental materials
presents several topics, focusing on the main geometry content (e.g., the properties
related to rectangles) that should be learned in this unit. Secondly, only few of the
geometric tasks used in the supplemental materials are exactly the same as those designed
in the textbook series. Most of the geometric tasks in supplemental materials differ from
the textbook series in terms of geometric diagrams and the description of the task settings.
Thirdly, at the beginning of each geometric topic, the supplemental materials
summarize the definitions and geometric properties relevant to the topic that students
have learned previously or will learn in the unit. After the summary sections, the
supplemental materials include diverse geometric tasks for students to practice and
sequence those tasks from low to high cognitive demand. For example, in the first unit of
the chapter under study here, after a one-page summary of the geometric content, the
supplemental materials present a very high percentage of one-step tasks (74%) in the first
two pages. These tasks can be solved using a single geometry property. After these one-
step tasks, the supplemental materials include tasks that require multiple reasoning steps
82
to obtain solutions. Finally, the supplemental materials contain worked examples, but
those examples are not fully worked out and do not provide solutions for students.
In addition to using the supplemental materials as a major source of instructional
material, Nancy also used geometric tasks that she created herself. She posed those
geometric tasks when she thought they were highly relevant to the class content. Twenty-
five such tasks were created by Nancy during the instruction of the geometry chapter.
Another main type of curricular/instructional material collected from Nancy’s
class was the tests that were used for formative or summative purposes. Some of the tests
were assigned as student homework and some were used on a weekly basis to evaluate
students’ learning of newly introduced geometry content. The remaining tests were
employed as summative evaluations to check if students understood the mathematical
content in the chapter and were able to connect the learned content with relevant
mathematical topics. Usually, Nancy discussed the test tasks in classes to address the
difficulties students had in solving them. A total of eighteen tests were administrated to
students during the instruction of the chapter under study.
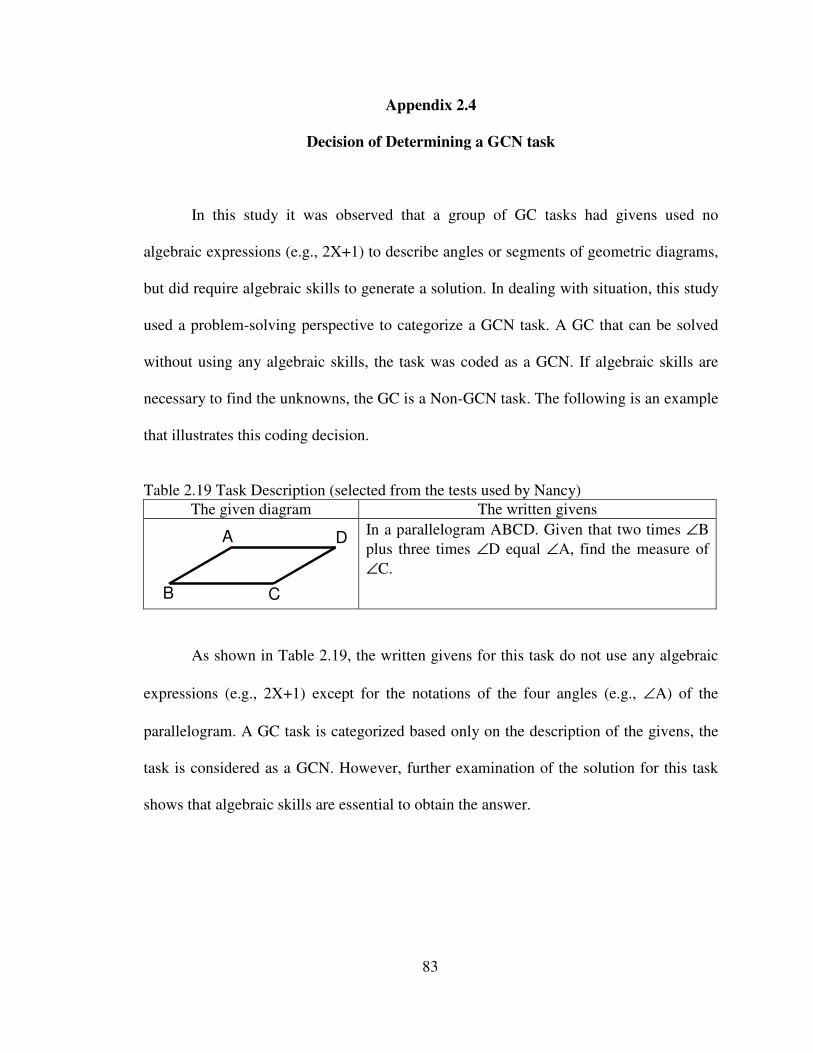
83
Appendix 2.4
Decision of Determining a GCN task
In this study it was observed that a group of GC tasks had givens used no
algebraic expressions (e.g., 2X+1) to describe angles or segments of geometric diagrams,
but did require algebraic skills to generate a solution. In dealing with situation, this study
used a problem-solving perspective to categorize a GCN task. A GC that can be solved
without using any algebraic skills, the task was coded as a GCN. If algebraic skills are
necessary to find the unknowns, the GC is a Non-GCN task. The following is an example
that illustrates this coding decision.
Table 2.19 Task Description (selected from the tests used by Nancy)
The given diagram The written givens
DA
B C
In a parallelogram ABCD. Given that two times ∠B plus three times ∠D equal ∠A, find the measure of ∠C.
As shown in Table 2.19, the written givens for this task do not use any algebraic
expressions (e.g., 2X+1) except for the notations of the four angles (e.g., ∠A) of the
parallelogram. A GC task is categorized based only on the description of the givens, the
task is considered as a GCN. However, further examination of the solution for this task
shows that algebraic skills are essential to obtain the answer.

84
Table 2.20 A solution for the GC task in Table 2.19 Steps Calculating sentences Geometric reasons Step One ∠B=∠D
So that ∠A=5∠B Opposite angles of a parallelogram are congruent
Step Two AD//BC19 Opposite sides of a parallelogram are parallel
Step Three ∠A+∠B=180˚ The consecutive interior angles property
Equation 1: ∠A=5∠B
Equation 2: ∠A+∠B=180˚
Answer: ∠A=150˚; ∠B=30˚
Step Four ∠C=∠A=150˚ Opposite angles of a parallelogram are congruent
As Table 2.20 shows, solving the task requires four reasoning steps, which are set
up based on the corresponding geometric properties. In particular, before obtaining the
measures of ∠A and ∠B, students have to solve two equations, ∠A=5∠B and
∠A+∠B=180˚ between the third step and the fourth step. Solving these two equations
requires the application of algebraic skills, and, thus, this task should be coded as a non-
GCN task.
This example shows that using the information on the givens alone is not a
reliable way to determine whether or not a GC task is a GCN. This is because solving a
geometric task may require of algebraic work, even though the givens do not use
algebraic expressions (e.g., 2X+1). Equally, it is also possible the givens in a GC task use
algebraic expressions, but the solution does not necessitate the application of algebraic
skills to find the solution.
19 Here, the geometric properties used to support calculating sentences were determined on the basis of those geometric properties listed and introduced in the Nan-I textbooks analyzed. Because Nan-I textbook series do not include the geometric statement that the consecutive interior angles of a parallelogram are supplementary, it suggests students to reason this property themselves when solving or proving geometric tasks.

85
Appendix 2.5
An Example of GCN Task Requiring the Drawing of Auxiliary Line
Table 2.21 Description of the GCN task selected from the tests The given diagram The written givens
B C
A D
16 86 10
As shown in the diagram, in a quadrilateral ABCD given that AD//BC and the length measures for AD=10, BC=16, AB=6, CD=8, and measure of ∠DCB=48˚, find the measure of ∠BAD=_________.
The drawing of auxiliary line and its solution
B C
A D
16 86 10O
Figure 2.6 The drawing of auxiliary line AO on the given diagram
The GCN task in Table 2.21 cannot be solved unless an auxiliary line is added to
the given diagram. In order to obtain solutions that involve the fewest reasoning steps, it
is possible to construct the auxiliary line by creating an AO segment such that OC=10
and BO=6. The segment construction in turn creates new sub-constructs and new
geometric properties that can be used to generate the solution, as shown in Table 2.22.
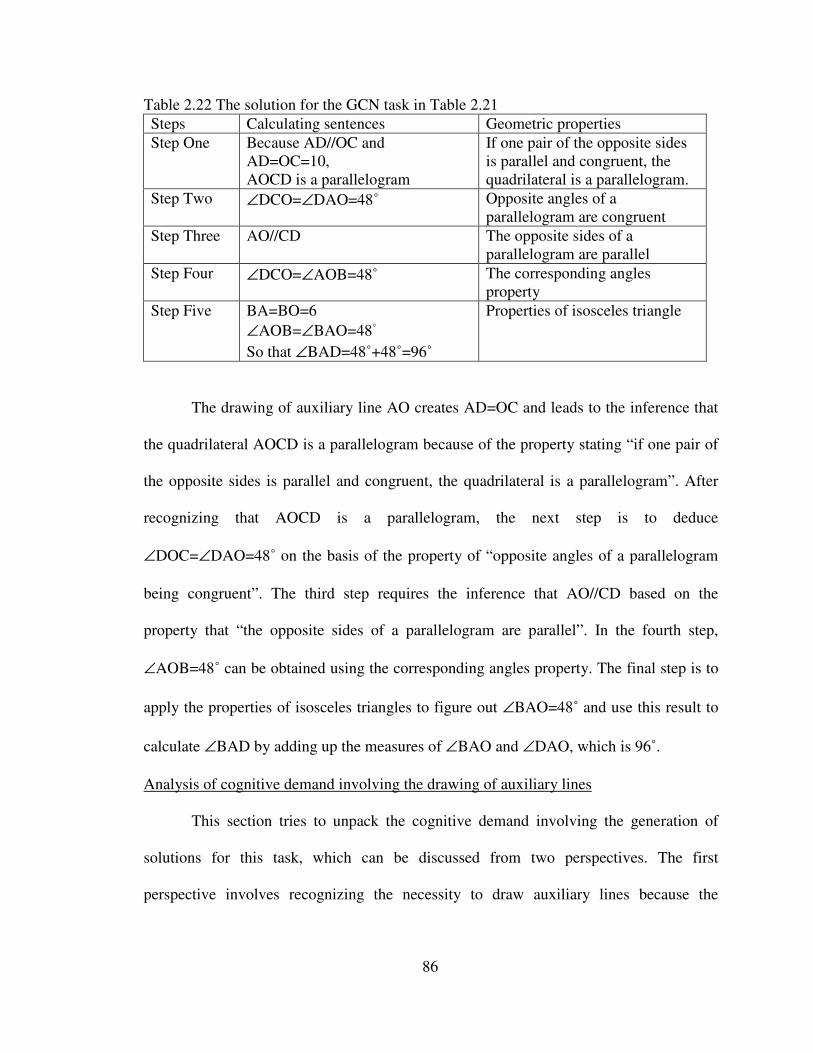
86
Table 2.22 The solution for the GCN task in Table 2.21 Steps Calculating sentences Geometric properties Step One Because AD//OC and
AD=OC=10, AOCD is a parallelogram
If one pair of the opposite sides is parallel and congruent, the quadrilateral is a parallelogram.
Step Two ∠DCO=∠DAO=48˚ Opposite angles of a parallelogram are congruent
Step Three AO//CD The opposite sides of a parallelogram are parallel
Step Four ∠DCO=∠AOB=48˚ The corresponding angles property
Step Five BA=BO=6 ∠AOB=∠BAO=48˚ So that ∠BAD=48˚+48˚=96˚
Properties of isosceles triangle
The drawing of auxiliary line AO creates AD=OC and leads to the inference that
the quadrilateral AOCD is a parallelogram because of the property stating “if one pair of
the opposite sides is parallel and congruent, the quadrilateral is a parallelogram”. After
recognizing that AOCD is a parallelogram, the next step is to deduce
∠DOC=∠DAO=48˚ on the basis of the property of “opposite angles of a parallelogram
being congruent”. The third step requires the inference that AO//CD based on the
property that “the opposite sides of a parallelogram are parallel”. In the fourth step,
∠AOB=48˚ can be obtained using the corresponding angles property. The final step is to
apply the properties of isosceles triangles to figure out ∠BAO=48˚ and use this result to
calculate ∠BAD by adding up the measures of ∠BAO and ∠DAO, which is 96˚.
Analysis of cognitive demand involving the drawing of auxiliary lines
This section tries to unpack the cognitive demand involving the generation of
solutions for this task, which can be discussed from two perspectives. The first
perspective involves recognizing the necessity to draw auxiliary lines because the

87
geometric properties embedded in the diagram and properties in the given are not
sufficient to generate a solution. Accordingly, these embedded geometric properties that
can be inferred from the givens and the diagram include the identification of ABCD as a
trapezoid and its relevant geometric properties (e.g., area formula for a trapezoid,
property of trapezoid median) on the basis of the given AD//BC. The given parallel lines
AD//BC also can be used to deduce that ∠DAB+∠ABC=180˚ and ∠ADC+∠DCB=180˚
using the consecutive interior angles property. Another geometric property that can be
retrieved is the angle sum of a quadrilateral. In addition, the measures of the four sides of
the trapezoid ABCD in the written givens also inform students that the trapezoid is not
special (e.g., isosceles trapezoid); thus geometric properties specific to special trapezoids
cannot be applied to obtain a solution in this task (e.g., base angles of an isosceles
triangle are congruent).
In the application of those embedded geometric properties to generate a solution,
the cognitive demand comes from recognizing the reasoning gap between the unknown
and the givens that cannot be bridged by these identified geometric properties. As the
given measure of ∠DCB=48˚ is located in the opposite angle to the unknown ∠BAD in
the trapezoid, the search is initiated for any geometric property that can be directly
applied to bridge between the given ∠DCB and the unknown ∠BAD to obtain a solution.
However, no geometric property is available to support this bridging action because the
trapezoid is not special. As a result, the task creates the demand to infer the sides or
angles adjacent to the given ∠DCB or the unknown ∠BAD. One strategy is to start the
reasoning from ∠DCB=48˚ and obtain the measure for the adjacent angle of ∠ADC,
which is 132˚ according to the consecutive interior angles property. After ∠ADC is
88
inferred, the next step is to try to bridge between ∠ADC=132˚ and the unknown ∠BAD
by searching for any geometric property that can support this inference. However, this
strategy does not work because no existing geometric property in the diagram can be used
for this bridging action. An alternative strategy is to reason backward from the unknown
to the given. Here, the first step is to deduce ∠DAB+∠ABC=180˚ based on the
consecutive interior angles property. The second step is to establish the relationship
between ∠ABC and the given ∠DCB=48˚. Nevertheless, similar to the first strategy, the
second strategy does not work because of the same difficulty encountered by the first
strategy. As a result, the task requires students to recognize the reasoning gap between
the givens and the unknown and see the need to construct auxiliary lines to create new
sub-constructs and geometric properties that can help them generate a solution.
The second perspective regarding the cognitive demand involved with solving this
GCN task is to determine where to draw needed auxiliary line on the diagram, which is
the most difficult part of this task. This task requires reasoning what geometric properties
can possibly be created by adding auxiliary line and how the created geometric properties
can contribute to the generation of a solution. In particular, to solve this GCN task
students have to observe the relationship among the measures of the trapezoid sides,
AD+AB=BC (10+6=16), which leads to the problem-solving strategy of dividing the
segment BC=16 into BO=6 and OC=10 (see Figure 2.6). The divided segments BO and
OC in turn reveal the possible places where the auxiliary line can be drawn on the given
diagram. As shown in Figure 2.6, an auxiliary line is constructed by connecting vertex A
to the point O on segment BC so that a solution requiring the fewest number of reasoning
steps can be generated.

89
Analysis of minimum number of solution steps, minimum number of geometric
properties, and number of diagram transformation required
As shown in Table 2.22, the minimum number of solution steps required for this
GCN task is five and the number of required geometric properties is also five. Regarding
the transformations, Table 2.23 provides the reference diagrams corresponding to the
geometric properties necessary to obtain the solution listed Table 2.21. The identification
of individual reference diagrams forms the basis for analyzing what transformation
actions are required to map the reference diagrams onto the GCN task diagram, which is
described in Table 2.24.
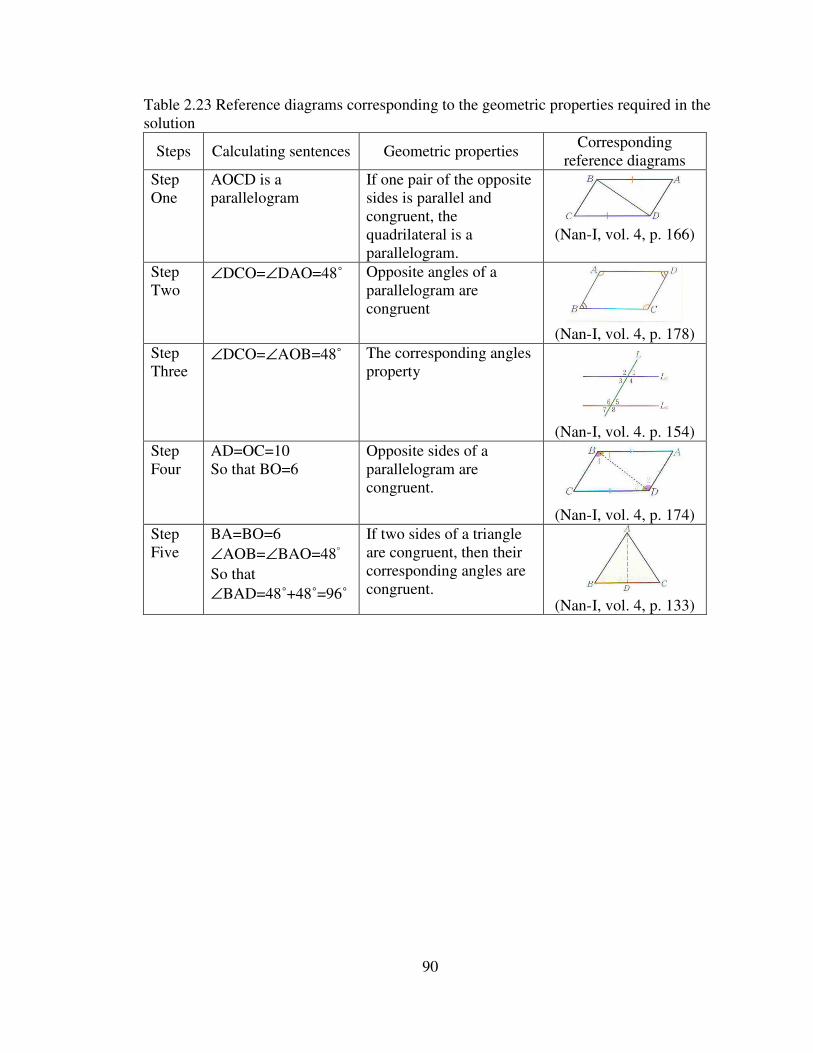
90
Table 2.23 Reference diagrams corresponding to the geometric properties required in the solution
Steps Calculating sentences Geometric properties Corresponding
reference diagrams Step One
AOCD is a parallelogram
If one pair of the opposite sides is parallel and congruent, the quadrilateral is a parallelogram.
(Nan-I, vol. 4, p. 166)
Step Two
∠DCO=∠DAO=48˚ Opposite angles of a parallelogram are congruent
(Nan-I, vol. 4, p. 178)
Step Three
∠DCO=∠AOB=48˚ The corresponding angles property
(Nan-I, vol. 4. p. 154)
Step Four
AD=OC=10 So that BO=6
Opposite sides of a parallelogram are congruent.
(Nan-I, vol. 4, p. 174)
Step Five
BA=BO=6 ∠AOB=∠BAO=48˚ So that ∠BAD=48˚+48˚=96˚
If two sides of a triangle are congruent, then their corresponding angles are congruent.
(Nan-I, vol. 4, p. 133)
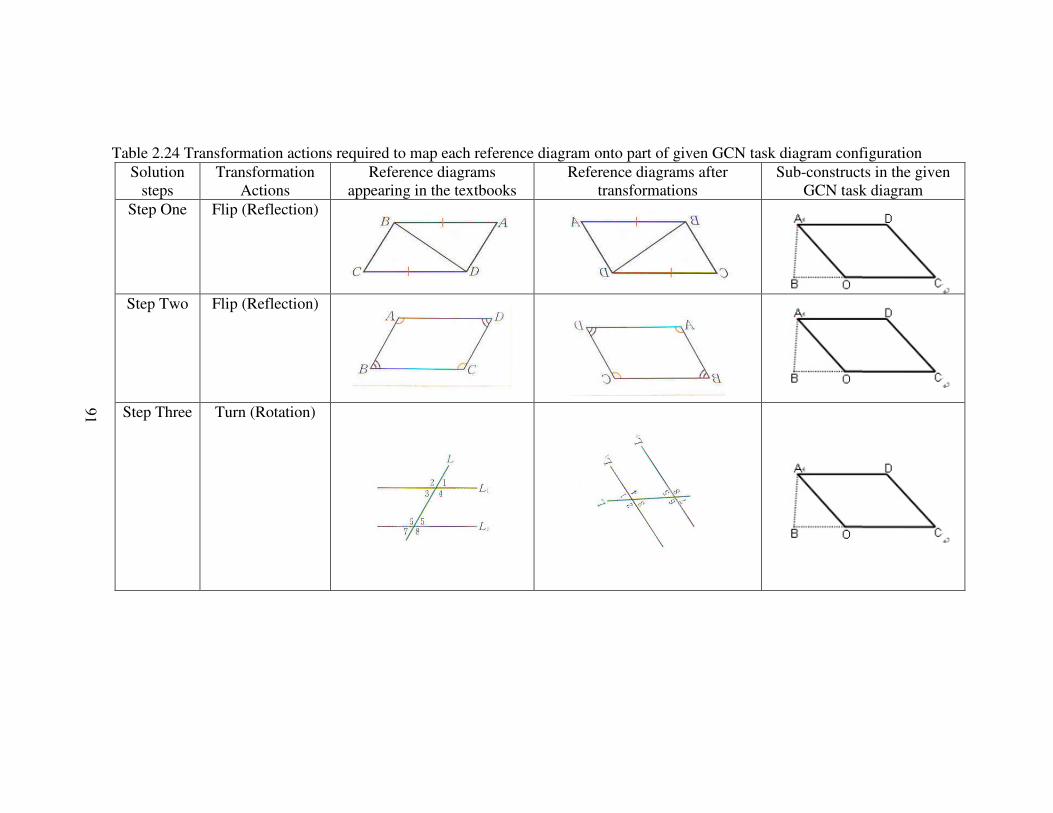
91
Table 2.24 Transformation actions required to map each reference diagram onto part of given GCN task diagram configuration Solution
steps Transformation
Actions Reference diagrams
appearing in the textbooks Reference diagrams after
transformations Sub-constructs in the given
GCN task diagram Step One Flip (Reflection)
Step Two Flip (Reflection)
Step Three Turn (Rotation)
91

92
Solution steps
Transformation Actions
Reference diagrams appearing in the textbooks
Reference diagrams after transformations
Sub-constructs in the given GCN task diagram
Step Four Flip (Reflection)
Step Five Turn (Rotation)
92

93
As shown in Table 2.24, a total five transformation actions were required in order
to map the corresponding reference diagrams onto the sub-constructs of the GCN task
diagram. For step one, step two, and step four, flipping actions (reflection) were needed.
For step three and step five, turning actions (rotation) are needed to move the reference
diagrams to the same orientations as they appear in the sub-constructs of the GCN task
diagram.
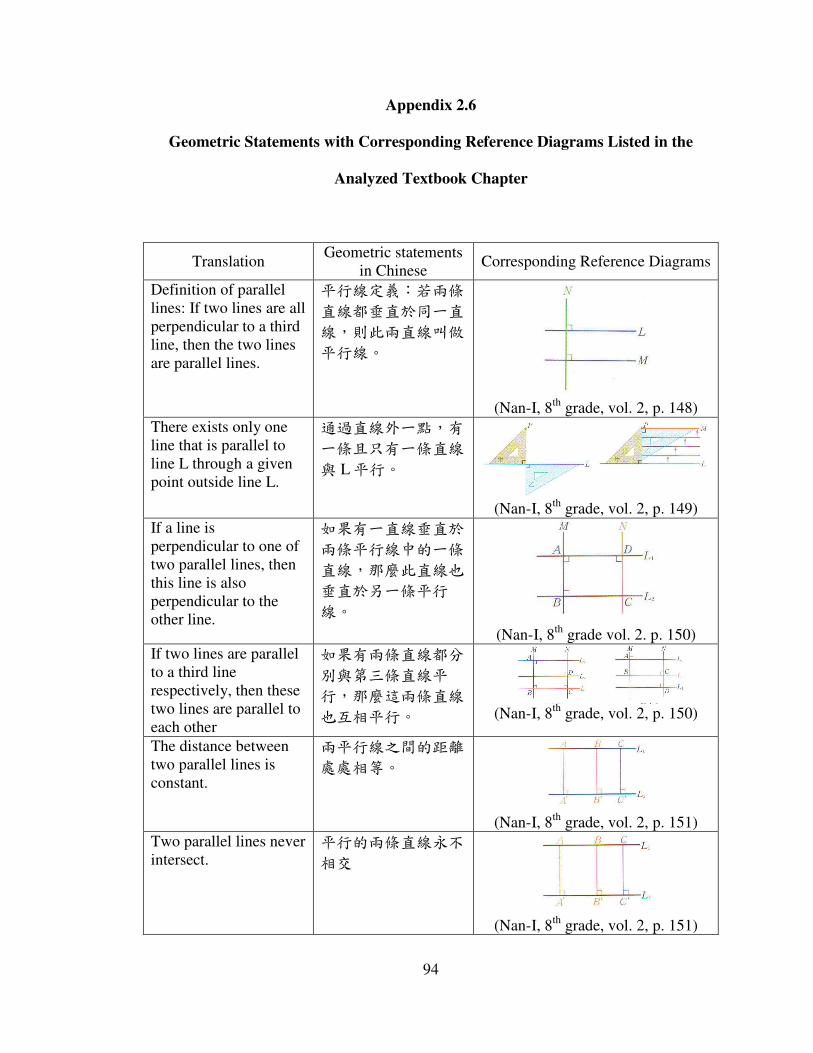
94
Appendix 2.6
Geometric Statements with Corresponding Reference Diagrams Listed in the
Analyzed Textbook Chapter
Translation Geometric statements
in Chinese Corresponding Reference Diagrams
Definition of parallel lines: If two lines are all perpendicular to a third line, then the two lines are parallel lines.
平行線定義:若兩條
直線都垂直於同一直
線,則此兩直線叫做
平行線。
(Nan-I, 8th grade, vol. 2, p. 148)
There exists only one line that is parallel to line L through a given point outside line L.
通過直線外一點,有
一條且只有一條直線
與 L平行。
(Nan-I, 8th grade, vol. 2, p. 149) If a line is perpendicular to one of two parallel lines, then this line is also perpendicular to the other line.
如果有一直線垂直於
兩條平行線中的一條
直線,那麼此直線也
垂直於另一條平行
線。 (Nan-I, 8th grade vol. 2. p. 150)
If two lines are parallel to a third line respectively, then these two lines are parallel to each other
如果有兩條直線都分
別與第三條直線平
行,那麼這兩條直線
也互相平行。
(Nan-I, 8th grade, vol. 2, p. 150)
The distance between two parallel lines is constant.
兩平行線之間的距離
處處相等。
(Nan-I, 8th grade, vol. 2, p. 151)
Two parallel lines never intersect.
平行的兩條直線永不
相交
(Nan-I, 8th grade, vol. 2, p. 151)
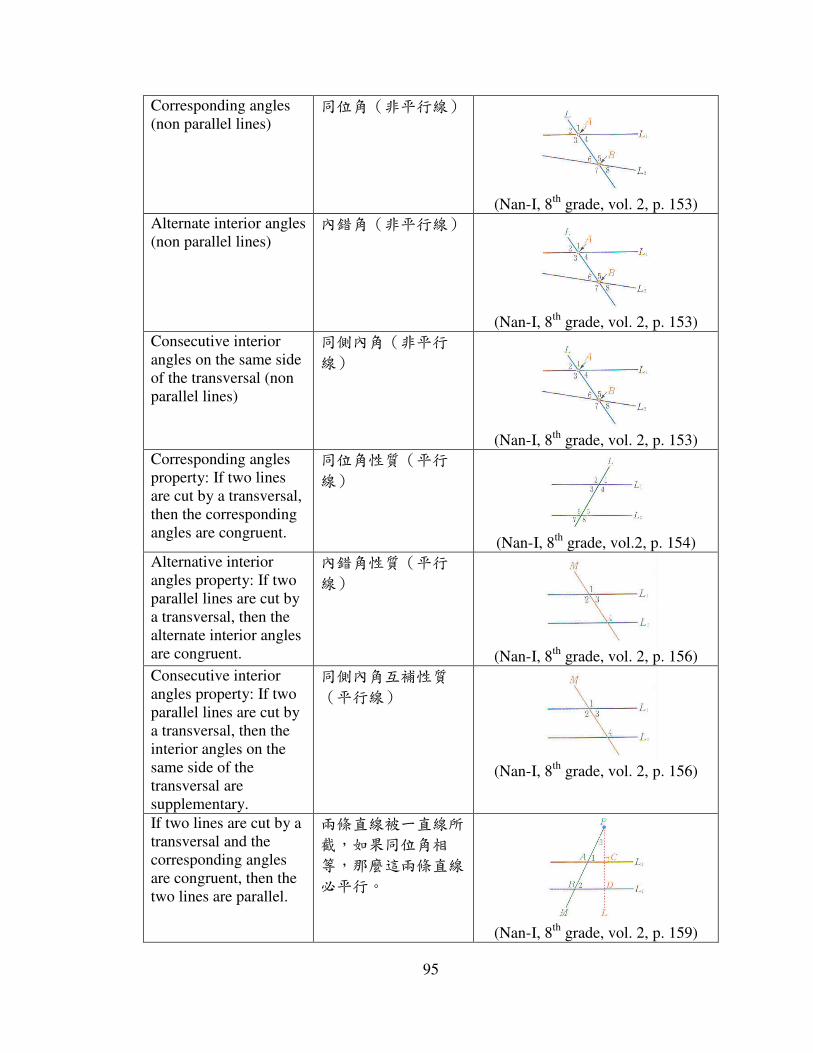
95
Corresponding angles (non parallel lines)
同位角(非平行線)
(Nan-I, 8th grade, vol. 2, p. 153)
Alternate interior angles (non parallel lines)
內錯角(非平行線)
(Nan-I, 8th grade, vol. 2, p. 153)
Consecutive interior angles on the same side of the transversal (non parallel lines)
同側內角(非平行
線)
(Nan-I, 8th grade, vol. 2, p. 153)
Corresponding angles property: If two lines are cut by a transversal, then the corresponding angles are congruent.
同位角性質(平行
線)
(Nan-I, 8th grade, vol.2, p. 154)
Alternative interior angles property: If two parallel lines are cut by a transversal, then the alternate interior angles are congruent.
內錯角性質(平行
線)
(Nan-I, 8th grade, vol. 2, p. 156)
Consecutive interior angles property: If two parallel lines are cut by a transversal, then the interior angles on the same side of the transversal are supplementary.
同側內角互補性質
(平行線)
(Nan-I, 8th grade, vol. 2, p. 156)
If two lines are cut by a transversal and the corresponding angles are congruent, then the two lines are parallel.
兩條直線被一直線所
截,如果同位角相
等,那麼這兩條直線
必平行。
(Nan-I, 8th grade, vol. 2, p. 159)
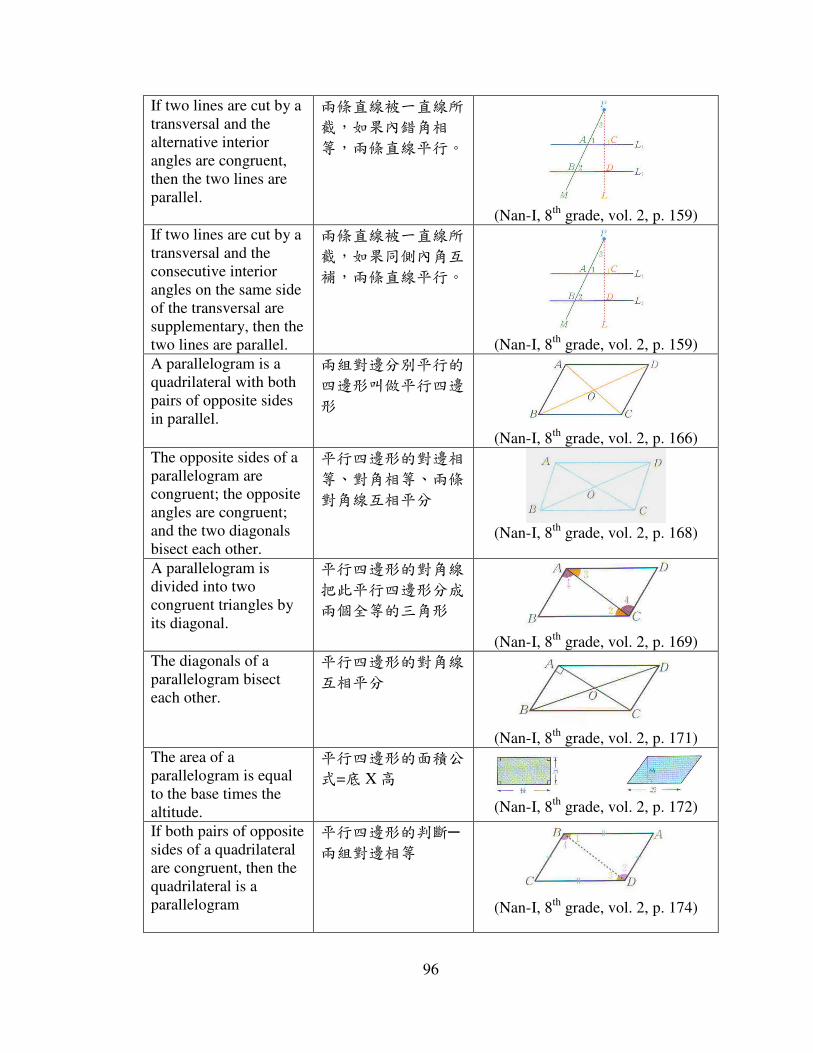
96
If two lines are cut by a transversal and the alternative interior angles are congruent, then the two lines are parallel.
兩條直線被一直線所
截,如果內錯角相
等,兩條直線平行。
(Nan-I, 8th grade, vol. 2, p. 159)
If two lines are cut by a transversal and the consecutive interior angles on the same side of the transversal are supplementary, then the two lines are parallel.
兩條直線被一直線所
截,如果同側內角互
補,兩條直線平行。
(Nan-I, 8th grade, vol. 2, p. 159)
A parallelogram is a quadrilateral with both pairs of opposite sides in parallel.
兩組對邊分別平行的
四邊形叫做平行四邊
形
(Nan-I, 8th grade, vol. 2, p. 166) The opposite sides of a parallelogram are congruent; the opposite angles are congruent; and the two diagonals bisect each other.
平行四邊形的對邊相
等、對角相等、兩條
對角線互相平分
(Nan-I, 8th grade, vol. 2, p. 168)
A parallelogram is divided into two congruent triangles by its diagonal.
平行四邊形的對角線
把此平行四邊形分成
兩個全等的三角形
(Nan-I, 8th grade, vol. 2, p. 169) The diagonals of a parallelogram bisect each other.
平行四邊形的對角線
互相平分
(Nan-I, 8th grade, vol. 2, p. 171)
The area of a parallelogram is equal to the base times the altitude.
平行四邊形的面積公
式=底 X高
(Nan-I, 8th grade, vol. 2, p. 172)
If both pairs of opposite sides of a quadrilateral are congruent, then the quadrilateral is a parallelogram
平行四邊形的判斷─
兩組對邊相等
(Nan-I, 8th grade, vol. 2, p. 174)

97
If the diagonals of a quadrilateral bisect each other, then the quadrilateral is a parallelogram.
兩條對角線互相平分
的四邊形是平行四邊
形
(Nan-I, 8th grade, vol. 2, p. 174)
If one pair of opposite sides of a quadrilateral is both parallel and congruent, then the quadrilateral is a parallelogram.
平行四邊形有一組對
邊平行且相等的四邊
形
(Nan-I, 8th grade, vol. 2,p. 175)
If both pairs of opposite angles of a quadrilateral are congruent, then the quadrilateral is a parallelogram.
兩組對角分別相等的
四邊形是平行四邊形
(Nan-I, 8th grade, vol. 2, p. 176)
Rhombus is a quadrilateral whose four sides all have the same length.
四邊都相等的四邊形
叫做菱形。
(Nan-I, 8th grade, vol. 2, p. 180)
The diagonals of a rhombus are perpendicular and bisect each other.
菱形的對角線互相垂
直、平分
(Nan-I, 8th grade, vol. 2, p. 181)
Rhombus is symmetric across each of its diagonals.
菱形是線對稱圖形,
他的對秤軸就是兩條
對角線
(Nan-I, 8th grade, vol. 2, p. 181)
The area of a rhombus is half the product of the diagonals.
菱形的面積等於兩條
對角線乘積的一半
(Nan-I, 8th grade, vol. 2, p. 183)
A rectangle (oblong) is a quadrilateral where all interior angles are right angles.
四個角是直角的四邊
形叫做長方形(矩
形)
(Nan-I, 8th grade, vol. 2, p. 185)

98
A rectangle (oblong) is symmetric across lines that connect midpoints of opposite sides.
矩形是線對稱圖形,
兩組對邊中點的連線
就是兩條對稱軸
(Nan-I, 8th grade, vol. 2, p. 187) The diagonals of a rectangle (oblong) are congruent and bisect each other.
矩形的對角線互相平
分且等長
(Nan-I, 8th grade, vol. 2, p. 187)
The midpoint of the hypotenuse of a right triangle is equidistant from three polygon vertices. In other words, OA=OB=OC.
直角三角形斜邊上的
中點 O到三個頂點的距離相等,即 OA=OB=OC
(Nan-I, 8th grade, vol. 2, p. 187)
A square is a polygon with four equal sides and right angles.
四邊等長、四個角都
是直角的四邊形就是
正方形
(Nan-I, 8th grade, vol. 2, p. 189)
The diagonals of a square are congruent, perpendicular, and bisect each other.
正方形的對角線相互
平分,垂直且等長
(Nan-I, 8th grade, vol. 2, p. 189)
A quadrilateral with one pair of parallel sides is referred to as trapezoid.
一組對邊平行而另一
組對邊不平行的四邊
形叫做梯形
(Nan-I, 8th grade, vol. 2, p. 191) A trapezoid in which non-parallel sides are equal is called as an Isosceles Trapezoid.
兩腰等長的梯形叫做
等腰梯形
(Nan-I, 8th grade, vol. 2, p. 191)
The base angles of an isosceles trapezoid are congruent.
等腰梯形兩底角相等
(Nan-I, 8th grade, vol. 2, p. 192)

99
The diagonals of an isosceles trapezoid are equidistant.
等腰梯形的兩條對角
線等長
(Nan-I, 8th grade, vol. 2, p. 192)
Two congruent isosceles trapezoids constitute a parallelogram.
兩個全等的等腰梯形
可以組成一個平行四
邊形 (Nan-I, 8th grade, vol. 2, p. 192)
The area of a trapezoid is half the product of the altitude and sum of its two bases.
梯形的面積= 1/2 x (上底+下底) x高
(Nan-I, 8th grade, vol. 2, p. 193)
The length of the trapezoid median is the average length of the bases.
梯形的中線長等於兩
底和的一半
(Nan-I, 8th grade, vol. 2, p. 194)
The median of a trapezoid is parallel to the bases.
梯形的中線平行於兩
底
(Nan-I, 8th grade, vol. 2, p. 195)
The area of a trapezoid is the product of its median and altitude.
梯形的面積=中線長乘以高
(Nan-I, 8th grade, vol. 2,p. 195)

100
CHAPTER THREE
SUNTAINING THE COGNITIVE DEMAND OF MATHEMATICAL TASKS: AN
EXAMINATION OF ONE TAIWANESE TEACHER’S SEQUENCING OF
GEOMETRIC CALCULATION WITH NUMBER (GCN) TASKS
Introduction
Investigations of mathematics classroom teaching across countries have provided
rich information regarding the effectiveness of schooling and ways of teaching that can
contribute to student learning (Hiebert et al., 2003; Stigler, Gallimore, & Hiebert, 2000;
Stigler & Hiebert, 1999). Although it cannot be concluded from these studies that there is
one best approach, numerous studies have explored models of exemplary mathematics
teaching, especially those in East Asian countries, which are believed to be an important
factor contributing to the outstanding performance of students in those countries.
One the matter of excellence in mathematics teaching, the 2009 issue of the
ZDM—International Journal on Mathematics Education (Volume 41, Issue 3) highlighted
characteristics of exemplary mathematics instruction in East Asian countries, including
the clear flow of lessons, the emphasis on the key mathematical concepts, the use of
multiple representations and solution strategies, and the emphasis on explanations and
reasoning (Huang & Li, 2009; Kaur, 2009; Lin & Li, 2009). The publication also
specifics another two characteristics of East Asian mathematics teachers, namely they
carefully select and sequence mathematical tasks and maintain the cognitive demand of

101
these tasks during instruction (Mok, 2009; Pang, 2009; Yang, 2009). To help clarify why
Taiwanese students have consistently scored at the top in cross-national comparisons, the
present study focuses on the latter two instruction characteristics and investigates what
opportunities the selection of mathematical tasks set up by a Taiwanese mathematics
teacher, Nancy 20 , can provide students to learn and how she sustains the levels of
cognitive demand when enacting the mathematical tasks with classroom students.
In fact, emphasizing the importance of selecting mathematical tasks and making
connection among these tasks to facilitate students’ learning in classroom is not new to
mathematics education (Bell, 1993; Krainer, 1993; Lampert, 2001). According to Bell
(1993), mathematical instructional tasks have significant features that can contribute to
student learning. These include the connection among mathematics topics, the flexibility
in adjusting the degree of challenge in a mathematical task, and extending a single task
into multiple tasks by changing the elements (e.g., type of number), structure, and context
of a single task. While providing general criteria of selecting and making connection
among mathematical tasks, to explore what learning opportunities the tasks can provide
the examination of a single type of task has been overlooked and not fully explored in
previous studies. Specifically, as Herbst (2006) used the term instructional situation to
identify various systems of norms students have to know and to do when working on
different mathematical tasks, he addressed that different mathematical tasks can
constitute different intellectual context for students to think about the mathematics at
stake in a problem. In this regard, examining the intellectual context of a type of
20 Nancy is a pseudonym.

102
mathematical tasks can provide insight into its special role in students’ learning of
mathematics.
More specifically the extant this study examines the learning opportunities of
geometric calculations with number (GCN)21 tasks set up by the Taiwanese mathematics
teacher and how she sustains the level of cognitive demand of the tasks. The reason that
GCN tasks are well suited for this investigation is because these tasks together with their
related diagrams can reveal how diverse learning opportunities are afforded by selecting a
sequence of mathematical tasks. In particular, since GCN tasks usually require the same
reasoning and knowledge as geometric proofs (GP) do (Hsu, 2007; 2008), this
investigation can further specify what learning opportunities associated with GP that the
GCN tasks can afford.
To explore the extent to which the selection and sequencing of GCN tasks can
contribute to students’ learning, the Mathematical Tasks Framework (MTF) (Silver &
Stein, 1996; Stein, Grover, & Henningsen, 1996; Stein & Smith, 1998; Stein, Smith,
Henningsen, & Silver, 2000) is applied to model and trace learning opportunities. As
shown in Figure 3.1, in the MTF framework mathematical tasks lead to student learning
as a result of how they appear in the pages of textbooks or other curricular mathematics,
how they are set up by teacher, and how these mathematical tasks are enacted by the
teacher and students in classroom. The first three stages in the MTF framework have a
strong influence on students’ learning outcomes (Silver & Stein, 1996; Stein et al., 1996;
Stein & Smith, 1998; Stein et al., 2000). In particular, the examination focuses on the
21 A GCN is generally described as numerical calculation done in relation to mental or physical geometric diagrams on the basis of geometric principles or formulae (e.g., calculating an angle measure in a triangle given that measures of the other two angles are 30˚ and 100˚, respectively).

103
second and the third stages, namely tasks as set up and enacted by classroom teacher and
students.
Figure 3.1 The Mathematical Tasks Framework (Stein, Smith, Henningsen, & Silver, 2000, p. 4; Silver, 2009, p. 829)
Furthermore, the MTF framework not only helps this study trace the influence of
sequencing and the implementation of GCN tasks, but also examine how the cognitive
demands of the tasks are sustained. While sustaining a high demand of a mathematical
task through the stages can have a significant impact on students’ learning (Boaler &
Staples, 2008; Hiebert & Wearne, 1993; Stein & Lane, 1996; Stigler & Hiebert, 2004;
Tarr et al., 2008), this study investigates how Nancy was able to facilitate student
learning by maintaining the cognitive demand through her efforts of setting up a
sequence of GCN tasks and enacting these tasks with her students.
Specifically, the investigation focuses on how GCN task diagrams influence the
maintenance or the increase in cognitive demand when enacting the sequence of tasks in
classroom. Another facet that will be examined in this study is the use of gestures.
Instruction in East Asian countries can be described as teacher-centered (Leung, 2002;
2005) while classroom teachers often talk more than students. In this regard, how
students can learn mathematics in this environment is of interest. From the perspective of
embodied cognition (Lakoff & Núnez, 2000), non-verbal communication can be a
Student Learning
TASKS as they appear in curricular/ instructional materials
TASKS as set up by classroom teachers
TASKS as enacted by teacher and students during instruction

104
possible way to make learning happen in the classroom in East Asian countries. This
study particularly focuses on examining the use of gestures, one type of non-verbal
communication, because gestures can function as a semiotic aid to facilitate students’
learning of mathematics (Nemirovsky & Ferrara, 2009). To this end, the research
question proposed in this study is described as follows:
In what ways does a Taiwanese mathematics teacher sustain or increase the levels of
cognitive demand and facilitate students’ learning by setting up a sequence of GCN tasks
and how she uses gestures to facilitate the learning?
Literature Review
Mathematical Task
In recent years, considerable attention has been given to mathematical tasks in
order to improve the quality of mathematics teaching and learning (Bell, 1993;
Henningsen & Stein, 1997; Herbst, 2003; 2006; Krainer, 1993; NCTM, 2000; Simon &
Tzur, 2004; van Boxtel, van der Linden, & Kanselaar, 2000). As defined by Doyle (1988),
a task is
(a) a goal state or end product to be achieved; (b) a problem space or set of conditions and resources available to accomplish the task, (c) the operations involved in assembling and using resources to reach the goal state or generate the product, and (d) the importance of the task in the overall work system of the class (p. 169). In line with Doyle, a mathematical task can be considered as the context that
conveys the message of what mathematics must be done while solving the task. When
task elements are manipulated, tasks have the potential to influence and structure how
students think about mathematics. Tasks can also direct students’ attention to a particular
perspective of the mathematics and broaden or limit their viewpoints of mathematics
105
(Henningsen & Stein, 1997; Silver, 2009). As such, a good mathematical task can
scaffold students’ development of a proficient understanding of mathematics.
Herbst (2006) further elaborated a mathematical task as a specific unit of meaning
that “constitutes the intellectual context in which individuals think about the
mathematical ideas at stake in a problem” (p. 315). He argued that teaching requires more
than understanding what mathematics problems are and how students interact with them.
Significance as well is recognizing how a teacher is able to sustain the intellectual
demand of a task in the classroom. To explore this, he proposed the term instructional
situation, which identifies what various systems of norms students have to know at a
particular time and what they have to do to fulfill the implicit didactical contract
(Brousseau, 1997) agreed upon between teacher and students in the classroom.
Researchers also suggest that mathematical tasks should be used to organized
instruction, especially the tasks of a high-level (Krainer, 1993; Lampert, 2001; Stein &
Smith, 1998; van Boxtel et al., 2000). For example, Krainer (1993) suggests using
powerful tasks (i.e. high level) so that teachers can manage complex and conflicting
instruction (e.g., the conflict between the well-developed mathematics system and
students’ prior knowledge). Here, a powerful task refers to a task that can be strongly
interconnected with other tasks and can facilitate students in actively and reflecting
confronting mathematics, which can further generate interesting questions (Krainer,
1993). Bell (1993) also investigated the effectiveness of mathematical tasks and
suggested several principles that should be followed to improve mathematics teaching,
including (1) selecting a mathematical task that contains mathematical concepts to be
learned and ideas that students will want to work on; (2) determining and adjusting the
106
degree of challenge in a mathematical task to allow students to explore the mathematics
concepts in accordance with their ability; (3) extending a single task into complex and
multiple tasks so that students will broaden their experiences working on certain
mathematics topics and then relate those learned mathematics topics to other
mathematical content; and (4) providing students opportunities to reflect and to review
their self learning in relation to a broader sense of mathematics, different types of
problems, and different methods of solutions within the field.
Despite the value placed on tasks of high cognitive demand, researchers have
recognized that such tasks do not always guarantee that students’ enactment remains at
the same high level in terms of their mathematics understanding (Stein, Grover, &
Henningsen, 1996; Stein, Smith, Henningsen, & Silver, 2000). One reason for this put
forth by Stein, Grover, and Henningsen (1996) is that teachers can not exactly predict
students’ responses when enacting these tasks because students may generate diverse
mathematics ideas in solving them. In this regard, these tasks require that teachers
possess good instructional skills to maintain the cognitive demand during classroom
instruction. If teachers do not effectively manage tasks with a high level of cognitive
demand, students’ enactment may remain at a level of demand that is lower than the
initial cognitive demand.
A lowering of cognitive can be attributed to six factors articulated by Stein et al.
(1996). The first factor occurs when the challenge of the tasks becomes a non-problem
for students. This results when teachers respond to students’ request that teachers reduce
the demand of the task by providing more explanation for the tasks, which in turn reduces
the complexities and the challenges of a task. Teachers may take over the challenge of the

107
work by unintentionally performing the work for students or directly telling students how
to do it. The second factor that reduces the level of the cognitive challenge is when
inappropriate tasks are assigned to students. In this circumstance, students fail to engage
in high–level cognitive activities because of a lack of motivation, interest, or prior
knowledge related to the mathematics work. The third factor is related to the process of
implementing the task. If teachers shift the learning focus from understanding
mathematical meaning, and concepts to emphasizing the correctness or completeness of
the answers, the cognitive challenge will be reduced. The fourth factor is related to the
time allocated to tasks. Time constraints that prevent students from going through the
mathematical ideas can lead to a lower level of cognitive demand. The fifth factor is the
lack of student accountability if students do not take responsibility for learning the
mathematics and monitoring the work progress themselves. For example, students will
not learn mathematics if they think the classroom teacher should always give them the
answers to problems and, thus, refuse to reason out the problem themselves. The final
factor that can lower cognitive demand has to do with classroom management. If teachers
lack sufficient skills to manage the flow of task implementation, a high-level cognitive
activity may become a low-level one.
Gestures as Semiotic Aid to Facilitate Student Learning
In recent years, many researchers have investigated how gestures play a role in
human communication and in influencing the teaching and learning (Chen & Herbst,
2007; Hsu, 2008; Maschietto & Bussi, 2009; Nemirovsky & Ferrara, 2009; Pozzer-
Ardenghi & Roth, 2005; Radford, 2003; 2009; Roth, 2001; 2002; Roth & Lawless, 2002;
Roth & Thom, 2009; Sabena, 2004; Williams, 2009). Previously, gestures were viewed
108
as spontaneous accompaniments of speech realized through the movements of figures,
hand, and arms; in other words gestures and speech are usually co-present in the social-
interactive context of communication (McNeill, 1992). But, recent studies have deepened
our understanding of gestures by recognizing their cognitive nature and arguing that
gestures are more than accompaniments to spoken messages during communication.
Language cannot be separated from imagery (McNeill, 2005), and gestures are
representations of thought. In this regard, gestures have cognitive possibilities as they
universally and automatically occur with speech to convey meanings during
communication and have an important influence on the communication context.
The cognitive possibilities of gestures were revealed in a study by Radford (2009),
which uses a broader context of the interplay of the various sensuous sources to explain
the learning. Rodford (2009) argued that knowing is an experience resulting from multi-
sensorial experiences of the world and then self-sensuous apprehension of to-be-learned
objects. Thus, gestures are one of importance in conveying abstract thinking. Other
support for the importance of gestures comes from the viewpoint that treats mathematics
learning as the development of a particular type of imagination (Nemirovsky & Ferrara,
2009; Radford, 2009). In this sense, gestures have a cognitive function , this possibly
facilitating students’ understanding and imagination of mathematics.
Considering that teachers are responsible for scaffolding students in learning
mathematics, they should take advantage of all resources available to do so. Since
gestures can convey mathematical meaning to students in classroom (Arzarello & Paola,
2007), they provides teachers an alternative way to externalize their thoughts (Roth, 2002)
and then potentially enhance students’ understanding of the content embodied in the

109
inscriptions (e.g., diagram, photograph) (McNeill, 1992; Pozzer-Ardenghi & Roth, 2005).
Given that teachers need to interact with diagrams to illustrate geometric meaning for
students, the interplay between diagrammatic properties and gestures is worthy of further
investigation (Chen & Herbst, 2007).
Methods
The Methods here consist of four sections. The first section describes the rationale
of selecting a Taiwanese teacher for the investigation of this study. The second section
explains the data source and the selected episodes for analysis. Section Three provides
information on the selected episodes in the context of the instruction. The final section
elaborates the methodological approaches used to analyze the selected episodes.
Rationale for Teacher Selection
One teacher, Nancy, was selected for this study because she represents a typical
expert Taiwanese mathematics teacher at the middle school level. As teaching is a
cultural activity (Stigler & Hiebert, 1999), Nancy’s teaching reflects several attributes
specific to Taiwan instruction. First, Nancy has a profound understanding of subject
content knowledge for mathematics (Ma, 1999). Given her more than twenty years of
teaching experience, Nancy can clearly describe the teaching sequence for mathematical
topics and elaborates how these topics relate to other mathematics content. She can do
this from the perspective of both student learning and mathematics curriculum
development. In this regard, she is capable of evaluating whether or not the arrangement
of a topic in a textbook is appropriate and aligned with students’ learning trajectories.
The second reason that Nancy is representative of the Taiwanese teaching culture has to
do with her teaching style in the classroom. Nancy’s classroom is teacher-centered

110
(Leung, 2002; 2005). She usually dominates the classroom activities by deciding what
work her students have to do and what mathematics should be discussed in class.
Although she assigns students to demonstrate their task solutions in front of the
classroom, students are constrained in elaborating their solutions because the solutions
should be relevant to the tasks assigned. It seems that the underlying didactical contract
(Brousseau, 1997) between Nancy and her students is to work on the mathematical tasks
assigned, while avoiding moving beyond the scope of the tasks. The classroom norm is
that Nancy grants students some freedom to solve a task by different solution paths, while
being very clear about the mathematics content to be learned. As a result, Nancy typically
expects only those answers that can be used to solve the tasks being discussed or can be
used as materials for subsequent instructional activity. The third typical characteristic that
Nancy has is consistent with the examination culture in Taiwan (Lin & Tsao, 1999).
Nancy believes that students’ success on the high school entrance examination is a very
important criterion for evaluating the quality of teaching. Thus, this high-stakes entrance
examination plays a central role in her instruction. Specifically, in relation to geometry,
Nancy comments that this is the most difficult topic for middle school students,
especially the construction of GP. However, she also believes that geometric tasks can
provide students an opportunity to acquire mathematics intuition because of the
particularity and complexity of individual geometric task. Considering that each
geometric task is special and complex, students can not simply apply a well-developed
procedure to derive the solution. This lack of a ready-made procedure forces students to
visualize the underlying structure of the geometry, especially the structure of geometric
diagrams, and to develop the intuition of geometry. This intuition, Nancy believes, is the

111
key to the success of mathematics learning and to getting good grades on the high school
entrance examination.
Data Source and Episode Selection
The data used in this study consists of video records of 30 lessons22 collected
from Nancy’s instruction in 8th grade mathematics class with about 40 students. The
geometry content taught in those lessons was properties related to parallel lines and
quadrilaterals.
Among these 30 video records, two episodes were selected for a close analysis.
The selection of the first episode was of interest because it indicates how Nancy sustained
or raised the cognitive demand of the work when she and her students solved a sequence
of GCN tasks in class. The investigation of this episode focused on the role of diagrams
in sustaining or raising the cognitive demand of the tasks and possibly in turn changing
instructional mathematical tasks (Doyle, 1983; Stein, Smith, Henningsen, & Silver, 2000).
The second episode was selected because it revealed how Nancy used gestures to
scaffold her students in learning geometry. Visualizing the diagram configurations with
sub-constructs are essential to retrieving useful geometric properties and there are one of
keys to solving GCN tasks. To aid in visualization, teachers may use gestures. Thus, the
analysis here focuses on the interaction between the diagram and gestures that can
convey geometric meaning to students without lowering the level of cognitive demand of
the GCN tasks Nancy gave her students to solve.
22 About 50% of tasks used by Nancy during the 30 lessons were GCN tasks.
112
Sustaining the level of cognitive demands by selecting and sequencing GCN tasks
as well as the use of diverse gestures to facilitate learning is very common in Nancy’s
classroom. Selecting the two episodes as convenient examples can allow author to
explicitly and inclusively demonstrate the ways to facilitate students’ learning through
the selection of GCN tasks and the use of gestures.
Background of the Two Selected Episodes
Episode One
Episode One involves Nancy’s setting up of a sequence of GCN tasks. When
setting up the sequence of GCN tasks, Nancy altered the diagram configurations to make
them more complex. The geometric content associated with the sequence of GCN tasks
was the properties related to parallel lines. Before working on the sequence of GCN tasks,
Nancy introduced students to the definitions and properties of parallel lines (e.g., the
alternate interior angles theorem). Together she and the students worked on several GC
tasks which required students to apply the learned properties.
In the selected episode, Nancy first set up a task (the task on the left side of Figure
3.2) and led the classroom discussion to solve the task using the relevant geometric
properties for each reasoning step in the solution. After obtaining the solution, Nancy set
up another two tasks (the one in the middle of Figure 3. 2 and the one on right) which
were similar to the first task in terms of the shape of the diagrams (two horizontal parallel
lines and several segments which constitute angles in between the parallel lines), the
given numerical measures of the angles, and the unknowns that the students had to figure
out. The major difference in the three tasks was the number of segments in between the
two parallel lines and the angles formed by both the segments and the parallel lines.
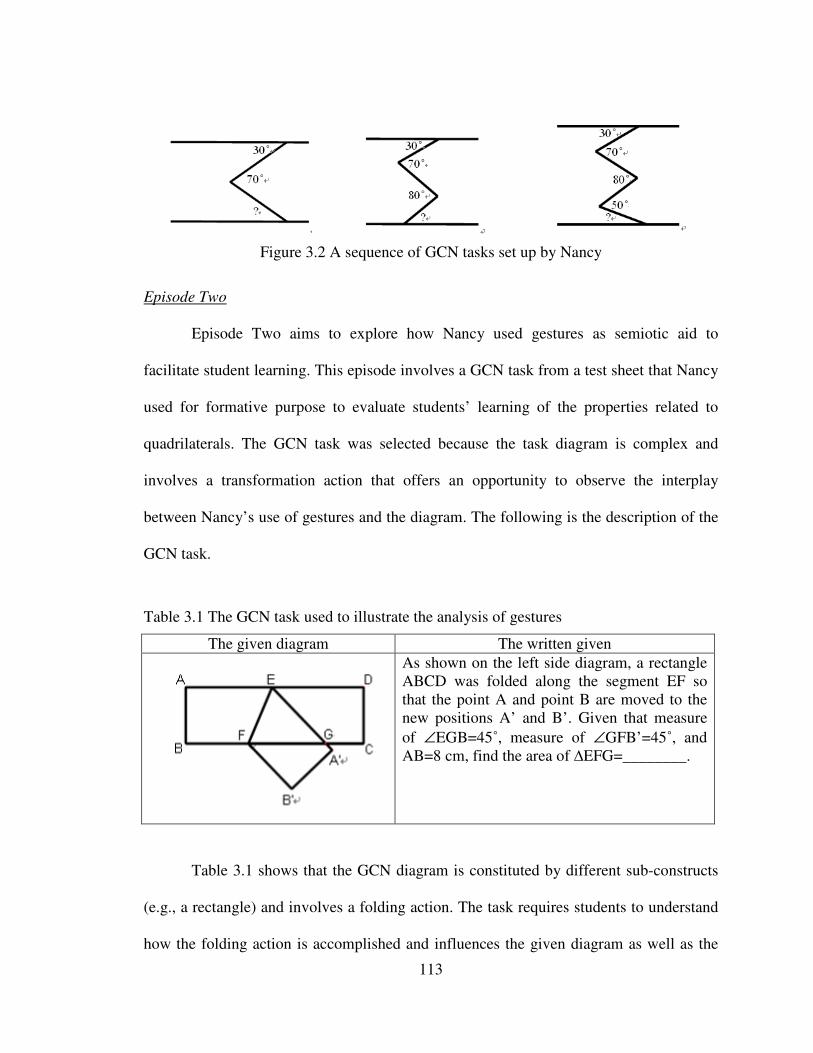
113
Figure 3.2 A sequence of GCN tasks set up by Nancy
Episode Two
Episode Two aims to explore how Nancy used gestures as semiotic aid to
facilitate student learning. This episode involves a GCN task from a test sheet that Nancy
used for formative purpose to evaluate students’ learning of the properties related to
quadrilaterals. The GCN task was selected because the task diagram is complex and
involves a transformation action that offers an opportunity to observe the interplay
between Nancy’s use of gestures and the diagram. The following is the description of the
GCN task.
Table 3.1 The GCN task used to illustrate the analysis of gestures
The given diagram The written given
As shown on the left side diagram, a rectangle ABCD was folded along the segment EF so that the point A and point B are moved to the new positions A’ and B’. Given that measure of ∠EGB=45˚, measure of ∠GFB’=45˚, and AB=8 cm, find the area of ∆EFG=________.
Table 3.1 shows that the GCN diagram is constituted by different sub-constructs
(e.g., a rectangle) and involves a folding action. The task requires students to understand
how the folding action is accomplished and influences the given diagram as well as the
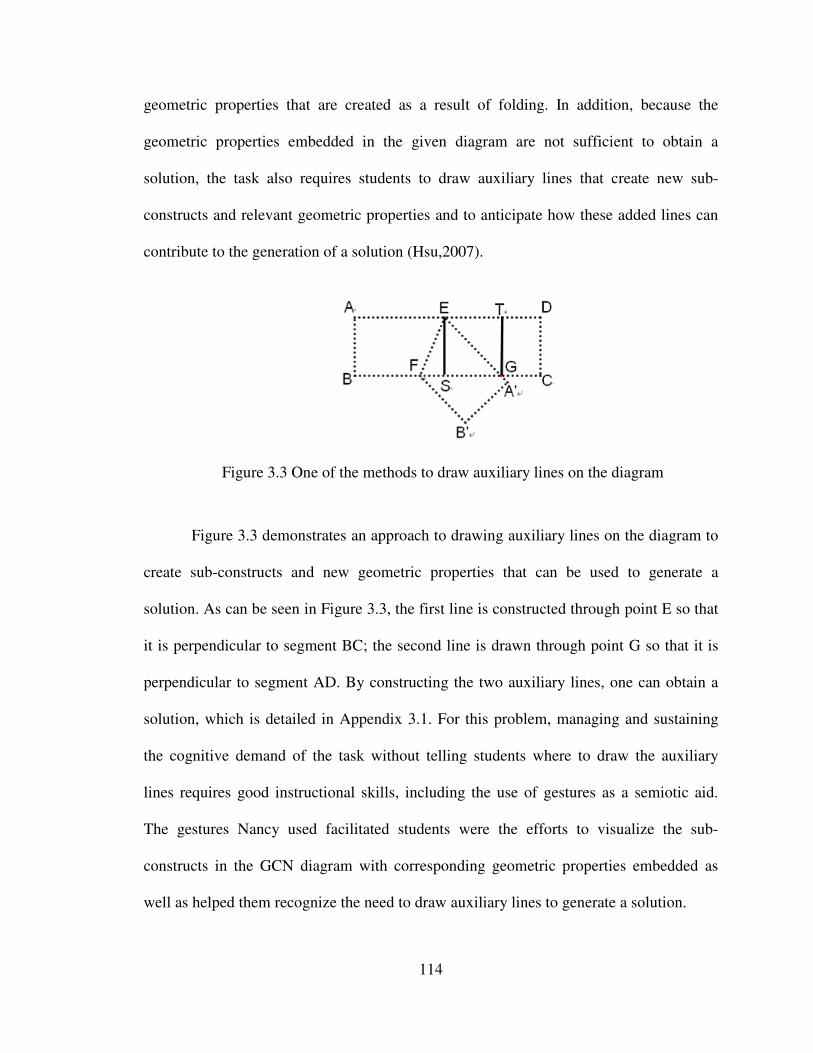
114
geometric properties that are created as a result of folding. In addition, because the
geometric properties embedded in the given diagram are not sufficient to obtain a
solution, the task also requires students to draw auxiliary lines that create new sub-
constructs and relevant geometric properties and to anticipate how these added lines can
contribute to the generation of a solution (Hsu,2007).
Figure 3.3 One of the methods to draw auxiliary lines on the diagram
Figure 3.3 demonstrates an approach to drawing auxiliary lines on the diagram to
create sub-constructs and new geometric properties that can be used to generate a
solution. As can be seen in Figure 3.3, the first line is constructed through point E so that
it is perpendicular to segment BC; the second line is drawn through point G so that it is
perpendicular to segment AD. By constructing the two auxiliary lines, one can obtain a
solution, which is detailed in Appendix 3.1. For this problem, managing and sustaining
the cognitive demand of the task without telling students where to draw the auxiliary
lines requires good instructional skills, including the use of gestures as a semiotic aid.
The gestures Nancy used facilitated students were the efforts to visualize the sub-
constructs in the GCN diagram with corresponding geometric properties embedded as
well as helped them recognize the need to draw auxiliary lines to generate a solution.
115
Mode of Data Analysis
This case study documents the instruction of a Taiwanese mathematics teacher
with a view toward systematically illuminating the reality of the instruction phenomenon
in detail (Merriam, 1998). Discourse analysis tools were used to analyze the video
records (Erickson, 2004; Johnstone, 2002; Lemke, 1990). Similar to most other research
in education, this study focuses on the interaction among teacher, students, and subject
matter content as manifested in speech, gestures, written symbolization, and non-verbal
actions (Erickson, 2006). In addition, multimodal analysis suggested by Thibault (2000)
is used to frame the transcription of the video clips in order to reveal the co-deployed and
co-contextualized textual meaning as created by the distinct semiotic resources systems.
The examination of the teacher’s gestures involved in solving a GCN task in
Episode Two employs a comprehensive classification of gestures developed by Pozzer-
Ardenghi and Roth (2005) developed from observations the use of gestures by biology
teachers when interacting with visual representations (e.g., photographs, diagrams).
Pozzer-Ardenghi and Roth identified eight types of gestures, which are described
as follows.
• Representing refers to the gestures used to denote the objects or phenomena that are
not directly available in the visual representations but related to some features of it
(e.g., to present the movement of something real but can not be shown in the static
diagram).
• Emphasizing describes gestures that emphasize an entity directly available in the
visual representation.
116
• Highlighting gestures are those used to draw attention to an approximate area in the
visual representation where an object can be identified. Usually, these gestures are
circular or elliptical.
• Pointing refers to the gestures that clearly point to specific objects in the visual
representation or entire representation from some distance.
• Outlining gestures are used to trace a shape in the visual representation. Hence, the
shape of this gesture is determined by the shape of the reference object.
• Adding gestures are similar to outlining, but the objects outlined are not available in
the visual representation, even though it could have been there.
• Extending describes gestures that add something beyond the boundary of the visual
representation.
• Positioning refers to the gestures that strongly relate to the body orientation and then
constitute a form of extension into three-dimensional space.
This comprehensive classification reveals what geometric meaning was conveyed
through the interplay between the gestures and the diagrams during the process of solving
the GCN task.
Findings
Episode One
Episode One focuses on exploring how Nancy set up a sequence of GCN tasks
and enacted these tasks with her students. The sequence of classroom discussion with

117
respect to the three tasks is demonstrated in the following transcripts23, which are framed
into three sections: the subjects (Nancy or the students), the verbal and non-verbal (e.g.,
physical actions related to the mathematics) communications, and the diagram alterations
or locations to which the physical actions (e.g., gesturing) refer.
The key to solving the first GCN task is to recognize that auxiliary lines need to
be drawn on the given diagram so that new sub-constructs and corresponding geometric
properties can be created and used to generate solutions. Nancy left the essential work
deciding where to draw the auxiliary lines to the students and facilitated the class
discussion regarding solutions by asking what angle measures students were inferring and
what geometric properties were used to support their inferences.
23 Episodes were translated into English by the author and then validated by a Taiwanese whose expertise is in English.

118
124 T: How to solve this task? 2 SG: The answer is 40.
3 T: Why 40? 4 5
SG: To draw a parallel line [gesture a horizontal line virtually]25
6 7 8
T: To draw a parallel line (1.0). Some one just said to draw a parallel line. Ok, we draw it here [draws a parallel line]. Then?
9 10
SG: The measures for the acute angle are 30 [point at the 30˚ angle virtually].
11 12
T: So, the measures for this angle are 30 [points at the 30˚ angle]. What will be the next?
13 14 15
SG: That (0.5) the measures of the alternate interior angle are 30 [point at the angle corresponding to the alternate interior angle].
16 17 18
T: Ok, the measures for the alternate interior angle are 30 [writes 30 on the angle] (.). How’s about this angle [points at the lower part of 70 degrees angle]?
19 SG: The measures are 40.
20 21
T: How’s about this angle? [points at the angle with a question mark]
22 SG: The measures are 40. 23 24
T: What geometric property can support this inference [points back and forth between the two angles]?
25 SG: The alternate interior angles property
26 27 28 29
T: Ok. So we know that the measures for this angle are 40 [erases the question mark and writes 40 on the unknown angle]. Is that correct? (.) Do you have any alternative strategies to this task?
24 The numbers used in the transcript refer to the sequence of the text demonstrated in the study and may not be the actually numbers in the transcript for the whole episode analyzed. 25 Notes for all transcript in this study: (.) short pause; (number) longer pause lasts the number of seconds; (inaudible) talk can not be recognized clearly; _____emphasis of the words; [] writing or physical actions from Teacher Nancy or students; T: Teacher Nancy; SG: group of students; S: individual student.

119
30 SG: We can extend the line down to the parallel line 31 32 33
T: What do you mean [erases the auxiliary line and angle measures discussed previously and puts the question mark back to the task diagram]?
34 35
SG: Extend the middle segment to intersect the below line [gesture the line extension virtually].
36 T: Extend the line [extends the line virtually]? 37 SG: Yes.
38 T: What else can we do after extending the line? 39 SG: The corresponding angles 40 SG: The alternate interior angles
41 42
T: Corresponding angles or alternate interior angles (smiles)?
43 SG: Alternate interior angles
44 45 46 47 48
T: Alternate interior angles [points at the 30˚ angle]. Thus, this angle is the alternate interior angle corresponding to the angle with 30˚ [points at the alternate interior angle]. Right?(.) Ok, measures for this angle are 30 [writes 30˚ on the angle]. And then?
49 SG: The exterior angle property
50 51 52
T: We can apply the exterior angle property [points at the three angles corresponding to this property] and calculate the angle measures to obtain the 40˚ answer.
The above transcript illustrates the discussion between Nancy and her students
when working on the first GCN task. Her students proposed two different methods of
constructing the auxiliary lines that can obtain the unknown angle measures; one involves
drawing a line parallel to the given parallel lines and the other is to extend one of the
segments in between the two given parallel lines so that the line drawn can intersect the
bottom parallel line. After the students elaborated the methods regarding constructions of

120
the auxiliary line, Nancy worked with them to figure out the geometric properties
corresponding to each reasoning step.
Several learning opportunities were afforded by the task and related work in class.
First, Nancy provided students the opportunity to visualize and operate the given diagram
to decide where to add auxiliary lines as well as to figure out how the line additions could
help them obtain the solutions, the work requiring the operative apprehension (Duval,
1995). The second learning opportunity was that the students could work on recognizing
the sub-constructs in the diagram and corresponding geometric properties which can be
used to support reasoning steps in the solution generations. The cognitive process of
recognizing the sub-constructs in the diagram requires the perceptive apprehension and
the process of identifying the geometric properties embedded in these sub-constructs
further asks for the discursive apprehension of the diagram (Duval, 1995). For example,
in lines 23 and 24, Nancy pointed back and forth at the angles of diagram, which allowed
students to visualize the triangle shape with the three angles and identify they were
corresponding to the alternate interior angles property. Another example can be seen in
lines 50 and 51, which captures how Nancy pointed at the three angles corresponding to
the exterior angle property on the diagram, which allowed students to correctly
understand the geometric property embedded in the diagram. This is relevant because
drawing auxiliary lines and identifying sub-constructs with corresponding geometric
properties correctly on a diagram require different diagram apprehensions (operative,
perceptive, and discursive) (Duval, 1995), which are fundamental competencies in
constructing GP. The third learning opportunity was that students could apply different
strategies with different sets of geometric properties to obtain a solution to this task (e.g.,

121
the alternate interior angles property for the first method and the exterior angle property
for the second method).
After this first GCN task was solved, Nancy introduced another GCN task by
adding complexity to the diagram of the first task, as shown in the middle of Figure 3.2.
She then asked students to find the unknown measure. At this moment, one of her
students immediately replied that the answer to the second GCN task was 40˚. In response,
Nancy decided to add the third GCN task (the one on the right side of Figure 3.2) to the
associated diagram so that the resulting diagram was even more complex than those of
the previous two GCN tasks. Nancy then discussed the second GCN task with students
again, focusing how to draw auxiliary lines on the diagram and what geometric properties
embedded in the diagram can be used to generate a solution. After figuring out the
unknown measure to this task, Nancy hinted to the students that a pattern may possibly
exist in the sequence of the three GCN tasks.
53 54 55 56
T: ….let’s think how we solved these tasks. (1.0) Actually, my point does not ask you to memorize the finding, but you will find out a rule existing in these tasks. Later, when you encounter similar tasks again, you can obtain the answer quickly by applying the rule.
Nancy emphasized that the pattern can benefit students in their future problem
solving, but she did not expect or want students to memorize the rule. Nancy wanted
students to systematically think through the three GCN tasks and guess what pattern was
embedded in the tasks. In a way, the explanation in the transcript allowed Nancy to
manage the transition of instructional situations (Herbst, 2006). Originally, the didactical
contract between Nancy and her students was to solve the GCN tasks and found the

122
unknown measures. After providing the explanation as shown in the transcript, Nancy
changed the instructional situation from solving the GCN tasks to conjecturing the
patterns embedded in the sequence of the GCN tasks.
In addition, the students’ inability to solve the third task with the most complex
diagram also forced Nancy to change the classroom activity. She asked students to work
in groups instead of in individual and walked around the classroom to check if they were
able to solve the task. After making sure that the students knew how to solve it, Nancy re-
directed their attention to the pattern embedded in the three GCN tasks again.
57 58 59
T: Ok, now we can see what conclusion we can obtain. We just solved several tasks and can anyone perceive the conclusion? (2.0)
60 SS: (inaudible)
61 62 63 64 65 66 67 68 69 70
T Ok, I re-write the measures again [re-labels the measures in the three GCN diagrams]. (.) When you solve the tasks and notice that you can apply the same properties and solution strategies to obtain the solutions. Do you think it is possible some patterns embedded in the tasks? (0.5) Actually, mathematical patterns or rules were discovered in history when similar cases appeared in different mathematics settings. Now, can you figure out the embedded patterns?
71 72
SG: Yes. (1.0) To add angle measures on both sides of the diagram.
73 T: What do you mean? To add both sides? 74 75
SG: To add the angle measures on left side in the diagram
76 T: And then? 77 78
SG: That equals the sum of angle measures on the right side.
79 80 81
T: Sum of angle measures on the left side of the diagram equals that on the right side. Ok, let us check if the pattern is correct with the three tasks.

123
As can be seen in lines 57, 58, and 59 in the transcript, Nancy asked if students
could identify the pattern in the three GCN tasks. Because none of her students responded
to her immediately, she scaffolded students thinking as they tried to find the pattern.
Specifically, Nancy re-labelled the measures of the angles in the three GCN diagrams and
used the example of how mathematics has been discovered (i.e., observing similar
examples that appear in different mathematics setting) to facilitate the learning. The
action of re-labelling the measures directed students’ attention to particular locations on
the diagram and seemed to hint students that the pattern is related to these measures.
Nancy’s effort successfully brought students from measure calculations to pattern
conjecturing. After the students figured out the pattern, Nancy confirmed it by checking
the measures in the three GCN tasks with her students.
Episode Two
Episode Two uses another GCN task to show how the use of gestures is an
important tool to scaffold students learning of geometry and to help students obtain
solutions by visualizing geometric diagrams with relevant geometric properties.
Specifically, because the GCN task diagram is complex and involves a transformation
action, the analysis can illustrate the use of diverse types of gestures can scaffold students
reasoning geometric relationship but not lower the level of cognitive demand of the task.
Similar to Episode One, the transcript in Episode Two also has three frames: the
subjects, the verbal and non-verbal communication, and the diagram alterations or
locations to which the physical actions refer.
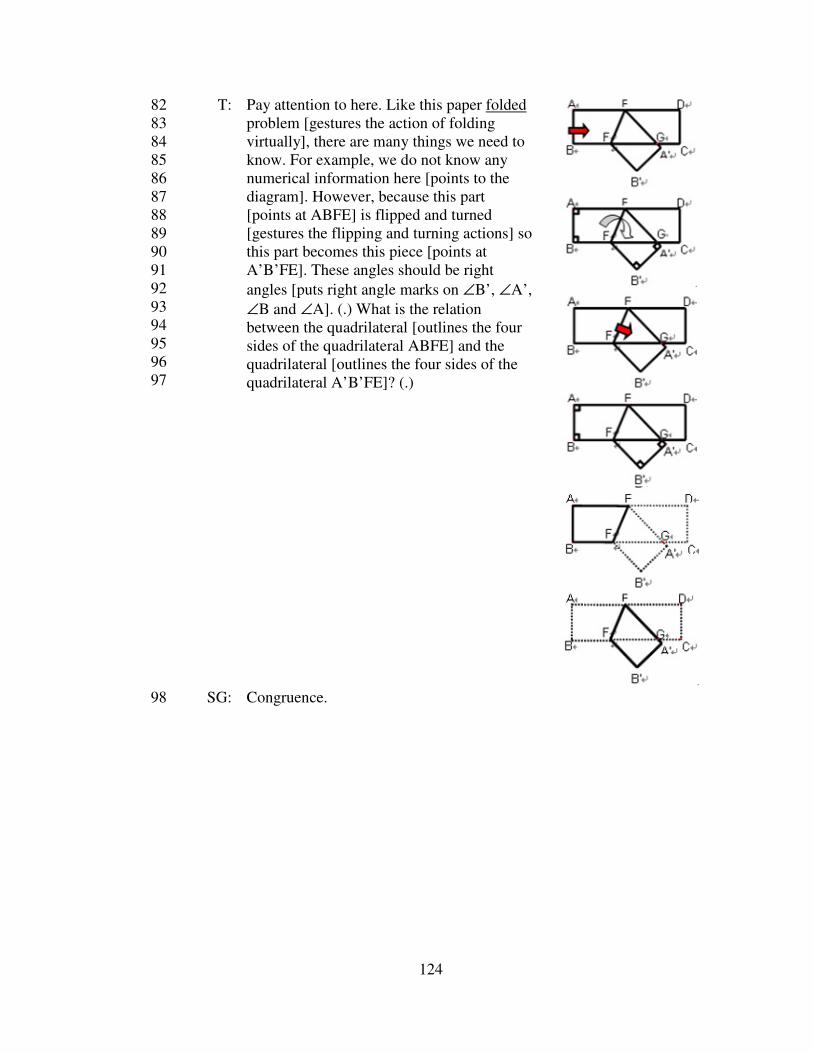
124
82 83 84 85 86 87 88 89 90 91 92 93 94 95 96 97
T: Pay attention to here. Like this paper folded problem [gestures the action of folding virtually], there are many things we need to know. For example, we do not know any numerical information here [points to the diagram]. However, because this part [points at ABFE] is flipped and turned [gestures the flipping and turning actions] so this part becomes this piece [points at A’B’FE]. These angles should be right angles [puts right angle marks on ∠B’, ∠A’, ∠B and ∠A]. (.) What is the relation between the quadrilateral [outlines the four sides of the quadrilateral ABFE] and the quadrilateral [outlines the four sides of the quadrilateral A’B’FE]? (.)
98 SG: Congruence.

125
99 100 101 102 103 104 105 106 107
T: Congruence. Are these two congruent? (.) These two [points at ABEF and A’B’EF] are flipped [gestures the folding action]. So, these two shapes [points to ABEF and A’B’EF] are congruent. Because these two quadrilaterals are congruent [puts labels on ∠AEF], these two angles [points at ∠AEF and ∠FEG] should be congruent too [puts labels on ∠FEG].
The transcript shows how Nancy scaffolded her students to interpret the diagram
configurations and the word “folded” as well as how the word “folded” influences the
geometric properties embedded in the given diagram that can be used to obtain solutions.
The word “folded” in the written givens implies that the two quadrilaterals ABFE and
A’B’FE and corresponding angles and segments (e.g., ∠AFE=∠A’FE). To scaffold
students to visualize the congruence of the quadrilaterals and the corresponding segments
and angles, Nancy used different gestural moves.
First of all, in lines 83, 84, and 89, Nancy used a gesture, which can be considered
a representing gesture, to demonstrate the folding action from quadrilateral ABFE to
quadrilateral A’B’FE. Thus, students had the opportunity to understand the relationship
between the flipping action and the diagram configurations (e.g., the two congruent
quadrilaterals), which is not visible in a static geometric diagram. Secondly, the use of
the pointing gesture revealed in lines 88, 90, and 91 also provides students an opportunity
to make connection of the two congruent quadrilaterals. In addition, the use of pointing

126
gestures also helped students follow Nancy’s reasoning and explanation. For example,
the pointing gesture (line 106) in relation to ∠AEF and ∠FEG helped students
understand that these two angles are the corresponding angles of the congruent
quadrilaterals.
Thirdly, Nancy used an outlining gesture to re-draw the two quadrilaterals ABFE
and A’B’FE to further impress upon her students the shapes of the two congruent
quadrilaterals. This outlining gesture can further facilitate students’ ability to see the
corresponding properties (e.g., AB=A’B’). Fourthly, the repeated representing gestures
can also be viewed as a kind of emphasizing gesture because they highlight the
importance of the folding action to the interpretation of the diagram configuration.
Overall, the use of gestures to interact with the diagrams can convey the spatio-graphical
meaning of the diagram (e.g., shape of quadrilateral ABFE) and provide students the
opportunities to connect between spatio-graphical properties and theoretical properties
(e.g., the congruence of the two quadrilaterals ABFE and A’B’FE). Outlining,
representing, and pointing gestures also function as an informal proof that allows students
to retrieve theoretical properties. For example, students inferred the congruence of ∠AEF
and ∠FEG which are labeled with circles in the diagram in lines 104, 105, 107, and 108.
After using gestures to help students understand the congruence of the two
quadrilaterals with the corresponding angles and segments, Nancy asked students to infer
any other geometric properties embedded in the diagram based on the written given
without considering the goal of this task. These goal-free inferences eventually led
students to recognize the necessity of drawing auxiliary lines on the diagram because
geometric properties embedded in the given diagram were not sufficient to obtain

127
solutions. In the end, Nancy asked two of the students to find solutions themselves and
then demonstrate their methods to construct the auxiliary lines and solutions generated
based on the auxiliary constructed lines.
Discussion
Sustaining the Cognitive Demand of GCN tasks
The analysis of Episode One shows that the Nancy’s setting up of a sequence of
GCN tasks provided students diverse opportunities to learn geometry. Specially, they had
opportunities to (1) operate the diagram to decide where to draw auxiliary lines; (2)
visualize geometric properties embedded in the diagram that can be used to obtain
solutions; (3) apply different strategies to solve the GCN tasks. While GCN tasks and GP
tasks require similar knowledge and problem-solving processes (further analysis is given
in the companion study in Chapter Four of this dissertation), students’ engagement with
GCN tasks can contribute to their potential competence in constructing GP tasks later.
In particular, setting up a sequence of tasks also allowed Nancy to scaffold
students as they made conjectures about the pattern that could possibly be used for future
problem solving. The conjectures about the pattern in the three GCN tasks directed
students’ attention to their underlying mathematical structures, which is the work that
would not have been successful had the students been working on individual task. The
ability to identify the pattern also can facilitate students’ reification of the GCN tasks into
an object (Sfard, 1991) on which they could draw when dealing with a more complex
GCN tasks or GP tasks and more possibly manage the work.
The set up of a sequence of mathematical tasks can be accomplished by changing
the elements of the tasks (e.g., different angle measures in a similar diagram
128
configuration) (e.g., Bell, 1993). However, the analysis shows that Nancy did not do so.
Rather, she carefully made the GCN task diagram more complex to sustain or increase
the level of cognitive demand of the tasks. In this regard, students could not directly
apply the experiences gained by solving the first GCN task diagram to obtain the
solutions of the second and the third high-demand tasks. This kind of teaching that
consistently maintains the cognitive demand can enable more learning to occur (Hiebert
& Wearne, 1993; Stein & Lane, 1996; Stigler & Hiebert, 2004; Tarr et al., 2008) and
possibly prevent shallow learning that occurs when students apply the superficial visual
associations of the diagram to guess the answers to the GCN tasks without understanding
(Aleven, Koedinger, Sinclair, & Snyder, 1998).
Sustaining or increasing the cognitive demand of the tasks in a classroom may
also unfortunately mean that some students cannot solve the problems because they are
too challenging. To address this potential problem, Nancy used different instructional
strategies to help all students participate in reasoning through challenging tasks. For
example, Nancy had students work in cooperative learning groups (Schoen, Cebulla, Finn,
& Fi, 2003) and used peer discussion to facilitate learning. Furthermore, when students
could not identify the pattern, Nancy re-labeled the measures and used mathematical
discovery to scaffold students’ work to produce the pattern. These efforts created a
classroom environment that allowed Nancy to foster and monitor high-level learning by
setting the bar high and expecting students to reach it.
In addition, the sequence of GCN tasks with different diagram configurations also
enhances students’ ability to make the generalizations from the pattern in one task to that
of other tasks. The pattern in the GCN task described here can be applied more broadly
129
than to just the geometric diagram settings as a pair of parallel lines with two segments in
between. Although the instruction did not discuss the extent to which the derived pattern
can be generalized, the classroom discussion did potentially provide students learning
opportunities to do so to any number of angles formed by segments with two parallel
lines.
Use of Gestures to Facilitate Student Learning
The analysis of Episode Two further shows how Nancy used different types of
gestures to facilitate students’ learning without lowering cognitive level of the task. As a
semiotic mediator (Arzarello & Paola, 2007), Nancy’s use of gestures scaffolded students
mentally operating the diagrams, and enhancing their ability to recognize the congruence
of the two quadrilaterals and relevant embedded geometric properties. The interplay
between gestures and the diagram functioned as an informal proof for proving the
congruence of the two quadrilaterals and activated relevant geometric properties. The
activation of these geometric properties, Nancy expected, could help students infer other
geometric properties and recognize that auxiliary lines are necessary to obtain a solution.
In particular, this study shows the gesturing scaffold did not lower the cognitive demand
level of the task, because students themselves had to work on recognizing the need to
draw auxiliary lines on the diagram and retrieving sufficient geometric properties
embedded in the diagram to obtain solutions.
This analysis of gestures is particularly important because it reveals how
instructional intervention focusing on the use of non-verbal communication can possibly
sustain the cognitive demand of tasks and facilitate learning, especially in the classroom
in East Asian countries classrooms, which usually are described as teacher-centered

130
because mathematics teachers in East Asian countries often talk more than students
(Leung, 2002; 2005). Most studies have concentrated on investigating the routines in
activity types such as reviewing previous lessons, teacher demonstrations, whole-class
discussion, as well as student group or seat work (Fwu & Wang, 2006; Hiebert et al.,
2003; Lemke, 1990; Shimizu, 2009; Stigler & Hiebert, 1999). This study, however,
proposes an alternative approach to understanding teaching and learning in the classroom
in Taiwan by observing the use of gestures, which is a type of embodied cognition
sources that can construct mathematical meaning for students (Nemirovsky & Ferrara,
2009; Roth & Thom, 2009).
In addition, as the teaching in East Asian countries is often examination-driven,
the analysis of a non-verbal communication way also suggests caution about focusing
only on verbal utterances to understand the instructional practice of Asian teachers. Using
non-verbal communication by teachers in East Asian countries’ classrooms may also
influence students’ learning. For example, as students frequently work on tests, it is
possible that a mathematics teacher can diagnose students’ misconceptions by evaluating
their responses to tests items and then use classroom lectures to help students understand
the misconceptions. It is also possible that a skillful mathematics teacher can identify
students’ facial expressions to know if students follow the lectures and understand the
mathematics without the need for any verbal communication. While classroom teachers
may use non-verbal communications to facilitate students’ learning, students in teacher-
centered and examination-oriented classroom may also learn mathematics that cannot be
identified by only examining the verbal communication between teacher and students.
For example, it can be the case that students learn mathematics by practicing abundant

131
mathematical tasks and evaluate their learning by checking the answers to the tasks. In
this regard, the students do not need to participate in classroom discussion. When they
have problems regarding the challenging tasks, the can listen to classroom lectures to
obtain the solutions. These possibilities all can make learning occur in a teacher-centered
and examination-driven classroom in East Asian countries, and should be carefully
considered in interpreting and understanding the differences in students’ performance in
cross-national comparisons.

132
REFERENCES
Aleven, V., Koedinger, K., Sinclair, H., & Snyder, J. (1998). Combatting shallow
learning in a tutor for geometry problem solving. Paper presented at the intelligent tutoring systems: Fourth International Conference, ITS '98, Berlin.
Arzarello, F., & Paola, D. (2007). Semiotic games: The role of the teacher. In J. H. Woo, H. C. Lew, K. S. Park, & D. Y. Seo (Eds.), Proceedings of the 31
st Conference of
the International Group for the Psychology of Mathematics Education (vol. 2, pp. 17-24). Seoul, Korea.
Bell, A. (1993). Principles for the design of teaching. Educational Studies in Mathematics,
24(1), 5-34.
Boaler, J., & Staples, M. (2008). Creating mathematical futures through an equitable teaching approach: The case of Railside school. Teachers College Record, 110(3), 608-645.
Brousseau, G. (1997). Theory of didactical situations in mathematics: Didactique des
mathématiques, 1970-1990. Dordrecht: The Netherlands: Kluwer Academic Publishers.
Chen, C.-L., & Herbst, P. (2007). The interplay among gestures, discourse and diagrams
in students' geometrical reasoning. Paper presented at the 29th PME-NA. Lake Tahoe, NV.
Doyle, W. (1983). Academic work. Review of Educational Research, 53(2), 159-199.
Doyle, W. (1988). Work in mathematics classes: The context of students' thinking during instruction. Educational Psychologist, 23(2), 167-180.
Duval, R. (1995). Geometrical pictures: Kinds of representation and specific processings. In R. Sutherland & J. Mason (Eds.), Exploiting mental imagery with computers in
mathematics education (pp. 142-157). Berlin: Springer.
Erickson, F. (2004). Talk and social theory: Ecologies of speaking and listening in
everyday life. Cambridge: Polity Press.
Erickson, F. (2006). Definition and analysis of data from videotape: Some research procedures and their rationales. In J. Green, G. Camilli & P. Ellmore (Eds.), Handbook of complimentary methods in education research (pp. 177-191). Mahwah, NJ: Lawrence Erlbaum Associates.
Fwu, B.-J., & Wang, H.-H. (2006). Practice makes perfect on the blackboard: A cultural analysis of mathematics instructional patterns in Taiwan. ZDM-The International
Journal on Mathematics Education, 38(5), 368-375.
Henningsen, M., & Stein, M. (1997). Mathematical tasks and student cognition: Classroom-based factors that support and inhibit high-level mathematical thinking and reasoning. Journal for Research in Mathematics Education, 28(5), 524-549.
Herbst, P. (2003). Using novel tasks in teaching mathematics: Three tensions affecting the work of the teacher. American Educational Research Journal, 40(1), 197-238.

133
Herbst, P. (2006). Teaching geometry with problems: Negotiating instructional situations and mathematics tasks. Journal for Research in Mathematics Education, 37(4), 313-347.
Hiebert, J., Gallimore, R., Garnier, H., Givvin, K., Hollingsworth, H., Jacobs, J., et al. (2003). Teaching mathematics in seven countries. Washington: National Center for Education Statistics.
Hiebert, J., & Wearne, D. (1993). Instructional tasks, classroom discourse, and students' learning in second-grade arithmetic. American Educational Research Journal,
30(2), 393-425.
Hsu, H.-Y. (2007). Geometric calculations are more than calculations. In J. H. Woo, H. C. Lew, K. S. Park, & D. Y. Seo (Eds.), Proceedings of the 31
st Conference of the
International Group for the Psychology of Mathematics Education (vol. 3, pp. 57-64). Seoul, Korea.
Hsu, H.-Y. (2008). Learning opportunity of reasoning: The interplay between gestures
and diagrammatic properties. Paper presented at the 11th ICME, Monterrey, Mexico.
Huang, R., & Li, Y. (2009). Pursuing excellence in mathematics classroom instruction through exemplary lesson development in China: A case study. ZDM-The
International Journal on Mathematics Education, 41(3), 297-309.
Johnstone, B. (2002). Discourse Analysis. Malden, MA: Blackwell.
Kaur, B. (2009). Characteristics of good mathematics teaching in Singapore grade 8 classrooms: A Juxtaposition of teachers' practice and students' perception. ZDM-
The International Journal on Mathematics Education, 41(3), 333-347.
Krainer, K. (1993). Powerful tasks: A contribution to a high level of acting and reflecting in mathematics instruction. Educational Studies in Mathematics, 24(1), 65-93.
Lakoff, G., & Núnez, R. (Eds.). (2000). Where mathematics comes from: How the
embodied mind brings mathematics into being. New York: Basic Books.
Lampert, M. (2001). Teaching problems and the problems of teaching. New Haven: Yale University Press.
Lemke, J. (1990). Talking science: Language, learning, and values. Westport: Ablex Publishing Corporation.
Leung, F. K. S. (2002). In search of an East Asian identity in mathematics education. Educational Studies in Mathematics, 47, 35-51.
Leung, F. K. S. (2005). Some characteristics of East Asian mathematics classrooms based on data from the TIMSS video study. Educational Studies in Mathematics, 60, 199-215.
Lin, F.-L., & Tsao, L.-C. (1999). Exam math re-examined. In C. Hoyles, C. Morgan & G. Woodhouse (Eds.), Rethinking mathematics curriculum (pp. 228-239). London: Falmer Press.

134
Lin, P.-J., & Li, Y.-P. (2009). Searching for good mathematics instruction at primary school level valued in Taiwan. ZDM-The International Journal on Mathematics
Education, 41(3), 363-378.
Ma, L. (1999). Knowing and teaching elementary mathematics. Mahwah, New Jersey: Lawrence Erlbaum Associates Inc.
Maschietto, M., & Bussi, M. G. B. (2009). Working with artefacts: Gestures, drawings and speech in the construction of the mathematical meaning of the visual pyramid. Educational Studies in Mathematics, 70, 143-157.
McNeill, D. (1992). Hand and mind: What gestures reveal about thought. Chicago: University of Chicago Press.
Merriam, S. B. (1998). Qualitative research and case study applications in education. San Francisco, CA: Jossey-Bass.
Mok, I. A. C. (2009). In search of an exemplary mathematics lesson in Hong Kong: An algebra lesson on factorization of polynomials. ZDM-The International Journal
on Mathematics Education, 41, 319-332.
NCTM. (2000). Principles and Standards for School Mathematics. Reston, VA: National Council of Teachers of Mathematics.
Nemirovsky, R., & Ferrara, F. (2009). Mathematical imagination and embodied cognition. Educational Studies in Mathematics, 70, 159-174.
Pang, J. S. (2009). Good mathematics instruction in South Korea. ZDM, 41(3), 349-362.
Pozzer-Ardenghi, L., & Roth, W.-M. (2005). Photographs in lectures: Gestures as meaning-making resources. Linguistics and Education, 15, 275-293.
Radford, L. (2003). Gestures, speech, and the sprouting of signs: A semiotic-cultural approach to students' types of generalization. Mathematical Thinking and
Learning, 5(1), 37-70.
Radford, L. (2009). Why do gestures matter? Sensuous cognition and the palpability of mathematical meanings. Educational Studies in Mathematics, 70, 111-126.
Roth, W.-M. (2001). Gestures: Their role in teaching and learning. Review of Educational
Research, 71(3), 365-392.
Roth, W.-M. (2002). From action to discourse: The bridging function of gestures. Cognitive Systems Research, 3, 535-554.
Roth, W.-M., & Lawless, D. V. (2002). Signs, deixis, and the emergences of scientific explanation. Semiotica, 138(1), 95-130.
Roth, W.-M., & Thom, J. S. (2009). Bodily experience and mathematical conceptions: From classical views to a phenomenological reconceptualization. Educational
Studies in Mathematics, 70, 175-189.
Sabena, C. (2004). The role of gestures in conceptualisation: An exploratory study on the
integral function. Paper presented at the International Group for the Psychology of Mathematics Education.

135
Schoen, H., Cebulla, K., Finn, K., & Fi, C. (2003). Teacher variables that relate to student achievement when using a standard-based curriculum. Journal for Research in
Mathematics Education, 34(3), 228-259.
Sfard, A. (1991). On the dual nature of mathematical conceptions: Reflections on processes and objects as different sides of the same coin. Educational Studies in
Mathematics, 22, 1-36.
Shimizu, Y. (2009). Characterizing exemplary mathematics instruction in Japanese classrooms from the learner's perspective. ZDM-The International Journal on
Mathematics Education, 41(3), 311-318.
Silver, E. (2009). Cross-national comparisons of mathematics curriculum materials: What might we learn? ZDM-The International Journal on Mathematics Education, 41, 827-832.
Silver, E., & Stein, M. (1996). The Quasar project: The "revolution of the possible" in mathematics instructional reform in urban middle schools. Urban Education,
30(4), 476-521.
Simon, M., & Tzur, R. (2004). Explicating the role of mathematical tasks in conceptual learning: An elaboration of the hypothetical learning trajectory. Mathematical
Thinking and Learning, 6(2), 91-104.
Stein, M., Grover, B., & Henningsen, M. (1996). Building student capacity for mathematical thinking and reasoning: An analysis of mathematical tasks used in reform classrooms. American Educational Research Journal, 33, 455-488.
Stein, M., & Lane, S. (1996). Instructional tasks and the development of student capacity to think and reason: An analysis of the relationship between teaching and learning in a reform mathematics project. Educational Reacher and Evaluation, 2, 50-80.
Stein, M., & Smith, M. (1998). Mathematical tasks as a framework for reflection: From research to practice. Mathematics Teaching in the Middle School, 3, 268-275.
Stein, M., Smith, M., Henningsen, M., & Silver, E. (2000). Implementing standards-
based mathematics instruction: A casebook for professional development. New York, NY: Teachers College Press.
Stigler, J., Gallimore, R., & Hiebert, J. (2000). Using video surveys to compare classrooms and teaching across cultures: Examples and lessons from the TIMSS video studies. Educational Psychologist, 35(2), 87-100.
Stigler, J., & Hiebert, J. (1999). The teaching gap: Best ideas from the world's teachers
for improving education in the classroom. New York: Free Press.
Stigler, J., & Hiebert, J. (2004). Improving mathematics teaching. Educational
Leadership, 61(5), 12-16.
Tarr, J., Reys, R., Reys, B., Chavez, O., Shih, J., & Osterlind, S. (2008). The impact of middle-grades mathematics curricula and the classroom learning environment on student achievement. Journal for Research in Mathematics Education, 39, 247-280.

136
Thibault, P. (2000). The multimodal transcription of a television advertisement: Theory and practice. In A. Baldry (Ed.), Multimodality and multimediality in the distance
learning age (pp. 311-384). Campobasso: Palladino Editore.
van Boxtel, C., van der Linden, J., & Kanselaar, G. (2000). Collaborative learning tasks and the elaboration of conceptual knowledge. Learning and Instruction, 10, 311-330.
Williams, J. (2009). Embodied multi-modal communication from the perspective of activity theory. Educational Studies in Mathematics, 70, 201-210.
Yang, Y. (2009). How a Chinese teacher improved classroom teaching in Teaching Research Group: A case study on Pythagoras theorem teaching in Shanghai ZDM-
The International Journal on Mathematics Education, 41(3), 279-296.

137
Appendix 3.1
Solution to the GCN Task Analyzed in Episode One
Table 3.2 Solution Steps with geometric reasons to GCN task in Table 3.1 Step Calculating sentences Geometric reasons
Step 1 AD//BC Opposite sides of a rectangles are parallel because rectangle is a parallelogram
Step 2 ∠A=∠B=∠C=∠D=90˚ Interior angles in a rectangle are 90˚ Step 3 AB=ES=8 cm The distance between two parallel lines is
constant. Step 4 AB=TG=8 cm The distance between two parallel lines is
constant. Step 5 ∠EGB=∠GED=45˚ The alternate interior angles property Step 6 ∠TGE=180˚-90˚-45˚=45˚ Angle sum property of a triangle Step 7 TG=ET=8 cm Property of an isosceles triangle Step 8 EG=8 2 cm The Pythagorean Theorem Step 9 ∠AEA’=180˚-45˚=135˚ Property of linear pair Step 10 ∠AEF=∠A’EF=67.5˚ Symmetry property Step 11 ∠EFG=∠AEF=67.5˚ The alternate interior angles property Step 12 EG=GF=8 2 cm Properties of isosceles triangle Step 13 Area of ΔEFG=32 2 cm 2 Triangle area formula
The minimum number of solution steps proposed in the above table is established
on the basis of the drawing of two auxiliary lines, as shown in Figure 3.3. A total of 13
reasoning steps are required in this solution. The first step is to infer AD//BB on the basis
of the property that “opposite sides of a rectangle are parallel because rectangle is a
parallelogram.” Step Two is to infer that the four interior angles of the rectangle are all
90˚. Based on the first reasoning step that AD//BC, the third step can deduce that
AB=ES=8 cm using the property “the distance between two parallel lines is constant.”
The fourth step is to infer TG=8 applying the same geometric property as the third step
does. The fifth step further deduces ∠EGB=∠GED=45˚ on the basis of the alternate
interior angles property and Step Six reasons ∠TGE=45˚ on the basis of the angle sum
138
property of a triangle. Step Seven further infers TG=ET=8 cm based on the property of an
isosceles triangle. Step Eight can conclude EG=8 2 cm because of the Pythagorean
Theorem. Next, one can infer ∠AEA’= 135˚ using the property of linear pairs. Step Ten
further reasons ∠AEF=˚A’EF=67.5˚ because of the symmetry property that results from
the folding action described in the givens. Step Eleven infer EG=GF=8 2 cm on the
basis of an isosceles triangle property. Finally, the area of ΔEFG=32 2 cm 2 can be
concluded on the basis of triangle area formula.
139
CHAPTER FOUR
CONCEPTUALIZATION OF THE RELATIONSHIP BETWEEN GEOMETRIC
CALCULATION WITH NUMBER (GCN) AND GEOMETRIC PROOF (GP)
Introduction
The value of teaching and learning proof at the secondary school level has been a
matter of some disagreement in the field. On the one hand, some scholars have argued
that proof and mathematical reasoning are fundamental to knowing and using
mathematics and have claimed that even elementary students are capable of constructing
a proof with the appropriate scaffolding (Ball & Bass, 2003; Maher & Martino, 1996;
Stylianides, 2007; Zack, 1999). In line with this view the National Council of Teachers of
Mathematics (2000) has identified proof and reasoning as an essential topic to be taught
across all grade levels, and, as such, a central goal of mathematics education. On the
other hand, the teaching of proof is often resisted by teachers and students who relegate it
to a less important role in mathematics curriculum, because of challenges in teaching and
learning of this topic not only in the U.S. but also in other countries with a tradition of
teaching proof in the secondary curriculum (Chazan, 1993; Harel & Sowder, 1998;
Mariotti, 2006). Mariotti (2006) highlights the concern of the idea of “proof for all”
wondering whether

140
“these words26 would have been possible only a few years ago, and still now the idea of “proof for all” claimed in the quotation is not a view that most teachers hold, even in countries where there is a longstanding tradition of including proof in the curriculum. I’m thinking of my country, Italy, but also, as far as I know, France or Japan. In fact, the main difficulties encountered by most students have led many teachers to abandon this practice and prompted passionate debate amongst math educators” (Mariotti, 2006, p. 173).
When geometry proof is viewed as a difficult topic for middle school students,
many attractive alternative options have been proposed (e.g., making reasonable
conjectures; Herbst, 2006). One of such options can be geometric calculation with
number (GCN), which generally involves numerical calculations within a mental or
physical geometric diagram (e.g., calculating angle measures in a triangle by applying
angle sum property) (Aleven, Koedinger, Sinclair, & Synder, 1998; Ayres & Sweller,
1990; Chinnapan, 2000; Lulu Healy & Celia Hoyles, 1998; Küchemann & Hoyles, 2002).
GCN is an attractive alternative because it can provide opportunities for students to
become familiar with and apply geometric properties, one of the aims in the secondary
geometry curriculum (Schumann & Green, 2000). In this regard, the major link between
GCN and GP seems to be the application of geometric properties. Another benefit of
GCN comes from the perspective of cognitive development. The use of GCN to practice
geometric properties aligns well with children’s development of the concept of geometry
and space. As Piaget, Inhelder, and Szeminska (1960) indicated, children at the
elementary school level are capable of performing calculating tasks by applying
26 [these words] refers to the citation from NCTM “Reasoning and proof are not special activities reserved for special times or special topics in the curriculum but should be a natural, ongoing part of classroom discussions, no matter what topic is being studied (NCTM, 2000, p. 342).

141
geometric properties (e.g., size of angle, length of distance) and using calculation as a
way to envisage the truth and validity of mathematics.
A more comprehensive theory specifying the relationship between proof and
calculation is the three mathematics worlds model proposed by Tall and his colleagues
(Tall, 2002; 2006a; 2006b; 2007). In this theory, calculation and proof are treated as two
different mathematics worlds, each of which has its own way of thinking of and operating
on mathematical objects as well as developing the standards of validity and mathematical
truth. Even though Tall and his colleagues establish the theory by recognizing the
conceptual and abstract entity that a calculation can possess because calculations are both
the problem-solving actions and the thinking over these actions (Gray & Tall, 1994), Tall
and his colleagues only treat calculation as a pre-stage of learning formal proof. This is
because calculation can be a generic example contributing to the understanding of
mathematical definition in the formal mathematics world. Regarding the development of
geometry through the three mathematical worlds, Tall anchors van Hiele’s theory (Tall,
2002; 2004), emphasizing that the operation of Euclidean proofs and theorems as well as
the description of these geometric properties in the embodiment world can lead students
to the understanding of mathematical formal proof and the relations among geometric
properties.
Although Tall and his colleagues propose this theory to reveal the relations
between calculation and proof in general as two different mathematics systems where
calculations are treated as a pre-stage of learning formal proofs, they do not particularly
deal with the relations between GCN and GP, nor the role that a geometric diagram can
play in influencing the relations. Nor does the theory proposed by van Hiele (Fuys,
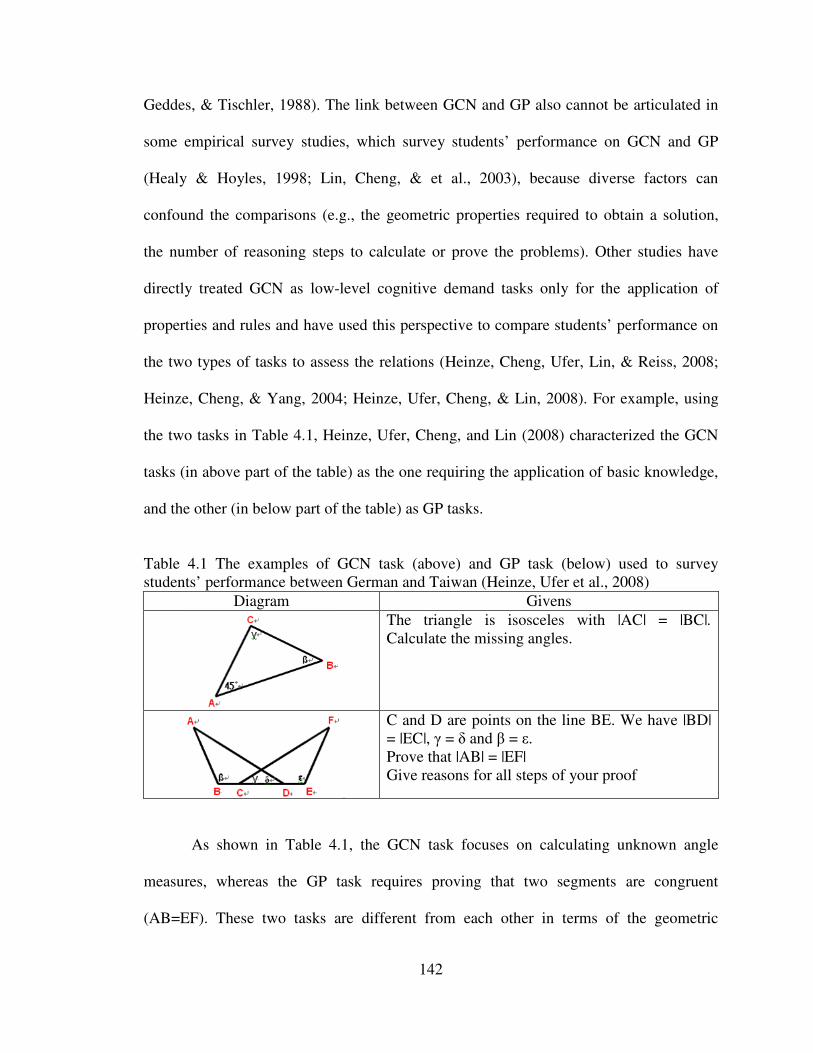
142
Geddes, & Tischler, 1988). The link between GCN and GP also cannot be articulated in
some empirical survey studies, which survey students’ performance on GCN and GP
(Healy & Hoyles, 1998; Lin, Cheng, & et al., 2003), because diverse factors can
confound the comparisons (e.g., the geometric properties required to obtain a solution,
the number of reasoning steps to calculate or prove the problems). Other studies have
directly treated GCN as low-level cognitive demand tasks only for the application of
properties and rules and have used this perspective to compare students’ performance on
the two types of tasks to assess the relations (Heinze, Cheng, Ufer, Lin, & Reiss, 2008;
Heinze, Cheng, & Yang, 2004; Heinze, Ufer, Cheng, & Lin, 2008). For example, using
the two tasks in Table 4.1, Heinze, Ufer, Cheng, and Lin (2008) characterized the GCN
tasks (in above part of the table) as the one requiring the application of basic knowledge,
and the other (in below part of the table) as GP tasks.
Table 4.1 The examples of GCN task (above) and GP task (below) used to survey students’ performance between German and Taiwan (Heinze, Ufer et al., 2008)
Diagram Givens
The triangle is isosceles with |AC| = |BC|. Calculate the missing angles.
C and D are points on the line BE. We have |BD| = |EC|, γ = δ and β = ε. Prove that |AB| = |EF| Give reasons for all steps of your proof
As shown in Table 4.1, the GCN task focuses on calculating unknown angle
measures, whereas the GP task requires proving that two segments are congruent
(AB=EF). These two tasks are different from each other in terms of the geometric

143
properties needed to obtain the solutions, diagram visualization demands, and the number
of proving or calculating steps. Solving the GCN task requires the triangle angle sum
property and the properties related to an isosceles triangle to find the measures, whereas
solving the GP task necessitates the use of the Angle-Side-Angle triangle congruence
postulate to prove the conclusion. The visualization demands also differ between the two
tasks. Proving the GP task requires one to recognize the sub-constructs (two overlapping
triangles) in the given diagram, the work of which work can be more demanding than that
needed to identify the diagram in the GCN task as an isosceles triangle. Moreover, the
reasoning steps required to generate the solution in each of the two tasks are also
different. For the GCN task, each of the unknowns can be inferred by applying a
geometric property (e.g., measure of ∠ABC can be obtained by using isosceles triangle
property). For the GP task multiple reasoning steps are needed: (1) steps of finding the
needed conditional statements to conclude that two overlapping triangles are congruent;
and (2) step of applying the result of congruent triangles to infer that segment AB = EF.
However, considering GCN as tasks of lower-level cognitive-demand ignores the
complexity and particularity a task can be (Stein, Smith, Henningsen, & Silver, 2000),
and may underestimate the link between both types of tasks. For instance, using the tasks
in Table 4.1 as examples again, we see that a one-step GCN may be much easier to solve
than constructing a multiple-step GP not because of their differences in task format, but
because of the cognitive demand as determined by the number of reasoning steps needed
to generate a solution. Thus, using only simple applications of basic knowledge to
characterize GCN tasks as low demanding tasks, we may fail to see the relationship
between GCN and GP. The argument proposed in this study is that the link between GCN
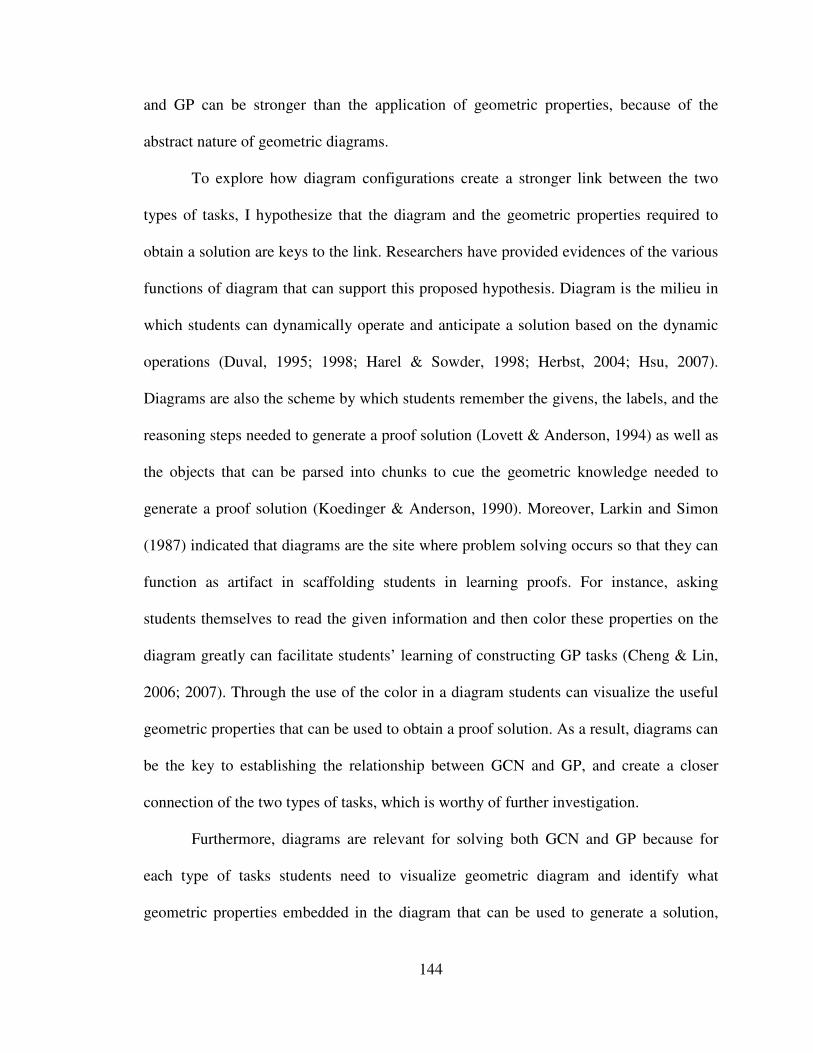
144
and GP can be stronger than the application of geometric properties, because of the
abstract nature of geometric diagrams.
To explore how diagram configurations create a stronger link between the two
types of tasks, I hypothesize that the diagram and the geometric properties required to
obtain a solution are keys to the link. Researchers have provided evidences of the various
functions of diagram that can support this proposed hypothesis. Diagram is the milieu in
which students can dynamically operate and anticipate a solution based on the dynamic
operations (Duval, 1995; 1998; Harel & Sowder, 1998; Herbst, 2004; Hsu, 2007).
Diagrams are also the scheme by which students remember the givens, the labels, and the
reasoning steps needed to generate a proof solution (Lovett & Anderson, 1994) as well as
the objects that can be parsed into chunks to cue the geometric knowledge needed to
generate a proof solution (Koedinger & Anderson, 1990). Moreover, Larkin and Simon
(1987) indicated that diagrams are the site where problem solving occurs so that they can
function as artifact in scaffolding students in learning proofs. For instance, asking
students themselves to read the given information and then color these properties on the
diagram greatly can facilitate students’ learning of constructing GP tasks (Cheng & Lin,
2006; 2007). Through the use of the color in a diagram students can visualize the useful
geometric properties that can be used to obtain a proof solution. As a result, diagrams can
be the key to establishing the relationship between GCN and GP, and create a closer
connection of the two types of tasks, which is worthy of further investigation.
Furthermore, diagrams are relevant for solving both GCN and GP because for
each type of tasks students need to visualize geometric diagram and identify what
geometric properties embedded in the diagram that can be used to generate a solution,

145
aligned with the concept of descriptive mode proposed by Herbst (2004). However,
recognizing geometric properties had been reported as one of the main difficulties in
learning geometry (Duval, 1995; Fischbein & Nachlieli, 1998; Zykova, 1975).
Given that geometric diagrams are common to both GCN and GP and geometric
properties needed to obtain a solution, this study investigates the following research
question:
To what extent is GCN similar to GP when controlling the diagram configurations and
requirements of geometric properties necessary for a solution?
Theoretical Comparison between GCN and GP
The relationship between GCN and GP is roughly analogous to the distinction
between a problem to find and a problem to prove (Pólya, 1945). In his seminal book,
How to solve it, Pólya explicates the differences between the two kinds of problems from
three perspectives: the aim of the problem, the principals, and the actions taken during the
problem-solving process. In relation to the aims, Polya states that
“The aim of a problem to find is to find a certain object, the unknown of the problem…The aim of a problem to prove is to show conclusively that a certain clearly stated assertion is true, or else to show that it is false.” (Polya, 1945, p. 154)
Accordingly, when GCN is viewed as a problem to find, GCN and GP have quite
different aims. Specifically, GCN viewed from this perspective is directed at finding
certain answers to a problem, whereas GP involves proving or disproving statements.
This key difference in aims also impacts the nature of the inferences one can make from
the problems. For instance, GP allows generalization to all cases that satisfy a given

146
statement. GCN, on the other hand, is limited to only a particular instance of a problem,
lacking the power to generalize to all cases.
Considering the second perspective, the principals, Polya asserts that the
principals for a problem to prove are the hypothesis and the conclusion, whereas the
principals for a problem to find are the data, the unknowns, and the conditions. To better
understand the differences in the principals for GP and GCN, the following examples are
useful here. A GP statement can be formulated as an if-then statement “if one of the
angles of a parallelogram is 90˚, then the parallelogram is a rectangle.” In this statement,
the hypothesis is a conditional statement starting with “if” and the conclusion is the
second part starting with “then.” The if-then formulation provides students guidance for
organizing proving steps into a logic sequence. An example of a GCN can be to calculate
the measure for ∠A in a triangle ABC given that the measures for ∠B and ∠C are 50˚
and 70˚, respectively. An analysis of the principals for this GCN reveals that the data are
the measures for ∠B and ∠C and the unknown is the measure for ∠A. The condition is
the connection between the data and the unknown, which in this task is the angle sum
property for a triangle. By applying the angle sum property, students can connect the
relationship between the data and the unknown, and determine the answer to this task.
The discussion so far has shown that GCN and GP are quite different in terms of
the aims and principals. However, with regard to the third perspective, actions taken
during the problem-solving process, the two types of tasks are similar, especially when
the diagram configurations and the geometric properties required to obtain solutions are
controlled. To explain the similarity in the problem-solving actions for the two types of
tasks, a pair of GCN and GP tasks is presented.

147
Table 4.2 GP (above) and GCN (below) with the same diagram configurations and the same requirements of geometric properties for obtain a solution
The given diagram The written givens
Triangle ABC in which AB and AC are the same lengths. Construct a line through point A so that the line is parallel to BC and the bisectors of angle B and angle C intersect the line at point D and point E. Prove AE=AC
Triangle ABC in which AB and AC are the same lengths. Construct a line through point A so that the line is parallel to BC and the bisectors of angle B and angle C intersect the line at point D and point E. If AC=6 cm, measure of A∠ CB=75˚. Find (1) the length of AE (2) Find the measure of AEC.∠
As Table 4.2 displays that the diagrams attached to the GCN and GP tasks are the
same. The written givens in the two tasks all specify the construction of diagrams which
implicitly reveal what geometric properties can be used to generate a solution. For
example, the sentence, “construct a line through point A that is parallel to BC,” implies
that segments ED and BC are parallel. The major difference in the two task is that the GP
provides a to-be-proved statement, whereas the GCN offers the angle and segment
measures and indicates what unknowns need to be found.
To further illustrate the similarities between GCN and GP, the concept of a plan
tree is used to outline the actions regarding the knowledge structure needed during the
problem-solving process. Plan tree have its basis in ACT-R theory and has been defined
by Anderson et al. (1981) as “an outline for actions” (p. 193) that is generated based on
the logically separate stages. Using geometry proofs as the subject content to explain the

148
thinking mechanisms of a plan tree, Anderson et al. describe stages as a set of geometric
rules that allow students to move from the givens of the task through intermediate levels
of statements to the to-be-proved statements. The plan tree for proof is the knowledge
structure generated by unpacking various links of relevant knowledge and re-organizing
these links and knowledge into a logic sequence. This process results in reasoning
solution paths that usually involve forward and backward searches. In a forward search,
students must search from the givens to find sets of solution paths that can yield the to-
be-proven statements. In a backward search, students also have to infer from the to-be-
proven statements that may be related to the givens. The process of forward and
backward reasoning gradually maps out a path containing relevant geometric knowledge
that can connect and fit with both the givens and the conclusion statements.
To solve the GCN and prove the GP, given that multiple strategies can be applied
to generate solutions, the plan trees in Figure 4.1 demonstrate one strategy with the same
geometric properties that can be used to obtain the solutions for the two tasks.
GP GCN
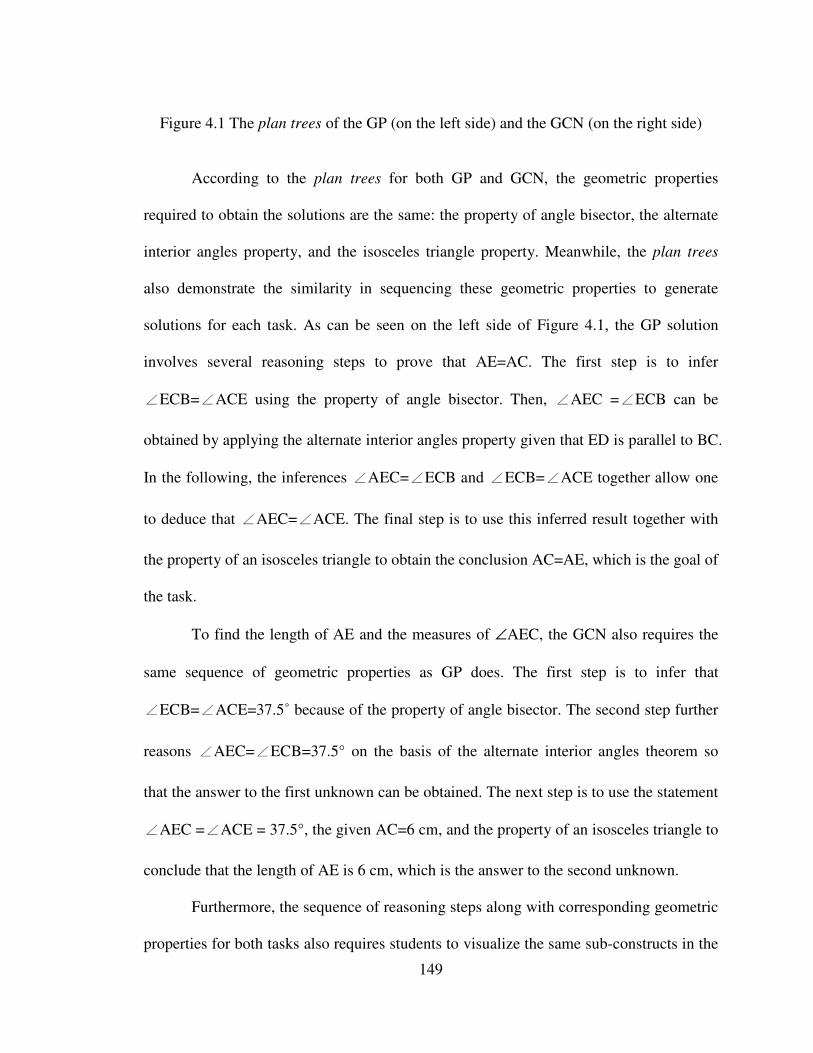
149
Figure 4.1 The plan trees of the GP (on the left side) and the GCN (on the right side)
According to the plan trees for both GP and GCN, the geometric properties
required to obtain the solutions are the same: the property of angle bisector, the alternate
interior angles property, and the isosceles triangle property. Meanwhile, the plan trees
also demonstrate the similarity in sequencing these geometric properties to generate
solutions for each task. As can be seen on the left side of Figure 4.1, the GP solution
involves several reasoning steps to prove that AE=AC. The first step is to infer
∠ECB=∠ACE using the property of angle bisector. Then, ∠AEC =∠ECB can be
obtained by applying the alternate interior angles property given that ED is parallel to BC.
In the following, the inferences ∠AEC=∠ECB and ∠ECB=∠ACE together allow one
to deduce that ∠AEC=∠ACE. The final step is to use this inferred result together with
the property of an isosceles triangle to obtain the conclusion AC=AE, which is the goal of
the task.
To find the length of AE and the measures of ∠AEC, the GCN also requires the
same sequence of geometric properties as GP does. The first step is to infer that
∠ECB=∠ACE=37.5˚ because of the property of angle bisector. The second step further
reasons ∠AEC=∠ECB=37.5° on the basis of the alternate interior angles theorem so
that the answer to the first unknown can be obtained. The next step is to use the statement
∠AEC =∠ACE = 37.5°, the given AC=6 cm, and the property of an isosceles triangle to
conclude that the length of AE is 6 cm, which is the answer to the second unknown.
Furthermore, the sequence of reasoning steps along with corresponding geometric
properties for both tasks also requires students to visualize the same sub-constructs in the

150
given diagram. Table 4.3 summarizes the steps together with the description of
visualizing the sub-constructs of the given diagram and identifying the relevant geometric
properties necessary to obtain solutions for the two tasks.
Table 4.3 The process of visualizing sub-constructs of the diagram for corresponding geometric properties
Steps with description of visualizing the diagram Sub-construct in the diagram Step One: Identify ∠ACB with its two sub-angles (∠ACE and ∠ECB) and infer that ∠ACE=∠ECB because EC is an angle bisector.
Step Two: Identify lines ED, BC, and transversal EC and then infer that ∠AEC=∠ECB because of ED//BC and the alternate interior angles property.
Step Three: Identify Δ AEC and infer that AE=AC because of the property of isosceles triangle and the inferred result ∠AEC=∠ACE.
Here students need to identify and infer from the diagram: (1) the bottom ∠ACB
in the ΔABC and its relation to segment EC; (2) the relationship among the parallel lines
ED, BC, and its transversal EC; and (3) the ΔAEC associated with ∠AEC and ∠ACE as
well as segments AE and AC.
In sum, this section demonstrates that GCN and GP are similar to each other in
terms of the actions taken during the problem-solving process, especially in relation to
the actions of visualizing the sub-constructs in the diagram to retrieve relevant geometric
properties. This analysis is consistent with the observation Kuchemann and Holyes (2002)
who noted that the skills used to solve a GCN are also necessary to construct a GP

151
because each step in a GCN involves a deduction. The analytical analysis shown above
further elaborates the similarities in reasoning steps for both GP and GCN tasks and how
these steps are strongly associated with the geometric diagram as well as the geometric
properties necessary to obtain the solutions for both types of tasks.
Methods
The study investigates the extent to which GCN is similar to GP when controlling
the diagram configurations and the requirements of geometric properties necessary for a
solution. To this end, I conducted a study to examine whether students’ performance on
GCN and GP is more dependent on variations in the format (proving or calculation), or
on students’ ability to visualize the diagram in such a way that allows them to retrieve the
geometric properties necessary for a solution.
Rationale for Survey Design
Four pairs of GCN and GP items (see Appendix 4.1) were designed for the survey.
To explore the visualization of the given diagram that may influence students’
performance, a total of five criteria are considered in designing the items. The first
criterion for designing the items is to control the configurations of diagram used in the
items. Each pair of GCN and GP items in the survey employs the same diagram
configurations, in which the labels are located in the same places, and both the size and
orientation presented in the survey are identical. The second criterion has to do with the
requirements of the geometric properties necessary to obtain a solution. Since a task
usually can be solved by employing different solution strategies with different sets of
geometric properties, the use of identical diagrams in a pair of GCN and GP items

152
provide students the same opportunity to visualize the sub-constructs in the diagram
along with corresponding geometric properties that can be used to obtain a solution.
Table 4.4 Pair 1 items included in the survey Given diagram GCN item GP item
ΔABC in which AC=BC and BCD is collinear. If the measure of ∠ACD is 130˚, find the measure of ∠ABC.
ΔABC in which AC=BC and BCD is collinear. Prove ∠ACD=2∠ABC
Taking the items in Table 4.4 as an example, we see that solutions to both GCN
and GP items can be obtained by applying two sets of geometric properties. The first set
includes the triangle sum property, the property of a linear pair, and the isosceles triangle
property, and the second set contains the exterior angle property and the isosceles triangle
property.
The third criterion in the survey design is to manage the sequence of the
geometric properties in the solutions for a pair of GCN and GP items. If the diagrams are
identical, the study can control how geometric properties embedded in the diagram are
retrieved sequentially to obtain a solution.

153
GCN GP
Figure 4.2 The plan trees of the Pair 1 GCN (left side) and GP (right side) items
Figure 4.2 shows the solution structure in the plan trees for both GCN and GP
items, in which geometric properties necessary to obtain the solutions appear in the same
sequence. According to the plan trees, students first apply the property of linear pairs and
the triangle sum property to infer that ∠ACD=∠ABC+∠BAC. Next, students use the
isosceles triangle property to obtain the answer to the GCN item, which is 65˚, and to
prove the statement that ∠ACD=2∠ABC. Sequencing the geometric properties in the
same order for obtaining the solutions for the pairs of GCN and GP items can ensure that
student’s attention is directed to the same sub-constructs in the diagram, thus imposing
the same cognitive demand on students when they work on the pairs of the items.
The fourth criterion in designing the survey items is to include different geometric
diagrams for different pairs of GCN and GP items. While individual pairs of items differ
in terms of diagram configuration and the geometric properties needed to obtain a

154
solution, this study can prevent a confounding variable from being generated because of
students’ prior experiences working in a similar diagram setting.
In order to further probe how the given geometric diagram may influence
students’ performance on GCN and GP items, the fifth criterion is to design Pair 1 and
Pair 4 items27 so that their given diagrams can be further compared. The two pairs of
items are designed to be similar in terms of the application of the same sets of geometric
properties to obtain solutions. The major difference in the two pairs of items is the given
diagrams. The given diagram in Pair 1 items is simpler than that in Pair 4 items. Figure
4.3 details the procedure used to make the Pair 4 diagrams more complex in comparison
to the Pair 1 diagrams. This process includes adding two auxiliary segments, changing
the measures of the angles and sides, and rotating the diagram to a new orientation.
Pair 1 diagram Adding a segment Adding another segment
Changing the measures Rotating the diagram (Pair 4 diagram)
Figure 4.3 Procedure of complicating Pair 1 diagram into Pair 4 diagram
27 I particularly arranged the Pair 1 in the beginning of the survey and the Pair 4 as the final items that students need to solve. Doing so is to minimize the influence caused by students’ experiences in solving the Pair 1 items on their performance of solving Pair 4 items.

155
The major consideration leading to the decision of how to add greater complexity
from Pair 1 to Pair 4 is based on pilot study results. The pilot study included two pairs of
items (see Table 4.5) in which the givens for GCN and GP items as well as the geometric
properties necessary to obtain solutions were identical. The only difference in the two
pairs of GCN and GP items was the diagram configurations. Specifically, as shown in
Table 4.5, the diagrams used in both pairs of items were identical except for segment AE
added to Pair 2 diagrams. The statistical analysis from the pilot study showed no
significant differences in the performance of 9th grade students on the Pair 1 and Pair 2
items for both types of tasks (for GCN: z=.735, p>.05; for GP: z=.925, p>.05).
Table 4.5 Pairs of items with diagrams designed in the pilot study Diagram configurations GCN givens GP givens Pair 1
D
C
B
A
Pair 2
D
C
B
A
E
ABC is collinear and BD=BC. If the measure of ∠ABD is 76˚, find the measure of ∠BDC=_____.
ABC is collinear and BD=BC. Prove ∠ABD=2∠BDC
Although the pilot study was not rigorously designed in terms of the procedures to
administer the items to students and the sample size (about 60 students solved each pair
of items), which may weaken the interpretation of the results, the pilot study does raise
two concerns with respect to the diagram configurations accompanying the items. The
first concern is that adding only one segment to the diagram in Pair 2 items may not
prevent students from recognizing the sub-constructs of the diagram and the

156
corresponding geometric properties as they did when solving Pair 1 items. Thus, there
was no significant difference in students’ performance between the two pairs of items.
This result is consistent with a subsequent research question. To what extent can the
diagram complexity influence students’ performance on each type of task when
controlling the geometric properties necessary to obtain solutions? This research question
also leads to the decision of complicating the diagram in the Pair 4 items in the formal
survey, as shown in Figure 4.3.
The second concern in designing the task items is that the similarity of the givens
in GCN and GP items may also become a confounding variable in interpreting the results.
While the givens for both pairs of GCN and GP items are identical, practice on Pair 1
items should contribute to students’ ability to figure out the solutions for Pair 4 items.
To address the limitations in the pilot study as a result of the added of one
segment, the diagrams used in Pair 4 items in the formal survey were made more
complex than those used in Pair 1 by total adding two segments, rotating the diagram
position, and changing the given measures. In doing so, this study aims to confirm that
the diagram complexity does influence students’ performance on GCN and GP.
Regarding the investigation of the extent to which the diagram complexity may influence
students’ ability to identify the relevant geometric properties in diagram configurations is
beyond the scope of this dissertation. The main concern here is whether the addition of
segments, which will increase the diagram complexity in terms of creating new sub-
diagram configurations and new geometric properties embedded in the diagram, may
prevent students from recognizing the correct diagram configurations to guess the correct
geometric properties to obtain a solution.

157
According to these criteria and concerns in designing the GCN and GP items in
the survey, this study investigates the extent to which GCN is similar to GP when
controlling the diagram configurations and the requirements of the geometric properties
necessary for a solution.
Survey Structure
Four pairs of GCN and GP items are included in the survey. Each item in the
survey asks students to complete three sections, including writing down each proving or
calculating step, labeling the given diagrams to indicate what actions with respect to
geometric property that was worked, and providing geometric properties as reasons to
support each calculating or proving step. An example of how to complete the item (see
Appendix 4.3) is also given in the survey. Collecting information on how students label
their problem-solving process on the diagrams as well as on the geometric reasons for
each calculating or proving step can benefit this study by revealing students’ visualization
of the given diagram regarding the geometric properties needed for solutions.
Furthermore, requiring students to complete these two sections on the survey also
provides insights into how the superficial visual associations of the diagrams (Aleven et
al., 1998) may influence student performance on answering both GCN and GP items.
Survey Procedure
This study employed two survey procedures to administer the items to students.
As it is unclear how students experiences with GP items may influence their performance
on the paired GCN items and vice versa, the use of different survey procedures can
contribute to examining the influence of working on GCN items before or after working
on GP items. For example, in Pair 1 items (see Table 4.4) students can calculate the
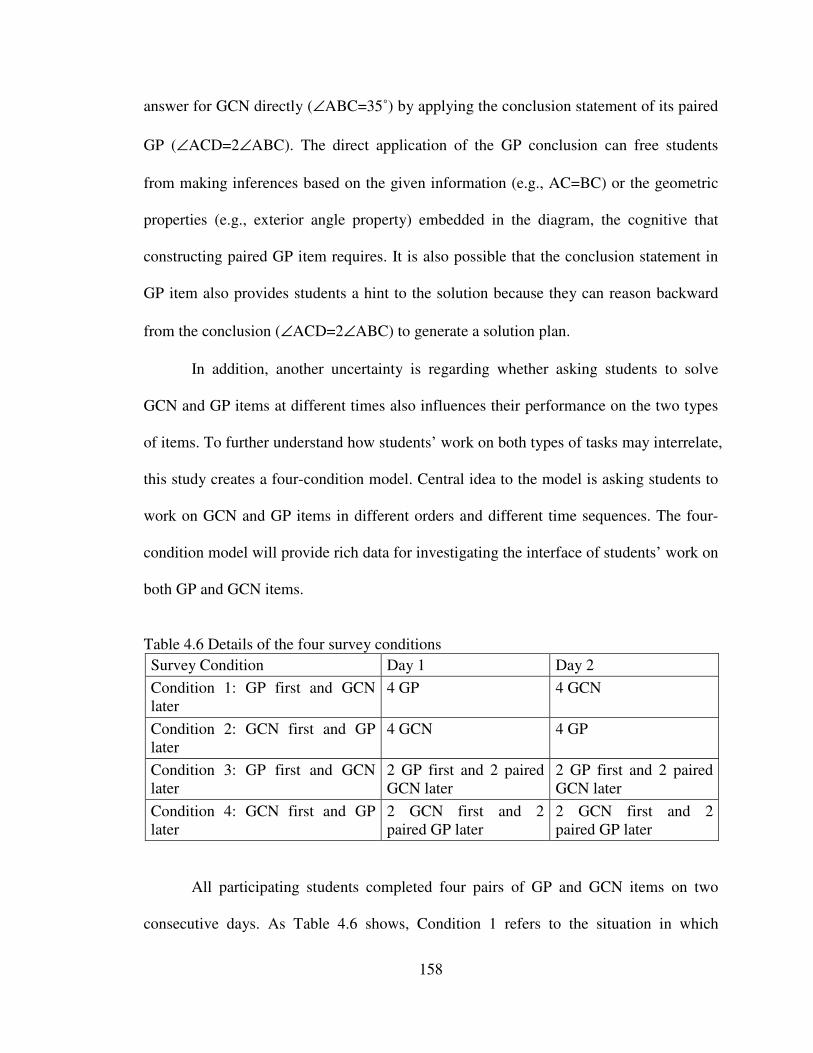
158
answer for GCN directly (∠ABC=35˚) by applying the conclusion statement of its paired
GP (∠ACD=2∠ABC). The direct application of the GP conclusion can free students
from making inferences based on the given information (e.g., AC=BC) or the geometric
properties (e.g., exterior angle property) embedded in the diagram, the cognitive that
constructing paired GP item requires. It is also possible that the conclusion statement in
GP item also provides students a hint to the solution because they can reason backward
from the conclusion (∠ACD=2∠ABC) to generate a solution plan.
In addition, another uncertainty is regarding whether asking students to solve
GCN and GP items at different times also influences their performance on the two types
of items. To further understand how students’ work on both types of tasks may interrelate,
this study creates a four-condition model. Central idea to the model is asking students to
work on GCN and GP items in different orders and different time sequences. The four-
condition model will provide rich data for investigating the interface of students’ work on
both GP and GCN items.
Table 4.6 Details of the four survey conditions Survey Condition Day 1 Day 2
Condition 1: GP first and GCN later
4 GP 4 GCN
Condition 2: GCN first and GP later
4 GCN 4 GP
Condition 3: GP first and GCN later
2 GP first and 2 paired GCN later
2 GP first and 2 paired GCN later
Condition 4: GCN first and GP later
2 GCN first and 2 paired GP later
2 GCN first and 2 paired GP later
All participating students completed four pairs of GP and GCN items on two
consecutive days. As Table 4.6 shows, Condition 1 refers to the situation in which

159
students solved all four GP items on Day 1 and solved paired GCN items on Day 2.
Opposite to Condition 1, Condition 2 asked students to solve GCN items on Day 1 and
paired GP items on Day 2. For Condition 3, students were required to solve two GP items
first and then two paired GCN items on Day 1. These students worked on another two
pairs of items in the same way on Day 2. Condition 4 is also opposite to Condition 3 and
asked students to work on two GCN items first and then two paired GP items on Day 1 as
well as the other two pairs of GCN and GP items in the same sequence on Day 2.
Because of the study design, Condition 1 and Condition 2 allow a direct comparison of
order effects (GP before or after GCN), and Condition 3 and Condition 4 also allow a
comparison of the same order effect. In addition, conditions 1 and 3, as well as conditions
2 and 4, also allow a direct comparison of timing effects (i.e., paired GP/GCN items
solved close in terms of time versus separated by one day).
Students were not informed that they needed to work on GCN or GP items on
Day 2 when they worked the items on Day 1. Students were also not allowed to revise
their previous work while they worked on the paired items. Before formally surveying the
items, students were well informed about how to work on the items in survey.
Student Sample and Procedure to Answer the Survey Items
8th and 9th grade students from Taiwan participated in this study. By selecting
these two grades of students, this study can compare how students’ experiences in
learning GP may influence their performance on solving GCN and GP items. 8th grade
students in Taiwan do not have to learn how to construct GP but 9th graders do. The
Taiwanese curriculum standard of mathematics introduces mostly geometry content in 8th
grade and 9th grade. In the 8th grade, the curriculum standard uses the geometric content
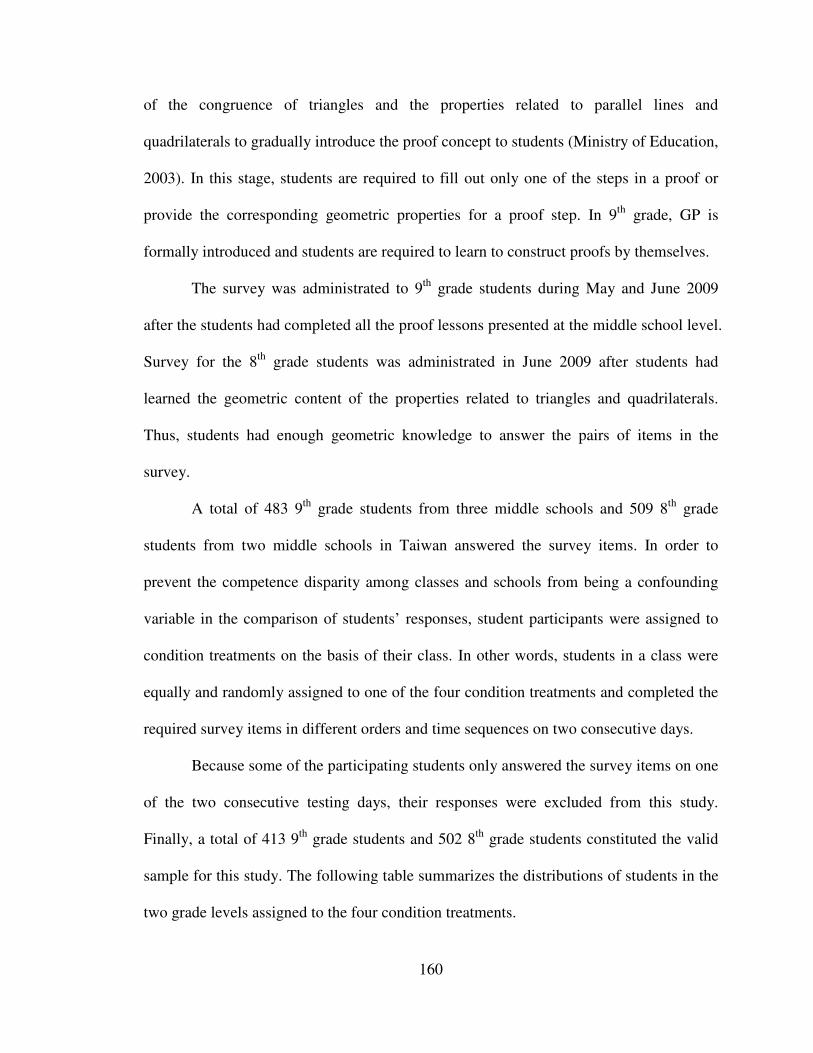
160
of the congruence of triangles and the properties related to parallel lines and
quadrilaterals to gradually introduce the proof concept to students (Ministry of Education,
2003). In this stage, students are required to fill out only one of the steps in a proof or
provide the corresponding geometric properties for a proof step. In 9th grade, GP is
formally introduced and students are required to learn to construct proofs by themselves.
The survey was administrated to 9th grade students during May and June 2009
after the students had completed all the proof lessons presented at the middle school level.
Survey for the 8th grade students was administrated in June 2009 after students had
learned the geometric content of the properties related to triangles and quadrilaterals.
Thus, students had enough geometric knowledge to answer the pairs of items in the
survey.
A total of 483 9th grade students from three middle schools and 509 8th grade
students from two middle schools in Taiwan answered the survey items. In order to
prevent the competence disparity among classes and schools from being a confounding
variable in the comparison of students’ responses, student participants were assigned to
condition treatments on the basis of their class. In other words, students in a class were
equally and randomly assigned to one of the four condition treatments and completed the
required survey items in different orders and time sequences on two consecutive days.
Because some of the participating students only answered the survey items on one
of the two consecutive testing days, their responses were excluded from this study.
Finally, a total of 413 9th grade students and 502 8th grade students constituted the valid
sample for this study. The following table summarizes the distributions of students in the
two grade levels assigned to the four condition treatments.

161
Table 4.7 Distributions of students in two grade levels assigned to condition treatments
9th grade 8th grade Number of students
Condition 1: GP first and GCN later (separated a day)
100 124 224
Condition 2: GCN first and GP later (separated a day)
103 122 225
Condition 3: GP first and GCN later (solved at a close proximity)
107 128 235
Condition 4: GCN first and GP later (solved at a close proximity)
103 128 231
Total number of students 413 502 915
Coding Scheme Used to Analyzed the Response on the GCN and GP Items
An elaborated coding scheme developed by Cheng and Lin (2005; 2006) was
employed to evaluate students’ responses on GP items. In the scheme, Cheng and Lin
categorized students’ responses on GP on the basis of crucial geometric properties that
are necessary to obtain a proof solution. They proposed four levels in describing student
performance on constructing GP items: acceptable proof, incomplete proof, improper
proof, and intuitive responses. Their clarification in relation to geometric properties
necessary to generate proof solution is aligned with the study, which aims to explore how
the geometric properties embedded in diagram configurations can determine student
performance on GCN and GP. In order to compare GCN and GP items, levels of
students’ responses on the GCN items in correspondence with these on the GP items were
established (see Appendix 4.4) in the following manner: correct calculation with reasons,
incomplete calculation, improper calculation, and intuitive response.
In addition, researchers have reported that students are better at providing
numerical answers than articulating the geometric properties as reasons for their

162
calculations because they can rely on the superficial visual associations of geometric
diagrams as a way to guess answers in GCN items (Aleven et al., 1998; Ayres & Sweller,
1990). This study also assesses the influence of superficial visual associations of
geometric diagrams in guessing GCN answers by analyzing the percentages of students
who can obtain correct answer in each of the five coding levels. The analysis can
contribute to (1) understanding students’ use of superficial visual associations of diagram
in relation to their ability to identify the geometric properties necessary to obtain the
solutions; and to (2) examine if the use of superficial visual associations of diagrams to
guess the answers of GCN is task-dependent. If guessing numerical answers to GCN
items is task-dependent, it may bring up a follow-up research question: is it possible for
certain GCN tasks in which students can not rely on superficial visual associations of
diagrams to obtain the correct numerical answers? Although investigating this research
question is beyond the scope of this study, it should be carefully considered as one of key
factors in outlining the relationship between GCN and GP. Moreover, as proof is often
regarded as a hard topic (Chazan, 1993; Cheng & Lin, 2005; 2006; 2008; Harel &
Sowder, 1998; Heinze, Cheng, & Yang, 2004; Senk, 1989; Weber, 2002), this study also
investigates the percentages of students who did not provide any response to the GCN
and GP items respectively.
To analyze students’ overall performance on the four pairs of items, points for the
categories in the coding framework were assigned for the statistical purposes. The
criterion to determining the points to students’ responses is aligned with the proposed
hypothesis: diagram and geometric properties necessary to obtain solutions are keys to
students’ performance on GCN and GP items. In this regard, the better ability to visualize

163
the geometric properties from the diagrams and then use these geometric properties to
generate a solution, the more points that students can obtain. If students could not
recognize any geometric properties in the diagram, even though they can provide some
intuitive responses to the GCN and GP items, they still can’t get any point. As a result,
three points were assigned to responses consisting of an acceptable proof or a correct
calculation with reasons. Two points were given to responses coded as an incomplete
proof or incomplete calculation. One point was assigned to responses coded as “improper
proofs or improper calculations”. Students who provided intuitive responses or did not
answer the survey items received no points.
The statistical methods applied to analyze students’ performance on GCN and GP
items included descriptive analysis, independent-samples T-tests, paired-samples T-tests,
correlation tests, Chi-square tests, and nonparametric related-samples tests. Furthermore,
this study also applied a grounded-theory approach to investigate students’ error
responses on both types of items. The analysis focused on students’ written responses
including calculating or proving sentences, labels or re-drawing on the given diagram
configurations, and geometric properties used to support the corresponding calculating or
proving sentence. The in-depth qualitative analysis can reveal how students visualize the
diagram configurations and identify the corresponding geometric properties needed for
their solutions as well as the connection between diagram visualization and identification
of geometric properties.
List of Sub-research Questions for the Study
To explore the extent to which GCN can be similar to GP when controlling the
diagram configurations and the geometric properties necessary to obtain a solution, this

164
study implemented a survey study. The goal is to investigate students’ performance on
the designed four pairs of GCN and GP items and to evaluate if increasing the complexity
of the diagram configurations impacts students’ performance on both types of items.
Selecting two grade levels of students participating in this study also provides the data
source to examine students’ experiences of learning proofs in influencing their
performance on both types of tasks. While it is unclear how students’ experiences in
solving the pairs of GCN and GP items in survey relates their performances on both types
of items, two survey procedures and two ways to solve the GCN and GP items in
different times are also examined.
In addition, this study explores how students rely on superficial visual
associations of diagrams to guess the GCN answers by means of comparing the
percentages between correct calculations only and correct calculation with reasons. As
GP is often viewed as a difficult topic, this study also checks the percentages of students
who did not provide an answer between the GCN and GP items. Finally, the qualitative
analysis of students’ error responses related to the diagram and geometric properties
needed for solutions can provide rich information in conceptualizing the relationship
between GCN and GP.
The following summarizes sub-research questions examined in this study.
1. When controlling the given geometric diagrams and the geometric properties
required to obtain a solution, do students perform differently on the GCN and GP
items?
2. If the geometric properties necessary to obtain solutions are identical, do different
diagram shapes influence students’ performance on the GCN and GP items?

165
3. When their performance on the GCN and GP items is compared, do students at
different grade levels perform differently?
4. Do the survey procedures (GCN before or after GP) influence students’ performance
on the GCN and GP items?
5. Do the timing effects (GCN/GP solved close in terms of time vs. separated by one day)
influence students’ performance on the GCN and GP items?
6. Do the percentages of students who provide correct answers with reasons differ from
those of students who provide correct answers only in GCN items? If so, what are the
distributions of students, who can obtain correct answers, in relation to the four
coding categories?
7. Do the percentages of students who did not provide any responses differ between the
GCN and GP items?
8. What types of error responses in relation to diagram configurations and
corresponding geometric properties can be found?
Findings
Comparison between GCN and GP Items
As shown in Table 4.8, the mean score on GCN items for both grades of students
is 6.33 and the mean score on GP items is 6.03. The difference in the mean scores of the
two types of items is statistically significant (t= -4.508, p<.05). This finding shows that
GCN items are easier for students than GP items when controlling the given diagrams
and the requirements of geometric properties for solutions in the survey.
Table 4.8 Comparison of students’ performance on GCN and GP in general

166
T test and P value Mean Mean Difference Std. Error Mean T df Sig. GCN 6.33 GP 6.03
-.305 .068 -4.508 914 .000*
*: A significant difference at the .05 level
A closer examination of the responses of students in each grade reveals a different
result. Table 4.9 shows that the difference in the mean scores of GCN items and GP items
for 8th grade are still significant (GCN=6.05, GP=5.65, t=-4.289, p<.05). However,
different from that for 8th grade, the results for 9th grade students are not significantly
different for both types of items (GCN=6.68, GP=6.49, t= -1.945; p>.05).
Table 4.9 Comparison of GCN and GP responses between two grade levels
T tests and p values
Mean Mean
difference Std. Error Deviation
T df Sig.
GCN 6.05 8th grade
GP 5.65 -.398 .093 -4.289 501 .000*
GCN 6.68 9th grade
GP 6.49 -.191 .098 -1.945 412 .052
*: A significant difference at the .05 level
Figure 4.4 provides a graph of the difference in the mean scores of GCN and GP
items for the two grade levels. As shown in the figure, the mean difference for 8th grade is
much greater than that for 9th grade. Although for 9th grade students the mean score of the
GCN items is still slightly higher than that of GP items, the statistical result confirms that
the GCN and GP tasks impose the same level of cognitive demand on 9th students. In
other words, for 9th grade students, the given diagram and the requirements of geometric
properties for the solutions are the key to determining their performance on both types of

167
tasks as opposed to the difference in the format between a calculation task and a proof
task.
6.686.496.055.655.05.25.45.65.86.06.26.46.66.87.0
8th grade 9th grade
Mea
n S
core
GC
GP
Figure 4.4 Mean scores of GCN and GP for both grades The results from correlation analysis also show that students’ performance on the
GCN items is highly related to that on the GP items. The coefficients (see Table 4.10) for
both grades together, 8th grade, and 9th grade are 0.874, 0.864, and 0.884 respectively, all
of which lead to the conclusion that students’ GCN item responses are significantly
dependent on GP items. The correlation results also indicate the size of the effect of this
dependence is large (Cohen, 1988; 1992).
Table 4.10 Correlation analysis on GCN and GP for both grades together, 8th grade, and 9th grade
Correlation tests and p values Pearson correlation Sig.
Both grades .874 .000*
8th grade .864 .000*
9th grade .884 .000*
*: A significant different at the .05 level

168
Comparison on Individual Pair Items
This study also investigates students’ responses on each pair of items. This was
done to determine whether students’ performance varied depending on the task setting,
especially for the items included in the survey that also vary in terms of the diagram
composition and the requirements of geometric properties.
The first step here is to check the dependency between GCN and GP items for
two grade levels by applying a chi-square test method.
Table 4.11 Chi-square tests and p values of comparing GCN and GP items for two grades
χ 2 values and p value in parenthesis Pair 1 Pair 2 Pair 3 Pair 4
8th grade 435.189 (.000*)
522.365 (.000*)
606.766 (.000*)
353.861 (.000*)
9th grade 327.145 (.000*)
487.845 (.000*)
529.080 (.000*)
388.530 (.000*)
*: A significant difference at the .05 level
As revealed by the results in Table 4.11, student performance in each grade on the
GCN items is significantly dependent to its paired GP items. For 8th grade, the values of
χ 2 test for the four pairs of items all result in statistical significances at the .05 level. For
9th grade students, the values of χ 2 test also cause significances at the .05 level for the
four pairs of items.
After recognizing student performance on GCN and GP items are significantly
dependent, the second step is to analyze whether students’ performance differs
significantly for individual pair of GCN and GP items. Table 4.12 demonstrates that 8th
grade students performance on GCN items of Pair 1, Pair 2, and Pair 4 was significantly
better than that on the paired GP items (Z=-2.150, p<.05 for Pair 1; Z=-3.305, p<.05 for

169
Pair 2; Z=-3.651, p<.05 for Pair 4). For Pair 3, 8th grade students’ performance was not
significantly different between the two types of tasks.
Opposed to the results of 8th grade students, 9th graders performed no significant
differences in GCN and GP items for all four pairs of items.
Table 4.12 Paired-samples tests and p values for individual pair of items for two grade levels
Paired-samples tests and p values 8th grade 9th grade Mean Z value Sig. Mean Z value Sig.
GCN 1.81 1.89 Pair 1 GP 1.71
-2.150 .032* 1.82
-1.230 .219
GCN 1.47 1.67 Pair 2 GP 1.35
-3.305 .001* 1.60
-1.819 .069
GCN 1.13 1.35 Pair 3 GP 1.14
-.248 .804 1.38
-.941 .347
GCN 1.64 1.78 Pair 4 GP 1.45
-3.651 .000* 1.69
-1.850 .064
*: A significant difference at the .05 level
Comparison of Students’ Responses Between Pair 1 and Pair 4 Items
In order to further investigate how a geometric diagram impacts student
performance on GCN and GP items, the study designed two pairs of items, Pair 1 and
Pair 4, in both which the geometric properties necessary for solutions are parallel, but the
diagrams given in the two pairs of GCN and GP items are different.
As Table 4.13 shows, students in each grade performed significantly better on
Pair 1 items than on Pair 4 items. For 8th grade students, the mean scores for GCN (1.85)
and GP (1.76) for Pair 1 are higher than the mean scores for GCN (1.76) and GP (1.56)
for Pair 4. This finding is statistically significant (Z= -4.175, p<.05 for GCN items; Z=-
7.155, p<.05 for GP items). A similar result can be found for 9th grade students; for this

170
group the mean scores for GCN (1.81) and GP (1.71) for Pair 1 are greater than that for
GCN (1.64) and GP (1.45) for Pair 4 items. This finding is also statistically significant
(Z=-3.570, p<.05 for GCN; Z=-6.653, p<.05 for GP). Figure 4.5 provides two graphs
showing the differences in mean scores for both types of items in Pair 1 and Pair 4. The
above findings confirm that the given diagrams do influence students’ performance on
GCN and GP items, even though the sequence of the geometric properties necessary to
obtain a solution are in the same order.
Table 4.13 Related-samples tests for comparing on Pair 1 and Pair 4 items
Related-sample Z tests and p values Mean value Z value Sig.
Pair 1 GCN 1.81 Pair 4 GCN 1.64
-3.570 .000*
Pair 1 GP 1.71 8th grade
Pair 4 GP 1.45 -6.653 .000*
Pair 1 GCN 1.89 Pair 4 GCN 1.78
-2.274 .023*
Pair 1 GP 1.82 9th grade
Pair 4 GP 1.69 -3.242 .001*
*: A significant difference at the .05 level
8th grade 1.711.81 1.451.641.01.11.21.31.41.51.61.71.81.9
GC GP
Mea
n S
core
Pair 1
Pair 4
9th grade 1.821.89 1.691.781.01.11.21.31.41.51.61.71.81.92.0
GC GP
Mea
n S
core
Pair 1
Pair 4
Figure 4.5 Mean scores for Pair 1 and Pair 4 items

171
Comparison between Two Grade Levels
Table 4.14 shows that the mean difference in 8th grade and 9th grade students’
scores on GCN items is -.631, which causes a significance (t= -3.019, p<.05). The mean
difference in GP performance between the two grades is -.838, which is also statistically
significant (t= -2.451, p<.05). The results indicate that 9th grade students performed
significantly better than 8th grade students did for both GCN items and GP items. Figure
4.6 is a graph showing the significant differences between both grade levels for GCN and
GP items.
Table 4.14 T tests for comparing grade differences for GCN and GP items
T tests and p values
Mean
difference Std. Error Difference T df Sig.
8th grade GCN
9th grade -.631 .278 -3.019 913 .003*
8th grade GP
9th grade -.838 .257 -2.451 913 .014*
*: A significant difference at the .05 level
5.656.056.68 6.495.05.25.45.65.86.06.26.46.66.87.0
GC GP
Mea
n S
core
8th grade
9th grade
Figure 4.6 Mean scores for 8th grade and 9th grade on GCN and GP items

172
Comparison between Two Survey Procedures
As it is unclear if the order of GCN and GP items in which students solve
problems influences their performance on the two types of tasks, this study examines two
survey procedures (GCN first or after GP) on students performance on both types of
items. Illustrated in Table 4.15, for GCN items the mean score for the procedure that
students solved GCN first and GP later is 6.06, whereas the mean score when GP was
solved first and GCN later is 6.61. The mean difference in GCN scores in relation to the
two survey treatments is significant (t=2.156, p<.05). In other words, the experience of
proving GP items does influence students’ performance on solving paired GCN items.
For GP items, the means score for the procedure when students solved GCN first is 6.08,
whereas the mean score of GP when students solved GP first is 5.98. The mean
difference in GP item scores in the two survey procedures is not statistically significant
(t= -.339, p>.05). Thus, the experience of solving GCN items first does not influence
student performance on proving the paired GP items.
Table 4.15 T tests for comparing survey procedures on GCN and GP items
T tests and p values
Mean Std. Error
Differences t df Sig. GCN first GP later 6.06
GCN GP first GCN after 6.61
.278 2.156 913 .031 a
GCN first GP later 6.08 GP
GP first GCN later 5.98 .257 -.339 913 .734
*a: A significant difference at the .05 level
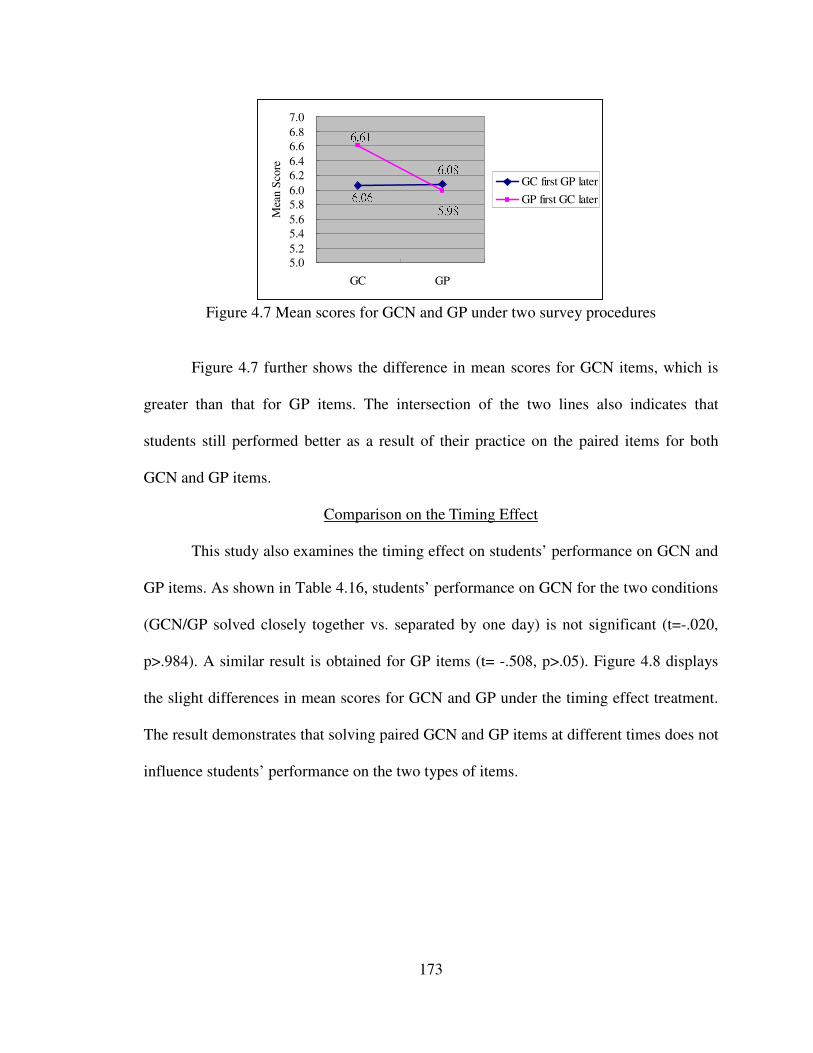
173
6.06 6.086.61 5.985.05.25.45.65.86.06.26.46.66.87.0
GC GPM
ean
Sco
re
GC first GP later
GP first GC later
Figure 4.7 Mean scores for GCN and GP under two survey procedures
Figure 4.7 further shows the difference in mean scores for GCN items, which is
greater than that for GP items. The intersection of the two lines also indicates that
students still performed better as a result of their practice on the paired items for both
GCN and GP items.
Comparison on the Timing Effect
This study also examines the timing effect on students’ performance on GCN and
GP items. As shown in Table 4.16, students’ performance on GCN for the two conditions
(GCN/GP solved closely together vs. separated by one day) is not significant (t=-.020,
p>.984). A similar result is obtained for GP items (t= -.508, p>.05). Figure 4.8 displays
the slight differences in mean scores for GCN and GP under the timing effect treatment.
The result demonstrates that solving paired GCN and GP items at different times does not
influence students’ performance on the two types of items.

174
Table 4.16 T tests for comparing the timing effect T tests and p values
Mean
Std. Error Differences t Df Sig.
A close proximity 6.34 GCN
Separated by one day 6.33 .255 -.020 913 .984
A close proximity 6.10 GP
Separated by one day 5.96 .278 -.508 913 .612
6.34 6.106.33 5.96
5.05.25.45.65.86.06.26.46.66.87.0
GC GP
Mean Score A close proximity
Separated by oneday
Figure 4.8 Mean scores for two time arrangement conditions
Comparison between Correct Calculations and Correct Calculation with Reasons
Another aim of this study is to understand how superficial visual associations of
the diagram plays a role in influencing student perception to obtain the numerical
answers without understanding what geometric properties account for the numerical
answers. To achieve this aim, this study compares the differences between percentages of
students who can obtain correct calculations and that of students who can obtain both
correct calculations and geometric reasons.
Table 4.17 summarizes the percentages of correct calculation and correct
calculation with reasons for each GCN item. The table shows that the percentages of
obtaining correct answers are much higher than those of finding correct answers with
supportive reasons. For Pair-1 GCN item, the percentage of students who can

175
successfully obtain correct calculations is 73.7%, whereas that of correct calculation with
reasons is 45.2%. For Pair-2 GCN item, the percentage of correct calculations is 70.1%
and for correct calculations with reasons the percentage is 29.1%. For Pair-3 GCN item,
even though the percentages are relatively lower than those for the other three pairs,
52.9% of students did obtain correct answers but only 13.7% of students could articulate
their corresponding reasons. For Pair-4 GCN item, 68.9% students found the correct
answers, but only 40.4% probed the corresponding geometric properties. Figure 4.9
provides a graph showing the performance differences in the percentages of correct
calculation and those of correct calculation with reasons.
Table 4.17 Percentages of correct calculation and correct calculation with reasons
Pair 1 Pair 2 Pair 3 Pair 4 Correct calculation 73.7% 70.1% 52.9% 68.9%
Correct calculation with reasons 45.2% 29.1% 13.7% 40.4%
68.9%59.2%70.1%73.7%45.2% 29.1% 40.4%13.7%
0%
20%
40%
60%
80%
100%
Pair 1 Pair 2 Pair 3 Pair 4
Per
cent
Correct calculation
Correct calculationwith reasons
Figure 4.9 Percentage of correct calculation and correct calculation with reasons
The distributions of students who provided correct answers within the five coding
categories were also analyzed. The goal here is to (1) understand what is meant by
superficial visual associations in the geometric diagram with relation to the crucial

176
geometric properties required for a solution; and to (2) investigate if using superficial
visual associations to guess the answers of GCN is task-dependent. Table 4.18
summarizes the distributions of the percentages of students providing correct answers
among the five coding categories. Figure 4.10 also provides bar charts of the distributions
for the four GCN items.
Table 4.18 Percentages of correct calculations within the five coding categories
Pair 1 Pair 2 Pair 3 Pair 4 Correct calculations with reasons 61.4% 41.5% 25.8% 58.7%
Incomplete calculation 17.2% 29.2% 32.6% 17.8%
Improper calculation 15.7% 18.6% 37.6% 18.4%
Intuitive response 5.6% 10.8% 3.9% 5.1%
No response 0% 0% 0% 0%
Total 100 100 100 100 Intuitive responsesImproper calculationsIncomplete calculationsCorrect calculations with reasons
PercentPercentPercentPercent100806040200GC1GC1GC1GC1
Intuitive responsesImproper calculationsIncomplete calculationsCorrect calculations with reasonsPercentPercentPercentPercent100806040200
GC2GC2GC2GC2
Intuitive responsesImproper calculationsIncomplete calculationsCorrect calculations with reasonsPercentPercentPercentPercent100806040200
GC3GC3GC3GC3Intuitive responsesImproper calculationsIncomplete calculationsCorrect calculations with reasons
PercentPercentPercentPercent100806040200GC4GC4GC4GC4
Figure 4.10 Distributions of correct calculation

177
Several observations can be made from the above table and bar charts. First of all,
students who could guess the correct answers, but could not articulate the correct
geometric properties underlying their calculations are distributed among the three coding
categories: incomplete calculations, improper calculations, and intuitive responses. The
distributions show that students may, on the one hand, use superficial association of
diagram to guess the answer (e.g., quantities of segments look equal), but, on the other
hand, also are able to retrieve some geometric properties embedded in the diagram
although these properties may not contribute to the solution generations. For example,
student answers coded as “improper calculation” revealed that students could visualize
the diagram configurations to retrieve some geometric properties correctly, but these
geometric properties do not contribute to solution generation.
Secondly, the distributions shown in Figure 4.10 differ among the four GCN
items. This finding implies that using the superficial visual associations of diagrams as an
approach to guess the answer is task-dependent. This result may be attributable to the
specific characteristics of diagrams which can prompt students’ different superficial
connections between the given diagrams and the answers to the items as well as the
design of the tasks. Thirdly, for GCN1, GCN2, and GCN4 students who could obtain the
correct answer and could also recognize the geometric properties necessary for solutions
occupy the highest percentages among five categories (61.4% for GCN1, 41.5% for
GCN2, 58.7% for GCN 4). However, this is not the case for GCN 3 item. The highest
percentage of students obtaining correct answers is located in the category of improper
calculations, the situation in which students did not figure out the geometric properties
were necessary to obtain the GCN solutions. The final observation made from Figure
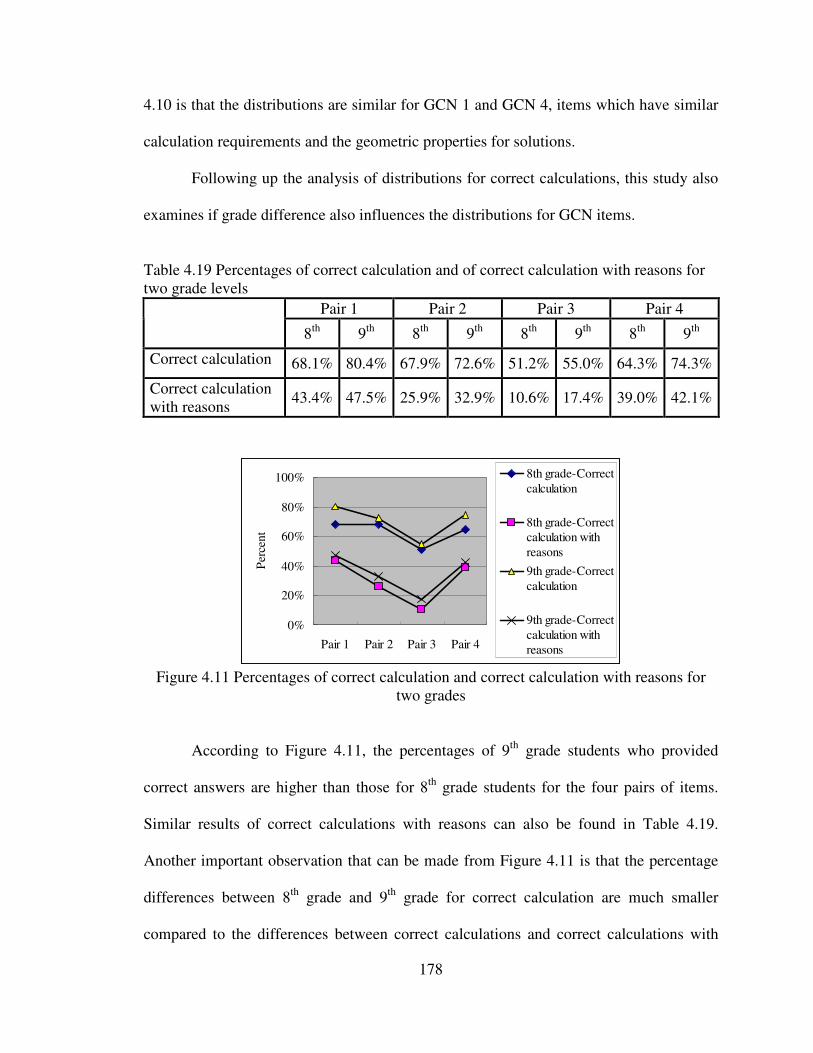
178
4.10 is that the distributions are similar for GCN 1 and GCN 4, items which have similar
calculation requirements and the geometric properties for solutions.
Following up the analysis of distributions for correct calculations, this study also
examines if grade difference also influences the distributions for GCN items.
Table 4.19 Percentages of correct calculation and of correct calculation with reasons for two grade levels
Pair 1 Pair 2 Pair 3 Pair 4
8th 9th 8th 9th 8th 9th 8th 9th
Correct calculation 68.1% 80.4% 67.9% 72.6% 51.2% 55.0% 64.3% 74.3%
Correct calculation with reasons
43.4% 47.5% 25.9% 32.9% 10.6% 17.4% 39.0% 42.1%
0%
20%
40%
60%
80%
100%
Pair 1 Pair 2 Pair 3 Pair 4
Per
cent
8th grade-Correctcalculation
8th grade-Correctcalculation withreasons
9th grade-Correctcalculation
9th grade-Correctcalculation withreasons
Figure 4.11 Percentages of correct calculation and correct calculation with reasons for
two grades
According to Figure 4.11, the percentages of 9th grade students who provided
correct answers are higher than those for 8th grade students for the four pairs of items.
Similar results of correct calculations with reasons can also be found in Table 4.19.
Another important observation that can be made from Figure 4.11 is that the percentage
differences between 8th grade and 9th grade for correct calculation are much smaller
compared to the differences between correct calculations and correct calculations with

179
reasons in general. A similar result can be identified by observing the percentage
differences in 8th grade and 9th grade for correct calculation with reasons, which is also
smaller than the differences between correct calculations and correct calculations with
reasons.
Further examination of the distributions of the correct answers for individual
grade level is shown in Table 4.20 and Figure 4.12. Both the table and bar charts indicate
that the percentage distributions of 8th grade and 9th grade students are similar for Pair 1,
Pair 2, and Pair 4. However, the distributions for Pair 3 for the two grade levels are quite
different. Higher percentage of 8th grade students than 9th grade students could not
provide corresponding geometric properties as reasons but could obtain the correct
answers.
Table 4.20 Distributions of correct answers for four GCN items between two grade levels
Pair 1 Pair 2 Pair 3 Pair 4
8th 9th 8th 9th 8th 9th 8th 9th
Correct calculations with reasons
63.7% 59.0% 38.1% 45.3% 20.6% 31.7% 60.7% 57.6%
Incomplete calculation
18.7% 15.7% 29.0% 29.3% 27.2% 38.8% 15.2% 20.5%
Improper calculation
13.2% 18.4% 21.1% 15.7% 47.9% 26.0% 19.2% 17.6%
Intuitive response 4.4% 6.9% 11.7% 9.7% 4.3% 3.5% 5.0% 5.2%
No response 0% 0% 0% 0% 0% 0% 0% 0%

180
Intuitive responsesImproper calculationsIncomplete calculationsCorrect calculations with reasonsPercentPercentPercentPercent1008060402008th grade- GC18th grade- GC18th grade- GC18th grade- GC1
Intuitive responsesImproper calculationsIncomplete calculationsCorrect calculations with reasonsPercentPercentPercentPercent1008060402009th grade - GC19th grade - GC19th grade - GC19th grade - GC1
Intuitive responsesImproper calculationsIncomplete calculationsCorrect calculations with reasonsPercentPercentPercentPercent1008060402008th grade - GC28th grade - GC28th grade - GC28th grade - GC2
Intuitive responsesImproper calculationsIncomplete calculationsCorrect calculations with reasonsPercentPercentPercentPercent1008060402009th grade - GC29th grade - GC29th grade - GC29th grade - GC2
Intuitive responsesImproper calculationsIncomplete calculationsCorrect calculations with reasonsPercentPercentPercentPercent1008060402008th grade - GC38th grade - GC38th grade - GC38th grade - GC3
Intuitive responsesImproper calculationsIncomplete calculationsCorrect calculations with reasonsPercentPercentPercentPercent1008060402009th grade - GC39th grade - GC39th grade - GC39th grade - GC3
Intuitive responsesImproper calculationsIncomplete calculationsCorrect calculations with reasonsPercentPercentPercentPercent1008060402008th grade - GC48th grade - GC48th grade - GC48th grade - GC4
Intuitive responsesImproper calculationsIncomplete calculationsCorrect calculations with reasonsPercentPercentPercentPercent1008060402009th grade - GC49th grade - GC49th grade - GC49th grade - GC4
Figure 4.12 Distributions of the two grade students who can provide correct calculations
in the four GCN items
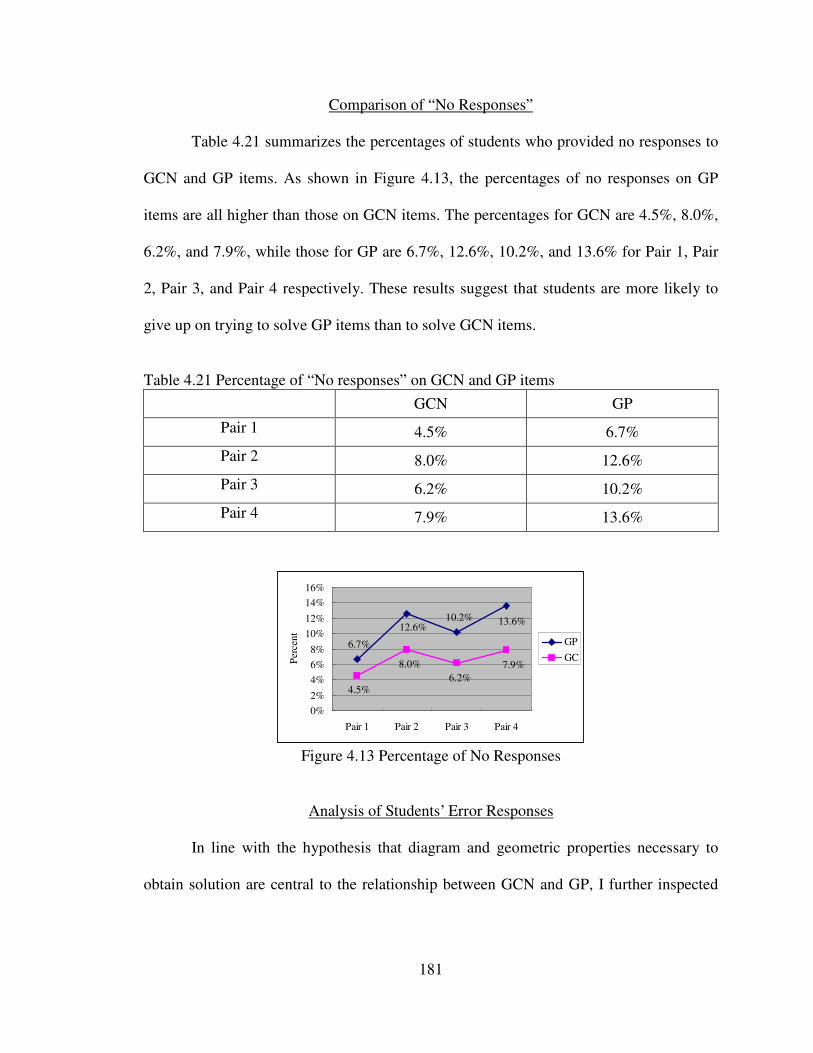
181
Comparison of “No Responses”
Table 4.21 summarizes the percentages of students who provided no responses to
GCN and GP items. As shown in Figure 4.13, the percentages of no responses on GP
items are all higher than those on GCN items. The percentages for GCN are 4.5%, 8.0%,
6.2%, and 7.9%, while those for GP are 6.7%, 12.6%, 10.2%, and 13.6% for Pair 1, Pair
2, Pair 3, and Pair 4 respectively. These results suggest that students are more likely to
give up on trying to solve GP items than to solve GCN items.
Table 4.21 Percentage of “No responses” on GCN and GP items
GCN GP
Pair 1 4.5% 6.7%
Pair 2 8.0% 12.6%
Pair 3 6.2% 10.2%
Pair 4 7.9% 13.6%
13.6%10.2%12.6%
6.7%
4.5%
8.0%6.2%
7.9%
0%
2%
4%
6%
8%
10%
12%
14%
16%
Pair 1 Pair 2 Pair 3 Pair 4
Per
cent GP
GC
Figure 4.13 Percentage of No Responses
Analysis of Students’ Error Responses
In line with the hypothesis that diagram and geometric properties necessary to
obtain solution are central to the relationship between GCN and GP, I further inspected

182
students’ error responses produced because they incorrectly interpreted the given
diagrams or retrieved the geometric properties required to obtain solutions.
Error Responses Related to the Given Diagram and the Geometric Properties Embedded
in the Diagram Configurations
Four different types of error responses related to the given diagram and the
geometric properties embedded in the diagram configurations are reported. They are (1)
using superficial visual associations of diagram to guess the solution, (2) applying
correct geometric property but interpreting the property wrongly on the diagram, (3)
labeling the geometric property correctly on the diagram but naming the geometric
property incorrectly, and (4) the retrieved geometric properties cannot form a successful
solution plan. These four types of error responses are described as follows.
Type 1: Using superficial visual associations of diagram to guess the solutions
The first kind of error refers to those in which students relied on the superficial
visual associations of diagram (Aleven et al., 1998) to guess the solution. In such errors,
the visual associations of diagram become the warrant for students to believe that there
are geometric properties in the diagram that they can use. However, these geometric
properties can not be inferred or are not given in the tasks. For instance, students may
infer two segments or two angles congruently based on their perceptual images of the
diagram (e.g., they look the same lengths) but not based on the geometric properties or
given information that would support the inference. In addition, the perceptual images
based on the visual associations of diagram may also lead to an incorrect solution.

183
Proving steps Labels on the
diagram Geometric reasons
Figure 4.14 Using perceptual images on the diagram to find the solution
Figure 4.14 shows the error in relation to perceptual images by using an example
selected from the responses to GP 1 item, the goal of which is to prove ∠ACD=2∠ABC
given that BCAC = and ABC is a triangle. Proving this GP item can be completed by
two inferring steps. The first step is to infer ∠A=∠B on the basis of the given BCAC =
and the property of isosceles triangle. The second step has to reason
∠ACD=∠CAB+∠ABC using the exterior angle property. Combining these two proving
steps one can conclude that ∠ACD=2∠ABC, which is the goal of this proving task. The
student example is selected because it shows the incorrect reasoning in the first step
which may be made based on the superficial visual associations of the diagram. Instead
of deducing ∠A=∠B, the student inferred ∠B=∠C by the reason that ACAB = , which
was incorrect for this task. The congruent labels on segments AB and AC in the given
diagram also shows how the student visualized the diagram configurations for this
inferring step. To explain the error with regard to the superficial visual associations of the
ACAB = ∠B=∠C
Exterior angle property
Congruence of ∠B and ∠C
∠B+∠A=2∠ABC ∠A=∠B

184
diagram, two possibilities are proposed. The first possibility for the error of viewing
ACAB = may be that the segments AB and AC look as having the same lengths in the
diagram so that the student directly assumed these two segments were congruent. The
second possibility can be attributable to the prototype of an isosceles triangle, the
congruent angles of which are often the base angles on the bottom. These two
possibilities associated with an isosceles triangle may be the reasons that can be used to
interpret the incorrect inference. As a result, the mis-understanding of the diagram
hindered the student from generating a successful solution since the incorrect proving
step could not lead to the proving conclusion, ∠ACD=2∠ABC.
Interestingly, the example analyzed here shows that using visual associations of
diagram to guess solutions is not specific to GCN items but also can happen when
constructing GP items.
Type 2: Applying the correct geometric property, but interpreting it wrongly on the
diagram
In the second error type, students applied correct geometric properties which were
necessary for a solution, but incorrectly interpreted the geometric properties on the
diagram.

185
Proving step Labels on the
diagram Geometric
reasons
Figure 4.15 Misinterpreting the geometric property on the diagram
Figure 4.15 provides an example of this type of error response. The task in this
example is GP 2 item with the goal of proving that ∠DAE=∠DEA given that ABCD is a
parallelogram and AE and BF are angle bisectors. As shown in Figure 4.15, the student’s
first step was to infer that the opposite sides of a parallelogram are parallel (AD//BC and
AB//CD) based on the parallelogram properties. Next, the student attempted to prove this
task by applying the alternate interior angles property, one of the properties that can be
used to obtain a solution. However, the student interpreted the alternate interior angles
property incorrectly on the diagram (see Figure 4.16). She labeled the alternate interior
angles property on the diagram as ∠1 and ∠6, which were not the angles ∠BAE and
Parallelogram property
Alternate interior angles property
Segment CD bisects both
segments CF and ED

186
∠AED corresponding to the alternate interior angles property. Nor were these two angles
congruent to each other. This misapprehension of the angles corresponding to the
geometric property on the diagram also prevented the student from achieving a successful
solution because the incorrect inference ∠1=∠6 could not help the student to reason the
next step associated with the congruent angles ∠BAE and ∠EAD because of the angle
bisector property. As a result, the student did not obtain a proof solution to this task.
Figure 4.16 Using correct geometric property but labeling the property incorrectly on the
diagram Type 3: Labeling the geometric property correctly on the diagram but naming the
property incorrectly
This error type is related to the mismatch between the name of geometric
properties and its embedment in a diagram. The difference between this type error and
the previous one is that the error here involves the correct interpretation of the diagram,
but with the wrong name assigned to the geometric property.

187
Proving step Labels on the diagram Geometric reasons
Figure 4.17 Error response of correct interpretation of configurations of the diagram but
with incorrect geometric property
The response in Figure 4.17 is part of the proof construction of the GP 2 item
from another student. As can be seen, the proving step did not match the corresponding
geometric property. The proving sentence indicates that the student recognized that the
sum of ∠ADF and ∠BAD was equal to 180˚ and could also recognize that parallel lines
were the one of the geometric reasons for this. However, instead of using the consecutive
interior angles property, the student wrote the alternate interior angles property as the
reason for the step, which was incorrect.
Type 4: The retrieved geometric properties are not sufficient to generate a solution plan
Another general type of error response related to the geometric diagram involves
the use of geometric properties that are not enough to generate a solution to this task.
Two parallel lines. Sum of the alternate interior angles is 180˚
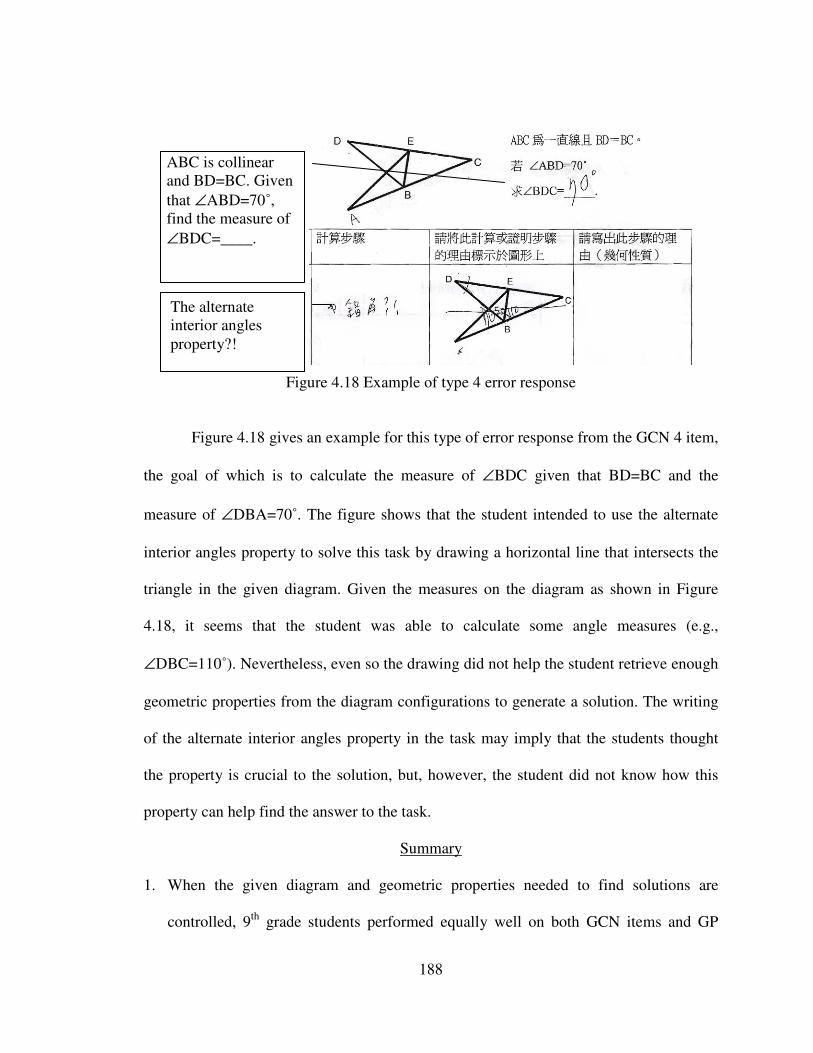
188
Figure 4.18 Example of type 4 error response
Figure 4.18 gives an example for this type of error response from the GCN 4 item,
the goal of which is to calculate the measure of ∠BDC given that BD=BC and the
measure of ∠DBA=70˚. The figure shows that the student intended to use the alternate
interior angles property to solve this task by drawing a horizontal line that intersects the
triangle in the given diagram. Given the measures on the diagram as shown in Figure
4.18, it seems that the student was able to calculate some angle measures (e.g.,
∠DBC=110˚). Nevertheless, even so the drawing did not help the student retrieve enough
geometric properties from the diagram configurations to generate a solution. The writing
of the alternate interior angles property in the task may imply that the students thought
the property is crucial to the solution, but, however, the student did not know how this
property can help find the answer to the task.
Summary
1. When the given diagram and geometric properties needed to find solutions are
controlled, 9th grade students performed equally well on both GCN items and GP
The alternate interior angles property?!
ABC is collinear and BD=BC. Given that ∠ABD=70˚, find the measure of ∠BDC=____.

189
items. But 8th grade students performed better on GCN items than on GP items.
2. When the geometric properties needed to obtain solutions are controlled, diagram
configurations did influence students’ performance. Students performed significantly
better on both GCN and GP items when the diagram had a simple configuration than
when the diagram was complex.
3. 9th grade students performed better than 8th grade students on both GCN and GP items.
4. The treatment of survey procedures (GCN first or after GP) significantly influenced
students’ performance on GCN items, but not on GP items. Students performed better
on GCN items when they solved GP items first and then GCN items later. But
students performed similarly on the GP items regardless of which item type was
presented first.
5. The treatment of the time effect (GCN/GP solved closely together vs. separated by
one day) did not cause a significant difference in student performance on GCN and
GP items.
6. The percentage of correct calculations for each GCN item was much higher than that
for correct calculations with reasons. Students who obtained correct answers, but
could not explain the correct geometric properties leading to their calculations were
distributed among the three coding categories: incomplete calculations, improper
calculations, and intuitive responses. The analysis also indicates that using the
superficial visual associations of diagram as an approach to guess the answer is task-
dependent.
7. The percentage of students who did not provide any response to GP items was much
higher than that for GCN items.
190
8. Four types of students’ error responses specific to the diagram and geometric
properties are reported as (1) using superficial visual associations of the diagram to
guess the solutions; (2) applying the correct geometric property, but interpreting it
wrongly on the diagram; (3) labeling the geometric property correctly on the diagram,
but naming the geometric property incorrectly; (4) The retrieved geometric properties
are not enough to generate a solution plan. In particular, the error type caused by
using superficial visual associations of diagram to guess the solutions can also occur
when constructing GP items.
Discussion
Based on the theoretical analysis regarding the analogous distinction between “a
problem to prove” and “a problem to find” (Polya, 1945) and comparisons of survey
responses of two grade levels of students, this study, from a problem-solving perspective,
conceptualizes the relationship between GCN and GP taking two major perspectives into
the consideration. The first perspective has to do with the role of geometric diagram and
geometric properties necessary to obtain a solution. The 9th grade students’ responses
showed that both the diagram and the required geometric properties are keys to
determining the cognitive demand of geometric tasks given to students. This result
highlights the weakness and limitation in theories describing the relationship between
calculation and proof (Tall, 2002; 2005; 2007), which do not consider how the diagram
might influence the relationship between the two types of tasks. The result also points out
the limitations of studies, which have treated GCN as tasks of lower-level cognitive
demand useful only for practicing geometric properties (Heinze, Cheng, Ufer, Lin, &
Reiss, 2008; Heinze, Cheng, & Yang, 2004; Heinze, Ufer, Cheng, & Lin, 2008), and did

191
not carefully consider the complexity and specificity of a mathematical task (Stein, Smith,
Henningsen, & Silver, 2000).
This finding of survey responses of 9th grade students also leads to an underlying
assumption regarding the cognition associated with the difference between calculating
specific measures and proving general statements. A common clarification between GCN
and GP is that GCN tasks are often viewed as special cases because of the characteristics
of calculating certain measures, whereas GP involves general statements that cannot be
replaced by solving a specific case. For example, Kuchemann and Hoyles (2002) state
“…the task [GCN] is only concerned with finding a specific value of an angle, rather than a general relationship between angles, which is more characteristic of a proof (p. 48)”
As indicated by the quote, Kuchemann and Hoyles treat GCN and GP as different types
of tasks because GCN deals with certain measures, and not general relationships among
angles, which GP does. Other researchers have argued the inappropriateness of using this
binary categorization to describe students’ cognitive behaviors and beliefs in GCN and
GP. For instance, Chazan (1993) pointed out the complexity of students’ beliefs in using
measurements and deductive proofs as means to verify an argument. When students
examine empirical examples for their justification, they can recognize the limitations of
using this approach and may develop strategies for minimizing these limitations.
Balacheff (1988) also stated that the use of representations (e.g., numerical calculating
sentences vs. formal proving sentence) should not be treated as the central in
conceptualizing students’ proof conceptions. The more importance is how students can
internalize the mathematical ideas and detach them from particular representations. In
192
line with this viewpoint, GCN can be more than a naïve example and involve a proof
conception.
This study further elaborates the abstract nature of a diagram (Duval, 1995;
Fischbein, 1993; Fischbein & Nachlieli, 1998) can influence the relationship between
both types of tasks. The argument proposed in this study is that, during the problem-
solving process, visualizing the diagram configurations to retrieve relevant geometric
properties forces students to see a geometric diagram as an abstract object and to make
general inferences regarding the relationships between/among different angles or
segments in the diagram (e.g., angle sum theorem involving three angles in a triangle),
regardless of whether a student is solving a GCN task or engaging in proving a GP. Even
though the measures of angles or segments are provided in a GCN task, these measures
might not help or provide hints to students as they try to figure out the diagram
configurations with corresponding geometric properties and generate a solution plan. In
this regard, measures are used only to execute the calculations for the unknowns if
students recognize the geometric properties that they can use to set up the calculating
sentence. The results of the 9th grade students’ performance on GCN and GP items
provides strong evidence to support the argument that geometric diagram and geometric
properties needed to obtain solutions are keys to the link between the two types of tasks.
This study also reveals that GCN are not tasks of lower cognitive demand. This
finding indicates the limitation of the conclusions shown in other studies (Heinze, Cheng,
Ufer, Lin, & Reiss, 2008; Heinze, Cheng, & Yang, 2004; Heinze, Ufer, Cheng, & Lin,
2008). One possible reason for this incorrect conclusion is that the GCN tasks designed
and implemented in previous studies did not, as this study does, ask students to provide

193
geometric reasons to account for each calculating step. If explanations are not required,
students’ performance on GCN will appear to be significant better than their performance
on GP because of the shallow learning related to solving GCN tasks (Aleven, Koedinger,
Sinclair, & Synder, 1998). Here, shallow learning of GCN refers to a situation in which
students use the superficial visual associations of the diagram to obtain answers to GCN
tasks rather reasoning logically from geometric properties. Shallow learning, therefore,
becomes a confounding variable in conceptualizing the relationship between GCN and
GP since the differences in the percentages of correct responses for GCN and GP should
be significant when GCN does not require students to provide geometric reasons.
Concerning the shallow learning in relation to the relationship between GCN and GP, this
study proposes two perspectives that should be carefully considered and further examined.
First of all, relying on superficial visual associations of the diagrams is not specific to
GCN items. This can also occur in the construction of GP, as shown in the example used
to illustrate Type 1 error response in the findings section, in which the student relied on
superficial visual associations of the diagram to set up the proving sentences. If the use of
superficial visual associations of the diagram is not specific to GCN items, how shallow
learning influences the relationship between GCN and GP should be further investigated
and should be carefully considered in articulating the relationship between GCN and GP.
Secondly, I maintain that not every GCN task allows students to use superficial visual
associations of diagrams as an approach to obtaining answers because this is task-
dependent. To elaborate this viewpoint, I offer the following GCN example in Table 4.22.

194
Table 4.22 The GCN example used to elaborate shallow learning Diagram GCN task description
A
B CE
D
In triangle ABC, AE⊥BC, AB//DE, and CD=CE. Given that measure of ∠DCE=40˚, find the measure of ∠BAE=_____.
The written information details the properties that can be used to generate a
solution, including ABC is a triangle; AE is perpendicular to BC; AB are DE are parallel;
and CD=CE. The given also indicates that ∠DCE=40˚ and the goal is to find the measure
of ∠BAE. Table 4.23 demonstrates a solution plan of reasoning the answer to this task.
Table 4.23 A solution to the GCN example in Table 4.22 Steps Calculating sentence Reason for the calculating sentence Step One ∠CDE+∠CED=180˚-40˚=140˚ Triangle sum property Step Two ∠CDE=∠CED=70˚ Properties of isosceles triangle
Step Three ∠EAC=180˚-90˚-40˚=50˚ Triangle sum property Step Four ∠DAB=∠CDE=70˚
So ∠BAE=70˚-50˚=20˚ Corresponding angles property
As shown in the above table, the solution plan requires four reasoning steps with
corresponding geometric properties. The first step is to apply triangle sum property to
calculate the sum of ∠CDE and ∠CED which is 140˚. The next step involves inferring
the congruence angles of ∠CDE and ∠CED based on the properties of an isosceles
triangle in order to obtain ∠CDE =70˚. The third step is to apply the angle sum property
again to compute the measure of ∠EAC, which is 50˚. Finally, the measure of ∠BAE can
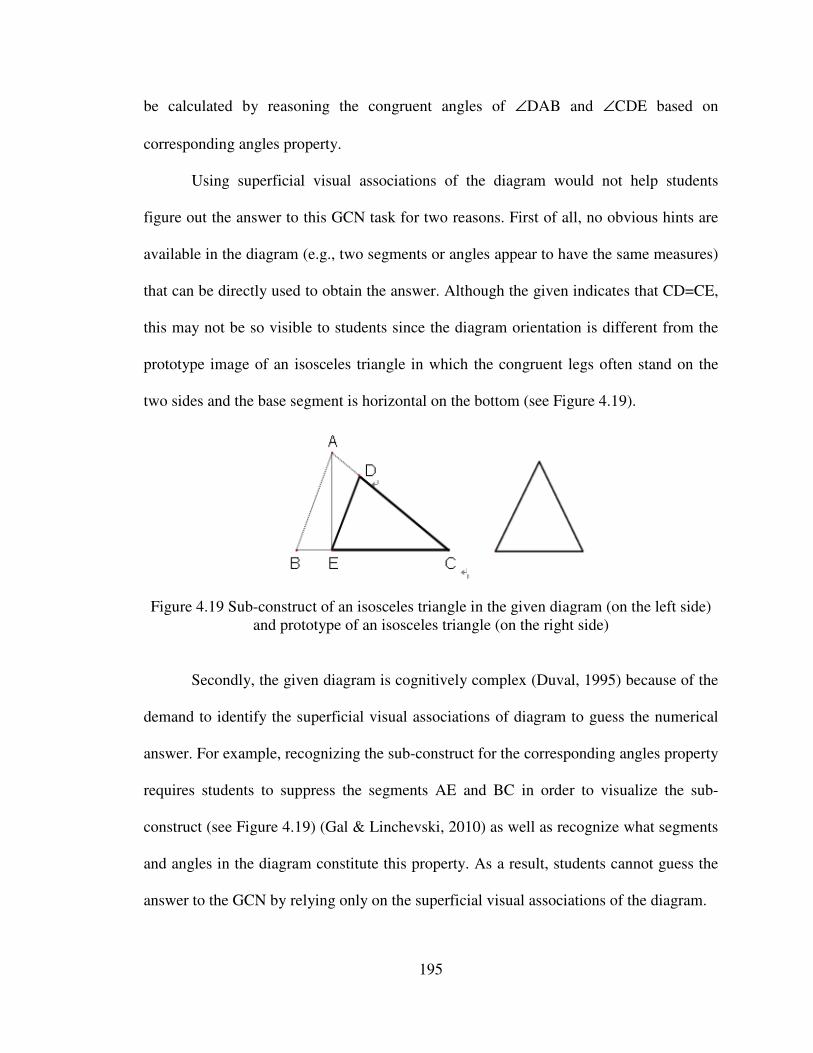
195
be calculated by reasoning the congruent angles of ∠DAB and ∠CDE based on
corresponding angles property.
Using superficial visual associations of the diagram would not help students
figure out the answer to this GCN task for two reasons. First of all, no obvious hints are
available in the diagram (e.g., two segments or angles appear to have the same measures)
that can be directly used to obtain the answer. Although the given indicates that CD=CE,
this may not be so visible to students since the diagram orientation is different from the
prototype image of an isosceles triangle in which the congruent legs often stand on the
two sides and the base segment is horizontal on the bottom (see Figure 4.19).
Figure 4.19 Sub-construct of an isosceles triangle in the given diagram (on the left side) and prototype of an isosceles triangle (on the right side)
Secondly, the given diagram is cognitively complex (Duval, 1995) because of the
demand to identify the superficial visual associations of diagram to guess the numerical
answer. For example, recognizing the sub-construct for the corresponding angles property
requires students to suppress the segments AE and BC in order to visualize the sub-
construct (see Figure 4.19) (Gal & Linchevski, 2010) as well as recognize what segments
and angles in the diagram constitute this property. As a result, students cannot guess the
answer to the GCN by relying only on the superficial visual associations of the diagram.
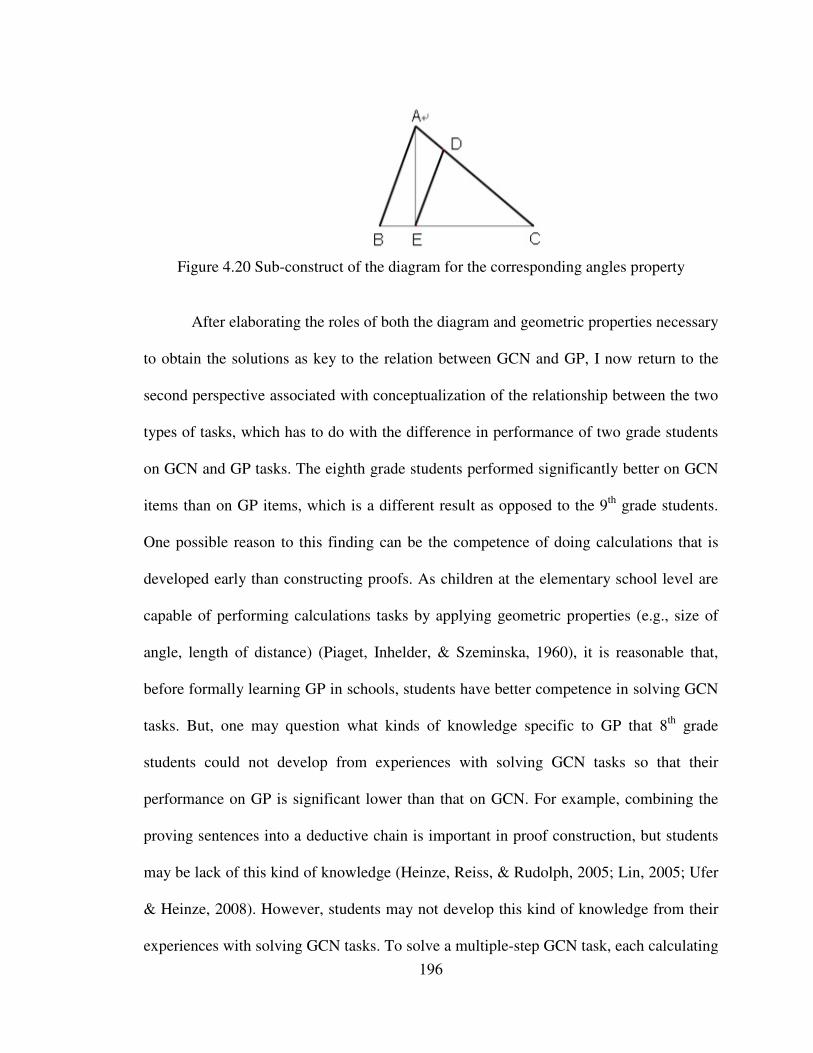
196
Figure 4.20 Sub-construct of the diagram for the corresponding angles property
After elaborating the roles of both the diagram and geometric properties necessary
to obtain the solutions as key to the relation between GCN and GP, I now return to the
second perspective associated with conceptualization of the relationship between the two
types of tasks, which has to do with the difference in performance of two grade students
on GCN and GP tasks. The eighth grade students performed significantly better on GCN
items than on GP items, which is a different result as opposed to the 9th grade students.
One possible reason to this finding can be the competence of doing calculations that is
developed early than constructing proofs. As children at the elementary school level are
capable of performing calculations tasks by applying geometric properties (e.g., size of
angle, length of distance) (Piaget, Inhelder, & Szeminska, 1960), it is reasonable that,
before formally learning GP in schools, students have better competence in solving GCN
tasks. But, one may question what kinds of knowledge specific to GP that 8th grade
students could not develop from experiences with solving GCN tasks so that their
performance on GP is significant lower than that on GCN. For example, combining the
proving sentences into a deductive chain is important in proof construction, but students
may be lack of this kind of knowledge (Heinze, Reiss, & Rudolph, 2005; Lin, 2005; Ufer
& Heinze, 2008). However, students may not develop this kind of knowledge from their
experiences with solving GCN tasks. To solve a multiple-step GCN task, each calculating

197
sentence uses some quantities from the given and produces new measures. The new
measures can later be used to set up a new calculating sentence based on the
corresponding geometric property. The recycling of using quantities from the given and
new quantities ends when students finally obtain answers to the task. In this regard, the
recycling in a way already organizes the solution steps into a logic sequence, which does
not require additional cognitive work as GP does.
Combining students’ performances of both grade levels on GCN and GP seems to
suggest a learning trajectory to facilitate students’ proficiency in creating GP because of
the diagram complexity and problem-solving complexity GCN tasks used and enacted in
Taiwanese classroom (see Chapter Two and Three). When solving GCN tasks, the
complexity of diagram provides students opportunities to learn strategic knowledge,
which is a key for effective problem solvers who need to recall actions that are likely to
be useful when choosing which actions to apply among several alternatives (Weber, 2002;
2005). Hence, class experiences in solving GCN tasks prior to formally learning GP can
nurture students’ strategic knowledge in terms of visualizing diagram configurations so
that they can retrieve relevant geometric properties and combine different geometric
properties to generate a valid solution strategy in novel ways. This training with working
on GCN tasks with diagram complexity can later contribute to the learning of GP.
Given that much research has reported that students have difficulties in learning
proofs (Fuys, Geddes, & Tischler, 1988; Harel & Sowder, 1998; Healy & Hoyles, 1998;
Heinze, Cheng, & Yang, 2004; Heinze, Reiss, & Rudolph, 2005; Li, 2002; Mariotti, 2006;
Miyazaki, 2000; Senk, 1989), the learning trajectory proposed here can also be used as a
framework to develop instructional approaches that emphasize diagrams and
198
requirements of geometric properties to improve students’ learning of GP. This
possibility is very worthy of further investigation.
The analysis of Pair 1 and Pair 4 with different diagram configurations also shows
that diagrams significantly influence students’ performance on both GCN and GP tasks.
When the requirements of geometric properties are controlled, students performed
significantly better on both types of items that had simple diagram configurations as
opposed to complex ones. This result confirms that the diagram configurations have an
influence on the underlying cognitive complexity of solving geometric tasks (Duval,
1995) and play an important role in students’ ability to recognize relevant geometric
properties. In this regard, Zykova (1975) used the term “reinterpreting diagrams” (p. 94)
to describe geometric tasks that require identifying different geometric concepts from the
same diagram configurations. Reinterpretation of the diagram with different geometric
properties can be psychologically complex and requires students to understand all of the
geometric properties in the diagram configurations and make transitions among these
properties. In addition, diagram complexity due to extra lines and angles may also
become visual obstacles (Yerushalmy & Chazan, 1990) that prevent students from
correctly identifying the corresponding geometric properties needed to obtain solutions.
However, the results from the pilot study suggest that this view may not be entirely
correct. In the pilot study when diagram configurations were made more complex by
adding one segment, students’ performance on the two types of tasks did not change. This
phenomenon suggests the need for further investigation. For instance, a follow-up study
could examine the extent to which the complexity of diagram configurations influences
students’ performance on GCN and GP.

199
The analysis of the percentage of students who provided no responses to either
type of item shows that students are more likely to give up on a GP task than on a GCN
task. The phenomenon may be due to students’ conceptions and beliefs of the tasks. As
Chazan (1993) points out, high school students prefer empirical arguments over
deductive arguments when working on mathematical problems. Since students often face
difficulties in constructing GP, they may lose their motivation to work on the tasks, even
though they could infer some geometric properties from the diagram configurations.
Further investigation of students’ conceptions and beliefs regarding both types of tasks
would be useful to understand how they perceive the relationship between GCN and GP.
One example of a research question to explore this could be: what are the underlying
reasons for student behaviors and cognition on both types of tasks when they provide a
partial solution or try to solve a GCN as opposed to working on a GP?
Finally, another important contribution of this study is the design of pairs of GCN
and GP items which are identical in terms of the diagram configurations and required
geometric properties need to obtain solutions. The investigation of such parallel tasks has
not been undertaken by other researchers, but is crucial to the ability to elaborate the
relationship between GCN and GP.

200
REFERENCES
Aleven, V., Koedinger, K., Sinclair, H., & Synder, J. (1998). Combatting shallow
Learning in a tutor for geometry problem solving. Paper presented at the Intelligent tutoring systems: Fourth International Conference, ITS '98, Berlin.
Anderson, J., Greeno, J., Kline, P., & Neves, D. (1981). Acquisition of problem-solving skill. In J. Anderson (Ed.), Cognitive skills and their acquisition (pp. 191-230). New Jersey: Lawrence Eblbaum.
Ayres, P., & Sweller, J. (1990). Locus of difficulty in multistage mathematics problems. The American Journal of Psychology, 103(2), 167-193.
Ball, D., & Bass, H. (2003). Making mathematics reasonable in school. In J. Kilpatrick, W. Martin & D. Schifter (Eds.), A research companion to principals and
standards for school mathematics (pp. 27-44). Reston: National Council of Teachers of Mathematics.
Ballacheff, N. (1988). Aspects of proof in pupils’ practice of school mathematics. In D. Pimm (Ed.) Mathematics, teachers and children (pp. 216-235). London: Hodder & Stoughton.
Chazan, D. (1993). High school geometry students' justification for their views of empirical evidence and mathematical proof. Educational Studies in Mathematics,
24, 359-387.
Cheng, Y.-H., & Lin, F.-L. (2005). One more step toward acceptable proof in geometry, Symposium presented 11th EARLI Conference. Nicosia, Cyprus.
Cheng, Y.-H., & Lin, F.-L. (2006). Using reading and coloring to enhance incomplete prover's performance in geometry proof. In J. Novotna, H. Moraova, M. Kratka, & N. Stehlikova (Eds.), Proceedings of the 30
th Conference of the International
Group for the Psychology of Mathematics Education (vol. 2, pp. 289-296). Prague, Czech Republic.
Cheng, Y.-H., & Lin, F.-L. (2007). The effectiveness and limitation of reading and coloring strategy in learning geometry proof. In J. H. Woo, H. C. Lew, K. S. Park, & D. Y. Seo (Eds.), Proceedings of the 31
st Conference of the International
Group for the Psychology of Mathematics Education (vol. 2, pp. 113-120). Seoul, Korea.
Cheng, Y.-H., & Lin, F.-L. (2008). A study on left behind students for enhancing their competence of geometry argumentation. In O. Figueras, J. L. Lortina, S. Alatorre, T. Rojano, & A. Sepulveda (Eds.), Proceedings of the Joint Meeting of 32
nd
Conference of the International Group for the Psychology of Mathematics
Education (PME) and PME-NA XXX (vol. 2, pp. 305-312). Morelia, Mexico.
Lawson, M., & Chinnapan, M. (2000). Knowledge connectedness in geometry problem solving. Journal for Research in Mathematics Education, 31(No. 1), 26-43.
Cohen, J. (1988). Statistical power analysis for the behavioral sciences (2 ed.). Hillsdale, NJ: Lawrence Earlbaum Associates.

201
Cohen, J. (1992). "A power primer". Psychological Bulletin, 112(1), 155-159.
Duval, R. (1995). Geometrical pictures: Kinds of representation and specific processings. In R. Sutherland & J. Mason (Eds.), Exploiting mental imagery with computers in
mathematics education (pp. 142-157). Berlin: Springer.
Duval, R. (1998). Geometry from cognitive point of view. In C. Mammana & V. Villani (Eds.), Perspectives on the teaching of geometry for 21st century (pp. 37-52). Dordrecht: Kluwer.
Fischbein, E. (1993). The theory of figural concepts. Educational Studies in Mathematics,
24(2), 139-162.
Fischbein, E., & Nachlieli, T. (1998). Concepts and figures in geometrical reasoning. International Journal of Science Education, 20(10), 1193-1211.
Fuys, D., Geddes, D., & Tischler, R. (1988). The van Hiele model of thinking in geometry
among adolescents (Vol. 3). Reston: National Council of Teachers of Mathematics.
Gal, H., & Linchevski, L. (2010). To see or not to see: Analyzing difficulties in geometry from the perspective of visual perception. Educational Studies in Mathematics, 74, 163-183.
Gray, E., & Tall, D. (1994). Duality, ambiguity and flexibility: A proceptual view of simple arithmetic. Journal for Research in Mathematics Education, 26(2), 115-141.
Hanna, G. (2000). Proof, explanation and exploration: An overview. Educational Studies
in Mathematics, 44, 5-23.
Harel, G., & Sowder, L. (1998). Students' proof schemes: Results from exploratory studies. CBMS Issues in Mathematics Education, 7, 234-283.
Healy, L., & Hoyles, C. (1998). Justifying and proving in school mathematics. London: Institute of Education.
Heinze, A., Cheng, Y.-H., Ufer, S., Lin, F.-L., & Reiss, K. (2008). Strategies to foster students' competencies in constructing multi-steps geometric proofs: Teaching experiments in Taiwan and Germany. ZDM—The International Journal on
Mathematics Education, 40(3), 443-453.
Heinze, A., Cheng, Y.-H., & Yang, K.-L. (2004). Students' performance in reasoning and proof in Taiwan and Germany: Results, paradoxes and open questions. ZDM—
The International Journal on Mathematics Education, 36(5), 162-171.
Heinze, A., Reiss, K., & Rudolph, F. (2005). Mathematics achievement and interest in mathematics from a differential perspective. ZDM—The International Journal on
Mathematics Education, 37(3), 212-220.
Heinze, A., Ufer, S., Cheng, Y.-H., & Lin, F.-L. (2008). Geometric proof competence
and its individual predictors: A Taiwanese-German study. Paper presented at ICME 11. Mexico.

202
Herbst, P. (2004). Interactions with diagrams and the making of reasoned conjectures in geometry. ZDM—The International Journal on Mathematics Education, 36(5), 129-139.
Herbst, P. (2006). Teaching geometry with problems: Negotiating instructional situations and mathematics tasks. Journal for Research in Mathematics Education, 37(4), 313-347.
Hsu, H.-Y. (2007). Geometric calculations are more than calculations. In J. H. Woo, H. C. Lew, K. S. Park, & D. Y. Seo (Eds.), Proceedings of the 31
st Conference of the
International Group for the Psychology of Mathematics Education (vol. 3, pp. 57-64). Seoul, Korea.
Koedinger, K., & Anderson, J. (1990). Abstract planning and perceptual chunks: Elements of expertise in geometry. Cognitive Science, 14, 511-550.
Küchemann, D., & Hoyles, C. (2002). The quality of students' reasons for the steps in a geometric calculation. Proceedings of the British Society for Research into
Learning Mathematics, 22(2), 43-48.
Larkin, J. H., & Simon, H. A. (1987). Why a diagram is (sometimes) worth ten thousand words. Cognitive Science, 11, 65-99.
Li, Y.-F. (2002). 9th grade students' learning of geometry proofs: The obstacles caused
by diagrams. Unpublished master thesis, National Taiwan Normal University, Taipei. (In Chinese)
Lin, F.-L. (2005). Modeling students' learning on mathematical proof and refutation. In H. L. Chick, & J. L. Vincent (Eds.), Proceedings of the 29
th Conference of the
International Group for the Psychology of Mathematics Education (vol. 1, pp. 3-18). Melbourne, Australia.
Lin, F.-L., Cheng, Y.-H., & et al. (2003). The competence of geometric argument in Taiwan adolescents, International Conference on Science & Mathematics
Learning. Taipei, Taiwan.
Lovett, M., & Anderson, J. (1994). Effects of solving related proofs on memory and transfer in geometry problem solving. Journal of Experimental Psychology:
Learning, Memory, and Cognition, 20(2), 366-378.
Maher, C., & Martino, A. (1996). The development of the idea of mathematical proof: A 5-year case study. Journal for Research in Mathematics Education, 27(2), 194-214.
Mariotti, M. A. (2006). Proof and proving in mathematics education. In Á. Gutiérrez & P. Boero (Eds.), Handbook of research on the psychology of mathematics education (pp. 173-204). Rotterdam: Sense Publishers.
Ministry of Education. (2003). Grades 1-9 curriculum guidelines. Taipei, Taiwan: Author.
Miyazaki, M. (2000). Levels of Proof in Lower Secondary School Mathematics. Educational Studies in Mathematics, 41, 47-68.

203
NCTM. (2000). Principles and Standards for School Mathematics. Reston: National Council of Teachers of Mathematics.
Piaget, J., Inhelder, B., & Szeminska, A. (1960). The child's conception of geometry (E. A. Lunzer, Trans.). New York: W.W. Norton & Company.
Pólya, G. (1945). How to solve it. Princeton, NJ: Princeton University Press.
Schumann, H., & Green, D. (2000). New protocols for solving geometric calculation problems incorporating dynamic geometry and computer algebra software. International Journal of Mathematical Education in Science and Technology,
31(3), 319-339.
Senk, S. (1989). Van Hiele levels and achievement in writing geometry proofs. Journal
for Research in Mathematics Education, 20(3), 309-321.
Stein, M., Smith, M., Henningsen, M., & Silver, E. (2000). Implementing standards-
based mathematics instruction: A casebook for professional development. New York: Teachers College Press.
Stylianides, A. (2007). The notion of proof in the context of elementary school mathematics. Educational Studies in Mathematics, 65, 1-20.
Tall, D. (2002). Differing modes of proof and belief in mathematics. Paper presented at the International Conference on Mathematics: Understanding proving and proving to understand, Taipei, Taiwan.
Tall, D. (2004). Thinking through three worlds of mathematics. In M. J. Hoines, A. B. Fuqlestad (Eds.), Proceedings of the 28
th Conference of the International Group
for the Psychology of Mathematics Education (vol. 4, pp. 281-288). Melbourne, Australia.
Tall, D. (2005). The transition from embodied thought experiment and symbolic
manipulation to formal proof. Paper presented at the Kingfisher Delta'05, Fifth Southern Hemisphere Symposium on Undergraduate Mathematics and Statistics Teaching and Learning, Fraser Island, Australia.
Tall, D. (2006a). A life-times' journey from definition and deduction to ambiguity and
insight. Paper presented at the Retirement as Process and Concept: A festschrift for Eddie Gray and David Tall, Prague.
Tall, D. (2006b). A theory of mathematical growth through embodiment, symbolism and proof, International Colloquium on Mathematical learning from early childhood
to adulthood. Nivelles, Belgium: Centre de Recherche surl'Enseignement des Mathematiques.
Tall, D. (2007). Embodiment, symbolism, argumentation and proof, Paper presented at the Conference on Reading, Writing and Argumentation
Ufer, S., & Heinze, A. (2008). Development of geoemtric proof competence from grade 7
to 9: A longitudinal study, Paper presented at ICME11, Mexico.
Weber, K. (2002). Student difficulty in constructing proofs: The need for strategic knowledge. Educational Studies in Mathematics, 48, 101-119.

204
Weber, K. (2005). Problem-solving, proving, and learning: The relationship between problem-solving processes and learning opportunities in the activity of proof construction. Journal of Mathematical Behavior, 24, 351-360.
Yerushalmy, M., & Chazan, D. (1990). Overcoming visual obstacles with the aid of the Supposer. Educational Studies in Mathematics, 21, 199-219.
Zack, V. (1999). Everyday and mathematical language in children's argumentation about proof. Educational Review, 51(2), 129-146.
Zykova, V. I. (1975). Operating with concepts when solving geometry problems. In J. Kilpatrick & I. Wirszup (Eds.), The learning of mathematical concepts (Vol. 1, pp. 93-148). Chicago: University of Chicago.

205
Appendix 4.1
Summary of the GCN and GP Items Included in the Survey
Item The given diagram The givens for GCN The givens for GP List of geometric properties for solutions
Pair 1
ΔABC in which AC=BC and BCD is collinear. If the measure of ∠ACD is 130˚, find the measure of ∠ABC.
ΔABC in which AC=BC and BCD is collinear. Prove ∠ACD=2∠ABC
Solution 1: The triangle sum property, the property of linear pair, the properties of an isosceles triangle Solution 2: The exterior angle property, the properties of an isosceles triangle
Pair 2
ABCD is a parallelogram. AE and BF are angle bisectors of ∠A and ∠B. If ∠AED=25∘, find the measure of ∠EAD.
ABCD is a parallelogram. AE and BF are angle bisectors of ∠A and ∠B. Prove ∠AED=∠EAD.
Properties related to parallelogram (e.g., opposite sides of a parallelogram are parallel), the alternate interior angles property, the angle bisector property.
205
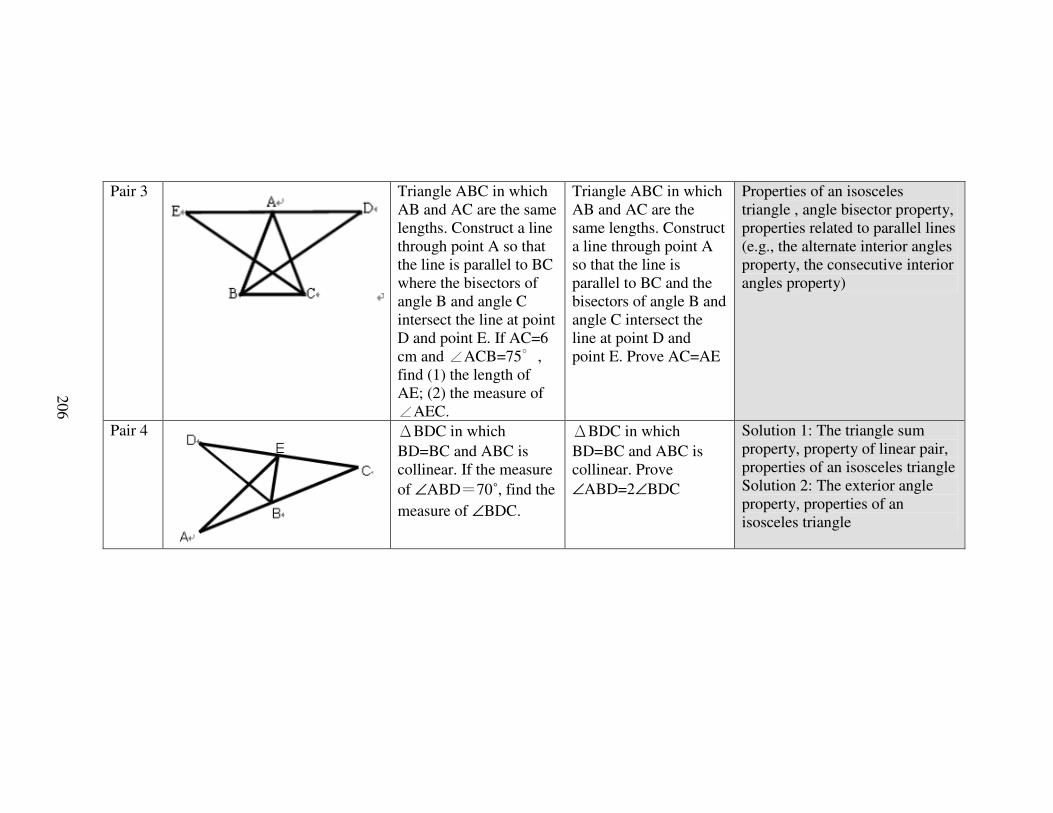
206
Pair 3
Triangle ABC in which AB and AC are the same lengths. Construct a line through point A so that the line is parallel to BC where the bisectors of angle B and angle C intersect the line at point D and point E. If AC=6 cm and AC∠ B=75∘, find (1) the length of AE; (2) the measure of
AEC.∠
Triangle ABC in which AB and AC are the same lengths. Construct a line through point A so that the line is parallel to BC and the bisectors of angle B and angle C intersect the line at point D and point E. Prove AC=AE
Properties of an isosceles triangle , angle bisector property, properties related to parallel lines (e.g., the alternate interior angles property, the consecutive interior angles property)
Pair 4
ΔBDC in which BD=BC and ABC is collinear. If the measure of ∠ABD=70˚, find the measure of ∠BDC.
ΔBDC in which BD=BC and ABC is collinear. Prove ∠ABD=2∠BDC
Solution 1: The triangle sum property, property of linear pair, properties of an isosceles triangle Solution 2: The exterior angle property, properties of an isosceles triangle
206

207
Appendix 4.2
Plan Trees for Each Pair of GCN and GP Items in the Survey
Figure 4.21 Plan trees for Pair 1 items (GCN on the left side and GP on the right side)
Figure 4.22 Plan trees for Pair 2 items (GCN on the left side and GP on the right side)

208
Figure 4.23 Plan trees for Pair 3 items (GCN on the left side and GP on the right side)
Figure 4.24 Plan trees for Pair 4 items (GCN on the left side and GP on the right side)

209
Appendix 4.3
Solution Example Included in the Survey
Please clearly write down your calculating or proving steps and indicate what geometric properties support your steps. Please also label your steps and geometric properties on the given diagram so that we can understand more about how you think of the task.
In triangle ABC, if line AD is a perpendicular bisector of segment BC. Prove △ABD ≅△ACD
Proving Steps Labels on diagram Reasons
Step 1 ∠ADB=∠ADC=90˚
Properties of perpendicular bisector (AD⊥BC)
Step 2 BD=DC
Properties of perpendicular bisector (BD=DC)
Step 3 AD=AD
Shared segment for both ΔABD and ΔACD
Step 4 △ABD ≅ △ACD (RHS)
Triangle congruence postulate
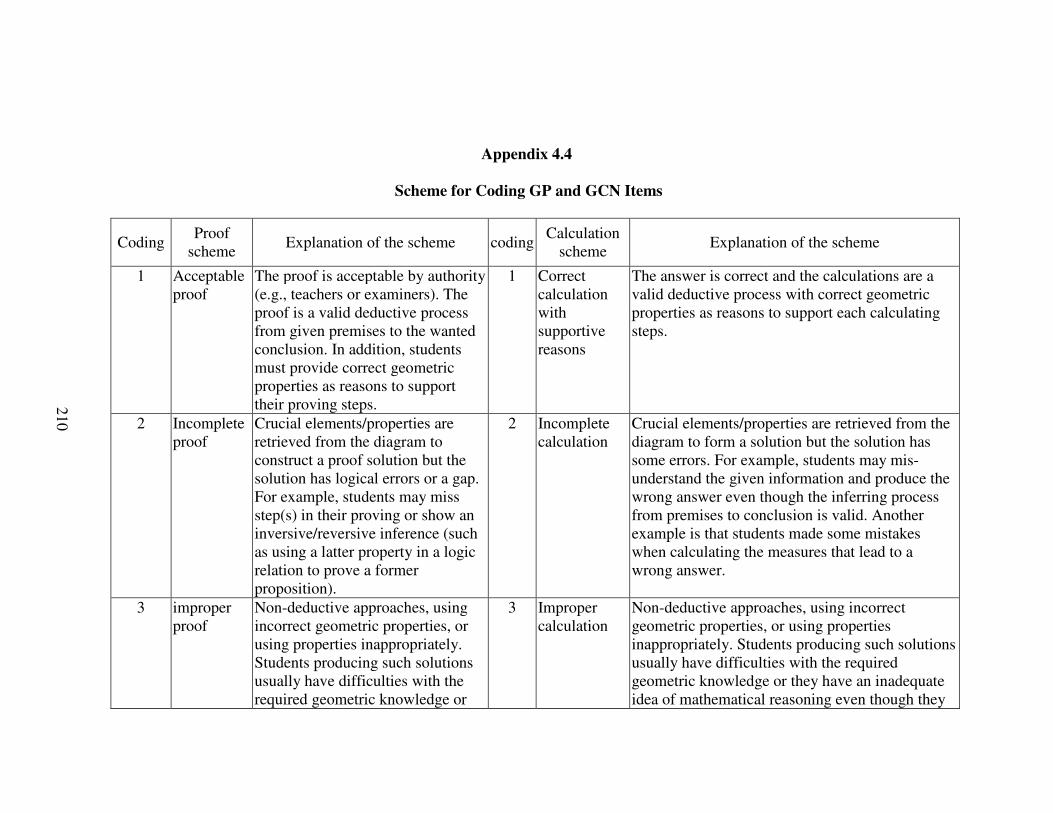
210
Appendix 4.4
Scheme for Coding GP and GCN Items
Coding Proof
scheme Explanation of the scheme coding
Calculation scheme
Explanation of the scheme
1 Acceptable proof
The proof is acceptable by authority (e.g., teachers or examiners). The proof is a valid deductive process from given premises to the wanted conclusion. In addition, students must provide correct geometric properties as reasons to support their proving steps.
1 Correct calculation with supportive reasons
The answer is correct and the calculations are a valid deductive process with correct geometric properties as reasons to support each calculating steps.
2 Incomplete proof
Crucial elements/properties are retrieved from the diagram to construct a proof solution but the solution has logical errors or a gap. For example, students may miss step(s) in their proving or show an inversive/reversive inference (such as using a latter property in a logic relation to prove a former proposition).
2 Incomplete calculation
Crucial elements/properties are retrieved from the diagram to form a solution but the solution has some errors. For example, students may mis-understand the given information and produce the wrong answer even though the inferring process from premises to conclusion is valid. Another example is that students made some mistakes when calculating the measures that lead to a wrong answer.
3 improper proof
Non-deductive approaches, using incorrect geometric properties, or using properties inappropriately. Students producing such solutions usually have difficulties with the required geometric knowledge or
3 Improper calculation
Non-deductive approaches, using incorrect geometric properties, or using properties inappropriately. Students producing such solutions usually have difficulties with the required geometric knowledge or they have an inadequate idea of mathematical reasoning even though they
210

211
they have an inadequate idea of mathematical reasoning even though they still can make inferences based on non-crucial geometric properties
can make inferences based on non-crucial geometric properties. In GCN, it is possible that students guess the final answer even though they could not identify crucial properties required in this task.
4 Intuitive response
Students just work on the surface level without any inferring process of the task. For example, make a visual judgment or just give an intuitive response.
4 Intuitive response
Students work on the surface level without any inferring process of the task. For example, make a visual judgment or just give an intuitive response. In GCN, it is possible that students guess the final answer without any calculating sentences or reasoning steps.
99 No response
99 No response
211

212
CHAPTER FIVE
GENERAL DISCUSSION
Using GCN Tasks to Facilitate Taiwanese Students’ Competence in Constructing GP
This dissertation reports a research on geometric calculation with number (GCN)
in Taiwan by conducting three sequential studies, corresponding roughly to key aspects
of the Mathematical Tasks Framework (MTF); namely, tasks as found in curriculum
materials and other instructional resources, tasks as enacted by students and their teacher,
and student learning from and through mathematical tasks. In particular, the attentions of
the dissertation focus on how GCN tasks were used and enacted in the classroom of one
Taiwanese teacher and the extent to which evidence of performance of a sample of
Taiwanese students on such tasks can be similar to that on geometric proof (GP) tasks.
Although this dissertation only examined one classroom with one Taiwanese
mathematics teacher, taken together the three studies offer a comprehensive glimpse at
how Taiwanese students’ experiences with GCN tasks might contribute to their high
levels of competence with geometric proving and reasoning, areas that are generally quite
difficult for students to master (Chazan, 1993; Harel & Sowder, 1998; Mariotti, 2006).
Study One (Chapter Two) presented an analysis of tasks as appeared in
curricular/instructional materials; that is, the GCN tasks included in the
curricular/instructional materials used by one Taiwanese mathematics teacher, Nancy.
The analysis revealed that the Taiwanese teacher used tasks drawn from several sources,

213
including not only the class textbook series, but also tasks of tests, tasks created by
herself, and some in the supplemental materials that were collaboratively developed by
her school colleagues. The analysis also revealed that these GCN tasks varied with
respect to cognitive complexity, but that a substantial number of the tasks situated in
auxiliary instructional materials, especially those for use in tests, were cognitively
demanding because they required students to (1) visualize the sub-constructs in complex
diagram configurations; (2) check if auxiliary lines are needed to solve the tasks; (3)
generate solutions with multiple reasoning steps that use multiple geometric properties;
and (4) apply multiple transformations to map corresponding reference diagrams onto the
GCN task diagrams. The high demand tasks, in particular, afford opportunities for
Taiwanese students to master the types of knowledge and the reasoning and problem-
solving skills that are essential in creating GP.
Study Two (Chapter Three) presented an analysis of tasks as enacted in the
classroom; that is, how Nancy set up and enacted these GCN tasks with her students. Of
particular interest were that ways that Nancy sustained the engagement of her students
with cognitively demanding GCN tasks involving complex diagram configurations.
When solving these tasks with complex diagrams, students cannot merely apply
information from geometric statements listed in the textbooks and corresponding
reference diagrams as well as their previous experiences solving simple problems; instead
they need to combine multiple facets of their geometric knowledge and their reasoning
and problem-solving skills in novel ways. Through scaffolded experiences with GCN
tasks containing complex diagrams, the teacher appeared to nurture students’ competence
in constructing and reasoning about geometric relationships in ways that are very likely
214
to support their later work with GP. Another facet of the analysis in this study focused on
the teacher’s use of gestures to facilitate students’ sustained engagement with complex
GCN tasks. For example, Nancy used a range of gestural moves to scaffold students
visualizing the complex diagram configurations. The ability to visualize the diagram
configurations allowed students to keep working on the task and figure out the solutions
themselves. Taken together, the findings of Studies One and Two offer a glimpse at
classroom instruction in Taiwan involving GCN tasks and sketch a plausible pathway for
Taiwanese students to gain competence through their experiences with GCN tasks in
curricular/instruction materials in ways that are highly likely to support their later success
with GP.
Study Three (Chapter Four) presented an analysis of student learning related to
GCN tasks; that is, Taiwanese students’ performance on a carefully constructed set of
GCN and GP tasks, which use the same diagrams and require the same geometric
properties to obtain solutions. The result shows that performance between GCN and GP
for 9th grade students in Taiwan is similar when the diagram configurations and the
geometric properties necessary to obtain solutions are controlled. In other words, Study
Three confirms that Taiwanese students’ prior experiences in solving GCN tasks have a
significant impact on their competence in creating GP.
Taken together the three studies that comprise this dissertation suggest why it
might be the case that Taiwanese students would both develop potential competence in
constructing GP before formal instruction to do so in schools and out-perform students in
other countries on geometric proving and reasoning, as has been shown in the particular
case of Germany (Heinze, Cheng, & Yang, 2004). In addition, the three studies taken

215
together appear to have implications for other research that might seek to understand
cross-national differences in mathematics performance.
Investigations of Students’ Performance in East Asian Countries
Numerous cross-national comparisons of mathematics performance have been
conducted in recent years (Heinze, Cheng, & Yang, 2004; Mullis, Martin, & Foy, 2008;
Mullis, Martin, Gonzalez, & Chrostowski, 2004; Mullis et al., 2000; OECD, 2004) to
examine differences in students’ performance among countries and to identify factors
associated with those differences. Researchers have focused on a number of different
aspects of macro-level and micro-level factors in these investigations, ranging from
country-level differences in curriculum, school organization and management and
economic prosperity to school-level and classroom-level differences in teacher
qualifications, instructional practices, and the enacted curriculum. One of the major
thrusts is this body of work has been to examine the curriculum, usually the official
textbooks, attempting to understand the relationship between curriculum and students’
learning (Charalambous, Delaney, Hsu, & Mesa, 2010; Fan & Zhu, 2007; Fujita & Jones,
2002; Fuson, Stigler, & Bartsch, 1988; Howson, 1995; Li, Chen, & An, 2009; Lo, Cai, &
Watanabe, 2001; Mayer, Sims, & Tajika, 1995; Son & Senk, 2010; Stevenson & Bartsch,
1992; Stigler, Fuson, Ham, & Kim, 1986; Valverde, Bianchi, Wolfe, Schmidt, & Houang,
2002; Zhu & Fan, 2006). Another major thrust of many of these investigations has been
to examine classroom instruction to elaborating how instruction influences student
learning outcomes (Hiebert et al., 2003; Jacobs & Morita, 2002; Leung, 1995; 2005;
Santagata, 2005; Santagata & Barbieri, 2005; Santagata & Stigler, 2000; Stigler &
Hiebert, 1999; 2004).

216
Especially popular have been studies examining performance differences between
students in Western countries and their counterparts in East Asian countries. These
studies have identified a number of similarities and differences in mathematics education
between the two sets of countries and have used these similarities and differences to
explain the diversity in students’ mathematics performance. However, these studies are
also limited in comprehensively outlining the whole story of how learning occurs in East
Asian countries so that the students can consistently perform so highly in assessments of
mathematical proficiency.
Most studies might be called vertical-dimension investigations, exploring a single
factor (e.g., textbooks) that can partially explain the differences in students’ learning
outcomes. In contrast the three studies that comprise this dissertation might be seen as a
horizontal-dimension approach that examines a sequence of factors in the teaching-
learning trajectory with respect to geometric tasks in East Asian countries, an approach
that might have the potential to explain more fully the observed high levels of
performance in specific areas of mathematics (geometry reasoning and proof, in this
case). Although this is a case study of only one Taiwanese classroom with one
mathematics topic, geometric proving and reasoning, the findings do provide an
insightful picture portraying how students in East Asian countries might learn
mathematics through enacting abundant mathematical tasks situated in both official and
auxiliary curricular/instructional materials provided by their teacher.
In addition, though instruction in East Asian countries, especially at the middle
school levels, can be described as teacher-centered, in that teachers usually talk more
than students (Leung, 2002; 2005), the analysis of gestures, a non-verbal communication
217
way, also suggest caution about focusing only on verbal utterances to understand the
instructional practice of Asian teachers; non-verbal communication by teachers in East
Asian countries’ classrooms may also influence students’ learning. For example, as
students frequently work on tests, it is possible that a mathematics teacher can diagnose
students’ misconceptions by evaluating their responses to test items and then use
classroom lectures to help students understand the misconceptions. It is also possible that
a skillful mathematics teacher can identify students’ facial expressions to know if
students follow the lectures and understand the mathematics without the need for any
verbal communication. While classroom teachers may use non-verbal communications to
facilitate students’ learning, students in teacher-centered and examination-oriented
classroom may also learn the mathematics that cannot be identified by examining the
verbal communication between teacher and students. For example, it can be the case that
students learn mathematics by practicing abundant mathematical tasks and evaluate their
learning by checking the answers to the tasks. In this regard, the students do not
necessitate to participating in classroom discussion. When they have problems regarding
the challenging tasks, they can listen to classroom lectures to know the solutions. These
possibilities all can make learning occur in a teacher-centered and examination-oriented
classroom in East Asian countries, and should be carefully considered in interpreting and
understanding the differences in students’ performance in cross-national comparisons.
Using the MTF Framework to Investigate Student Learning Outcomes
In a recent paper commenting on cross-national comparison studies involving
East Asian countries, Silver (2009) suggested that differences in students’ learning across
countries might be understood by analyzing mathematical tasks together with their
218
cognitive demand levels using the three-stage MTF: tasks as they appear in
curricular/instructional materials; tasks as set up by classroom teachers; and tasks as
enacted by classroom teacher and students. These three stages have clear consequences
for students’ learning outcomes. In this regard, this dissertation provides a good example
to support Silver’s assertion that the MTF could be a core frame for an investigation of
factors accounting for the differences in students’ performance in cross-national
comparisons.
First, this dissertation provides the evidence that auxiliary curricular/instructional
materials can have strong influence on students’ learning outcomes. In line with Stein and
Smith (1998), they clarified that the pages in official printed textbooks are not the only
curricular materials considered in influencing students’ learning outcomes but also the
auxiliary materials that a teacher may use in the classroom. Examination of official
curriculum, usually the textbooks, among countries like most studies did is limited in
exploring students’ learning opportunities because auxiliary curricular/instructional
materials can possess a high portion of mathematical tasks with diverse opportunities in
East Asian countries.
Second, this dissertation also anchors the importance of sustaining the cognitive
demand levels when setting up and enacting mathematical tasks with classroom students.
The dissertation presents how Taiwanese mathematics teacher carefully sustained the
cognitive demand of tasks and used different instructional strategies to make students’
learning occur; these efforts can have significant impact on students’ learning outcomes.
Finally, as the first three stages in the MTF framework have strong consequence
on students’ learning, the survey study also shows how including abundant GCN tasks,
219
setting up these tasks, and enacting them with students can greatly influence students’
competence not only in solving GCN but also in constructing GP. Taken together with
the three studies, this dissertation provides an example to illustrate the influence of
mathematical tasks as one of key factors to East Asian students’ out-performance in
cross-national comparisons.

220
REFERENCES
Charalambous, C., Delaney, S., Hsu, H.-Y., & Mesa, V. (2010). A comparative analysis of the addition and subtraction of fractions in textbooks from three countries. International Journal for Mathematical Thinking and Learning, 12(2), 117-151.
Chazan, D. (1993). High school geometry students' justification for their views of empirical evidence and mathematical proof. Educational Studies in Mathematics,
24, 359-387.
Fan, L., & Zhu, Y. (2007). Representation of problem-solving procedures: A comparative look at China, Singapore, and US mathematics textbooks. Educational Studies in
Mathematics, 66, 61-75.
Fujita, T., & Jones, K. (2002). Opportunities for the development of geometrical reasoning in current textbooks in the UK and Japan. Proceedings of the British
Society for Research into Learning Mathematics, 22(3), 79-84.
Fuson, K., Stigler, J., & Bartsch, K. (1988). Grade placement of addition and subtraction topics in Japan, Mainland China, the Soviet Union, Taiwan, and the United States. Journal for Research in Mathematics Education, 19(5), 449-456.
Harel, G., & Sowder, L. (1998). Students' proof schemes: Results from exploratory studies. CBMS Issues in Mathematics Education, 7, 234-283.
Heinze, A., Cheng, Y.-H., & Yang, K.-L. (2004). Students' performance in reasoning and proof in Taiwan and Germany: Results, paradoxes and open questions. ZDM,
36(5), 162-171.
Hiebert, J., Gallimore, R., Garnier, H., Givvin, K., Hollingsworth, H., Jacobs, J., et al. (2003). Teaching mathematics in seven countries. Washington: National Center for Education Statistics.
Howson, G. (1995). TIMSS monograph No. 3: Mathematics textbooks: A comparative
study of grade 8 texts. Vancouver, BC: Pacific Educational Press.
Jacobs, J., & Morita, E. (2002). Japanese and American teachers' evaluations of videotaped mathematics lessons. Journal for Research in Mathematics Education,
33(3), 154-175.
Leung, F. K. S. (1995). The mathematics classroom in Beijing, Hong Kong and London. Educational Studies in Mathematics, 29, 297-325.
Leung, F. K. S. (2002). In search of an East Asian identity in mathematics education. Educational Studies in Mathematics, 47, 35-51.
Leung, F. K. S. (2005). Some characteristics of East Asian mathematics classrooms based on data from the TIMSS video study. Educational Studies in Mathematics, 60, 199-215.
Li, Y., Chen, X., & An, S. (2009). Conceptualizing and organizing content for teaching and learning in selected Chinese, Japanese and US mathematics textbooks: The case of fraction division. ZDM-The International Journal on Mathematics
Education, 41, 809-826.

221
Lo, J.-J., Cai, J., & Watanabe, T. (2001). A comparative study of the selected textbooks
from China, Japan, Taiwan and the United States on the teaching of ratio and
proportion concepts. Paper presented at the Annual Meeting of the North American Chapter of the International Group for the Psychology of Mathematics Education.
Mariotti, M. A. (2006). Proof and proving in mathematics education. In Á. Gutiérrez & P. Boero (Eds.), Handbook of research on the psychology of mathematics education (pp. 173-204). Rotterdam: Sense Publishers.
Mayer, R., Sims, V., & Tajika, H. (1995). A comparison of how textbooks teach mathematical problem solving in Japan and the United States. American
Educational Research Journal, 32(2), 443-460.
Mullis, I. V. S., Martin, M. O., & Foy, P. (2008). TIMSS 2007 international mathematics
report. Chestnut Hill, MA: TIMSS & PIRLS International Study Center, Boston College.
Mullis, I. V. S., Martin, M. O., Gonzalez, E. J., & Chrostowski, S. J. (2004). TIMSS 2003
international mathematics report: Findings from the IEA's Trends in
International Mathematics and Sciences Study at the fourth and eighth grades. Chestnut Hill, MA: TIMSS & PIRLS International Study Center.
Mullis, I. V. S., Martin, M. O., Gonzalez, E. J., Gregory, K. D., O'Connor, K. M., Chrostowski, S. J., et al. (2000). International mathematics report: Findings from
IEA's repeat of the third international mathematics and science study at the eighth
grade. Chestnut Hill, MA: International Study Center.
OECD. (2004). Learning for tomorrow's world-First results from PISA 2003. Paris: Organization for Economic Co-operation and Development.
Santagata, R. (2005). Practices and beliefs in mistake-handling activities: A video study of Italian and US mathematics lessons. Teaching and Teacher Education, 21, 491-508.
Santagata, R., & Barbieri, A. (2005). Mathematics teaching in Italy: A cross-cultural video analysis. Mathematical Thinking and Learning, 7(4), 291-312.
Santagata, R., & Stigler, J. (2000). Teaching mathematics: Italian lessons from a cross-cultural perspective. Mathematical Thinking and Learning, 2(3), 191-208.
Silver, E. (2009). Cross-national comparisons of mathematics curriculum materials: What might we learn? ZDM-The International Journal on Mathematics Education, 41, 827-832.
Son, J.-W., & Senk, S. (2010). How reform curricula in the USA and Korea present multiplication and division of fractions. Educational Studies in Mathematics,
74(2), 117-142.
Stein, M., & Smith, M. (1998). Mathematical tasks as a framework for reflection: From research to practice. Mathematics Teaching in the Middle School, 3, 268-275.
Stevenson, H., & Bartsch, K. (1992). An analysis of Japanese and American textbooks in
mathematics. Ann Arbor: Center for Japanese Studies, University of Michigan.
222
Stigler, J., Fuson, K., Ham, M., & Kim, M. (1986). An analysis of addition and subtraction word problems in American and Soviet elementary mathematics textbook. Cognition and Instruction, 3(3), 153-171.
Stigler, J., & Hiebert, J. (1999). The teaching gap: Best ideas from the world's teachers
for improving education in the classroom. New York: Free Press.
Stigler, J., & Hiebert, J. (2004). Improving mathematics teaching. Educational
Leadership, 61(5), 12-16.
Valverde, G., Bianchi, L., Wolfe, R., Schmidt, W., & Houang, R. (2002). According to
the book: Using TIMSS to investigate the translation of policy into practice
through the world of textbooks. Dordrecht: Kluwer.
Zhu, Y., & Fan, L. (2006). Focus on the representation of problem types in intended curriculum: A comparison of selected mathematics textbooks from mainland China and The United States. International Journal of Science and Mathematics
Education, 4, 609-626.