Embed Size (px)
Citation preview

The student learning experience2012 Survey
Bahram BekhradniaDirector, HEPI
22 May 2012

Scheduled hours of teaching by subject (2006, 2007 and 2012)
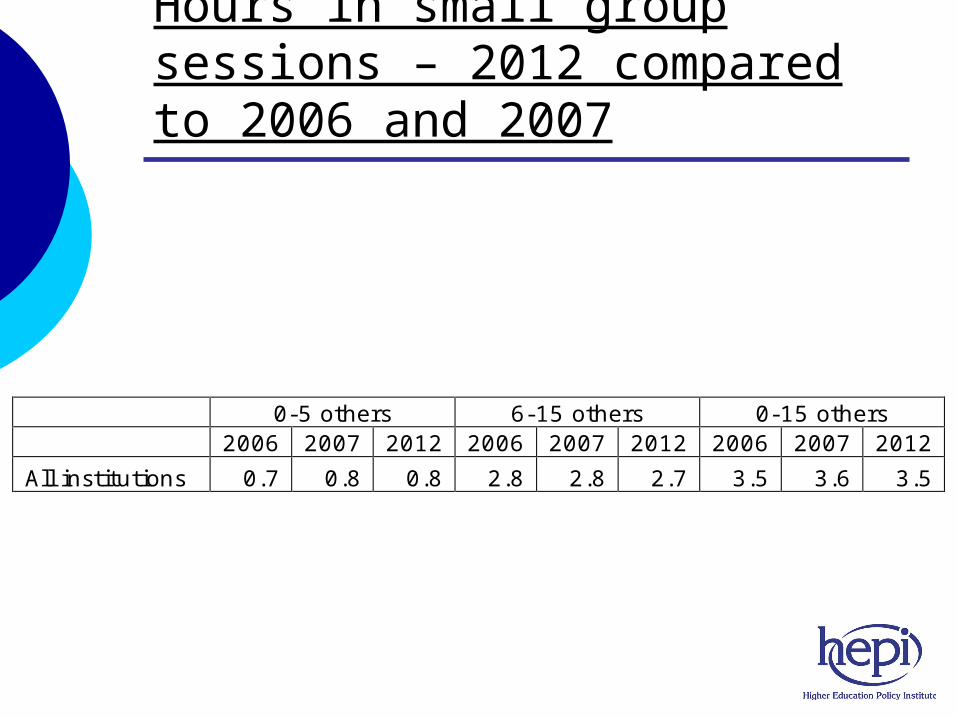
Hours in small group sessions – 2012 compared to 2006 and 2007
0-5 others 6-15 others 0-15 others 2006 2007 2012 2006 2007 2012 2006 2007 2012
All institutions 0.7 0.8 0.8 2.8 2.8 2.7 3.5 3.6 3.5
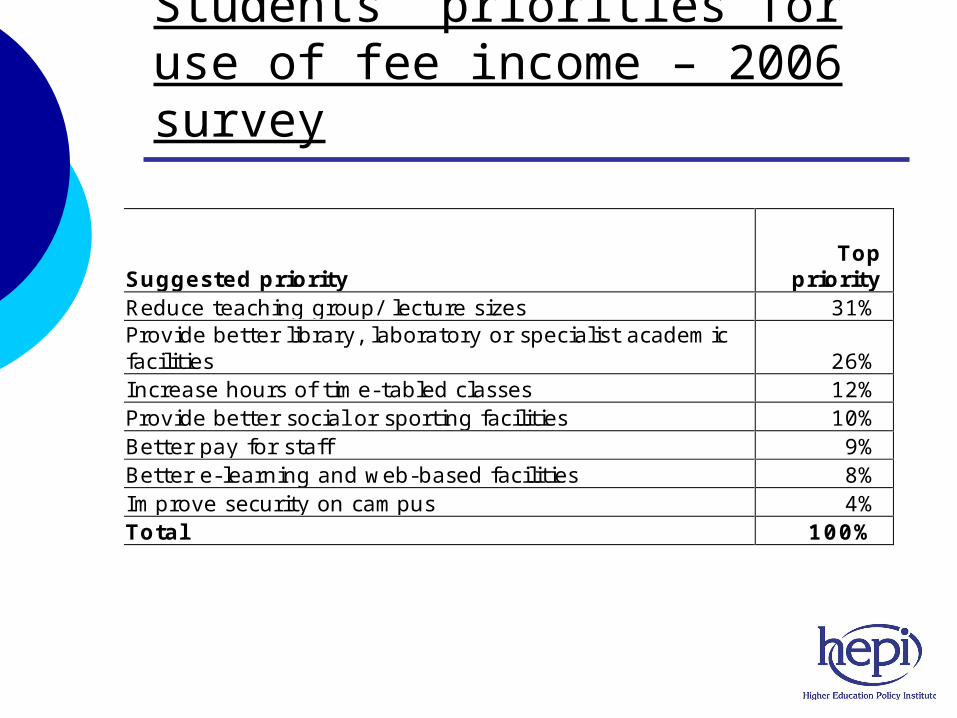
Students’ priorities for use of fee income – 2006 survey
Suggested priority Top
priority Reduce teaching group/ lecture sizes 31% Provide better library, laboratory or specialist academic facilities 26% Increase hours of time-tabled classes 12% Provide better social or sporting facilities 10% Better pay for staff 9% Better e-learning and web-based facilities 8% Improve security on campus 4% Total 100%

Satisfaction with the number of time-tabled classes
0%
5%
10%
15%
20%
25%
30%
35%
40%
45%
50%
1 to 7 8 to 10 11 to 15 16 to 20 21 to 25 > 25
Disagree somewhat
Disagree strongly
Prop
ortio
n of
resp
onde
nts
Scheduled hours

Hours of Private Study by subject

Total Workload by subject (2012)
0.0
5.0
10.0
15.0
20.0
25.0
30.0
35.0
40.0
Private study Attended hours

Student workload by subject – highest and lowest institutional mean hours per week
Subject
Highest institutional
mean
Lowest institutional
mean
Median of institutional
means Medicine and dentistry 46.3 26.3 35.5 Subjects allied to medicine 38.3 24.6 31.2 Biological Sciences 39.9 15.0 24.5 Veterinary agriculture and related 41.6 23.5 37.0 Physical Sciences 45.3 19.8 27.6 Mathematical & Computer Sciences 36.4 17.1 26.2 Engineering & technology 41.2 20.8 28.7 Architecture, Building & Planning 41.5 26.3 28.5 Social studies 35.8 14.0 21.6 Law 44.8 18.7 26.2 Business & Administrative studies 28.3 15.5 20.8 Mass Communications & Documentation 26.8 14.7 19.4 Linguistics, Classics & related subjects 39.3 14.8 22.3 Historical & Philosophical studies 39.5 14.0 21.5 Creative Arts & Design 34.5 17.2 25.6 Education 33.7 14.4 25.5
Note: Average of 2006 and 2007 results combined

Workload & different types of institution
Pre-92 Post-92 Other All
Medicine and dentistry 37.3 34.5 36.5 37.2
Subjects allied to medicine 32.4 33.0 31.7 32.8 Biological sciences 27.9 24.2 23.2 26.0 Veterinary sciences, agriculture & related subjects
37.9 27.0 34.9 32.0
Physical sciences 31.4 25.7 25.9 29.3 Mathematical & Computer Sciences 29.4 26.6 31.0 28.0 Engineering and technology 31 26.7 24.7 28.9 Architecture, building and planning 38.8 34.3 27.7 35.0 Social studies 24.7 23.6 25.6 24.2 Law 31 26.5 37.0 28.6 Business and administrative studies 23.3 20.5 21.6 21.3 Mass communications and documentation
18.1 20.4 23.0 20.1
Languages 27.4 24.6 20.4 26.5 Historical and philosophical studies 28 23.9 20.5 26.2 Creative arts and design 28.1 28.6 34.3 29.3 Education 26.9 25.9 23.3 25.6 All subjects 28.6 25.9 29.3 27.2

On the other hand – different aspects of provision
Hours in small group sessions – old and new universities
0-5 others 6-15 others 0-15 others
All institutions 0.8 2.7 3.5
Pre 92 0.8 2.4 3.2
Post 92 0.8 2.9 3.7
Other 1.1 3.7 4.8
Summary table - teaching led by academics by type of teaching (per cent) (2007 data) Pre-92
universities Post-92 universities & others
Lectures 98 99 Seminars 70 92 Tutorials 70 93 Practicals 64 83 Fieldwork 74 85

Relationship (or lack of) between satisfaction as revealed in the National Student Survey and contact time and total study time
Global score for full-time core population
Total % satisfied
(from NSS)
Percentage points above
or below average (81%)
(from NSS)
contact hours (from this survey)
Total study effort (from this survey)
Creative arts and design 72 -9 12.95 29.34 Mass communications and
documentation 74 -7 9.91 20.12
Computer science 77 -4 Architecture, building and
planning 77 -4 14.47 34.97
Engineering and technology
80 -1 16.58 28.89
Education 81 0 12.33 25.58 Social studies 81 0 10.23 24.21
Medicine and dentistry 83 2 20.38 37.15 Veterinary sciences 87 5 17.47 31.96
Subjects allied to medicine 85 3 17.93 32.76 Biological sciences 85 4 13.23 25.95
Mathematical sciences 87 6 13.88 27.98 Languages 87 6 9.76 26.52
Physical sciences 88 7 15.82 29.33 Historical and
philosophical studies 89 7 8.3 26.21

The student learning experience2012 Survey
Bahram BekhradniaDirector, HEPI
22 May 2012


![[Bahram Farahmand] Fracture Mechanics of Metals, C(BookFi.org)](https://img.dokumen.tips/doc/110x75/55cf9a81550346d033a21084/bahram-farahmand-fracture-mechanics-of-metals-cbookfiorg.jpg)