Embed Size (px)
Citation preview
1/15/2008
1
The Student-Athlete
Perspective of the
College Experience
Findings from the
NCAA GOALS and SCORE Studies
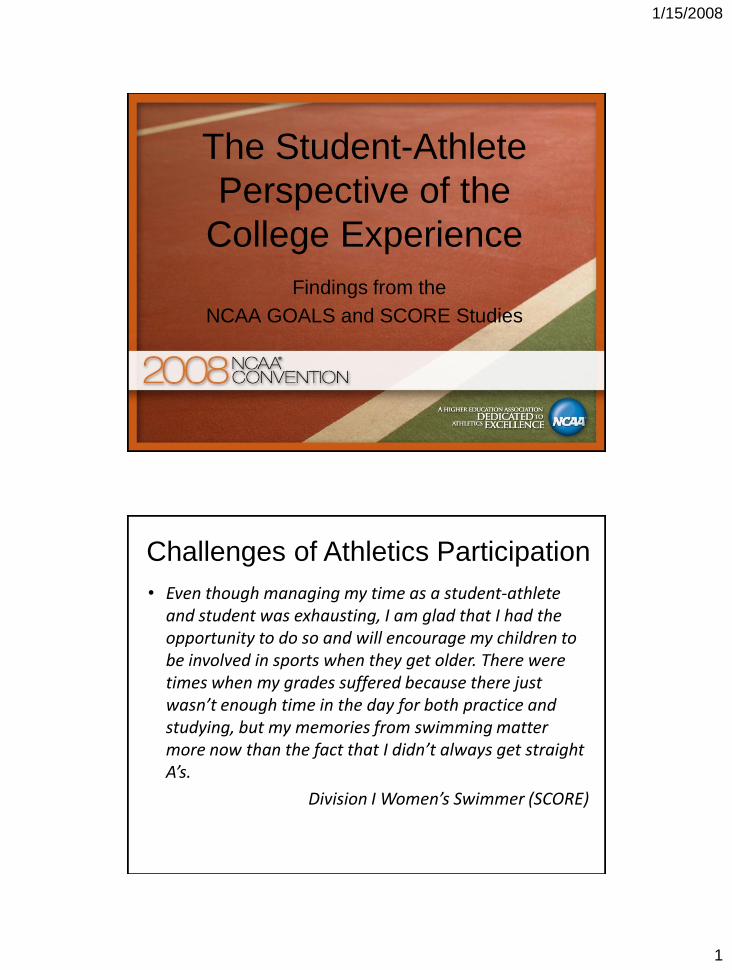
Challenges of Athletics Participation
• Even though managing my time as a student-athlete and student was exhausting, I am glad that I had the opportunity to do so and will encourage my children to be involved in sports when they get older. There were times when my grades suffered because there just wasn’t enough time in the day for both practice and studying, but my memories from swimming matter more now than the fact that I didn’t always get straight A’s.
Division I Women’s Swimmer (SCORE)
1/15/2008
2
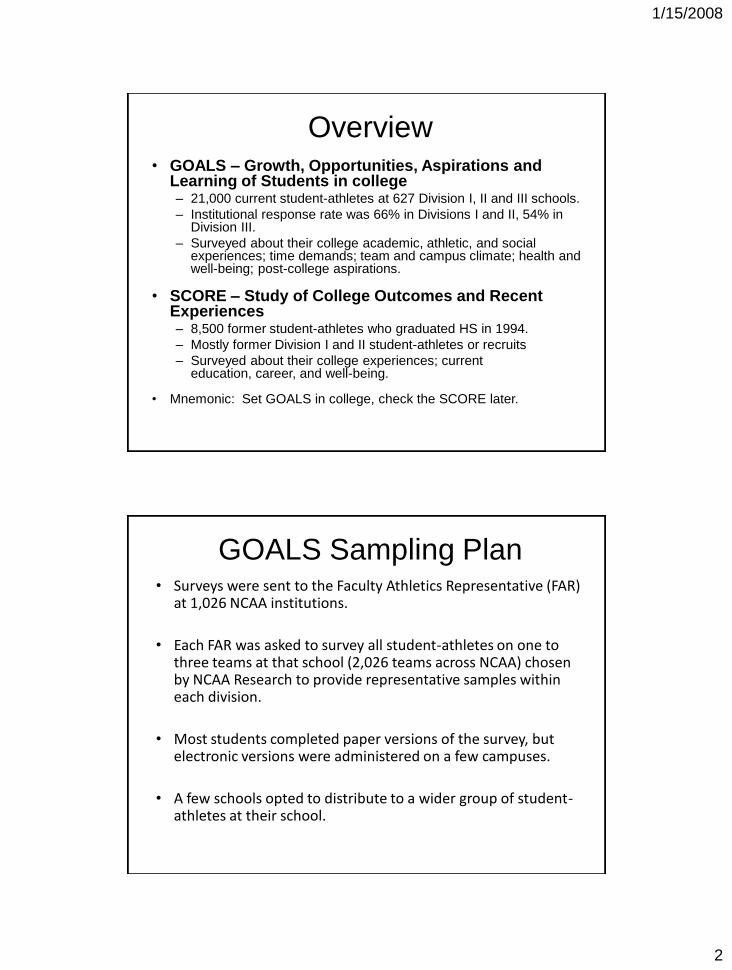
Overview• GOALS – Growth, Opportunities, Aspirations and
Learning of Students in college – 21,000 current student-athletes at 627 Division I, II and III schools.
– Institutional response rate was 66% in Divisions I and II, 54% in Division III.
– Surveyed about their college academic, athletic, and social experiences; time demands; team and campus climate; health and well-being; post-college aspirations.
• SCORE – Study of College Outcomes and Recent Experiences– 8,500 former student-athletes who graduated HS in 1994.
– Mostly former Division I and II student-athletes or recruits
– Surveyed about their college experiences; current education, career, and well-being.
• Mnemonic: Set GOALS in college, check the SCORE later.
GOALS Sampling Plan• Surveys were sent to the Faculty Athletics Representative (FAR)
at 1,026 NCAA institutions.
• Each FAR was asked to survey all student-athletes on one to three teams at that school (2,026 teams across NCAA) chosen by NCAA Research to provide representative samples within each division.
• Most students completed paper versions of the survey, but electronic versions were administered on a few campuses.
• A few schools opted to distribute to a wider group of student-athletes at their school.
1/15/2008
3
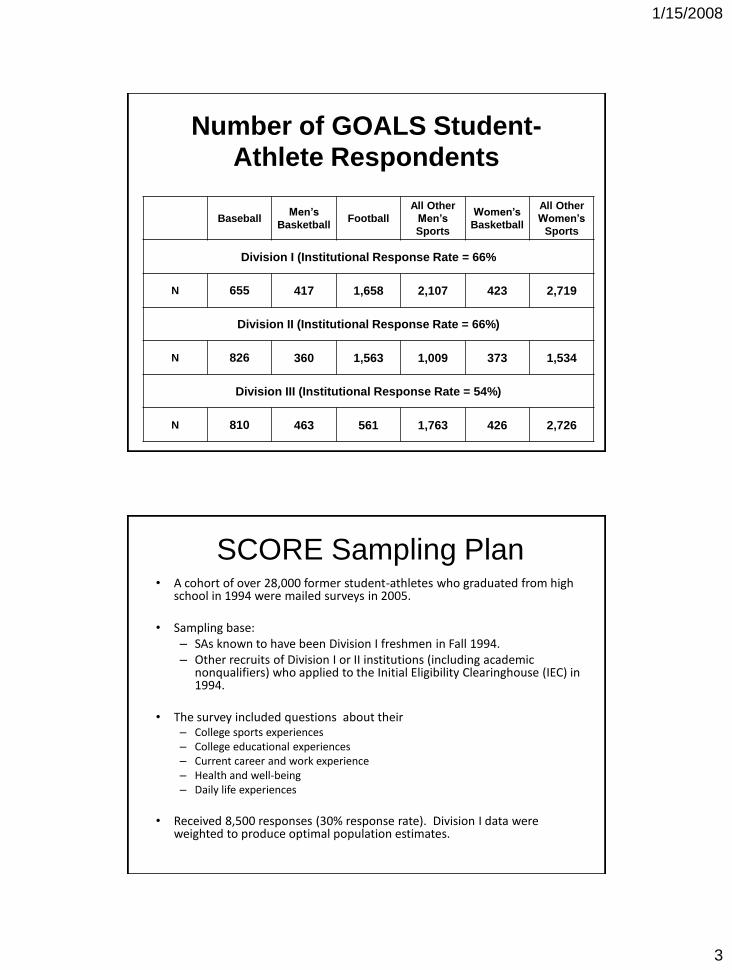
Number of GOALS Student-Athlete Respondents
BaseballMen’s
BasketballFootball
All Other
Men’s
Sports
Women’s
Basketball
All Other
Women’s
Sports
Division I (Institutional Response Rate = 66%
N 655 417 1,658 2,107 423 2,719
Division II (Institutional Response Rate = 66%)
N 826 360 1,563 1,009 373 1,534
Division III (Institutional Response Rate = 54%)
N 810 463 561 1,763 426 2,726
SCORE Sampling Plan• A cohort of over 28,000 former student-athletes who graduated from high
school in 1994 were mailed surveys in 2005.
• Sampling base:– SAs known to have been Division I freshmen in Fall 1994.– Other recruits of Division I or II institutions (including academic
nonqualifiers) who applied to the Initial Eligibility Clearinghouse (IEC) in 1994.
• The survey included questions about their– College sports experiences– College educational experiences– Current career and work experience– Health and well-being– Daily life experiences
• Received 8,500 responses (30% response rate). Division I data were weighted to produce optimal population estimates.
1/15/2008
4
KEY FINDINGS FROM THE GOALS and SCORE STUDIES
Finding #1: Student-
athletes report being
actively engaged in their
academic experience –
both in and out of the classroom.
1/15/2008
5
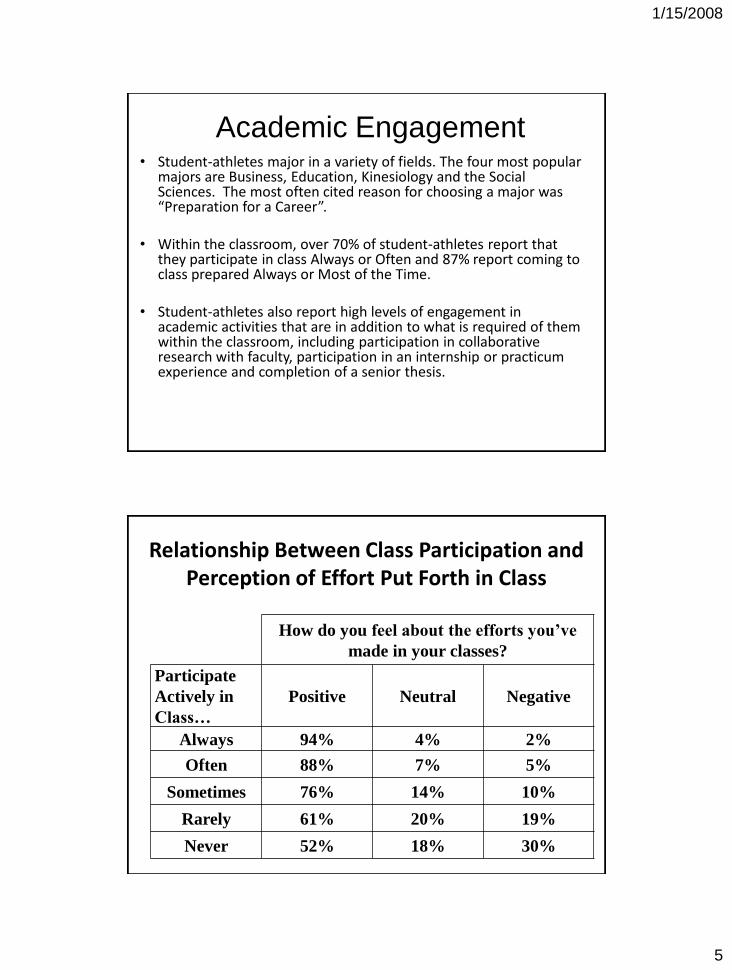
Academic Engagement• Student-athletes major in a variety of fields. The four most popular
majors are Business, Education, Kinesiology and the Social Sciences. The most often cited reason for choosing a major was “Preparation for a Career”.
• Within the classroom, over 70% of student-athletes report that they participate in class Always or Often and 87% report coming to class prepared Always or Most of the Time.
• Student-athletes also report high levels of engagement in academic activities that are in addition to what is required of them within the classroom, including participation in collaborative research with faculty, participation in an internship or practicum experience and completion of a senior thesis.
Relationship Between Class Participation and Perception of Effort Put Forth in Class
How do you feel about the efforts you’ve
made in your classes?
Participate
Actively in
Class…
Positive Neutral Negative
Always 94% 4% 2%
Often 88% 7% 5%
Sometimes 76% 14% 10%
Rarely 61% 20% 19%
Never 52% 18% 30%
1/15/2008
6
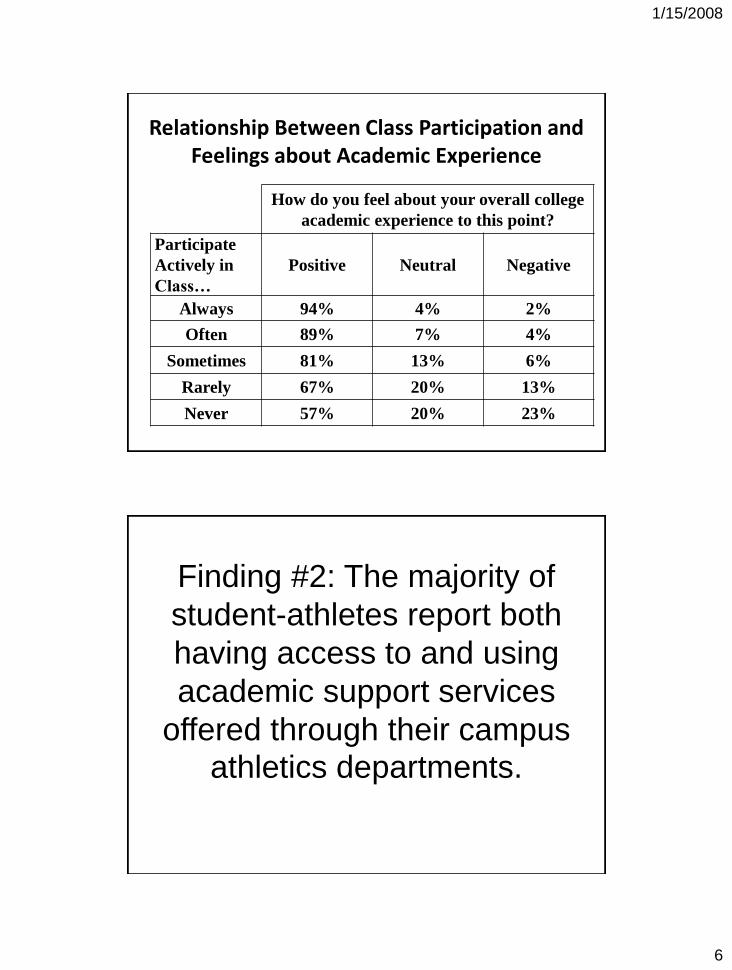
Relationship Between Class Participation and Feelings about Academic Experience
How do you feel about your overall college
academic experience to this point?
Participate
Actively in
Class…
Positive Neutral Negative
Always 94% 4% 2%
Often 89% 7% 4%
Sometimes 81% 13% 6%
Rarely 67% 20% 13%
Never 57% 20% 23%
Finding #2: The majority of
student-athletes report both
having access to and using
academic support services
offered through their campus
athletics departments.
1/15/2008
7
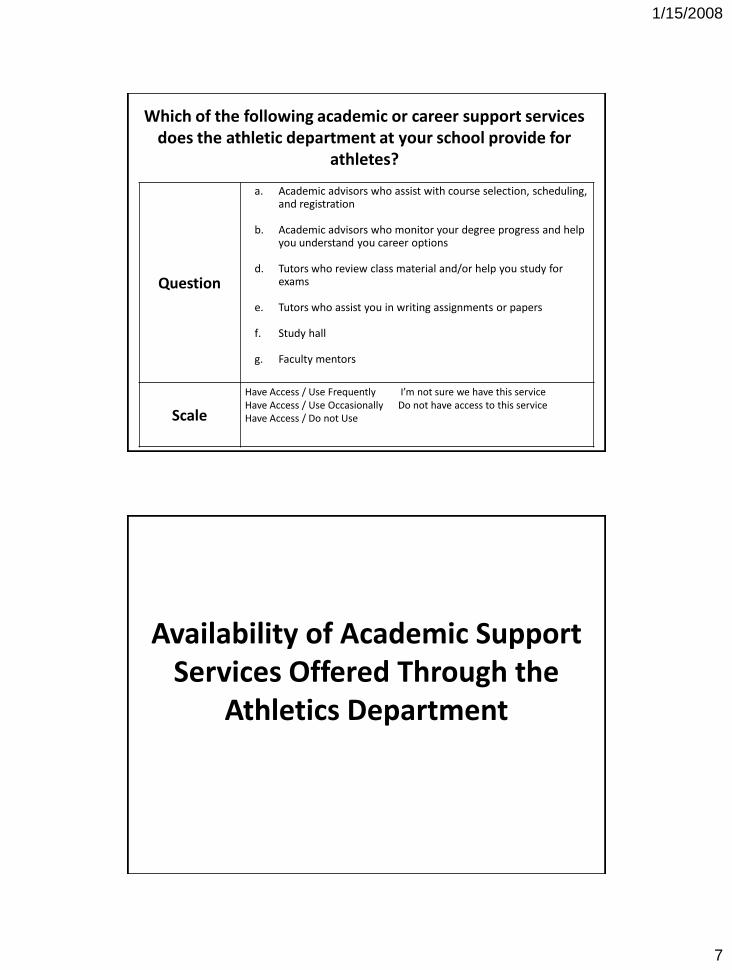
Which of the following academic or career support services does the athletic department at your school provide for
athletes?
Question
a. Academic advisors who assist with course selection, scheduling, and registration
b. Academic advisors who monitor your degree progress and help you understand you career options
d. Tutors who review class material and/or help you study for exams
e. Tutors who assist you in writing assignments or papers
f. Study hall
g. Faculty mentors
Scale
Have Access / Use Frequently I’m not sure we have this serviceHave Access / Use Occasionally Do not have access to this serviceHave Access / Do not Use
Availability of Academic Support Services Offered Through the
Athletics Department
1/15/2008
8
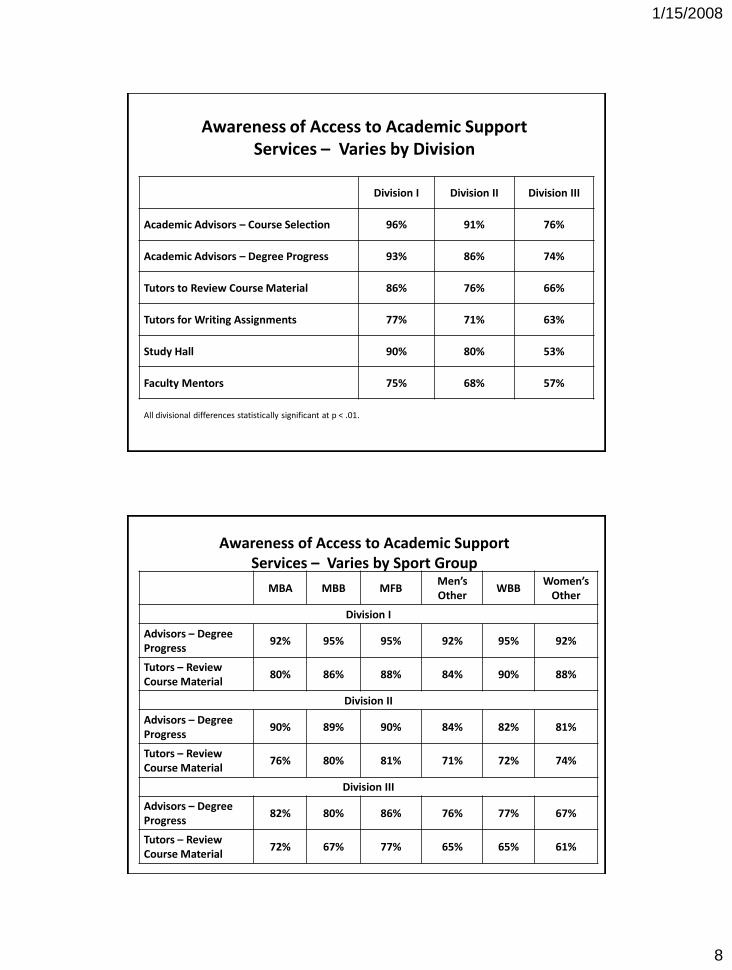
Awareness of Access to Academic Support Services – Varies by Division
Division I Division II Division III
Academic Advisors – Course Selection 96% 91% 76%
Academic Advisors – Degree Progress 93% 86% 74%
Tutors to Review Course Material 86% 76% 66%
Tutors for Writing Assignments 77% 71% 63%
Study Hall 90% 80% 53%
Faculty Mentors 75% 68% 57%
All divisional differences statistically significant at p < .01.
Awareness of Access to Academic Support Services – Varies by Sport Group
MBA MBB MFBMen’s Other
WBBWomen’s
Other
Division I
Advisors – Degree Progress
92% 95% 95% 92% 95% 92%
Tutors – Review Course Material
80% 86% 88% 84% 90% 88%
Division II
Advisors – Degree Progress
90% 89% 90% 84% 82% 81%
Tutors – Review Course Material
76% 80% 81% 71% 72% 74%
Division III
Advisors – Degree Progress
82% 80% 86% 76% 77% 67%
Tutors – Review Course Material
72% 67% 77% 65% 65% 61%
1/15/2008
9
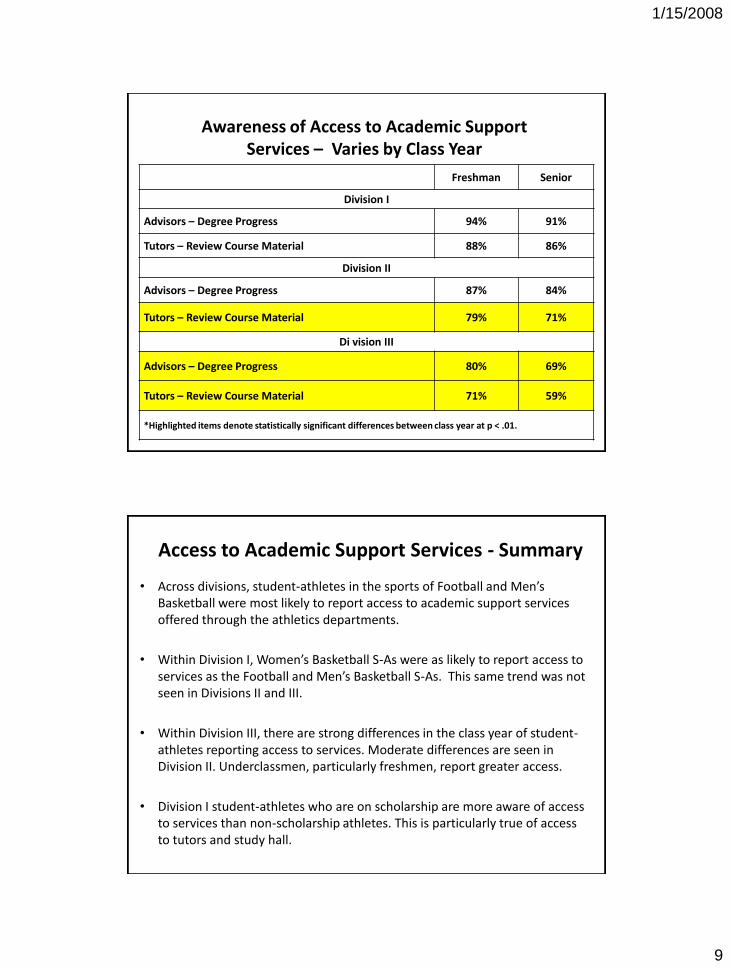
Awareness of Access to Academic Support Services – Varies by Class Year
Freshman Senior
Division I
Advisors – Degree Progress 94% 91%
Tutors – Review Course Material 88% 86%
Division II
Advisors – Degree Progress 87% 84%
Tutors – Review Course Material 79% 71%
Di vision III
Advisors – Degree Progress 80% 69%
Tutors – Review Course Material 71% 59%
*Highlighted items denote statistically significant differences between class year at p < .01.
Access to Academic Support Services - Summary
• Across divisions, student-athletes in the sports of Football and Men’s Basketball were most likely to report access to academic support services offered through the athletics departments.
• Within Division I, Women’s Basketball S-As were as likely to report access to services as the Football and Men’s Basketball S-As. This same trend was not seen in Divisions II and III.
• Within Division III, there are strong differences in the class year of student-athletes reporting access to services. Moderate differences are seen in Division II. Underclassmen, particularly freshmen, report greater access.
• Division I student-athletes who are on scholarship are more aware of access to services than non-scholarship athletes. This is particularly true of access to tutors and study hall.
1/15/2008
10
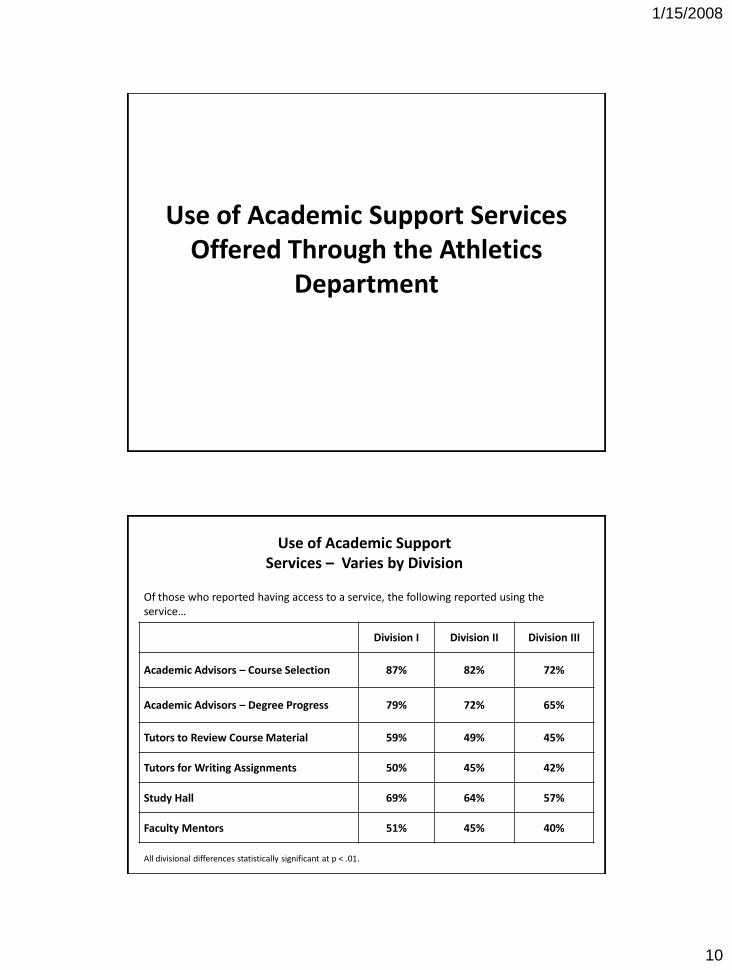
Use of Academic Support Services Offered Through the Athletics
Department
Use of Academic Support Services – Varies by Division
Of those who reported having access to a service, the following reported using the service…
Division I Division II Division III
Academic Advisors – Course Selection 87% 82% 72%
Academic Advisors – Degree Progress 79% 72% 65%
Tutors to Review Course Material 59% 49% 45%
Tutors for Writing Assignments 50% 45% 42%
Study Hall 69% 64% 57%
Faculty Mentors 51% 45% 40%
All divisional differences statistically significant at p < .01.
1/15/2008
11
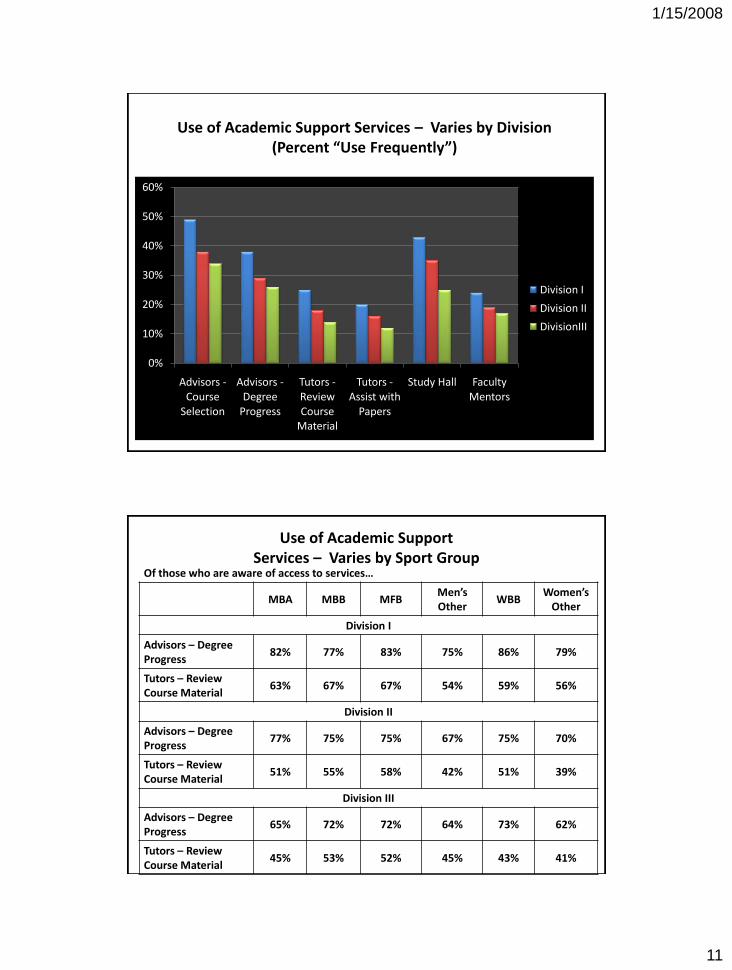
Use of Academic Support Services – Varies by Division(Percent “Use Frequently”)
0%
10%
20%
30%
40%
50%
60%
Advisors -Course
Selection
Advisors -Degree
Progress
Tutors -Review Course
Material
Tutors -Assist with
Papers
Study Hall Faculty Mentors
Division I
Division II
DivisionIII
Use of Academic Support Services – Varies by Sport Group
Of those who are aware of access to services…
MBA MBB MFBMen’s Other
WBBWomen’s
Other
Division I
Advisors – Degree Progress
82% 77% 83% 75% 86% 79%
Tutors – Review Course Material
63% 67% 67% 54% 59% 56%
Division II
Advisors – Degree Progress
77% 75% 75% 67% 75% 70%
Tutors – Review Course Material
51% 55% 58% 42% 51% 39%
Division III
Advisors – Degree Progress
65% 72% 72% 64% 73% 62%
Tutors – Review Course Material
45% 53% 52% 45% 43% 41%
1/15/2008
12
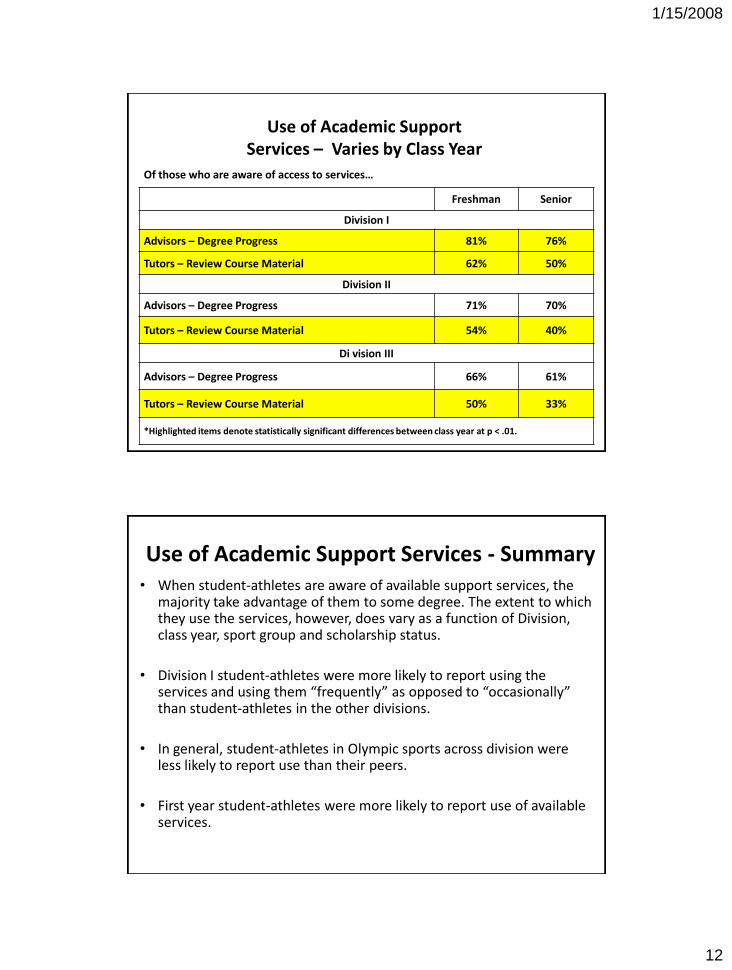
Use of Academic Support Services – Varies by Class Year
Of those who are aware of access to services…
Freshman Senior
Division I
Advisors – Degree Progress 81% 76%
Tutors – Review Course Material 62% 50%
Division II
Advisors – Degree Progress 71% 70%
Tutors – Review Course Material 54% 40%
Di vision III
Advisors – Degree Progress 66% 61%
Tutors – Review Course Material 50% 33%
*Highlighted items denote statistically significant differences between class year at p < .01.
Use of Academic Support Services - Summary• When student-athletes are aware of available support services, the
majority take advantage of them to some degree. The extent to which they use the services, however, does vary as a function of Division, class year, sport group and scholarship status.
• Division I student-athletes were more likely to report using the services and using them “frequently” as opposed to “occasionally” than student-athletes in the other divisions.
• In general, student-athletes in Olympic sports across division were less likely to report use than their peers.
• First year student-athletes were more likely to report use of available services.
1/15/2008
13
Influence of Athletics and Advisors on Academics
• Overall, almost two-thirds of Division I student-athletes believe their GPA would be higher if they had not participated in a sport, compared with about one-half of Division II S-As and 40% of Division III.
• The majority of student-athletes in all sport groups believe their coaches have had a positive influence on their academic careers. There was a significant relationship between perception of coach’s influence and division with Division I student-athletes reporting greater levels of positive influence.
• The majority of student-athletes in all sport groups believe their academic advisors in their athletics department have had a positive influence on their academic careers. Here too, the relationship between perception of influence and division was significant.
Finding #3: The majority of
student-athletes report that
they view themselves more as
athletes than as students.
1/15/2008
14
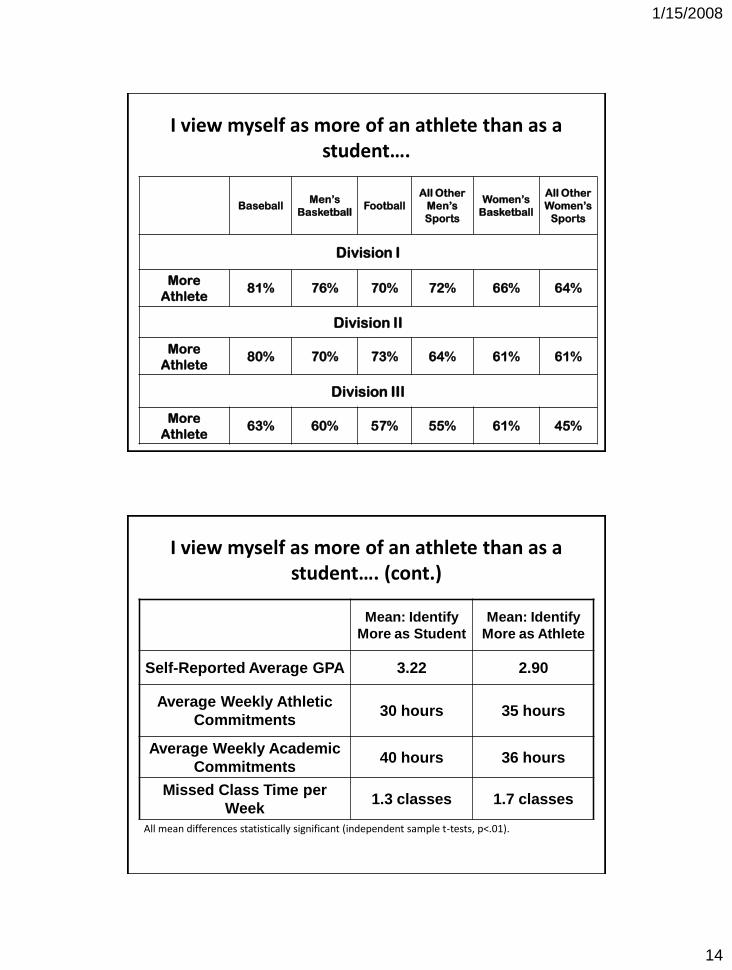
I view myself as more of an athlete than as a student….
BaseballMen’s
BasketballFootball
All Other
Men’s
Sports
Women’s
Basketball
All Other
Women’s
Sports
Division I
More
Athlete81% 76% 70% 72% 66% 64%
Division II
More
Athlete80% 70% 73% 64% 61% 61%
Division III
More
Athlete63% 60% 57% 55% 61% 45%
I view myself as more of an athlete than as a student…. (cont.)
Mean: Identify
More as Student
Mean: Identify
More as Athlete
Self-Reported Average GPA 3.22 2.90
Average Weekly Athletic
Commitments30 hours 35 hours
Average Weekly Academic
Commitments40 hours 36 hours
Missed Class Time per
Week1.3 classes 1.7 classes
All mean differences statistically significant (independent sample t-tests, p<.01).
1/15/2008
15
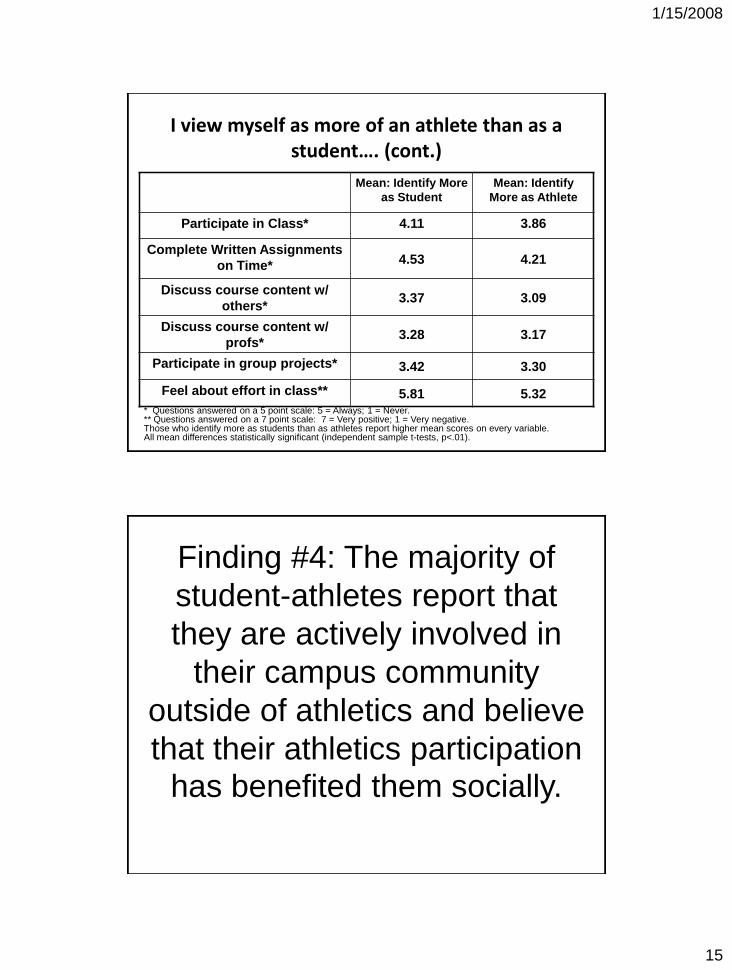
I view myself as more of an athlete than as a student…. (cont.)
Mean: Identify More
as Student
Mean: Identify
More as Athlete
Participate in Class* 4.11 3.86
Complete Written Assignments
on Time* 4.53 4.21
Discuss course content w/
others*3.37 3.09
Discuss course content w/
profs*3.28 3.17
Participate in group projects* 3.42 3.30
Feel about effort in class** 5.81 5.32* Questions answered on a 5 point scale: 5 = Always; 1 = Never.** Questions answered on a 7 point scale: 7 = Very positive; 1 = Very negative.Those who identify more as students than as athletes report higher mean scores on every variable.All mean differences statistically significant (independent sample t-tests, p<.01).
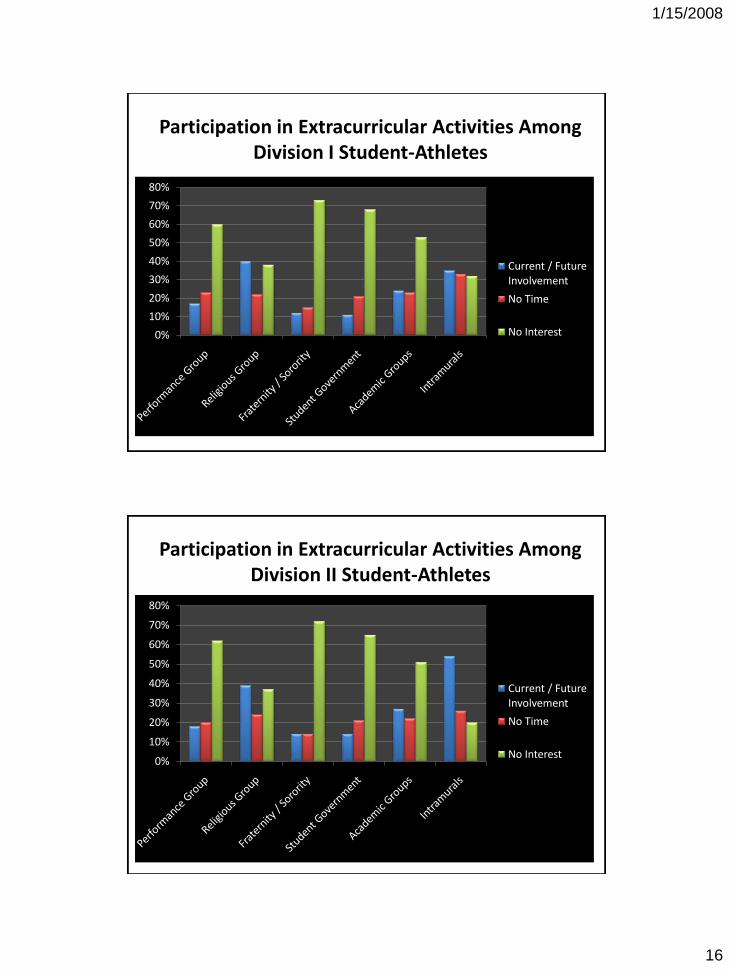
Finding #4: The majority of
student-athletes report that
they are actively involved in
their campus community
outside of athletics and believe
that their athletics participation
has benefited them socially.
1/15/2008
16
Participation in Extracurricular Activities Among Division I Student-Athletes
0%
10%
20%
30%
40%
50%
60%
70%
80%
Current / Future Involvement
No Time
No Interest
Participation in Extracurricular Activities Among Division II Student-Athletes
0%
10%
20%
30%
40%
50%
60%
70%
80%
Current / Future Involvement
No Time
No Interest
1/15/2008
17
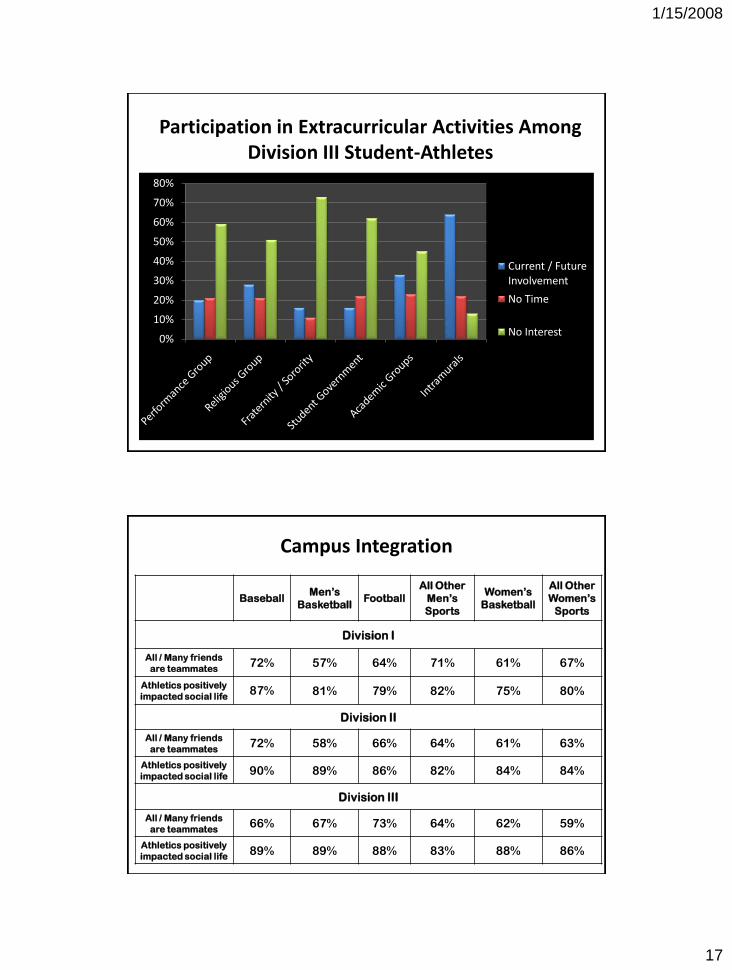
Participation in Extracurricular Activities Among Division III Student-Athletes
0%
10%
20%
30%
40%
50%
60%
70%
80%
Current / Future Involvement
No Time
No Interest
Campus Integration
BaseballMen’s
BasketballFootball
All Other
Men’s
Sports
Women’s
Basketball
All Other
Women’s
Sports
Division I
All / Many friends
are teammates72% 57% 64% 71% 61% 67%
Athletics positively
impacted social life87% 81% 79% 82% 75% 80%
Division II
All / Many friends
are teammates72% 58% 66% 64% 61% 63%
Athletics positively
impacted social life90% 89% 86% 82% 84% 84%
Division III
All / Many friends
are teammates66% 67% 73% 64% 62% 59%
Athletics positively
impacted social life89% 89% 88% 83% 88% 86%
1/15/2008
18
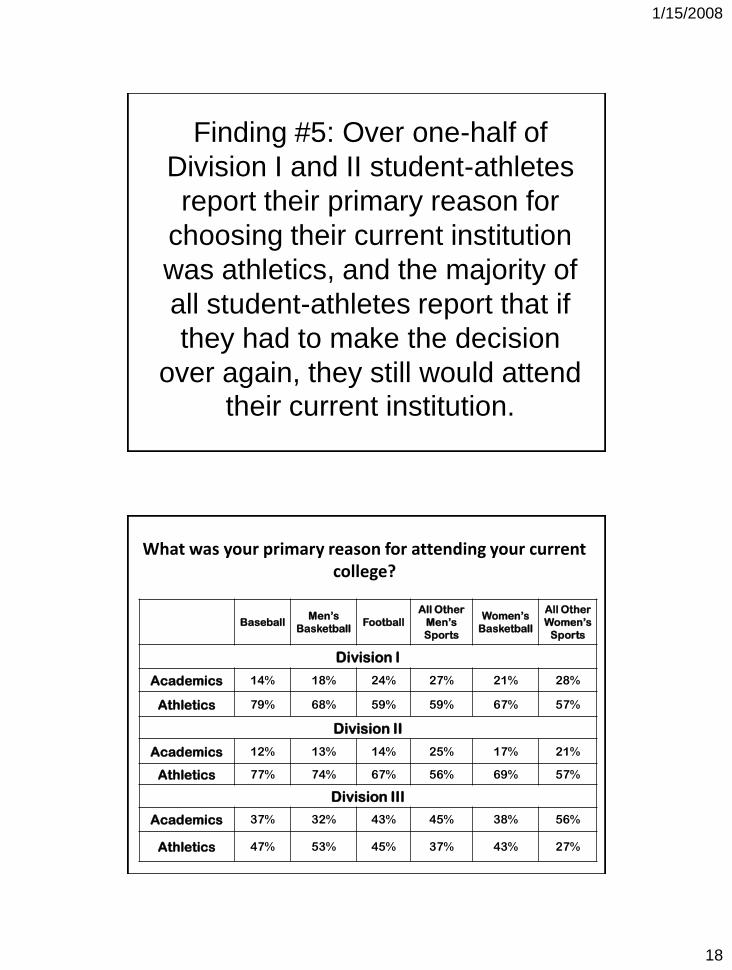
Finding #5: Over one-half of
Division I and II student-athletes
report their primary reason for
choosing their current institution
was athletics, and the majority of
all student-athletes report that if
they had to make the decision
over again, they still would attend
their current institution.
What was your primary reason for attending your current college?
BaseballMen’s
BasketballFootball
All Other
Men’s
Sports
Women’s
Basketball
All Other
Women’s
Sports
Division I
Academics 14% 18% 24% 27% 21% 28%
Athletics 79% 68% 59% 59% 67% 57%
Division II
Academics 12% 13% 14% 25% 17% 21%
Athletics 77% 74% 67% 56% 69% 57%
Division III
Academics 37% 32% 43% 45% 38% 56%
Athletics 47% 53% 45% 37% 43% 27%
1/15/2008
19
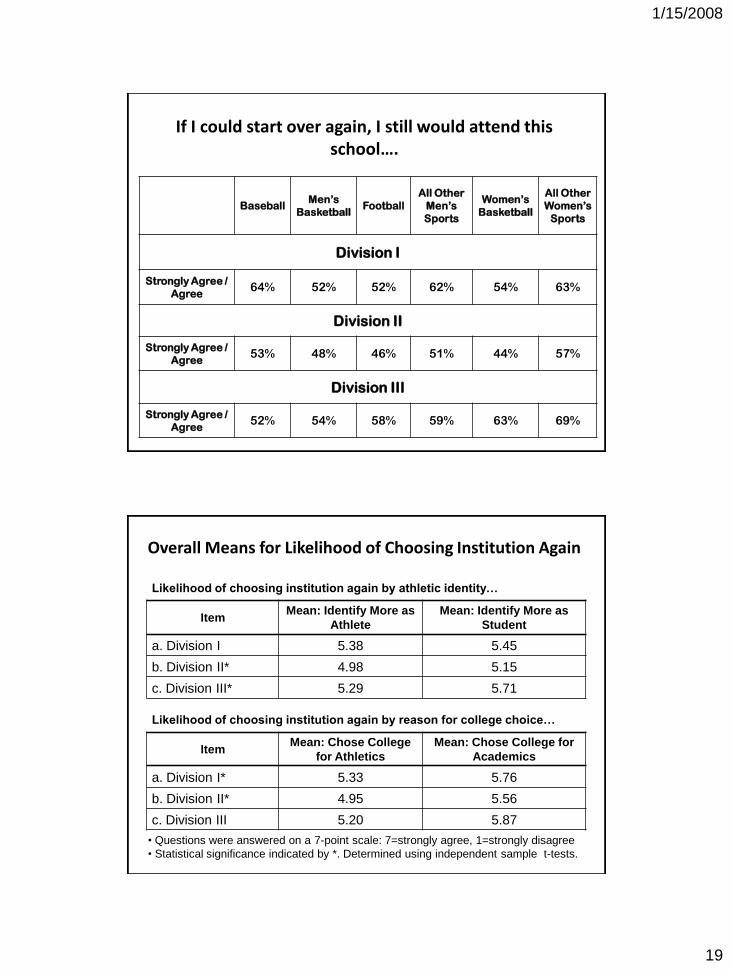
If I could start over again, I still would attend this school….
BaseballMen’s
BasketballFootball
All Other
Men’s
Sports
Women’s
Basketball
All Other
Women’s
Sports
Division I
Strongly Agree /
Agree64% 52% 52% 62% 54% 63%
Division II
Strongly Agree /
Agree53% 48% 46% 51% 44% 57%
Division III
Strongly Agree /
Agree52% 54% 58% 59% 63% 69%
Overall Means for Likelihood of Choosing Institution Again
Likelihood of choosing institution again by athletic identity…
ItemMean: Identify More as
Athlete
Mean: Identify More as
Student
a. Division I 5.38 5.45
b. Division II* 4.98 5.15
c. Division III* 5.29 5.71
• Questions were answered on a 7-point scale: 7=strongly agree, 1=strongly disagree
• Statistical significance indicated by *. Determined using independent sample t-tests.
Likelihood of choosing institution again by reason for college choice…
ItemMean: Chose College
for Athletics
Mean: Chose College for
Academics
a. Division I* 5.33 5.76
b. Division II* 4.95 5.56
c. Division III 5.20 5.87
1/15/2008
20
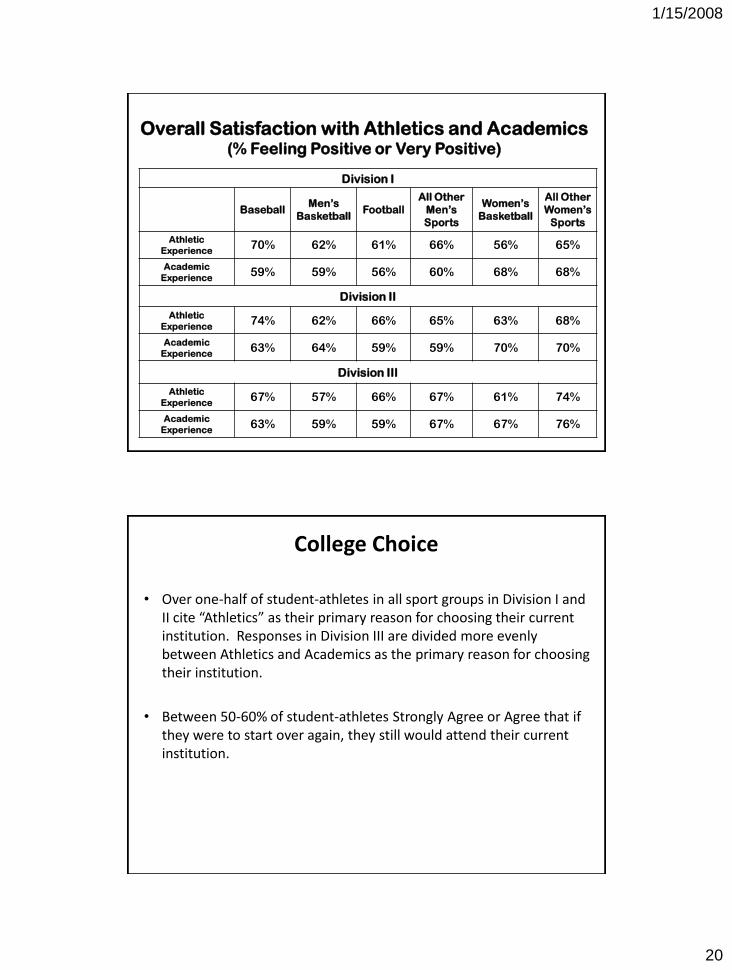
Overall Satisfaction with Athletics and Academics(% Feeling Positive or Very Positive)
Division I
BaseballMen’s
BasketballFootball
All Other
Men’s
Sports
Women’s
Basketball
All Other
Women’s
Sports
Athletic
Experience70% 62% 61% 66% 56% 65%
Academic
Experience59% 59% 56% 60% 68% 68%
Division II
Athletic
Experience74% 62% 66% 65% 63% 68%
Academic
Experience63% 64% 59% 59% 70% 70%
Division III
Athletic
Experience67% 57% 66% 67% 61% 74%
Academic
Experience63% 59% 59% 67% 67% 76%
College Choice
• Over one-half of student-athletes in all sport groups in Division I and II cite “Athletics” as their primary reason for choosing their current institution. Responses in Division III are divided more evenly between Athletics and Academics as the primary reason for choosing their institution.
• Between 50-60% of student-athletes Strongly Agree or Agree that if they were to start over again, they still would attend their current institution.
1/15/2008
21
College Choice (cont.)
• Across the three divisions, student-athletes are more likely to respond that they would choose their current institution again if:
– They express positive feelings about their major;
– Feel that their expectations of the academic, athletic, and social experiences were accurate, and
– Express positive feelings about their relationships with faculty and their overall academic experience.
• Relationships with their coaches also impacted their motivation to choose their current institution. Student-athletes were more likely to choose their current institution again if they believed their coach had a positive impact on their academic career and was not negatively influencing choice of major, classes, or the ability to participate in other extracurricular activities.
College Choice (cont.)
• The one item where the largest difference could be seen between those who would choose their current institution and those who would not was how satisfied the respondent was with their overall athletic experience.
• Other significant contributors increasing S-As’ likelihood of choosing their current institution indicate the importance of a well-rounded college experience.
1/15/2008
22
Finding #6: Both former and
current student-athletes
believe their participation in
college athletics has had a
positive influence on their
health.
Physical Health
• Overall, 95% of current student-athletes have indicated that they have sought care for physical health issues from health care professionals on campus. Of those, 78% were satisfied with the care they received.
• In spite of seeking care for issues, 85% of current student-athletes believe that athletics participation has had a positive influence on their physical health, and an additional 6% believe it has had no influence – positive or negative.
• Overall, 90% of former student-athletes believe that college athletics had a positive impact on their current physical health.
1/15/2008
23
Finding #7: Although there is
substantial variation across
sport, student-athletes in all
sports generally commit large
amounts of time to both
athletics and academic
endeavors.
Definitions
• Athletic Hours: Sum of hours reported on physical (practicing, training, competing, training room, etc.) and non-physical (meetings, team functions, film study, etc.) activities related to competing in their sport.
• Academic Hours: Sum of hours reported attending class activities (including labs, discussion groups, etc.) and studying or academic work done outside of class.
• Students self-reported hours spent in these activities and others on their typical in-season weekday and typical in-season weekend. It is believed that these questions provide better estimates than asking students for weekly estimates of time spent on academic or athletics.
• Students were not asked to do any accounting toward the 20-hour rule.
• We expect some degree of error involved with a self-reported retrospective assessment of time commitments. However, we generally expect that any inconsistencies will be present across sport, division, etc. Therefore, between-sport or between-division comparisons should give us a good relative understanding of student-athlete time commitments.

1/15/2008
24
Average Hours Spent Per Week In-Season on Athletic Activities by Student-Athletes in Men’s Sports (Self-Report)
SPORT Division I Division II Division III
National
Collegiate
Champ.
Baseball 40.0 37.6 33.5
Basketball 36.8 35.0 30.6
Football (FBS / FCS) 44.8 / 35.3 37.1 34.4
Golf 40.8 28.9 26.7
Ice Hockey 37.6 35.1
Lacrosse 34.8 31.1 31.6
Skiing 33.8
Soccer 33.6 29.9 28.5
Swimming 33.6 33.6 27.5
Tennis 33.9 31.7 27.7
Track / XC 30.7 28.6 27.0
Volleyball 31.8
Water Polo 30.9
Wrestling 32.4 31.4 33.6
Average Hours Spent Per Week In-Season on Athletic Activities by Student-Athletes in Women’s Sports (Self-Report)
SPORT Division I Division II Division III
National
Collegiate
Champ.
Basketball 36.1 32.3 30.0
Bowling 29.8
Field Hockey 34.3 28.5 28.6
Golf 32.4 24.9 23.9
Gymnastics 34.2
Ice Hockey 34.6 31.1
Lacrosse 32.0 29.5 26.4
Skiing 30.1
Soccer 34.1 27.2 29.2
Softball 37.1 34.8 29.1
Swimming 32.6 34.3 29.5
Tennis 30.2 26.7 26.2
Track / XC 29.3 27.6 25.9
Volleyball 35.4 30.8 31.7
Water Polo 30.9
1/15/2008
25
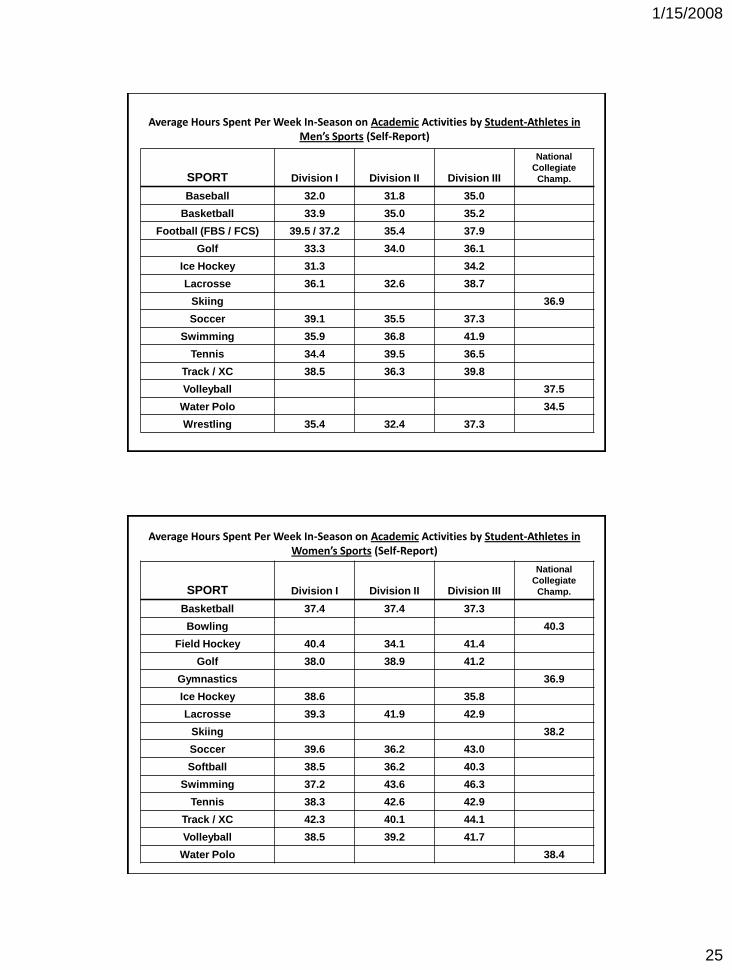
Average Hours Spent Per Week In-Season on Academic Activities by Student-Athletes in Men’s Sports (Self-Report)
SPORT Division I Division II Division III
National
Collegiate
Champ.
Baseball 32.0 31.8 35.0
Basketball 33.9 35.0 35.2
Football (FBS / FCS) 39.5 / 37.2 35.4 37.9
Golf 33.3 34.0 36.1
Ice Hockey 31.3 34.2
Lacrosse 36.1 32.6 38.7
Skiing 36.9
Soccer 39.1 35.5 37.3
Swimming 35.9 36.8 41.9
Tennis 34.4 39.5 36.5
Track / XC 38.5 36.3 39.8
Volleyball 37.5
Water Polo 34.5
Wrestling 35.4 32.4 37.3
Average Hours Spent Per Week In-Season on Academic Activities by Student-Athletes in Women’s Sports (Self-Report)
SPORT Division I Division II Division III
National
Collegiate
Champ.
Basketball 37.4 37.4 37.3
Bowling 40.3
Field Hockey 40.4 34.1 41.4
Golf 38.0 38.9 41.2
Gymnastics 36.9
Ice Hockey 38.6 35.8
Lacrosse 39.3 41.9 42.9
Skiing 38.2
Soccer 39.6 36.2 43.0
Softball 38.5 36.2 40.3
Swimming 37.2 43.6 46.3
Tennis 38.3 42.6 42.9
Track / XC 42.3 40.1 44.1
Volleyball 38.5 39.2 41.7
Water Polo 38.4
1/15/2008
26
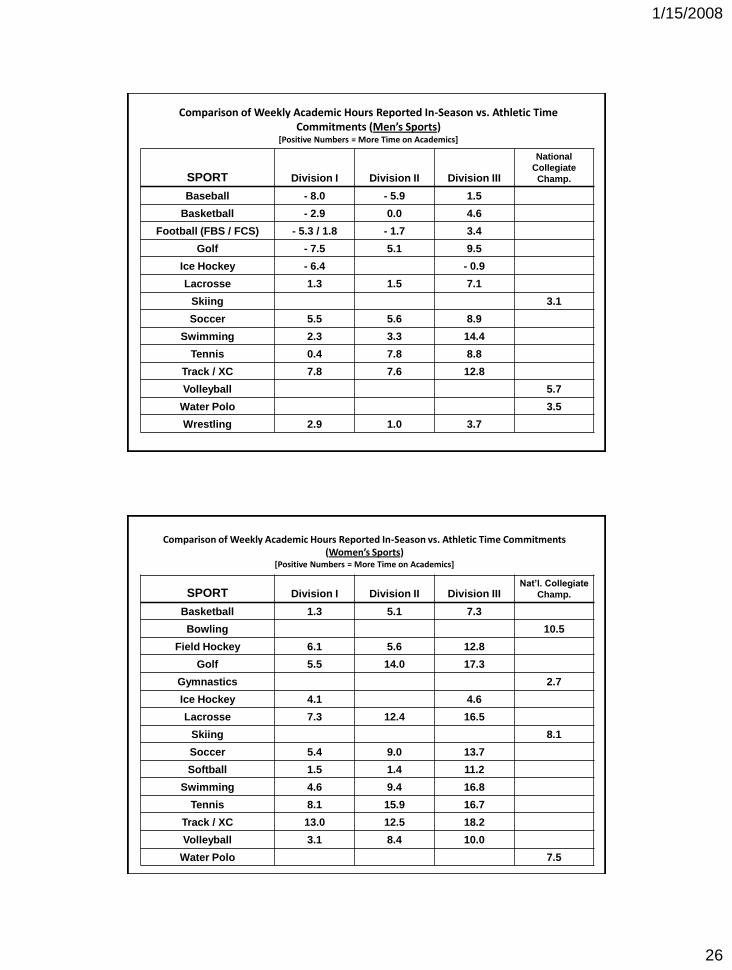
Comparison of Weekly Academic Hours Reported In-Season vs. Athletic Time Commitments (Men’s Sports)
[Positive Numbers = More Time on Academics]
SPORT Division I Division II Division III
National
Collegiate
Champ.
Baseball - 8.0 - 5.9 1.5
Basketball - 2.9 0.0 4.6
Football (FBS / FCS) - 5.3 / 1.8 - 1.7 3.4
Golf - 7.5 5.1 9.5
Ice Hockey - 6.4 - 0.9
Lacrosse 1.3 1.5 7.1
Skiing 3.1
Soccer 5.5 5.6 8.9
Swimming 2.3 3.3 14.4
Tennis 0.4 7.8 8.8
Track / XC 7.8 7.6 12.8
Volleyball 5.7
Water Polo 3.5
Wrestling 2.9 1.0 3.7
Comparison of Weekly Academic Hours Reported In-Season vs. Athletic Time Commitments (Women’s Sports)
[Positive Numbers = More Time on Academics]
SPORT Division I Division II Division IIINat’l. Collegiate
Champ.
Basketball 1.3 5.1 7.3
Bowling 10.5
Field Hockey 6.1 5.6 12.8
Golf 5.5 14.0 17.3
Gymnastics 2.7
Ice Hockey 4.1 4.6
Lacrosse 7.3 12.4 16.5
Skiing 8.1
Soccer 5.4 9.0 13.7
Softball 1.5 1.4 11.2
Swimming 4.6 9.4 16.8
Tennis 8.1 15.9 16.7
Track / XC 13.0 12.5 18.2
Volleyball 3.1 8.4 10.0
Water Polo 7.5
1/15/2008
27
Finding #8: Divisional differences are
present in the distributions of time spent
on athletics and academics. However,
within sport, these divisional differences
are more pronounced in terms of time
committed to athletics. In addition, some
sports showed much less variation
across division.
Finding #9: Within each division there is
a relationship between athletic and
academic time commitments. In several
sports, student-athletes in aggregate
reported spending more time on athletics
than academics.
1/15/2008
28
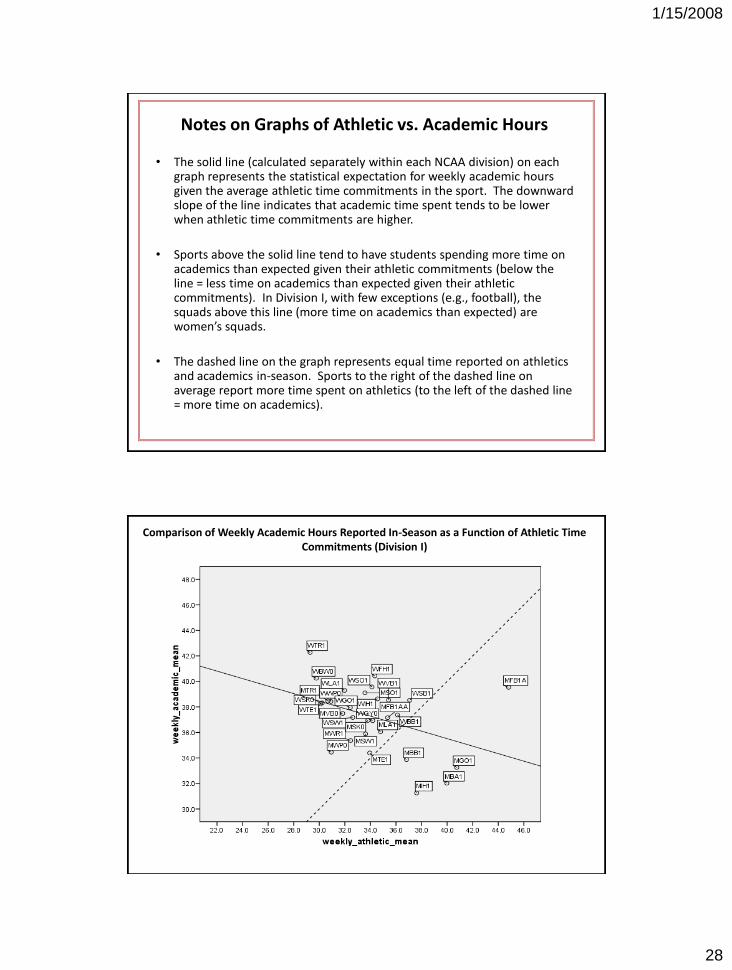
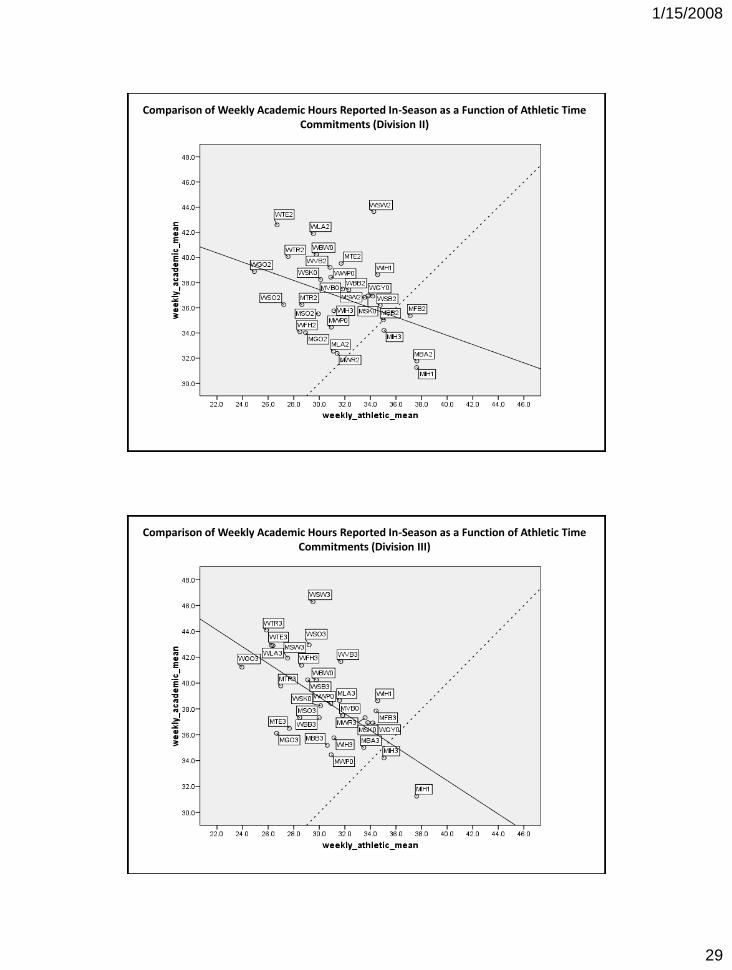
Notes on Graphs of Athletic vs. Academic Hours
• The solid line (calculated separately within each NCAA division) on each graph represents the statistical expectation for weekly academic hours given the average athletic time commitments in the sport. The downward slope of the line indicates that academic time spent tends to be lower when athletic time commitments are higher.
• Sports above the solid line tend to have students spending more time on academics than expected given their athletic commitments (below the line = less time on academics than expected given their athletic commitments). In Division I, with few exceptions (e.g., football), the squads above this line (more time on academics than expected) are women’s squads.
• The dashed line on the graph represents equal time reported on athletics and academics in-season. Sports to the right of the dashed line on average report more time spent on athletics (to the left of the dashed line = more time on academics).
Comparison of Weekly Academic Hours Reported In-Season as a Function of Athletic Time Commitments (Division I)
1/15/2008
29
Comparison of Weekly Academic Hours Reported In-Season as a Function of Athletic Time Commitments (Division II)
Comparison of Weekly Academic Hours Reported In-Season as a Function of Athletic Time Commitments (Division III)
1/15/2008
30
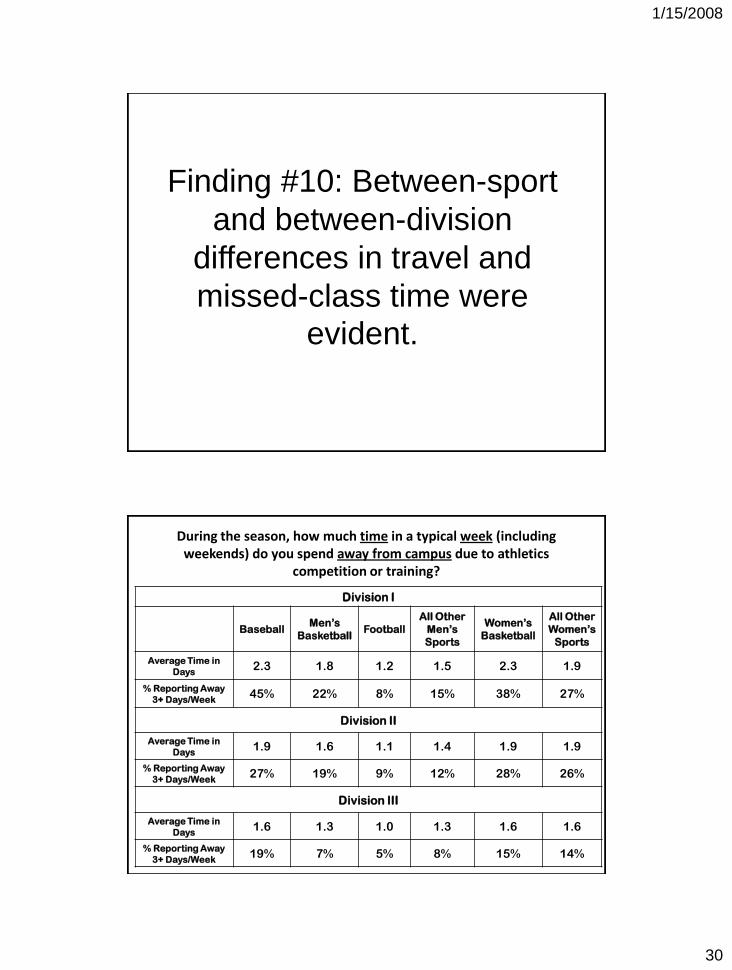
Finding #10: Between-sport
and between-division
differences in travel and
missed-class time were
evident.
During the season, how much time in a typical week (including weekends) do you spend away from campus due to athletics
competition or training?
Division I
BaseballMen’s
BasketballFootball
All Other
Men’s
Sports
Women’s
Basketball
All Other
Women’s
Sports
Average Time in
Days2.3 1.8 1.2 1.5 2.3 1.9
% Reporting Away
3+ Days/Week45% 22% 8% 15% 38% 27%
Division II
Average Time in
Days1.9 1.6 1.1 1.4 1.9 1.9
% Reporting Away
3+ Days/Week27% 19% 9% 12% 28% 26%
Division III
Average Time in
Days1.6 1.3 1.0 1.3 1.6 1.6
% Reporting Away
3+ Days/Week19% 7% 5% 8% 15% 14%
1/15/2008
31
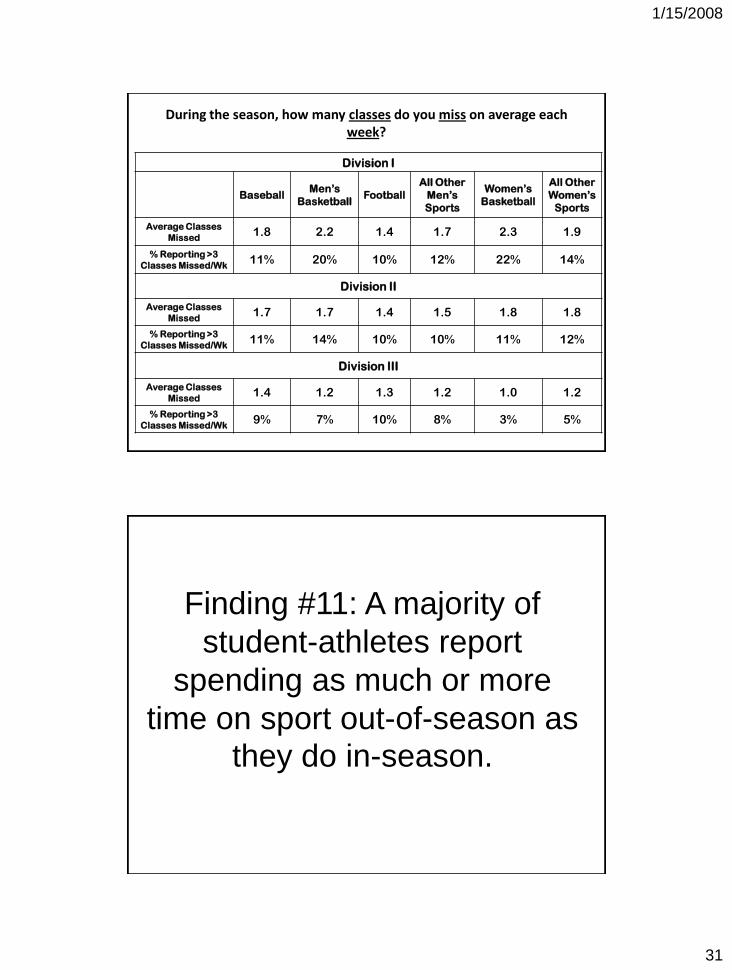
During the season, how many classes do you miss on average each week?
Division I
BaseballMen’s
BasketballFootball
All Other
Men’s
Sports
Women’s
Basketball
All Other
Women’s
Sports
Average Classes
Missed1.8 2.2 1.4 1.7 2.3 1.9
% Reporting >3
Classes Missed/Wk11% 20% 10% 12% 22% 14%
Division II
Average Classes
Missed1.7 1.7 1.4 1.5 1.8 1.8
% Reporting >3
Classes Missed/Wk11% 14% 10% 10% 11% 12%
Division III
Average Classes
Missed1.4 1.2 1.3 1.2 1.0 1.2
% Reporting >3
Classes Missed/Wk9% 7% 10% 8% 3% 5%
Finding #11: A majority of
student-athletes report
spending as much or more
time on sport out-of-season as
they do in-season.
1/15/2008
32
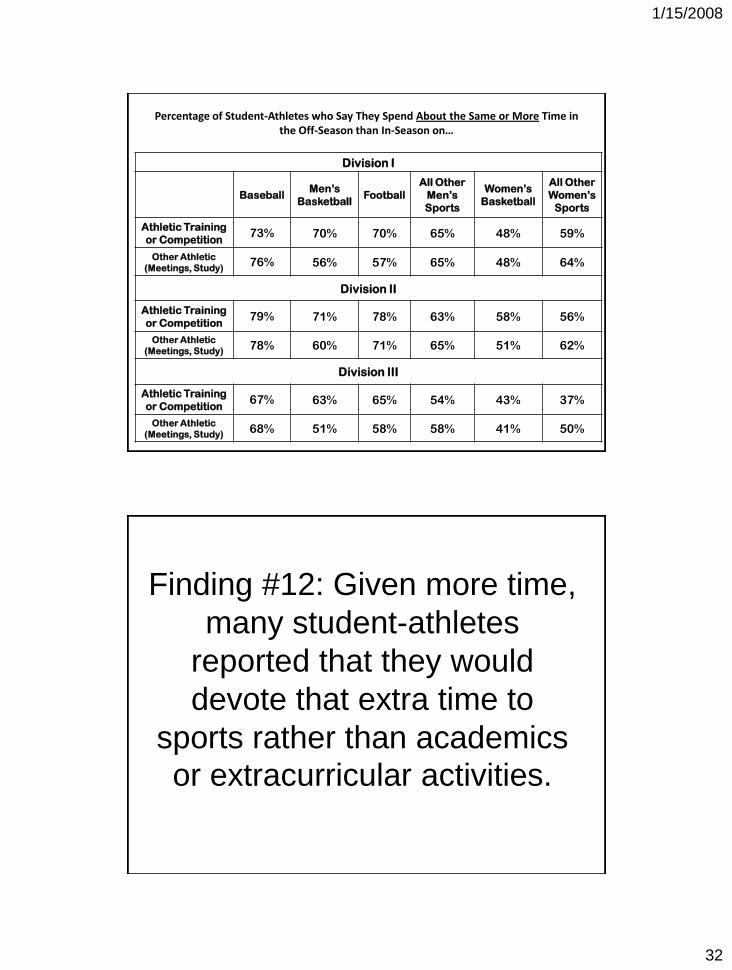
Percentage of Student-Athletes who Say They Spend About the Same or More Time in the Off-Season than In-Season on…
Division I
BaseballMen’s
BasketballFootball
All Other
Men’s
Sports
Women’s
Basketball
All Other
Women’s
Sports
Athletic Training
or Competition73% 70% 70% 65% 48% 59%
Other Athletic
(Meetings, Study)76% 56% 57% 65% 48% 64%
Division II
Athletic Training
or Competition79% 71% 78% 63% 58% 56%
Other Athletic
(Meetings, Study)78% 60% 71% 65% 51% 62%
Division III
Athletic Training
or Competition67% 63% 65% 54% 43% 37%
Other Athletic
(Meetings, Study)68% 51% 58% 58% 41% 50%
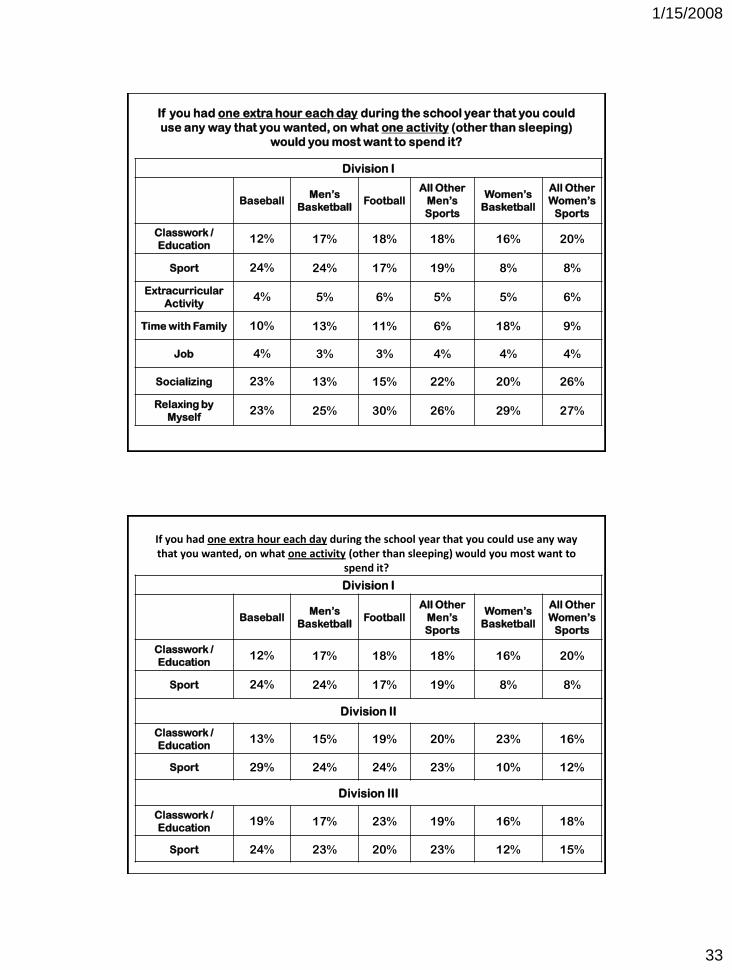
Finding #12: Given more time,
many student-athletes
reported that they would
devote that extra time to
sports rather than academics
or extracurricular activities.
1/15/2008
33
If you had one extra hour each day during the school year that you could
use any way that you wanted, on what one activity (other than sleeping)
would you most want to spend it?
Division I
BaseballMen’s
BasketballFootball
All Other
Men’s
Sports
Women’s
Basketball
All Other
Women’s
Sports
Classwork /
Education12% 17% 18% 18% 16% 20%
Sport 24% 24% 17% 19% 8% 8%
Extracurricular
Activity4% 5% 6% 5% 5% 6%
Time with Family 10% 13% 11% 6% 18% 9%
Job 4% 3% 3% 4% 4% 4%
Socializing 23% 13% 15% 22% 20% 26%
Relaxing by
Myself23% 25% 30% 26% 29% 27%
If you had one extra hour each day during the school year that you could use any way that you wanted, on what one activity (other than sleeping) would you most want to
spend it?
Division I
BaseballMen’s
BasketballFootball
All Other
Men’s
Sports
Women’s
Basketball
All Other
Women’s
Sports
Classwork /
Education12% 17% 18% 18% 16% 20%
Sport 24% 24% 17% 19% 8% 8%
Division II
Classwork /
Education13% 15% 19% 20% 23% 16%
Sport 29% 24% 24% 23% 10% 12%
Division III
Classwork /
Education19% 17% 23% 19% 16% 18%
Sport 24% 23% 20% 23% 12% 15%
1/15/2008
34
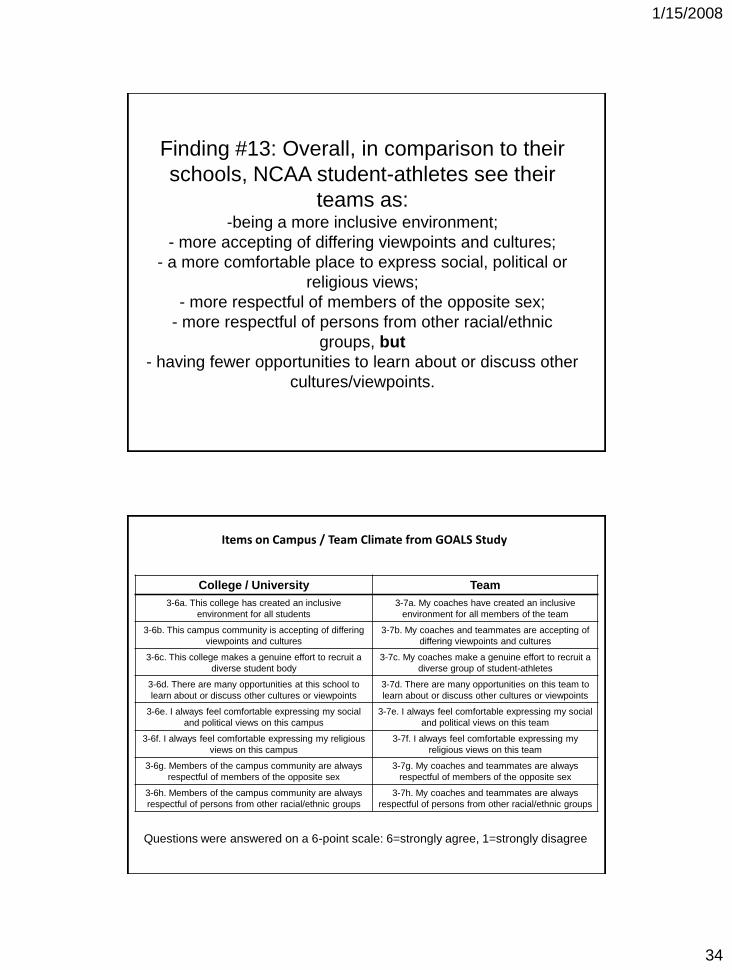
Finding #13: Overall, in comparison to their
schools, NCAA student-athletes see their
teams as:-being a more inclusive environment;
- more accepting of differing viewpoints and cultures;
- a more comfortable place to express social, political or
religious views;
- more respectful of members of the opposite sex;
- more respectful of persons from other racial/ethnic
groups, but
- having fewer opportunities to learn about or discuss other
cultures/viewpoints.
Items on Campus / Team Climate from GOALS Study
College / University Team
3-6a. This college has created an inclusive
environment for all students
3-7a. My coaches have created an inclusive
environment for all members of the team
3-6b. This campus community is accepting of differing
viewpoints and cultures
3-7b. My coaches and teammates are accepting of
differing viewpoints and cultures
3-6c. This college makes a genuine effort to recruit a
diverse student body
3-7c. My coaches make a genuine effort to recruit a
diverse group of student-athletes
3-6d. There are many opportunities at this school to
learn about or discuss other cultures or viewpoints
3-7d. There are many opportunities on this team to
learn about or discuss other cultures or viewpoints
3-6e. I always feel comfortable expressing my social
and political views on this campus
3-7e. I always feel comfortable expressing my social
and political views on this team
3-6f. I always feel comfortable expressing my religious
views on this campus
3-7f. I always feel comfortable expressing my
religious views on this team
3-6g. Members of the campus community are always
respectful of members of the opposite sex
3-7g. My coaches and teammates are always
respectful of members of the opposite sex
3-6h. Members of the campus community are always
respectful of persons from other racial/ethnic groups
3-7h. My coaches and teammates are always
respectful of persons from other racial/ethnic groups
Questions were answered on a 6-point scale: 6=strongly agree, 1=strongly disagree
1/15/2008
35
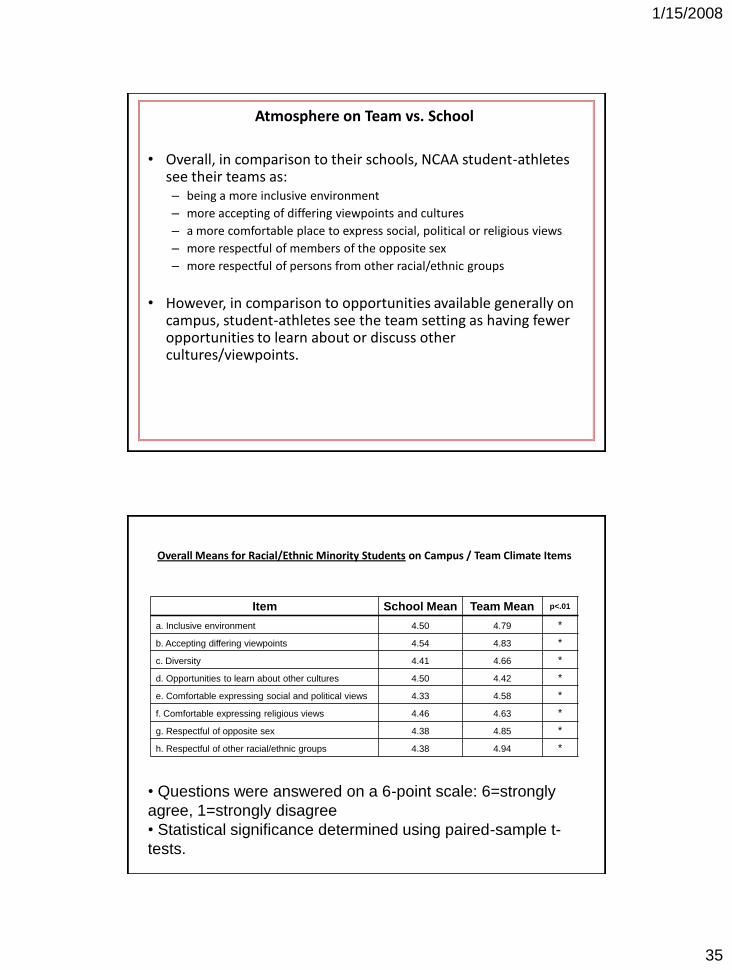
Atmosphere on Team vs. School
• Overall, in comparison to their schools, NCAA student-athletes see their teams as:– being a more inclusive environment
– more accepting of differing viewpoints and cultures
– a more comfortable place to express social, political or religious views
– more respectful of members of the opposite sex
– more respectful of persons from other racial/ethnic groups
• However, in comparison to opportunities available generally on campus, student-athletes see the team setting as having fewer opportunities to learn about or discuss other cultures/viewpoints.
Overall Means for Racial/Ethnic Minority Students on Campus / Team Climate Items
Item School Mean Team Mean p<.01
a. Inclusive environment 4.50 4.79 *
b. Accepting differing viewpoints 4.54 4.83 *
c. Diversity 4.41 4.66 *
d. Opportunities to learn about other cultures 4.50 4.42 *
e. Comfortable expressing social and political views 4.33 4.58 *
f. Comfortable expressing religious views 4.46 4.63 *
g. Respectful of opposite sex 4.38 4.85 *
h. Respectful of other racial/ethnic groups 4.38 4.94 *
• Questions were answered on a 6-point scale: 6=strongly
agree, 1=strongly disagree
• Statistical significance determined using paired-sample t-
tests.
1/15/2008
36
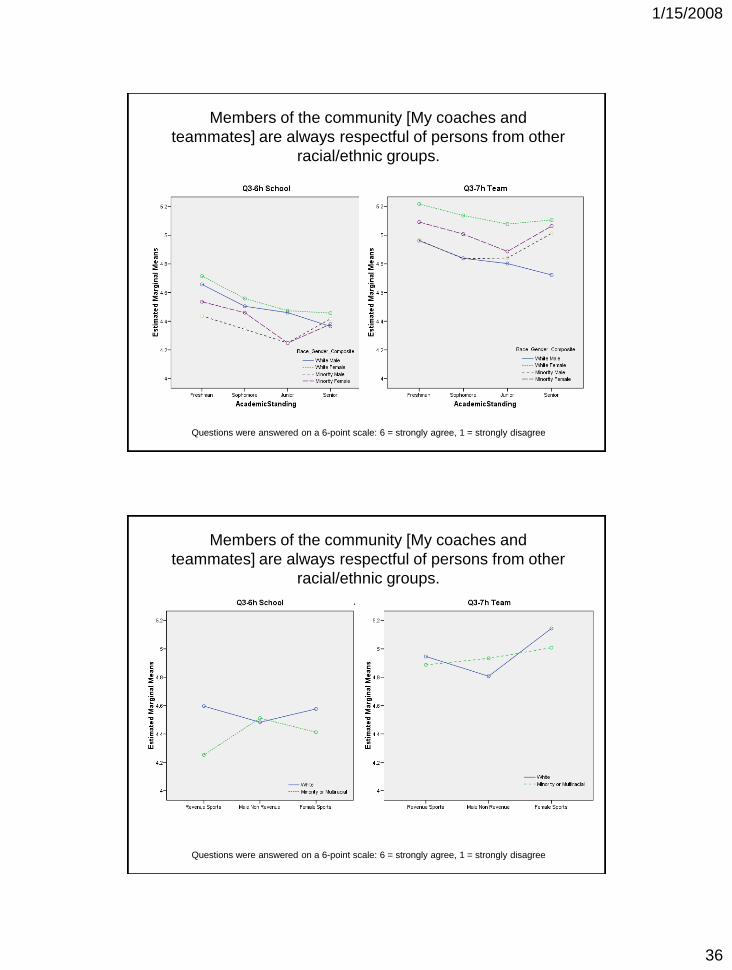
Members of the community [My coaches and
teammates] are always respectful of persons from other
racial/ethnic groups.
(Subgroup means displayed)
Questions were answered on a 6-point scale: 6 = strongly agree, 1 = strongly disagree
Members of the community [My coaches and
teammates] are always respectful of persons from other
racial/ethnic groups.
(Subgroup means displayed)
Questions were answered on a 6-point scale: 6 = strongly agree, 1 = strongly disagree
1/15/2008
37
Finding #14: Ten-year degree attainment of
bachelor’s and/or graduate degrees is
predictable from high school and college
academic performance. However, perceived
academic work ethic and self-identifying as a
student rather than as an athlete in college
are also strong predictors of eventual
graduation. Professional/Olympic aspirations
are negatively related to graduate degree
attainment only.
Finding #15: Life satisfaction, job
satisfaction and satisfaction with
standard of living at age 30 were
shown to be related to perceived
academic work ethic and degree
attainment (generally, an additive
benefit for BA and graduate degrees).
1/15/2008
38
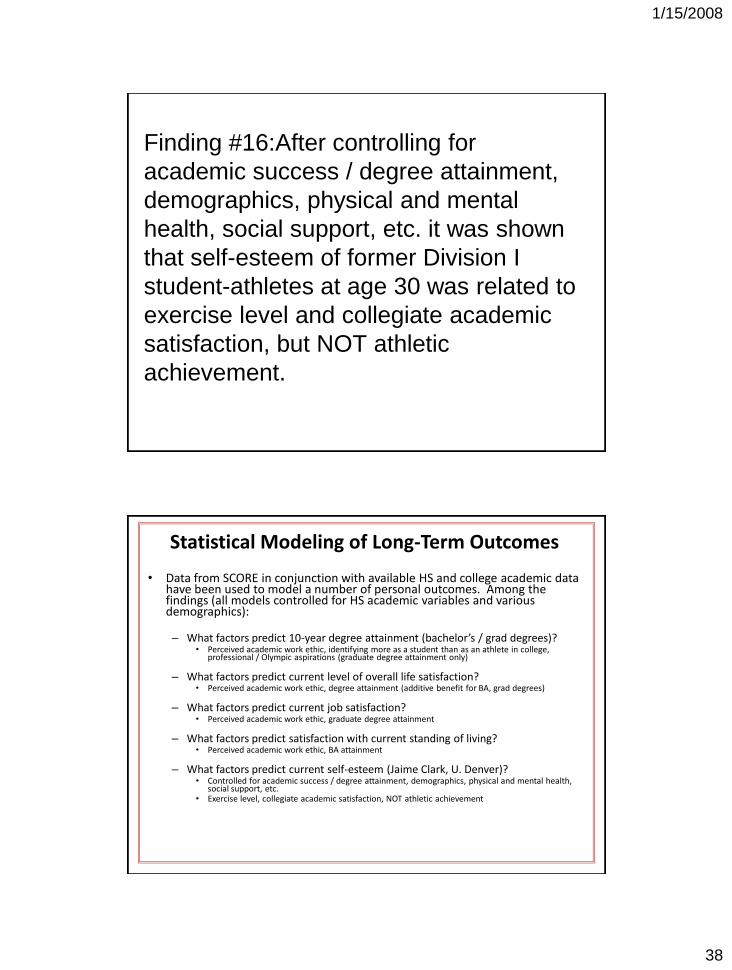
Finding #16:After controlling for
academic success / degree attainment,
demographics, physical and mental
health, social support, etc. it was shown
that self-esteem of former Division I
student-athletes at age 30 was related to
exercise level and collegiate academic
satisfaction, but NOT athletic
achievement.
Statistical Modeling of Long-Term Outcomes
• Data from SCORE in conjunction with available HS and college academic data have been used to model a number of personal outcomes. Among the findings (all models controlled for HS academic variables and various demographics):
– What factors predict 10-year degree attainment (bachelor’s / grad degrees)?• Perceived academic work ethic, identifying more as a student than as an athlete in college,
professional / Olympic aspirations (graduate degree attainment only)
– What factors predict current level of overall life satisfaction?• Perceived academic work ethic, degree attainment (additive benefit for BA, grad degrees)
– What factors predict current job satisfaction?• Perceived academic work ethic, graduate degree attainment
– What factors predict satisfaction with current standing of living?• Perceived academic work ethic, BA attainment
– What factors predict current self-esteem (Jaime Clark, U. Denver)?• Controlled for academic success / degree attainment, demographics, physical and mental health,
social support, etc.• Exercise level, collegiate academic satisfaction, NOT athletic achievement
1/15/2008
39
Finding #17: Open-ended
comments shed light on how
former and current student-
athletes feel about their
college athletics experience.
Tone of Comments
• A few themes emerged in the comments:1. Positive comments touching on how participation in
athletics has benefited them academically and socially as well as lasting health benefits
2. Some comments noted concerns regarding the academic-athletic tug-of-war and noted sacrifices that were made in order to participate in college athletics.
3. Comments related to finances and the doors of opportunity athletics opened.
4. Comments specifically related to coaching staffs and relationships with coaches.
1/15/2008
40
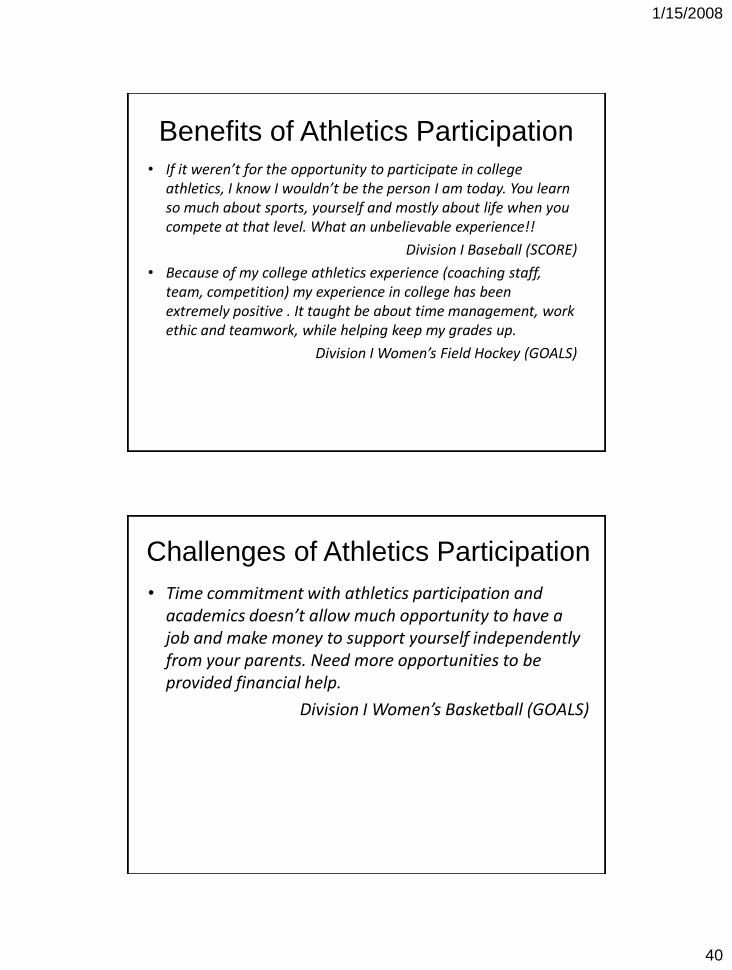
Benefits of Athletics Participation
• If it weren’t for the opportunity to participate in college athletics, I know I wouldn’t be the person I am today. You learn so much about sports, yourself and mostly about life when you compete at that level. What an unbelievable experience!!
Division I Baseball (SCORE)
• Because of my college athletics experience (coaching staff, team, competition) my experience in college has been extremely positive . It taught be about time management, work ethic and teamwork, while helping keep my grades up.
Division I Women’s Field Hockey (GOALS)
Challenges of Athletics Participation
• Time commitment with athletics participation and academics doesn’t allow much opportunity to have a job and make money to support yourself independently from your parents. Need more opportunities to be provided financial help.
Division I Women’s Basketball (GOALS)
1/15/2008
41
Comments Regarding Coaching Staff / Athletics Personnel
• I am glad that I participated in athletics in college but the coaches and faculty dealing with athletics in my opinion did not care about the students at all. The people in charge of the athletic program were concerned only with their own career and showed very little to no interest in helping the student-athlete.
Division I Men’s Swimmer (SCORE)
Comments Regarding Coaching Staff / Athletics Personnel
• College athletics and athletics in general have allowed me to excel in life. My college wrestling coach still e-mails / calls me often to see how things are going. I am a strong (very) believer in athletics making a student better. If it were not for wrestling and the NCAA, I don’t know if I would have earned a degree or a Master’s degree.
Division I Men’s Wrestler (SCORE)
1/15/2008
42
What Have We Learned?• Lives of student-athletes are complex. The issue of a balance
between athletics and academics appears to be a very important ingredient for success as a student-athlete.
• Many positive outcomes from the student-athlete experience:
– High levels of engagement in academics, athletics and community service.
– Higher academic success rates (88% graduation rate) than previously reported.
– Very positive responses to feelings about their overall athletics and academic experiences.
– Many life skills gained from participation in intercollegiate athletics (e.g. time management, teamwork, commitment, etc.)
– Team climate is seen as understanding of people from different backgrounds and perspectives.
What Have We Learned?• Some challenges:
– Self-identity that leans too much toward identifying solely as an athlete can lead to poorer academic performance and lower self-esteem in later life.
– Understanding attitudes and motivations could be very important in helping student-athletes to succeed.
– Coach/player relationship is very important and can have a powerful impact on student-athletes (either positively or negatively).
– Athletic time commitments for student-athletes can be very high and there is little down-time, even in the off-season. However, there is evidence that athletes might want to spend even more time on athletics pursuits. This issue is crucial to developing the balance that should be a goal for student-athletes.
1/15/2008
43
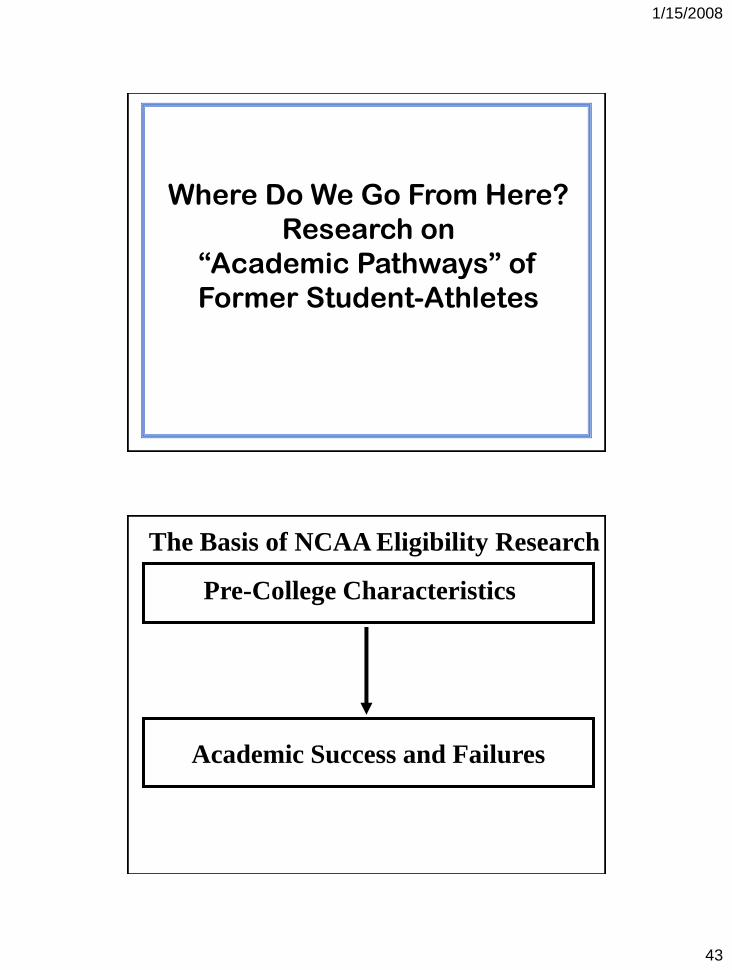
Where Do We Go From Here?
Research on
“Academic Pathways” of
Former Student-Athletes
The Basis of NCAA Eligibility Research
Academic Success and Failures
Pre-College Characteristics
1/15/2008
44
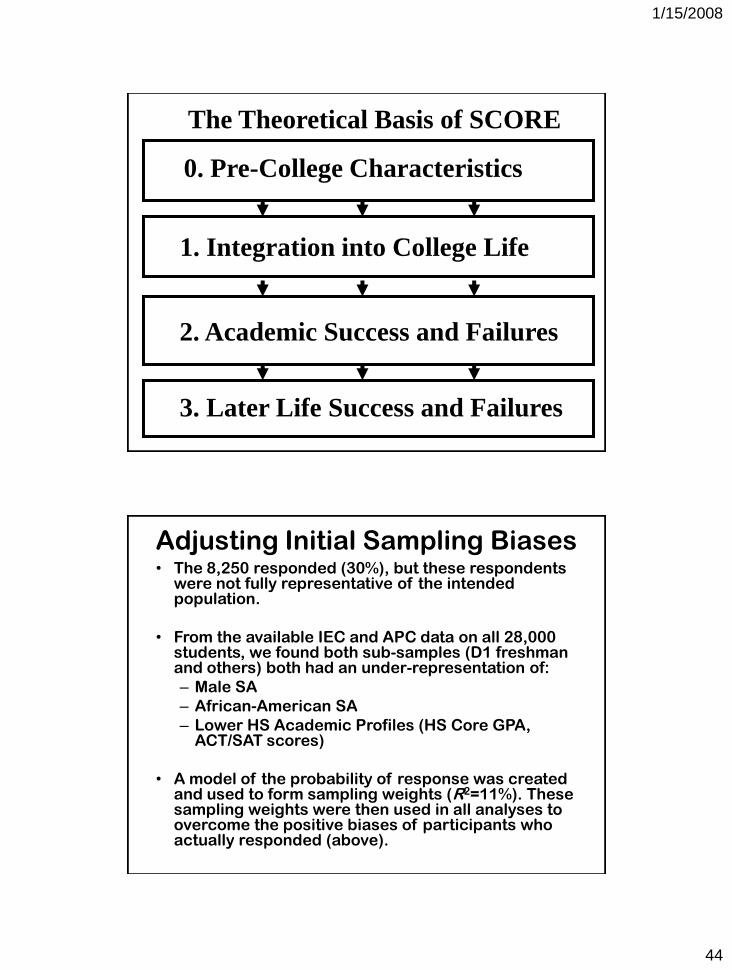
The Theoretical Basis of SCORE
3. Later Life Success and Failures
2. Academic Success and Failures
1. Integration into College Life
0. Pre-College Characteristics
Adjusting Initial Sampling Biases• The 8,250 responded (30%), but these respondents
were not fully representative of the intended population.
• From the available IEC and APC data on all 28,000 students, we found both sub-samples (D1 freshman and others) both had an under-representation of:
– Male SA
– African-American SA
– Lower HS Academic Profiles (HS Core GPA, ACT/SAT scores)
• A model of the probability of response was created and used to form sampling weights (R2=11%). These sampling weights were then used in all analyses to overcome the positive biases of participants who actually responded (above).
1/15/2008
45
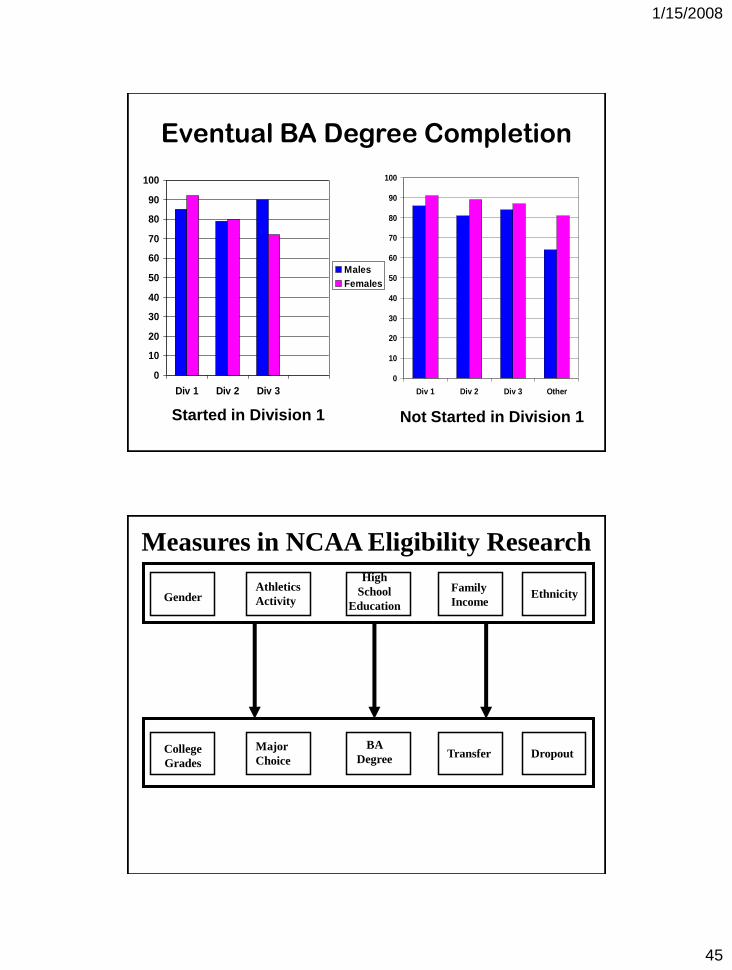
Eventual BA Degree Completion
0
10
20
30
40
50
60
70
80
90
100
Div 1 Div 2 Div 3
Males
Females
0
10
20
30
40
50
60
70
80
90
100
Div 1 Div 2 Div 3 Other
Started in Division 1 Not Started in Division 1
Measures in NCAA Eligibility Research
Family
IncomeGender Ethnicity
High
School
Education
Athletics
Activity
TransferCollege
GradesDropout
BA
DegreeMajor
Choice
1/15/2008
46
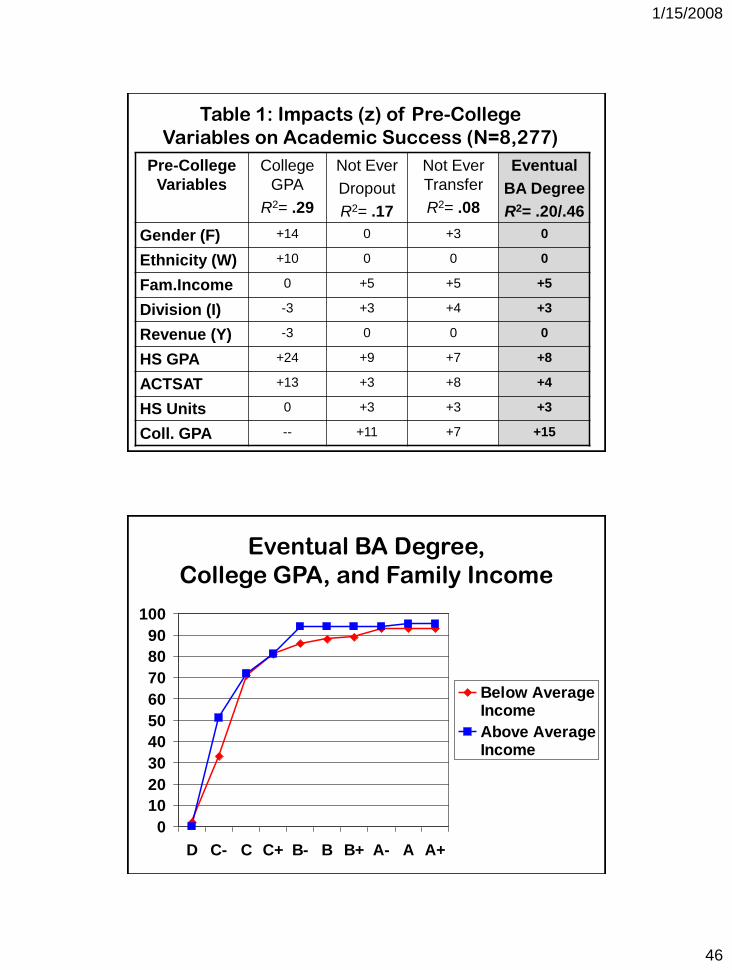
Table 1: Impacts (z) of Pre-College
Variables on Academic Success (N=8,277)
Pre-College
Variables
College
GPA
R2= .29
Not Ever
Dropout
R2= .17
Not Ever
Transfer
R2= .08
Eventual
BA Degree
R2= .20/.46
Gender (F) +14 0 +3 0
Ethnicity (W) +10 0 0 0
Fam.Income 0 +5 +5 +5
Division (I) -3 +3 +4 +3
Revenue (Y) -3 0 0 0
HS GPA +24 +9 +7 +8
ACTSAT +13 +3 +8 +4
HS Units 0 +3 +3 +3
Coll. GPA -- +11 +7 +15
Eventual BA Degree,
College GPA, and Family Income
0
10
20
30
40
50
60
70
80
90
100
D C- C C+ B- B B+ A- A A+
Below AverageIncome
Above AverageIncome
1/15/2008
47
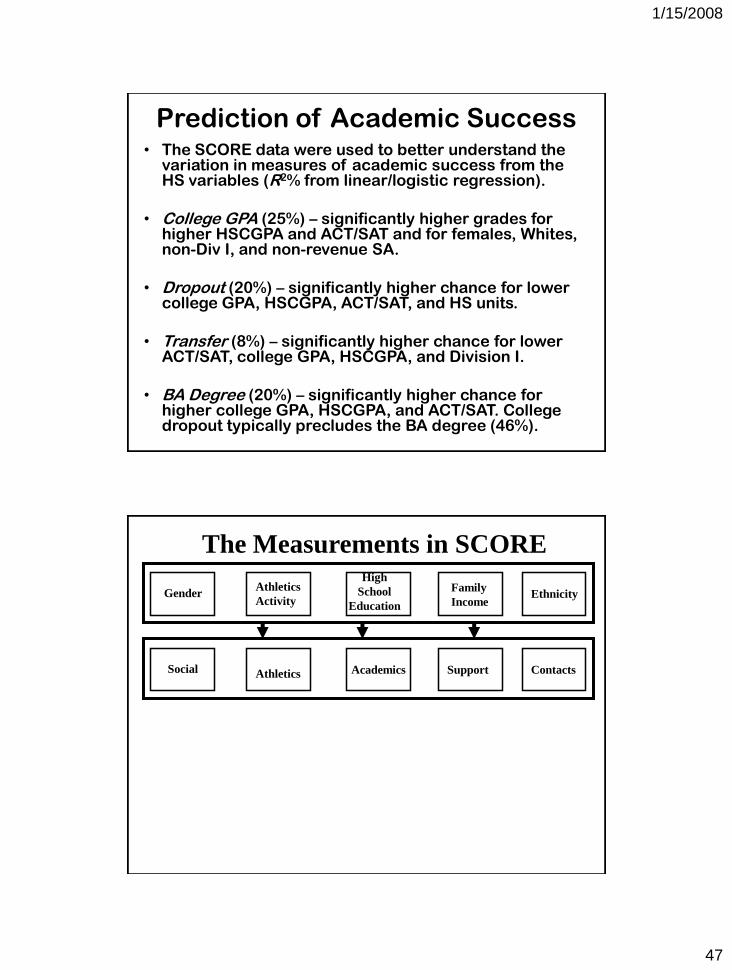
Prediction of Academic Success• The SCORE data were used to better understand the
variation in measures of academic success from the HS variables (R2% from linear/logistic regression).
• College GPA (25%) – significantly higher grades for higher HSCGPA and ACT/SAT and for females, Whites, non-Div I, and non-revenue SA.
• Dropout (20%) – significantly higher chance for lower college GPA, HSCGPA, ACT/SAT, and HS units.
• Transfer (8%) – significantly higher chance for lower ACT/SAT, college GPA, HSCGPA, and Division I.
• BA Degree (20%) – significantly higher chance for higher college GPA, HSCGPA, and ACT/SAT. College dropout typically precludes the BA degree (46%).
The Measurements in SCORE
Family
IncomeGender Ethnicity
High
School
Education
Athletics
Activity
SupportSocial ContactsAcademicsAthletics
1/15/2008
48
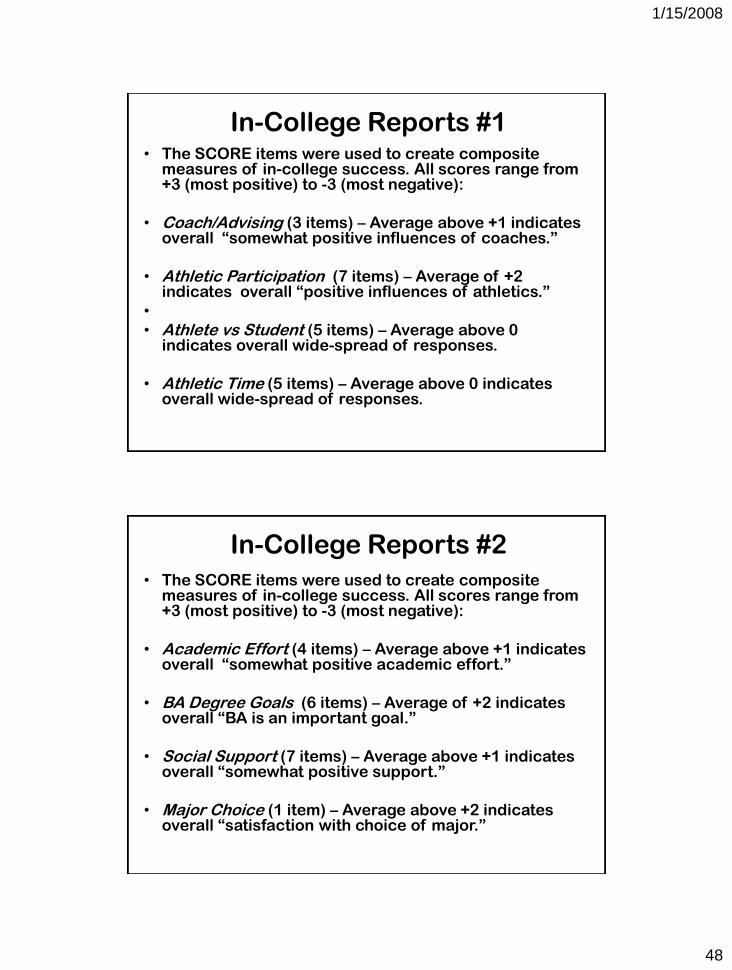
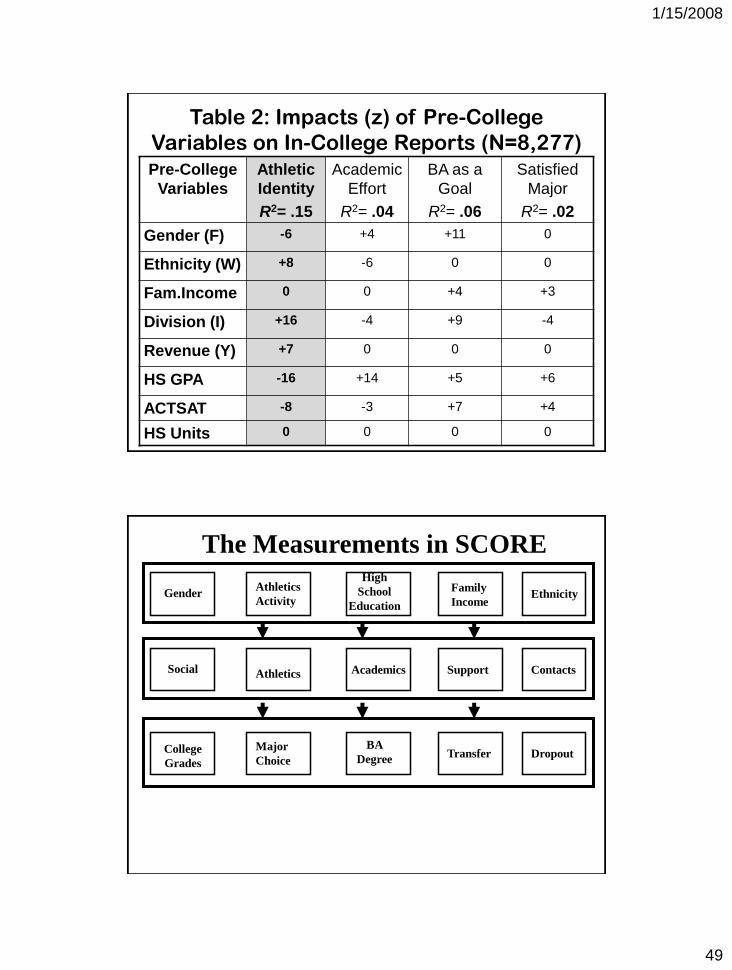
In-College Reports #1• The SCORE items were used to create composite
measures of in-college success. All scores range from +3 (most positive) to -3 (most negative):
• Coach/Advising (3 items) – Average above +1 indicates overall “somewhat positive influences of coaches.”
• Athletic Participation (7 items) – Average of +2 indicates overall “positive influences of athletics.”
•
• Athlete vs Student (5 items) – Average above 0 indicates overall wide-spread of responses.
• Athletic Time (5 items) – Average above 0 indicates overall wide-spread of responses.
In-College Reports #2
• The SCORE items were used to create composite measures of in-college success. All scores range from +3 (most positive) to -3 (most negative):
• Academic Effort (4 items) – Average above +1 indicates overall “somewhat positive academic effort.”
• BA Degree Goals (6 items) – Average of +2 indicates overall “BA is an important goal.”
• Social Support (7 items) – Average above +1 indicates overall “somewhat positive support.”
• Major Choice (1 item) – Average above +2 indicates overall “satisfaction with choice of major.”
1/15/2008
49
Table 2: Impacts (z) of Pre-College
Variables on In-College Reports (N=8,277)
Pre-College
Variables
Athletic
Identity
R2= .15
Academic
Effort
R2= .04
BA as a
Goal
R2= .06
Satisfied
Major
R2= .02
Gender (F) -6 +4 +11 0
Ethnicity (W) +8 -6 0 0
Fam.Income 0 0 +4 +3
Division (I) +16 -4 +9 -4
Revenue (Y) +7 0 0 0
HS GPA -16 +14 +5 +6
ACTSAT -8 -3 +7 +4
HS Units 0 0 0 0
The Measurements in SCORE
Family
IncomeGender Ethnicity
High
School
Education
Athletics
Activity
SupportSocial ContactsAcademicsAthletics
TransferCollege
GradesDropout
BA
DegreeMajor
Choice
1/15/2008
50
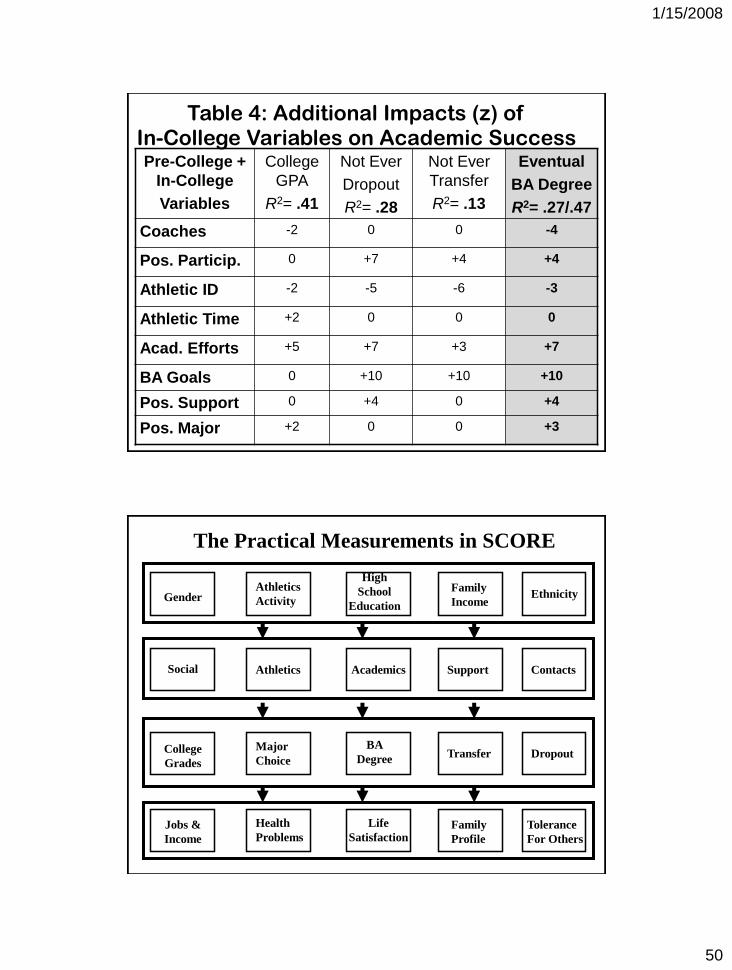
Table 4: Additional Impacts (z) of In-College Variables on Academic SuccessPre-College +
In-College
Variables
College
GPA
R2= .41
Not Ever
Dropout
R2= .28
Not Ever
Transfer
R2= .13
Eventual
BA Degree
R2= .27/.47
Coaches -2 0 0 -4
Pos. Particip. 0 +7 +4 +4
Athletic ID -2 -5 -6 -3
Athletic Time +2 0 0 0
Acad. Efforts +5 +7 +3 +7
BA Goals 0 +10 +10 +10
Pos. Support 0 +4 0 +4
Pos. Major +2 0 0 +3
The Practical Measurements in SCORE
Family
IncomeGender Ethnicity
High
School
Education
Athletics
Activity
Family
Profile
Jobs &
Income
Tolerance
For Others
Life
Satisfaction
Health
Problems
SupportSocial ContactsAcademicsAthletics
TransferCollege
GradesDropout
BA
DegreeMajor
Choice
1/15/2008
51
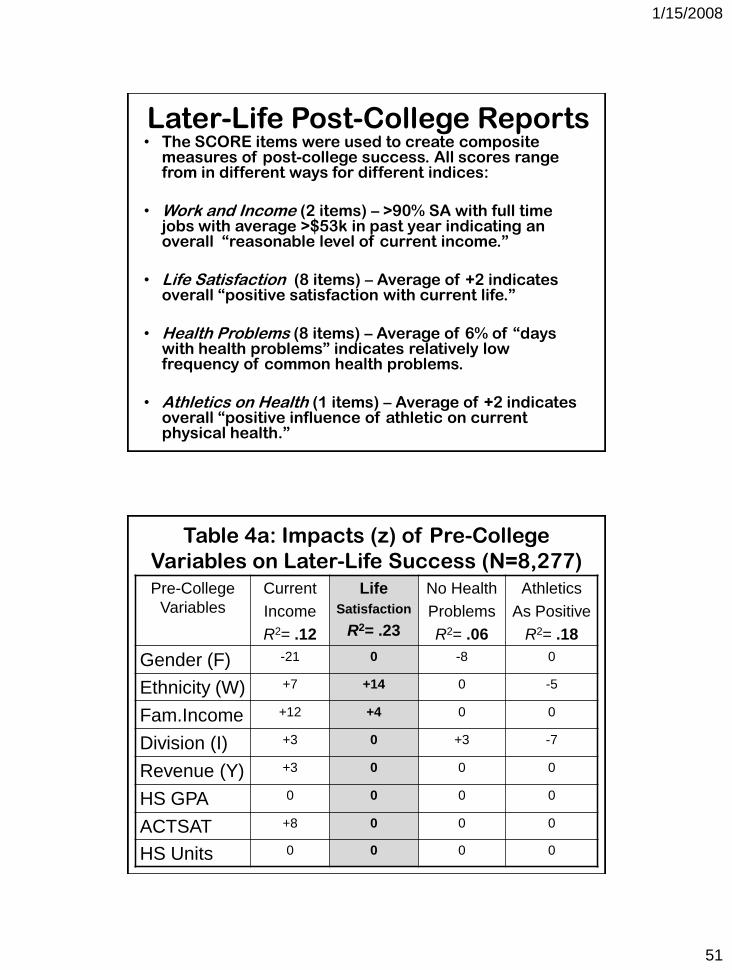
Later-Life Post-College Reports • The SCORE items were used to create composite
measures of post-college success. All scores range from in different ways for different indices:
• Work and Income (2 items) – >90% SA with full time jobs with average >$53k in past year indicating an overall “reasonable level of current income.”
• Life Satisfaction (8 items) – Average of +2 indicates overall “positive satisfaction with current life.”
• Health Problems (8 items) – Average of 6% of “days with health problems” indicates relatively low frequency of common health problems.
• Athletics on Health (1 items) – Average of +2 indicates overall “positive influence of athletic on current physical health.”
Table 4a: Impacts (z) of Pre-College
Variables on Later-Life Success (N=8,277)
Pre-College
Variables
Current
Income
R2= .12
Life
Satisfaction
R2= .23
No Health
Problems
R2= .06
Athletics
As Positive
R2= .18
Gender (F) -21 0 -8 0
Ethnicity (W) +7 +14 0 -5
Fam.Income +12 +4 0 0
Division (I) +3 0 +3 -7
Revenue (Y) +3 0 0 0
HS GPA 0 0 0 0
ACTSAT +8 0 0 0
HS Units 0 0 0 0
1/15/2008
52
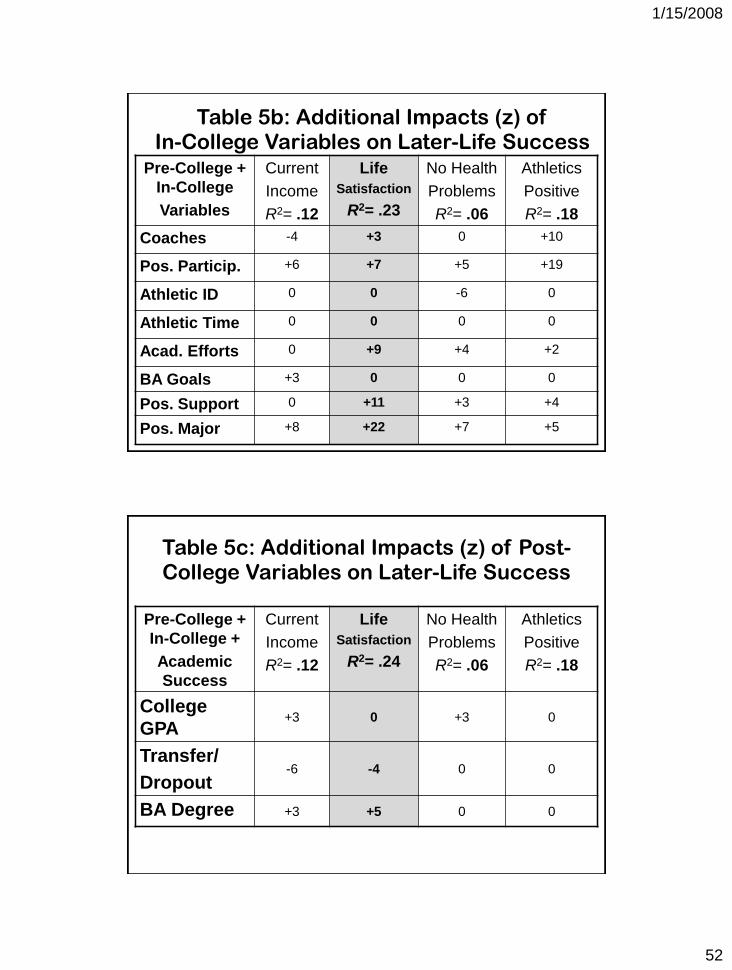
Table 5b: Additional Impacts (z) of In-College Variables on Later-Life Success
Pre-College +
In-College
Variables
Current
Income
R2= .12
Life
Satisfaction
R2= .23
No Health
Problems
R2= .06
Athletics
Positive
R2= .18
Coaches -4 +3 0 +10
Pos. Particip. +6 +7 +5 +19
Athletic ID 0 0 -6 0
Athletic Time 0 0 0 0
Acad. Efforts 0 +9 +4 +2
BA Goals +3 0 0 0
Pos. Support 0 +11 +3 +4
Pos. Major +8 +22 +7 +5
Table 5c: Additional Impacts (z) of Post-College Variables on Later-Life Success
Pre-College +
In-College +
Academic
Success
Current
Income
R2= .12
Life
Satisfaction
R2= .24
No Health
Problems
R2= .06
Athletics
Positive
R2= .18
College
GPA+3 0 +3 0
Transfer/
Dropout-6 -4 0 0
BA Degree +3 +5 0 0
1/15/2008
53
Summary & Conclusions• The SCORE items can be used to create composite measures of
pre-college characteristics, in-college integration, college academic success, and later-life outcomes.
• Pre-College Variables – The SCORE sample is positively biased but the use of IEC/APC data allow adjustments to create a more representative dataset.
• In-College Variables – The SCORE survey includes many items representing the in-college integration of SA, and these improve the prediction of later outcomes.
• Academic Success in College – SCORE is unique in tracing student’s academic career past the first college. The indices show strong academic success, and the variation can be understood in terms of pre-college and in-college variables.
• Later-Life Outcomes – SCORE is unique in tracing student’s life-outcomes for 10 years after starting their first college. These outcomes can be better understood by including all pre-college, in-college, and academic success.