Embed Size (px)
Citation preview

Chapter 20
THE STRUCTURE OF URBAN EQUILIBRIA: A UNIFIEDTREATMENT OF THE MUTH-MILLS MODEL*
JAN K. BRUECKNER
University o Illinois at Urbana-Champaign
1. Introduction
A principal challenge facing the urban economist is the formulation of a rigorouseconomic explanation for a variety of observed regularities in the spatial struc-tures of real-world cities. The most obvious among these is the dramatic spatialvariation in the intensity of urban land-use. Buildings are tall near the centers ofmost cities, while suburban structures embody much lower ratios of capital toland. Providing a precise explanation of this pattern is an important goal ofurban economic analysis. Among other obvious regularities requiring explanationis building height variation among (as opposed to within) cities. Buildings nearthe centers of large urban areas appear to be much taller than those near thecenters of small cities, and a successful economic model must be able to isolatethe causes of this observed difference.
Urban economics has met the challenge of scientific explanation, with consider-able success. The last twenty years have seen the emergence and refinement of asimple yet powerful model of urban spatial structure that successfully explains theprincipal regularities observed in the urban landscape, including those mentionedabove. This model, which derives from the work of Alonso (1964), Mills (1967,1972b), and Muth (1969), is built around the key observation that commutingcost differences within an urban area must be balanced by differences in the priceof living space. This compensating price variation, which reconciles suburbanresidents to long and costly commuting trips, has far-reaching implications forthe spatial structure of the city. While Alonso explored these implications in aframework where individuals consume land directly, Muth and Mills analysed amore realistic model where land is an intermediate input in the production ofhousing, which is the final consumption good.
The purpose of the present chapter is to provide a unified treatment of the
*I1 wish to thank Mahlon Straszheim, Takahiro Miyao, and Edwin Mills for comments. Any errorsare mine.
Handbook of Regional and Urban Economics, Volume II, Edited h E.S. Mills© 1987, Elsevier Science Publishers B.V.

J.K. Brueckner
Muth-Mills version of the urban model, deriving the well-known results on theinternal features of cities in a framework which is then used for comparativestatic analysis. This unified approach offers clear insight into the structure of theurban equilibrium. We begin by deriving the model's implications regarding theintracity spatial variation of the important urban variables (the central city-suburban building height differential noted above is, for example, shown to be animplication of the model). While the approach is somewhat different, theconclusions of the analysis are familiar from Muth (1969). Next, we offer acomparative static analysis of the urban equilibrium, deriving results that areuseful in comparing the spatial structures of different cities (the large city-smallcity building height differential noted above is derived from the model). Thisdiscussion generalizes Wheaton's (1974) comparative static analysis of the Alonsomodel to an urban economy with housing production (many mathematicaldetails are relegated to an appendix). It should be noted that while the method ofanalysis (and many of the results) are familiar from Wheaton, comparative staticanalysis of the Muth-Mills model has not previously appeared in the literature.'Finally, the chapter concludes with a short survey of papers that attempt tomodify in various interesting and realistic ways the basic assumptions of themodel.
2. Intracity analysis
In the stylized city represented by the model, each urban resident commutes to ajob in the central business district (CBD) along a dense radial road network.Commuting cost per round-trip mile equals t, so that commuting cost from aresidence x radial miles from the CBD is tx per period (the CBD is a point atx =0).2 All consumers earn the same income y per period at the CBD, and tastesare assumed to be identical for all individuals. The common strictly quasi-concave utility function is v(c, q), where c is consumption of a composite non-housing good and q is consumption of housing, measured in square feet of floorspace. Note that although real-world dwellings are characterized by a vector ofattributes, the analysis ignores this fact and focuses on a single importantattribute: interior living space. While the price of the composite good c isassumed to be the same everywhere in the city (the price is taken to be unity forsimplicity), the rental price per square foot of housing floor space, denoted p,varies with location.
Since consumers are identical, the urban equilibrium must yield identical utility
'While Mills (1967, 1972b) was the first to analyse the overall equilibrium of an urban economy, hisanalysis lacked generality.
2All the results of the analysis can be derived for a general commuting cost function T(x), providedthe function satisfies a rather weak requirement (T"<O0 guarantees satisfaction of this requirement).
822

Ch. 20: The Structure of Urban Equilibria
C
- tx0
y - tx1j
Figure 1.
levels for all individuals. Spatial variation in p provides the key to achievingequal utilities throughout the city. In particular, the price per square foot ofhousing will vary over space so that the highest utility level attainable at eachlocation equals some constant u. Substituting for c in the utility function usingthe budget constraint c +pq =y-tx, the requirement that the maximized utilitylevel equals u can be written
max v(y - tx - pq, q)= u. (1){q}
Eq. (1) reduces to two separate statements. First, since consumers choose qoptimally conditional on p, the first-order condition
2 (yt - pq, q)4 (2)vl(y-tx-pq, q)
must hold (subscripts denote partial derivatives). The key additional requirementis that the resulting consumption bundle must afford utility u, so that
v(y - tx -pq, q) = u. (3)
The simultaneous system composed of (2) and (3) yields solutions for theunknowns p and q. The solution values depend on the parameters of the equationsystem: x, y, t, and u.
Figure 1 illustrates various solutions to (2) and (3). The indifference curve withthe given utility level is plotted first. Then a budget line with c-intercept equal to
823

J.K. Brueckner
y -tx is drawn so that it is tangent to the indifference curve. The absolute slope ofthe resulting line equals p, and q is read off from the tangency point. Note thatthis procedure is the reverse of normal consumer optimization, although thediagram is identical. Utility is fixed, then a price is determined, rather than viceversa. The determination of the urban utility level will be discussed below.
The nature of the dependencies of p and q on the parameters x, y, t, and u canbe derived mathematically by totally differentiating (2) and (3). The results canalso be inferred diagrammatically from Figure 1. For present purposes, the mostimportant relationships are those between p and x and q and x. These re-lationships indicate the spatial behavior of housing prices (per square foot) andhousing consumption within the city. Totally differentiating (3) with respect to xyields
-V t+ p +p )q + v, aq =0 (4)
Since 2 =pu, by (2), (4) yields
.p r < 0. (5)ax q
Thus, the price per square foot of housing is a decreasing function of distance x tothe CBD. This result, which is of fundamental importance, can be seen directly inFigure 1. An increase in x from x0 to xl reduces the c-intercept of the budget line,as shown in the figure, so that reestablishing the tangency requires a counter-clockwise rotation of the line around the new intercept. Since the budget line'sabsolute slope decreases, it follows that p declines as a result of the x increase.
As can be seen from Figure 1, the associated change in q (from q to q) ispositive, establishing that q is an increasing function of x. Concretely, this meansthat dwelling sizes increase moving away from the center of the city, a predictionwhich appears to be confirmed in the real world. Note that since utility isconstant, the increase in q corresponds exactly to the substitution effect of thehousing price decrease. Formally, it follows that
aq ap 0, (6)
where <0 is the slope of the appropriate income-compensated (constant-utility)demand curve.3
The intuitive explanation behind the spatial behavior of p and q is straightfor-ward. Consumers living far from the CBD must be compensated in some fashionfor their long and costly commutes (otherwise, no one would live voluntarily atgreat distances). Compensation takes the form of a lower price per square foot of
3 Note that r=dMRSj/qluji,y=,, a negative expression given the convexity of indifference curves(MRS v,2 /u i).
824

Ch. 20: The Structure of Urban Equilibria
housing relative to close-in locations. The resulting decline with x in the price ofhousing causes consumers to substitute in its favor, leading to larger dwellings atgreater distances.4
The influences of the parameters y, t, and u on p and q tell us nothingimmediate about the internal structure of the city. However, since the variouspartial derivatives play a crucial role in the comparative static analysis presentedbelow, derivation of their signs is helpful at this point. The discussion will makeuse of Figure 1. Since an increase in y has the same effect as a decrease in x on thec-intercept of the budget line, it follows that a rotation opposite to that discussedabove is needed to restore a tangency. By the above arguments, it then followsthat5
Op>0, <0. (7)
Similarly, since an increase in t has the same effect on the budget line's c-interceptas an increase in x, it follows that
aP<0, ->0. (8)
Finally, an increase in u holding x, y, and t fixed raises the level of the indifferencecurve but leaves the c-intercept of the budget line unchanged. A counterclockwiserotation of the line around its fixed intercept is therefore required to restore thetangency, reducing p. The effect on q of the increase in u depends on whetherhousing is a normal good. If housing is normal, then rotation of the budget lineleads to an increase in consumption, as shown in Figure 1 (housing consumptionrises from qO to q). Therefore, when housing is a normal good, it follows that6
4Note that (6) together with (5) implies that 2p/0x2 >0, or that p is a convex function of x. Thesame conclusion would hold with a general commuting cost function T(x) as long as T"<O. Also,note that while the price per square foot of housing declines with x, dwelling rent, which equals pq,may either rise or fall. This follows because a(pq)/ax=(1 +plq)qOpax-_(1 +r)qOp/Ox, where a is theincome-compensated price elasticity of demand. Note that :(pq)/Ox 0 as a 1 -1.
SNote that aq/ay bears no relation to the regular income effect since utility is held fixed.'The results in (7), (8), and (9) are derived mathematically by total differentiation of (2) and (3) with
respect to Y, t, and u. This yields
ap 1 ap -x ap -1->0, =-0-<, -= <0
Oy q at q au qvu
Oq p Oq ap aq =p OMRS 1]- _-<O - = _p _ 1I>0.
ay ay at at au au ec Ir
The sign of aq/au is derived using the inequality MRS/ac>0, which must hold for q to be a normalgood. The inequality states that indifference curves become steeper moving vertically in Figure 1.Together with convexity, this property implies that a parallel upward shift in the budget line movesthe tangency point to the right.
825

J.K. Brueckner
-P<0, -q>0. 19)
Turning now to the supply side of the housing market, it is assumed thathousing square footage is produced with inputs of land and capital N accordingto the concave constant returns function H(N, 1). This function gives the numberof square feet of floor space contained in a building with the specified inputs.7
Concavity of H means among other things that H <0 (capital's marginalproductivity diminishes), reflecting the fact that as buildings become taller, capitalis increasingly consumed in non-productive uses such as stairways, elevators, andfoundations.
An important feature of the model is that the issue of the durability ofstructures is avoided via the implicit assumption that housing capital is perfectlymalleable. In effect, the analysis portrays producers as able to costlessly adjustboth their capital and land inputs from period to period. Accordingly, producersare viewed as renting the inputs rather than purchasing them outright, anassumption which may appear particularly unrealistic for the capital input. Itshould be realized that the assumption of malleable capital is invoked to achieveanalytical tractability. Models in which the durability of structures is explicitlyrecognized are more realistic than the present one but considerably morecomplex. s
Recalling that floor space is rented to consumers at price p, it follows that therevenue from a building is pH(N, 1). Note that the building is implicitly beingdivided up into dwellings (apartments) of the size demanded by consumers.Letting r denote land rent per acre (an endogenous variable) and i denote thespatially-invariant rental price per unit of capital, it follows that producer profitis pH(N, )-iN- rl. Since H exhibits constant returns, profit may be rewritten as1(pH(N/1, 1)-iN/ - r). To simplify notation, let S denote the capital-land ratioN/I, which is an index of the height of buildings (S will be referred to as structuraldensity). Substituting S, profit can be rewritten as
1(ph(S) - iS - r), (10)
where h(S)-H(S, 1) gives floor space per acre of land. The function h satisfiesh'(S)_ H(S, 1)>0 and h"(S) H,,(S, 1)<0.
For fixed , the producer chooses S to maximize profit per acre of land (theexpression in parentheses in (10)), and land rent r adjusts so that profit per acre iszero. Since total profit is then zero regardless of the value of , the scale of the
'It is easy to see that in order for this production function to be well-defined, the fraction of theland area covered by the capital must be specified in advance. For a model where the open spacesurrounding the structure gives utility to the consumer and consequently becomes a choice variable ofthe producer, see Brueckner (1983).
SFor a survey of such papers, see the chapter by Miyao in this volume.
826

Ch. 20: The Structure of Urban Equilibria
producer's building (represented by ) is indeterminate. From (10), the first-ordercondition for choice of S and the zero-profit condition are
ph'(S) = i, (11)
ph(S)- iS = r. (12)
Recalling that p is already a function of x, t, y and u from the solution to theconsumer problem, it follows that (11) and (12) determine S and r as functions ofthese same variables and i. Totally differentiating (11) and (12) with respect to x,t, y, and u yields
h' + ph"- =0, (13)
aS ap ar(ph' - i) + h= , =x,t,y,u (14)
Recalling (11), (14) and (13) yield
ar apa =h ap (15)
as _ h' apat=- ph" ~a 4 =x ,ty, u. (16)a- ph" ' xy
The effect of a change in the capital cost parameter i is not considered in theanalysis.
Since h"<O, (16) implies that as/q has the same sign as ap/a¢, while ar/aand ap/a¢ also have the same sign by (15). Recalling (5), the important results
<r0, as 0, (17)
are then immediate. Thus, land rent and structural density are both decreasingfunctions of x, so that land is cheaper and buildings are shorter farther from theCBD. The latter result shows that the model successfully predicts the decline inbuilding heights over distance that is observed in real-world cities. The intuitiveexplanation for the results in (17) is that lower land rents are required at greaterdistances to compensate producers for the lower price per square foot of housing.The resulting decline with distance in the relative price of land causes producersubstitution in its favor, leading to lower structural densities.
An additional variable of interest is population density, denoted D. Assumingwithout loss of generality that households each contain one person, D is given byh(S)/q, which equals square feet of floor space per acre divided by square feet offloor space per dwelling, or dwellings (persons) per acre. Since aq/ax>O and
827

J.K. Brueckner
aS/ax <, it follows immediately that aDlax <o; population density is a decreas-ing function of distance. The intuitive reason is that since buildings are shorterand the individual dwellings contained within them are larger at greater dis-tances, fewer dwellings and hence fewer people fit on each acre of land. Note thatthe spatial behavior of population density is a joint result of consumer andproducer decisions; consumer substitution in favor of housing and producersubstitution in favor of land as x increases are together responsible for the declineof density.
Summing up, the analysis so far has yielded results on the internal structure ofcities that appear to recapitulate reality. In particular, the model has predictedthat the price per square foot of housing, land rent per acre, and structural andpopulation density are all decreasing functions of distance to the CBD, withdwelling size an increasing function of distance. While these conclusions appearbroadly consistent with the results of casual empiricism, systematic empirical testsof the model's predictions have focused mainly on the population densityvariable. A wealth of evidence has accumulated confirming the negative asso-ciation between density and distance predicted by the model.9
3. Comparative static analysis
While we have seen that the Muth-Mills model does a good job of predictingobserved regularities in the internal structures of cities, an equally important goalof the model is to explain intercity differences in spatial structures. For example,the model should be able to explain the building height differential between largeand small cities noted in the introduction.
Intercity analysis requires development of the two conditions that characterizethe overall equilibrium of the urban area. The first equilibrium condition requiresthat housing producers outbid agricultural users for all the land used in housingproduction. Letting x denote the distance to the urban-rural boundary, thiscondition translates into the requirement that urban land rent equals theagricultural rent rA at . Since r/lx<O, urban rent will exceed rA inside x, asrequired, and fall short of r beyond x. Recalling that r depends on y, t, and u inaddition to x, the first equilibrium condition may be written'@
r(x, y, t, u)=rA. (18)
9 See, for example, Muth (1969). For an analysis of the conditions under which the commonly-fittednegative exponential density function will be the correct specification, see Brueckner (1982).
'°Recall that while r depends on the capital cost parameter i, this variable is not of interest in thepresent analysis.
828

Ch. 20: The Structure of Urban Equilibria
$
Figure 2.
Figure 2 presents a graphical representation of condition (18) (note that the levelof the r function will depend on y, t, and u). M
The second equilibrium condition requires that the urban population exactlyfit inside x. To formalize this condition, let 0 equal the number of radians of landavailable for housing at each x, with <0<27 (the remaining land will beconsumed by the transportation network and topographical irregularities). Then,note that the population of a narrow ring with inner radius x and width dx willapproximately equal OxD(x, y, t, u)dx, where the functional dependence of popu-lation density has been made explicit. The condition that the urban population Lfit inside x may then be written
T OxD(x, t, y, u) dx = L. (19)
The interpretation of the urban equilibrium conditions depends on whether thecity is closed or open to migration. In the "closed-city" case, where migration
"The curvature of the land rent contour can be derived by using (15) to compute2 r aS p ah2p
ax' ax axX2
Since this expression is positive by previous results, the land rent contour is convex, as shown inFigure 2.
829

J.K. Brueckner
cannot occur, the population variable L is exogenous and the urban utility u isdetermined along with x by balancing of the supply and demand for housing, asexpressed in conditions (18) and (19). These conditions constitute two simul-taneous equations that determine equilibrium values for u and x as functions ofthe parameters L, rA, y, and t. In the "open-city" case, costless migration ensuresthat the urban residents are neither better off nor worse off than consumers in therest of the economy. In this case, the urban utility level is fixed exogenously, andpopulation L becomes endogenous, adjusting to whatever value is consistent withthe prevailing utility level. The boundary distance x remains endogenous, and rA,y, and t remain as parameters. Note that in the open-city case, the system (18)-(19)is recursive instead of fully simultaneous. Eq. (18) determines x directly in termsof the parameters, and (19) then gives L.
With the urban equilibrium conditions established, the stage is now set forcomparative static analysis." The closed-city case is discussed first, with atten-tion then turning to the open-city case.
3.1. The closed-city case
The goal of the analysis is to deduce the impacts of changes in the parameters L,rA, y, and t on the spatial size of the city (x), housing prices (p), land rents (r),dwelling sizes (q), and building heights (S). The first step in the analysis is totaldifferentiation of the equation system (18) and (19), which yields the comparative-static derivatives au/8 and x:/8, q = L, rA, y, t. While this calculation shows theimpact of parameter changes on x, more work is required to derive the effects onp, q, r, and S. Recalling that at a given x, each of these variables depends on y, t,and u, the sources of change are clear. When y or t increases, there is both a directeffect and an indirect effect operating through the induced change in u. When L orrA increases, the indirect effect alone is felt since p, q, r, and S do not dependdirectly on population and agricultural rent. Since the analysis outlined above isquite complex, details are relegated to an appendix.
Before proceeding, it is important to realize that the discussion will focus onthe impact of parameter changes on the equilibrium of a single city. Once thedifferences between the pre-change and post-change cities are known, the con-clusions can be used to make intercity predictions (separate cities with parameterlevels corresponding to the pre- and post-change values can be compared).
'2A final point regarding the urban equilibrium concerns the disposition of the rent earned byurban land. Since urban residents subsist on wage income alone, it is clear that the analysis implicitlyassumes that rent is paid to absentee landlords living outside the urban boundary. See Pines andSadka (1986) for comparative static analysis of a model where land is internally owned.
830

Ch. 20: The Structure of Urban Equilibria
3.1.1. The effects of an increase in L
It is shown in the appendix that and u are respectively increasing anddecreasing functions of L, or that
U->0, a<0. (20)
A population increase thus causes the city to expand spatially and leads to alower urban utility level. The population increase will also lead to changes in p, q,r, and S at each location. Since y and t are fixed, the impact of the increase in L isfelt entirely through the induced change in u, as explained above. The impact onp is given by
dp Op aud-L uL >0, (21)
where the inequality follows from (20) and the fact that p/Ou is negative (see (9)).Eq. (21) indicates that the price per square foot of housing rises at all locations asa result of the population increase.
The total derivatives of q, S, and r with respect to L are given by expressionsanalogous to (21), with p replaced by the appropriate variable. Since the sign ofOq/au is positive by (9) and since r/Ou and as/au share the negative sign of ap/auby (15) and (16), it follows using (20) that
dq dr dSdq<0, >0, >0. (22)dL ' dL dL
Thus, an increase in L leads to smaller dwellings, higher land rents, and higherstructural densities (taller buildings) at all locations. Since q falls and S rises, itfollows that population density rises everywhere (dD/dL> 0).
It is helpful to trace through the effects of the population increase using aheuristic approach. When the city starts in equilibrium and population increases,excess demand for housing is created at the old prices: the urban population nolonger fits inside the old . As a result, housing prices are bid up throughout thecity. On the consumption side of the market, this increase in prices leads to adecline in dwelling sizes at all locations. On the production side, the priceincrease causes land rents to be bid up everywhere, and higher land rents in turnlead producers to substitute away from land, resulting in higher structuraldensities. Since buildings are taller and dwellings smaller, population density riseseverywhere, so that more people fit inside any given x. Finally, the rise in the levelof the land rent function leads to an increase in the value of x that satisfies (18)(Figure 3 shows the upward shift in the land rent contour (from r to r,) togetherwith the increase in x (from xa to xb)). The resulting spatial expansion of the city,
831

J.K. Brueckner
I II I
Xe Xa Xd Xb
Figure 3.
together with the increase in population densities, tends to eliminate the excessdemand for housing, restoring equilibrium.
By describing what appear to be instantaneous changes in the structure of thecity as a result of the population increase, the above discussion ignores the factthat buildings are not easily or quickly replaceable. This, of course, is a reflectionof the assumption that housing capital is perfectly malleable. Realistically, onewould expect the adjustments described above to unfold over a long time periodas buildings are torn down and replaced. Thus, the comparative static results arebest viewed as predicting the long-run effect of a population increase. 3
Although the appropriate time horizon must be considered in predictingchanges in the spatial structure of a particular city, this issue does not arise whenthe comparative static results are used to predict intercity differences at a givenpoint in time. The reason is that in a stationary or gradually changing world, thespatial structures of different cities will reflect equilibrium (or approximateequilibrium) outcomes, so that the comparative static results will give correctpredictions in intercity comparisons. In the case of population differences, wewould expect (holding r, y, and t constant) that larger cities would have biggerspatial areas. Moreover, at any given distance from the center, the larger city willhave taller buildings and smaller dwellings, and thus a higher population density.
t3 A problem with this view is that the model is being interpreted in a dynamic sense even thoughproducer decision-making has been modeled in a static context.
832

Ch. 20: The Structure of Urban Equilibria
In addition, the price per square foot of housing and land rent per acre will behigher at a given distance from the center in a larger city. These predictionsappear to be consistent with the observed features of cities in the real world.' 4
3.1.2. The effects of an increase in rA
The effects on the closed-city equilibrium of an increase in the agricultural rent rAare similar to those of an increase in population. The appendix establishes that
aX <0, au <0, (23)
indicating that an increase in agricultural rent reduces the spatial size of the cityand lowers the urban utility level. Since rA is not a direct argument of p, q, r, andS, the derivation of the impacts of the agricultural rent change on these variablesproceeds as in the case of a population increase, with each total derivative equalto u/SrA times the partial derivative of the relevant variable with respect to u (forexample, dp/drA =(Opl/u)(au/lrA)). Using (9), (15), and (16) together with (23), thesigns of the total derivatives are
P >0, q <O0, 0 dS>0. (24)dr A dr d rdrA dr A
Note that the directions of change in (24) are the same as in the case of apopulation increase. In particular, the price per square foot of housing, land rent,and structural density rise at each location, while dwelling sizes fall. Note that themovements of q and S raise population density everywhere, so that dD/drA >0.
The intuitive explanation for the above results borrows from the explanation ofthe impact of a population increase. Proceeding heuristically, the first-roundeffect (holding u constant) of an increase in rA is spatial shrinkage of the city, withland near the boundary returned to agricultural use (with u and hence r fixed, anincrease in rA from r' to r reduces x below its original value of xa, as can be seenin Figure 3). This change, however, creates excess demand for housing, so thatfurther adjustments unfold as in the case of a population increase. Note thatwhile x expands from its first-round adjustment value (reaching xc in Figure 3 inthe case where the final land rent function corresponds to r,), the variable neverrises to its original level (since the city becomes denser, its population fits in asmaller area).
These results can be used to predict differences between otherwise identicalcities facing different agricultural rents. For given values of L, y, and t, a city in a
4 For empirical confirmation of the comparative static predictions regarding the spatial sizes ofcities, see Brueckner and Fansler (1983).
833
region of low agricultural rent (a desert, for instance) will have a larger area thana city located amidst productive farmland. In addition, at a given distance fromthe center the low-rent city will have shorter buildings and larger dwellings, andthus a lower population density. Also, the price per square foot of housing andland rent per acre will be lower in the low-rent city at a given distance from thecenter. Real-world observation appears to confirm these predictions.
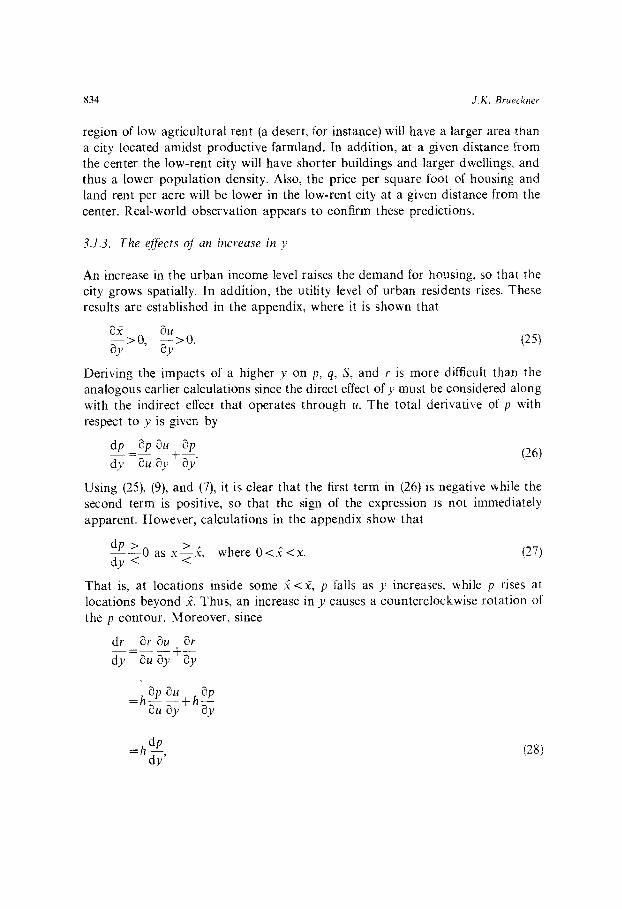
3.1.3. The effects of an increase in y
An increase in the urban income level raises the demand for housing, so that thecity grows spatially. In addition, the utility level of urban residents rises. Theseresults are established in the appendix, where it is shown that
OX au>0, >0. (25)
ay ay
Deriving the impacts of a higher y on p, q, S, and r is more difficult than theanalogous earlier calculations since the direct effect of y must be considered alongwith the indirect effect that operates through u. The total derivative of p withrespect to y is given by
dp _p au apdp = pu + (26)dy u y y'
Using (25), (9), and (7), it is clear that the first term in (26) is negative while thesecond term is positive, so that the sign of the expression is not immediatelyapparent. However, calculations in the appendix show that
-P 0 as x > , where 0<x< x. (27)dy < <
That is, at locations inside some <x, p falls as y increases, while p rises atlocations beyond )x. Thus, an increase in y causes a counterclockwise rotation ofthe p contour. Moreover, since
dr Or u ar
dy u y y
=hap au +h apau y ay
=h dp (28)dy'
834 J.K. Brueckner

Ch. 20: The Structure of Urban Equilibria
by (16), it follows that the land rent contour rotates counterclockwise in step withthe p contour (the point of rotation is the same ). Figure 3 illustrates thisoutcome (r rotates from r to r2 and x increases from xa to xd). Since
dS -h' dpdy ph" dy'
by (15), it follows (recalling h" <O) that the S contour rotates in the same fashionas the p and r contours. Thus, an increase in y lowers the price per square foot ofhousing, land rent, and structural density at central locations while increasing thelevels of these variables at more distant points. These conclusions, as well as theresults in (25), can be used as before to predict differences in the features ofotherwise identical cities with different values of y.
It is easy to establish that q rises in response to the increase in y at any locationwhere p falls. This follows because the new consumption bundle must lie on ahigher indifference curve [recall (25)] at a point where the MRS is lower (theabsolute slope of the budget line, p, has fallen by assumption). Such a point mustlie to the right of the original bundle in Figure 1 given that housing is a normalgood and indifference curves are convex. Thus, since p falls inside x, dwelling sizesrise at central locations in response to the increase in income. Since S falls insidex from above, it follows that population density also falls at central locations.
By referring to Figure 1, it is easy to see that at locations where p rises, q mayeither rise or fall. Thus, at locations between and the old x, the change in q inresponse to the increase in y is ambiguous. Since it may be shown that the valueof p at the new urban boundary is the same as at the old,' 5 it follows that thenew boundary value of q must be higher than the old boundary value. It is easyto see, however, that this conclusion is not inconsistent with a decline in q at someintermediate location.
To gain an intuitive understanding of the rotation of the p contour, considerthe change in locational incentives caused by an increase in income. Whenincome rises, desired housing consumption increases, and since housing ischeaper at greater distances, consumers have an incentive to move to less centrallocations. This desire to relocate drives up houses prices at distant locations anddepresses prices in the now less-attractive central part of the city. These changeslead to sympathetic movements in r and S.
' 5To see this, note that r in (12) must be replaced by r when (11) and (12) are evaluated at x. Thetwo equations then serve to determine boundary values of p and S. Since x does not appear explicitly,it follows that the boundary values of both these variables are independent of x. Note that thisargument implies that the boundary values of S and p will also be invariant to changes in Land t(they will change with rA, however).
835

J.K. Brueckner
3.1.4. The effects of an increase in t
When the commuting cost parameter t increases, commute trips of any givenlength become more expensive, and the city shrinks spatially in response. Theurban utility level declines. These results are proved in the appendix, where it isshown that
<0, -- <0. (30)
As in the case of an increase in income, the impacts of higher commuting cost onp, q, r, and S are complex. The appendix establishes that
dp apau ap> <dp =ap a +--0 as x<x*, where 0<x*<x. (31)dt u t at < >
Thus, the housing price contour rotates in a clockwise direction, with p risinginside some x* <x and falling beyond x*. As in the earlier discussion, the r and Scontours rotate in exactly the same fashion as the p contour (in this case,clockwise). An increase in t therefore raises the price per square foot of housing,land rent, and structural density at central locations while lowering the values ofthese variables at more distant points. These impacts, of course, are just thereverse of those generated by an increase in y. The rotation of the land rentcontour from r to r3 and the resulting decline of x from x. to e are shown inFigure 3 (for simplicity, the Figure assumes x =).
Applying the same argument as before, it follows that q falls at any locationwhere p rises (recall that utility declines in the present case). Thus, dwelling sizesdecrease in the central part of the city, although they may rise beyond x*.Recalling that S rises inside x*, it follows that central population densities rise.
An intuitive understanding of the rotation of the p contour comes from notingthat the increase in t makes close-in locations more attractive given the originalpattern of housing prices. The resulting desire of consumers to move toward theCBD bids up central prices and reduces prices at more distant locations, causinga clockwise rotation of the contour.
3.2. The open-city case
For the predictions of the closed-city model to be valid, urban populations mustbe captive, ruling out utility-equalizing migration flows. When such flows occur,the urban utility level is no longer determined internally, and the open-city modelis appropriate. The discussion now turns to a comparative static analysis of thismodel.
836

Ch. 20: The Structure of Urban Equilibria
As noted above, the exogenous parameters in the open-city model are u, rA, y,and t. Holding u fixed, the goal of the analysis is to derive the impact of changesin the observable parameters r, y, and t on , L, p, q, r, and S (recall thatpopulation is now endogenous). The analysis is considerably simpler than in theclosed-city case. First, since u is now a parameter, the impact of a changes in rA, yor t on x follows immediately from (18). With the x impact thus determined, theeffect of a parameter change on L can be read off directly from (19) (the system(18)-(19) is now recursive rather than simultaneous). In addition, the exogeneityof u means that indirect effects on p, q, r, and S (which figured prominently in theclosed-city analysis) are absent. Direct effects are the sole sources of change.
An increase in the agricultural rent level has an especially simple impact on theopen-city equilibrium. Since y, t, and u are fixed, the land rent function isunchanged as rA increases (both direct and indirect effects are absent in this case).As a result, x must fall as rA increases, as can be seen in Figure 3. Since p, q, and Sare (like r) unchanged at a given x, it follows that the effect of the increase in rA issimply to truncate the city at a smaller x, reducing its population but not alteringthe structure of its remaining area. The model therefore predicts that an open cityin a high-rA region will be smaller spatially and have a lower population than anopen city in a low-rA region. At a given distance from the CBD, however, thecities will be identical.
An increase in y leads to more extensive changes in the open-city equilibriumsince the increase in income alters p, q, r, and S at every location, with theimpacts (direct effects) given by the partial derivatives in (7), (15), and (16). Thesigns of these derivatives indicate that the price per square foot of housing, landrent, and structural density rise at all locations in response to the increase in y,while dwelling sizes fall. The upward shift in r leads to an increase in x, and sincepopulation density increases everywhere, L from (19) also increases. These resultsindicate that in an open urban system, a high-income city will have a higherpopulation, a larger area, and will be denser and more expensive to live in than alow-income city. Note that the model predicts the positive correlation betweenincome and city size noted in various empirical studies.16
The changes in the open-city equilibrium following from an increase in t arejust the reverse of the impacts of higher income. From (8), (15), and (16), p, r, andS fall at all locations as t increases, while dwelling sizes increase everywhere. Sincer falls, x declines in Figure 3. Lower population densities at all locations togetherwith a smaller x lead to a smaller L by (19). Thus, a high-t city in an open systemwill have cheaper housing, a smaller area and population, and will be less densethan a low-t city.
To appreciate the connection between these comparative static results and
6Sef., for example, Hoch (1972).
837
J.K. Brueckner
those for a closed city, it is helpful to decompose the open-city changes into twoparts. First, let the given parameter (rA, y, or t) increase holding L fixed, andpredict impacts using the closed-city analysis. Then, adjust population to cancelthe utility change generated by the parameter increase, again inferring impactsusing the closed-city model. The net impact of the two changes corresponds tothe open-city effect of the given parameter change. Consider first the case of anincrease in income. Holding L fixed, a higher y increases and causes counter-clockwise rotations of the p, r, and S contours (recall Section 3.1.3). Since utilityrises and since aulaL<O, it follows that an increase in population is required torestore the original utility level. The required increase in L raises x further andshifts the rotated p, r, and S contours upward while shifting the q contourdownward. From above, the net changes relative to the starting point turn out tobe an upward shift in each of the p, q, and S contours, and a downward shift inthe q contour. Note that the changes holding L fixed could be interpreted asshort-run adjustments, with the remaining impacts unfolding after migrants havebegun to enter the city in response to the higher utility level.
While the decomposition of the effect of an increase in t parallels the above, anincrease in r, yields a somewhat different series of changes. Holding L fixed, ahigher rA lowers x, raises the p, r, and S contours, and lowers the q contour. Sinceutility falls as a result of the higher rA, a decline in population is required torestore the original utility level. The required decrease in L lowers the p, r, and Scontours and raises the q contour, restoring their original positions. The declinein r drives x further below its original level. Again, the first-round impacts can beviewed as occuring before migration begins, with the second-round impactscapturing the effects of the outward migration flow induced by the decline in thecity's standard of living.
In concluding this section, it is interesting to consider the question of whethercities in a national economy are best viewed according to the open- or closed-citymodel. On the one hand, the costs of migration (both pecuniary and psychic) areoften high, so that utility differences between cities may persist over long periods.On the other hand, migration flows must ultimately eliminate intercity differencesin standards of living, especially over a time horizon as long as one or twogenerations. Casual empiricism suggests that the predictions of both the open-and closed-city models are partly borne out in reality. For example, the realworld appears to exhibit the positive correlation between income and citypopulation predicted by the open-city model. Conversely, the low-density charac-ter of desert cities is consistent with predictions of the closed-city model but atvariance with those of the open-city model. This kind of evidence suggests thatutility levels in certain cities may diverge appreciably from the national norm atany point in time. Such differences, of course, are always in the process of beingeliminated as consumers migrate.
838

Ch. 20: The Structure of Urban Equilibria
4. Modifications of the model
Having gained an understanding of the properties of the Muth-Mills model, it isimportant to remember that its portrayal of the urban economy is highly stylized.While the good predictive performance of the model suggests that its simplifi-cations are artfully chosen, capturing the essential features of real-world cities, itis nevertheless instructive to list the ways in which the model is unrealistic andnote the attempts of various authors to add greater realism.
The assumption that the city is monocentric is perhaps the most obvioussource of difficulty. While the assumption will be reasonably accurate for manyurban areas, many cities have important secondary employment centers outsidethe CBD. By demonstrating that land-use patterns around such centers followthe predictions of the basic model, Muth (1969) showed that the lessons of theanalysis are largely unchanged in a polycentric setting. In a different vein, White(1976) analyzed the forces leading to decentralization of employment by explor-ing the incentives that might lead a CBD firm to seek a suburban location. Inmore ambitious studies, Mills (1972a) and Fujita and Ogawa (1982) constructedmodels where the location of all employment within the city is endogenous andpotentially decentralized.
The assumption that all urban residents earn the same income is also unre-alistic. The effect of relaxing this assumption has been discussed by Mills (1972b)and extensively analyzed by Muth (1969), who offers a complete treatment of theeffect of income differences on household location. In addition, Hartwick et al.(1976) and Wheaton (1976) present comparative static analyses of the equilibriumof a city with multiple income groups. The results of these studies show thatmany of the key properties of the model are unaffected by income heterogeneity.
While the Muth-Mills approach essentially ignores the urban transportationsystem by assuming an exogenous commuting cost function, the fact that urbantraffic congestion (and hence the cost of travel) is endogenous has been stressed ina number of studies. Although the endogeneity of commuting costs has receivedmost attention in normative models of city structure [see, for example, Dixit(1973)], early positive analyses recognizing the importance of investment in thetransportation network were provided by Mills (1967, 1972a).
Another unrealistic feature of the model is its treatment of the housingcommodity. As was noted in Section 2, the model's focus on a single housingattribute (floor space) is inconsistent with the fact that real-world dwellings arecharacterized by a vector of attributes. Although awareness of this fact gave birthto the empirical hedonic price literature in the early 1970s, incorporation ofmultiple housing attributes in urban spatial models has been more recent [seeButtler (1981) and Brueckner (1983)]. Interestingly, this modification leaves mostof the important predictions of the model unchanged.
839

J.K. Brueckner
Modification of the Muth-Mills assumption that housing capital is perfectlymalleable has been the goal of a growing new literature in urban economics. Theresulting models, which stress the importance of spatial variation in the age ofbuildings, are considerably more complex than the basic malleable-capital frame-work (see Miyao, Chapter 22 in this volume, for a survey). The models do,however, generate the kind of spatial irregularities that are observed on a microlevel in real-world cities (erratic local building height patterns, for example) butare not successfully explained by the Muth-Mills model.
Finally, a number of studies have introduced local public goods (which areabsent in the Muth-Mills framework) into urban spatial analysis. While moststudies assume that public consumption is spatially uniform, Schuler (1974) andYang and Fujita (1983) add a new spatial element to the analysis by focusing onmodels where the public good level varies with location.
Appendix
This appendix derives the comparative static results cited in Section 3. While theanalysis largely parallels that of Wheaton (1974), the derivations do not rely onWheaton's assumption that the non-housing good is normal (more extensivesubstitutions in several expressions made avoidance of the assumption possible).
The first step is computation of the partial derivatives of r with respect to x, y,t, and u. Substituting for ap/a in (15) using (5) and footnote 6, it follows that
Or -th Or h Or -xh Or -h--- <0, -=->0, -= -- <0, = - < O. (la)
ax q 3y q 0at q u qvl
Then, noting that Dh/q= -(arlax)/t, (19) may be rewritten as
rX ar
-J x -- dx=tL/O. (2a)
Integrating (2a) by parts then yields
- rAx + r dx = tL/O, (3a)
where (18) has been used. Letting denote any one of the parameters (L, r, , t),total differentiation of (3a) gives
(a r ar u r L at arA)l+& u __ dx=u- t+- L +x, (4a)
(note that the terms involving x/Oi, cancel and that since u is an endogenousvariable, the effect of 2 on the u argument of r must be taken into account). Since
840
Ch. 20: The Structure of Urban Equilibria
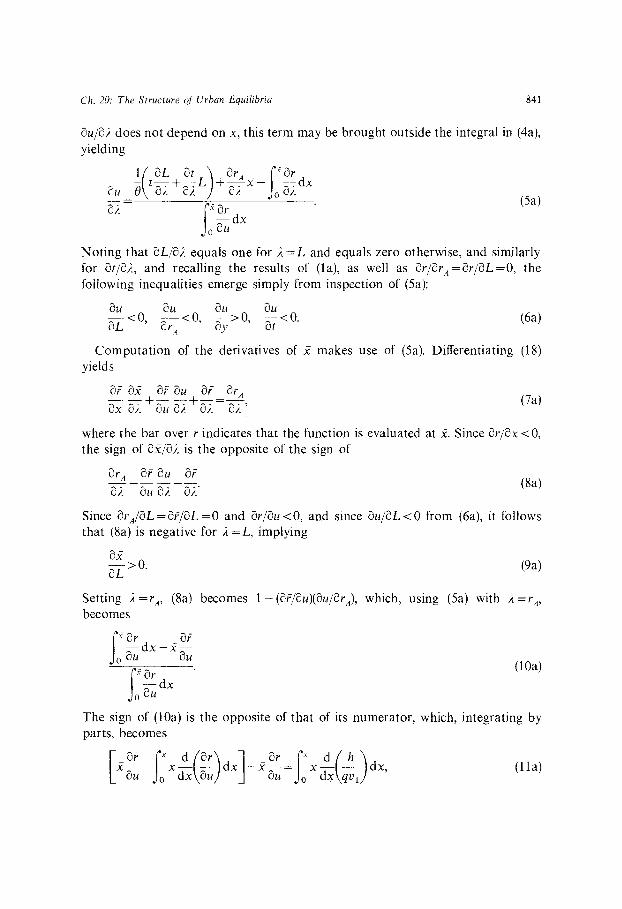
Ou/a; does not depend on x, this term may be brought outside the integral in (4a),yielding
1at aL at a) ar A - ar
(5a)S-dxNoting that aL/a equals one for i,=L and equals zero otherwise, and similarlyfor at/d;, and recalling the results of (la), as well as ar/arA=arlaL=O, thefollowing inequalities emerge simply from inspection of (5a):
au au au au-- <° <0, >0, >-<O. (6a)aL OrA ay at
Computation of the derivatives of x makes use of (5a). Differentiating (18)yields
aF ax aFau aD rAOF-Ox+OF au+~~~~~~ + - OrA ~(7a)ax a -au ax a; '
where the bar over r indicates that the function is evaluated at x. Since /ax <0,the sign of x/8a is the opposite of the sign of
rA aaF u aF-a-, ~~~~- -as~~~~ ~(8a)ax au a ax2
Since arAaL=a?/aL=o and aF/au<O, and since aul/L<O from (6a), it followsthat (8a) is negative for ; =L, implying
ax> 0. (9a)
OL
Setting A =rA, (8a) becomes 1-(8/jau)(au/arA), which, using (5a) with .,=r,becomes
r ar ar
au dau
r d (10a)-dx
The sign of (10a) is the opposite of that of its numerator, which, integrating byparts, becomes
_f,"x d aF f d h Lx F z d ' dx] -x- JO x -q dx, (la)xau dx au d\ 1 d '
841

J.K. Brueckner
using (la). Now (h/q)/ax - D/Ox<0. Also, it may be shown that dvl/dx > 0 holdsas long as q is a normal good. These facts imply d(h/qvl)/dx < 0 and yield positivesigns for (10a) and (8a), giving
ax-- <0. (12a)OrA
The positive sign of dv,1 /dx = vuc/x + v1 2aq/,x =(v2 - v2 v/vl)Oq/ax is estab-lished by noting that the term multiplying the positive expression aq/ax will itselfbe positive when q is a normal good. Note that ac/ax= -(v 2/vl)q/ax sinceutility is constant over x.
When ;i=y, (8a) becomes -((OF/Su)(au/Sy)+O?/Sy), which, substituting (5a),has the sign of
aFf r-r a r- arU - _ d- - - dx. (13a)
ay 0 au 8 aJo ayGathering all terms under the same integral sign and substituting from (la), (13a)becomes
) _ dx, (14a)Jo qq vi vj
where the bar again indicates that the variable is evaluated at x. Since dv, /dx >0,it follows that the integrand in (14a) is negative over the range of integration,making (13a) and (8a) positive and yielding
->0. (15a)ay
Computation of xjat is more difficult and proceeds in a reverse manner to theabove. Eq. (19) is differentiated directly and then u/St is eliminated using (7a).Differentiating (19) with respect to t yields
__ ax r /a aJD auxD-t + x t +u t dx=0. (16a)
Rearranging (7a) to solve for u/St and substituting in (16a) yields, after morerearrangement,
axF_ ar O a a - `OD Or OD fxD-- I xx I x- _ -_ _ _ dx. (17a)
DB du-Jo Xau x _ J0 k u t at aud
Using the definition of D,
aD h'OS h' q h 8a-t =--- 2-. (18a)at q at q2 at'
842

Ch. 20: The Structure of Urban Equilibria
Substituting for S/at and aq/at using (16) and footnote 6, (18a) becomes
a0 F_(h')2 h 8Vp ap (19a)at - Lphq +q t aPt'
with >0. To evaluate D/lau, as/au and q/au from (16) and footnote 6 aresubstituted into an expression analogous to (18a). Since
aq/au = (aplau - (a MRSlc)(lv))r/,
the result is
aD rp h MRS r ap , (20a)(20a)au U u q2 ac V au
with A- (h/q2)(OMRS/Oc)(r/vl)< 0 (see footnote 6). Since ap/au < 0, it follows thataD/u is negative, which implies that the integral on the LHS of (17a) is positive,making the entire term multiplying /xlSt negative. Next, substituting (19a) and(20a) to evaluate the RHS of (17a), the expression reduces to
o xF t ____ +xA¥ dx=0 0 L au at at au at]
S:r-r i h X x aF xr -x- ) + xA dx. (21a)
The second term in the integrand of (21a) is positive while the first term is alsopositive since x/v, >x/v, holds over the range of integration by virtue ofdv/dx>0. Thus the RHS of (17a) is positive, and it follows that
ax< 0. (22a)
The final results to be derived are the effects of an increase in y or t on p.Substituting in (26) using footnote 6 yields
dy + ), (23a)
where the - indicates that the variable is evaluated at some xk between 0 and x.Substituting for u/Sy from (5a) and factoring out S-Sr/lu dx, (23a) has the signof
F OXar 1 rXOr I-I I dx+ I -dxl (24a)
LJo, au aJoy y
843

J.K. Brueckner
=-i -I-- I dx, (25a)
using (la). When x=x, so that r =it,, (25a) is positive given du1/dx>0.Conversely, when =O, so that , =v', (25a) is negative. Furthermore, since (25a)is increasing in x, it follows that the expression changes sign just once, establish-ing that d/dy is negative for less than some and positive beyond .
Substituting in (31) using footnote 6 gives
dp 1 au-= _ 5 + . (26a)
dt 4( A at).
Substituting for u/t using (5a), (26a) has the sign of
' xr 1 L 1 er_" -Ordx +IL -_- I C-Ordx. (27a)
o au C 0 b Ju atd
Using (2a) to eliminate L/O and replacing r/lx by (tlx)(arlat) using (la), (27a)reduces to
I - I dx, (28a)making further substitutions from (la). For =O, (28a) is clearly positive.Although (28a) is ambiguous in sign for x =x, the facts that the boundary valueof p is invariant with t (see footnote 12) while Ox/Dt<O together imply thatdf/dt <0 (recall ap/ax <0). Thus (28a) must be negative for =x. The fact that itsderivative with respect to is negative then means that (28a) changes sign justonce between =O0 and x =x, implying that dp/dt is positive inside some x* andnegative beyond x*.
References
Alonso, W. (1964) Location and land use. Cambridge: Harvard University Press.Brueckner, J.K. (1982) 'A note on sufficient conditions for negative exponential population densities',
Journal of Regional Science, 22:353-359.Brueckner, J.K. (1983) 'The economics of urban yard space: An "implicit-market" model for housing
attributes', Journal of Urban Economics, 13:216-234.Brueckner, J.K. and D. Fansler (1983) 'The economics of urban sprawl: Theory and evidence on the
spatial sizes of cities', Review of Economics and Statistics, 55:479-482.Bdttler, H. (1981) 'Equilibrium of a residential city, attributes of housing, and land-use zoning', Urban
Studies, 18:23-39.Dixit, A. (1973) 'The optimum factory town', Bell Journal of Economics, 4:637-651.Fujita, M. and H. Ogawa (1982), 'Multiple equilibria and structural transition of non-monocentric
urban configurations', Regional Science and Urban Economics, 18:161-196.Hartwick, J., U. Schweizer and P. Varaiya (1976) 'Comparative static analysis of a residential
economy with several classes', Journal of Economic Theory, 13:396-413.
844

Ch. 20: The Structure of Urban Equilibria 845
Hoch, 1. (1972) 'Income and city size', Urban Studies, 9:299-328.Mills, E.S. (1967) 'An aggregative model of resource allocation in a metropolitan area', American
Economic Reriew, 57:197-210.Mills, E.S. (1972a), Studies in the structure of the urban economy. Baltimore: Johns Hopkins University
Press.Mills, E.S. (1972b), Urban economics. Glenview, Illinois: Scott Foresman.Muth, R.F. (1969) Cities and housing. Chicago: University of Chicago Press.Pines D. and E. Sadka (1986) 'Comparative statics analysis of a fully closed city', Journal of Urban
Economics, 20:1- 20.Schuler, R.E. (1974) 'The interaction between local government and urban residential location',
American Economic Review, 64:682-696.Wheaton, W.C. (1974) 'A comparative static analysis of urban spatial structure', Journal of Economic
Theory, 9:223-237.Wheaton, W.C. (1976) 'On the optimal distribution of income among cities', Journal of Urban
Economics, 3:31-44.White, M.J. (1976)'Firm suburbanization and urban subcenters', Journal of Urban Economics, 3:323-343.Yang, C. and M. Fujita (1983) 'Urban spatial structure with open space', Environment and Planning A.,
15:67-84.