Embed Size (px)
Citation preview

THE STRUCTURAL INTEGRITY OF NANOCLAY FILLED EPOXY
POLYMER UNDER CYCLIC LOADING
Submitted in fulfillment of the requirements of the degree of
Master of Engineering: Mechanical Engineering
In the Faculty of Engineering and the Built Environment at the
Durban University of Technology
Sathievelli Chetty
Approved for final submission:
Supervisor: ________________________ Date: _______________
Prof K Kanny
Co-supervisor: ______________________ Date: _______________
Dr T P Mohan
April 2017

ii
ABSTRACT
Fatigue crack initiation and propagation behaviour of CFRP have been of great
importance because such composites are often used in engineering components
that are subjected to continuous cyclic loading. The objective of this thesis work
was to investigate the damage characteristics of the fatigue properties of CFRP
composites by the modification of the polymer matrix with nanoclay addition.
Carbon fibre reinforced epoxy was produced via vacuum assisted resin infusion
moulding method (VARIM) with nanoclay concentrations of 0wt%, 1wt%, 3wt%
and 5wt%. Tension-tension fatigue tests were conducted at loading levels of 90%,
75% and 60%. The frequency that was used was 3Hz with R value of 0.1. The
results showed that at nanoclay percentages of 0wt%, 1wt% and 3wt% there was
a consistent trend, where the number of cycles increased in fatigue loading
percentages of 90%, 75% and 60%. At 5wt% nanoclay percentage the number of
fatigue cycles dropped significantly at the 90% fatigue loading. The brittle nature
of the 5wt% laminate became dominate and the sample fractured early at low
fatigue cycle numbers. At the 75% fatigue loading, the number of cycles increased
and at 60% fatigue loading the 5wt% nanoclay sample exceeded the number of
cycles of all the nanoclay percentages by 194%. This was due to the intercalated
arrangement of the nanoclays favouring the slow rate of surface temperature
increase, during fatigue testing, at low fatigue cycle loading. The Crack Density
analysis was performed and showed that at the same time in the fatigue cycle life,
the 1wt% had 55 cracks, 3wt% had 52 cracks and the 5wt% had 50 cracks, for
the 60% fatigue loading. This proved that it took longer for the cracks to initiate
and propagate through the sample as the nanoclay percentage increased. Impact
and hardness testing showed that the 5wt% exhibited brittle behaviour, which
contributed to the results above. Scanning electron microscopy examination
highlighted that the agglomeration of nanoclays delayed the crack initiation and
propagation through the specimen and that the extent of fatigue damage

iii
decreased as the nanoclay percentage increased. A fatigue failure matrix was
developed and showed that delamination, fibre breakage and matrix failure were
the predominate causes for the fatigue failure.

iv
DECLARATION
I hereby declare that the work described in this thesis is my original work and has
not previously been submitted in its entirety or in part for a degree in any other
university. I further declare that this work does not infringe or violate the right of
others, as all the sources cited or quoted are indicated and acknowledged by
means of a comprehensive list of references.
Sathievelli Chetty

v
ACKNOWLEDGEMENTS
I would like to express my sincere appreciation and gratitude to the following
individuals and institutions that formed an integral part of the successful
completion of this research.
Prof Krishnan Kanny for the supervisory role that he played throughout the course
of the research period. He has provided some guidance, assistance and
motivation throughout the duration of this study. His critical appraisals and
suggestions have been welcomed at every phase of the study.
Dr Mohan Turup Pandurangan for co-supervising this work and for providing
excellent guidance at every step of the way. His knowledgeable hands-on
feedback was insightful and accelerated the process. His persistence and
perseverance ensured that a steady progress was maintained that lead to the
successful submission of this thesis. He was a source of encouragement and
motivation when spirits were low, for that I am very grateful.
My mother, Mrs. P Chetty, my family and my little angel and savior, my son, Lolan
who kept me sane through this whole process, who gave me the strength to forge
ahead every day. His enthusiasm for life and excitement for my research work
kept me headstrong, motivated me and never allowed me to give up. I thank them
all for the support and warm encouragement they offered throughout the years.
Thank you for believing in me. You are simply the best. I love you all.
Mr. Avinash Ramsuroop for his assistance with writing, testing, advice and overall
running of the department. Assisting with procedures in place, procuring items
and sometimes going the extra mile by collecting items required personally
himself. Keeping me on the right track, keeping me positive and motivating me to
be the best that I can be. For showing me that hard work and dedication pays off
and is rewarded.
Dr Vimla Paul for guidance and assistance in writing and motivation to never give
up and hard work will be rewarded. For the long talks and apt advice and

vi
friendship offered and for always believing in me. Your critical suggestions and
constructive criticism further invigorated my drive towards reaching the optimum
of this study.
I would like to thank Vishnu Kribagaran Moodley (Chemical Engineering
Department) for assistance with consumables, advise and general assistance,
Ravi Veerasamy (Manufacturing Workshop) for use of the equipment at the
workshop, i.e., the Drill, sander, polisher, band saw, handsaw and general
consumables and the Technology Station for use of the oven, band saw, sander,
angle grinder, Barcol meter and the CNC machine. All this assistance minimized
delays and ensured that the samples created were free of defect and at the
highest level of accuracy.
Kentron (Denel Dynamics) and the National Research Foundation (NRF) for
providing the funding for the research project. This scholarship assisted in making
a dream come true to pursue and attain this qualification.
My fellow diverse team members, for the constant guidance and motivation and
help with keeping me grounded. For assistance with no hesitation and for always
having encouraging words. I say a BIG thank you to you all.

vii
TABLE OF CONTENTS
ABSTRACT ..........................................................................................................ii
DECLARATION ..................................................................................................iv
ACKNOWLEDGEMENTS ................................................................................... v
TABLE OF CONTENTS ..................................................................................... vii
LIST OF FIGURES ............................................................................................. x
LIST OF TABLES .............................................................................................. xiv
EQUATIONS ......................................................................................................xv
SYMBOLS AND ABBREVIATIONS .................................................................. xvi
CHAPTER 1 ........................................................................................................ 1
1.1 BACKGROUND ..................................................................................... 1
1.2 THE COMPOSITE SYSTEM ................................................................. 3
1.2.1 Properties of Composites ................................................................ 6
1.2.2 Poisson Ratio .................................................................................. 8
1.3 COMPONENTS OF THE COMPOSITE ............................................... 10
1.3.1 Types of resin matrices ................................................................. 10
1.3.2 Reinforcement ............................................................................... 13
1.3.3 Nanoclays ..................................................................................... 23
1.4 HYBRID COMPOSITES ...................................................................... 25
1.4.1 Processing of hybrid composites ................................................... 26
1.4.3 Advantages and disadvantages of hybrid composites................... 30
1.4.4 Application of hybrid composites ................................................... 32
1.5 COMPOSITE HYBRID USED IN PRESENT STUDY .......................... 35
1.5.1 Aim of the Study: ........................................................................... 35
1.5.2 Objectives of the Study: ................................................................ 36
1.5.3 Problem statement ........................................................................ 36
CHAPTER 2 ...................................................................................................... 38
2.1 BACKGROUND INTO FAILURE DUE TO FATIGUE .......................... 39
viii
2.2 FAILURE OF POLYMER STRUCTURES ............................................ 39
2.2.1 The Effect of Nanoclay on Polymer structure ................................ 40
2.2.2 Types of Nanoclay ......................................................................... 40
2.2.3 Techniques for Characterizing Nanocomposites ........................... 41
2.2.4 Testing of Polymer Structures ....................................................... 42
2.3 FAILURE OF COMPOSITE STRUCTURES ........................................ 43
2.3.1 Fibre Orientation............................................................................ 43
2.3.2 Fibre Volume Fraction ................................................................... 44
2.4 FAILURE OF HYBRID STRUCTURES ................................................ 44
2.4.1 Fatigue Failure Theory .................................................................. 45
2.4.2 Damage Characteristics ................................................................ 48
2.4.3 Fatigue Parameters. ...................................................................... 49
2.5 MOTIVATION AND SCOPE OF RESEARCH WORK.......................... 50
CHAPTER 3 ...................................................................................................... 52
3.1 DESIGN OF RESEARCH .................................................................... 52
3.1.1 Flow Diagram of Research Design ................................................ 53
3.2 RESEARCH METHODOLOGY ............................................................ 54
3.2.1 Processing .................................................................................... 55
3.2.2 Morphology ................................................................................... 60
3.2.3 Mechanical Testing ....................................................................... 63
3.2.4 Dynamic Testing............................................................................ 68
3.2.5 Failure Mechanism Analysis .......................................................... 70
3.3 SUMMARY OF CHAPTER ...................................................................... 72
CHAPTER 4 ...................................................................................................... 73
4.1 BACKGROUND ................................................................................... 73
4.2 MORPHOLOGICAL ANALYSIS ........................................................... 74
4.2.1 X-Ray Diffraction ........................................................................... 74
4.2.2 Transmission Electron Microscopy ................................................ 75
4.2.3 Fibre Volume Fraction ................................................................... 78
4.3 QUASI-STATIC TESTING ................................................................... 79
4.3.1 Tensile ........................................................................................... 79

ix
4.3.2 Barcol Hardness ............................................................................ 84
4.3.3 Charpy Impact ............................................................................... 85
4.4 DYNAMIC TESTING: FATIGUE .......................................................... 88
4.4.1 Tension-Tension Fatigue Testing .................................................. 88
4.4.2 The effect of Frequency and Temperature .................................... 92
4.4.3 Fatigue Crack Growth ................................................................... 96
4.4.4 Fatigue Crack Density Growth ...................................................... 97
4.4.5 Crack Initiation and Propagation ................................................... 99
4.4.6 Fatigue Failure Mechanism ......................................................... 104
4.4.7 Statistical Analysis ....................................................................... 105
CHAPTER 5 .................................................................................................... 109
REFERENCES ............................................................................................... 111
LIST OF PAPERS PUBLISHED ON THE BASIS OF THIS THESIS ............... 120

x
LIST OF FIGURES
Figure 1.1: Classification of Composites .......................................................... 4
Figure 1.2: Showing increasing Composite usage from 1970 [10] ................... 5
Figure 1.3: Representation of matrix and fibre stressed in one direction ......... 7
Figure 1.4: Representation of matrix and fibre stressed in two directions ........ 8
Figure 1.5: Illustration depicting Poisson’s Ratio [16] ....................................... 9
Figure 1.6: Showing the difference between thermoplastic and
thermoset resin [17] ..................................................................... 11
Figure 1.7: Showing the polyester and styrene reaction [20] ......................... 12
Figure 1.8: Showing fibre direction and strength ............................................ 14
Figure 1.9: Showing direction of woven fibres ............................................... 15
Figure 1.10: Showing the element of the on-axis composite and definition
of normal and shear stress components [23] ............................... 16
Figure 1.11: The different types of Woven Weaves available. [105] ................ 18
Figure 1.12: (a) A multidirectional laminate is built by a stack of
unidirectional composites bonded together. (b) Definition of
ply orientation angle θ. [23] .......................................................... 18
Figure 1.13: Glass, Carbon and Kevlar fibres [25] ........................................... 19
Figure 1.14: Carbon Fibre production process [27] .......................................... 21
Figure 1.15: Chemical structures of Cloisite 15A [33] ...................................... 23
Figure 1.16: Schematic of nm-thick montmorillonite clay aluminosilicate
layers [34] .................................................................................... 25
Figure 1.17: Schematic showing the process of creating a hybrid
Nanocomposite [35] ..................................................................... 26

xi
Figure 1.18: Different phases of the fatigue life ............................................... 29
Figure 1.19: Various types of cracks that occur during fatigue testing [39] ...... 30
Figure 1.20: Versatile Carbon fibre airframes mean that aircraft can be
very different in shape in the future [3] ......................................... 34
Figure 2.1: Showing the different types of nanoclay infused structures
[57] ............................................................................................... 41
Figure 2.2: Showing a) tension/compression and b) Tension/tension
cyclic loading and unloading [52] ................................................. 47
Figure 3.1: Flow Diagram highlighting the experimental design ..................... 53
Figure 3.2: Demonstrating the key aspects of a Scientific Method ................ 55
Figure 3.3: The VARIM Process [75] ............................................................. 56
Figure 3.4: Showing the actual Infusion setup used for the CFRP
preparation in the composite processing lab at DUT. .................. 60
Figure 3.5: TEM equipment utilized in this research ...................................... 61
Figure 3.6: Schematic of how XRD testing is performed [77] ......................... 62
Figure 3.7: Charpy test specimen, showing the “V” notch in the middle
of the sample. [82] ....................................................................... 65
Figure 3.8: The Charpy test equipment .......................................................... 65
Figure 3.9: Showing the location of the temperature check points along
the sample during the fatigue testing ........................................... 71
Figure 4.1: XRD spectra for Cloisite 15A, 1% - 5% Nanoclays ...................... 74
Figure 4.2a: TEM Image of 1wt% Nanoclay infused composite specimen ....... 76
Figure 4.2b: TEM Image of 3wt% Nanoclay infused composite specimen ....... 77
Figure 4.2c: TEM Image of 5wt% Nanoclay infused composite specimen ....... 77
Figure 4.3: Stress vs Strain graph for CFRP at 0wt%, 1wt%, 3wt%, and
5wt% nanoclay concentration ...................................................... 80

xii
Figure 4.4: a) Tensile fractured sample of virgin nanoclay specimen ............ 81
Figure 4.4: b) Tensile fractured sample of 5wt% nanoclay specimen ............ 81
Figure 4.5: Ultimate Tensile Strength graph for CFRP at 0wt%, 1wt%,
3wt%, and 5wt% nanoclay concentration..................................... 82
Figure 4.6: Extension graph for CFRP at 0wt%, 1wt%, 3wt%, and 5wt%
nanoclay concentration ................................................................ 83
Figure 4.7: Barcol Hardness testing values CFRP for 0wt%, 1wt%,
3wt%, and 5wt% nanoclay concentration..................................... 84
Figure 4.8: Impact testing of CFRP for 0wt%, 1wt%, 3wt%, and 5wt%
nanoclay concentration ................................................................ 86
Figure 4.9: Image of the 5wt% impact sample a) before testing and b)
after testing .................................................................................. 87
Figure 4.10: Showing the 0wt% and 1wt%, uneven jagged fracture edge,
after testing .................................................................................. 87
Figure 4.11: S-N graph for 90%, 75% and 60% fatigue loading for 0wt%,
1wt%, 3wt% and 5wt%................................................................. 89
Figure 4.12: Fatigue Cycle Failure at 90%, 75% and 60% loading at a
constant frequency of 3Hz for 0, 1, 3 and 5 wt% nanoclay
specimens .................................................................................... 91
Figure 4.13: Normalized S-N graph for 90%, 75% and 60% fatigue
loading ......................................................................................... 92
Figure 4.14: Showing temperature increase during fatigue testing .................. 95
Figure 4.15: Fatigue Crack Density Growth for 0wt%, 1wt%, 3wt% and
5wt% at 60% fatigue loading ........................................................ 98
Figure 4.16: Crack Initiation and propagation of 1wt% specimen at 60%
fatigue loading ............................................................................. 99

xiii
Figure 4.17: Crack Initiation and propagation of 5wt% specimen at 60%
fatigue loading ........................................................................... 100
Figure 4.18: a) 1wt% and b) 5wt% sample showing crack propagation
through the matrix ...................................................................... 101
Figure 4.19: 5wt% sample showing a crack being arrested and a new
crack being created ................................................................... 102
Figure 4.20: EDX of the 5wt% sample showing the composition of
elements at the site where the crack was arrested. ................... 103
Figure 4.21: 5wt% sample showing the crack being re-routed. ...................... 104
Figure 4.22: Failure analysis envelope based on fatigue fracture results ...... 105
Figure 4.23: ANOVA Analysis results for each Fatigue loading and
Nanoclay Percentage................................................................. 107

xiv
LIST OF TABLES
Table 3:1: Typical Fibre Volume Fractions [83] .................................................. 66
Table 3:2: Duration for each of the Fatigue loading percentages for
each Nanoclay Percentage ................................................................. 69
Table 4:1: Data for determining the fibre volume fraction of CFRP ................. 78
Table 4:2: Summary of Tensile testing results for each nanoclay
concentration ......................................................................................... 83
Table 4.3: Barcol Hardness and Impact Results ................................................ 88
Table 4.4: Fatigue Results showing the number of cycles for 90%, 75%
and 60% fatigue loading ...................................................................... 89
Table 4:5: Temperature increase of the test sample during Fatigue
Testing – Temperature 1 ..................................................................... 93
Table 4.6: Temperature increase of the test sample during Fatigue
Testing – Temperature 2 ..................................................................... 94
Table 4.7: Temperature increase of the test sample during Fatigue
Testing – Temperature 3 ..................................................................... 94
Table 4.8: Degradation rates of fatigue samples ................................................ 97
Table 4:9: Summary of ANOVA analysis for fatigue results ........................... 106
Table 4.10: ANOVA Analysis between the each fatigue loading and
nanoclay percentage: ......................................................................... 106
Table 4.11: Multiple Comparisons for each of the fatigue loading ................... 108

xv
EQUATIONS
Equation 1.1: ROM equation for the apparent Young’s modulus in the
fibre direction [12] .............................................................. 6
Equation 1.2: Inverse rule of mixtures equation ........................................ 7
Equation 1.3: Poisson's ratio ..................................................................... 9
Equation 1.4: State of plane stress ......................................................... 15
Equation 1.5: Out of plane shear strains ................................................. 16
Equation 1.6: Stress-strain relation for plane stress ................................ 16
Equation 2.1: Total Life Calculation ........................................................ 48
Equation 3.1: Bragg’s equation ............................................................... 63
Equation 3.2: Fibre volume fraction ........................................................ 67
Equation 3.3: Void content ...................................................................... 67
Equation 4.1: Fatigue Slope Calculation ................................................. 96

xvi
SYMBOLS AND ABBREVIATIONS
VHCF Very high cycle fatigue Mag magnification
S-N Stress vs number of fatigue
cycles
CFRP Carbon Fibre Reinforced
Plastic
UTS Ultimate Tensile Strength CCD Charge-coupled device
AMT Advanced Materials
Technology
ASTM American society for
testing and materials
CTE Coefficient of thermal
expansion
CMOS Complementary metal
oxide semi-conductor
HDT Heat deflection temperature nm Nanometer
DUT Durban University of
Technology
GFRP Glass Fibre Reinforced
Polymer
CNC Computer numerical control MMT Montmorillonite
HNO3 Nitric Acid MTS Mechanical testing system
wt% Weight percentage OM Optical Microscope
Å Angstrom SEM Scanning electron
microscope
kPa Kilo Pascal GPa Giga Pascal
MPa Mega Pascal USA United States of America
TEM Transmission Electron
Microscopy
VARIM Vacuum assisted resin
infusion method
CF Carbon Fibre NC Nanoclay

xvii
mm Millimeter XRD X-ray diffraction
FRP Fibre Reinforced Plastic PCM Polymer matrix Composite
MMC Metal matrix Composite CMC Ceramic matrix Composite
ROM Rule of mixture E1 Elastic Modulus
ε Strain ɵ Stress
V𝐹 Fibre Volume Fraction V𝑀 Matrix Volume Fraction
A Cross Sectional Area SCFM Self-consistent field
method
H-T Halpin–Tsai 𝜇 Poisson’s ratio
Tg Glass transition Temperature τ Shear Stress
γ Engineering Shear Stress kg Kilogram
Nf Number of Cycles at the
point of fracture
Np Number of cycle for the
crack growth to occur
σUTS Ultimate Tensile Stress at
the fatigue loading
percentage
Ni Number of cycle for the
crack to initiate
σmax Maximum Stress PSB Persistent Slip Band
Hz Hertz °C Degrees Celsius
b Slope of the fatigue graph EDX Dispersion X-ray
NIOSH National Institute for
Occupational Safety and
Health
HEPA High-Efficiency Particulate
Air

1
CHAPTER 1
1.1 BACKGROUND
The primary structural material of World War One aircrafts were wood however,
the anisotropic nature and strength characteristics of wood varied, depending on
the source of supply [1]. Metal was a potential alternative [1]. Metals are strong,
hard and durable and were therefore sought after materials in the manufacture of
military and space products. Military vehicles, such as airplanes, helicopters, and
rockets placed a premium on high-strength, light-weight materials [2] but it was
realized that it would not be a simple matter of substituting metal for wood.
Attempts to use metals such as aluminum and steel did not immediately satisfy
the desired goal of weight reduction. The higher the weight of the aircraft itself,
the less cargo its engines could carry. This led to the exploration into new polymer
products, which could be lighter while affording the same strength and durability
as metal and metal alloys [2]. In the aero vehicle industry, weight is money. The
heavier an aircraft is, the more fuel it requires to fly. The more fuel it consumes,
the more the running costs will be. In order to decrease fuel consumption and
improve the aerodynamic performance of the aircrafts, engineers moved away
from using aluminum. Instead today's latest aircrafts like the Boeing's 787
Dreamliner and Airbus's A350 [3], rely on lightweight carbon fibre composites i.e.
woven mats of carbon which are embedded into a polymer.
A polymer [4] is a substance which consists of a large number of chains that come
together to form a complex structure and is typically used in the manufacture of
plastics and resins. Polymers were used as lightweight materials for the
replacement of metal and metal alloys, provided that these polymeric materials
possessed improved mechanical properties [2]. Hence fibre like materials which
had high strength were incorporated into polymers to achieve comparable
properties with metal and metal alloys. This discovery in turn lead to the discovery
of materials like fibres which have an extremely high strength.

2
Engineers soon realized that by incorporating fibres in a matrix of a lightweight,
lower-strength polymer, they could obtain a stronger material called a composite
[5]. The fibres delayed the propagation of the cracks in the matrix. According to
Reade [6], this implied that a polymer with insufficient strength or stiffness
intended for use as an airplane wing could be reinforced with fibres to produce a
stronger, stiffer and light-weight product. While these materials used in the form
of long fibres were strong they were also brittle and hence when they failed, they
did so catastrophically [2].
Defects, such as micro cracks in the material, could severely undermine the high
strengths, since the defect sizes are different for each manufactured piece. Also
since the number of defects generally scale with the size of the component, the
only solution was to use short fibres [2], for the increased strength, the defects
were generally minimized in the system.
Major world events prompted the use of new stronger reinforcement fibres.
Consequently, graphite (carbon) fibres were produced using rayon as the starting
raw material [6]. While carbon and boron fibres were developed around the same
time, carbon took the lead due to its superior processing capabilities and its lower
cost [5]. Carbon fibres were of use only in polymer matrices at this time. According
to Koo [7], carbon fibre and a polymer matrix gave far superior mechanical
strength properties when compared to that of glass fibre. Currently, the 787
Dreamliner which is Boeing’s latest plane, used composites for more than half of
its airframe and that is including the fuselage and the wing. The Airbus’s A350
XWB [3] had both its wings and fuselage made from carbon fibre. Carbon fibre
reinforced polymer composites used for the creation of sweeping wing tips
reduced fuel consumption by up to 5% and this was achieved while keeping the
aircraft still conventionally shaped.
Both academic and industrial researchers extended the composite paradigm to
smaller scales, due to the need for minute and more efficient options and hence
the era of the nanocomposites was born. Nanocomposites entail infusing
nanoparticles, such as nanoclays, into the polymer/fibre matrix system.

3
Nanoclays are nanoparticles of layered silicates. Koo [7], further stated that a
carbon fibre and polymer matrix infused with nanoclays results in enhanced
improvement in temperature performance, mechanical properties, damage
resistance and environment corrosion resistance of materials. A composite with
carbon fibre added to polymer infused nanoclay is called a polymer hybrid
composite.
1.2 THE COMPOSITE SYSTEM
A composite is any material made of more than one component. There are many
examples in everyday life, for example concrete is a composite. It is made of
cement, gravel and sand and sometimes steel rods to reinforce it. Each
component is added in a particular quantity, at specific time for specific period to
serve a specific purpose. The composite structure can be created when a polymer
resin and hardener mixture is passed through the fibres using methods such as
vacuum bagging and hand lay-up processes. In some instances composite
materials may require heat and pressure during processing [8]. This compound
is generally referred to as Fibre Reinforced Plastic (FRP).
The classification of a composite is as per the diagram shown in Figure 1.1. There
are 3 matrix composites, polymer matrix composites (PMC), metal matrix
composites (MMC) and ceramic matrix composite (CMC). The composites that
will be studied in this thesis will be polymer composites that are made from
polymer matrix, fibres and nanoclays. Fibres used in the production of
composites are fiberglass, carbon (graphite), Kevlar, boron, diolen and vectran.
The fibre most often utilized is glass fibre however sometimes; Kevlar and carbon
are used, depending on the application. Boron, diolen and vectran although have
their own unique properties, however they are less desirable as compared to
glass, Kevlar and carbon, due to cost, processing and temperature resistance.

4
Fibres are embedded into the matrix in order to make the composite stronger.
The fibres themselves are strong and light and are often stronger than steel and
weigh much less [5]. This means that composites can be used to make aircrafts
and automobiles lighter and thus more fuel efficient and hence means that
pollution will be reduced [4].
Global polymer production began in the mid-20th century, when low material and
production costs, new production technologies and new product categories
combined to make polymer production economical. The industry finally matured
in the late 1970s as seen in Figure 1.2, when world polymer production surpassed
that of steel, making polymers the ubiquitous material that it is today. From the
1970s the usage of carbon fibre in the Airbus 300 started off at 4t/unit and
increased gradually to 9t/unit by 1995. And in 2015, the Airbus A350 consisted of
32t/unit of carbon fibre [9].
Figure 1.1: Classification of Composites

5
The growth of the use of composites in the Airbus’s from the 1990’s till present
has increased steadily, from the Rudder, Spoilers, and Airbrakes to the Wing box
and Fuselage. The Airbus is now made up of 50% composites and this
percentage will continue growing. Fibre reinforced plastics have been a significant
aspect of this industry from the beginning.
The trailing edges of the wings, that extends back and down takes the full load of
forces when the airplane is landing. This is the component that takes the full load
of the forces when travelling through the air at 250mph and it is light enough to
be lifted by a human being. This is one of the recent developments of the Airbus's
latest plane, the A350 [3]. As per Sirett [11], if a kilogram of weight is removed,
that is a major saving over the life span of an aircraft.
Figure 1.2: Showing increasing Composite usage from 1970 [10]
With this kind of technology, the parts on an airbus can be cut down considerably
from six million parts. With fewer parts, it means manufacturing time and costs
6
will be cut down considerably. Sirett goes further to state that with each kilogram
saving on an Airbus, this equates to roughly $1M in costs over the lifetime of the
aircraft and that with use of composites the weight of the aircraft can be reduced
by up to 20% [11].
1.2.1 Properties of Composites
Composites have this unique ability to offer strength and light weight to a product.
The properties that contribute to these qualities are described below. The rapid
growth in the use of composite materials in structures requires the development
of structure mechanics for modelling the mechanical behaviors and the analysis
of structural elements made of composite material.
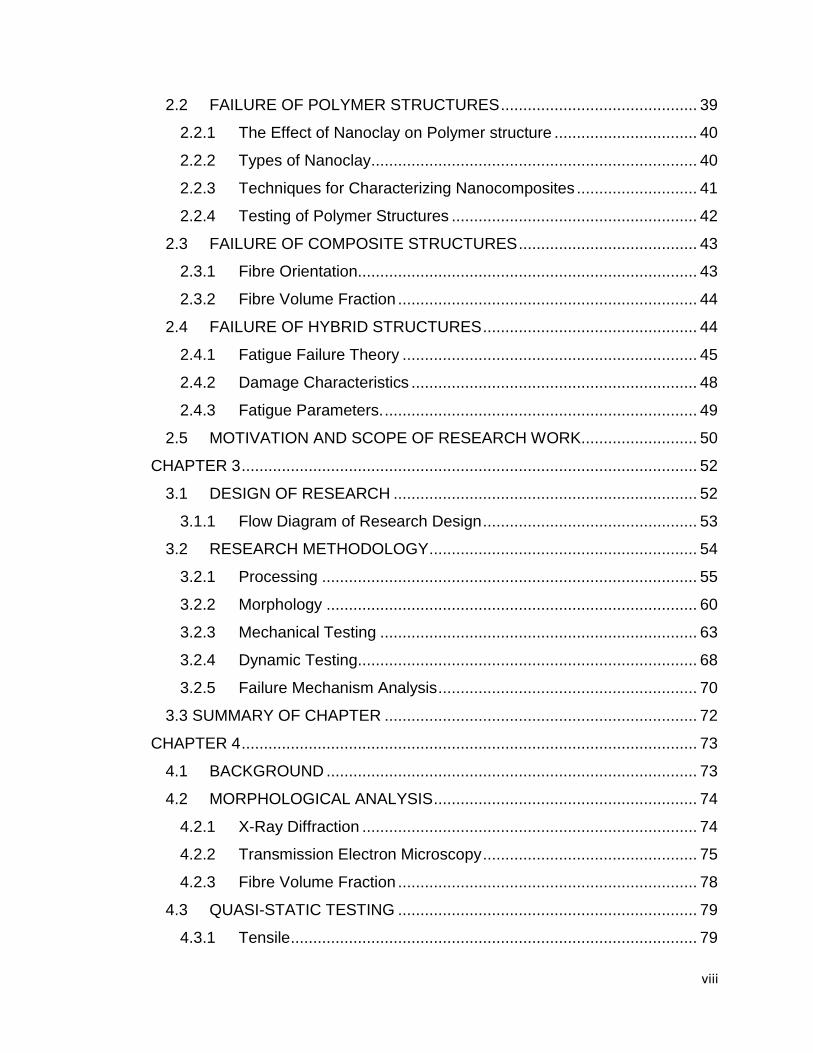
The properties of composites may be estimated by the application of the simple
rule of mixture (ROM) theory. These rules can be used to estimate the average
composite mechanical and physical properties along different directions. They are
therefore extremely useful in the assessment of the combinations of basic
mechanical/physical properties that can be engineered via composite
reinforcement [12]. In order to calculate the elastic modulus of the composite
material in the one-direction (E1), Voigt postulated that both the matrix and fibre
experience the same strain (ε1) as shown in Figure 1.3. This strain is a result of a
uniform stress (σ1) being applied over a uniform cross-sectional area, A [13].
Equation 1.1: ROM equation for the apparent Young’s modulus in the fibre
direction [13]
E1 = E𝐹V𝐹 + E𝑀V𝑀 (1.1)
Where EF, EM, VF and VM are the moduli and volume fractions of the fibre and
matrix materials respectively. This model works extremely well for aligned
continuous fibre composites where the assumption of equal strain in the two
components is correct.

7
The elastic modulus, E of the composite in the two-direction (ε2) is determined by
assuming that the applied transverse stress (σ2) is equal in both the fibre and the
matrix as shown in Figure 1.4 (Reusss assumption) [13]. As a result, E2 is
determined by an inverse rule of mixtures equation that is given as [13].
Figure 1.3: Representation of matrix and fibre stressed in one direction
Equation 1.2: Inverse rule of mixtures equation
𝐸2 = 𝐸𝐹𝐸𝑀
𝑉𝑀𝐸𝐹 + 𝑉𝐹𝐸𝑀 (1.2)
For all composites with well-bonded reinforcements, Young’s modulus in the
principle fibre direction will be somewhere in between the extreme values
predicted by the ROM equations.
The mathematical model, Halpin–Tsai, (H-T) is used for the prediction of elasticity
of composite materials based on the geometry and orientation of the filler and the
elastic properties of the filler and matrix [14]. The model is often considered to be
empirical, although it is based on the self-consistent field method (SCFM), which
is also called the Hartree-Fock Method. These relations, which are called semi-

8
empirical relations because the parameters involved in these relations have some
physical significance, were developed by curve fitting to the results that’s are
based on elasticity [15].
Figure 1.4: Representation of matrix and fibre stressed in two directions
The assumption for the creation of the ROM and the H-T equations are the basics,
i.e. both the matrix and fibres are linearly elastic, isotropic and homogeneous,
fibres are perfectly aligned and spaced, matrix is void free and the bonding
between the matrix and the fibres is perfect [15].
1.2.2 Poisson Ratio
When a composite material is stretched, longitudinally, it usually tends to contract
in the direction transverse to the direction of stretching, which is lateral as
depicted in figure 1.5. Poisson's ratio, μ is a measure of this effect that is it is the
negative ratio of the lateral strain and the longitudinal strain.

9
Figure 1.5: Illustration depicting Poisson’s Ratio [16]
Equation 1.3: Poisson's ratio
Ѵ = − 𝐿𝑎𝑡𝑒𝑟𝑎𝑙 𝑆𝑡𝑟𝑎𝑖𝑛
𝐿𝑜𝑛𝑔𝑖𝑡𝑢𝑑𝑖𝑛𝑎𝑙 𝑆𝑡𝑟𝑎𝑖𝑛 (1.3)
The Poisson’s ratio of the carbon fibre is 0.30. This means that the material has
a greater ability to stretch in one direction than it is able to contract in the other
direction. The bonds between the atoms in the structure become realigned during
the process of stretching and compressing. In most cases, a material’s Poisson
ratio will range between 0 and 0.5. Among common materials, rubber has a
Poisson ratio very close to 0.5, whereas steel has one of 0.3 and cork is much
closer to 0 [16]. This is why wine corks are made of cork: it can withstand the
pressure from the neck of the bottle without stretching vertically and jamming in
place. Hence it can be seen that the composite can stretch and allow contraction
sufficient to adapt to any situation.

10
1.3 COMPONENTS OF THE COMPOSITE
As already discussed previously the main components of the composite are the
matrix and the fibre reinforcement. These are broad terms and the different
categories will be discussed further.
1.3.1 Types of resin matrices
The resins that are used in fibre reinforced composites can also be referred to as
polymers. All polymers exhibit an important common property, that is they are
composed of long chain-like molecules consisting of many simple repeating units.
Man-made polymers are generally called 'synthetic resins' or simply 'resins'.
Polymers can be classified under two types, 'thermoplastic' and 'thermosetting',
according to the effect of heat on their properties. Figure 1.6, shows the difference
between thermoplastic and thermoset resins. The black dots represent the
permanent bonds that are formed, that heat cannot destroy.
Thermoplastics will soften with heating and eventually melt and harden again
upon cooling. This repetition of the process of crossing the softening or melting
point can be repeated as often as desired, without any appreciable effect on the
material properties in either state. Typical thermoplastics include nylon,
polypropylene and ABS, and these can be reinforced, although usually only with
short, chopped fibres such as glass.
Thermosetting materials, or 'thermosets', are formed from a chemical reaction in
situ, where the resin and hardener or resin and catalyst are mixed and then they
undergo a non-reversible chemical reaction to form a hard, infusible product.
Once cured, thermosets will not become liquid again if heated, although above a
certain temperature their mechanical properties will change significantly. This
temperature is known as the glass transition temperature (Tg), and varies widely
according to the particular resin system used, its degree of cure and whether it

11
was mixed correctly. Above the Tg, the molecular structure of the thermoset
changes from that of a rigid crystalline polymer to a more flexible, amorphous
polymer. This change is reversible on cooling back below the Tg. [18]. For this
study, a thermoset, polyester resin will be utilised, as it is not desired, for example
for the wing of an aircraft to become flexible when the polymer resin becomes
liquid.
Figure 1.6: Showing the difference between thermoplastic and thermoset
resin [17]
Thermoset materials can be brittle due to high crosslink density and have high
service temperature. Due to presence of strong covalent bonds as crosslinks,
thermoset cannot be recycled easily. Incorporation of fillers in form of particulates
and fibres help to reduce transfer and distribute stress applied, and can be used
in high end applications. [19].
There are three main types of resin matrices; namely; polymer matrix composite,
metal matrix composite and ceramic matrix composite.
12
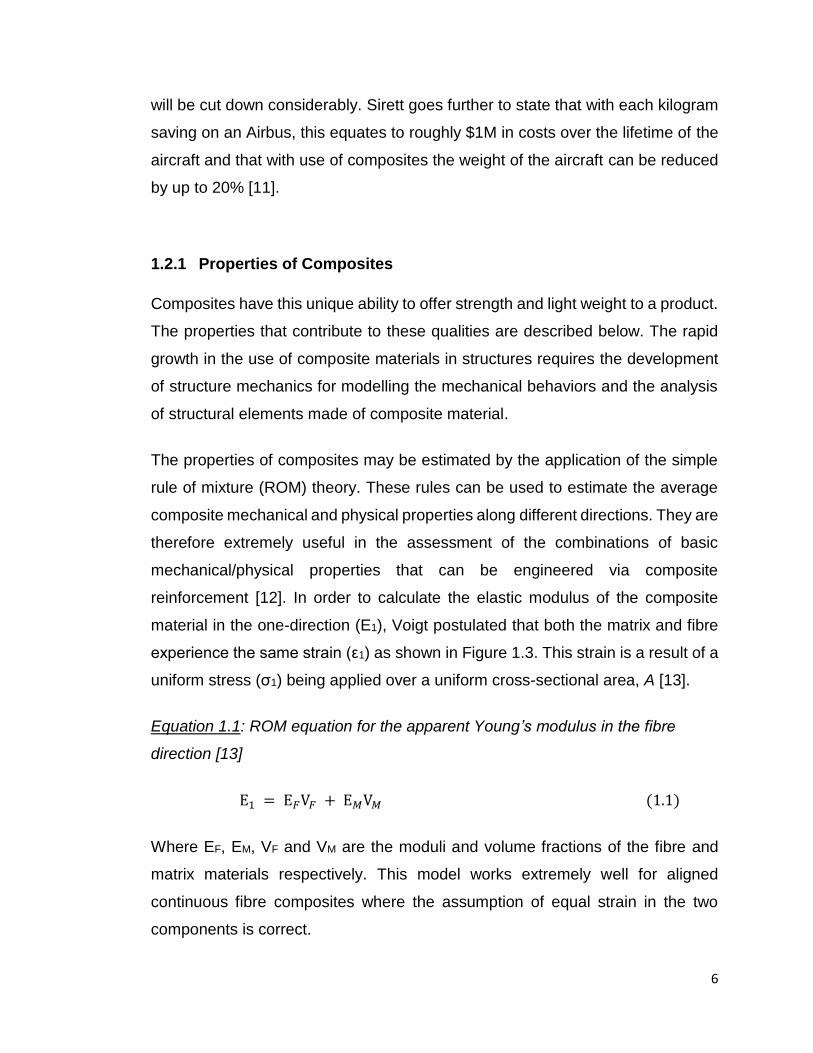
The matrix is a major component of any composite, hence a polymer matrix
composite is one in which resins and polymers are present in major quantity and
fillers are added to improve stiffness of the polymer. For example, reacting
polyester with carbon-carbon double bonds in its backbone and styrene. This
mixture is then mixed with the fibres and allowed to cure [20].
Figure 1.7: Showing the polyester and styrene reaction [20]
Figure 1.7 shows the reaction that occurs when polyester and styrene are mixed
to create a resin matrix. The styrene and the double bonds react by “free radical
vinyl polymerization” to form a cross-linked resin [20]. As the reaction continues
and more cross links are generated, a network of molecules is created. This is an
example of the thermosetting resin.
A metal matrix composite (MMC) is a composite material with at least two
constituent parts, one being a metal and the other material may be a different
metal or another material, such as a ceramic or organic compound. MMCs are
made by dispersing a reinforcing material into a metal matrix. The reinforcement
surface can be coated to prevent a chemical reaction with the matrix. For
example, carbon fibre is commonly used in aluminum matrix to synthesize
composites showing low density and high strength [21]. However, carbon reacts
13
with aluminum to form a brittle and water-soluble compound Al4C3 on the surface
of the fibre. To prevent this reaction, the carbon fibres are coated with nickel or
titanium boride. The carbon fibres here are not coated with any inhibitors.
Ceramic-matrix composites (CMCs) comprise of a ceramic matrix reinforced by a
refractory fibre, such as silicon carbide (SiC) fibre. CMCs offer low density, high
hardness and superior thermal and chemical resistance. These qualities coupled
with their intrinsic ability to be tailored as composites, make CMCs highly
attractive in an array of applications, most notably internal engine components,
exhaust systems and other “hot-zone” structures, where CMCs are envisioned as
lightweight replacements for metallic superalloys [22]. CMCs have been largely
limited to missile structures, radomes and exhaust systems for fighter jets.
The three classifications described above offer a brief description of the available
composite systems that are suitable for use in the military and space environment.
Polymer matrix composites based on thermoset polymers i.e. polyester (epoxy)
is chosen to work with, with an aim to improve stiffness of resin by incorporating
nanoclays. This study will investigate the improvement of this brittle quality of the
carbon fibre reinforced plastic through the use of nanoclays.
1.3.2 Reinforcement
Reinforcement provides strength and stiffness while polymer matrix protects and
transfers loads between fibres. Long thin fibres possess high strength and
stiffness. Particulate filler is a solid material which is capable of changing the
physical and chemical properties of materials by surface interaction or by its own
physical characterization. The combination of long thin fibres and particulate fillers
will give rise to a hybrid structure with network links between long thin fibres-
particulate fillers-polymer which shall impart high impact strength as well as high
stiffness to a composite material.
14
Polymer resin has been used for the manufacture of products; however, its
strength was very low. When fibres were added to the resin they became
reinforced and as such the composite became mechanically stronger [2]. The
fibres are processed along with resins, which develops a synergistic effect and
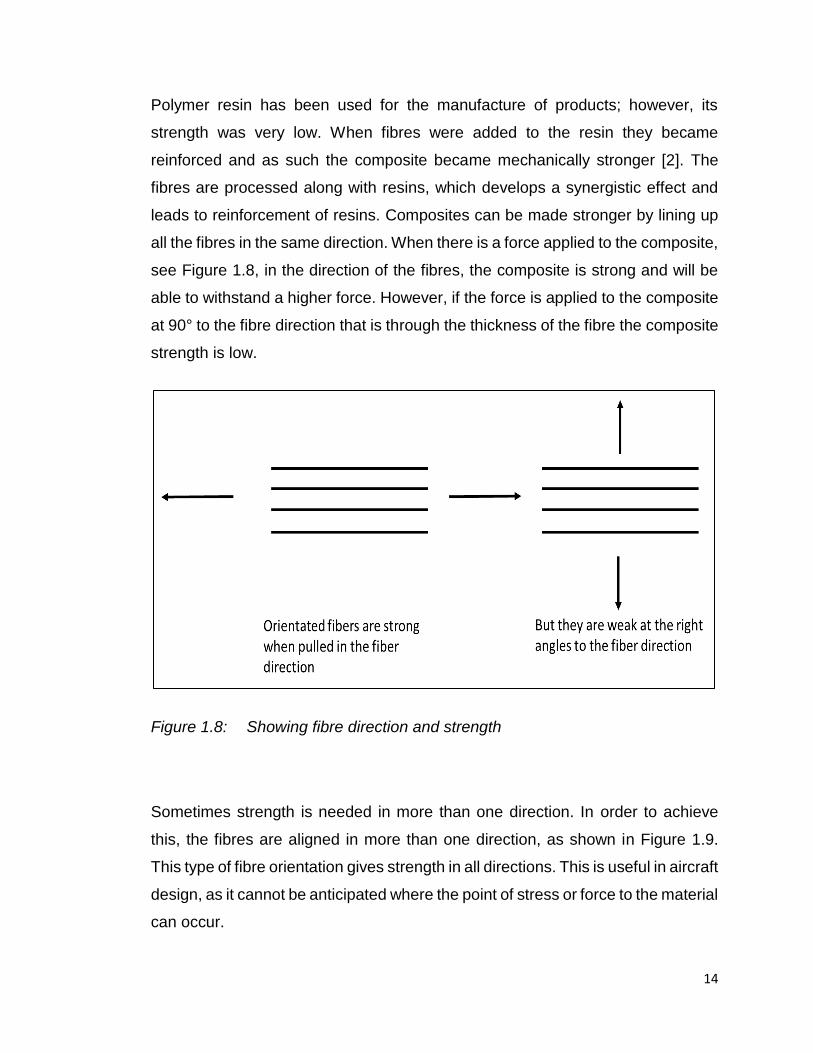
leads to reinforcement of resins. Composites can be made stronger by lining up
all the fibres in the same direction. When there is a force applied to the composite,
see Figure 1.8, in the direction of the fibres, the composite is strong and will be
able to withstand a higher force. However, if the force is applied to the composite
at 90° to the fibre direction that is through the thickness of the fibre the composite
strength is low.
Figure 1.8: Showing fibre direction and strength
Sometimes strength is needed in more than one direction. In order to achieve
this, the fibres are aligned in more than one direction, as shown in Figure 1.9.
This type of fibre orientation gives strength in all directions. This is useful in aircraft
design, as it cannot be anticipated where the point of stress or force to the material
can occur.

15
Figure 1.9: Showing direction of woven fibres
Furthermore when an on-axis composite configuration is studied, the following
can be seen, as shown in Figure 1.10, the principle axes, 1, 2 and 3 are aligned
with the co-ordinate system. This also shows the definition of stress components
associated with the material coordinate system, 1, 2, 3, where the stresses are
volume averages over the fibre and matrix domains. The normal stresses are σ1,
σ2, and σ3, while the shear stresses are τ12, τ13, and τ23. Corresponding normal
strains are ε1, ε2, and ε3, and the engineering shear strains are γ12, γ13, and γ23.
In thin, sheet-like structures such as a laminate, it is common to assume a state
of plane stress by setting:
Equation 1.4: State of plane stress
σ3 = τ13 = τ23 = 0. [1.4]

16
Figure 1.10: Showing the element of the on-axis composite and definition of
normal and shear stress components [23]
It may be shown that such a state of stress leads to vanishing of the out of plane
shear strains, i.e.
Equation 1.5: Out of plane shear strains
γ13 = γ23 = 0. [1.5]
The out-of-plane extensional strain, ε3, does not vanish but becomes coupled to
the in-plane stresses σ1 and σ2 and does not remain an independent quantity.
The stress-strain relation for plane stress becomes:
Equation 1.6: Stress-strain relation for plane stress
[𝜎1𝜎2𝜏12
] = [𝑄11 𝑄12 0𝑄12 𝑄22 0
0 0 𝑄66] [
𝜀1𝜀2
𝛾12] [1.6]

17
A common approach to achieve a set of more balanced mechanical properties is
to utilize woven fabric composites, where tows of several thousand fibres are
arranged in a specific pattern, such as plain weave fabrics consisting of “one fibre
bundle over-one under” as shown in Figure 1.11. Figure 1.11 shows the various
types of woven structures that are available, that is; plain weave, satin 5HS, 2x2
twill weave and non-crimp weave. Each type of weave has their own use for a
particular application, with their own set of advantages and disadvantages.
Direction of the individual fibre strands is referred to as the warp and weft (or fill),
where the warp is the vertical fibre strand and the weft is the horizontal fibre. In
this dissertation, the plain woven weave will be discussed.
Unidirectional composites, such as shown in Figure 1.11, are rarely utilized in
actual structures because of their extremely anisotropic properties and weak
failure planes. Most composite structures are multi-directional laminates, where
unidirectional plies are oriented in different directions θ, e.g., θ = 0°, 45°, −45°,
and 90° Figure 1.12. It is observed that each ply orientation θ is obtained by a
suitable rotation of the ply around the 3 axis.

18
Figure 1.11: The different types of Woven Weaves available. [105]
Figure 1.12: (a) A multidirectional laminate is built by a stack of unidirectional
composites bonded together. (b) Definition of ply orientation angle θ. [23]

19
1.3.2.1 Glass fibre
Glass wool, which is also referred to as "glassfibre", is a material that is used as
thermal building insulation. Glass fibre has roughly comparable mechanical
properties to other fibres such as polymers and carbon fibre [24]. Although not as
strong or as rigid as carbon fibre, it is much cheaper and significantly less brittle
when used in composites. Glass fibre is therefore used as a reinforcing agent for
many polymer products; to form a very strong and relatively lightweight fibre-
reinforced polymer (FRP) composite material called glass fibre reinforced plastic
(GFRP). Figure 1.13 shows the 3 different types of fibres; glass, carbon and
Kevlar.
1.3.2.2 Kevlar fibre
Kevlar is the registered trademark for a para-aramid synthetic fibre. This high-
strength material was first commercially used in the early 1970s as a replacement
for steel in racing tyres [26]. Typically it is spun into ropes or fabric sheets that
can be used as such or as an ingredient in composite material components.
Figure 1.13: Glass, Carbon and Kevlar fibres [25]
20
Considering its high tensile strength-to-weight ratio, currently, Kevlar has many
applications, ranging from bicycle tyres and racing sails to body armour because
of it being five times stronger than steel [4]. When used as a woven material, it is
suitable for mooring lines and other underwater applications [26].
1.3.2.3 Carbon fibre
Carbon fibre is also called graphite fibre or carbon graphite and consists of very
thin strands of the element carbon. These fibres have high tensile strength and
are very strong for their size and is known to be the strongest material available
[8]. Each fibre strand is 5-10 microns in diameter. To give a sense of how small
that is, one micron (um) is 0.000039 inches. One strand of spider web silk is
usually between 3-8 microns. Carbon fibres are twice as stiff as steel and five
times as strong as steel (per unit of weight) and is also highly chemically resistant
and has high temperature tolerance with low thermal expansion [8].
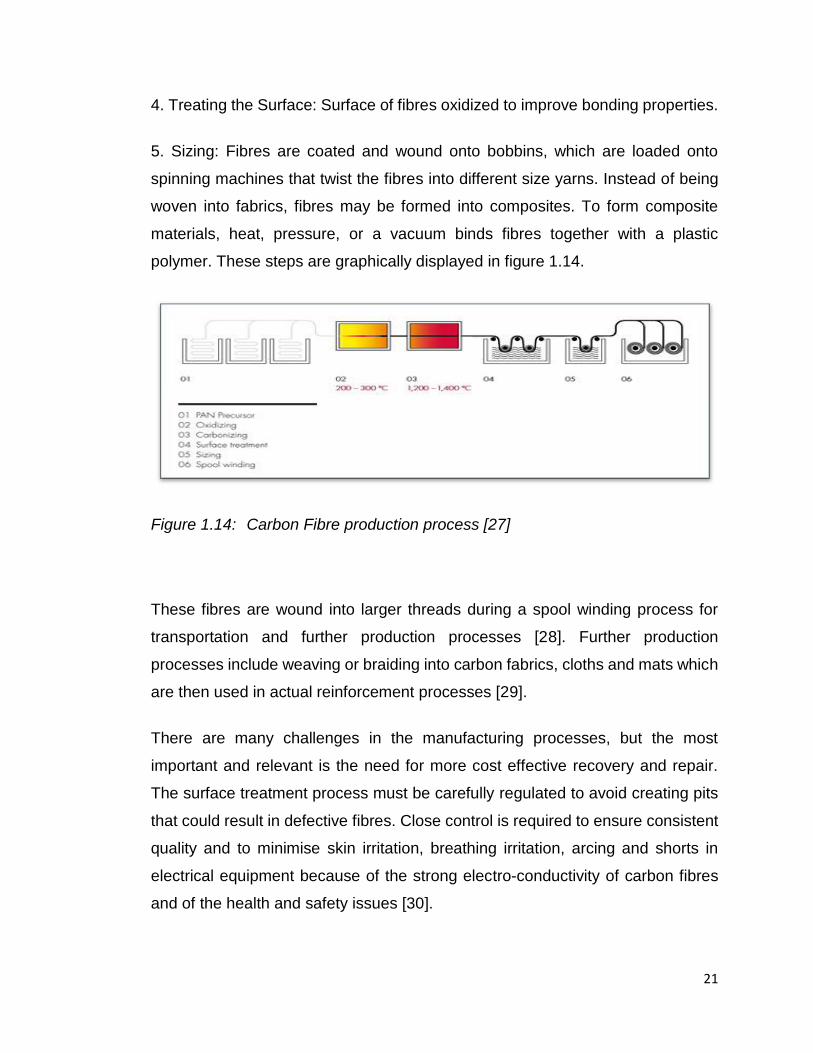
Carbon fibre is created through a series of processes which are graphically
depicted in figure 1.14. Polyacrylonitrile fibres (PAN), pitch resins, or rayon are
carbonized (through oxidation and thermal pyrolysis) at high temperatures.
Through further processes of graphitizing or stretching the fibres, strength or
elasticity can be enhanced respectively. Carbon fibres are manufactured in
diameters analogous to glass fibres with diameters ranging from 9 to 17 µm.
There are typically five segments in the manufacturing of carbon fibres from the
PAN process [8]. These are:
1. PAN Precursor Spinning: PAN mixed with other ingredients and spun into
fibres, which are washed and stretched.
2. Oxidizing: Chemical alteration to stabilize bonding.
3. Carbonizing: Stabilized fibres heated to very high temperature forming tightly
bonded carbon crystals.
21
4. Treating the Surface: Surface of fibres oxidized to improve bonding properties.
5. Sizing: Fibres are coated and wound onto bobbins, which are loaded onto
spinning machines that twist the fibres into different size yarns. Instead of being
woven into fabrics, fibres may be formed into composites. To form composite
materials, heat, pressure, or a vacuum binds fibres together with a plastic
polymer. These steps are graphically displayed in figure 1.14.
Figure 1.14: Carbon Fibre production process [27]
These fibres are wound into larger threads during a spool winding process for
transportation and further production processes [28]. Further production
processes include weaving or braiding into carbon fabrics, cloths and mats which
are then used in actual reinforcement processes [29].
There are many challenges in the manufacturing processes, but the most
important and relevant is the need for more cost effective recovery and repair.
The surface treatment process must be carefully regulated to avoid creating pits
that could result in defective fibres. Close control is required to ensure consistent
quality and to minimise skin irritation, breathing irritation, arcing and shorts in
electrical equipment because of the strong electro-conductivity of carbon fibres
and of the health and safety issues [30].
22
1.3.2.3 Other Types of Reinforcements
There are other types of reinforcements that can be utilized. They are:
Polyester – Due to lack of stiffness, it is usually excluded from being used
in composites. It is however very useful due to its low cost and where high impact,
low weight or abrasion resistance is desired [31]. It has low modulus, low density
and high tenacity with good impact resistance. It is useful as a surfacing material
as it can be smoothened and is compatible with most resin systems.
Boron
In order to improve the overall fibre properties, metal or carbon fibres are often
coated with a layer of boron. A boron/carbon hybrid, composed of carbon fibres
among 80-100μm boron fibres, in an epoxy matrix, can achieve properties greater
than either fibre alone, with flexural strength and stiffness twice that of carbon and
1.4 times that of boron, and shear strength exceeding that of either fibre. Its use
is restricted in high temperature aerospace applications and in specialized
sporting equipment, due to its extremely high cost.
Ceramics
These are most frequently linked with non-polymer matrices such as metal alloys.
Ceramic fibres, are mainly used in areas requiring high temperature resistance,
usually in the form of very short ‘whiskers’.
Natural
It is possible to use silk, wool and fibrous plant materials such as jute and sisal
as reinforcements in ‘low-tech’ applications. Fairly high specific strengths can be
achieved due to the fibre’s low specific gravity which is typically between 0.5-0.6.

23
1.3.3 Nanoclays
The nanoclay utilized was Cloisite®15A which was obtained from Southern Clay
Products Inc., USA. Cloisite 15A is a dimethyl, dehydrogenated tallow,
quaternary ammonium with Chloride as its anion. Cloisite 15A improves various
plastic physical properties, such as heat deflection temperature (HDT), coefficient
of thermal expansion (CTE) and thermal barrier [32]. There are various nanoclays
available, Cloisite Na+, 10A, 15A, 20A, 25A, 93A AND 30B, each with their own
unique chemical structure. Figure 1.15 below, illustrates the structure of Cloisite
15A. HT denotes hydrogenated tallow which consists of ~65% C18, ~30% C16
and ~5% C14 [33].
Figure 1.15: Chemical structures of Cloisite 15A [33]
The interlayer distance for Cloisite 15A is higher than the other Cloisite. This
implies that the desorption of organic compounds will be easier. It is for this
reason that Cloisite 15A was chosen as the nanoclay to use during the processing
of the composite structure.
At the nanoscale level, unusual physical, chemical, and biological properties can
emerge in materials. Nanomaterials behave differently from bulk materials of the
same chemical because of the increased surface area – or the area of an object
that is an exposed surface.

24
In this thesis the type of clay that is used is called nanoclay which are clay
minerals optimized for use in clay nanocomposites– multi-functional material
systems with several property enhancements targeted for a particular application.
Nanoclays are a broad class of naturally occurring inorganic minerals, of which
plate-like montmorillonite is the most commonly used in materials applications.
Montmorillonite consists of ~ 1 nm thick aluminosilicate layers surface-substituted
with metal cations and stacked in ~ 10 µm-sized multilayer stacks. The stacks
can be dispersed in a polymer matrix to form polymer-clay nanocomposite, as
shown in Figure 1.16. Within the nanocomposite, individual nm-thick clay layers
are fully separated to form plate-like nanoparticles with very high (nm × µm)
aspect ratio. Even at low nanoclay loading (a few weight %), the entire
nanocomposite consists of interfacial polymer, with majority of polymer chains
residing in close contact with the clay surface. Potential benefits include increased
mechanical strength, decreased gas permeability, superior flame-resistance, and
even enhanced transparency when dispersed nanoclay plates suppress polymer
crystallization. [3]
Nanomaterial-enabled products such as surface-coated materials,
nanocomposites, and materials comprised of nanostructures (Integrated circuits)
are unlikely to pose a risk of exposure during their handling and during their use
as the materials are of a non-inhalable size. However, some of the processes,
like the cutting or grinding of the products could release respirable-sized
nanoparticles used in their production which may lead to exposure to
nanomaterials.
Based on studies done on animals, nanoparticles can enter the blood stream, and
translocate to other organs. Results from human and animal studies carried out
by NIOSH [11] documented that airborne nanoparticles can be inhaled and
deposited into the respiratory tract. Engineering control techniques which are
effective for capturing airborne nanoparticles and source enclosure i.e., isolating
the generation source from the worker are some examples of the precautions that
can be carried out when handling nanoparticles.

25
Figure 1.16: Schematic of nm-thick montmorillonite clay aluminosilicate layers
[34]
Exhaust ventilation systems with a high-efficiency particulate air (HEPA) filter are
known to effectively remove nanomaterials. Good basic work practices e.g.
washing hands, wearing appropriate personal protection equipment and no
eating/drinking in the work area can help to minimize the workers exposures to
nanomaterials.
1.4 HYBRID COMPOSITES
A hybrid composite is one where there are three or more components. They could
be the resin matrix, the fibre reinforcement and particles, such as nanoclays.
Figure 1.17 shows the process of fabricating a hybrid composite. The nanoclays
are added to the resin mixture and they are allowed to interact. After this
interaction they create either an intercalated or exfoliated arrangement. This resin
mixture is now added to the fibre reinforcement, via a processing technique, for
example, resin transfer moulding. The composite is cured and is ready for
fabrication and testing.

26
Figure 1.17: Schematic showing the process of creating a hybrid Nanocomposite
[35]
1.4.1 Processing of hybrid composites
Composites have been known for years. Their use in high end applications like
aerospace, motor vehicles and sporting equipment is extensive, as indicated by
Tong etal. It is with this growing confidence that research in this field is still
continuing.
The processing techniques of these composites can be varied depending on their
application. There are two distinct types of moulding, namely, composite moulding
and wet moulding. In composite moulding, the resin is fibre reinforced first before
being put through further moulding processes. Sheets of prepreg (pretreated with
resin) FRP are heated or compressed in different ways to create geometric
shapes. In wet moulding, the fibre reinforcement and the matrix are combined
during the moulding process [36], namely, Resin Transfer Molding (RTM), High
pressure Moulding (HPM) & Vacuum Assisted Resin Transfer Molding (VARTM).

27
Fibres are placed into a mould into which wet resin is injected. The resin is
pressurized and forced into a cavity which is under vacuum. Resin is pulled into
cavity under vacuum in the VARTM process. This moulding process allows
precise tolerances and detailed shaping [36].
In the aerospace industry, tensile testing is used for material strength testing of
adhesive bonds, aircraft textiles and carpets, peel tests on the airframe
composites and shear and tensile strength testing of fasteners, e.g. bolts, nuts
and screws and tensile. In the Automotive Industry, quality assessments of
interior fittings (airbags, carpets, dashboards, electrical harness, handles,
laminated trim, mirrors, seals, seatbelts) and handbrake levers.
There are also benefits for the Beverage, Construction, Electrical, Medical,
Packaging, Paper and pulp, pharmaceutical and Plastics, Rubber and Elastomer
Industries. In all these applications, there are ASTM standards that govern the
dimension of the test specimens, the frequency and the test speed [37]. The
Mechanical Testing Equipment is the universal testing equipment that all the
industries use in order to perform the tensile tests.
1.4.2.1 Fatigue Testing
Fibre reinforced polymer composites have become an attractive replacement for
heavier metals due to their superior fatigue and corrosion properties. Although
they may be less susceptible to fatigue failure than metals, fatigue can still occur.
Composite fatigue failure is generally driven by fatigue failure in the polymer
matrix, as such polymer kinetics becomes the obvious tool for predicting fatigue
in composites [38].
Fatigue failures represent the greatest uncertainty with regard to the long-term
service lifetime of the major structural components of a wind turbine, Boeing nose
piece, satellites etc, often leading the designer to either add excess weight to
compensate or to inadequately size a blade resulting in fracture – both costly
errors limiting the cost advantage of wind energy.
28
Fatigue is the main reason that causes extensive damage throughout the
specimen, which can lead to failure from general degradation of the material
instead of a predominant crack. However in static loading of isotopic, brittle
materials, a predominant single crack is the most common failure mechanism that
can occur [39]. Matrix cracking, delamination, fibre breakage and interfacial
debonding, are four basic failure mechanisms that occur in composite materials
as a result of fatigue.
Despite the large amount of research carried out on fatigue failure, its true nature
still remains unknown and damage, cracks or even complete failure due to cycling
loads are constantly being reported. If the problem still exists after 100 years of
research in the previous century, there is something to be explained. The idea
behind this thesis work is not to provide answers to the unanswered questions,
but to tackle the fatigue problem from a different perspective, ITO understanding
the crack initiation and propagation characteristic during Fatigue testing.
This includes testing and analyzing specimens that have 0wt%, 1wt%, 3wt% and
5wt% nanoclays added into the matrix to further reinforce the composite, with
addition of carbon fibre. Furthermore to analyze the complex nature of fatigue
failure, highlight the crack initiation, propagation and arrest during the actual
fatigue testing itself. These phenomena will allow the designer insight into the
crack behavior when fatigue initiates.
1.4.2.2 Crack Initiation, propagation and arrest
Following on from the previous section, it can be noted fatigue failure does not
happen suddenly, there are steps that occur prior to that, that build up to the final
failure. These are highlighted in Figure 1.18. The fatigue life is generally divided
into three stages/periods, Crack Initiation period, Crack Growth Period and then
the final failure itself.

29
Figure 1.18: Different phases of the fatigue life
Crack Initiation is the number of cycles required to initiate a crack, Nf. It generally
results from dislocation pile-ups and imperfections such as surface roughness,
voids, scratch etc. hence; in this period fatigue is a material surface phenomenon.
Crack Growth is the number of cycles, Np required to grow the crack in a stable
manner to a critical size, generally controlled by stress level. Since most common
material contains flaws, the prediction of crack growth is the most studied aspect
of fatigue. Crack growth resistance, when the crack penetrates into the material,
depends on the material as a bulk property. It is no longer a surface phenomenon.
To further elaborate on the Crack initiation and growth, Figure 1.19, highlights the
occurrences of the surface of a specimen during fatigue testing.
Intrusions or extrusions which are actually surface roughness, which can be
created during manufacturing of the specimen itself, are the basis of determining
crack initiation. From here the Persistent Slip Band, PSB is created which is the
very start of the fatigue crack. Thereafter, the primary crack appears and after a
long fatigue test cycle, ~ 1Million cycles, the secondary crack appears. These
cracks will continue until the specimen has fractured. This phenomena occurs in
a composite, however in a hybrid composite the mechanism will be slightly
different. This will be discussed in this thesis.

30
Figure 1.19: Various types of cracks that occur during fatigue testing [39]
However, for the purpose of this study the nanoclays have been added during the
processing stage to the matrix itself. These nanoclays are thought to be able to
arrest the crack and prolong the crack from actually fracturing the specimen and
in essence actually prolonging the life span of the product.
1.4.3 Advantages and disadvantages of hybrid composites
CFRP has a higher performance for a given weight which leads to lighter aircrafts
and hence fuel savings. Excellent strength to weight and stiffness to weight ratios
can be achieved by employing the use of composite materials. Laminate patterns
and ply build-up in a part can be tailored to give the required mechanical
properties in various directions. It is easier to achieve smooth aerodynamic
profiles for drag reduction. Complex double-curvature parts with a smooth surface
31
finish can be made in one manufacturing operation, hence reducing production
cost. For instance, an A380 super-jumbo [3] has about six million parts which in
the future can be reduced significantly. All the parts can be molded
simultaneously. Manufacturing time will be shortened due to fewer components,
saving money. Each precious kilogram cut, from an aircraft’s weight means a
saving of approximately, $1m (£603,000) in costs over the lifetime of an aircraft
and the use of such composites can reduce the weight of an aircraft by up to 20%
[3].
Composites may be made from a wide range of processes. Composites offer
excellent resistance to corrosion. According to Tong et al [36], chemical attack
and outdoor weathering can be damaging to composites. New types of paint and
stripper are being developed to deal with this problem.
Some thermoplastics are not resistant to some solvents. Detection of cracks and
fatigue cracks are easily performed and the repair strategy for these cracks is
equally as simple. Just the area where the crack has been detected can be
repaired and the crack propagation can hence be stopped. By using composites,
manufacturers can get a good component surface finish to optimize their
aerodynamic performance.
Some disadvantages of composites are: Composites are more brittle than metals
and thus are easily damaged. Cast metals also tend to be brittle and repair of the
damages introduces new problems. Materials require refrigerated transport and
storage and have limited shelf lives. Hot curing is necessary in many cases,
requiring special equipment, curing either hot or cold takes time.
Keith et al [40] stated that the product is not finished until the last rivet has been
installed. If rivets have been used and must be removed, this presents problems
of removal without causing further damage.
Repair at the original cure temperature requires tooling and pressure. Composites
must be thoroughly cleaned of all contamination before repair, composites must

32
be dried before repair because all resin matrices and some fibres absorb
moisture.
During processing, pieces of carbon fibres can break off and circulate in the air in
the form of a fine dust. Industrial health studies [41] have shown that, unlike some
asbestos fibres, carbon fibres are too large to be a health hazard when inhaled.
They can be an irritant, however, and people working in the area should wear
protective masks. The carbon fibres can also cause skin irritation, especially on
the back of hands and wrists. Protective clothing or the use of barrier skin creams
is recommended for people in an area where carbon fibre dust is present.
The sizing materials used to coat the fibres often contain chemicals that can
cause severe skin reactions, which also requires protection. Carbon fibres are
also good conductors of electricity. As a result, carbon fibre dust can cause arcing
and shorts in electrical equipment. If electrical equipment cannot be relocated
from the area where carbon dust is present, the equipment is sealed in a cabinet
or other enclosure.
1.4.4 Application of hybrid composites
Every day, a new application is found for carbon fibre reinforced plastic. What
started out forty years ago as a highly exotic material is now a part of everyday
life. These thin filaments, a tenth the thickness of a human hair, are now available
in a wide range of useful forms.
The first fibre reinforced plastic plane fuselage was used on a modified Vultee
BT-13A designated the XBT-16 based at Wright Field in late 1942 [42]. In 1943
further experiments were undertaken to build structural aircraft parts from
composite materials resulting in the first plane, a Vultee BT-15, with a Glass Fibre
Reinforced Plastic (GFRP) fuselage being flown in 1944 [43]. A significant
development in the tooling processes for GFRP components had been made by
Republic Aviation Corporation in 1943 [44].
33
Carbon fibre has gone to the moon on a spacecraft, but it is also used widely in
aircraft components and structures, where its superior strength to weight ratio far
exceeds that of any metal. Thirty percent of all carbon fibre is used in the
aerospace industry. From helicopters to gliders, fighter jets to microlights, carbon
fibre is a make of the design and structure and hence increasing range and
simplifying maintenance [45]. Carbon fibre application in sports goods ranges
from the stiffening of running shoes to ice hockey stick, tennis racquets and golf
clubs. ‘Shells’ (hulls for rowing) are built from carbon fibre, and many lives have
been saved on motor racing circuits by its strength and damage tolerance in body
structures. Carbon fibre is used in crash helmets too, for rock climbers, horse
riders and motor cyclists – in fact in any sport where there is a danger of head
injury.
The applications in the military are very wide ranging; from planes and missiles
to protective helmets, providing strengthening and weight reduction across all
military equipment. It takes energy to move weight; whether it is a soldier’s
personal gear or a field hospital, and weight saved means more weight moved
per gallon of gas. A new military application is announced almost every day. The
latest and most exotic military application is for small flapping wings on
miniaturized flying drones, used for surveillance missions [2]. The application and
uses of carbon fibre are widely extensive and research is seeking to improve the
technology and quality of products so that they can last longer, be cost effective
and have minimal maintenance requirements. With the increasing use of CFRP,
the future options are endless.
Future designs with composites will significantly improve a plane's lift-to-drag
ratio, making it much more aerodynamically efficient, and reduce its overall
weight. The Airbus unveiled its proposal for an airliner of the future and this too
moves away from the traditional narrow tube-like fuselage. Instead, in its 2050
concept plane the wings are slimmer and longer to reduce drag as shown in figure
1.20. The new fuselage efficient design is fatter, curved and shaped to improve

34
airflow and to provide more internal space. The engines will need less frequent
maintenance by the ground crew as it will become more efficient.
Figure 1.20: Versatile Carbon fibre airframes mean that aircraft can be very
different in shape in the future [3]
The tail section is U-shaped, which acts as a shield, cutting down on engine noise.
This means they can be partially embedded in the airframe to improve fuel
consumption. Elements of these designs are certain to be incorporated in all
future aircraft designs, in large part due to the materials revolution which is rapidly
changing all aspects of manufacturing [3].
In addition to lowering the overall airplane weight, moving to a composite primary
structure promises to reduce both the scheduled and non-routine maintenance
burden on the airlines. Experience with the Boeing 777 proves that composite
structures require less scheduled maintenance [37] than non-composite
structures. For example, the Boeing 777 composite tail is 25% larger than the
Boeing 767’s aluminum tail, yet requires 35% fewer scheduled maintenance labor
hours. This labor hour reduction is due to the result of a reduced risk of corrosion
and fatigue of composites compared with metal. A composite structure also

35
results in less non-routine maintenance. The 777 floor structure is all composite
and highlights the advantages of this material when applied in a harsh
environment. Airline operators are aware of the undetectable fatigue cracking and
corrosion difficulties experienced with traditional aluminum floor beams. The 777
model has been flying for more than 10 years [34] with more than 565 airplanes
in the fleet and to date has not replaced a single composite floor beam.
The intended use for the CFRP for this dissertation is the aircraft for military,
space and passenger travel. For all these applications, weight saving is of
paramount importance. Weight saving will mean fuel saving, less emissions and
the ability to transport more passengers and cargo. The passenger per kilometer
consumption is currently at 5l/km. With the weight savings this value will be
reduced considerably.
1.5 COMPOSITE HYBRID USED IN PRESENT STUDY
1.5.1 Aim of the Study:
The aim of this research was to fatigue test the test specimens, produced from
composite panels processed via the VARIM process. The test specimens were
infused with nanoclays at percentages of 0 wt%, 1wt%, 3wt% and 5 wt%. The
fatigue tests were carried out to determine the Fatigue life of Carbon Fibre
Reinforced Composites for aerospace applications.
The idea is to fabricate light weight composite panels with similar strength and
improved stiffness of epoxy resin for airplane parts. This in turn can ensure that
the aircraft can carry more fuel and can hence travel for longer periods or carry
more passengers and hence the use of the aircrafts can become economically
viable.

36
1.5.2 Objectives of the Study:
The objectives in order to achieve this research aim are as follows:
Produce Carbon fibre composite panels with 0wt%, 1wt%, 3wt% and 5wt%
nanoclay concentration.
Fully characterize the nanoclays and the sample specimens.
Perform dynamic and static testing on the sample specimens and analyse
this data.
1.5.3 Problem statement
With growing technology, there is always a need to improve on existing products.
Composites are widely used in aerospace; main body of the aircrafts, wings,
satellites and automobile industry; door linings, engine covers. In 2011; A dream
became a reality when a Boeing's new carbon-fibre 787 Dreamliner heralded a
new age of air travel [24].
This Boeing’s structure comprised of 50% of composites parts, including the
fuselage and the wings. Due to this new technology being used, this Boeing is
now 20% more fuel-efficient than similar sized planes. However the question
needs to be asked how this product can be made better, stronger, light weight
and more durable that is to increase on the already phenomenal 20% fuel-efficient
savings. The two main components of a composite are resin and the fibre itself.
For the purposes of this study, carbon fibre will be utilized, since it is already a
major component in high end applications and its mechanical strength is very
high.
If more fibre or more resin is to be added then the product will be stronger however
it will also get heavier. And with aircrafts ever increasing speeds and agility, this
will certainly be a problem. However if a nanoclay is added to the composite with
the existing processing methods, this composite will retain its same weight and
37
become stronger. However with the addition of the nanoclays into the composite,
there is very limited knowledge about the behavior of the composite during fatigue
conditions.
Research has been conducted with the epoxy only, with epoxy and nanoclay, with
epoxy and fibre and then with the hybrid; fibre, epoxy and nanoclay. A similar
trend is observed in results where the nanoclay addition enhances the static and
dynamic properties of the material. However limited work has been performed on
woven carbon fibre hybrid composite for aerospace application. This dissertation
will focus on creating a woven CFRP in a thermoset resin with the addition of
MMT nanoclays at percentages of 0wt%, 1wt%, 3wt%, and 5wt%. Aircrafts
undergo shear forces on a daily basis, and it is these forces that can create stress
points where the components can shear off and break away. Therefore, the focus
of this study is to investigate the fatigue properties of nanoclay filled Carbon Fibre
Re-inforced Polymer.

38
CHAPTER 2
Carbon Fibre Reinforced Polymer has been extensively researched over the past
decade. Studies have shown that although they are lightweight, strong, durable
and suitable for aerospace applications; their brittle nature and hence cracking
effect, their delamination effects and shear stress effects decrease their life span.
Previously, as discussed by Ratna etal [46], only metals have been used for
aircraft construction, however when these structures have been failing untimely
and the root cause was difficult to ascertain, the move was to use composites for
aircraft structures.
There was an increasing trend to utilize composites in various parts of aircrafts,
however, the need now is to improve on this further. If this material could be made
lighter whilst offering the same strength to weight ratio, this would mean that the
aircraft fuel efficiency would increase and hence the aircraft could carry less fuel.
The increase in space area could accommodate more passengers and luggage.
The hypothesis for this is to incorporate nanoclays during the processing of the
composite, directly into the resin mixture. In current work, nanoclays were added
in concentrations 0wt%, 1wt%, 3wt% and 5%, and improvement in fatigue life was
observed as loading of nanoclay increased to 5%.
Numerous studies [46, 47, and 48] have been carried out by incorporating
nanoclays into the composite during the processing stage to create a hybrid
nanocomposite. Tensile (to obtain ultimate tensile strength), fatigue (to determine
the breakage point under a constant strain) and fracture (to determine the
cracking properties) testing were then carried out on these samples. Previous
works carried out, report characterization of polymers only. Here in this work to
strengthen these polymers, fibres were then added during processing and the
orientation and direction of these fibres were varied to obtain the optimum
strength that is required for the given application. Thereafter to provide sufficient
strength along with stiffness a hybrid composite was fabricated where nanoclays
at various percentages were added during processing.

39
2.1 BACKGROUND INTO FAILURE DUE TO FATIGUE
Grimmer and Dharan [49] stated that high cycle fatigue life in glass fibre
reinfiorced composites was dominated by fatigue cracking in the matrix, which
subsequently propagated and ruptured the main load bearing elements which are
the fibres. They further stated that the low elasticity modulus of glass fibres, when
compared to the high modulus of carbon fibre composites, may impose higher
strains in the matrix leading to failure by fatigue. Therefore the addition of
nanoparticles like organoclay was expected to contribute to decrease the scale
of damage mechanisms, leading to an increased absorption of the strain energy
through the creation of fine nano-scale cracks. Carbon fibre is already a preferred
fibre over glass fibre and adding nanoclays to the composite will result in a hybrid
nanocomposite being able to withstand a higher degree of fatigue before rupturing
and failing.
The use of composite materials has increased in aircraft structures where
reducing the structure of non-useful weight becomes a crucial design criterion so
as to maximize the weight of the useful structures. According to Helmy and Hoa
[50], tapered composite structures produced by terminating or dropping off some
of the laminate plies have received much attention, since fatigue failure on these
type of structures were on the increase. Kabir and Hoa [51] further stated that, it
can be expected that adding nanoparticles in polymer matrix would improve the
ability of energy dissipation under dynamic loading and thus enhance the
damping properties. If energy dissipated is improved, then the fatigue life of the
structure must also be enhanced.
2.2 FAILURE OF POLYMER STRUCTURES
Polymer structures on their own without any reinforcements are rarely ever used
in aerospace application, since they are very brittle and fracture easily. Hence,
work has been done in this area with the addition of nanoclays to strength the
polymer.
40
2.2.1 The Effect of Nanoclay on Polymer structure
There are two particular characteristics of clays that are generally considered for
nanocomposites; the first is the ability of the silicate platelets to disperse into
individual layers and the second is the ability to fine-tune their surface chemistry
through ion exchange reactions with organic and inorganic cations. These two
characteristics are, of course, interrelated since the degree of dispersion of
silicate platelets in a particular polymer matrix depends on the interlayer cations.
A nanocomposite may not be formed by the physical mixture of a polymer and
clay. This situation is analogous to polymer blends and in most cases separation
into discrete phases takes place. The poor physical interaction between the
organic and the inorganic components leads to poor mechanical and thermal
properties which occurs mostly in immiscible systems. In contrast, strong
interactions between the polymer and the organo-modified clay in
nanocomposites leads to the dispersion of organic and inorganic phases at
nanometer level. As a result, nanocomposites exhibit unique properties not shown
by their micro counterparts or conventionally filled polymers [52-56].
Alkylammonium or alkylphosphonium cations in the organomodified clays lower
the surface energy of the inorganic host and improve the wetting characteristics
of the polymer matrix, and result in a larger interlayer spacing. Additionally, the
alkylammonium or alkylphosphonium cations can provide functional groups that
can react with the polymer matrix, or in some cases initiate the polymerization of
monomers to improve the strength of the interface between the inorganic and the
polymer matrix [57].
2.2.2 Types of Nanoclay
Clays have silicate layers of thickness 1 nm and high aspect ratio (e.g. 10-1000).
A few weight percent of clay that are uniformly dispersed throughout the polymer
matrix creates a much higher surface area for clay/polymer interaction as
compared to conventional composites. Depending on the strength of interfacial

41
interactions between the polymer matrix and clay, two different types of
nanocomposites are thermodynamically achievable as described in Figure 2.1.
In an intercalated nanocomposite the insertion of a polymer matrix into the inter
gallery spacing of clay occurs in a regular crystallographic fashion, regardless of
the clay to polymer ratio. Intercalated nanocomposites normally have interlayer
of few molecular layers of polymer
The second type is the exfoliated nanocomposites: the individual clay layers are
separated in a continuous polymer matrix, and the average distance depends on
clay loading. Usually, the clay content of an exfoliated nanocomposite is much
lower than that of an intercalated nanocomposite.
Figure 2.1: Showing the different types of nanoclay infused structures [57]
2.2.3 Techniques for Characterizing Nanocomposites
The structure of nanocomposites has typically been established using X-Ray
Diffraction (XRD) analysis and Transmission Electron Microscopic (TEM)
observation. Monitoring the shape, position, and intensity of the basal distance
within the distributed silicate layers, the nanocomposite structure may be
42
identified as to whether it is intercalated, exfoliated or a combination of both. For
example, in an exfoliated nanocomposite, the extensive layer separation
associated with the delamination of the silicate layers in the polymer matrix results
in the eventual disappearance of any coherent X-ray diffraction from the
distributed silicate layers. On the other hand, for intercalated nanocomposites,
the finite layer expansion associated with the polymer intercalation results in the
appearance of a new basal reflection corresponding to the larger gallery height.
Although XRD offers a convenient method to determine the interlayer spacing of
the silicate layers in the clay, and in the intercalated nanocomposites (within 1–4
nm), little can be said about the spatial distribution of the silicate layers or any
structural non-homogeneities in nanocomposites. Additionally, some clays initially
do not exhibit well-defined basal reflections. Thus, peak broadening and decrease
in intensity are very difficult to assess. Therefore, conclusions concerning the
mechanism of nanocomposites formation and their structure based solely on XRD
patterns are only tentative.
TEM allows a qualitative understanding of the internal structure, spatial
distribution of the various phases, and views of the defective structure through
direct visualization. However, special care must be exercised to guarantee a
representative cross-section of the sample. Typically, when inter-layer spacing
exceed 6–7 nm in intercalated nanocomposites or when the inter layers become
relatively disordered in exfoliated nanocomposites, associated XRD features
weaken to the point of not being useful.
2.2.4 Testing of Polymer Structures
Moodley and Kanny [48] showed that the tensile modulus and tensile strength of
polypropylene increased by 120% and 160% respectively with 2wt% nanoclays
and that degradation of these properties was noticed for 3%, 4% and 5% clay
loading. It can be further noted that in this study polypropylene was utilized,
prepared by the melt blend technique, with Cloisite 15A Montmorillonite (MMT)
nanoclay. According to Mohan etal [46], tensile modulus of nanoclay filled resin

43
was significantly increased from 1.1Gpa to 3.59Gpa (226% increase) at 3%
nanoclay concentration and the tensile strength was increased from 61.1MPa to
66.3MPa (8.5% increase). Here there was no fibre included, just the resin and the
nanoclays. Testing was carried out up to 10wt% nanoclays, however the 3%
showed the best results. The effect of nanoclays on specimens even without fibre
as a reinforcing agent still showed amassed results.
2.3 FAILURE OF COMPOSITE STRUCTURES
When fibres are added to the polymer it becomes a fibre re-inforced composite.
Fibres bring their own re-in forcing properties and these need to be explored.
Gamstedt and Talerja [58] proved that a thermoset based composite showed a
higher fatigue resistance with few micro cracks initiated at distributed fibre breaks
growing at a decelerating rate. The thermoplastic composite had a more
pronounced fatigue degradation with a steeper fatigue life curve which was
caused by widespread propagating debonds and the matrix cracks. So the use of
a tougher and more ductile matrix results in a superior fatigue life performance.
Backe etal [59] studied very high cycle fatigue (VHCF) of CFRP and showed that
CFRP undergoes fatigue damage at low loading amplitude and at very long
lifetimes in the VHCF regime.
2.3.1 Fibre Orientation
There are various fibre orientations that are available, unidirectional, cross-ply
and woven. There are also multi directional fibres. Research done by Kawai etal
[60] on the fatigue studies of cross-ply and unidirectional CFRP, showed that the
static tensile strength of unidirectional laminate increases with decreasing
number of plies however by contrast, the fatigue behavior is insensitive to the
number of plies. The cross ply laminate behaves in a similar way as when
compared to the unidirectional laminate. The S-N relationship for the cross ply
laminate is almost parallel to the result on the unidirectional laminate. This

44
observation indicates that the fatigue strength of the cross-ply laminate is
determined by the fatigue strength of the axial plies. Hence since woven fibre is
used here, the S-N relationship will be similar to that as studied by Kawai, hence
it can be implied that the cycles will be greater than 106 range.
2.3.2 Fibre Volume Fraction
Tensile tests have already been conducted on CFRP, with variations; for example
with different void fractions, with different fibre orientation (in the case of
unidirectional fibre) and with different thicknesses. In most cases tensile tests are
carried out to determine the UTS and stiffness and then further testing takes place
from here on, it is most often not the final test.
As per Brunbauer etal [61], the fibre volume fraction of the composite plays a
major role in the stiffness and strength during tensile testing. It was concluded
that fibre volume fraction is directly proportional to stiffness and strength of
composites. This finding was further emphasized when Qi etal [62], went on
further to test multi-layer composites with different volume fractions. The finding
here was consistent with Brunbauer etal [61], where it was concluded that as the
fibre volume fraction increased so did the tensile strength, even with multilayers.
Hence during processing the fibre volume fraction was maintained at 55%. This
goes in line with what has been discussed above as well. The higher the fibre
volume fraction, the higher the stiffness and strength is. While strength is
desirable quality, the stiffness is not always desired as it makes the material brittle
and easy to snap. Hence the optimum fibre void fraction desired for this work is
55%.
2.4 FAILURE OF HYBRID STRUCTURES
These are processing techniques and surface additions that create a stronger
and more durable composite. Borrego etal [63] and Wang etal [64] have studied
the addition of nanoclays to the composite during processing. The theory is that

45
these nano particles will create stronger hybrid structures. Below are other studies
carried out that demonstrated how nano particles are responsible for creating a
stronger composite.
The percentage increase for the modulus and for the strength with the fibres in
the matrix was even greater, as indicated by Zhou and Lee [65]. They indicated
that the tensile modulus and strength of high-performance thermoset polymer
composites synthesized by using both long carbon fibres and nanoclays,
improved by 80% and 64%, respectively with 5% MMT nanoclay. Ratna etal [47]
shoed that with clay re-inforced epoxy the impact strength of nanocomposite was
increased from 0.7kJ/m to 1.1 kJ/m (57% increase) with a clay content of 5%.
Borrego etal [59] pointed out that during the fatigue testing of glass fibre
reinforced epoxy composites enhanced with nanoparticles, the nanoparticles act
as a barrier for the fatigue crack propagation.
From the studies that have been conducted so far, it can be seen that the addition
of MMT nanoclays increase the tensile static properties (UTS, Young’s Modulus
and Impact Strength) of the resin alone and with the MMT nanoclay, the resin and
carbon long fibre as well. It also shows that the optimum MMT Nanoclay
concentration can vary between 3-5%, however higher concentrations above this
point, results in product degradation [46].
2.4.1 Fatigue Failure Theory
In materials science, fatigue [64] is defined as the weakening of a material caused
by repeatedly applied cyclic loading. The nominal maximum stress value that can
cause such damage is usually less than the ultimate tensile strength of the
material.
Fatigue occurs when a material is subjected to cyclic repeated loading and
unloading. If the loads are above a certain threshold, microscopic cracks will
begin to form at the surface. Eventually a crack will reach a critical size, the crack
will propagate suddenly, and the structure will fracture.

46
The basic method of presenting engineering fatigue data is by means of the S-N
curve, a plot of stress, S against the number of cycles to failure, Nf. Usually,
millions of cycles might be required at lower loading levels, to cause failure, so
the abscissa in usually plotted logarithmically.
Three basic factors are necessary in order for fatigue cracks to initiate [52]. First,
the loading pattern must contain minimum and maximum peak values with large
enough variation or fluctuation. Secondly, the peak stress levels must be of
sufficiently high value. Thirdly, the material must experience a sufficiently large
number of cycles of the applied stress. The number of cycles required to initiate
and grow a crack is largely dependent on the first two factors.
In addition to these three basic factors, there are a host of other variables, such
as stress concentration, corrosion, temperature, overload, metallurgical structure,
and residual stresses which can affect the propensity for fatigue. Since fatigue
cracks generally initiate at a surface, the surface condition of the component
being loaded will have an effect on its fatigue life.
Surface roughness is important as it is directly related to number and the level of
stress concentrations on the surface. When the stress concentration is high, the
more likely it is for a crack to nucleate. Smooth surfaces increase the time to
nucleation. Notches, scratches, and other stress risers decrease fatigue life.
Surface residual stress will also have a significant effect on fatigue life.
Figure 2.2a shows the cyclic behavior for tension and compression loading that
is the specimen is pulled apart and then pushed together again and thus creating
the compression effect. Figure 2.2b shows the cyclic behavior for tension and
tension loading, that is the sample is pulled and then relaxed.
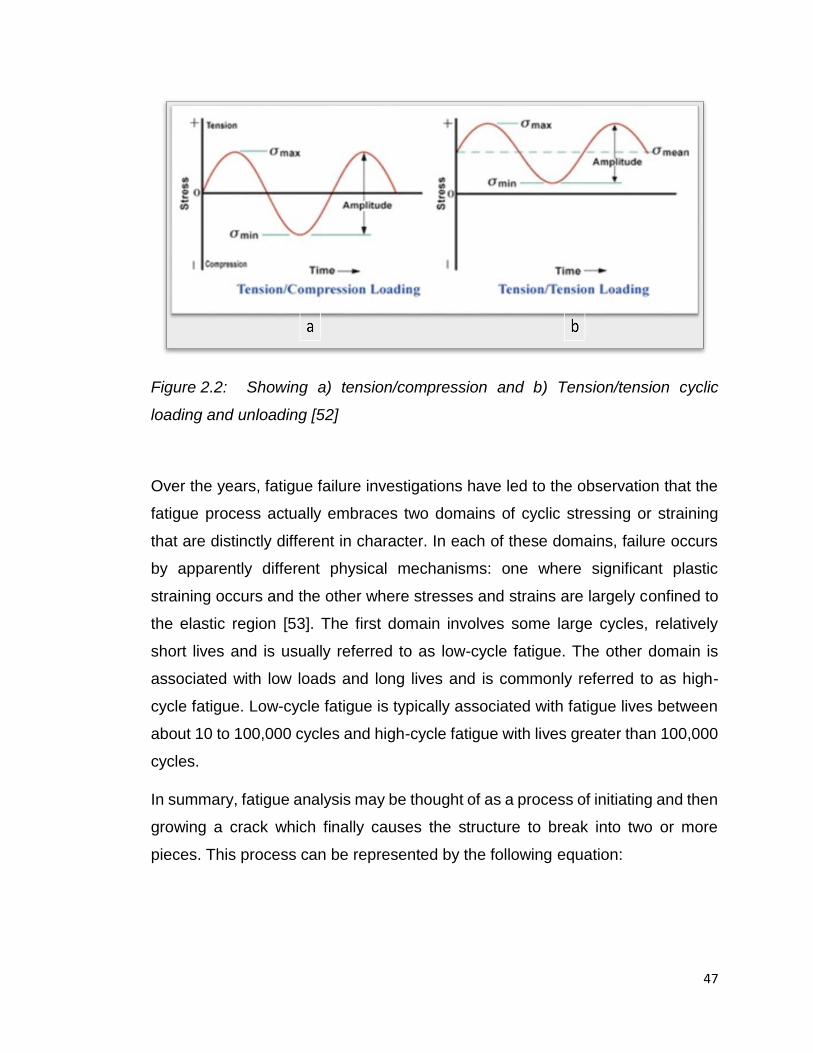
47
Figure 2.2: Showing a) tension/compression and b) Tension/tension cyclic
loading and unloading [52]
Over the years, fatigue failure investigations have led to the observation that the
fatigue process actually embraces two domains of cyclic stressing or straining
that are distinctly different in character. In each of these domains, failure occurs
by apparently different physical mechanisms: one where significant plastic
straining occurs and the other where stresses and strains are largely confined to
the elastic region [53]. The first domain involves some large cycles, relatively
short lives and is usually referred to as low-cycle fatigue. The other domain is
associated with low loads and long lives and is commonly referred to as high-
cycle fatigue. Low-cycle fatigue is typically associated with fatigue lives between
about 10 to 100,000 cycles and high-cycle fatigue with lives greater than 100,000
cycles.
In summary, fatigue analysis may be thought of as a process of initiating and then
growing a crack which finally causes the structure to break into two or more
pieces. This process can be represented by the following equation:
48
Equation 2.1: Total Life Calculation
Total Life = Crack Initiation + Crack Growth, or
Nf = Ni + Np [2.1]
Where: Nf = Total fatigue cycles to failure
Ni = Number of cycles to initiate a crack
Np = Number of cycles to propagate a crack to final fracture
Ho et al [66] points out that using nanoclays in composites, proved that 5 wt%
nanoclay gave the highest UTS and Vickers Hardness value amongst all the
nanoclay compositions from 0wt% through to 8wt%. The ductility however
decreased drastically with the addition of the higher nanoclay content inside the
epoxy sample, which would cause catastrophic failure. The nanoclay content
should be kept below the 5wt% in order to get good mechanical properties.
2.4.2 Damage Characteristics
Khan et al [67] studied unidirectional CFRP containing nanoclays and found that
the incorporation of nanoclay into CFRP composites not only improves the
mechanical properties but also the fatigue life for a given cyclic load level. The
corresponding fatigue damage area is significantly reduced due to the nanoclay.
When a stress is applied to the sample, dimples appear on the surface of the
sample. Dimples are referred to small microscopic cavities within the structure of
the sample. The size of these dimples increased in both width and depth with
decreasing the stress level applied during fatigue or alternatively with an increase
in fatigue life. The mechanisms of dimple growth and formation can be explained
as follows: micro cracks are formed during the early stages of fatigue loading at
weak locations where there are high stress concentrations. Localized plastic
deformation occurs due to the strain concentration around these micro cracks,

49
which in turn promotes the formation of dimples. Khan etal further stated that, the
lower the applied stress level, the longer this stage lasts. Dimples grow in a stable
fashion with increasing number of fatigue cycles before they coalescence into
major cracks and final failure. They tend to coalescence rapidly at high stress
levels, leading to premature fracture without extensive growth of deep and wide
dimples. The elongation or stretching of the localized deformation zones or
dimples is highly dependent on the applied stress.
These dimples occur during crack initiation, however as the crack progresses and
the number of cycle’s increases, the dimples become larger and the fracture
mechanism changes. After this matrix cracking, fibre breaking and delamination
takes place and this determines the final fracture.
2.4.3 Fatigue Parameters
While the fatigue testing is being carried out, there are certain factors that need
to be considered. One is the fatigue loading percentage and the other is the
fatigue frequency.
2.4.3.1 Fatigue Loading Percentage
This percentage determines at which rate the sample will be fatigue tested. The
ultimate tensile stress is required which is then referred to as the maximum stress.
This is obtained from the static tensile test that is conducted. Khan etal [67]
studied unidirectional CFRP containing nanoclays, and used fatigue loading
percentages of 80%, 60% and 45%. In order to be comparable with the results
and be able to fill in the gaps for the other percentages, 90%, 75% and 60% was
used in this study.

50
2.4.3.2 Fatigue Testing Frequency
The frequency of the fatigue testing plays a major role during testing. Some of the
samples can have fatigue cycles of more than 5 Million cycles, this will generate
a lot of heat. So the frequency needs to be kept to a minimum in order to minimize
the temperature generation. The loading frequency is considered to have a
significant influence on the sensitivity to fatigue for carbon fibre composites for
the effect of self-generated heating and intrinsic rate dependence, as stated by
Curtis etal [68]. The surface temperature of specimens increase rapidly in the
intermediate number of cycle range of 10,000 cycles and the increase in surface
temperature was larger than 20°C, as observed by Pandita etal [69]. The
magnitude of the change of the surface temperature depended on the fibre
orientation as well as maximum fatigue stress. It was found that 2Hz offers the
most consistent temperature profile, while 10Hz offered the highest temperature
profile range. Based on these findings, 3 Hz was utilized. This offered the
minimum heat generation however, still at a level, where the testing can take
place.
2.5 MOTIVATION AND SCOPE OF RESEARCH WORK
Research has been conducted on fibre-reinforced hybrid structures with addition
of nanoclays with favorable improvements in properties. Materials, in general,
may be categorized as being either ductile or brittle [70]. This depends on the
characteristics of failure. In the case of polymers, there are two primary
deformation mechanisms, namely, crazing and shear band formation [71]. Shear
band formation is believed to be the precursor to ductile failure [71]. Brittle failure
occurs when crazing is the dominant deformation mechanism [72]. Thermoset
polymers exhibit brittle fracture at low temperatures and ductile fracture at high
temperatures [73]. The failure mechanism in thermoplastics can be both brittle
and ductile. The failure mechanisms for tensile, flexural and other common
mechanical testing are well documented. However, literature on failure due to
fatigue mechanisms are not extensive, especially with the inclusion of nanoclays.

51
Therefore this study involves the processing and analysis of woven CFRP with
the addition of nanoclays. Specimens were subjected to fatigue tests in order to
determine the life cycle at different loading rates which were 90%, 75% and 60%
at a frequency of 3Hz. The crack initiation, crack propagation and crack paths that
were observed during the fatigue testing of these composite structures are
discussed. The temperature and frequency effect of the test samples during
testing and crack density and rate are also analysed and discussed.

52
CHAPTER 3
3.1 DESIGN OF RESEARCH
Products, aircraft, spacecraft, satellite, sporting goods and high performance
motor vehicles, made with carbon fibre re-enforcement plastic (CFRP), undergo
strenuous fatigue cycles on a daily basis. This research undertakes to identify
and understand these fatigue cycles and study factors that can improve these
cycles and hence extend the lifetime of the product.
The strategy adopted for this research was purely experimental, where
specimens were created and tests were carried out which are similar to the
operating conditions which the end products are subjected to. This research
approach was both qualitative and quantitative. Qualitative in that ASTM
standards which have already been devised and approved by a regulatory board
were adhered to when preparing the specimens and the running tests.
Quantitative in that experimental work carried out were done using five specimens
for each test and the data obtained was analysed using approved methods and
conclusions drawn.
Figure 3.1, outlines the design method that was adopted for this research work.
Carbon fibre re-inforced plastic (CFRP) composites were prepared using the
vacuum assisted resin infusion method (VARIM) during which time Cloisite®
Nanoclays were added to the composite in the concentration of 0wt%, 1wt%,
3wt%, and 5wt%. The VARIM process was selected due to it being able to ensure
a uniform thickness throughout the laminate during the infusion process due to
the constant pressure applied to the entire laminate. Transmission electron
microscope (TEM) and X-ray Diffraction (XRD) were the characterisation and the
morphological methods that were carried out. Static (tensile, Impact, hardness,
double cantilever beam and end notch flexure) and dynamic test (fatigue) were
carried out on the prepared specimens to obtain the life cycle for the sample. The
static tests and dynamic tests were carried out on 0wt%, 1wt%, 3wt% and 5wt%
nanoclay samples.

53
3.1.1 Flow Diagram of Research Design
Figure 3.1: Flow Diagram highlighting the experimental design
Carbon Fibre Re-
inforced Polymer
(CFRP)
Tensile Test (0, 1, 3, 5wt%)
5 samples each
Impact (0, 1, 3, 5wt%)
5 samples each
Hardness (0, 1, 3, 5wt%)
5 samples each
Fatigue Test
(0, 1, 3, 5wt%)
5 samples each
XRD
TEM
Scanning Electron Microscope
(SEM)
Woven Carbon fibre
10 sheets
Epoxy Resin
+ Hardener
Nanoclays
0, 1, 3 & 5wt%
Vacuum Infusion Process
Static Testing
Dynamic Testing
Morphology
Failure Mechanism
Processing
Mechanical testing
54
3.2 RESEARCH METHODOLOGY
Research can be stimulated by various methods such as deductive logic,
inductive logic, scientific methods, critical thinking and collaborative work. The
method that best describes this research, as shown in Figure 3.2, is the scientific
method for the following reasons.
Step 1: Observation: It is at this step where the idea or concept for the research
is born. Carbon fibre is known as the strongest fibre, however it is brittle and under
fatigue conditions it can break easily. Hence the question was raised as to what
can be done to the material to make the final product stronger and hence last
longer, yet still maintain its lightweight structure.
Step 2: Hypothesis: Through researching the subject, it was postulated to add
nanoclays into the material during the manufacturing process to create a hybrid
structure. During this stage, it was established what quantities of nanoclays would
be used, that is 0wt% (reference sample), 1wt%, 3wt% and 5wt%. The tests that
were to be carried out were highlighted at this stage. Tensile test to determine the
fatigue loading, hardness and impact testing to determine the effect of the
nanoclays on the brittleness of the material, fracture tests to determine the
fracture mechanics of the material and then finally fatigue testing. The procedure
to follow in order to manufacture the specimens for all the testing were also
identified.
Step 3: Testing: This step is purely experimental. Specimens were cut and tests
were carried out as per regulated standards. This step was a continuous and
repetitive process. This process continued until the hypothesis was proven.
Step 4: Predictions: this is the last and final step, where the hypothesis raised
earlier was proved using the relevant results from the experimental data
performed.
Due to the process followed in this research study being very similar to the
scientific approach highlighted in Figure 3.2, it can now be stated that this
research is indeed a scientific method.

55
Figure 3.2: Demonstrating the key aspects of a Scientific Method
Figure 3.2 shows the cyclic process that is followed in a scientific method
procedure. As the diagram shows this procedure can be repetitive, which was the
case in this research study.
3.2.1 Processing
3.2.1.1 Materials to manufacture the Composites
Woven carbon fibre with a density of 200 g/m2 was acquired from Advanced
Materials Technology (AMT) Composites, South Africa. Woven fibre was selected
based on the fact that it offers excellent multi-axis properties and it lends great
toughness and durability to a composite structure. The carbon fibre was
purchased in 20mx1m rolls and thereafter cut into 300mmx300mm sheets. The
resin, LR20 and the hardener LH281 (Unmodified Cyclicaliphatic Amine) epoxy
resin system was obtained from AMT Composites. The peel ply, perforated
release film, distribution mesh and vacuum bagging were all obtained from AMT
Composites as well and they all were procured in rolls and thereafter cut into the

56
desired lengths. The 8 mm tubing and the spiral distribution tubing were obtained
from a local electrical supplier, Industrial Rubber and Engineering Supplies cc.
The wax that was used as a release film for the hardened composite laminate
was procured from a local hardware store. The nanoclay utilized was Cloisite®15A
which was obtained from Southern Clay Products Inc., USA. Cloisite 15A is a
quaternary ammonium salt modified natural montmorillonite (MMT) polymer
additive, which improves various plastic physical properties, such as
reinforcement, heat deflection temperature (HDT), coefficient of thermal
expansion (CTE) and thermal barrier [74]. The pump that was utilised was
N022AN 18 Vacuum Pump IP20 which was purchased from Labotec (PTY) Ltd,
South Africa. A resin trap was utilised to prevent damage of the pump.
3.2.1.2 Processing of Composites
The laminate was produced using a vacuum assisted resin infusion method
(VARIM). The advantages of this process as compared to the others are that it
provides better fibre-to-resin ratio, there is less resin wasted, there is very
consistent resin usage, there is unlimited set-up time and the process is much
cleaner. Figure 3.3 highlights the key points of the VARIM infusion process.
Figure 3.3: The VARIM Process [75]
57
The infusion process was carried out on a clean, dry, scratch-free glass surface.
Acetone was used to do a final clean on the surface, before applying a layer of
wax. This wax was allowed to dry for 5minutes before it was polished and buffed.
The area that was to be used for the resin infusion was then marked off using the
sealant tape. 10x300mmx300mm carbon fibre layers, which were cut from rolls
of carbon fibre were weighed and then carefully placed one sheet at a time directly
onto the waxed glass surface, in a 90°/0° orientation. Any loose threads were
removed.
The peel ply layer was then placed directly over fibres, ensuring to cover all the
fibres completely. The distribution mesh was then placed directly over the peel
ply layer to allow for even distribution of the resin through the fibres. Breather
fabric strips were placed at the suction end to trap excess resin and prevent it
from getting into the resin trap. The vacuum plastic bag was then placed directly
over, covering the entire setup. This was the crucial step during the infusion
process. The vacuum was then applied to the setup and left to run for 5 minutes,
then the pump was stopped and the setup was allowed to rest for 10mins to check
for any air leaks. Any leaks present could be detected via a drop in pressure which
can be checked on the pressure gauge situated on the vacuum pump. If there
were no leaks then all was set for the infusion. If there were any leaks present
then the seals along the perimeter of the setup would have to be secured again
and all piping checked as well to ensure sufficient clamping. Thereafter the pump
was left running, while preparing the resin, to compress the fibres further and
extract any excess air trapped in the fibres.
The LR 20 resin was weighed out in a glass beaker with a 1:1 ratio to the weight
of the carbon fibre sheets and heated on a hot plate (Heidolph MR Hei-STD) to
70°C. The viscosity of the resin is high at 1500mPa.s and processing of the resin
becomes very difficult, hence it is heated to reduce the viscosity. The nanoclay
Cloisite® 15A was weighed on a precision electronic scale (Boeco Germany, 4
decimal place) at the required concentration of 0wt%, 1wt%, 3wt% and 5wt% of
the epoxy resin plus hardener mixture weight. This was added to the heated resin

58
and homogenized at a rate of 500rpm using the magnetic stirrer hot plate. The
heating of the resin allowed the nanoclays to enter into the resin structure and
bond easily with it. Thermogravimetric analysis has shown that the organic
compound of organoclay deteriorate and breakdown at temperatures of 180°C
[76]. The mixture was maintained at 70°C for 1 hour.
During processing, difficulties infusing were encountered when the nanoclay
concentrations were higher. It was discovered that above 5wt% nanoclay
concentration, the resin and nanoclay mixture became very viscous and this
created problems for the resin flow during vacuum infusion. The resin took too
long to flow through the dense fibres and had difficulty filtering through the layers.
The resin also gelled before reaching the end of the laminate to complete the
infusion process.
The rate of infusion was calculated and it was found that the rate decreased by
26% from 0wt% to 5wt%. Previous research conducted showed best results at
2wt% [48] and 3wt% [46]nanoclay concentrations without fibre and at 3wt% and
5wt% nanoclay concentrations with fibre, hence it was decided to stop at 5wt%
nanoclay concentration. The increment of nanoclay concentration was chosen at
0wt%, 1wt%, 3wt%, and 5wt% as these intervals would provide an adequate
range to work with.
The epoxy resin was removed and allowed to cool to room temperature before
infusion could take place. The translucent colour indicated uniform distribution of
the nanoclays within the epoxy resin mixture. The hardener, LH281 was added to
the epoxy resin nanoclay mixture at a ratio of 70:30 and mechanically stirred for
5mins until the mixture was completely homogenised. During this time the
vacuum pump was still running. The inlet tubing, while still clamped, was slowly
immersed into the beaker with the resin mixture. The clamp was slowly released
and the resin was quickly sucked up into the tubing and into the fibres. This
process for the resin to be completely absorbed by the system was 35mins. The
gel time of the resin mixture is 45mins, as per the data sheets as supplied by the
manufacturer, so this does give the user some flexibility with time. Once all the

59
resin has been absorbed, the inlet tubing was clamped again before any air
ingress into the system could occur. The vacuum pump was left running for 2
hours to extract any excess resin in the system. The next day, 24hrs later, the
vacuum bag was removed from the sealant tape and this released any vacuum
pressure that was still left. The laminate was easily removed from the table due
to the waxed surface. The peel ply, perforated film and distribution mesh were all
removed at one time as they all stuck to the peel ply. The laminate was then left
for 5 days to fully cure before use.
Figure 3.4, shows the complete setup for the resin infusion process as performed
in the composite processing workshop. There is a resin trap between the vacuum
pump and the pipe outlet, which collected any excess resin that got sucked
through the pipe, and hence prevented damage to the pump. The spiral binder
tubing at the inlet and the outlet pipes distributes the flow evenly through the
process.
The cured composite laminates were cut by a CNC machine to the desired
specifications as per ASTM standards.

60
Figure 3.4: Showing the actual Infusion setup used for the CFRP preparation
in the composite processing lab at DUT.
3.2.2 Morphology
3.2.2.1 Transmission Electron Microscope (TEM)
The Transmission Electron Microscope (JEOL 1010 TEM) was used to
investigate the morphology of the organoclay, as shown in figure 3.5.
Sealant tape Spiral tape at
the inlet Inlet infusion point Clamp to prevent any
air ingress after the
resin has been infused
Resin Trap
Vacuum
Pump
Spiral at the outlet of
the Infusion Process

61
Figure 3.5: TEM equipment utilized in this research
The TEM gives the researcher an idea about the distribution and the arrangement
of the nanoclays within the matrix. The ultra-thin specimens were produced via a
process called microtoming. Microtoming was carried out using the Leica EM UC
7 microtome, where very thin samples between 60-150nm thick were cut. These
microtomed specimens were collected hygienically using a flame and then placed
onto filter paper until when required. TEM provided an image showing the
dispersion of the nanoclays within the resin mixture. TEM could only be carried
out on resin samples without the fibre, as the blades were unable to cut through
the fibre during the microtoming process.
Point where the
sample is loaded
Adjustment
panel
Display monitor
Adjustment
panel
CPU for loading
images
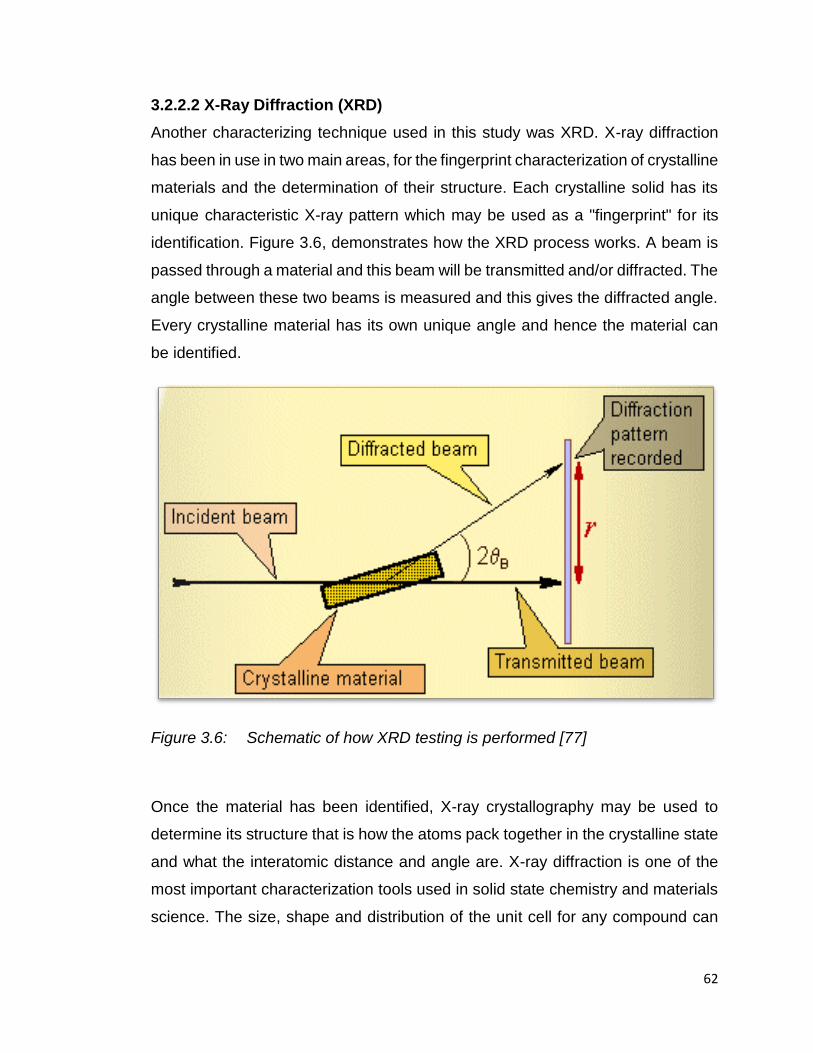
62
3.2.2.2 X-Ray Diffraction (XRD)
Another characterizing technique used in this study was XRD. X-ray diffraction
has been in use in two main areas, for the fingerprint characterization of crystalline
materials and the determination of their structure. Each crystalline solid has its
unique characteristic X-ray pattern which may be used as a "fingerprint" for its
identification. Figure 3.6, demonstrates how the XRD process works. A beam is
passed through a material and this beam will be transmitted and/or diffracted. The
angle between these two beams is measured and this gives the diffracted angle.
Every crystalline material has its own unique angle and hence the material can
be identified.
Figure 3.6: Schematic of how XRD testing is performed [77]
Once the material has been identified, X-ray crystallography may be used to
determine its structure that is how the atoms pack together in the crystalline state
and what the interatomic distance and angle are. X-ray diffraction is one of the
most important characterization tools used in solid state chemistry and materials
science. The size, shape and distribution of the unit cell for any compound can

63
easily be determined using XRD. The sample is crushed into a fine powder state
and then placed into the crucible for XRD characterization.
The basal spacing or d-spacing may be determined using Bragg’s equation. This
is the distance between basal layers of the MMT molecule.
Equation 3.1: Bragg’s equation
𝑑 = 𝜆
2 sin 𝜃 (3.1)
XRD is used to calculate this interlayer d-spacing [11].
3.2.3 Mechanical Testing
Before the experimental work could begin, the specimens needed to be prepared
in accordance with the relevant ASTM standard. The following section describes
the manufacturing process for the specimens for each of the tests, the test
methods and the equipment that was utilized.
3.2.3.1 Hardness Testing
The laminate created above was cut as per ASTM D 2583-07 [78] to produce
specimens to be used for the hardness tests. The sample size here was
250x25x2mm. The hardness test was performed using Barcol Impressor GYZJ
934-1.
Verification was required with predetermined discs of values 45-48 and 87-89
before commencing the testing. The hardness check was done using the Barcol
meter and if the value falls within this range then the unit is calibrated and testing
can commence. The verification process needed to be done each time before
using the equipment. Testing was then performed on the composite specimens
of 0wt% to 5wt%. As per the ASTM standard, up to 10 checks needed to be
performed on various points along the sample in order to get a true estimate of
the hardness value of the entire sample.

64
Hardness measurements quantify the resistance of a material to plastic
deformation. Indentation hardness tests compose the majority of processes used
to determine material hardness, and can be divided into two classes:
microindentation and macroindentation tests. Microindentation tests typically
have forces less than 2 N (0.45 lbf). Hardness, however, cannot be considered to
be a fundamental material property. Instead, it represents as pointed out by
Meyers et al [79], an arbitrary quantity used to provide a relative idea of material
properties.
3.2.3.2 Impact Testing:
The Impact test was performed using the Charpy Impact tester. Testing was done
here also on a predetermined sample and if the value fell within the acceptable
range, then testing commenced.
Impact testing laminate was created as per the ASTM standard D6110-04 [80].
The sample size here was 127x12.7x2mm. Specimens were cut and prepared
using the circular saw and notches with an angle of 22° were inserted in the
middle of the sample, using a precision scale, as per Figure 3.7.
Figure 3.8 shows the actual test equipment that was used to perform the Charpy
test. The two arms at the top were released and the sample was broken. The
force required to break the sample was recorded.
This is a standardized high strain-rate test which determines the amount of energy
absorbed by a material during fracture. Tough materials absorb a lot of energy,
whilst brittle materials tend to absorb very little energy prior to fracture [81].

65
Figure 3.7: Charpy test specimen, showing the “V” notch in the middle of the
sample. [82]
Figure 3.8: The Charpy test equipment

66
3.2.3.3 Fibre Volume Fraction
Fibre volume fraction is the percentage of fibre volume in the entire volume of a
fibre-reinforced composite material. Manufacturing processes for components
made from thermoset composites usually require the optimal achievement of two
physical properties. The first is the fibre volume fraction which determines the
composites strength. The second property is the void content found within the
matrix resin. During the lay-up process the presence of voids is inevitable. A high
void content indicates that the resin has not thoroughly embedded the fibres,
resulting in the deterioration of properties.
Test methods determine the constituent content of the composite materials by
removing the matrix by digestion or ignition leaving the reinforcement essentially
unaffected. This allows for an accurate determination of the fibre volume fraction.
Typical fibre volume fractions are shown in Table 1.1 below, which highlights that
the optimum fibre volume fraction for woven carbon fibre is 45 %. However with
the VARIM system, this value can get higher, up to 55%.
Table 3:1: Typical Fibre Volume Fractions [83]
Reinforcement form Possible range of fibre
volume fractions (%)
Typical value for fibre
volume fraction (%)
Unidirectional 50 – 70 60
Woven 35 – 55 45
Random Mat 10 - 30 20
Once the laminates have been processed, they are analyzed for fibre volume
fraction. This can be carried out in two methods, one using the direct calculation
using the actual volumes of the fibre and the resin volume utilized to create the
laminate during processing.

67
Equation 3.2: Fibre volume fraction
𝑉𝑓 = 𝐹𝑖𝑏𝑒𝑟 𝑤𝑒𝑖𝑔ℎ𝑡
𝐹𝑖𝑏𝑒𝑟 + 𝑟𝑒𝑠𝑖𝑛 𝑤𝑒𝑖𝑔ℎ𝑡 (3.2)
Using Equation 3.2, the Vf was calculated to be 55.6%. The resin weight in the
above equation incorporates the nanoclay and the hardener volumes as well.
The second method is doing an evaluation of the cured laminate and identifying
the actual amount of the fibre and resin present. ASTM D3171 [84] was followed
for this procedure. Procedure A was followed which was the use of Nitric acid,
HNO3, to dissolve the resin and then calculate the amount of fibres left behind.
Five samples were used for each nanoclay percentage to get a representative
average value. The samples were dried in an oven at 50°C for 4 days, which was
how long it took for the samples to reach an equilibrium weight. 100 ml beakers
were filled with 30 ml Nitric Acid and the samples were immersed into this liquid.
The beakers were then placed into a temperature bath at 80°C for 8 hours. At this
point the resin had disintegrated and the fibres remained in the Acid. The fibres
were then filtered using a vacuum suction system and washed with distilled water
to remove any acid that may be present. These fibres were further dried to remove
the water and then weighed. This was done for each nanoclay percentage from
0-5wt%.
Equation 3.2 was then used to calculate the fibre volume fraction. With this
method the average values for each nanoclay percentage was between 49 –
53%.
The Void content was calculated using Equation 3.3:
Equation 3.3: Void content
𝑉𝑣 = 100 − (V𝑓 + Vm) (3.3)
The void content value was negligible which implied that there were little to no
voids present in the laminate itself.

68
3.2.3.4 Tensile Testing:
The equipment utilized for the tensile testing was the universal mechanical testing
machine (MTS), Servo Hydraulic MTS 100 kN at the test rate of 5mm/min.
Calibration is done biannually by an external company, IMP Calibration services
and no further verification was required before utilising the machine for testing.
Tensile testing specimens were prepared using 10 sheets of carbon fibre. The 10
sheets were chosen as the optimum number of sheets after a trial and error
process in order to obtain a thickness of 2 mm, as required by the ASTM standard
3039 [85]. Specimens were cut using a Computer Numerical Control (CNC)
machine with utmost precision. Specimen sizes were 250x25x2mm. Tabs used
were made of glass fibre. The test rate used was 5mm/min. 5 samples of each
0wt%, 1wt%, 3wt%, and 5wt% were tested and the averages were obtained. The
sample was loaded between the jaws of the MTS machine and the load was
continuously increased at a constant rate, until the sample stretched and reached
its breaking point.
The data obtained was the extension and load values, from which the stress and
strain were calculated. The modulus was then calculated from the stress and
strain values.
The extension value, which was the distance that the sample was stretched was
also recorded. The calculated tensile strength and modulus values were used to
calculate the loading rate percentages for the fatigue tests.
3.2.4 Dynamic Testing
3.2.4.1 Fatigue testing specimen
Fatigue test specimens were prepared in a similar way as to the tensile test
specimens and the test method used here was ASTM 3479 [86]. Emery paper,
50x50mm, rather than glass fibre tabs was used as tabs at the end of the
specimens to ensure a firmer grip between the testing equipment jaws and hence
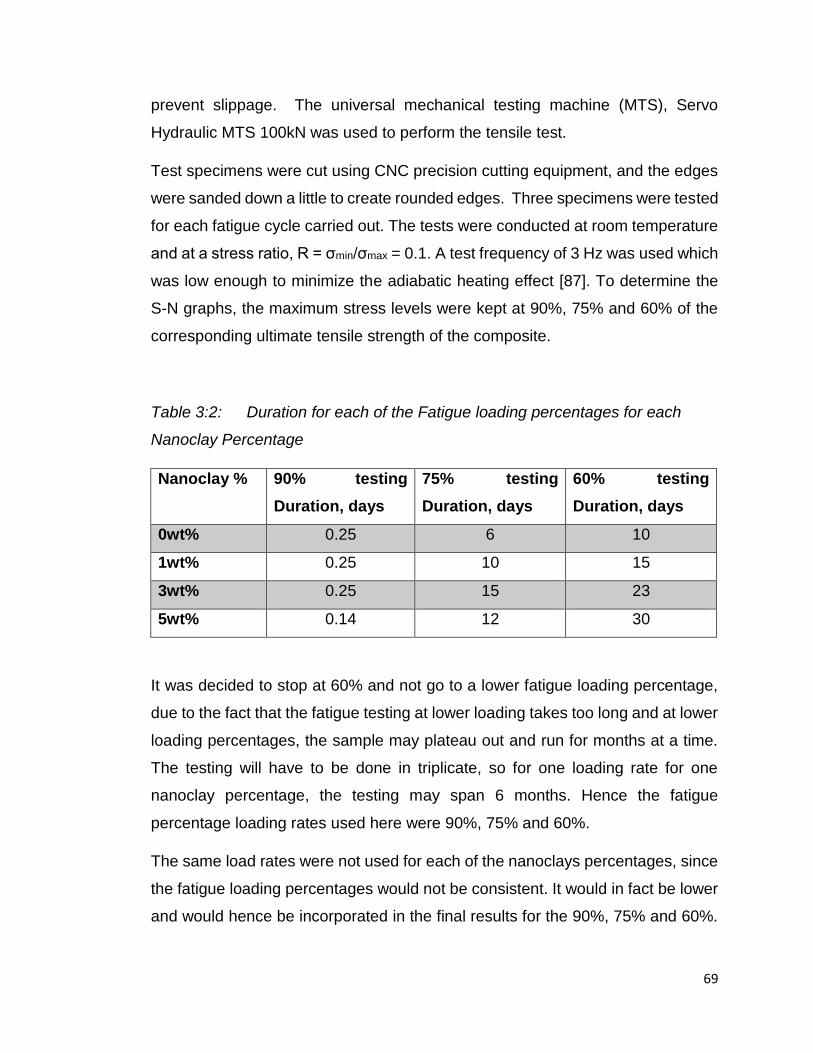
69
prevent slippage. The universal mechanical testing machine (MTS), Servo
Hydraulic MTS 100kN was used to perform the tensile test.
Test specimens were cut using CNC precision cutting equipment, and the edges
were sanded down a little to create rounded edges. Three specimens were tested
for each fatigue cycle carried out. The tests were conducted at room temperature
and at a stress ratio, R = σmin/σmax = 0.1. A test frequency of 3 Hz was used which
was low enough to minimize the adiabatic heating effect [87]. To determine the
S-N graphs, the maximum stress levels were kept at 90%, 75% and 60% of the
corresponding ultimate tensile strength of the composite.
Table 3:2: Duration for each of the Fatigue loading percentages for each
Nanoclay Percentage
Nanoclay % 90% testing
Duration, days
75% testing
Duration, days
60% testing
Duration, days
0wt% 0.25 6 10
1wt% 0.25 10 15
3wt% 0.25 15 23
5wt% 0.14 12 30
It was decided to stop at 60% and not go to a lower fatigue loading percentage,
due to the fact that the fatigue testing at lower loading takes too long and at lower
loading percentages, the sample may plateau out and run for months at a time.
The testing will have to be done in triplicate, so for one loading rate for one
nanoclay percentage, the testing may span 6 months. Hence the fatigue
percentage loading rates used here were 90%, 75% and 60%.
The same load rates were not used for each of the nanoclays percentages, since
the fatigue loading percentages would not be consistent. It would in fact be lower
and would hence be incorporated in the final results for the 90%, 75% and 60%.
70
This is an alternative test method that can be used for comparison purposes.
However the test method utilised in this research work incorporates these values.
3.2.5 Failure Mechanism Analysis
3.2.5.1 Microscopy (Optical and Scanning)
The optical microscope, OM which is often referred to as the "light microscope",
is a type of microscope which uses visible light and a system of lenses to magnify
images of small samples. The image from an optical microscope can be captured
by normal light-sensitive cameras to generate a micrograph. Originally images
were captured by photographic film but modern developments in CMOS and later
charge-coupled device (CCD) cameras allow the capture of digital images. Purely
Digital microscopes are now available which just use a CCD camera to examine
a sample, and the image is shown directly on a computer screen without the need
for eye-pieces [88]. The OM was used on the fractured samples prior to the
scanning electron microscope (SEM) work being undertaken. The OM gave a
good visual of the damaged surface, and allowed the researcher to accurately pin
point the areas to be observed under the SEM.
The Scanning Electron Microscope, SEM is an instrument that produces a largely
magnified image by using electrons instead of light to form an image. The SEM
has many advantages over traditional microscopes. The SEM has a large depth
of field, which allows more of a specimen to be in focus at one time. The SEM
also has much higher resolution, so closely spaced specimens can be magnified
at much higher levels. Since the SEM uses electromagnets rather than lenses,
the researcher has much more control in the degree of magnification. All of these
advantages, as well as the actual strikingly clear images, make the scanning
electron microscope one of the most useful instruments in research today [89].
The equipment used here was the JEOL JEM-7500F (Tokyo, Japan) operated at
an accelerating voltage of 2 kV. The SEM was able to accurately provide details
images of the fibre breakages, hairline crack propagation and of the delamination
that occurred.
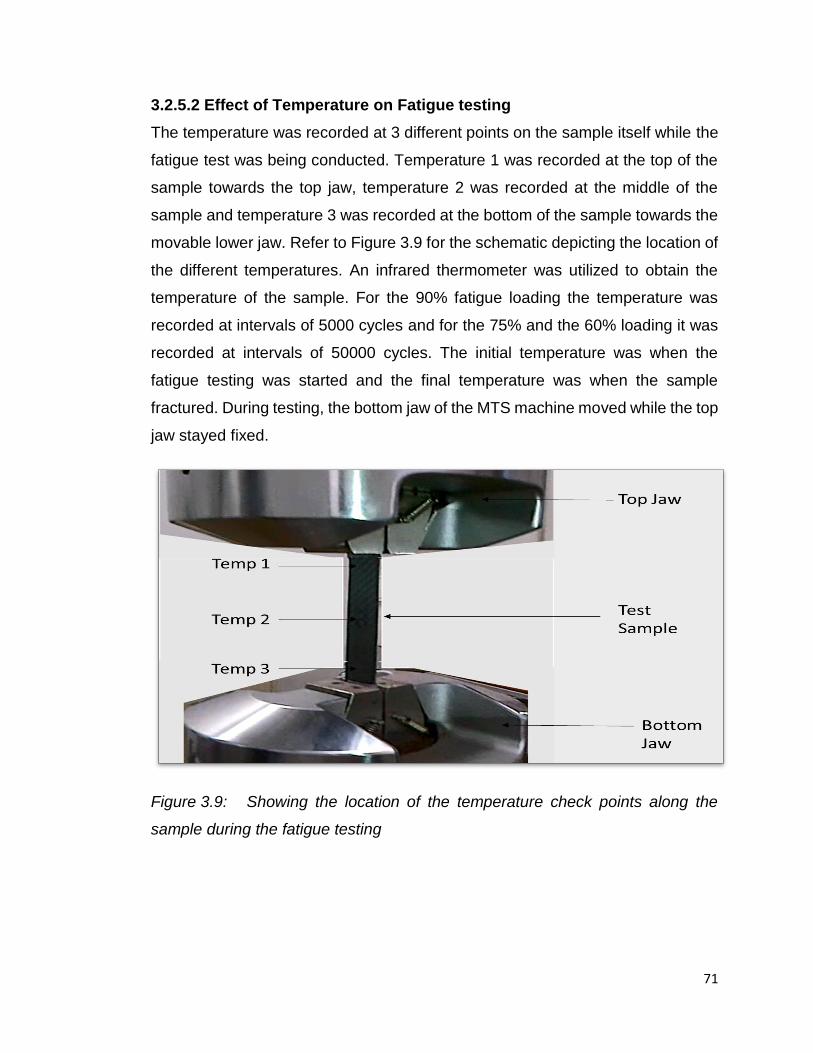
71
3.2.5.2 Effect of Temperature on Fatigue testing
The temperature was recorded at 3 different points on the sample itself while the
fatigue test was being conducted. Temperature 1 was recorded at the top of the
sample towards the top jaw, temperature 2 was recorded at the middle of the
sample and temperature 3 was recorded at the bottom of the sample towards the
movable lower jaw. Refer to Figure 3.9 for the schematic depicting the location of
the different temperatures. An infrared thermometer was utilized to obtain the
temperature of the sample. For the 90% fatigue loading the temperature was
recorded at intervals of 5000 cycles and for the 75% and the 60% loading it was
recorded at intervals of 50000 cycles. The initial temperature was when the
fatigue testing was started and the final temperature was when the sample
fractured. During testing, the bottom jaw of the MTS machine moved while the top
jaw stayed fixed.
Figure 3.9: Showing the location of the temperature check points along the
sample during the fatigue testing

72
3.2.5.3 Fatigue Crack Density Growth
The crack density of the fatigue specimens was investigated during testing. A 25
mm section of the test sample was monitored by visual inspection during the 60%
fatigue loading and the crack initiation and growth was monitored on a daily basis.
3.3 SUMMARY OF CHAPTER
This chapter focuses on the preparation of the CFRP composites with the addition
of nanoclays in the concentration of 0wt%, 1wt%, 3wt% and 5wt% using the
vacuum assisted resin infusion method (VARIM). Static (tensile, Impact,
hardness, double cantilever beam and end notch flexure) and dynamic test
(fatigue) were carried out on the prepared specimens to obtain the life cycle for
the sample. Characterisation and morphological studies were done via XRD, TEM
and SEM.
73
CHAPTER 4
4.1 BACKGROUND
Carbon fibre is used in many applications, mainly because of its low weight to
high strength ratio. The use of carbon fibre panels on aircrafts in particular have
been steadily increasing throughout the years [3]. These aircraft structures are
required to carry sufficient fuel for a single trip. If the composite panels are made
lighter but with the same strength, then the aircraft can increase the number of
passengers that it carries or the fuel consumption significantly decreases.
Numerous studies show the benefit of creating a hybrid structure by adding
nanoparticles into their composite panels, as they provide added strength. In this
study the nanoparticle introduced into the composite is Cloisite® 15A, a
Montmorillonite, MMT. This research study focuses on the fatigue of CFRP and
examines the effect that the nanoclays have on the fatigue life of a composite
structure.
Carbon fibre re-inforced plastic (CFRP) specimen were produced using the
Vacuum Assisted Resin Infusion Method (VARIM). During infusion, a virgin
sample with no nanoclay was produced and Cloisite® 15A nanoclays were added
into the resin mixture, in 1wt%, 3wt%, and 5wt% concentrations to create different
specimens of varying wt% of nanoclay concentration samples. Test samples were
prepared and tests were according to ASTM standards. In this section the results
and discussion of the research study are presented. Morphological analysis look
at the X-Ray Diffraction and TEM analysis of the prepared test specimens. Static
testing look at the tensile test, Barcol Hardness and Charpy tests conducted.
Dynamic testing look at the tension-tension fatigue testing at room temperature.
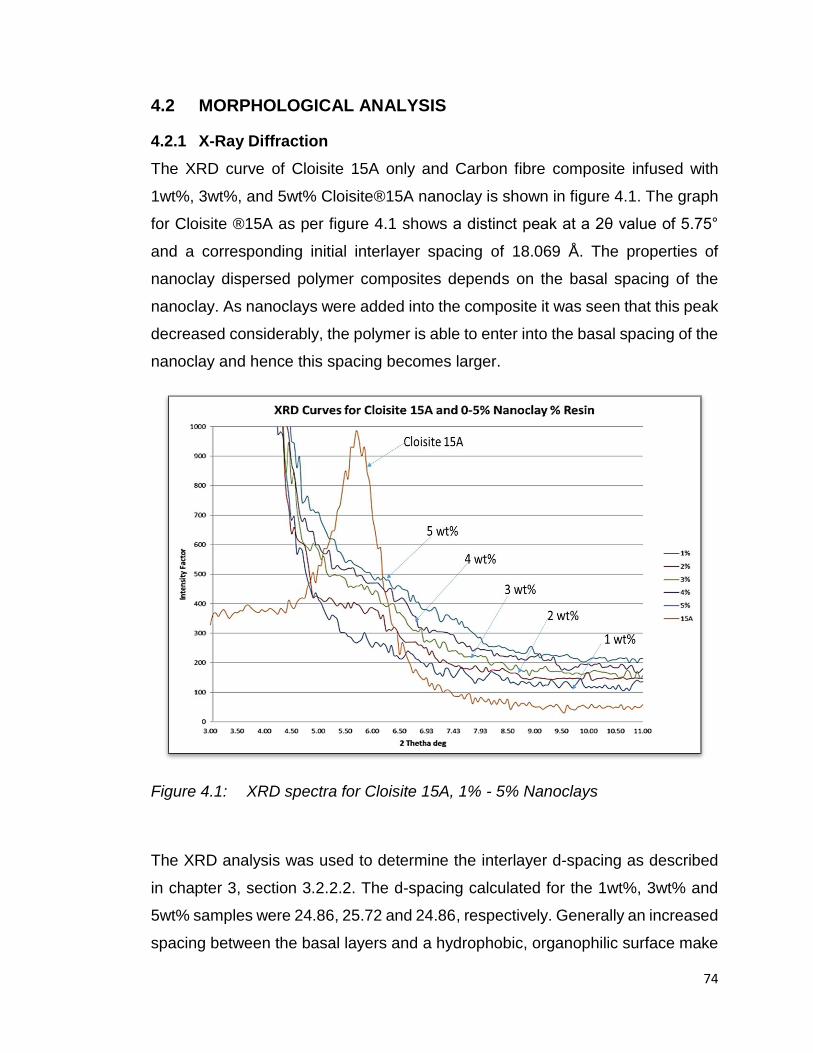
74
4.2 MORPHOLOGICAL ANALYSIS
4.2.1 X-Ray Diffraction
The XRD curve of Cloisite 15A only and Carbon fibre composite infused with
1wt%, 3wt%, and 5wt% Cloisite®15A nanoclay is shown in figure 4.1. The graph
for Cloisite ®15A as per figure 4.1 shows a distinct peak at a 2θ value of 5.75°
and a corresponding initial interlayer spacing of 18.069 Å. The properties of
nanoclay dispersed polymer composites depends on the basal spacing of the
nanoclay. As nanoclays were added into the composite it was seen that this peak
decreased considerably, the polymer is able to enter into the basal spacing of the
nanoclay and hence this spacing becomes larger.
Figure 4.1: XRD spectra for Cloisite 15A, 1% - 5% Nanoclays
The XRD analysis was used to determine the interlayer d-spacing as described
in chapter 3, section 3.2.2.2. The d-spacing calculated for the 1wt%, 3wt% and
5wt% samples were 24.86, 25.72 and 24.86, respectively. Generally an increased
spacing between the basal layers and a hydrophobic, organophilic surface make

75
it more likely for the polymer to enter between the layers of the clay [90]. This
happens when an exchange between the organic ions and the natural clay
particles takes place.
The peak that was present in the Cloisite 15A curve is however absent in the
curves for the nanoclay samples. This indicated that the polymer has entered into
the basal spacing of the nanoclay. The calculation of the basal spacing for the
nanoclay samples showed that the value was higher than that for the Cloisite 15A
only sample, hence this was an indication that the polymer had entered into the
basal spacing.
An exfoliated structure is formed when individual platelets dispersed in the matrix
are separated by distances greater than 8.8 nm and the platelets can be
orientated, forming short stacks [91]. Since the d-spacing increase was greater
than 8.8 nm for all the nanoclay samples, the arrangement can then be described
as exfoliated. However, further analysis in the form of TEM needed to be
performed to confirm this arrangement.
4.2.2 Transmission Electron Microscopy
Figures 4.2a, 4.2b and 4.2c show the TEM image of the 1wt%, 3wt% and 5wt%
nanoclay infused specimens, respectively. Three arrangements are possible
when a composite is infused with nanoclays. The sample can be intercalated,
where the interlayer spacing between the platelets are 1 nm. The sample can be
exfoliated when the individual platelets that are dispersed in the matrix are
separated by distances greater than 8.8 nm and the platelets can be orientated,
forming short stacks or tactoids [92]. An agglomerated clay structure is formed
when no polymer penetrates the interlayer spacing thus forming clustered
platelets. These structures are micron sized particles reminiscent of conventional
micro composite filler materials.
From the XRD results in the above section 4.1, since the peak was absent in all
the nanoclay samples, it can be safely stated that none of the samples have an

76
agglomerated clay structure. The image shown in Figure 4.2a shows a uniformly
distributed 1wt% nanoclay sample. Small concentrated clusters and uniformly
distributed groups are seen. The scattered lighter sections are the voids, which
were created during the VARIM process. During the VARIM process, the resin is
heated to 70°C and the nanoclays are added into this resin mixture. When the
hardener was added, the reaction that took place was exothermic and as such,
air bubbles were created. Although much care was taken to remove these
bubbles, small bubbles were still present and these showed up as voids at a later
stage. Since the distance between the platelets here is more than 8.8 nm, the
structure can be said to be exfoliated.
Figure 4.2a: TEM Image of 1wt% Nanoclay infused composite specimen
Figure 4.2b shows the structure for the 3wt% nanoclay sample. Here the clusters
are bigger than those of the 1wt% sample and also uniformly distributed groups.
The distance here as well between the platelets is greater than 8.8nm, however
there is agglomeration here.
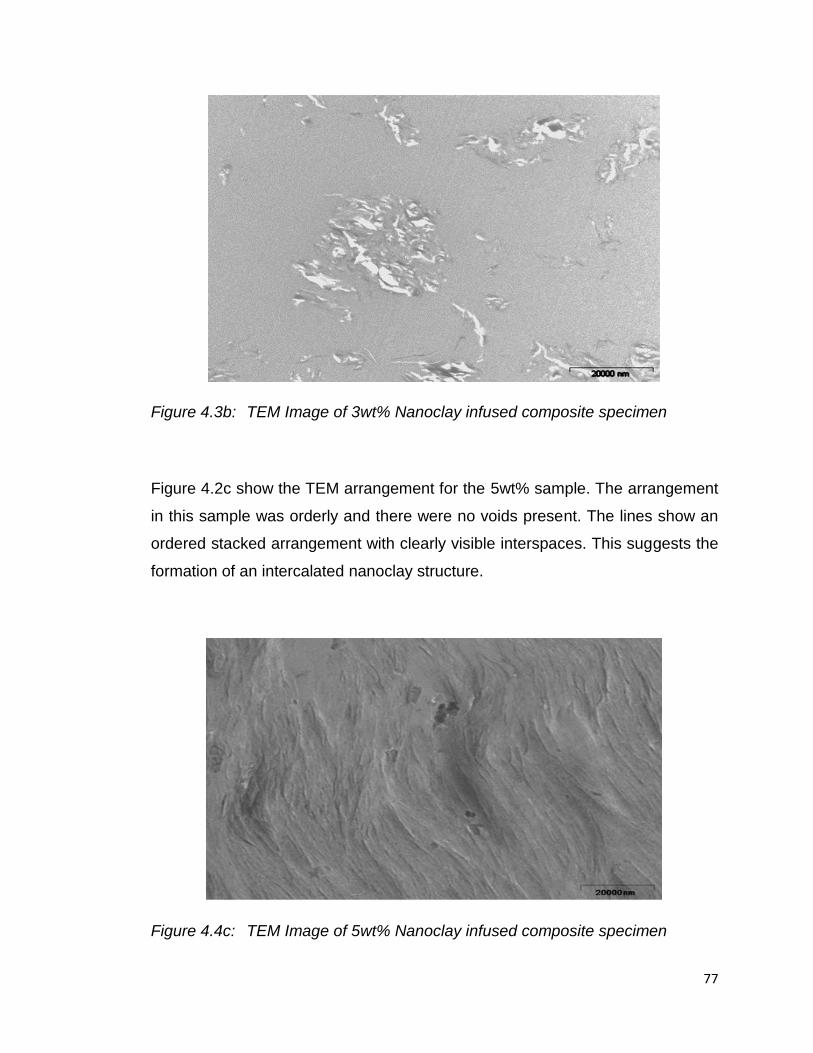
77
Figure 4.3b: TEM Image of 3wt% Nanoclay infused composite specimen
Figure 4.2c show the TEM arrangement for the 5wt% sample. The arrangement
in this sample was orderly and there were no voids present. The lines show an
ordered stacked arrangement with clearly visible interspaces. This suggests the
formation of an intercalated nanoclay structure.
Figure 4.4c: TEM Image of 5wt% Nanoclay infused composite specimen
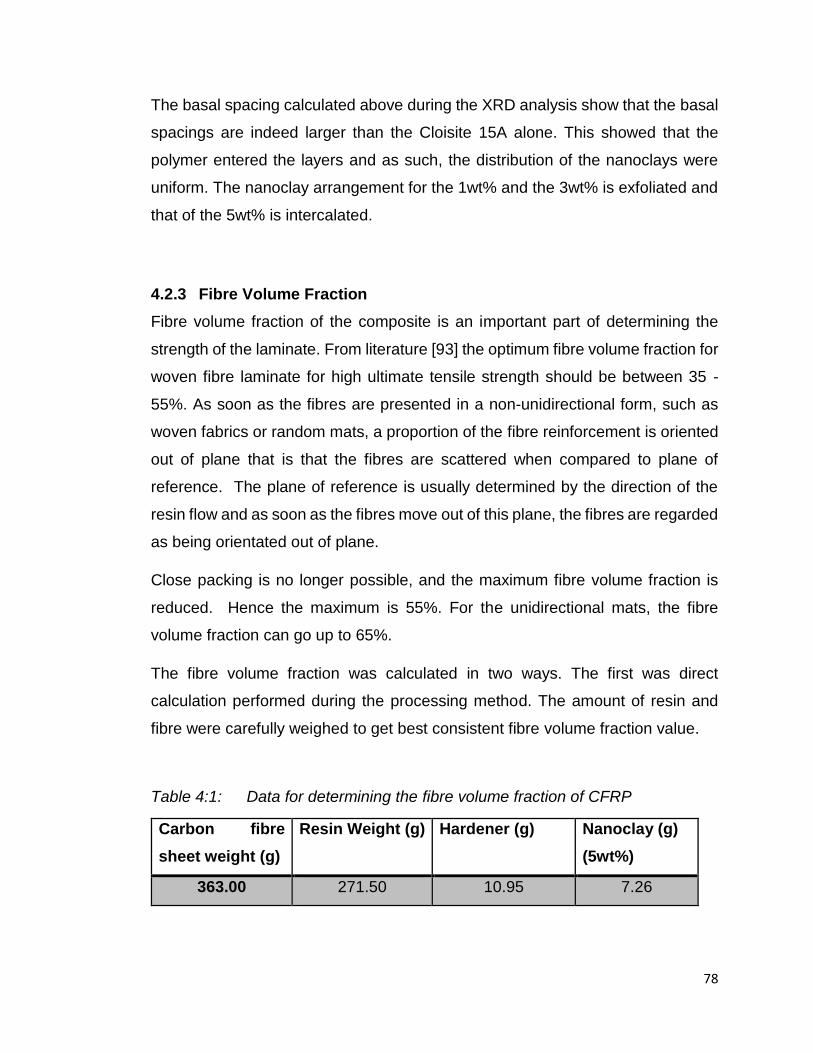
78
The basal spacing calculated above during the XRD analysis show that the basal
spacings are indeed larger than the Cloisite 15A alone. This showed that the
polymer entered the layers and as such, the distribution of the nanoclays were
uniform. The nanoclay arrangement for the 1wt% and the 3wt% is exfoliated and
that of the 5wt% is intercalated.
4.2.3 Fibre Volume Fraction
Fibre volume fraction of the composite is an important part of determining the
strength of the laminate. From literature [93] the optimum fibre volume fraction for
woven fibre laminate for high ultimate tensile strength should be between 35 -
55%. As soon as the fibres are presented in a non-unidirectional form, such as
woven fabrics or random mats, a proportion of the fibre reinforcement is oriented
out of plane that is that the fibres are scattered when compared to plane of
reference. The plane of reference is usually determined by the direction of the
resin flow and as soon as the fibres move out of this plane, the fibres are regarded
as being orientated out of plane.
Close packing is no longer possible, and the maximum fibre volume fraction is
reduced. Hence the maximum is 55%. For the unidirectional mats, the fibre
volume fraction can go up to 65%.
The fibre volume fraction was calculated in two ways. The first was direct
calculation performed during the processing method. The amount of resin and
fibre were carefully weighed to get best consistent fibre volume fraction value.
Table 4:1: Data for determining the fibre volume fraction of CFRP
Carbon fibre
sheet weight (g)
Resin Weight (g) Hardener (g) Nanoclay (g)
(5wt%)
363.00 271.50 10.95 7.26

79
The calculation using the values above, gave a fibre volume fraction of 55.6%.To
further confirm the fibre volume fraction a burn off test was carried out on the fully
infused and cured laminate. ASTM D 3171 – 99 [84], was utilized for this test. The
laminate was placed into nitric acid and the matrix was allowed to dissolve
overnight at a temperature of 70°C. The resultant fibres were then vacuum filtered
at 17kPa and dried in an oven for one hour. These fibres were then weighed and
compared to its original weight. This value was calculated to be 55%. This 1.07%
difference was acceptable.
4.3 QUASI-STATIC TESTING
4.3.1 Tensile
Tensile testing specimens were prepared and testing were carried out as per
ASTM D3039 [85]. Five samples of each nanoclay percentage was tested and
analyzed. The ultimate tensile strength was required from this test so that the
fatigue testing could be carried out. The stress strain graph was plotted as shown
in Figure 4.3 below.
The stress-strain graph for CFRP with 0wt%, 1wt%, 3wt%, and 5wt% nanoclay
concentration all displayed a typical viscoelastic stress strain curve behavior. As
the nanoclay percentage increased the stress and strain factors that the sample
experienced increased as well. The higher nanoclay weight percentage sample,
that was the 5wt% sample showed a 36% better result in terms of tensile stress,
when compared to the 0wt% sample.
The Figure 4.3 shows similar trends for all four samples and the distinct regions
characteristic of tensile testing is not clearly evident here. There is no adjustment
period, however the sample continues to be strained and migrates into the elastic
region. Once the ultimate stress has been reached, the sample fractures.
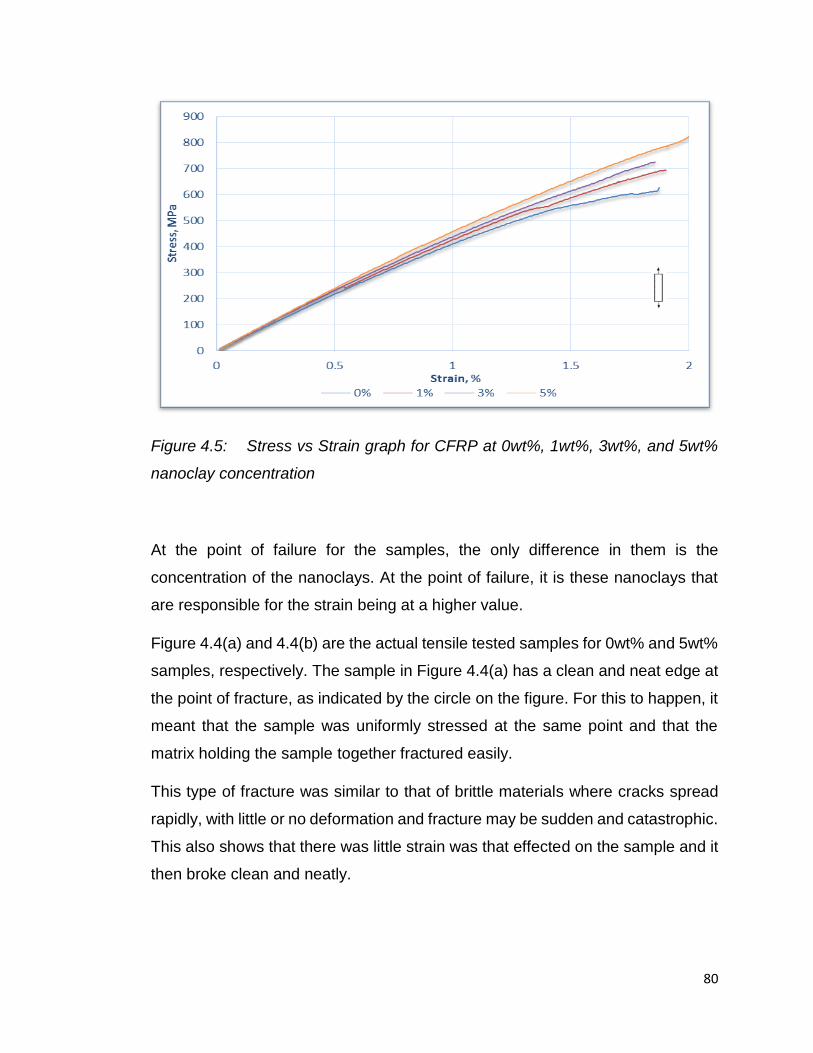
80
Figure 4.5: Stress vs Strain graph for CFRP at 0wt%, 1wt%, 3wt%, and 5wt%
nanoclay concentration
At the point of failure for the samples, the only difference in them is the
concentration of the nanoclays. At the point of failure, it is these nanoclays that
are responsible for the strain being at a higher value.
Figure 4.4(a) and 4.4(b) are the actual tensile tested samples for 0wt% and 5wt%
samples, respectively. The sample in Figure 4.4(a) has a clean and neat edge at
the point of fracture, as indicated by the circle on the figure. For this to happen, it
meant that the sample was uniformly stressed at the same point and that the
matrix holding the sample together fractured easily.
This type of fracture was similar to that of brittle materials where cracks spread
rapidly, with little or no deformation and fracture may be sudden and catastrophic.
This also shows that there was little strain was that effected on the sample and it
then broke clean and neatly.

81
Figure 4.6: a) Tensile fractured sample of virgin nanoclay specimen
In comparison, Figure 4.4(b) showed a different scenario where the fractured
edge was not neat and clean as that for the 0wt% sample. It was however jagged
and uneven and the fracture was not in a straight line. There was also evidence
of fibre separation and delamination that took place. In order for this to happen, it
highlighted that the composite was highly stressed, however it did not fracture at
the exact point where the stress was, which was in the middle of the sample. The
matrix took the strain and deteriorated first, while still keeping the fibres in place.
As the stress continued, the fibres still stayed intact and separated as sheets of
fibre. It was at this point where ultimately the fibre strength determines the
strength of the composite as a whole and the fracture took place.
The strain that the 5wt% sample incurred was twenty percentage higher than that
of the 0wt% sample.
Figure 4.7: b) Tensile fractured sample of 5wt% nanoclay specimen

82
The ultimate tensile strength curve shown in Figure 4.5, showed a similar trend
as with that in Figure 4.4 above. There was a continuous increase in the strength
from the 0wt% sample to the 5wt% sample. The percentage increase was 34%
from 0wt% to 5wt%.
Figure 4.8: Ultimate Tensile Strength graph for CFRP at 0wt%, 1wt%, 3wt%,
and 5wt% nanoclay concentration
The extension indicated the samples ability to be pulled during the process of the
tensile testing. From Figure 4.6 it can be seen that as the nanoclay percentage in
the sample increased, the extent to which the sample can be stretched, also
increased. The strain to failure that the 5wt% sample was able to withstand
enabled it to have a higher strength than the 0wt% sample. This highlights the
crack arresting mechanism of the nanoclays and shows the nanoclays enhanced
capabilities.

83
Figure 4.9: Extension graph for CFRP at 0wt%, 1wt%, 3wt%, and 5wt%
nanoclay concentration
Table 4.2 is a summary of the static tests that were carried out. As the nanoclay
percentage increased so too did the values for each of the static testing
performed.
Table 4:2: Summary of Average Tensile testing results for each nanoclay
concentration
Modulus UTS Extension
GPa Increase
%
MPa Increase % mm
CF + 0wt% NC 44.68 ± 0.6 594.19 ± 10 3.01
CF + 1wt% NC 46.53 ± 0.5 4.16 648.96 ± 12 9.22 2.85
CF + 3wt% NC 48.30 ± 0.7 8.10 671.67 ± 11 13.04 2.80
CF + 5wt% NC 50.76 ± 0.4 13.63 795.73 ± 8 33.92 2.52
From the parameters examined from the tensile testing conducted it can be
established that the 5wt% specimen could withstand the most amount of load and
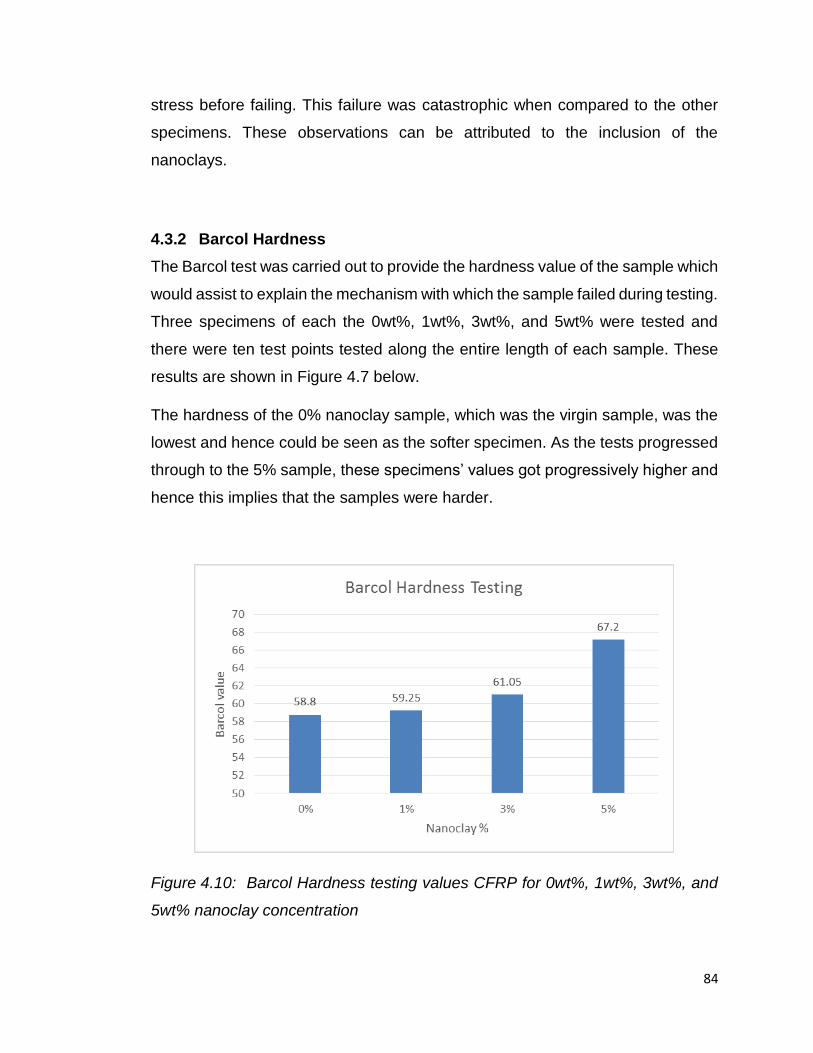
84
stress before failing. This failure was catastrophic when compared to the other
specimens. These observations can be attributed to the inclusion of the
nanoclays.
4.3.2 Barcol Hardness
The Barcol test was carried out to provide the hardness value of the sample which
would assist to explain the mechanism with which the sample failed during testing.
Three specimens of each the 0wt%, 1wt%, 3wt%, and 5wt% were tested and
there were ten test points tested along the entire length of each sample. These
results are shown in Figure 4.7 below.
The hardness of the 0% nanoclay sample, which was the virgin sample, was the
lowest and hence could be seen as the softer specimen. As the tests progressed
through to the 5% sample, these specimens’ values got progressively higher and
hence this implies that the samples were harder.
Figure 4.10: Barcol Hardness testing values CFRP for 0wt%, 1wt%, 3wt%, and
5wt% nanoclay concentration

85
According to Pavlini etal [94], indentation hardness correlates linearly with the
tensile strength. This was very evident in the results shown in Figure 4.7. The
Barcol tester tests the surface of the sample and stopped when there was an
indentation on the surface of the specimen. The nanoclays are bonded to the fibre
and the matrix intrinsically, this was evident in the values obtained for the Barcol
test. It takes a higher value for the indenter to create an indent in the specimen
as the nanoclay concentration increased.
Meyers etal [79] stated that the hardness can only offer a comparative idea of the
material's resistance to plastic deformation and this was what will determine the
brittleness of the specimen. From the tests carried out with the Barcol tester, it
could be concluded that as the nanoclay concentration in the specimens
increased, so too did the hardness value and hence as the nanoclay percentage
in the specimen increased, the specimen becomes brittle.
4.3.3 Charpy Impact
The impact test can be identified as the amount of energy absorbed by a
specimen during fracture. As the specimen was hit or “impacted”, it absorbed the
energy to the point where it could not absorb anymore and then this impact
continued to break the specimen. The sample size for this test tended to be higher
than the five recommended, as per Mills [95], due to the possible inconsistencies
in the notch angle, notch size and the sample size that can greatly affect the
results. The number of samples used here was six samples, as recommended by
Mills.
The graph for the Impact testing as shown in Figure 4.8 showed a downward
trend from 0wt% to 5wt% nanoclay concentration. This trend was opposite to that
of the Tensile and the Barcol testing. The 5wt% specimen test had the lowest
value. The nanoclays present in the specimens in the matrix and have left little
room for the absorption of any energy. The 5wt% specimens fractured off neatly

86
at the 22° angle notch, while the other nanoclay percentage specimens broke in
several pieces and flew off into different directions.
The qualitative results of the impact test can be used to determine the ductility of
a material, according to Mathurt etal [96]. If the material broke on a flat plane, the
fracture was brittle, and if the material broke with jagged edges or shear lips, then
the fracture was ductile. Usually a material does not break in just one way or the
other, and thus comparing the jagged to flat surface areas of the fracture would
give an estimate of the percentage of ductile and brittle fracture [94].
Figure 4.11: Impact testing of CFRP for 0wt%, 1wt%, 3wt%, and 5wt%
nanoclay concentration
Each of the six specimens tested for the 5wt% samples, had neat, clean breaks
and as per Mathurt etal [96], this is synonymous of a brittle sample. Figure 4.9
shows the 5wt% Impact sample with the V-Notch before and after the testing was
carried out. Figure 4.10 shows the 0wt% and 1wt% fractured sample after testing.

87
Figure 4.12: Image of the 5wt% impact sample a) before testing and b) after
testing
Figure 4.13: Showing the 0wt% and 1wt%, uneven jagged fracture edge, after
testing
The fractured edge was straight, which supports Mathurt etal theory about the
higher nanoclay samples, in this case the 5wt% sample, being brittle. When
compared to Figure 4.9, the fractured edges in Figure 4.10 can be seen to be
jagged and have rough fractured edges. The impact tests further confirm that as
the nanoclay percentage increased, so too did the brittleness of the composite.
The results for the Barcol hardness and the Impact Testing results are tabulated
below. There was a percentage increase between each nanoclay percentage for
all the results.

88
Table 4.3: Average Barcol Hardness and Impact Results
Nanoclay % Barcol Hardness % Increase Impact (J) % Increase
0wt% 58.80 4.75
1wt% 59.23 1% 4.52 5%
3wt% 61.05 3% 4.23 6%
5wt% 67.20 10% 3.84 9%
4.4 DYNAMIC TESTING: FATIGUE
With only very low fractions of clay, including the enhanced thermal stability [97,
98], clay-epoxy nanocomposites showed a wide array of property improvements,
reduced moisture and gas permittivity [99] and superior flame retardancy [100].
The nanoclay, in particular, which was Cloisite15A, exhibited ameliorating effects
on fracture and fatigue resistance of CFRPs.
4.4.1 Tension-Tension Fatigue Testing
The S-N graphs for each of the fatigue loading that was the 90%, 75% and the
60% are combined and are represented below in Figure 4.11.
For each of the fatigue loading percentages, the mean of the five samples tested,
were plotted and error bars are included to show the scatter. A trend line was
passed through the points, in order to obtain an accurate as possible trend for
each fatigue loading. The 0wt% sample fractured at a lower load when compared
to the 1wt%, 3wt% and 5wt% samples. The 1wt% and 3wt% samples fractured at
higher cycles when compared to the 5wt% sample. The 5wt % specimen became
progressively better as the fatigue loading percentage decreased and this
resulted in the 5wt% sample having a highest fatigue life cycle. This is a desirable
quality in all products.

89
Figure 4.14: S-N graph for 90%, 75% and 60% fatigue loading for 0wt%, 1wt%,
3wt% and 5wt%
Table 4.4 shows the mean cycles for each fatigue percentage loading and for
each nanoclay percentage with their deviations.
Table 4.4: Fatigue Results showing the number of cycles for 90%, 75% and
60% fatigue loading
Nanoclay
%
90% Fatigue
Loading
75% Fatigue
Loading
60% Fatigue
Loading
0wt% 35110 ± 1018 931518 ± 58951 1830476 ± 17929
1wt% 46764 ± 586 989518 ± 22206 2640130 ± 155033
3wt% 58904 ± 717 1850969 ± 74517 3537201 ± 171714
5wt% 2286 ± 70 961580 ± 59963 5373984 ± 142676

90
At the 90% fatigue loading, the number of cycles for each nanoclay percentage
sample increased until the 3wt% sample, which had a maximum life cycle of
58904 cycles. The 5wt% sample fractured early at 2286 cycles. This was
attributed to the brittle quality of the CFRP as the nanoclay concentration
increased. Note that five samples were tested for the 5wt% sample and all five
samples behaved in a similar manner.
At the 75% loading, a similar trend was observed where the 3wt% sample again
performed better than the 0wt% and 1wt% nanoclay percentages. At the 5wt%
sample, the number of cycles to failure dropped again as with the 90% fatigue
loading. The number of cycles to failure and the fracture mechanism for the 5wt%
sample was not sufficient enough to determine that the sample exhibited brittle
fracture.
At the 60% fatigue loading, the 5wt% sample ran for the most amount of cycles,
performing 52% better than the 3wt% sample and 194% better than the 0wt%. A
graphical representation of the time of fracture within the fatigue life cycle of the
sample was depicted in the diagram in figure 4.12 below.
All the 90% loading samples fractured less than the 100K life cycle mark. For the
75% loading, it could be noticed that the number of fatigue cycles start in the 1M
life cycle region. It should be noted that the 3wt% sample fatigue life was the best
in the 75% loading. In the 60% loading the samples follow a trend as per the
tensile testing, where they become progressively better as the nanoclay
percentage increased.

91
Figure 4.15: Fatigue Cycle Failure at 90%, 75% and 60% loading at a constant
frequency of 3Hz for 0, 1, 3 and 5 wt% nanoclay specimens
Taking out the effect of the specimen area, it could be seen that Figure 4.13 looks
very similar to that in Figure 4.11.
The graph for the 0wt% and the 1wt% are almost parallel in the normalized graph.
And a similar trend is observed for the 3wt% and the 5wt% when compared to
figure 4.11. It could therefore be stated that the above graph can be useful for any
sized CFRP sample. The results presented above are the actual number of cycles
to fracture for each of the fatigue loading rates and for each of the nanoclay
percentages.
Fatigue
Loading
Nanoclay
Percentage< 100K 500K 1000K 1500K 2000K 2500K 3000K 3500K 4000K 4500K 5000K 5500K 6000K
0wt%
1wt%
3wt%
5wt%
0wt%
1wt%
3wt%
5wt%
0wt%
1wt%
3wt%
5wt%
Number of Fatigue Cycles
90%
75%
60%
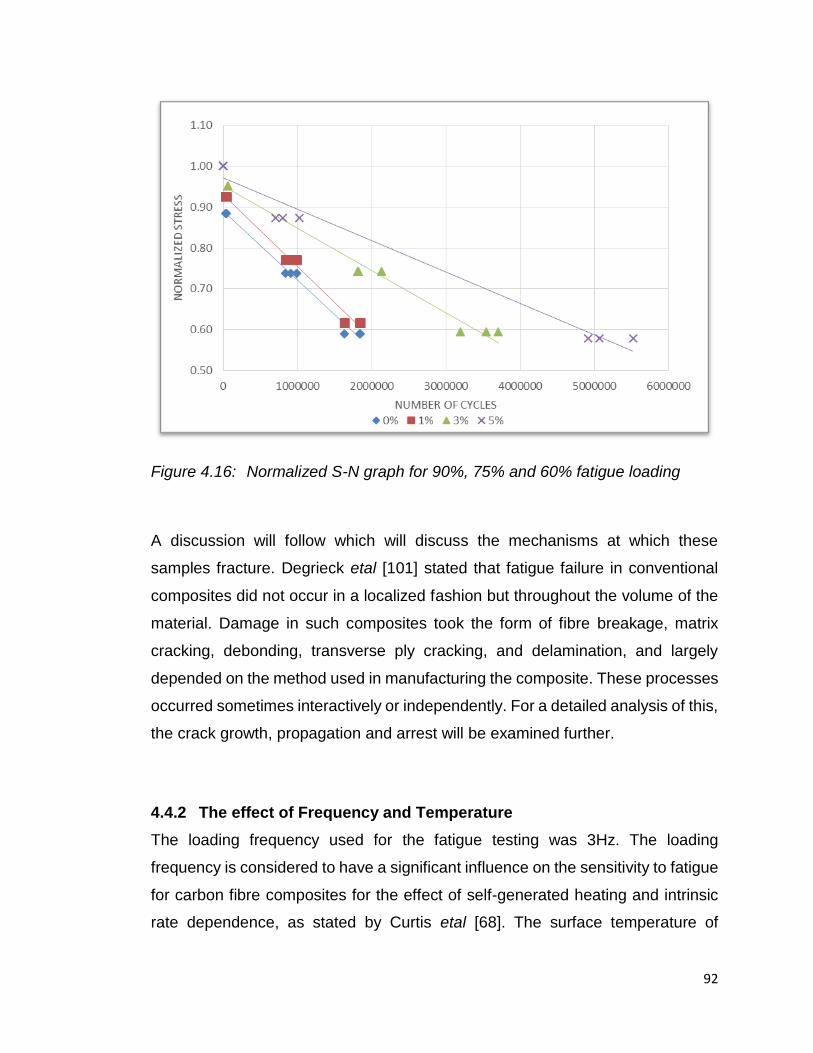
92
Figure 4.16: Normalized S-N graph for 90%, 75% and 60% fatigue loading
A discussion will follow which will discuss the mechanisms at which these
samples fracture. Degrieck etal [101] stated that fatigue failure in conventional
composites did not occur in a localized fashion but throughout the volume of the
material. Damage in such composites took the form of fibre breakage, matrix
cracking, debonding, transverse ply cracking, and delamination, and largely
depended on the method used in manufacturing the composite. These processes
occurred sometimes interactively or independently. For a detailed analysis of this,
the crack growth, propagation and arrest will be examined further.
4.4.2 The effect of Frequency and Temperature
The loading frequency used for the fatigue testing was 3Hz. The loading
frequency is considered to have a significant influence on the sensitivity to fatigue
for carbon fibre composites for the effect of self-generated heating and intrinsic
rate dependence, as stated by Curtis etal [68]. The surface temperature of

93
specimens increase rapidly in the intermediate number of cycle range of 10,000
cycles and the increase in surface temperature was larger than 20°C, as observed
by Pandita etal [69]. The magnitude of the change of the surface temperature
depended on the fibre orientation as well as maximum fatigue stress. It was found
that 2Hz offered the most consistent temperature profile, while 10Hz offered the
highest temperature profile range.
The temperature was recorded at 3 different points on the sample itself while the
fatigue test was being conducted. Temperature 1 was recorded at the top of the
sample towards the top jaw, temperature 2 was recorded at the middle of the
sample and temperature 3 was recorded at the bottom of the sample towards the
movable lower jaw. Table 4.5, 4.6 and 4.7 show the surface temperature at points
1 (Top Jaw), 2 (Middle Jaw) and 3 (Bottom Jaw) for each fatigue percentage
loading rate and for each nanoclay percentage.
Table 4:5: Temperature increase of the test sample during Fatigue Testing –
Temperature 1
Sample Temperature Increase (Temp 1)
90% 75% 60%
Temperature, °C Temperature, °C Temperature, °C
Initial Final % ↑ Initial Final % ↑ Initial Final % ↑
0wt% 25.2 25.8 2% 25.1 31 24% 25.0 33.5 34%
1wt% 24.5 25.1 2% 25.1 30 20% 25.3 33.6 33%
3wt% 24.7 25.7 4% 25.3 31.8 26% 25.1 33.8 35%
5wt% 25.3 25.9 2% 25 30.2 21% 25.2 36.2 44%

94
Table 4.6: Temperature increase of the test sample during Fatigue Testing –
Temperature 2
Sample Temperature Increase (Temp 2)
90% 75% 60%
Temperature, °C Temperature, °C Temperature, °C
Initial Final % ↑ Initial Final % ↑ Initial Final % ↑
0wt% 25.2 27.8 10% 25.1 31.8 27% 25 33.8 35%
1wt% 24.5 27.0 10% 25.1 32.1 28% 25.3 34.7 37%
3wt% 24.7 27.6 12% 25.3 32.2 27% 25.1 34.5 37%
5wt% 25.3 26.0 3% 31.4 31.4 26% 25.2 37.2 48%
Table 4.7: Temperature increase of the test sample during Fatigue Testing –
Temperature 3
Sample Temperature Increase (Temp 3)
90% 75% 60%
Temperature, °C Temperature, °C Temperature, °C
Initial Final % ↑ Initial Final % ↑ Initial Final % ↑
0wt% 25.2 28.3 12% 25.1 32.2 28% 25 36.8 47%
1wt% 24.5 27.3 11% 25.1 32.8 31% 25.3 36.5 44%
3wt% 24.7 28.0 13% 25.3 32.6 29% 25.1 36.9 47%
5wt% 25.3 26.1 3% 25 31.9 28% 25.2 37.5 49%
As the fatigue loading rate decreased the surface temperature of the sample
increased and it can be seen that this trend occurred for all the tests carried out.
The increase in surface temperature at point 3, which was the stationary jaw was
the highest. The maximum temperature increase was noted to be 12°C. As
observed by Pandita etal [69], the surface temperature increase of 20°C was
sufficient enough in order to effect the test sample and hence the results. Since
the surface temperature increase for the samples tested in this research work

95
was only 12°C, it can be stated that the temperature effect did not affect the
fatigue results.
The surface temperature rate increase was 2.6°C/hr for 90% fatigue loading,
0.135°C/hr for 75% fatigue loading and 0.046°C/hr for the 60% fatigue loading.
This low rate of temperature increase, was negligible to effect any changes to the
fatigue results.
Figure 4.14, below show the temperature increase at each fatigue loading rate at
the three different temperature test points on the jaw of the MTS Machine. The
figure show the increase in the surface temperature of the test sample being the
highest at the lowest fatigue percentage loading rate and at the bottom stationary
jaw. The 60% fatigue loading has the total highest temperature increase due to
the test running for an average duration of 21 days.
Figure 4.17: Showing temperature increase during fatigue testing
The nanoclay arrangement of the 1wt% and the 3wt% is exfoliated and that of the
5wt% sample is intercalated, as discussed in Chapter 4, section 4.2.2. The

96
intercalated nanoclay arrangement, and in this case, a brittle material, performs
better during 60% fatigue loading, than the 75% and 90% fatigue loading. It can
be inferred that a slow rate of heat generation and the high fatigue loading - does
not favour brittle materials hence the short fatigue cycle at the 90% fatigue loading
and that a slow rate of heat generation and low fatigue loading of 60% - favours
brittle materials.
4.4.3 Fatigue Crack Growth
Crack propagation during fatigue loading is one of the primary causes of failure
in engineering materials. While this was inevitable, it was helpful to ascertain a
trend that will determine the long term effects and life span of materials that
undergo fatigue loading. Mandel [102] postulated a way to calculate the
degradation rate of the samples, by calculating the slope first, using the fatigue
data and then by calculating the percentage degradation from this. In order to
calculate the slope the following equation was used:
Equation 4.1: Fatigue Slope Calculation
𝑏 =𝜎𝑚𝑎𝑥− 𝜎𝑈𝑇𝑆
𝑙𝑜𝑔 𝑁𝑓 [4.1]
Where σmax is the maximum stress, σUTS is the stress at the various fatigue loading
rates, b is the slope and Nf is the number of fatigue cycles at the point of fracture.
Table 4.8 shows the values for the slope of the fatigue curves. It can be noted
that as the nanoclay percentage increased within each fatigue loading, the slope
of the curve also increased. Thereafter the degradation rate was calculated. For
the 90% fatigue loading the rate decreased until the 3wt% sample and then it
increased at the 5wt% sample. This tied up with the 5wt% sample fracturing
earlier than the other samples. For the 75% sample there was a similar trend. For
the 60% fatigue testing, it could be seen that as the nanoclay percentage
increased, the rate of degradation decreased, even in the 5wt% sample. From the

97
0wt% sample to the 5wt% samples, there was a 7.44% decrease in the rate of
degradation.
Table 4.8: Degradation rates of fatigue samples
90% 75% 60%
b (Slope) σuts /b b (Slope) σuts /b b (Slope) σuts /b
0 wt% 13 2.44% 25 5.59% 39 10.67%
1 wt% 14 2.36% 27 5.56% 41 10.41%
3 wt% 14 2.33% 27 5.30% 42 10.19%
5 wt% 21 3.00% 34 5.63% 47 9.93%
If the curves for each of the nanoclay percentages were extrapolated to include
lower fatigue loading percentages, it could be seen that the lower percentages,
0wt%, 1wt% and 3wt% will reach a finite life cycle value. However the 5wt%
sample would continue and eventually plateau, giving the 5wt% sample at the
60% fatigue loading an infinite life cycle.
4.4.4 Fatigue Crack Density Growth
The crack density of the fatigue specimens were investigated during testing. A 25
mm section of the test sample was monitored by visual inspection during the 60%
fatigue loading and the crack initiation and growth was monitored on a daily basis.
The results are presented below in Figure 4.15.
The rate of crack growth in the 0wt% sample was faster than that in the 1wt% and
5wt% samples. Although the crack density of the 1wt% and 3wt% are lower at
lower cycle levels, they slowly pick up as the number of cycles continue. The slow
rate of the crack density can be attributed to the inclusion of the nanoclays into
the samples. All samples were prepared in the same way the only difference
between them was the percentage of nanoclays within the samples.
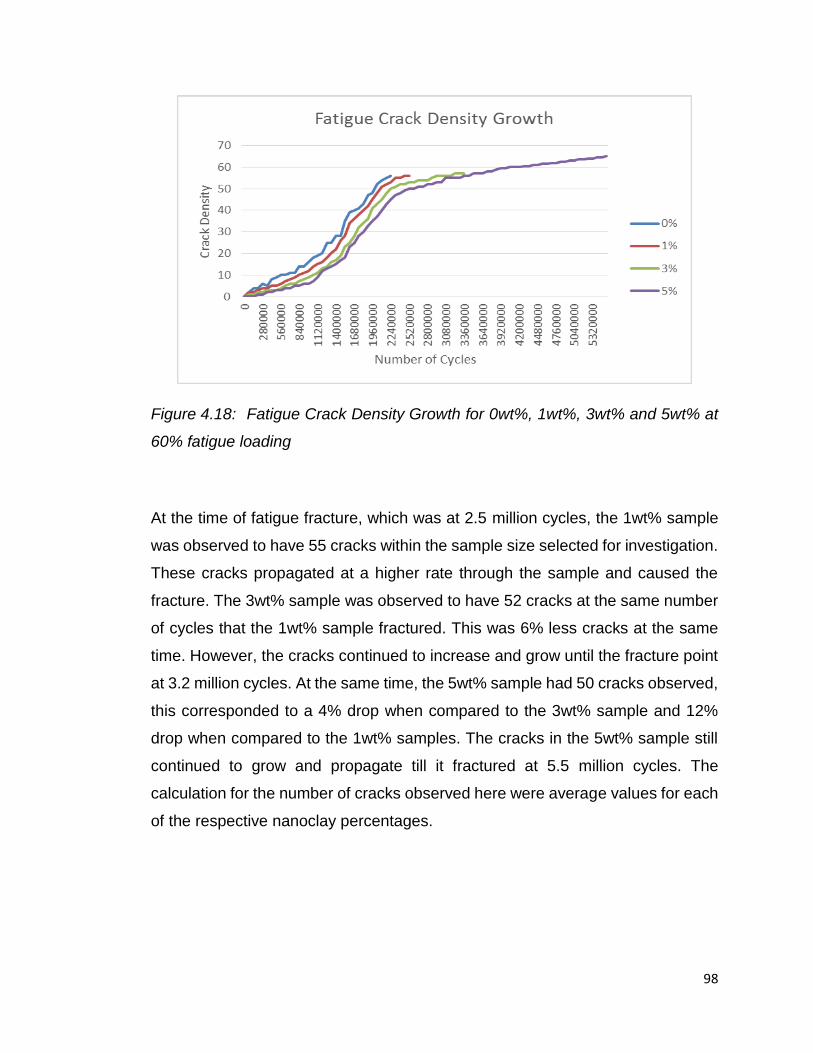
98
Figure 4.18: Fatigue Crack Density Growth for 0wt%, 1wt%, 3wt% and 5wt% at
60% fatigue loading
At the time of fatigue fracture, which was at 2.5 million cycles, the 1wt% sample
was observed to have 55 cracks within the sample size selected for investigation.
These cracks propagated at a higher rate through the sample and caused the
fracture. The 3wt% sample was observed to have 52 cracks at the same number
of cycles that the 1wt% sample fractured. This was 6% less cracks at the same
time. However, the cracks continued to increase and grow until the fracture point
at 3.2 million cycles. At the same time, the 5wt% sample had 50 cracks observed,
this corresponded to a 4% drop when compared to the 3wt% sample and 12%
drop when compared to the 1wt% samples. The cracks in the 5wt% sample still
continued to grow and propagate till it fractured at 5.5 million cycles. The
calculation for the number of cracks observed here were average values for each
of the respective nanoclay percentages.

99
4.4.5 Crack Initiation and Propagation
Before a crack can initiate there would be prior toughening mechanisms that will
take place, like crack deflection, micro crack toughening, transformation
toughening, crack bridging and particle toughening. These phenomena halt the
crack initiation, until such time that the stress becomes too large for these
phenomena to overcome, and a crack is initiated.
See Figure 4.16 for the tension-tension fatigue specimen for 1wt% at 60% fatigue
loading. After 1.6 Million cycles and after ~seven days, visible cracks could be
seen, towards one edge only. The white marks are representative of micro-cracks
that form beneath the surface and that has travelled through the fibre layers and
the matrix and has surfaced. After each day, the amount of white lines increased
until after eleven days, the sample eventually fractured. The micro cracks that
occurred coalesced with each other to form larger cracks and these propagated
through the sample. The 1wt% sample was not as densely packed with nanoclays
as the 5wt% specimen, so the cracks were able to initiate and propagate to the
surface, with relative ease.
Figure 4.19: Crack Initiation and propagation of 1wt% specimen at 60% fatigue
loading

100
Figure 4.17 displays the specimens for the 5wt% sample at various intervals of
fatigue cycles. The micro-cracks here appear a lot more abundantly as when
compared to the 1wt% sample. These micro cracks delay in the coalescing of
larger cracks and this delay can be attributed to the nanoclays present in the
matrix. The 5wt% sample was densely packed with the nanoclays and when the
cracks propagate, they make contact with a nanoclay and the crack was arrested.
As the number of cycles increased, the cracks were able to propagate through or
around the nanoclay and reach the surface where they formed larger cracks. Here
as well the nanoclays served to delay the process and eventually the cracks
propagated and the sample fractured.
Figure 4.20: Crack Initiation and propagation of 5wt% specimen at 60% fatigue
loading
Fatigue occurs when a material is subjected to repeated cyclic loading and
unloading. If the loads are above a certain threshold, microscopic cracks will
begin to form at the stress concentrators such as the surface, persistent slip
bands (PSBs), and grain interfaces. Kim and Laird [103] stated that, a crack will

101
initiate, the crack will grow and eventually the crack will reach a critical size, the
crack will propagate, and the structure will fracture.
The 1wt% sample when compared to the 5wt% sample, shows that the cracks
initiate and propagate quickly. The cracks as shown in the SEM image in Figure
4.18a also propagated in straight lines, this showed that the sparsely distributed
nanoclays did not hinder the crack path. And that these cracks occurred even
through the woven structure, in a straight line.
The cracks in the 5wt% sample in Figure 4.18b, deflected in different directions
and the cracks also caused delamination through the fibre layers. Ritchie [104]
stated that crack propagation was a mutual competition between intrinsic
microstructural damage mechanisms, which promoted crack extension ahead of
the tip, and extrinsic crack-tip shielding mechanisms, which act primarily behind
the tip to retard crack growth. In light of this phenomena, in Figure 4.18b, the
crack can be seen to be arrested and moved into different directions and even
into the fibre layers below the surface.
Figure 4.21: a) 1wt% and b) 5wt% sample showing crack propagation through
the matrix

102
Figure 4.19a highlighted the same phenomena but this time there are multiple
cracks. The crack highlighted by the red circle can be seen to be arrested,
however due to the ongoing stresses created by the cyclic fatigue motion, a new
crack appeared next to it.
Figure 4.22: 5wt% sample showing a crack being arrested and a new crack
being created
Figure 4.20 shows micro crack sites and in the middle there was an example of
the crack being arrested and deviated. Since the 5wt% sample was densely
packed with nanoclays, this could be a site where a nanoclay was present which
arrested the crack and then the crack had to move around the nanoclay. SEM
evidence of this phenomena could not be obtained, however, an EDX was
performed at this point, as showed in Figure 4.20 which showed a high
concentration of silica. Silica is a bulk component of nanoclays, so it can be
inferred that the nanoclay was at the point that the crack deviated and it is due to
this nanoclay that the crack re-routed. The high concentration of Titanium, Ti is
from the Tipex which was used to mark the point on the sample.
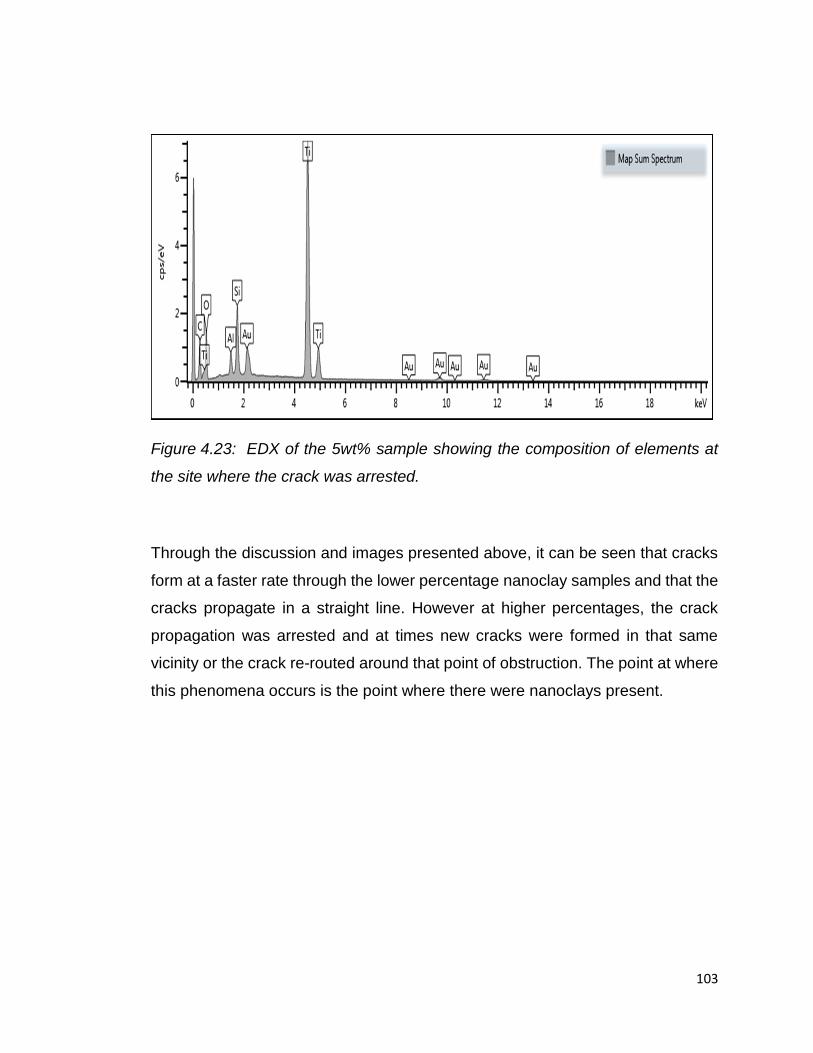
103
Figure 4.23: EDX of the 5wt% sample showing the composition of elements at
the site where the crack was arrested.
Through the discussion and images presented above, it can be seen that cracks
form at a faster rate through the lower percentage nanoclay samples and that the
cracks propagate in a straight line. However at higher percentages, the crack
propagation was arrested and at times new cracks were formed in that same
vicinity or the crack re-routed around that point of obstruction. The point at where
this phenomena occurs is the point where there were nanoclays present.

104
Figure 4.24: 5wt% sample showing the crack being re-routed.
4.4.6 Fatigue Failure Mechanism
Figure 4.21, represents a failure envelope for the different types of fracture that
occurred during the fatigue testing. Only three samples for each fatigue loading
and each nanoclay percentage are reported here. The final fracture mode only
was categorized here. The quadrants were broken up into three areas, Fibre
Breakage, Matrix Failure and Delamination.
The 90% fatigue loading failure was characterized mostly by fibre breakage and
matrix failure and as the nanoclay percentage increased, the extent of fibre
breakage and matrix cracking decreased and the trend moved towards
delamination, where the fibre sheets separated from each other. The repeated
cyclic stresses imposed on the samples by fatigue testing causes the layers to
separate, forming separate layers of the fibre.
The 75% fatigue loading was characterized mostly with matrix failure at the lower
nanoclay percentages of 0wt% and 1wt% and some delamination at the 3wt%

105
and 5wt%. At the 60% loading, all the nanoclay samples were characterized by
delamination.
Figure 4.25: Failure analysis envelope based on fatigue fracture results
Consequently, it can be summarized that as the fatigue loading decreased, from
90% to 60%, the failure mechanism moved from matrix cracking to delamination.
As the nanoclay percentage increased to 5wt%, the failure mechanism was
predominantly delamination. This is important to note, since delamination is an
indication of the strength of the material.
4.4.7 Statistical Analysis
For the fatigue testing, three samples each for each fatigue loading percentages
were tested, for each nanoclay percentage. Each test result was different from
each other. In order to determine if this variation was adequate, a statistical
analysis ANOVA was performed. In this analysis, the mean of each of the results
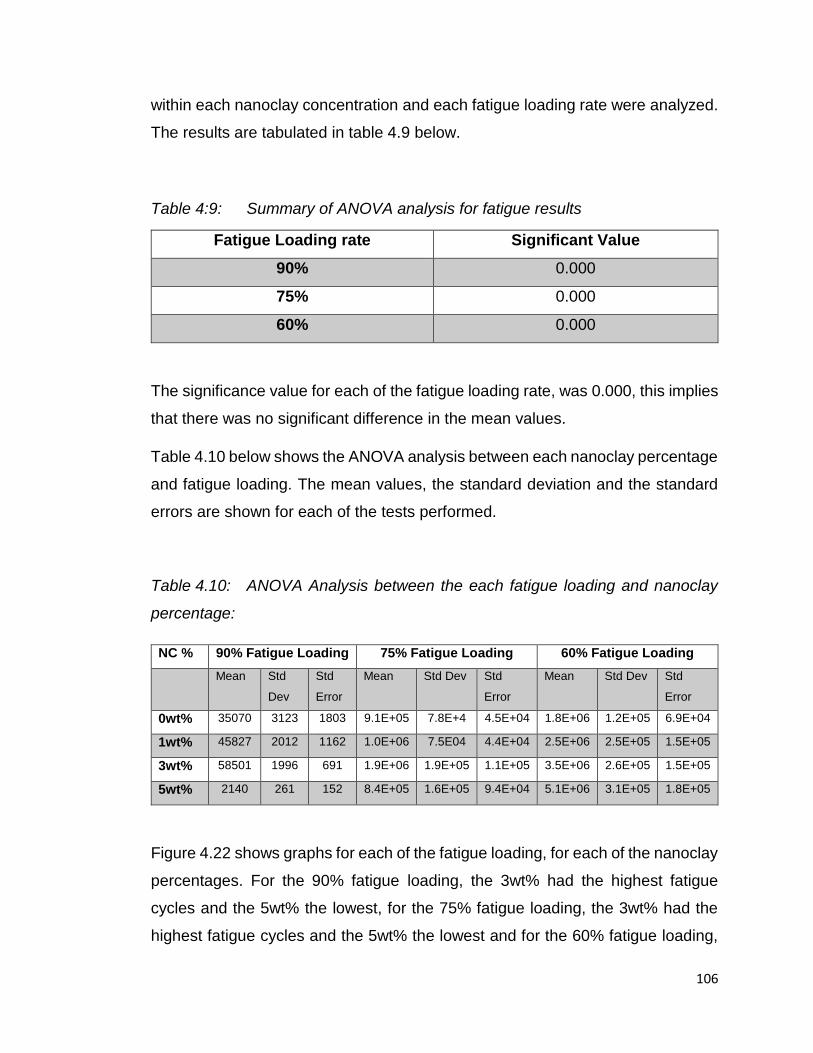
106
within each nanoclay concentration and each fatigue loading rate were analyzed.
The results are tabulated in table 4.9 below.
Table 4:9: Summary of ANOVA analysis for fatigue results
Fatigue Loading rate Significant Value
90% 0.000
75% 0.000
60% 0.000
The significance value for each of the fatigue loading rate, was 0.000, this implies
that there was no significant difference in the mean values.
Table 4.10 below shows the ANOVA analysis between each nanoclay percentage
and fatigue loading. The mean values, the standard deviation and the standard
errors are shown for each of the tests performed.
Table 4.10: ANOVA Analysis between the each fatigue loading and nanoclay
percentage:
NC % 90% Fatigue Loading 75% Fatigue Loading 60% Fatigue Loading
Mean Std
Dev
Std
Error
Mean Std Dev Std
Error
Mean Std Dev Std
Error
0wt% 35070 3123 1803 9.1E+05 7.8E+4 4.5E+04 1.8E+06 1.2E+05 6.9E+04
1wt% 45827 2012 1162 1.0E+06 7.5E04 4.4E+04 2.5E+06 2.5E+05 1.5E+05
3wt% 58501 1996 691 1.9E+06 1.9E+05 1.1E+05 3.5E+06 2.6E+05 1.5E+05
5wt% 2140 261 152 8.4E+05 1.6E+05 9.4E+04 5.1E+06 3.1E+05 1.8E+05
Figure 4.22 shows graphs for each of the fatigue loading, for each of the nanoclay
percentages. For the 90% fatigue loading, the 3wt% had the highest fatigue
cycles and the 5wt% the lowest, for the 75% fatigue loading, the 3wt% had the
highest fatigue cycles and the 5wt% the lowest and for the 60% fatigue loading,

107
the 5wt% had the highest fatigue cycles and the 0wt% the lowest fatigue cycles.
It can be inferred that at the lower fatigue loading rates, the 3wt% performs the
best and for the high fatigue loading rates, the 5wt% performs the best.
Figure 4.26: ANOVA Analysis results for each Fatigue loading and Nanoclay
Percentage
The breakdown of the values for each fatigue loading rate, was as shown in Table
4.11. As a rule, if the significant difference is greater than 0.05, this implies that
there was a significant difference in the results. From table 4.10, it can be seen
that the ANOVA analysis showed that there is no significant difference between
the values.
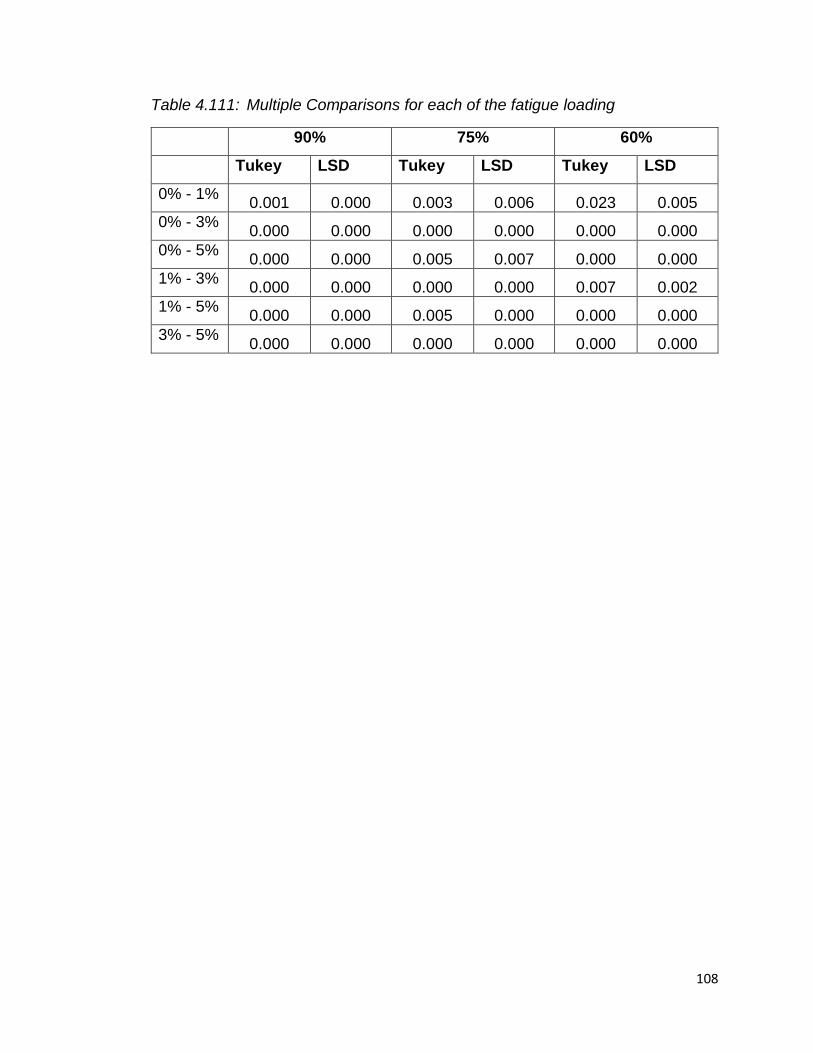
108
Table 4.111: Multiple Comparisons for each of the fatigue loading
90% 75% 60%
Tukey LSD Tukey LSD Tukey LSD
0% - 1% 0.001 0.000 0.003 0.006 0.023 0.005
0% - 3% 0.000 0.000 0.000 0.000 0.000 0.000
0% - 5% 0.000 0.000 0.005 0.007 0.000 0.000
1% - 3% 0.000 0.000 0.000 0.000 0.007 0.002
1% - 5% 0.000 0.000 0.005 0.000 0.000 0.000
3% - 5% 0.000 0.000 0.000 0.000 0.000 0.000

109
CHAPTER 5
Carbon Fibre Re-inforced plastic composite laminates were produced via the
VARIM method. During this process, Cloisite 15A nanoclays were added to the
resin mixture to be infused into the composite. Nanoclays were added in the
concentration of 0wt%, 1wt%, 3wt% and 5wt%.
The objective of this study was to investigate the effect of nanoclay concentration
on the fatigue failure properties at fatigue loading rates of 90%, 75% and 60%
and investigate the failure mechanisms.
XRD proved that the distribution of the nanoclays within the matrix was
evenly distribution. The 1wt% showed exfoliated structures, the 3wt% showed a
mixture of exfoliated, flocculated and intercalated structures and the 5wt%
showed intercalated structures.
Tensile testing showed that the nanoclay percentage played a role in the
strength of the composite and that as the nanoclay percentage increased, so too
does the strength of the composite.
It was found that the 5wt% sample became progressively stronger as the
fatigue percentage loading rate moved from 90% to 75% to 60% and the
specimen was able to withstand longer cycle times as opposed to the 0wt%, 1wt%
and 3wt% nanoclay samples. This was attributed to the slow increase in the
temperature which favors intercalated structures.
The lines for the 0wt% and 1wt% on the S-N diagram were parallel to each
other and very steep. This indicated a higher rate of fatigue degradation during
the cyclic loading. The lines for the 3wt% and the 5wt% were gentle slopes, which
indicated low rates of degradation.
The 5wt% at 90% loading behaved similar to that of a brittle substance and
this brittleness was proved by performing the hardness and impact testing.
However as the fatigue loading percentage became lower and hence the
force became lower, the 5wt% sample performed progressively better than the

110
other samples and had cycles of up to 5.5M. These results were attributed to the
inclusion of the nanoclays.
The damage mechanism examined using the scanning electron
microscope showed an array of types of fractures, at the different percentage
loading rates and at the different nanoclay percentages.
o For the 90% fatigue loading, the 0wt% and 5wt% showed similar fracture
characteristics. Both fractured along a straight line, with neat lines.
However the 1wt% and 3wt% showed, delamination, matrix failure and
fibre breaking.
o For the 75% fatigue loading, 0wt% and 3wt% were similar where fracture
occurred along a fairly straight line and debonding was evident. The 3wt%
and 5wt% both showed signs of extensive delamination with the 5wt%
individual fibre strands, fracturing in different directions, whereas the 1wt%
sample delaminated and fractured along a single plane, only.
o For the 60% fatigue loading, the 0wt% was the only sample that displayed
debonding and fibre breakage. The 1wt%, 3wt% and 5wt% all fractured in
the similar manner here, that being, delamination. Once the fibre sheet
layers separated, it was the fracture of the individual fibre strands rather
than the failure of the entire bundle or the fibre sheet itself that ultimately
brought about the failure of the entire specimen.
In conclusion, the addition of nanoclays into the matrix, strengthened the matrix
and allowed the sample to have a higher fatigue cycle life. The damage
mechanism was mainly characterized by delamination.
111
REFERENCES
1. Global.security.org; “From Wood to Metal”
http://www.globalsecurity.org/military/systems/aircraft/intro-wood.htm; 2015
2. Tim Palucka and Bernadette Bensaude-Vincent; “Composites Overview”;
http://authors.library.caltech.edu/5456/1/hrst.mit.edu/hrs/materials/public/compo
sites/Composites_Overview.htm; 2012
3. Bowler T, Carbon fibre planes: Lighter and stronger by design, Business reporter,
BBC News, 28 Jan 2014.
4. Polymer Science Learning Centre; Department of Polymer Science; “What is a
Polymer”; University of Southern Mississippi; 2015
http://www.pslc.ws/macrog/kidsmac/basics.htm
5. History of Composites: The Evolution of Lightweight Composite Materials;
http://composite.about.com/od/aboutcompositesplastics/a/HistoryofComposites.
htm ; 2015.
6. Your higher technological specialty chemicals resource;
http://www.reade.com/products/12-minerals-clays/597-montmorillonite-smectite-
sodium-montmorillonite-sodium-bentonite-wyoming-bentonite-us-swelling-
bentonite-western-bentonite-us-sodium-activated-bentonite-bentonite-uk-
sodium-exchanged-bentonite-synthetic-bentonite-calcium-montmorillonite
7. Joseph H. Koo “Nanocomposites for Carbon Fibre Reinforced Polymer Matrix
Composites”
8. How Is Carbon Fibre Made?; The Manufacturing Process Of This Lightweight
Material; http://composite.about.com/od/aboutcarbon/a/How-Is-Carbon-Fibre-
Made.htm
9. The Adhesive and Sealants Industry; www.adhesivemag.com/articles/94350-
market-trends-lightening-up-with-carbon-fibre-reinforcement-plastics; 2016.
10. Mr. John Leahey, COO of Airbus “Boeing 787/777/Y3 Strategy Against Bigger
A350s”, 2010.
11. http://scribol.com/technology/aviation/airbus-a350-composites-on-trial-part-i/
Colin Sirett, Head of research, Airbus UK. Aug 2016.

112
12. Tucker C. L., Liang E. Stiffness predictions for unidirectional short fibre
composites: review and evaluation. Comp Sci Technol, 655–71, 1999
13. Angelo G. Facca, Mark T. Kortschot; Ning Yan; Predicting the elastic modulus of
natural fibre reinforced thermoplastics; Department of Chemical Engineering and
Applied Chemistry, University of Toronto, 2005
14. Halpin J. C. and Kardos J. L; Halpin-Tsai Equations: A Review, Polymer
Engineering and Science;, v16, N5, pp 344-352, 1996.
15. Ghafaar M. A., Mazen A. A., El-mahallawy NA; Application of the Rule of Mixtures
and Halpin-Tsai Equations to Woven Fabric reinforced Epoxy Composites;
Journal of Engineering Sciences, Assiut University, Vol 34, No 1, pp 227-236, Jan
2006.
16. https://www.youtube.com/watch?v=hBnzrBhnzVo, April 2015.
17. Thermoplastic and thermosetting Plastics; http://www.recycledplastic.com/wp-
content/uploads/2014/01/thermoplastics-vs-thermosetting.jpg, May 2016.
18. Wise Geek: “What is resin”: http://www.wisegeek.org/what-is-resin.htm, Sept
2015.
19. http://www.netcomposites.com/guide/resin-types/7, Mar 2016.
20. Polymer Science Learning Centre; Department of Polymer Science;
“Composites”; University of Southern Mississippi;
http://www.pslc.ws/macrog/composit.htm, Feb 2015
21. Wu Y, Kim G. Y.; Carbon nanotube reinforced aluminum composite fabricated by
semi-solid powder processing; Journal of Materials Processing Technology, Vol
211, Issue 8, Pgs 1341 – 1347, August 2011.
22. Karen Wood; “Ceramic-matrix composites heat up”; Composite World; 2013.
23. Carlsson, L. A. and Kardomateas, G. A., Stress-Strain Relations for On-Axis and
Off-Axis Composite Elements, Structural and Failure Mechanics of Sandwich 365
Composites, Solid Mechanics and its Applications 121, DOI 10.1007/978-1-4020-
3225-7, © Springer Science+Business Media B.V. 2011.
24. Wikipedia; “Glass Fibre”; Wikipedia, the free encyclopedia;
http://en.wikipedia.org/wiki/Glass_fibre, Oct 2015.
25. Julius Lordjw; Slotforum, 2004.

113
26. Wikipedia; “Kevlar Fibre”; Wikipedia, the free encyclopedia;
http://en.wikipedia.org/wiki/Kevlar, Dec 2015.
27. The Carbon Company;
http://www.sglgroup.com/cms/_common/images/products/lexicon-of-
materials/carbon-fibre-en.jpg, June 2016.
28. Erhard, Gunter; “Designing with Plastics”; Trans. Martin Thompson; Munich:
Hanser Publishers, http://en.wikipedia.org/wiki/Fibre-
reinforced_plastic#cite_note-Gunter-1, 2006.
29. Smallman, R. E., and Bishop R. J.; “Modern Physical Metallurgy and Materials
Engineering”; 6th ed. Oxford: Butterworth-Heinemann,
http://en.wikipedia.org/wiki/Fibre-reinforced_plastic#cite_note-Smallman, 1999.
30. An Introduction to Carbon Fibre Reinforced Plastics;
http://www.getcarbonfibre.com/carbon-fibre-vinyl/introduction-to-carbon-fibre-
reinforced-polymer, Apr 2014.
31. http://www.azom.com/article.aspx?ArticleID=984, Fibres for Reinforcement in
Composite Materials, 2016.
32. http://www.matweb.com/search/datasheettext.aspx?matguid=0d27f2cbfe6f49c3
b7a27eba7e503eaf , BYK Cloisite® 15A Nanoclay, 2015.
33. Cervantes-Uc J. M., Cauich-Rodriguez J. V., Vazquez-Torres H, Garfias-Mesias
L. F., Paul D. R., Thermal Degradation of commercially available organoclays
studied by TGA-FTIR, Science direct, Thermochimica, 2007.
34. Hale J, "AERO Magazine." Boeing. (Online Article).
http://www.boeing.com/commercial/aeromagazine/articles/qtr_4_06/AERO_Q40
6_article4.pdf, 2008.
35. Theoretical and Applied Mechanics; Composites Material Program; Robert R.
McCormick School of Engineering and Applied Science; Northwestern University,
2015.
36. Tong, L, Mouritz A. P. and Bannister M. K.; 3”D Fibre-Reinforced Polymer
Composites”; Oxford: Elsevier, 2002.
37. Cyberphysics.co.uk; “Youngs Modulus”;
http://www.cyberphysics.co.uk/topics/forces/young_modulous.htm; 2013.

114
38. www.azom.com/article.aspx?ArticleID=5551, Tensile testing – Theory,
Applications and Systems, Force and Torque Test Solutions, 2016.
39. Firehole Composites, Fatigue life predictions in Composite Materials, White
Paper Series, 2010.
40. Keith B. A., William C., Graham B.; Care and Repair of Advanced Composites,
pg 2-4, Second Edition, June 2005
41. How products are made, Health and Safety Concerns, Carbon Fibre, Advameg,
Inc, http://www.madehow.com/Volume-4/Carbon-Fibre.html, 2015.
42. “Car of the future in plastics”, The Mercury (Hobart, Tasmania), , page 16,
Monday 27 May 1946
43. Donald V. R., Dominick V. R, and John M.; “Reinforced plastics handbook”;
Elsevier; page 586, 2004
44. Palucka T. and Bensaude-Vincent B.; History of Composites,
http://authors.library.caltech.edu/5456/1/hrst.mit.edu/hrs/materials/public/compo
sites/Comp, 2013.
45. Applications of Carbon Fibre;
http://composite.about.com/od/aboutcarbon/a/Applications-Of-Carbon-
Fibre.htm; 2015.
46. Mohan T. P., Kumar M. R., Velmurugan R., Rheology and curing characteristics
of epoxy-clay nanocomposites. Polymer Int;54:1653-9, 2005.
47. Ratna D, Manoj N. R, Varley R.; Clay-reinforced epoxy nanocomposites. Polymer
Int; 52 L1403-7, 2003.
48. Moodley V. K., Kanny K, Nano Modified Thermoplastics, proceedings of 2nd
biennial international composites Africa, 24-25 August 2004.
49. Grimmer C, Dharan C. K. H. High-cycle fatigue of hybrid carbon nanotube/glass
fibre/polymer composites. Journal of Material Science, 43:4487-92, 2008.
50. Helmy S, Hoa S. V., Tensile fatigue behavior of tapered glass fibre reinforced
epoxy composites containing nanoclays, Composites Science and Technology,
Science Direct, 2014.

115
51. Kabir A, Hoa S. V.; Effect of nanoclay addition on the damping and fatigue
properties of glass/epoxy composites. In: Proc 26th symposium of the international
committee of aeronautical fatigue, Montreal, June 1-3; 2011.
52. Campbell F. W., Polymer Matrix Composites, Manufacturing Technology for
Aerospace Structural Materials, 2006.
53. Matera T.; The world most comprehensive materials database, Fatigue of Metals:
Part 2; Aug 2010
54. Fatigue Users guide; Fatigue Theory; MSC Software Training; University of
California; 2015.
55. Ramsaroop A; Fracture Properties of Fibre and Nano Reinforced Composite
Structures; Master’s Thesis, 2007.
56. O’ Brien, T.K., “Characterisation, Analysis and Prediction of Delamination in
Composites Using Fracture Mechanics”, NASA Langley Research Centre
ICF100942OR, 2001.
57. Moodley V. K., The Synthesis, Structure and Properties of Polypropylene
Nanocomposites, Master’s Thesis, Durban University of Technology, Mechanical
Engineering Department, 2007.
58. Gamstedt E. K., Talerja R.; Fatigue damage mechanisms in unidirectional carbon-
fibre-reinforced plastics; Journal of Material Science 34; 2535-2546; 1999.
59. Backe D, Balle F and Eifler D; Fatigue testing of CFRP in the very high cycle
fatigue (VHCF) regime at ultrasonic frequencies; Composites Science and
Technology, Oct 2014.
60. Kawai M; Fatigue Studies of crossply CFRP laminates at room and high
temperatures; International Journal of Fatigue, Volume 28, Issue 10, Oct 2006.
61. Brunbauer J, Stadler H, Pinter G; Mechanical properties, fatigue damage and
microstructure of carbon/epoxy laminates depending on the fibre volume content,
International Journal of Fatigue, Science Direct, 2014.
62. Qi Y, Li J, Liu L; Tensile properties of multilayer-connected biaxial weft knitted
fabric reinforced composites for carbon fibres, Materials and Design, Science
Direct, 2013.

116
63. Borrego L. P., Costa J. D. M., Ferreira J. A. M., Silva H; Fatigue behavior of glass
fibre reinforced epoxy composites enhanced with nanoparticles, Science direct,
Composites part B, Feb 2014.
64. Wang L, Wang K, Chen L, Zhang Y, He C; Preparation, Morphology and
Thermal/Mechanical properties of epoxy/nanoclay composite, Composites: Part
A, Science Direct, 2005.
65. Zhou G, Lee L. J.; Nanoclay and long fibre reinforced composites based on epoxy
and phenolic resins, ANTEC: 2094-8, 2003.
66. Ho M. W., Lam C, Lau K, Ng D. H., Hui D; Mechanical properties of epoxy based
composites using nanoclays; Composite structures 75, 415-421, 2006.
67. Khan S. U., Munir A, Hussain R, Kim J; Fatigue damage behaviors of carbon fibre
reinforced epoxy composites containing nanoclay; Composites science and
technology 70, 2077-2085, 2010
68. Curtis D.C., Moore D.R., Slater, B, Zahlan, N; Fatigue testing of multi-angle
laminates of CF/PEEK, Composites, Volume 19, Issue 6, , Pages 446–452,
November 1988.
69. Pandita S. D., Huysmans G, Wevers G, Verpoest I; Tensile fatigue behaviour of
glass plain-weave fabric composites in on- and off-axis directions, Composites
Part A: Applied Science and Manufacturing, Volume 32, Issue 10, Pages 1533–
1539, October 2001
70. Fatigue. http://en.wikipedia.org/wiki/Fatigue_(material), Nov 2015.
71. Estevez, R., Tijssens, M. G. A., and Van der Giessen, E.; “Modeling of the
competition between shear yielding and crazing in glassy polymers”, Journal of
the Mechanics and Physics of Solids, 48, pp 2585–2617, 2000.
72. Kambour, R. P., “A review of crazing and fracture in thermoplastics”, Journal of
Polymer Science, Macromolecular Reviews 7, pp 1-154, 1973.
73. “Chapter 16. Polymers. Characteristics, Applications and Processing”,
http://www.virginia.edu/bohr/mse209/chapter16.htm, 103. 2013.
74. http://www.matweb.com/search/datasheettext.aspx?matguid=0d27f2cbfe6f49c3
b7a27eba7e503eaf, BYK Cloisite® 15A Nanoclay, 2015.

117
75. http://www.an-cor.com/glossary_laminating_methods.htm, fibreglass fabricating
for the future, An-Cor Industrial Plastics, Inc., 2015.
76. Cervantes-Uc J. M., Cauich-Rodriguez J. V., Vazquez-Torres H, Garfias-Mesias
L. F., Paul D. R.; Thermal Degradation of commercially available organoclays
studied by TGA-FTIR, Science direct, Thermochimica, 2007.
77. Davidson M. W.; Molecular Expressions, XRD, Exploring the world of optics and
microscopy, www.micro.magnet.fsu.edu/primer/java/interference/index.html,
Florida State University, 2013.
78. ASTM D 2583-07, “Standard Test Method for Indentation Hardness of Rigid
Plastics by means of a Barcol Impressor”, Annual Book of ASTM, Standards, ,
15.03, Philadelphia (USA), 2003.
79. Meyers and Chawla: "Mechanical Behavior of Materials", 162–168, 1999.
80. ASTM D 6110-04, “Standard Test Method for Determining the Charpy Impact
Resistance of Notched Specimens of Plastics1”, Annual Book of ASTM,
Standards, 15.03, Philadelphia (USA), 2003
81. Hojo M, Ando T, Tanaka M, Adachi T, Ochiai S, Endo;. Modes 1 and II
interlaminar fracture toughness and fatigue delamination of CF/epoxy laminates
with self-same epoxy interleaf. International Journal of Fatigue; Pages 1159-
1161. Japan, 2006.
82. http://www.substech.com/dokuwiki/doku.php?id=fracture_toughness, Subtech;
Substance and Technology, Dr. Dmitri Kopeliovich, 2015.
83. Composites, Design and manufacture;
http://www.tech.plym.ac.uk/sme/MATS324/, Composites with Plymouth
University; Advanced composites manufacturing centre; John Summerscales,
June 2015.
84. ASTM D3171-99, “Standard Test Method for Constituent Content of Composite
Material”, Approved for use by agencies of the Department of Defence,
Philadelphia (USA), 1999.
85. ASTM D 3039-01M, “Standard Test Method for Tensile Properties of Polymer
Matrix Composite Materials”, Annual Book of ASTM, Standards, 15.03,
Philadelphia (USA), 2003.

118
86. ASTM D3479-02, “Standard Test Method for Tension-Tension fatigue of Polymer
matrix Composite Material”, Annual Book of ASTM, Standards, 15.03,
Philadelphia (USA), 2003
87. http://www.composites.northwestern.edu/research/characterization/toughness.ht
m, 2005.
88. http://www.princeton.edu/~achaney/tmve/wiki100k/docs/Optical_microscope.ht
ml, 2005
89. http://www.purdue.edu/ehps/rem/rs/sem.htm, 2006.
90. Manjunatha C. M., Taylor A. C., Kinloch A. J., Sprenger S; The tensile fatigue
behaviour of a silica nanoparticle-modified glass fibre reinforced epoxy
composite. Compos Sci Technol;70(1):193–9, 2010.
91. Utracki, L. A., and Kamal, M. R.; “Clay-Containing Polymeric Nanocomposites”,
The Arabian Journal for Science and Engineering, 27, pp. 43-67, 2002
92. Brandt A. M., Marshal I. H. and Li V. C., Brittle Matrix Composites 7, Elsevier, 01
- Technology & Engineering, Oct 2003
93. Composites, Design and manufacture;
http://www.tech.plym.ac.uk/sme/MATS324/, Composites with Plymouth
University; Advanced composites manufacturing centre; John Summerscales,
June 2015.
94. Pavlina E. J., van Tyne C. J.; Correlation of Yield Strength and Tensile Strength
with Hardness for Steels, Journal of Materials Engineering and Performance,
Volume 17, Number 6 / December, 2008.
95. Mills N. J. (February 1976). "The mechanism of brittle fracture in notched impact
tests on polycarbonate". Journal of Materials Science 11 (2): 363–75., 2016.
96. Mathurt K. K., Needleman A, Tvergaard V (May 1994). "3D analysis of failure
modes in the Charpy impact test". Modeling and Simulation in Materials Science
Engineering 2 (3A): 617–35, 2016
97. Yasmin A, Luo J. J., Abot J. L.; Danial IM. Mechanical and thermal behaviour of
clay/ epoxy nanocomposites. Compos Sci Technol;66:2415–22, 2006.

119
98. Lin L. Y., Lee J. H., Hong C. E., Yoo G. H and Advani S. G.; Preparation and
characterization of layered silicate/glass fibre/epoxy hybrid nanocomposites via
vacuum assisted resin transfer molding. Compos Sci Technol;66:2116–25, 2006.
99. Kim J. K., Hu C. G., Woo R. S. C. and Sham M. L.; Moisture barrier characteristics
of organoclay–epoxy nanocomposites. Compos Sci Technol;65:805–13, 2005.
100. Gilman J. W. and Kashiwagi T.; Polymer-layered silicate nanocomposites
with conventional flame retardants. In: Pinnavaia TJ, Beall GW, editors.
Polymerclay nanocomposites. New York: John Wiley & Sons; 2000.
101. Degrieck J and Van Paepegem W.; Fatigue damage modelling of fibre-
reinforced composite materials: review. Appl Mech Rev;54 (4):279–300, 2001.
102. Mandell, J. F;, Fatigue Crack Growth in Fibre Reinforced Plastics, Polymer
Composites, Department of Materials Science and Engineering, Massachusetts
Institute of technology Cambridge, Massachusetts 02139, Jan 1981, Vol 2, No 1.
103. Kim W. H and Laird C. (1978). Crack Nucleation and State I Propagation
in High Strain Fatigue- II Mechanism. Acta Metallurgica. pp. 789–799, 2005.
104. Ritchie R. O.; Mechanisms of fatigue-crack propagation in ductile and
brittle solids; International Journal of Fracture 100: 55–83, 1999.
105. http://cdn.shopify.com/s/files/1/0261/6507/files/weave_types.png?726083
5241504407843, Mar 2017.

120
LIST OF PAPERS PUBLISHED ON THE BASIS OF THIS
THESIS
I. Refereed Journal
1. Sathie Chetty, Krishnan Kanny, Shalini Singh (2015). The effect of
nanoclays on the strain energy release rate on carbon fibre reinforced
composites. Engineering Fracture Mechanics. EFM-S-14-00769.
Submitted to Journal and busy with corrections.
2. Sathie Chetty, Krishnan Kanny, (2016). The effect of nanoclay
concentration on fatigue failure properties of CFRP nano-composites at
0/45°, 0/60° and 0/90° fibre configuration . Advances in Mechanical
Engineering. Submitted.
3. Sathie Chetty, Krishnan Kanny, (2016). The effect of nanoclay infusion
on fatigue life of carbon fibre reinforced polymer. Journal of Re-inforced
Plastics and Composites. Submitted.
II. Conference Proceedings
1. Sathie Chetty, Krishnan Kanny (2013). Thermal improvement of Carbon
Fibre Re-inforced Composites with Nanoclay Addition. Paper presented at
the Institutional Research Day, 26 November 2013, Durban University of
Technology, Durban, South Africa.
2. Sathie Chetty, Krishnan Kanny (2013). Thermal & fracture property
improvement of carbon fibre re-inforced composites with nanoclay
addition. Paper presented at the First International Conference for
121
Composite, Biocomposite and Nanocomposite (ICCBN). ISBN: 978-1-919-
858-25-8; 2-4 December 2013, Durban, South Africa.
3. Sathie Chetty, Krishnan Kanny (2014). The Impact of Nanoclays on
CFRP during Fracture Testing. Paper presented at the International
Aerospace Symposium of South Africa (IASSA). 24-25 November 2014,
Centurion, South Africa.
4. Sathie Chetty, Krishnan Kanny (2014). Fatigue and Hardness Studies of
Carbon Fibre Reinforced Composite at Elevated Temperatures. Paper
presented at the Institutional Research Day, 26 November 2014, Durban
University of Technology, Durban, South Africa.
5. Sathie Chetty, Krishnan Kanny (2015). Effect of Nanoclay Concentration
on Fatigue Failure Properties of CFRP. Paper presented at the Second
International Conference for Composite, Biocomposite and
Nanocomposite (ICCBN). ISBN: 978-0-620684-56-9; 28-30 October 2015,
Durban, South Africa.