Embed Size (px)
Citation preview

SUSTAINABILITY IN ACTION
WORLD FISHERIES AND AQUACULTURE
THE STATE OF
IN BR IEF
2019 2019 20202020

| 2 |
COVER PHOTOGRAPH ©FAO/Kyle LaFerriereGHANA. Fishing canoes and gear in the Canoe Basin, Tema.
This booklet contains the main points of the publication The State of World Fisheries and Aquaculture 2020. The numbering of the tables and figures corresponds to this publication.https://doi.org/10.4060/ca9231en
| 3 |
CONTENTS
FOREWORD 4
PART 1 WORLD REVIEW 7Overview 7
} FIGURE 1 World capture fisheries and aquaculture production 8
Capture fisheries production 8 } TABLE 1 World fisheries and aquaculture production, utilization and trade 9
Aquaculture production 10 } FIGURE 8 World aquaculture production of aquatic animals and algae, 1990–2018 10
Fishers and fish farmers 11 } TABLE 12 World employment for fishers and fish farmers, by region 12
The status of the fishing fleet 11
The status of fishery resources 13 } FIGURE 19 Global trends in the state of the world’s marine fish stocks, 1974–2017 13
Fish utilization and processing 14 } FIGURE 2 World fish utilization and apparent consumption 14
Fish consumption 15 } FIGURE 26 Apparent fish consumption per capita, average 2015–2017 16
Fish trade and products 16 } FIGURE 29 Top exporters and importers of fish and fish products in terms of value, 2018 17
PART 2 SUSTAINABILITY IN ACTION 19The twenty-fifth anniversary of the Code of Conduct for Responsible Fisheries 19
How has the Code supported the adoption of sustainable practices? 19
Progress on the road to sustainability – what the Code questionnaire reveals 20
} FIGURE 40 Response by Members to the FAO Questionnaire on the Implementation of the Code of Conduct for Responsible Fisheries and Related Instruments, by region 21
Securing fisheries and aquaculture sustainability 22Sustainability, tenure, access and user rights 22
PART 3 OUTLOOK AND EMERGING ISSUES 24Fisheries and aquaculture projections 24
Production 24
Prices 25
Consumption 25
} FIGURE 56 Increasing role of aquaculture 25
Trade 26
Summary of main outcomes from the projections 26

| 4 |
FOREWORD
In September 2015, the United Nations launched the 2030 Agenda for Sustainable Development, a beautiful blueprint for global peace and prosperity. In adopting the 2030 Agenda, countries demonstrated a remarkable determination to take bold and
transformative steps to shift the world onto a more sustainable and resilient path.
However, after 5 years of uneven progress and with less than 10 years to go, and despite progress in many areas, it is clear that action to meet the 17 Sustainable Development Goals (SDGs) is not yet advancing at the speed or scale required. In response, at the SDG summit in September 2019, the United Nations Secretary-General called on all sectors of society to mobilize for a Decade of Action to accelerate the development of sustainable solutions for the world’s biggest challenges – ranging from poverty and inequality to climate change and closing the finance gap.
It is therefore necessary and timely that the 2020 edition of The State of World Fisheries and Aquaculture is devoted to the topic of Sustainability in Action. The fisheries and aquaculture sector has much to contribute to securing all the SDGs, but is at the core of SDG 14 – Conserve and sustainably use the oceans, seas and marine resources for sustainable development. As custodian of four out of ten indicators of SDG14 progress, FAO has an obligation to accelerate the global momentum to secure healthy and productive oceans, a momentum whose pace will receive further impetus at the second United Nations Ocean Conference.
The 2020 edition of The State of World Fisheries and Aquaculture continues to demonstrate the significant and growing role of fisheries and aquaculture in providing food, nutrition and employment. It also shows the major challenges ahead despite the progress made on a number of fronts. For example, there is growing evidence that when fisheries are properly managed, stocks are consistently above target levels or rebuilding, giving credibility to the fishery managers and governments around the world that are willing to take strong action. However, the report also demonstrates that the successes achieved in some countries and regions have not been sufficient to reverse the global trend of overfished stocks, indicating that in places where fisheries management is not in place, or is ineffective, the status of fish stocks is poor and

| 5 |
deteriorating. This unequal progress highlights the urgent need to replicate and re-adapt successful policies and measures in the light of the realities and needs of specific fisheries. It calls for new mechanisms to support the effective implementation of policy and management regulations for sustainable fisheries and ecosystems, as the only solution to ensure fisheries around the world are sustainable.
FAO is a technical agency created to fight hunger and poverty. Yet, as we approach a world of 10 billion people, we face the fact that since 2015 the numbers of undernourished and malnourished people have been growing. While there is no silver bullet to fix this problem, there is little doubt that we will need to use innovative solutions to produce more food, ensure access to it, and improve nutrition. While capture fisheries will remain relevant, aquaculture has already demonstrated its crucial role in global food security, with its production growing at 7.5 percent per year since 1970. Recognizing the capacity of aquaculture for further growth, but also the enormity of the environmental challenges the sector must face as it intensifies production, demands new sustainable aquaculture development strategies. Such strategies need to harness technical developments in, for example, feeds, genetic selection, biosecurity and disease control, and digital innovation, with business developments in investment and trade. The priority should be to further develop aquaculture in Africa and in other regions where population growth will challenge food systems most.
The FAO Hand-in-Hand Initiative is an ideal framework for efforts that combine fisheries and aquaculture trends and challenges in the context of blue growth. The Hand-in-Hand Initiative aims to accelerate food systems transformation through matching donors with recipients, using the best data and information available. This evidence-based, country-led and country-owned initiative prioritizes countries where infrastructure, national capacities and international support are most limited, and where efficient collaboration and partnerships to transfer skills and technology can be of particular benefit. For example, climate change impacts on marine capture fisheries are projected to be more significant in tropical regions of Africa and Asia, where warming is expected to decrease productivity. Targeted fisheries and aquaculture development interventions in these regions, addressing their specific needs for food,

| 6 |
FOREWORD
| 6 |
trade and livelihoods, can provide the transformational change we need to feed everyone, everywhere.
Part of these targeted interventions is the recognition that most food systems affect the environment, but that there are trade-offs to ensure we improve food and nutrition security while minimizing the impacts on their supportive ecosystems. Fish and fisheries products are actually recognized not only as some of the healthiest foods on the planet, but also as some of the less impactful on the natural environment. For these reasons, they must be better considered in national, regional and global food security and nutrition strategies, and contribute to the ongoing transformation of food systems to ensure we eliminate hunger and malnutrition.
For FAO, 2020 is an important year in its history. It is the seventy-fifth anniversary of its creation – FAO is the oldest permanent specialized agency of the United Nations. It is also the twenty-fifth anniversary of the FAO Code of Conduct for Responsible Fisheries, the blueprint that has guided fisheries and aquaculture policy development around the world. However, there is no time for celebrations. These anniversaries remind us of the reason for our existence, they are calls to action, springboards for change, for a rapidly changing world in need of innovative and transformative solutions to old as well as new problems. As this report was being prepared, COVID-19 emerged as one of the greatest challenges that we have faced together since the creation of FAO. The deep socio-economic consequences of this pandemic will make our fight to defeat hunger and poverty harder and more challenging. As fisheries and aquaculture is one of the sectors most impacted by the pandemic, the baseline information provided in this report is already helping FAO respond with technical solutions and targeted interventions.
The State of World Fisheries and Aquaculture is the only publication of its kind, which for years has provided technical insight and factual information on a sector crucial for societal success. Among other things, the report highlights major trends and patterns observed in global fisheries and aquaculture and scans the horizon for new and emerging areas that need to be considered if we are to manage aquatic resources sustainably into the future. I hope this edition will have even greater quantitative and qualitative impact than previous editions, making valuable contributions in helping us meet the challenges of the twenty-first century. n
Qu DongyuFAO Director-General

| 7 |
sustainable development – and other SDGs relevant to fisheries and aquaculture. To this end, the implementation of science-based fisheries and aquaculture management policies, coupled with predictable and transparent regimes for international fish utilization and trade, are widely accepted as minimum substantive criteria for sustainable fisheries and aquaculture. To support evidence-based endeavours, this edition of The State of World Fisheries and Aquaculture presents updated and verified statistics of the sector, and analyses current and emerging issues and approaches needed to accelerate international efforts to achieve the goal of sustainable fisheries and aquaculture.
Global fish1 production is estimated to have reached about 179 million tonnes in 2018 (Table 12 and Figure 1). Of the overall total, 156 million tonnes were used for human consumption, equivalent to an estimated annual supply of 20.5 kg per capita. Aquaculture accounted for 46 percent of the total production and 52 percent of fish for human consumption.
1 Unless otherwise specified, throughout this publication, the term “fish” indicates fish, crustaceans, molluscs and other aquatic animals, but excludes aquatic mammals, reptiles, seaweeds and other aquatic plants. 2 In the tables in this publication, figures may not sum to totals because of rounding.
The world review in Part 1 of The State of World Fisheries and Aquaculture 2020 presents
FAO’s official world fisheries and aquaculture statistics.
Note: At the time of writing (March 2020), the COVID-19 pandemic has affected most countries in the world, with severe impacts on the global economy and the food production and distribution sector, including fisheries and aquaculture. FAO is monitoring the situation closely to assess the overall impact of the pandemic on fisheries and aquaculture production, consumption and trade.
OVERVIEWTwenty-five years after the adoption of the Code of Conduct for Responsible Fisheries (the Code), the importance of utilizing fisheries and aquaculture resources responsibly is now widely recognized and prioritized. The Code has informed the development of international instruments, policies and programmes to support responsible management efforts globally, regionally and nationally. These efforts have been consolidated and prioritized since 2015 to particularly address, in a coherent and coordinated manner, Sustainable Development Goal (SDG) 14 – Conserve and sustainably use the oceans, seas and marine resources for
PART 1WORLD REVIEW

| 8 |
CAPTURE FISHERIES PRODUCTIONIn 2018, total global capture fisheries production reached the highest level ever recorded at 96.4 million tonnes – an increase of 5.4 percent from the average of the previous three years (Table 1). The increase in 2018 was mostly driven by marine capture fisheries, whose production increased to 84.4 million tonnes in 2018. The top seven capture producers (China, Indonesia, Peru, India, the Russian Federation, the United States of America and Viet Nam) accounted for almost 50 percent of total global capture production.
Catches of anchoveta (Engraulis ringens) by Peru and Chile accounted for most of the increase in catches in 2018, following relatively low catches for this species in recent years, making it the top species, at over 7.0 million tonnes. Alaska pollock (Theragra chalcogramma) was second, at 3.4 million tonnes, while skipjack tuna (Katsuwonus pelamis) ranked third for the ninth consecutive year, at 3.2 million tonnes. Finfish represented about 85 percent of total marine capture production, with small pelagics as the main group, followed by gadiformes and tuna and tuna-like species. Catches of tuna and tuna-like
PART 1
Aquaculture – marine watersCapture fisheries – marine waters
CAPT
URE
Aquaculture – inland waters
AQUA
CULT
URE
Capture fisheries – inland waters
0
20
40
60
80
100
120
140
160
180
MIL
LION
TON
NES
1950 1954 1958 1962 1966 1970 1974 1978 1982 1986 1990 1994 1998 2002 2006 2010 2014 2018
FIGURE 1 WORLD CAPTURE FISHERIES AND AQUACULTURE PRODUCTION
NOTE: Excludes aquatic mammals, crocodiles, alligators and caimans, seaweeds and other aquatic plants.SOURCE: FAO.

| 9 |
species continued their year-on-year increase, reaching their highest levels in 2018 at over 7.9 million tonnes, mostly the result of catches in the Western and Central Pacific.
Global catches in inland waters have increased steadily year on year, reaching over 12 million tonnes in 2018, the highest levels recorded. However, this continuously rising trend in inland
TABLE 1 WORLD FISHERIES AND AQUACULTURE PRODUCTION, UTILIZATION AND TRADE1
1986–1995 1996–2005 2006–2015 2016 2017 2018
Average per year
(million tonnes, live weight)
Production
Capture
Inland 6.4 8.3 10.6 11.4 11.9 12.0
Marine 80.5 83.0 79.3 78.3 81.2 84.4
Total capture 86.9 91.4 89.8 89.6 93.1 96.4
Aquaculture
Inland 8.6 19.8 36.8 48.0 49.6 51.3
Marine 6.3 14.4 22.8 28.5 30.0 30.8
Total aquaculture 14.9 34.2 59.7 76.5 79.5 82.1
Total world fisheries and aquaculture
101.8 125.6 149.5 166.1 172.7 178.5
Utilization2
Human consumption 71.8 98.5 129.2 148.2 152.9 156.4
Non-food uses 29.9 27.1 20.3 17.9 19.7 22.2
Population (billions)3 5.4 6.2 7.0 7.5 7.5 7.6
Per capita apparent consumption (kg)
13.4 15.9 18.4 19.9 20.3 20.5
Trade
Fish exports – in quantity 34.9 46.7 56.7 59.5 64.9 67.1
Share of exports in total production 34.3% 37.2% 37.9% 35.8% 37.6% 37.6%
Fish exports – in value (USD billions)
37.0 59.6 117.1 142.6 156.0 164.1
1 Excludes aquatic mammals, crocodiles, alligators and caimans, seaweeds and other aquatic plants. Totals may not match due to rounding.2 Utilization data for 2014–2018 are provisional estimates.3 Source of population figures: UN DESA, 2019.
THE STATE OF WORLD FISHERIES AND AQUACULTURE 2020 IN BRIEF

| 10 |
PART 1
FIGURE 8 WORLD AQUACULTURE PRODUCTION OF AQUATIC ANIMALS AND ALGAE, 1990–2018
fisheries production may be misleading, as the increase in catches can partially be attributed to improved reporting and assessment at the country level. In 2018, 16 countries produced over 80 percent of total inland captures, compared with 25 countries for marine captures.
AQUACULTURE PRODUCTIONWorld aquaculture production attained another all-time record high of 114.5 million tonnes in live weight in 2018 (Figure 8), with a total farmgate sale value of USD 263.6 billion. The total production consisted of 82.1 million tonnes of aquatic animals, 32.4 million tonnes of aquatic algae and 26 000 tonnes of ornamental seashells
and pearls. The farming of aquatic animals in 2018 was dominated by finfish (54.3 million tonnes). Fed aquaculture production (57 million tonnes) has outpaced that of the non-fed subsector in world aquaculture.
World aquaculture production of farmed aquatic animals grew on average at 5.3 percent per year in the period 2001–2018, whereas the growth was only 4 percent in 2017 and 3.2 percent in 2018. The recent low growth rate was caused by the slowdown in China, the largest producer.
In 2018, inland aquaculture produced 51.3 million tonnes of aquatic animals, accounting
0
20
40
60
80
100
120
MIL
LION
TON
NES
(LIV
E W
EIGH
T)
Aquatic algae – all aquaculture (mostly seaweed) Crustaceans – inland aquaculture
Crustaceans – marine and coastal aquaculture
Other aquatic animals – all aquaculture
Molluscs – all aquaculture (mostly marine) Finfish – marine and coastal aquaculture
Finfish – inland aquaculture
1990 1995 2000 2005 2010 2015 2018
SOURCE: FAO.

| 11 |
for 62.5 percent of the world’s farmed food fish production, as compared with 57.9 percent in 2000. Mariculture and coastal aquaculture collectively produced 30.8 million tonnes of aquatic animals in 2018. Despite technological developments in marine finfish aquaculture, marine and coastal aquaculture produce currently many more molluscs than finfish and crustaceans.
World aquaculture production of farmed aquatic animals has been dominated by Asia, with an 89 percent share in the last two decades or so. Among major producing countries, Egypt, Chile, India, Indonesia, Viet Nam, Bangladesh and Norway have consolidated their share in regional or world production to varying degree over the past two decades.
FISHERS AND FISH FARMERSIn 2018, an estimated 59.51 million people were engaged in the primary sector of fisheries and aquaculture (Table 12), 14 percent of them women. In total, about 20.53 million people were employed in aquaculture and 38.98 million in fisheries, a slight increase from 2016.
Overall, the highest numbers of fishers and aquaculture workers are in Asia (85 percent of the world total). Globally, the proportion of women in the total work force in aquaculture (19 percent) is larger than that in fisheries (12 percent). Overall, women play a crucial role throughout the fish value chain, providing labour in both commercial and artisanal fisheries.
Where appropriate technologies and capital are at their disposal, they also act as small-scale entrepreneurs, particularly in household-level cottage operations. Many authors and non-governmental organizations (NGOs) report that one out of two seafood workers is a woman, when both the primary and secondary seafood sectors are considered. Gender studies and approaches have multiplied and have shown how women are often assigned the most unstable roles, or poorly paid or unpaid positions that require lower qualifications – most often in the secondary sector – and are under-recognized or not recognized at all in the sector.
THE STATUS OF THE FISHING FLEETIn 2018, the global total of fishing vessels, from small undecked and non-motorized boats to large industrial vessels, was estimated to be 4.56 million, a 2.8 percent decrease from 2016. Asia continues to have the largest f leet with 3.1 million vessels, 68 percent of the global total.
The global total of motorized vessels has remained steady at an estimated 2.86 million vessels, or 63 percent of the total f leet. This stability masks regional trends, including decreases since 2000 in Europe and 2013 in China due to efforts to reduce f leet sizes. In 2018, about 82 percent of the motorized fishing vessels (which had a known length classification) in the world were in the LOA class of less than 12 m, the majority of which were undecked, and those small
THE STATE OF WORLD FISHERIES AND AQUACULTURE 2020 IN BRIEF

| 12 |
PART 1
| 12 |
vessels dominated in all regions. Worldwide, FAO estimated there were about 67 800 fishing vessels with an LOA of at least 24 m.
Despite the global dominance of small vessels, estimations of their numbers are
likely to be less accurate, as, unlike industrial vessels, they are often not subject to licensing and registration requirements. The lack of information and reporting is particularly acute for inland water fleets, which are often entirely omitted from national or local registries.
TABLE 12 WORLD EMPLOYMENT FOR FISHERS AND FISH FARMERS, BY REGION1995 2000 2005 2010 2015 2018
(thousands)Fisheries and aquaculture
Africa 2 812 3 348 3 925 4 483 5 067 5 407
Americas 2 072 2 239 2 254 2 898 3 193 2 843
Asia 31 632 40 434 44 716 49 427 49 969 50 385
Europe 476 783 658 648 453 402
Oceania 466 459 466 473 479 473
Total 37 456 47 263 52 019 57 930 59 161 59 509
Fisheries
Africa 2 743 3 247 3 736 4 228 4 712 5 021
Americas 1 793 1 982 2 013 2 562 2 816 2 455
Asia 24 205 28 079 29 890 31 517 30 436 30 768
Europe 378 679 558 530 338 272
Oceania 460 451 458 467 469 460
Total 29 579 34 439 36 655 39 305 38 771 38 976
Aquaculture
Africa 69 100 189 255 355 386
Americas 279 257 241 336 377 388
Asia 7 426 12 355 14 826 17 910 19 533 19 617
Europe 98 104 100 118 115 129
Oceania 6 8 8 6 10 12
Total 7 878 12 825 15 364 18 625 20 390 20 533
NOTE: The regional and global totals have been adjusted in some cases as a result of extended work on the dataset to revise historical data and improve the methodologies applied for estimations.SOURCE: FAO.
| 13 |
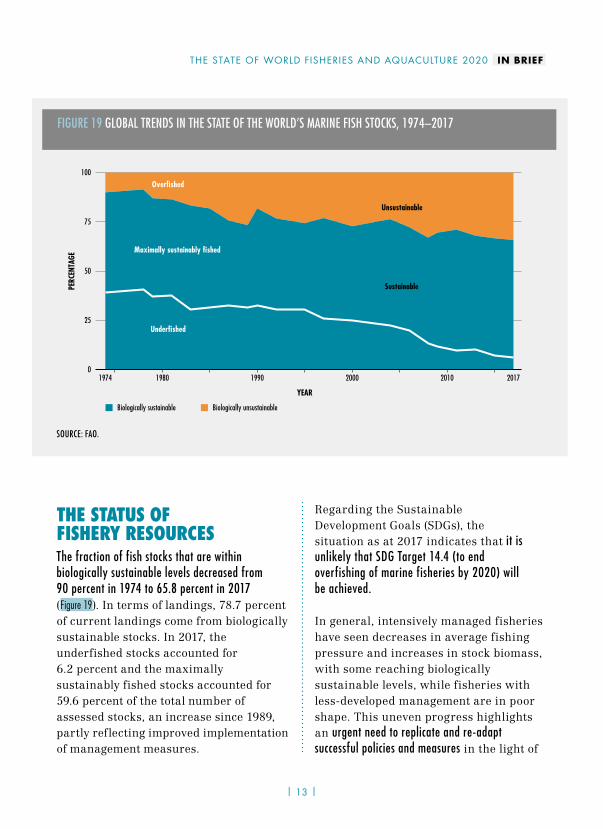
THE STATUS OF FISHERY RESOURCESThe fraction of fish stocks that are within biologically sustainable levels decreased from 90 percent in 1974 to 65.8 percent in 2017 (Figure 19). In terms of landings, 78.7 percent of current landings come from biologically sustainable stocks. In 2017, the underfished stocks accounted for 6.2 percent and the maximally sustainably fished stocks accounted for 59.6 percent of the total number of assessed stocks, an increase since 1989, partly reflecting improved implementation of management measures.
Regarding the Sustainable Development Goals (SDGs), the situation as at 2017 indicates that it is unlikely that SDG Target 14.4 (to end overfishing of marine fisheries by 2020) will be achieved.
In general, intensively managed fisheries have seen decreases in average fishing pressure and increases in stock biomass, with some reaching biologically sustainable levels, while fisheries with less-developed management are in poor shape. This uneven progress highlights an urgent need to replicate and re-adapt successful policies and measures in the light of
| 13 |
FIGURE 19 GLOBAL TRENDS IN THE STATE OF THE WORLD’S MARINE FISH STOCKS, 1974–2017
SOURCE: FAO.
Biologically sustainable Biologically unsustainable
25
50
75
100
YEAR
PERC
ENTA
GE
Sustainable
Unsustainable
Overfished
Maximally sustainably fished
Underfished
019801974 1990 2000 2010 2017
THE STATE OF WORLD FISHERIES AND AQUACULTURE 2020 IN BRIEF

| 14 |
PART 1
the realities of specific fisheries, and to focus on creating mechanisms that can effectively implement policy and regulations in fisheries with little management.
FISH UTILIZATION AND PROCESSING In 2018, about 88 percent of the 179 million tonnes of total fish production was utilized for direct human consumption, while the remaining 12 percent was used for non-food purposes (Figure 2). In 2018, live, fresh or chilled fish still represented the largest share of fish utilized for direct human consumption (44 percent).
A significant but declining proportion of world fisheries production is processed into fishmeal and fish oil. Fishmeal and fish oil are still considered the most nutritious and most digestible ingredients for farmed fish. However, their inclusion rates in compound feeds for aquaculture have shown a clear downward trend. With regard to direct human consumption, fish oil represents the richest available source of long-chain polyunsaturated fatty acids (PUFAs), which perform a wide range of critical functions for human health.
A growing share of fishmeal and fish oil, estimated at 25–35 percent, is produced from the by-products of fish processing,
FIGURE 2 WORLD FISH UTILIZATION AND APPARENT CONSUMPTION
NOTE: Excludes aquatic mammals, crocodiles, alligators and caimans, seaweeds and other aquatic plants.SOURCE: FAO.
0
3
6
9
12
15
18
21
24
0
20
40
20
40
60
80
100
120
140
160
FISH
UTI
LIZA
TION
(MIL
LION
TON
NES)
POPU
LATI
ON (B
ILLI
ONS)
AND
FOO
D SU
PPLY
(KG/
CAPI
TA)
Population Per capita apparent consumption
FOOD
NON-FOOD USES
1950 1954 1958 1962 1966 1970 1974 1978 1982 1986 1990 1994 1998 2002 2006 2010 2014 2018

| 15 |
which previously were often discarded or used as direct feed, in silage or in fertilizers. Other aquatic organisms, including seaweeds and aquatic plants, are the subject of promising experimentation and pilot projects for use in medicine, cosmetics, water treatment, food industry and as biofuels.
In fisheries and aquaculture, it is estimated that 35 percent of the global harvest is either lost or wasted every year. Effective fish loss and waste reduction requires appropriate policies, regulatory frameworks, capacity building, services and infrastructure, as well as physical access to markets. Reducing fish loss and waste can lead to a reduction in pressure on fish stocks and contribute to improving resource sustainability as well as food security.
FISH CONSUMPTIONIn the period 1961–2017, the average annual growth rate of total food fish consumption3 increased at 3.1 percent, outpacing annual population growth rate (1.6 percent). In per capita terms, food fish consumption rose from 9.0 kg (live weight equivalent) in 1961 to 20.3 kg in 2017 (Figure 26). Preliminary estimates for per capita fish consumption in 2018 currently stand at 20.5 kg (Figure 2). The expansion in consumption has been driven not only by increases in
3 The term “food fish” refers to fish destined for human consumption, thus excluding fish for non-food uses. The term “consumption” refers to apparent consumption, which is the average food available for consumption, which, for a number of reasons (for example, waste at the household level), is not equal to food intake.
production, but also by a combination of many other factors: technological developments; rising incomes worldwide; reductions in loss and waste; and increased awareness of the health benefits of fish.
Fish provided an average of only about 35 calories per capita per day in 2017, exceeding 100 calories per capita per day in countries where a preference for fish has developed and endured traditionally (e.g. Iceland) and where alternative proteins are not easily accessible (e.g. small island developing States [SIDS]). The dietary contribution of fish is more significant in terms of high-quality animal proteins, PUFAs and micronutrients of fundamental importance for diversified and healthy diets. In 2017, fish accounted for about 17 percent of total animal protein, and 7 percent of all proteins, consumed globally. Moreover, fish provided about 3.3 billion people with almost 20 percent of their average per capita intake of animal protein.
At the regional and continental levels, the lowest per capita fish consumption occurs in Africa, where it peaked at 10.5 kg in 2014 and then declined to 9.9 kg in 2017. Low fish consumption in sub-Saharan Africa is the result of a number of interconnected factors, including among others: population increasing at a higher rate than food fish supply; stagnation of fish production because of pressure on capture fisheries resources; and a poorly developed aquaculture sector.
THE STATE OF WORLD FISHERIES AND AQUACULTURE 2020 IN BRIEF
| 16 |
PART 1
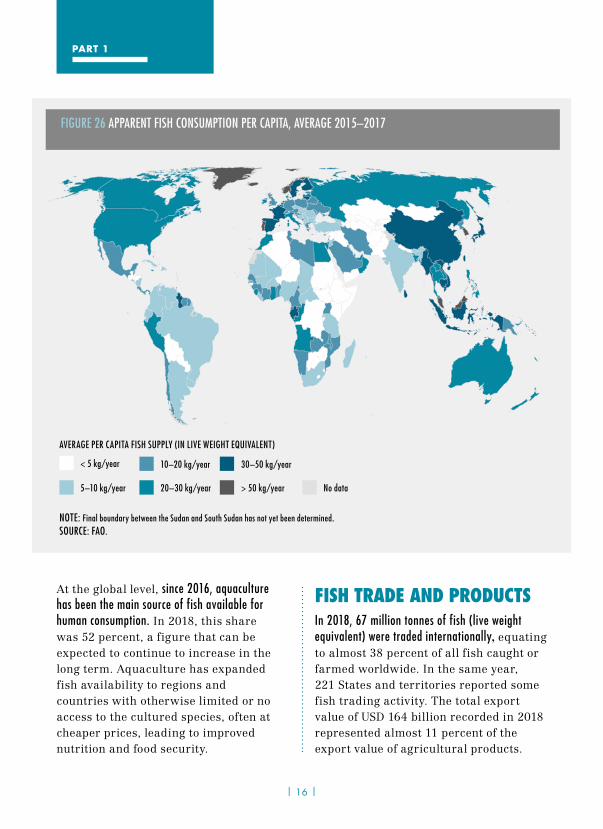
At the global level, since 2016, aquaculture has been the main source of fish available for human consumption. In 2018, this share was 52 percent, a figure that can be expected to continue to increase in the long term. Aquaculture has expanded fish availability to regions and countries with otherwise limited or no access to the cultured species, often at cheaper prices, leading to improved nutrition and food security.
FISH TRADE AND PRODUCTSIn 2018, 67 million tonnes of fish (live weight equivalent) were traded internationally, equating to almost 38 percent of all fish caught or farmed worldwide. In the same year, 221 States and territories reported some fish trading activity. The total export value of USD 164 billion recorded in 2018 represented almost 11 percent of the export value of agricultural products.
FIGURE 26 APPARENT FISH CONSUMPTION PER CAPITA, AVERAGE 2015–2017
NOTE: Final boundary between the Sudan and South Sudan has not yet been determined.SOURCE: FAO.
AVERAGE PER CAPITA FISH SUPPLY (IN LIVE WEIGHT EQUIVALENT)
No data
< 5 kg/year
5–10 kg/year
10–20 kg/year
20–30 kg/year > 50 kg/year
30–50 kg/year

FIGURE 29 TOP EXPORTERS AND IMPORTERS OF FISH AND FISH PRODUCTS IN TERMS OF VALUE, 2018
NOTE: Usually, exports are recorded at their free-on-board (FOB) value and imports at their cost, insurance and freight (CIF) value. Therefore, at the world level, the value of imports should be higher than that of exports. However, since 2011, this has not been the case. Work is under way to understand the reasons for this anomalous trend.SOURCE: FAO.
EXPORTS
Others48%
China14%
Norway7%
Viet Nam5%
India4%
Netherlands4%
RussianFederation3%
Others40%
Spain5%
China9%
United Statesof America14%
Japan9%
Republicof Korea4%
Netherlands3%
Germany4%
Italy4%
France4%
Sweden3%
Chile4%
United Statesof America4%
Thailand4%
Canada3%
IMPORTS
| 17 |
THE STATE OF WORLD FISHERIES AND AQUACULTURE 2020 IN BRIEF

| 18 |
PART 1
| 18 |
From 1976 to 2018, the value of global exports of fish and fish products increased at an annual rate of 8 percent in nominal terms and of 4 percent in real terms. Available estimates for 2019 suggest that total trade value contracted by about 2 percent in both quantity and value compared with the previous year. The outbreak of coronavirus disease (COVID-19) has already negatively impacted trade among key exporters and importers in 2020.
In addition to being by far the major fish producer, China has also been the main exporter of fish and fish products since 2002. Since 2004, Norway has been the second major exporter, now followed by Viet Nam (Figure 29). While developed
markets still dominate fish imports with the European Union4 followed by the United States of America and Japan, the importance of developing countries as consumers as well as producers of fish and fish products has been steadily increasing. In 2018, fish imports by developing countries represented 31 percent of the global total by value and 49 percent by quantity (live weight).
Over 90 percent of the quantity (live weight equivalent) of trade in fish and fish products consisted of processed products (i.e. excluding live and fresh whole fish) in 2018, with frozen products representing the highest share. About 78 percent of the quantity exported consisted of products destined for human consumption. n
4 Here, the European Union is considered as the EU27.
| 19 |
PART 2SUSTAINABILITY IN ACTION
Part 2, Sustainability in action, focuses on various themes on fisheries and aquaculture
sustainability. Below are condensed versions of its sections on the Code and on aspects of securing sustainability.
THE TWENTY-FIFTH ANNIVERSARY OF THE CODE OF CONDUCT FOR RESPONSIBLE FISHERIESHow has the Code supported the adoption of sustainable practices?The Code of Conduct for Responsible Fisheries (the Code), unanimously adopted by FAO Members in 1995, is a foundational document that sets out globally agreed principles and standards for the use of fisheries and aquaculture resources, including through regional mechanisms and cooperation, to ensure sustainable use of aquatic living resources in harmony with the environment.
The Code facilitates and promotes technical and financial cooperation for the conservation and management of fisheries resources, for research on fisheries and associated ecosystems, and for trade in fish and fishery products. It promotes the contribution
of fisheries to food security, giving priority to the nutritional needs of resource-dependent communities, and calls for protection of living aquatic resources and their habitats.
The Code is global in scope, and is directed towards: FAO Members and Non-Members; fishing entities; subregional, regional and global organizations, whether governmental or non-governmental; and all persons concerned with the governance of fishery and aquaculture resources and their management and development, such as fishers, those engaged in processing and marketing of fish and fishery products, and other users of the aquatic environment in relation to fisheries. The Code is voluntary in nature; however, certain parts are based on relevant rules of international law.
In the past 25 years, FAO and many other organizations and institutions have worked to promote the implementation of the Code and its supporting instruments. These supporting instruments, consisting of some 50 international and technical guidelines, 4 international plans of action and 3 strategies, have developed and adapted to support the international community in meeting emerging challenges.

| 20 |
PART 2
The Code and its instruments have shaped fisheries policies, legal and management frameworks worldwide, instilling key principles of sustainable and responsible development of fisheries and aquaculture. The Code has also served as an important catalyst for incorporating conservation and environmental considerations into fisheries and aquaculture management, and inspired the development of the ecosystem approach to fisheries and aquaculture. Moreover, the Code provides the guidance needed to shape how to address new and emerging issues in fisheries, such as sustainable aquaculture development, ocean degradation, social responsibility, biodiversity conservation and climate change. Thus, the Code will be fundamental to international work in fisheries and aquaculture in support of the 2030 Agenda for Sustainable Development (2030 Agenda).
Progress on the road to sustainability – what the Code questionnaire revealsA mandate of COFI, as stipulated by Article 4 of the Code, is that FAO will report to COFI every two years concerning implementation of the Code (Figure 40). This task is largely performed using the FAO Questionnaire on the Implementation of the Code of Conduct for Responsible Fisheries and Related Instruments. FAO sends the questionnaire to all Members, regional fishery bodies (RFBs), and selected non-governmental organizations biennially, and the responses form the
basis of a progress report for discussion at COFI. To date, FAO has prepared 11 such reports.
In 2014, the Code questionnaire was digitalized, permitting participants to answer the questions succinctly, and helping with reporting on the application of the Code, as well as related developments.
At the regional and global level, the questionnaire responses indicate a strong trend toward improvements in fisheries management in both marine fisheries and inland fisheries. Another positive trend in the past decade has been the use of the ecosystem approach to fisheries (EAF) as the preferred fisheries management system. Three-quarters of Members report they have adopted the EAF, and most of these countries report having taken appropriate management actions and established ecological, socio-economic and governance objectives.
Members have been expressing an interest in better guidance on the governance of small-scale fisheries since the mid-2000s, especially with regard to safety at sea since 2009. The questionnaire responses also indicate a rise in the mechanisms through which small-scale fishers and fishworkers can contribute to decision-making processes, and more than three-quarters of these mechanisms would include the promotion of the active participation of women.
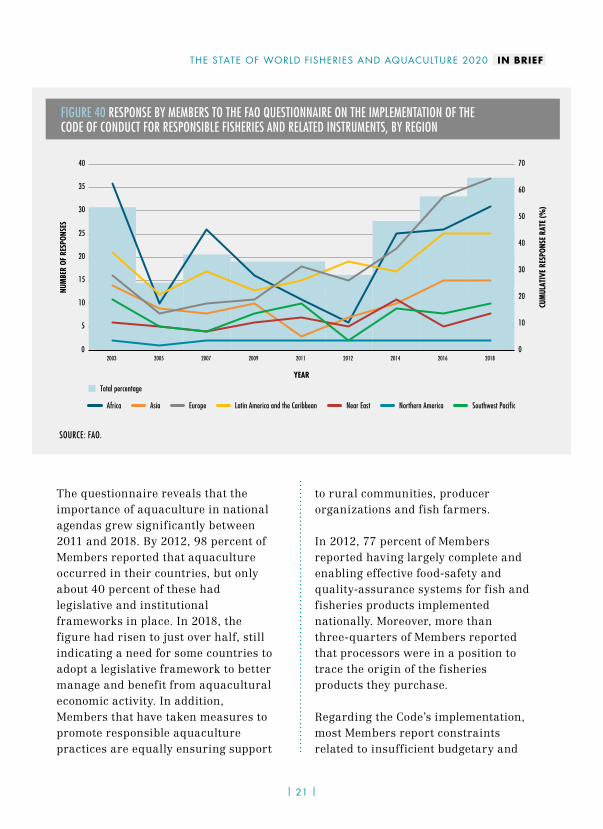
The questionnaire reveals that the importance of aquaculture in national agendas grew significantly between 2011 and 2018. By 2012, 98 percent of Members reported that aquaculture occurred in their countries, but only about 40 percent of these had legislative and institutional frameworks in place. In 2018, the figure had risen to just over half, still indicating a need for some countries to adopt a legislative framework to better manage and benefit from aquacultural economic activity. In addition, Members that have taken measures to promote responsible aquaculture practices are equally ensuring support
to rural communities, producer organizations and fish farmers.
In 2012, 77 percent of Members reported having largely complete and enabling effective food-safety and quality-assurance systems for fish and fisheries products implemented nationally. Moreover, more than three-quarters of Members reported that processors were in a position to trace the origin of the fisheries products they purchase.
Regarding the Code’s implementation, most Members report constraints related to insufficient budgetary and
| 21 |
FIGURE 40 RESPONSE BY MEMBERS TO THE FAO QUESTIONNAIRE ON THE IMPLEMENTATION OF THE CODE OF CONDUCT FOR RESPONSIBLE FISHERIES AND RELATED INSTRUMENTS, BY REGION
SOURCE: FAO.
Total percentage
YEAR
0
10
20
30
40
50
60
70
0
5
10
15
20
25
30
35
40
2003 2005 2007 2009 2011 2012 2014 2016 2018
Africa Asia Latin America and the CaribbeanEurope Near East Northern America Southwest Pacific
NUM
BER
OF R
ESPO
NSES
CUM
ULAT
IVE
RESP
ONSE
RAT
E (%
)
THE STATE OF WORLD FISHERIES AND AQUACULTURE 2020 IN BRIEF

| 22 |
PART 2
human resources. To overcome these constraints, Members highlighted the need for: access to more financial and human resources; training and awareness raising; and improvements in research and statistics.
Overall, the questionnaire has proved an important tool for reporting by Members and RFBs on their implementation of the Code globally. Moreover, in recent years, it has shown itself adaptable to emerging issues, and reporting on related SDG targets.
SECURING FISHERIES AND AQUACULTURE SUSTAINABILITYSustainability, tenure, access and user rightsIn marine and inland fisheries, the connection between sustainable resource use and secure tenure, user and access rights is widely recognized. There is also increasing acknowledgement that environmental sustainability is intrinsically linked to and dependent on the social and economic sustainability of coastal and inland fisheries communities in the long term. The livelihoods of many, particularly among the rural poor, are based on having secure and equitable access to and management of fisheries and aquaculture resources, as these resources provide shelter and highly nutritious food, underpin social, cultural and religious practices, and are a central factor in equitable economic growth and social cohesion.
If properly designed, tenure and user rights systems can secure the activity of historical users and dependent communities, and establish exclusive access to the resource and create the conditions to help avoid overfishing. In doing so, fishing becomes a long-term activity where the resource users are responsible for the future of the sector and play an important role as stewards of the resource. However, as rights are allocated and limited, they also become valuable for stakeholders inside and outside the sector, and this may render the sector subject to investment forces with different objectives from those of historical users and the communities that have relied on the local aquatic resources.
Different ways of recognizing and allocating tenure, user and access rights generate important social, economic and environmental trade-offs. It is vital to understand this point as aquatic resources are gaining attention in national policies for economic development and conservation of natural resources. Competition over resources within the fisheries and aquaculture sector can arise where tenure systems are not clearly defined or not properly enforced.
A fundamental condition for ensuring appropriate tenure systems is that all stakeholders involved in the development and implementation process have the necessary capacity to fulfil their respective role in responsible governance. National fisheries

| 23 |
administrations should understand the different tenure options and their respective trade-offs. Equally important is the capacity to apply participatory methods to conduct consultations with key actors to identify and operationalize the most appropriate tenure and user rights systems. The effectiveness of a given tenure system depends, to a large extent, on the collective involvement and ownership of the system by the resource users.
The 2030 Agenda is a strong commitment to leave no one behind, and SDG Target 14.b calls specifically for small-scale artisanal fishers to be provided with access to marine
resources and markets. Such access needs to be underpinned by secure tenure and user rights to the aquatic resources that form the basis for social and cultural well-being, livelihoods and sustainable development of communities, including both women and men, that depend on fisheries and aquaculture. Advancing knowledge on tenure and user rights is a crucial step for securing sustainability and achieving the objectives of the SDGs. This is true in relation to how the world’s marine and inland capture fisheries, coastal and aquatic spaces are accessed, used and managed. It also holds regarding their interactions with land, water and forest tenure and rights. n
THE STATE OF WORLD FISHERIES AND AQUACULTURE 2020 IN BRIEF

| 24 |
PART 3OUTLOOK AND EMERGING ISSUES
Part 3, Outlook and emerging issues, outlines a new vision for capture fisheries among
its other forward-looking content. Below is a shortened version of the section containing FAO’s projections up until 2030.
FISHERIES AND AQUACULTURE PROJECTIONSNote: The COVID-19 pandemic has affected most countries in the world, with severe impacts on the global economy. The following projections are based on the assumption that there will be a significant disruption in the short run for production, consumption and trade, with a recovery in late 2020 or early 2021.
ProductionTotal fish production is expected to expand from 179 million tonnes in 2018 to 204 million tonnes in 2030. Aquaculture production is projected to reach 109 million tonnes in 2030, an increase of 32 percent (26 million tonnes) over 2018. Yet, the average annual growth rate of aquaculture should slow from 4.6 percent in 2007–2018 to 2.3 percent in 2019–2030. As initiated with China’s Thirteenth Five-Year Plan (2016–2020),
the country’s policies in the next decade are expected to continue the transition from extensive to intensive aquaculture.
Asia will continue to dominate the aquaculture sector and will be responsible for more than 89 percent of the increase in production by 2030. The sector is expected to expand most in Africa (up 48 percent), driven by the additional culturing capacity put in place in recent years.
The majority (62 percent) of global aquaculture production in 2030 will be composed of freshwater species, such as carp and Pangas catfish. Production of higher-value species, such as shrimps, salmon and trout, is also projected to continue to grow.
Capture fisheries production is projected to stay at high levels, reaching about 96 million tonnes in 2030. Factors influencing sustained capture fisheries production include: (i) increased catches in areas where stocks are recovering; (ii) growth in catches in waters of the few countries with underfished resources; and (iii) improved utilization of the harvest. The share of capture fisheries production reduced into fishmeal and fish oil should decline slightly in the next decade.

| 25 || 25 |
PricesIn nominal terms, prices in the fishery and aquaculture sector are expected to rise in the long term up to 2030. A number of factors explain this tendency. On the demand side, these include improved income, population growth and higher meat prices. On the supply side, stable capture fisheries production, slowing growth in aquaculture production, and cost increase for inputs are likely to play a role. The increase in the average price of farmed fish will be greater than that of captured fish. However, in real terms, all average prices are expected to
decline slightly over the projection period, while remaining relatively high.
ConsumptionThe share of fish production destined for human consumption is expected to continue to grow, reaching 89 percent by 2030. The main factors behind this increase will be a combination of high demand resulting from rising incomes and urbanization, linked with the expansion of fish production, improvements in post-harvest methods and distribution channels expanding the commercialization of fish. Demand will
FIGURE 56 INCREASING ROLE OF AQUACULTURE
SOURCE: FAO.
From capture fisheries
From aquaculture
GLOBAL CAPTURE AND AQUACULTURE PRODUCTION
GLOBAL FOOD FISH CONSUMPTION
Capture
Aquaculture
2018 203052% 48% 59% 41%
2018 54%46% 2030 47%53%

| 26 |
PART 3
also be stimulated by changes in dietary trends. World food fish consumption in 2030 is projected to be 18 percent higher than in 2018.
In per capita terms, world fish consumption is projected to reach 21.5 kg in 2030, up from 20.5 kg in 2018. In 2030, about 59 percent of the fish available for human consumption is expected to originate from aquaculture production (Figure 56).
In Africa, per capita fish consumption is expected to decrease slightly by 0.2 percent per year up to 2030, declining from 10.0 kg in 2018 to 9.8 kg in 2030. The projected decline in per capita fish consumption in Africa raises food-security concerns.
TradeIt is projected that about 36 percent of total fish production will be exported in 2030. In quantity terms, world trade in fish for human consumption is expected to grow by 9 percent in the projection period, and to reach more than 54 million tonnes in live weight equivalent in 2030. Overall, the average annual growth rate of exports is projected to decline from 2 percent in 2007–2018 to 1 percent in 2019–2030. This can be partly explained by: (i) the slower expansion of production; (ii) stronger domestic demand in some of the major producing and exporting countries; and (iii) rather high fish prices. Aquaculture will contribute to a growing share of international trade in
fishery commodities for human consumption. The bulk of the growth in fish exports is projected to originate from Asia, which will account for about 73 percent of the additional exported volumes by 2030.
Summary of main outcomes from the projections } World fish production, consumption and trade are expected to increase, but with a growth rate that will slow over time.
} World capture production is projected to grow moderately owing to increased production in other areas if resources are properly managed.
} The world’s growth in aquaculture production, despite its deceleration, is anticipated to fill the supply–demand gap.
} While prices will all increase in nominal terms, they should decline but remain high in real terms.
} Food fish supply will increase in all regions, while per capita fish consumption is expected to decline in Africa, raising concerns in terms of food security.
} Trade in fish and fish products is expected to increase more slowly than in the past decade.
} The new fisheries and aquaculture reforms and policies to be implemented by China are expected to have a noticeable impact at the world level. n

| 27 |
The 2020 edition of The State of World Fisheries and Aquaculture has a particular focus on sustainability. This reflects a number of specific considerations. First, 2020 marks the twenty-fifth anniversary of the Code of Conduct for Responsible Fisheries (the Code). Second, several Sustainable Development Goal indicators mature in 2020. Third, FAO hosted the International Symposium on Fisheries Sustainability in late 2019, and fourth, 2020 sees the finalization of specific FAO guidelines on sustainable aquaculture growth, and on social sustainability along value chains.
While Part 1 retains the format of previous editions, the structure of the rest of the publication has been revised. Part 2 opens with a special section marking the twenty-fifth anniversary of the Code. It also focuses on issues coming to the fore, in particular, those related to Sustainable Development Goal 14 and its indicators for which FAO is the “custodian” agency. In addition, Part 2 covers various aspects of fisheries and aquaculture sustainability. The topics discussed range widely, from data and information systems to ocean pollution, product legality, user rights and climate change adaptation. Part 3 now forms the final part of the publication, covering projections and emerging issues such as new technologies and aquaculture biosecurity. It concludes by outlining steps towards a new vision for capture fisheries.
The State of World Fisheries and Aquaculture aims to provide objective, reliable and up-to-date information to a wide audience – policymakers, managers, scientists, stakeholders and indeed everyone interested in the fisheries and aquaculture sector.
2020THE STATE OF
WORLD FISHERIES AND AQUACULTURE
SUSTAINABILITY IN ACTION
THE STATE OFTHE WORLD
Some rights reserved. This work is available under a CC BY-NC-SA 3.0 IGO licence
The State of World Fisheries and Aquaculture 2020 (full text) ©
FAO
, 202
0C
A92
31EN
/1/0
6.20