Embed Size (px)
Citation preview

WWW.AMERICANPROGRESS.ORG
AP PH
OTO
/JOH
N BA
ZEMO
RE
The State of Women in AmericaA 50-State Analysis of How Women Are Faring Across the Nation
By Anna Chu and Charles Posner September 2013

The State of Women in AmericaA 50-State Analysis of How Women Are Faring Across the Nation
By Anna Chu and Charles Posner September 2013

1 Introduction and summary 2 How women are faring across the states
6 Economic security 9 The wage gap
11 Minimum wage
13 Poverty
15 Paid family and medical leave policies
17 Early childhood education
19 The leadership gap 22 Women’s leadership in public office
24 Women’s leadership at work
26 Women’s health and healthy families 29 Access to reproductive health services
34 Implementation of Affordable Care Act protections
37 Ensuring healthy pregnancy and delivery
39 Conclusion
40 Methodology 41 Ranking the states
46 Grading the states
47 Author bios & Acknowledgements
48 Endnotes
Contents
1 Center for American Progress | The State of Women in America: A 50-State Analysis of How Women Are Faring Across the Nation
Introduction and summary
The role of women in the United States has changed dramatically over the past few decades. For one, more and more women have taken on new responsibilities outside the home by joining the paid workforce. While women made up only about one-third of the workforce in 1969, women today make up almost half of all work-ers in the United States.1 Women are also stepping up to lead the country; a record number of women ran for public office in 2012, and a record-high percentage of women are serving in Congress.2 In addition to making progress on issues of eco-nomics and leadership, women have made progress on health issues, which impact women’s personal well-being, as well as their economic security. Over the past few years, women have been able to end gender discrimination by big insurance com-panies and gain free contraception coverage because of the Affordable Care Act.
Despite women’s advancements, however, substantial inequalities remain. Although an increasing number of women are either the sole breadwinner for their family or share the role with their partners, women in the United States are paid only 77 cents for every dollar a man makes.3 The pay gap is even larger for women of color. On average, African American women make 64 cents for every dollar that white men make.4 While 2012 was a watershed year for women in terms of getting elected to public office, women still comprise only 18.1 percent of Congress, despite making up more than half of the U.S. population.5 They also face challenges on health issues, as 2012 saw continued conservative efforts to erode women’s ability to make their own decisions about their health and well-being.
A deeper examination shows that disparities for women also exist among states. Women in Vermont, for example, make on average close to 85 cents for every dollar a man makes, while women in Wyoming make only 64 cents—more than 25 percent less than women in Vermont.6 On leadership, 15 states have no female elected leaders in the House of Representatives or the Senate. Lastly, while less than 10 percent of women in Vermont, Wisconsin, Hawaii, and Massachusetts are uninsured, nearly 25 percent of women in Texas do not have health insurance.7
2 Center for American Progress | The State of Women in America: A 50-State Analysis of How Women Are Faring Across the Nation
How women are faring across the states
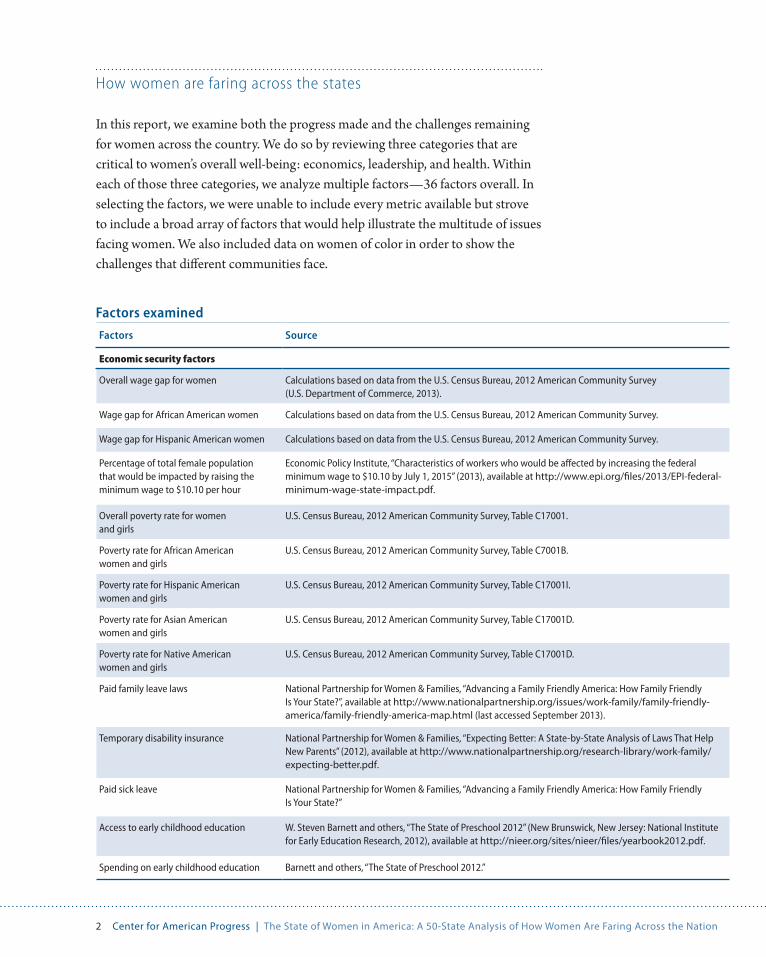
In this report, we examine both the progress made and the challenges remaining for women across the country. We do so by reviewing three categories that are critical to women’s overall well-being: economics, leadership, and health. Within each of those three categories, we analyze multiple factors—36 factors overall. In selecting the factors, we were unable to include every metric available but strove to include a broad array of factors that would help illustrate the multitude of issues facing women. We also included data on women of color in order to show the challenges that different communities face.
Factors examined
Factors Source
Economic security factors
Overall wage gap for women Calculations based on data from the U.S. Census Bureau, 2012 American Community Survey (U.S. Department of Commerce, 2013).
Wage gap for African American women Calculations based on data from the U.S. Census Bureau, 2012 American Community Survey.
Wage gap for Hispanic American women Calculations based on data from the U.S. Census Bureau, 2012 American Community Survey.
Percentage of total female population that would be impacted by raising the minimum wage to $10.10 per hour
Economic Policy Institute, “Characteristics of workers who would be affected by increasing the federal minimum wage to $10.10 by July 1, 2015” (2013), available at http://www.epi.org/files/2013/EPI-federal-minimum-wage-state-impact.pdf.
Overall poverty rate for women and girls
U.S. Census Bureau, 2012 American Community Survey, Table C17001.
Poverty rate for African American women and girls
U.S. Census Bureau, 2012 American Community Survey, Table C7001B.
Poverty rate for Hispanic American women and girls
U.S. Census Bureau, 2012 American Community Survey, Table C17001I.
Poverty rate for Asian American women and girls
U.S. Census Bureau, 2012 American Community Survey, Table C17001D.
Poverty rate for Native American women and girls
U.S. Census Bureau, 2012 American Community Survey, Table C17001D.
Paid family leave laws National Partnership for Women & Families, “Advancing a Family Friendly America: How Family Friendly Is Your State?”, available at http://www.nationalpartnership.org/issues/work-family/family-friendly-america/family-friendly-america-map.html (last accessed September 2013).
Temporary disability insurance National Partnership for Women & Families, “Expecting Better: A State-by-State Analysis of Laws That Help New Parents” (2012), available at http://www.nationalpartnership.org/research-library/work-family/expecting-better.pdf.
Paid sick leave National Partnership for Women & Families, “Advancing a Family Friendly America: How Family Friendly Is Your State?”
Access to early childhood education W. Steven Barnett and others, “The State of Preschool 2012” (New Brunswick, New Jersey: National Institute for Early Education Research, 2012), available at http://nieer.org/sites/nieer/files/yearbook2012.pdf.
Spending on early childhood education Barnett and others, “The State of Preschool 2012.”
3 Center for American Progress | The State of Women in America: A 50-State Analysis of How Women Are Faring Across the Nation
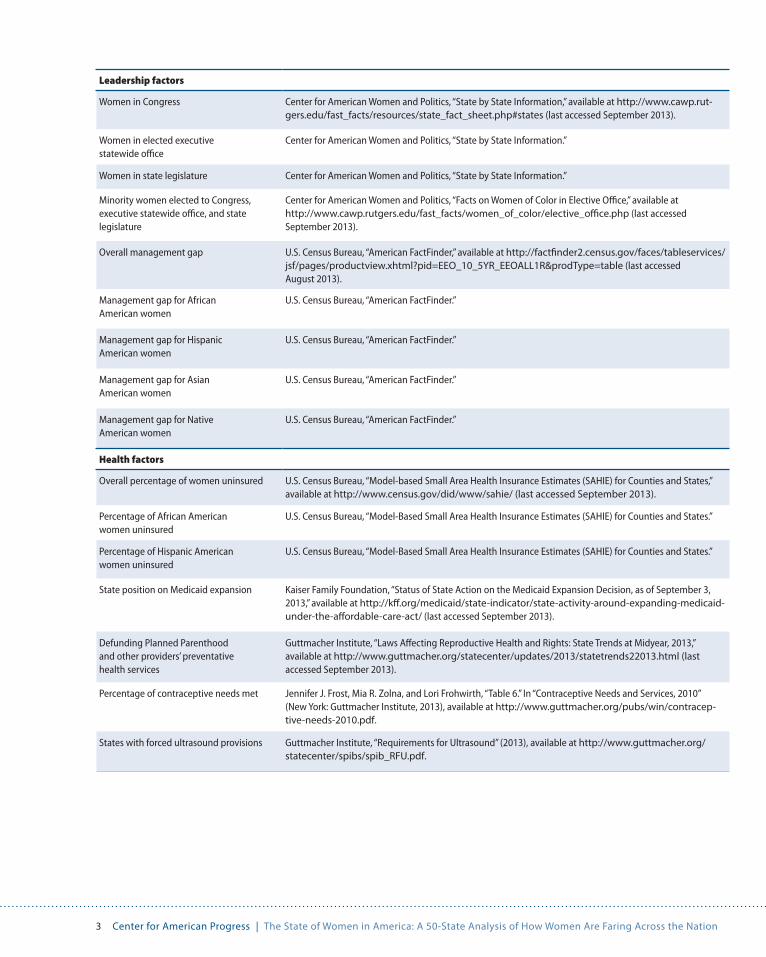
Leadership factors
Women in Congress Center for American Women and Politics, “State by State Information,” available at http://www.cawp.rut-gers.edu/fast_facts/resources/state_fact_sheet.php#states (last accessed September 2013).
Women in elected executive statewide office
Center for American Women and Politics, “State by State Information.”
Women in state legislature Center for American Women and Politics, “State by State Information.”
Minority women elected to Congress, executive statewide office, and state legislature
Center for American Women and Politics, “Facts on Women of Color in Elective Office,” available at http://www.cawp.rutgers.edu/fast_facts/women_of_color/elective_office.php (last accessed September 2013).
Overall management gap U.S. Census Bureau, “American FactFinder,” available at http://factfinder2.census.gov/faces/tableservices/jsf/pages/productview.xhtml?pid=EEO_10_5YR_EEOALL1R&prodType=table (last accessed August 2013).
Management gap for African American women
U.S. Census Bureau, “American FactFinder.”
Management gap for Hispanic American women
U.S. Census Bureau, “American FactFinder.”
Management gap for Asian American women
U.S. Census Bureau, “American FactFinder.”
Management gap for Native American women
U.S. Census Bureau, “American FactFinder.”
Health factors
Overall percentage of women uninsured U.S. Census Bureau, “Model-based Small Area Health Insurance Estimates (SAHIE) for Counties and States,” available at http://www.census.gov/did/www/sahie/ (last accessed September 2013).
Percentage of African American women uninsured
U.S. Census Bureau, “Model-Based Small Area Health Insurance Estimates (SAHIE) for Counties and States.”
Percentage of Hispanic American women uninsured
U.S. Census Bureau, “Model-Based Small Area Health Insurance Estimates (SAHIE) for Counties and States.”
State position on Medicaid expansion Kaiser Family Foundation, “Status of State Action on the Medicaid Expansion Decision, as of September 3, 2013,” available at http://kff.org/medicaid/state-indicator/state-activity-around-expanding-medicaid-under-the-affordable-care-act/ (last accessed September 2013).
Defunding Planned Parenthood and other providers’ preventative health services
Guttmacher Institute, “Laws Affecting Reproductive Health and Rights: State Trends at Midyear, 2013,” available at http://www.guttmacher.org/statecenter/updates/2013/statetrends22013.html (last accessed September 2013).
Percentage of contraceptive needs met Jennifer J. Frost, Mia R. Zolna, and Lori Frohwirth, “Table 6.” In “Contraceptive Needs and Services, 2010” (New York: Guttmacher Institute, 2013), available at http://www.guttmacher.org/pubs/win/contracep-tive-needs-2010.pdf.
States with forced ultrasound provisions Guttmacher Institute, “Requirements for Ultrasound” (2013), available at http://www.guttmacher.org/statecenter/spibs/spib_RFU.pdf.

4 Center for American Progress | The State of Women in America: A 50-State Analysis of How Women Are Faring Across the Nation
Unconstitutional bans on abortion Guttmacher Institute, “State Policies on Later Abortions” (2013), available at http://www.guttmacher.org/statecenter/spibs/spib_PLTA.pdf.
Restrictive counseling and waiting-period restrictions
Guttmacher Institute, “Counseling and Waiting Periods for Abortion” (2013), available at http://www.guttmacher.org/statecenter/spibs/spib_MWPA.pdf.
Targeted regulation of abortion provider, or TRAP, laws
Guttmacher Institute, “Targeted Regulation of Abortion Providers” (2013), available at http://www.guttmacher.org/statecenter/spibs/spib_TRAP.pdf.
Maternal mortality rate National Women’s Law Center, “Maternal Mortality Rate (per 100,000),” available at http://hrc.nwlc.org/status-indicators/maternal-mortality-rate-100000 (last accessed September 2013).
Infant mortality rate National Center for Health Statistics, “Infant Mortality Rates, By State: 2010” (2010), available at http://www.cdc.gov/nchs/pressroom/states/INFANT_MORTALITY_RATES_STATE_2010.pdf.
Rate of availability of obstetrician-gynecolo-gists, or OB-GYNs
U.S. Bureau of Labor Statistics, “Occupational Employment and Wages, May 2012,” available at http://www.bls.gov/oes/current/oes291064.htm (last accessed September 2013).
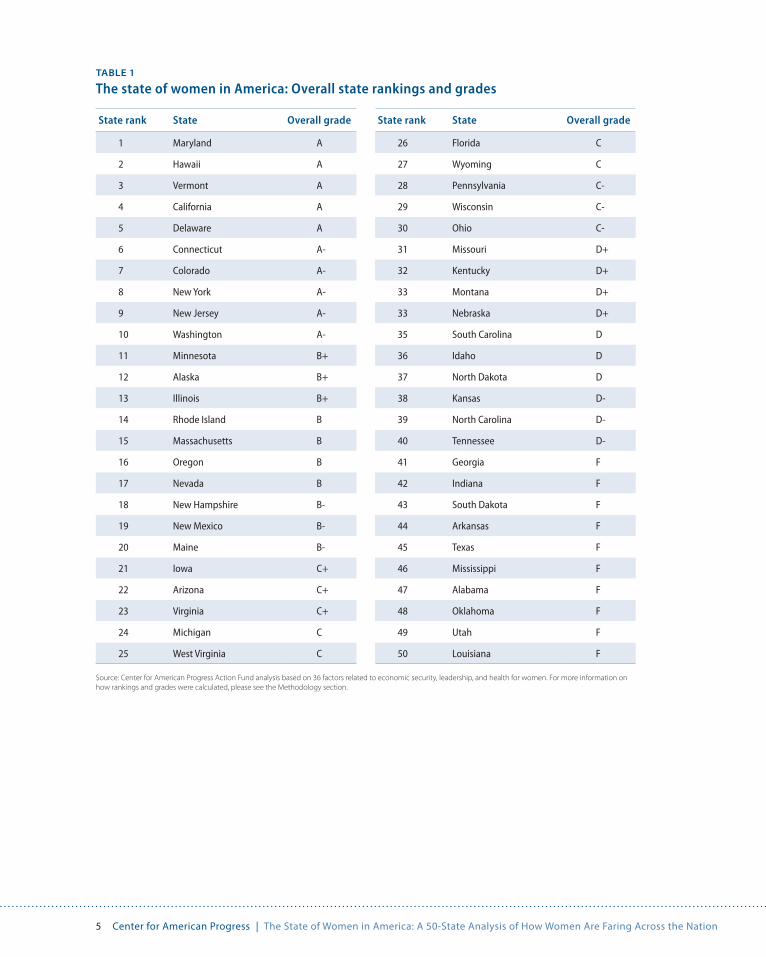
We ranked each state on all 36 factors and then arrived at overall rankings in the categories of economics, leadership, and health by taking the averages of how states ranked on the factors within those categories. We then gave each state an overall national ranking, taken from an average of how the states rank across the three categories.
Our analysis determined that on matters of economics, leadership, and health, women, on average, fare the best in Maryland and the worst in Louisiana. More than 22 percent of women in Louisiana are in poverty, compared to 11 percent of women in Maryland. Additionally, taking in all of the leadership factors consid-ered, Maryland ranks first in the nation in terms of women reaching leadership positions in the public and private sector. Meanwhile, Louisiana receives a D- on overall leadership factors.
Table 1 details how all 50 states rank on issues of economics, leadership, and health for women based on the 36 factors examined in this report. For a full expla-nation of our methodology, please see the appendix.
5 Center for American Progress | The State of Women in America: A 50-State Analysis of How Women Are Faring Across the Nation
TABLE 1
The state of women in America: Overall state rankings and grades
Source: Center for American Progress Action Fund analysis based on 36 factors related to economic security, leadership, and health for women. For more information on how rankings and grades were calculated, please see the Methodology section.
State rank State Overall grade
1 Maryland A
2 Hawaii A
3 Vermont A
4 California A
5 Delaware A
6 Connecticut A-
7 Colorado A-
8 New York A-
9 New Jersey A-
10 Washington A-
11 Minnesota B+
12 Alaska B+
13 Illinois B+
14 Rhode Island B
15 Massachusetts B
16 Oregon B
17 Nevada B
18 New Hampshire B-
19 New Mexico B-
20 Maine B-
21 Iowa C+
22 Arizona C+
23 Virginia C+
24 Michigan C
25 West Virginia C
State rank State Overall grade
26 Florida C
27 Wyoming C
28 Pennsylvania C-
29 Wisconsin C-
30 Ohio C-
31 Missouri D+
32 Kentucky D+
33 Montana D+
33 Nebraska D+
35 South Carolina D
36 Idaho D
37 North Dakota D
38 Kansas D-
39 North Carolina D-
40 Tennessee D-
41 Georgia F
42 Indiana F
43 South Dakota F
44 Arkansas F
45 Texas F
46 Mississippi F
47 Alabama F
48 Oklahoma F
49 Utah F
50 Louisiana F
6 Center for American Progress | The State of Women in America: A 50-State Analysis of How Women Are Faring Across the Nation
Economic security
Women play an increasingly important role in our nation’s economy and our fami-lies’ pocketbooks. In 1967, women made up less than 29 percent of the U.S. work-force;8 today, they comprise nearly half of the nation’s workforce.9 Their incomes are also critical to their families’ economic security, as one in four U.S. families now have a mother who is either the sole or primary breadwinner for the family.10
Despite how important women are to our national economy and to their fami-lies, women are struggling to achieve economic security for themselves and their families and to balance the competing demands for their time. Women still receive only 77 cents for every dollar men make11 and make up the majority of minimum-wage workers. And too many women live in poverty.
Table 2 ranks how women are doing economically across the nation, looking at the following 14 key measures that affect the economic standing of families:
• Overall wage gap
• Wage gap for African American women
• Wage gap for Hispanic women
• Percentage of the population that would be impacted by raising the minimum wage to $10.10 per hour
• Percentage of women in poverty
• Percentage of African American women in poverty
• Percentage of Hispanic women in poverty
• Percentage of Asian American women in poverty

7 Center for American Progress | The State of Women in America: A 50-State Analysis of How Women Are Faring Across the Nation
• Percentage of Native American women in poverty
• Paid family leave policies
• Temporary disability insurance policies
• Paid sick leave policies
• Early childhood education
• Pre-K average spending per child
We used these measures because they often have a unique impact on women and can reveal attitudes about women and their roles in the workplace. Based on these factors, women are faring the very worst economically in Mississippi, followed closely by women in Wyoming and Alabama. In contrast, women are doing best economically in Maryland.
Women in Mississippi, Wyoming, and Alabama all face similar challenges. Women in all three states suffer from high wage gaps.12 In fact, Wyoming has the larg-est wage gap for women in the country.13 Meanwhile, women in Mississippi and Alabama have some of the highest rates of poverty in the country.14 Mississippi actually has the worst poverty rate for women in the nation.15 What’s more, none of these three states have any sort of paid family, sick, or temporary disability leave policies.
In contrast, Maryland, and Nevada are tied for having the lowest wage gap for women in the country.16 Maryland also has the third-lowest poverty rate for women nationwide.17

8 Center for American Progress | The State of Women in America: A 50-State Analysis of How Women Are Faring Across the Nation
TABLE 2
The state of women in America:
State rankings and grades for economic security
Source: Center for American Progress Action Fund analysis based on 14 factors related to economic security for women. For more information on how rankings and grades were calculated, please see the Methodology section.
State rank StateEconomic
security grade
1 Maryland A
2 California A
2 New Jersey A
4 Hawaii A
5 New York A
6 Delaware A-
7 Connecticut A-
7 Virginia A-
9 Florida A-
10 Vermont A-
11 Alaska B+
11 Washington B+
13 Rhode Island B+
14 Nevada B
15 Colorado B
16 Illinois B
17 Oregon B
18 Oklahoma B-
19 Arizona B-
19 Arkansas B-
21 Kansas C+
21 Minnesota C+
21 North Carolina C+
21 Tennessee C+
25 Michigan C
State rank StateEconomic
security grade
26 New Hampshire C
27 Ohio C
27 Texas C
29 New Mexico C-
29 Wisconsin C-
31 Pennsylvania D+
32 Iowa D+
32 Massachusetts D+
34 West Virginia D
35 Kentucky D
36 South Carolina D
37 South Dakota D
38 Maine D-
39 Missouri D-
40 Georgia D-
40 Nebraska D-
42 Idaho F
43 Utah F
44 Louisiana F
45 Montana F
46 Indiana F
46 North Dakota F
48 Alabama F
49 Wyoming F
50 Mississippi F
9 Center for American Progress | The State of Women in America: A 50-State Analysis of How Women Are Faring Across the Nation
The wage gap
The past few decades have seen an increase in the percentage of women that are either the sole breadwinner for their family or share the role with their partners. Only 1 in 10 mothers were the sole or primary breadwinner for their families in 1960,18 compared to 4 in 10 mothers in 2011.19
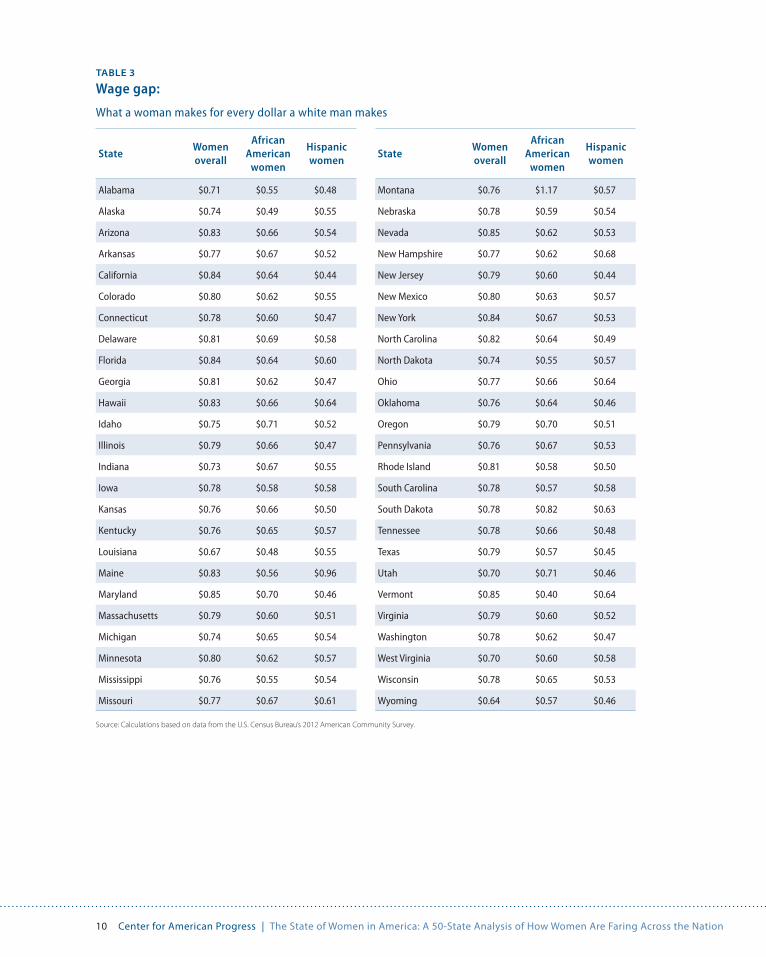
Although women are playing an increasingly important role in the livelihoods of their families, they continue to face unfair pay practices that undermine their economic security and that of their families. Nationally, women earn 77 cents on the male dollar, putting all families at a disadvantage.20 The pay disparity is more dramatic for women of color: African American women make 64 cents for every dollar white men make, and Hispanic women earn only 53 cents.21 The pay dispar-ity also varies across states. Women in Wyoming, for instance, make only 64 cents for every dollar men make.22
Table 3 details the wage gap facing U.S. women. Data on the wage gap facing African American and Hispanic women are also included.
10 Center for American Progress | The State of Women in America: A 50-State Analysis of How Women Are Faring Across the Nation
TABLE 3
Wage gap:
What a woman makes for every dollar a white man makes
Source: Calculations based on data from the U.S. Census Bureau’s 2012 American Community Survey.
StateWomen overall
African American
women
Hispanic women
Alabama $0.71 $0.55 $0.48
Alaska $0.74 $0.49 $0.55
Arizona $0.83 $0.66 $0.54
Arkansas $0.77 $0.67 $0.52
California $0.84 $0.64 $0.44
Colorado $0.80 $0.62 $0.55
Connecticut $0.78 $0.60 $0.47
Delaware $0.81 $0.69 $0.58
Florida $0.84 $0.64 $0.60
Georgia $0.81 $0.62 $0.47
Hawaii $0.83 $0.66 $0.64
Idaho $0.75 $0.71 $0.52
Illinois $0.79 $0.66 $0.47
Indiana $0.73 $0.67 $0.55
Iowa $0.78 $0.58 $0.58
Kansas $0.76 $0.66 $0.50
Kentucky $0.76 $0.65 $0.57
Louisiana $0.67 $0.48 $0.55
Maine $0.83 $0.56 $0.96
Maryland $0.85 $0.70 $0.46
Massachusetts $0.79 $0.60 $0.51
Michigan $0.74 $0.65 $0.54
Minnesota $0.80 $0.62 $0.57
Mississippi $0.76 $0.55 $0.54
Missouri $0.77 $0.67 $0.61
StateWomen overall
African American
women
Hispanic women
Montana $0.76 $1.17 $0.57
Nebraska $0.78 $0.59 $0.54
Nevada $0.85 $0.62 $0.53
New Hampshire $0.77 $0.62 $0.68
New Jersey $0.79 $0.60 $0.44
New Mexico $0.80 $0.63 $0.57
New York $0.84 $0.67 $0.53
North Carolina $0.82 $0.64 $0.49
North Dakota $0.74 $0.55 $0.57
Ohio $0.77 $0.66 $0.64
Oklahoma $0.76 $0.64 $0.46
Oregon $0.79 $0.70 $0.51
Pennsylvania $0.76 $0.67 $0.53
Rhode Island $0.81 $0.58 $0.50
South Carolina $0.78 $0.57 $0.58
South Dakota $0.78 $0.82 $0.63
Tennessee $0.78 $0.66 $0.48
Texas $0.79 $0.57 $0.45
Utah $0.70 $0.71 $0.46
Vermont $0.85 $0.40 $0.64
Virginia $0.79 $0.60 $0.52
Washington $0.78 $0.62 $0.47
West Virginia $0.70 $0.60 $0.58
Wisconsin $0.78 $0.65 $0.53
Wyoming $0.64 $0.57 $0.46
11 Center for American Progress | The State of Women in America: A 50-State Analysis of How Women Are Faring Across the Nation
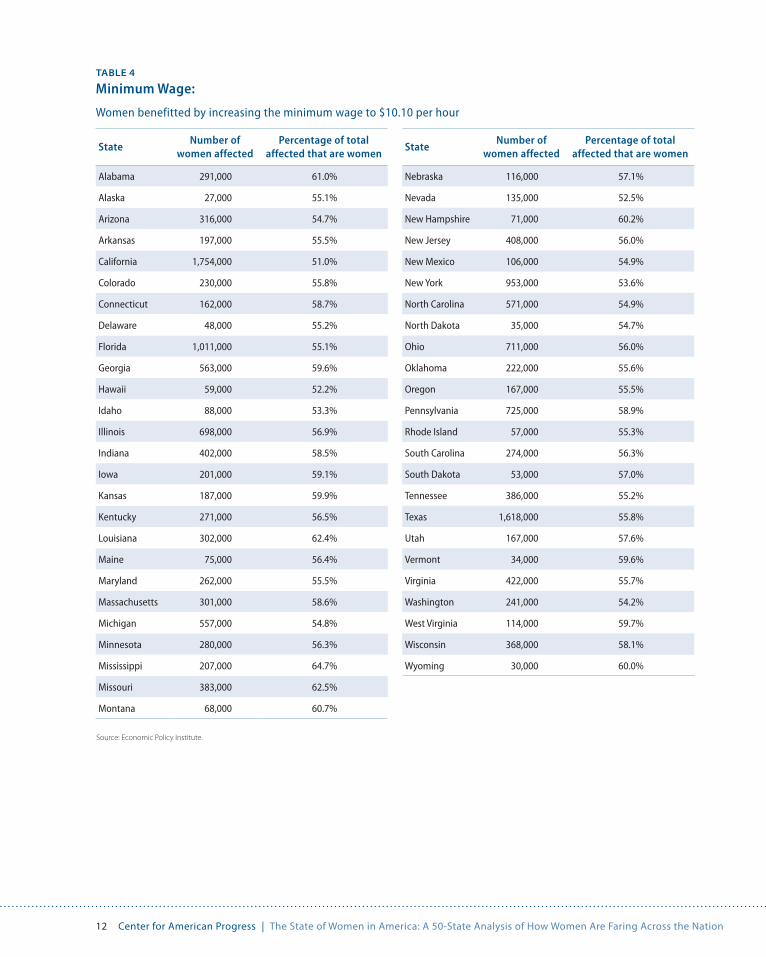
Minimum wage
On June 25, 1938, President Franklin D. Roosevelt signed the Fair Labor Standards Act, establishing the first federal minimum wage in the United States. It was a landmark achievement for workers. But 75 years later, wages have not kept up with productivity and inflation. Wages as a share of U.S. gross domestic product, or GDP, have fallen to a record low, even though worker productivity increased 124 percent from 1968 to 2012.23 Back in 1968, the federal minimum wage was $1.60 per hour. If the minimum wage had kept up with inflation, it would be more than $10.50 today.24 But today’s minimum wage is only $7.25 per hour—31 percent lower than the value of the minimum wage in 1968.25
Raising the minimum wage would greatly help women as they recover from the recession. Thus far, 60 percent of the job gains for women during the current economic recovery have been in the 10 largest occupations that typically pay less than $10.10 per hour.26 If the minimum wage were raised to $10.10 per hour, more than half of the beneficiaries would be women.27 In total, close to 17 million women would benefit from such a raise.28
Table 4 shows the percentage of people that would benefit from this increase that are women, state by state. The data were compiled by the Economic Policy Institute and include women who would be directly affected by such a raise, as well as women who would be indirectly affected because of the spillover effects of raising the minimum wage.29
12 Center for American Progress | The State of Women in America: A 50-State Analysis of How Women Are Faring Across the Nation
TABLE 4
Minimum Wage:
Women benefitted by increasing the minimum wage to $10.10 per hour
StateNumber of
women affectedPercentage of total
affected that are women
Alabama 291,000 61.0%
Alaska 27,000 55.1%
Arizona 316,000 54.7%
Arkansas 197,000 55.5%
California 1,754,000 51.0%
Colorado 230,000 55.8%
Connecticut 162,000 58.7%
Delaware 48,000 55.2%
Florida 1,011,000 55.1%
Georgia 563,000 59.6%
Hawaii 59,000 52.2%
Idaho 88,000 53.3%
Illinois 698,000 56.9%
Indiana 402,000 58.5%
Iowa 201,000 59.1%
Kansas 187,000 59.9%
Kentucky 271,000 56.5%
Louisiana 302,000 62.4%
Maine 75,000 56.4%
Maryland 262,000 55.5%
Massachusetts 301,000 58.6%
Michigan 557,000 54.8%
Minnesota 280,000 56.3%
Mississippi 207,000 64.7%
Missouri 383,000 62.5%
Montana 68,000 60.7%
StateNumber of
women affectedPercentage of total
affected that are women
Nebraska 116,000 57.1%
Nevada 135,000 52.5%
New Hampshire 71,000 60.2%
New Jersey 408,000 56.0%
New Mexico 106,000 54.9%
New York 953,000 53.6%
North Carolina 571,000 54.9%
North Dakota 35,000 54.7%
Ohio 711,000 56.0%
Oklahoma 222,000 55.6%
Oregon 167,000 55.5%
Pennsylvania 725,000 58.9%
Rhode Island 57,000 55.3%
South Carolina 274,000 56.3%
South Dakota 53,000 57.0%
Tennessee 386,000 55.2%
Texas 1,618,000 55.8%
Utah 167,000 57.6%
Vermont 34,000 59.6%
Virginia 422,000 55.7%
Washington 241,000 54.2%
West Virginia 114,000 59.7%
Wisconsin 368,000 58.1%
Wyoming 30,000 60.0%
Source: Economic Policy Institute.
13 Center for American Progress | The State of Women in America: A 50-State Analysis of How Women Are Faring Across the Nation
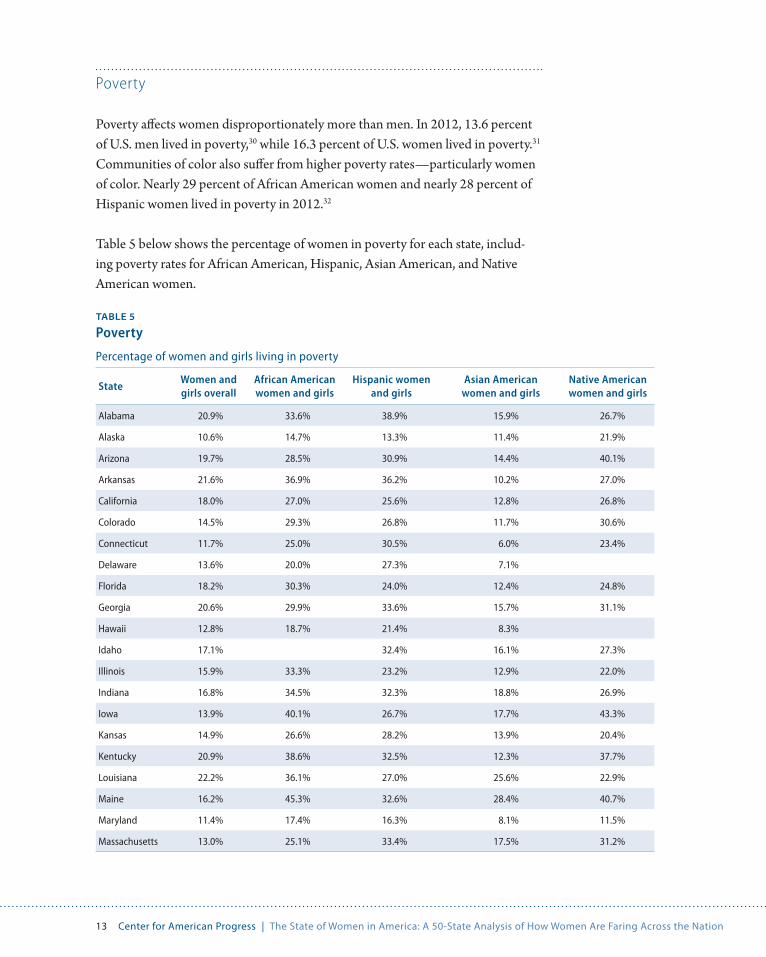
Poverty
Poverty affects women disproportionately more than men. In 2012, 13.6 percent of U.S. men lived in poverty,30 while 16.3 percent of U.S. women lived in poverty.31 Communities of color also suffer from higher poverty rates—particularly women of color. Nearly 29 percent of African American women and nearly 28 percent of Hispanic women lived in poverty in 2012.32
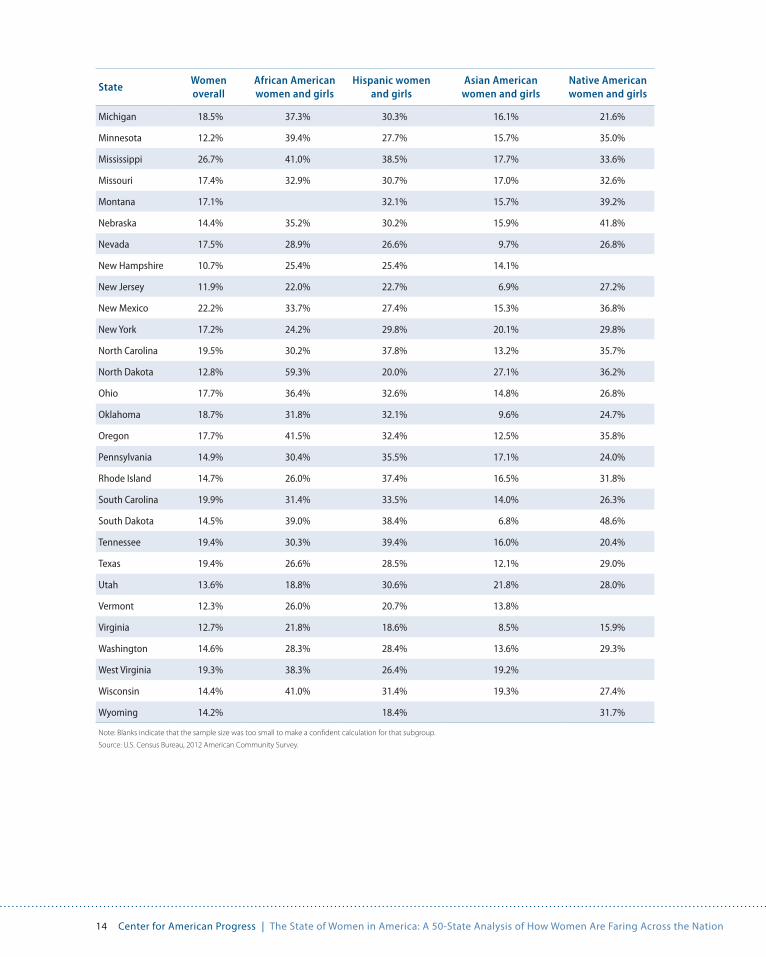
Table 5 below shows the percentage of women in poverty for each state, includ-ing poverty rates for African American, Hispanic, Asian American, and Native American women.
TABLE 5
Poverty
Percentage of women and girls living in poverty
StateWomen and girls overall
African American women and girls
Hispanic women and girls
Asian American women and girls
Native American women and girls
Alabama 20.9% 33.6% 38.9% 15.9% 26.7%
Alaska 10.6% 14.7% 13.3% 11.4% 21.9%
Arizona 19.7% 28.5% 30.9% 14.4% 40.1%
Arkansas 21.6% 36.9% 36.2% 10.2% 27.0%
California 18.0% 27.0% 25.6% 12.8% 26.8%
Colorado 14.5% 29.3% 26.8% 11.7% 30.6%
Connecticut 11.7% 25.0% 30.5% 6.0% 23.4%
Delaware 13.6% 20.0% 27.3% 7.1%
Florida 18.2% 30.3% 24.0% 12.4% 24.8%
Georgia 20.6% 29.9% 33.6% 15.7% 31.1%
Hawaii 12.8% 18.7% 21.4% 8.3%
Idaho 17.1% 32.4% 16.1% 27.3%
Illinois 15.9% 33.3% 23.2% 12.9% 22.0%
Indiana 16.8% 34.5% 32.3% 18.8% 26.9%
Iowa 13.9% 40.1% 26.7% 17.7% 43.3%
Kansas 14.9% 26.6% 28.2% 13.9% 20.4%
Kentucky 20.9% 38.6% 32.5% 12.3% 37.7%
Louisiana 22.2% 36.1% 27.0% 25.6% 22.9%
Maine 16.2% 45.3% 32.6% 28.4% 40.7%
Maryland 11.4% 17.4% 16.3% 8.1% 11.5%
Massachusetts 13.0% 25.1% 33.4% 17.5% 31.2%
14 Center for American Progress | The State of Women in America: A 50-State Analysis of How Women Are Faring Across the Nation
StateWomen overall
African American women and girls
Hispanic women and girls
Asian American women and girls
Native American women and girls
Michigan 18.5% 37.3% 30.3% 16.1% 21.6%
Minnesota 12.2% 39.4% 27.7% 15.7% 35.0%
Mississippi 26.7% 41.0% 38.5% 17.7% 33.6%
Missouri 17.4% 32.9% 30.7% 17.0% 32.6%
Montana 17.1% 32.1% 15.7% 39.2%
Nebraska 14.4% 35.2% 30.2% 15.9% 41.8%
Nevada 17.5% 28.9% 26.6% 9.7% 26.8%
New Hampshire 10.7% 25.4% 25.4% 14.1%
New Jersey 11.9% 22.0% 22.7% 6.9% 27.2%
New Mexico 22.2% 33.7% 27.4% 15.3% 36.8%
New York 17.2% 24.2% 29.8% 20.1% 29.8%
North Carolina 19.5% 30.2% 37.8% 13.2% 35.7%
North Dakota 12.8% 59.3% 20.0% 27.1% 36.2%
Ohio 17.7% 36.4% 32.6% 14.8% 26.8%
Oklahoma 18.7% 31.8% 32.1% 9.6% 24.7%
Oregon 17.7% 41.5% 32.4% 12.5% 35.8%
Pennsylvania 14.9% 30.4% 35.5% 17.1% 24.0%
Rhode Island 14.7% 26.0% 37.4% 16.5% 31.8%
South Carolina 19.9% 31.4% 33.5% 14.0% 26.3%
South Dakota 14.5% 39.0% 38.4% 6.8% 48.6%
Tennessee 19.4% 30.3% 39.4% 16.0% 20.4%
Texas 19.4% 26.6% 28.5% 12.1% 29.0%
Utah 13.6% 18.8% 30.6% 21.8% 28.0%
Vermont 12.3% 26.0% 20.7% 13.8%
Virginia 12.7% 21.8% 18.6% 8.5% 15.9%
Washington 14.6% 28.3% 28.4% 13.6% 29.3%
West Virginia 19.3% 38.3% 26.4% 19.2%
Wisconsin 14.4% 41.0% 31.4% 19.3% 27.4%
Wyoming 14.2% 18.4% 31.7%
Note: Blanks indicate that the sample size was too small to make a confident calculation for that subgroup.
Source: U.S. Census Bureau, 2012 American Community Survey.
15 Center for American Progress | The State of Women in America: A 50-State Analysis of How Women Are Faring Across the Nation
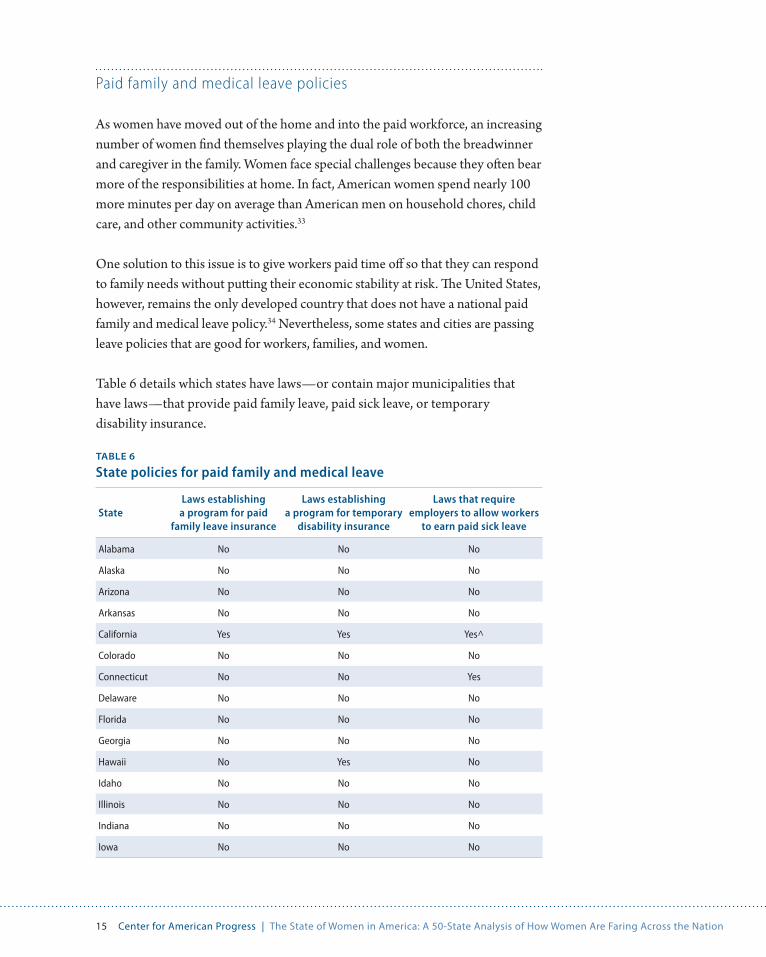
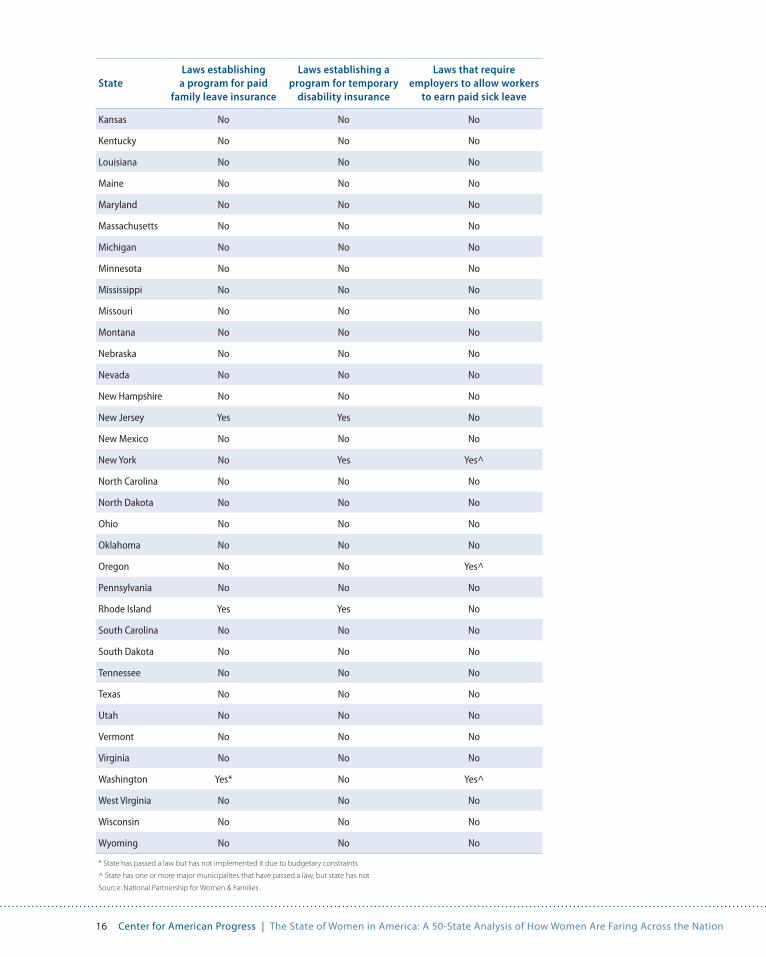
Paid family and medical leave policies
As women have moved out of the home and into the paid workforce, an increasing number of women find themselves playing the dual role of both the breadwinner and caregiver in the family. Women face special challenges because they often bear more of the responsibilities at home. In fact, American women spend nearly 100 more minutes per day on average than American men on household chores, child care, and other community activities.33
One solution to this issue is to give workers paid time off so that they can respond to family needs without putting their economic stability at risk. The United States, however, remains the only developed country that does not have a national paid family and medical leave policy.34 Nevertheless, some states and cities are passing leave policies that are good for workers, families, and women.
Table 6 details which states have laws—or contain major municipalities that have laws—that provide paid family leave, paid sick leave, or temporary disability insurance.
TABLE 6
State policies for paid family and medical leave
StateLaws establishing
a program for paid family leave insurance
Laws establishing a program for temporary
disability insurance
Laws that require employers to allow workers
to earn paid sick leave
Alabama No No No
Alaska No No No
Arizona No No No
Arkansas No No No
California Yes Yes Yes^
Colorado No No No
Connecticut No No Yes
Delaware No No No
Florida No No No
Georgia No No No
Hawaii No Yes No
Idaho No No No
Illinois No No No
Indiana No No No
Iowa No No No
16 Center for American Progress | The State of Women in America: A 50-State Analysis of How Women Are Faring Across the Nation
StateLaws establishing
a program for paid family leave insurance
Laws establishing a program for temporary
disability insurance
Laws that require employers to allow workers
to earn paid sick leave
Kansas No No No
Kentucky No No No
Louisiana No No No
Maine No No No
Maryland No No No
Massachusetts No No No
Michigan No No No
Minnesota No No No
Mississippi No No No
Missouri No No No
Montana No No No
Nebraska No No No
Nevada No No No
New Hampshire No No No
New Jersey Yes Yes No
New Mexico No No No
New York No Yes Yes^
North Carolina No No No
North Dakota No No No
Ohio No No No
Oklahoma No No No
Oregon No No Yes^
Pennsylvania No No No
Rhode Island Yes Yes No
South Carolina No No No
South Dakota No No No
Tennessee No No No
Texas No No No
Utah No No No
Vermont No No No
Virginia No No No
Washington Yes* No Yes^
West Virginia No No No
Wisconsin No No No
Wyoming No No No
* State has passed a law but has not implemented it due to budgetary constraints
^ State has one or more major municipalites that have passed a law, but state has not
Source: National Partnership for Women & Families.
17 Center for American Progress | The State of Women in America: A 50-State Analysis of How Women Are Faring Across the Nation
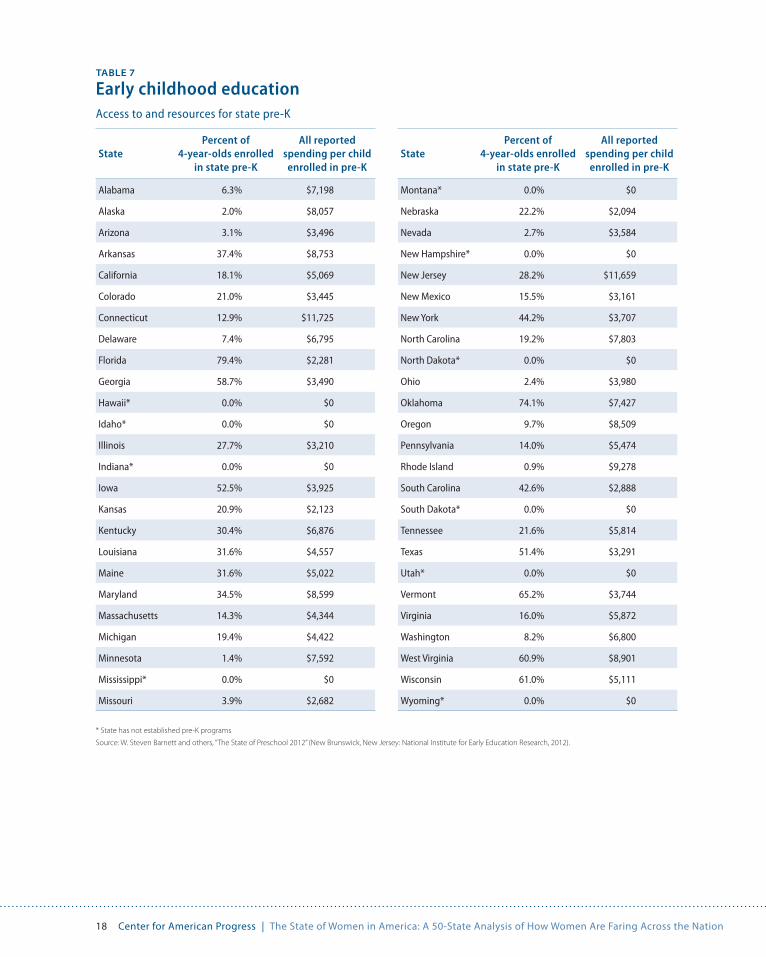
Early childhood education
Another way to help workers balance the demands of the family and the work-place is to provide access to high-quality child care and early education.35 Making preschool more accessible would be one method to help working parents, who often struggle to find quality low-cost child care.
Providing access to quality preschool education also has other advantages. Multiple studies have shown that children benefit greatly from having a quality preschool education. The HighScope Perry Preschool Study, for example, found that people who were enrolled as children in a quality preschool program were more likely to be employed, earned more money, and committed fewer crimes in their lifetime.36 At the same time, our economy benefits from these investments in our future workforce, which help strengthen our nation’s long-term economic competitiveness.37 One estimate suggests that investments in early childhood education yield a return of 12 percent for society in general.38
The United States, however, does not provide access to free, publicly funded, qual-ity preschool education. Access to high-quality preschool education varies greatly across the states. While states such as Oklahoma and Georgia serve the majority of their 4-year-olds in state pre-kindergarten programs, states such as Indiana and Montana do not have any state pre-kindergarten programs for their 4-year-olds.39
Table 7 ranks each state based on two key indicators of high-quality preschool education: the percentage of 4-year-olds in the state that have access to these pro-grams and the spending per child for those that participate in them.
18 Center for American Progress | The State of Women in America: A 50-State Analysis of How Women Are Faring Across the Nation
TABLE 7
Early childhood educationAccess to and resources for state pre-K
StatePercent of
4-year-olds enrolled in state pre-K
All reported spending per child
enrolled in pre-K
Alabama 6.3% $7,198
Alaska 2.0% $8,057
Arizona 3.1% $3,496
Arkansas 37.4% $8,753
California 18.1% $5,069
Colorado 21.0% $3,445
Connecticut 12.9% $11,725
Delaware 7.4% $6,795
Florida 79.4% $2,281
Georgia 58.7% $3,490
Hawaii* 0.0% $0
Idaho* 0.0% $0
Illinois 27.7% $3,210
Indiana* 0.0% $0
Iowa 52.5% $3,925
Kansas 20.9% $2,123
Kentucky 30.4% $6,876
Louisiana 31.6% $4,557
Maine 31.6% $5,022
Maryland 34.5% $8,599
Massachusetts 14.3% $4,344
Michigan 19.4% $4,422
Minnesota 1.4% $7,592
Mississippi* 0.0% $0
Missouri 3.9% $2,682
StatePercent of
4-year-olds enrolled in state pre-K
All reported spending per child
enrolled in pre-K
Montana* 0.0% $0
Nebraska 22.2% $2,094
Nevada 2.7% $3,584
New Hampshire* 0.0% $0
New Jersey 28.2% $11,659
New Mexico 15.5% $3,161
New York 44.2% $3,707
North Carolina 19.2% $7,803
North Dakota* 0.0% $0
Ohio 2.4% $3,980
Oklahoma 74.1% $7,427
Oregon 9.7% $8,509
Pennsylvania 14.0% $5,474
Rhode Island 0.9% $9,278
South Carolina 42.6% $2,888
South Dakota* 0.0% $0
Tennessee 21.6% $5,814
Texas 51.4% $3,291
Utah* 0.0% $0
Vermont 65.2% $3,744
Virginia 16.0% $5,872
Washington 8.2% $6,800
West Virginia 60.9% $8,901
Wisconsin 61.0% $5,111
Wyoming* 0.0% $0
* State has not established pre-K programs
Source: W. Steven Barnett and others, “The State of Preschool 2012” (New Brunswick, New Jersey: National Institute for Early Education Research, 2012).
19 Center for American Progress | The State of Women in America: A 50-State Analysis of How Women Are Faring Across the Nation
The leadership gap
Although women make up more than half of our nation’s population, far too few women are in positions of decision making and leadership. Having women in leadership positions in the workplace and in government would better empower women to chart their own futures.
In order to assess how women are faring in terms of attaining leadership posi-tions, we examined the percentage of women in each state in elected office at the state and national level and the percentage of women in each state holding management positions in the private sector. Including minority data, we looked at nine factors overall:
• Percentage of U.S. congressional seats occupied by women
• Percentage of statewide elected executive offices occupied by women
• Percentage of state legislature seats occupied by women
• Percentage of minority women elected to Congress, statewide executive, or state legislature offices
• Management gap among women overall
• Management gap among Hispanic women
• Management gap among African American women
• Management gap among Asian American women
• Management gap among Native American women
20 Center for American Progress | The State of Women in America: A 50-State Analysis of How Women Are Faring Across the Nation
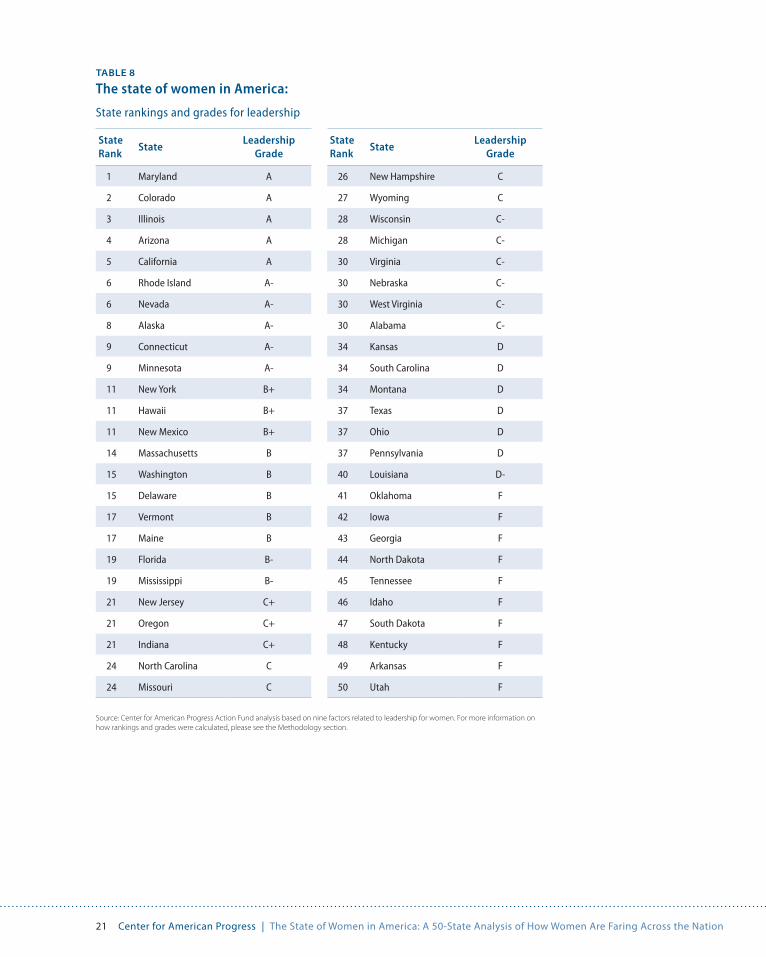
Based on these factors, this report finds that women in Utah, Arkansas, and Kentucky have the fewest leadership positions relative to men.
Women in Utah and Arkansas are not reaching leadership positions in the private sector; both states rank near the bottom in terms of the percentage of managerial jobs held by women. According to Census data, Utah is the third-worst state in the country in terms of the percentage of managerial jobs held by women; Arkansas is the ninth worst.
Women in Kentucky are also particularly challenged on leadership. Out of the state’s eight seats in Congress, none are occupied by women. Out of the eight statewide elected executive positions available, only one is held by a woman.
In contrast, based on the factors examined, women in Maryland are doing the best on leadership. Maryland ranks fourth in the nation in terms of the total percentage of elected positions in Congress, statewide elected executive office, and the state legislature that are held by women of color. Maryland ranks third in the nation in terms of the percentage of managerial jobs held by women.
Table 8 ranks the states on leadership matters for women, based on the factors examined.
21 Center for American Progress | The State of Women in America: A 50-State Analysis of How Women Are Faring Across the Nation
TABLE 8
The state of women in America:
State rankings and grades for leadership
State Rank
StateLeadership
Grade
1 Maryland A
2 Colorado A
3 Illinois A
4 Arizona A
5 California A
6 Rhode Island A-
6 Nevada A-
8 Alaska A-
9 Connecticut A-
9 Minnesota A-
11 New York B+
11 Hawaii B+
11 New Mexico B+
14 Massachusetts B
15 Washington B
15 Delaware B
17 Vermont B
17 Maine B
19 Florida B-
19 Mississippi B-
21 New Jersey C+
21 Oregon C+
21 Indiana C+
24 North Carolina C
24 Missouri C
State Rank
StateLeadership
Grade
26 New Hampshire C
27 Wyoming C
28 Wisconsin C-
28 Michigan C-
30 Virginia C-
30 Nebraska C-
30 West Virginia C-
30 Alabama C-
34 Kansas D
34 South Carolina D
34 Montana D
37 Texas D
37 Ohio D
37 Pennsylvania D
40 Louisiana D-
41 Oklahoma F
42 Iowa F
43 Georgia F
44 North Dakota F
45 Tennessee F
46 Idaho F
47 South Dakota F
48 Kentucky F
49 Arkansas F
50 Utah F
Source: Center for American Progress Action Fund analysis based on nine factors related to leadership for women. For more information on how rankings and grades were calculated, please see the Methodology section.
22 Center for American Progress | The State of Women in America: A 50-State Analysis of How Women Are Faring Across the Nation
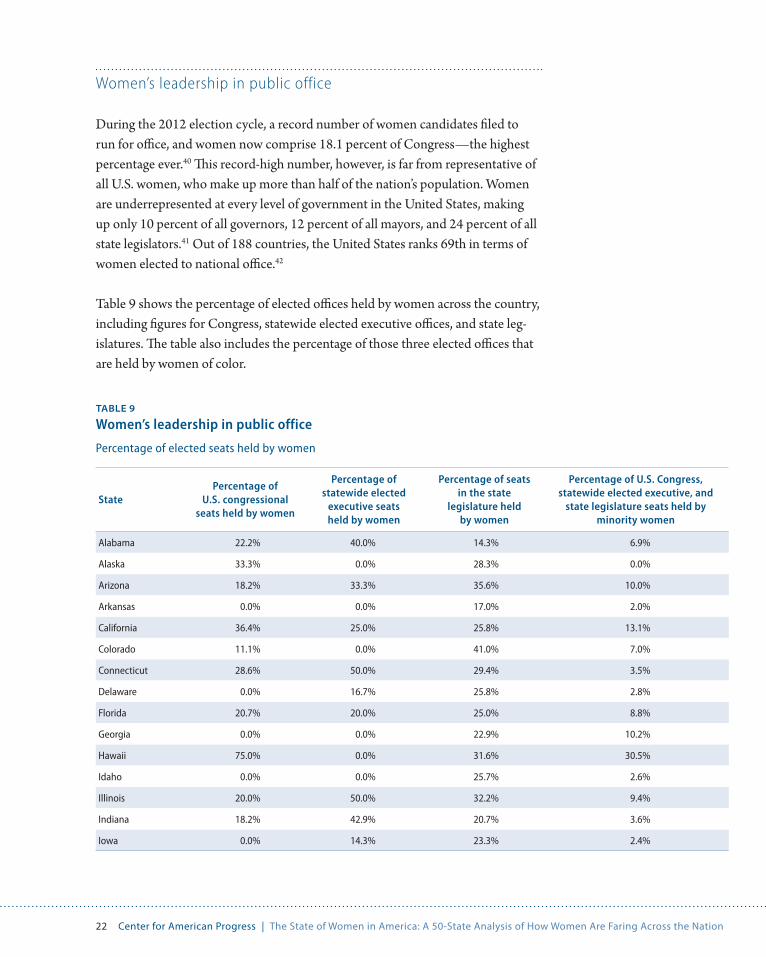
Women’s leadership in public office
During the 2012 election cycle, a record number of women candidates filed to run for office, and women now comprise 18.1 percent of Congress—the highest percentage ever.40 This record-high number, however, is far from representative of all U.S. women, who make up more than half of the nation’s population. Women are underrepresented at every level of government in the United States, making up only 10 percent of all governors, 12 percent of all mayors, and 24 percent of all state legislators.41 Out of 188 countries, the United States ranks 69th in terms of women elected to national office.42
Table 9 shows the percentage of elected offices held by women across the country, including figures for Congress, statewide elected executive offices, and state leg-islatures. The table also includes the percentage of those three elected offices that are held by women of color.
TABLE 9
Women’s leadership in public office
Percentage of elected seats held by women
StatePercentage of
U.S. congressional seats held by women
Percentage of statewide elected
executive seats held by women
Percentage of seats in the state
legislature held by women
Percentage of U.S. Congress, statewide elected executive, and
state legislature seats held by minority women
Alabama 22.2% 40.0% 14.3% 6.9%
Alaska 33.3% 0.0% 28.3% 0.0%
Arizona 18.2% 33.3% 35.6% 10.0%
Arkansas 0.0% 0.0% 17.0% 2.0%
California 36.4% 25.0% 25.8% 13.1%
Colorado 11.1% 0.0% 41.0% 7.0%
Connecticut 28.6% 50.0% 29.4% 3.5%
Delaware 0.0% 16.7% 25.8% 2.8%
Florida 20.7% 20.0% 25.0% 8.8%
Georgia 0.0% 0.0% 22.9% 10.2%
Hawaii 75.0% 0.0% 31.6% 30.5%
Idaho 0.0% 0.0% 25.7% 2.6%
Illinois 20.0% 50.0% 32.2% 9.4%
Indiana 18.2% 42.9% 20.7% 3.6%
Iowa 0.0% 14.3% 23.3% 2.4%

23 Center for American Progress | The State of Women in America: A 50-State Analysis of How Women Are Faring Across the Nation
StatePercentage of
U.S. congressional seats held by women
Percentage of statewide elected
executive seats held by women
Percentage of seats in the state
legislature held by women
Percentage of U.S. Congress, statewide elected executive, and
state legislature seats held by minority women
Kansas 16.7% 16.7% 23.6% 2.3%
Kentucky 0.0% 12.5% 18.1% 0.0%
Louisiana 12.5% 0.0% 11.8% 5.0%
Maine 50.0% 0.0% 28.5% 0.0%
Maryland 20.0% 0.0% 30.3% 12.9%
Massachusetts 18.2% 33.3% 25.5% 2.3%
Michigan 12.5% 25.0% 18.9% 1.2%
Minnesota 30.0% 60.0% 33.3% 0.9%
Mississippi 0.0% 25.0% 16.1% 8.0%
Missouri 30.0% 0.0% 21.8% 4.7%
Montana 0.0% 37.5% 27.3% 0.0%
Nebraska 20.0% 16.7% 20.4% 1.7%
Nevada 16.7% 50.0% 28.6% 9.3%
New Hampshire 100.0% 100.0% 33.0% 1.2%
New Jersey 0.0% 50.0% 29.2% 11.0%
New Mexico 20.0% 71.4% 27.7% 15.3%
New York 27.6% 0.0% 21.6% 6.9%
North Carolina 20.0% 50.0% 21.8% 6.7%
North Dakota 33.3% 21.4% 17.0% 0.0%
Ohio 16.7% 16.7% 23.5% 6.4%
Oklahoma 0.0% 36.4% 13.4% 1.2%
Oregon 14.3% 40.0% 28.9% 2.0%
Pennsylvania 5.0% 20.0% 17.8% 3.2%
Rhode Island 0.0% 40.0% 27.4% 1.6%
South Carolina 0.0% 11.1% 12.9% 3.2%
South Dakota 33.3% 10.0% 22.9% 0.0%
Tennessee 18.2% 0.0% 17.4% 4.8%
Texas 10.5% 22.2% 21.0% 9.6%
Utah 0.0% 0.0% 16.3% 2.6%
Vermont 0.0% 16.7% 40.6% 0.5%
Virginia 0.0% 0.0% 17.9% 6.4%
Washington 41.7% 11.1% 30.6% 2.4%
West Virginia 20.0% 16.7% 16.4% 1.4%
Wisconsin 20.0% 16.7% 25.0% 3.4%
Wyoming 33.3% 40.0% 16.7% 1.0%
Source: Center for American Women and Politics.
24 Center for American Progress | The State of Women in America: A 50-State Analysis of How Women Are Faring Across the Nation
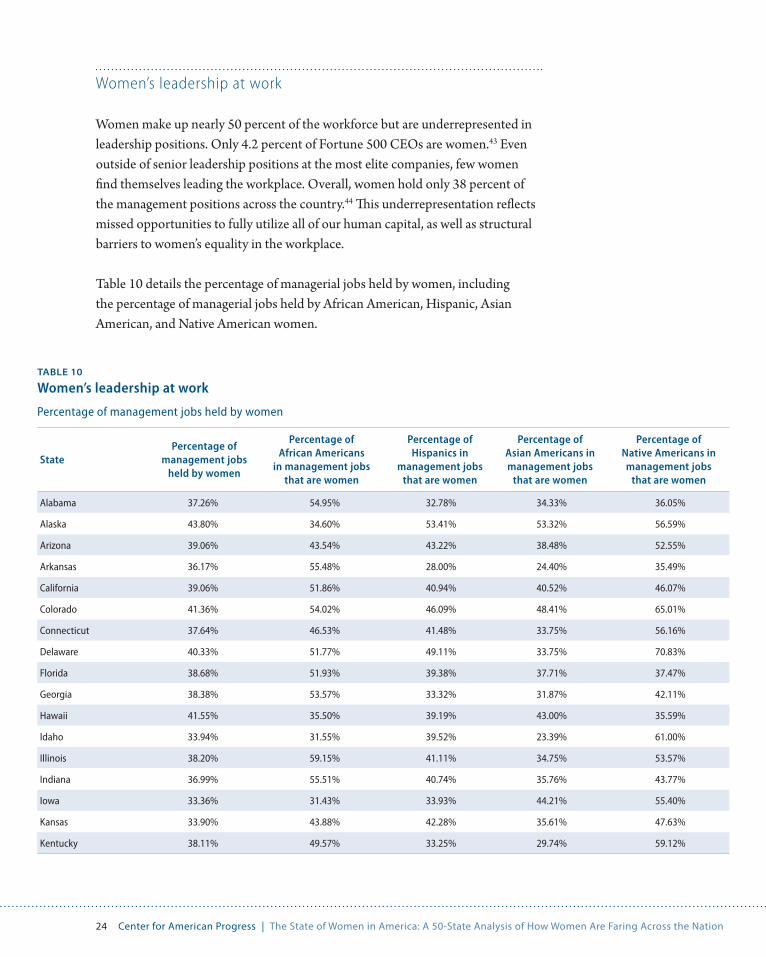
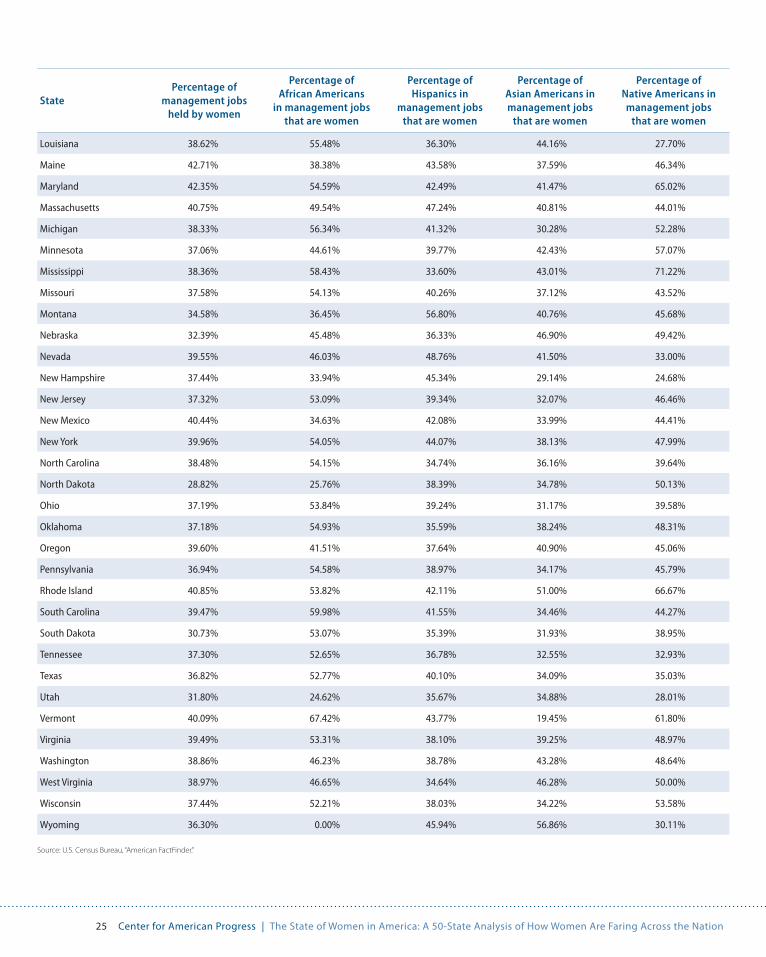
Women’s leadership at work
Women make up nearly 50 percent of the workforce but are underrepresented in leadership positions. Only 4.2 percent of Fortune 500 CEOs are women.43 Even outside of senior leadership positions at the most elite companies, few women find themselves leading the workplace. Overall, women hold only 38 percent of the management positions across the country.44 This underrepresentation reflects missed opportunities to fully utilize all of our human capital, as well as structural barriers to women’s equality in the workplace.
Table 10 details the percentage of managerial jobs held by women, including the percentage of managerial jobs held by African American, Hispanic, Asian American, and Native American women.
State Percentage of
management jobs held by women
Percentage of African Americans
in management jobs that are women
Percentage of Hispanics in
management jobs that are women
Percentage of Asian Americans in management jobs
that are women
Percentage of Native Americans in management jobs
that are women
Alabama 37.26% 54.95% 32.78% 34.33% 36.05%
Alaska 43.80% 34.60% 53.41% 53.32% 56.59%
Arizona 39.06% 43.54% 43.22% 38.48% 52.55%
Arkansas 36.17% 55.48% 28.00% 24.40% 35.49%
California 39.06% 51.86% 40.94% 40.52% 46.07%
Colorado 41.36% 54.02% 46.09% 48.41% 65.01%
Connecticut 37.64% 46.53% 41.48% 33.75% 56.16%
Delaware 40.33% 51.77% 49.11% 33.75% 70.83%
Florida 38.68% 51.93% 39.38% 37.71% 37.47%
Georgia 38.38% 53.57% 33.32% 31.87% 42.11%
Hawaii 41.55% 35.50% 39.19% 43.00% 35.59%
Idaho 33.94% 31.55% 39.52% 23.39% 61.00%
Illinois 38.20% 59.15% 41.11% 34.75% 53.57%
Indiana 36.99% 55.51% 40.74% 35.76% 43.77%
Iowa 33.36% 31.43% 33.93% 44.21% 55.40%
Kansas 33.90% 43.88% 42.28% 35.61% 47.63%
Kentucky 38.11% 49.57% 33.25% 29.74% 59.12%
TABLE 10
Women’s leadership at work
Percentage of management jobs held by women
25 Center for American Progress | The State of Women in America: A 50-State Analysis of How Women Are Faring Across the Nation
State Percentage of
management jobs held by women
Percentage of African Americans
in management jobs that are women
Percentage of Hispanics in
management jobs that are women
Percentage of Asian Americans in management jobs
that are women
Percentage of Native Americans in management jobs
that are women
Louisiana 38.62% 55.48% 36.30% 44.16% 27.70%
Maine 42.71% 38.38% 43.58% 37.59% 46.34%
Maryland 42.35% 54.59% 42.49% 41.47% 65.02%
Massachusetts 40.75% 49.54% 47.24% 40.81% 44.01%
Michigan 38.33% 56.34% 41.32% 30.28% 52.28%
Minnesota 37.06% 44.61% 39.77% 42.43% 57.07%
Mississippi 38.36% 58.43% 33.60% 43.01% 71.22%
Missouri 37.58% 54.13% 40.26% 37.12% 43.52%
Montana 34.58% 36.45% 56.80% 40.76% 45.68%
Nebraska 32.39% 45.48% 36.33% 46.90% 49.42%
Nevada 39.55% 46.03% 48.76% 41.50% 33.00%
New Hampshire 37.44% 33.94% 45.34% 29.14% 24.68%
New Jersey 37.32% 53.09% 39.34% 32.07% 46.46%
New Mexico 40.44% 34.63% 42.08% 33.99% 44.41%
New York 39.96% 54.05% 44.07% 38.13% 47.99%
North Carolina 38.48% 54.15% 34.74% 36.16% 39.64%
North Dakota 28.82% 25.76% 38.39% 34.78% 50.13%
Ohio 37.19% 53.84% 39.24% 31.17% 39.58%
Oklahoma 37.18% 54.93% 35.59% 38.24% 48.31%
Oregon 39.60% 41.51% 37.64% 40.90% 45.06%
Pennsylvania 36.94% 54.58% 38.97% 34.17% 45.79%
Rhode Island 40.85% 53.82% 42.11% 51.00% 66.67%
South Carolina 39.47% 59.98% 41.55% 34.46% 44.27%
South Dakota 30.73% 53.07% 35.39% 31.93% 38.95%
Tennessee 37.30% 52.65% 36.78% 32.55% 32.93%
Texas 36.82% 52.77% 40.10% 34.09% 35.03%
Utah 31.80% 24.62% 35.67% 34.88% 28.01%
Vermont 40.09% 67.42% 43.77% 19.45% 61.80%
Virginia 39.49% 53.31% 38.10% 39.25% 48.97%
Washington 38.86% 46.23% 38.78% 43.28% 48.64%
West Virginia 38.97% 46.65% 34.64% 46.28% 50.00%
Wisconsin 37.44% 52.21% 38.03% 34.22% 53.58%
Wyoming 36.30% 0.00% 45.94% 56.86% 30.11%
Source: U.S. Census Bureau, “American FactFinder.”
26 Center for American Progress | The State of Women in America: A 50-State Analysis of How Women Are Faring Across the Nation
Women’s health and healthy families
Health issues affect women’s personal, everyday well-being. Having access to affordable health care, access to reproductive services, and the ability to ensure a healthy pregnancy and delivery can greatly impact a woman’s life. Access to afford-able health care is especially important, as medical bills are the number one cause of bankruptcy filings in America.45 This year alone, about 1.7 million American households will file for bankruptcy because of rising medical bills.46
What’s worse, the 2012 elections showed that attacks on women’s health are not subsiding. Instead, too many politicians—all too frequently men—continue to try to interfere with women’s reproductive health. Despite the importance of access to affordable health care, more than 21 million women in the United States still lack health insurance.47
This report examines how women are faring in each state on a multitude of health issues, including access to reproductive health services, implementation of Affordable Care Act protections, and the ability to ensure a healthy pregnancy and delivery. We examined the following 14 factors:
• Policies to defund Planned Parenthood’s preventive health services
• Contraceptive needs met with public funding
• Policies requiring medically unnecessary ultrasounds
• Unconstitutional limits on abortion at a specific gestational age
• Number of mandatory waiting-period and counseling restrictions
• Targeted Restrictions on Abortion Providers, or TRAP, laws
• Percentage of nonelderly women uninsured
27 Center for American Progress | The State of Women in America: A 50-State Analysis of How Women Are Faring Across the Nation
• Percentage of nonelderly African American women uninsured
• Percentage of nonelderly Hispanic women uninsured
• Medicaid expansion policy
• Maternal mortality rate
• Infant mortality rate
• Number of women per obstetrician-gynecologist, or OB-GYN, in the state
Based on the factors examined, this report finds that women fare the worst on health issues in Oklahoma, Louisiana, and North Carolina.
In Oklahoma, women suffer from the third-highest maternal mortality rate in the nation, meaning that women in Oklahoma are more likely to die from pregnancy-related complications than women in 47 other states in the nation. Oklahoma is also among the top 10 worst states in the nation in terms of infant mortality. Considering these factors, it is unsurprising that women in Oklahoma have difficulties accessing health care. Across the nation, the state has the second-lowest rate of OB-GYNs to the female population, with only one OB-GYN for every 18,713 women.
Meanwhile, Louisiana has one of the top 10 worst maternal mortality rates in the nation. In Louisiana, there is only one OB-GYN for every 13,136 women.48 To put this in perspective, the United States already has a worse maternal mortality rate than 49 other countries.49
Women in North Carolina are not doing much better. When it comes to access-ing health care, nearly 18 percent of nonelderly women in the state are uninsured. North Carolina also has the fourth-highest rate of uninsured nonelderly Hispanic women in the country at 38 percent. Yet despite the high rate of uninsured women in North Carolina, the state is not expanding Medicaid, which could potentially provide health care coverage to nearly 300,000 more women in the state.50
In contrast, based on the factors examined, women in Vermont are doing the best on health issues. Vermont has the second-lowest rate of uninsured women, the second-lowest maternal mortality rate, and the second-lowest infant mortality rate in the country. Vermont is also one of the highest-ranking states as far as access to reproductive health care.
28 Center for American Progress | The State of Women in America: A 50-State Analysis of How Women Are Faring Across the Nation
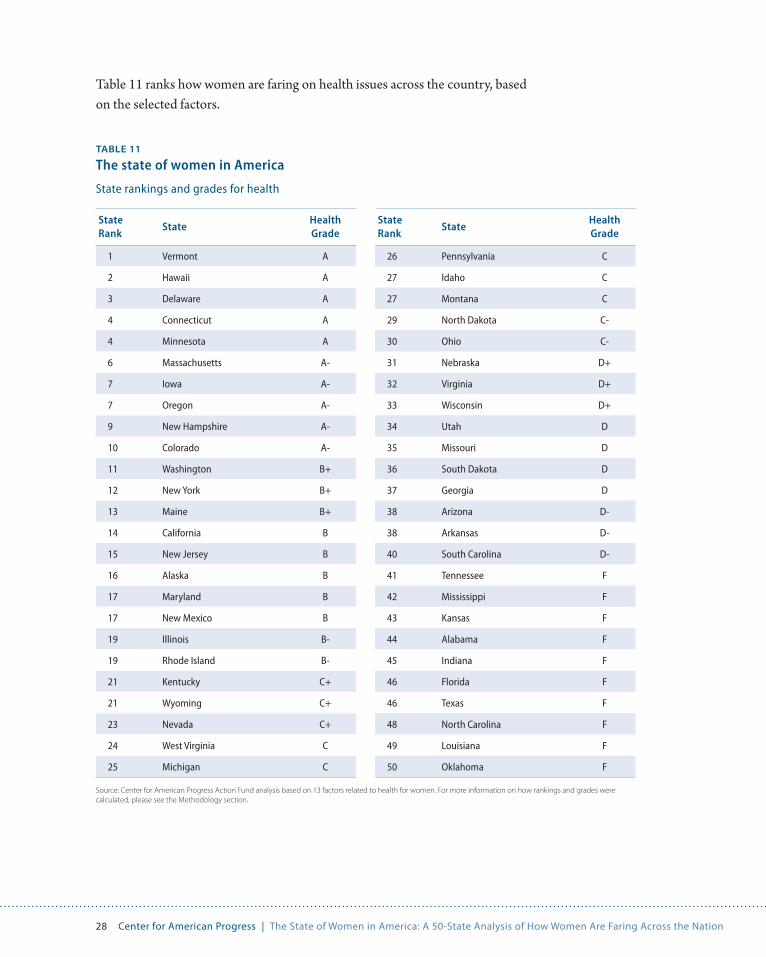
Table 11 ranks how women are faring on health issues across the country, based on the selected factors.
TABLE 11
The state of women in America
State rankings and grades for health
State Rank
StateHealth Grade
1 Vermont A
2 Hawaii A
3 Delaware A
4 Connecticut A
4 Minnesota A
6 Massachusetts A-
7 Iowa A-
7 Oregon A-
9 New Hampshire A-
10 Colorado A-
11 Washington B+
12 New York B+
13 Maine B+
14 California B
15 New Jersey B
16 Alaska B
17 Maryland B
17 New Mexico B
19 Illinois B-
19 Rhode Island B-
21 Kentucky C+
21 Wyoming C+
23 Nevada C+
24 West Virginia C
25 Michigan C
State Rank
StateHealth Grade
26 Pennsylvania C
27 Idaho C
27 Montana C
29 North Dakota C-
30 Ohio C-
31 Nebraska D+
32 Virginia D+
33 Wisconsin D+
34 Utah D
35 Missouri D
36 South Dakota D
37 Georgia D
38 Arizona D-
38 Arkansas D-
40 South Carolina D-
41 Tennessee F
42 Mississippi F
43 Kansas F
44 Alabama F
45 Indiana F
46 Florida F
46 Texas F
48 North Carolina F
49 Louisiana F
50 Oklahoma F
Source: Center for American Progress Action Fund analysis based on 13 factors related to health for women. For more information on how rankings and grades were calculated, please see the Methodology section.

29 Center for American Progress | The State of Women in America: A 50-State Analysis of How Women Are Faring Across the Nation
Access to reproductive health services
States are enacting more and more restrictions on abortion rights and abortion providers every year, eroding the constitutional protections secured by Roe v. Wade. This year alone, Texas, Ohio, and North Carolina passed bills imposing new restrictions on women’s access to reproductive health. The measure in Texas is so strict that it will shut down most abortion clinics in the state.51 Meanwhile, North Carolina’s anti-abortion measure will likely lead to the closure of all of the state’s clinics except one.52
In analyzing the restrictions on reproductive health services across the states, we examined several factors: defunding of Planned Parenthood’s preventive health services, percentage of contraception needs met, forced ultrasounds, unconsti-tutional limits on abortion based on a specific gestational age, counseling and waiting-period restrictions on women who seek an abortion, and TRAP laws. Each of these factors dramatically affects women’s health.
• Defunding Planned Parenthood and other providers’ preventative health
services. Health care providers such as Planned Parenthood provide critical health services for women, including family-planning services, cancer screen-ings, pelvic and breast examinations, and contraception coverage. Nearly 3 mil-lion women and men visit Planned Parenthood each year.53 Abortion services account for only about 3 percent of Planned Parenthood’s activities.54 Despite the value of services provided by Planned Parenthood, in recent years, state legislatures have been attacking and seeking to remove funding for Planned Parenthood and other health care providers that provide critical access to family-planning and preventive health services.55
• Access to publicly funded contraceptive services. According to historian Elaine Tyler May, the female activists who pushed for and funded the invention of the pill realized that women “could not achieve full equality unless they had control over their reproductive lives.”56 The activists understood that birth control plays a critical role in giving women that control over their lives. More than 50 years after the introduction of the pill, however, birth control is still not accessible to all. In 2010, 19.1 million women were in need of publicly funded contraceptive services.57 Yet only 8.9 million women received such services. The Affordable Care Act would improve the accessibility of publicly funded contraceptive services. In addition to guaranteeing that insurers cover birth control, the Affordable Care Act would also provide funding for states to expand Medicaid, the largest source of publicly funded contraceptive services.58 Unfortunately, not all states are choosing to expand Medicaid.
30 Center for American Progress | The State of Women in America: A 50-State Analysis of How Women Are Faring Across the Nation
• Forced ultrasounds. Ultrasounds are traditionally a sound medical procedure benefiting many women. Some states, however, have started mandating ultra-sounds for women seeking an abortion in an effort to interfere with a woman’s choice. Women in 10 states are now compelled to undergo an ultrasound when seeking an abortion, even if it is not considered medically necessary.59 Some of the laws passed in these states would actually necessitate that a woman undergo an invasive transvaginal probe.60 In 2012, for example, conservative lawmakers in Virginia attempted to pass a bill that would have required a vaginal ultrasound before an adoption procedure.61 The backlash against the measure led to language in the bill stating that women cannot be forced to undergo such an invasive pro-cedure.62 Other states have not gone as far as to mandate medically unnecessary ultrasounds, but they still impede doctors’ ability to recommend timely and nec-essary procedures to patients for abortions or other general medical procedures.63
• Unconstitutional limits on abortion. In Planned Parenthood v. Casey, the Supreme Court held that states may only restrict or ban abortions after fetal viability under certain conditions. In later opinions, the Court clarified that even after fetal viability, states may not prohibit abortions that are necessary to preserve the life or health of the mother. Despite the Court’s requirements, however, some states continue to enact laws that place unconstitutional restric-tions on abortions based on arbitrarily chosen time periods after fertilization. These include several states that have passed laws banning abortion at 20 weeks after fertilization—“well before viability.”64 North Dakota has gone even further in banning abortions by passing a law that declares that life begins at conception, effectively banning all abortions in the state.65
• Onerous counseling and waiting-period restrictions. Before a patient under-goes medical treatment, the patient must give informed consent for the treat-ment. In order for that consent to be considered informed, a patient must be provided with adequate and appropriate information. Frequently, though, states pass abortion-counseling requirements that require information that is irrel-evant or misleading to the patient. Additionally, some states require that patients wait at least 24 hours between counseling and an abortion, effectively requiring women to make at least two trips to the doctor to obtain an abortion.66
31 Center for American Progress | The State of Women in America: A 50-State Analysis of How Women Are Faring Across the Nation
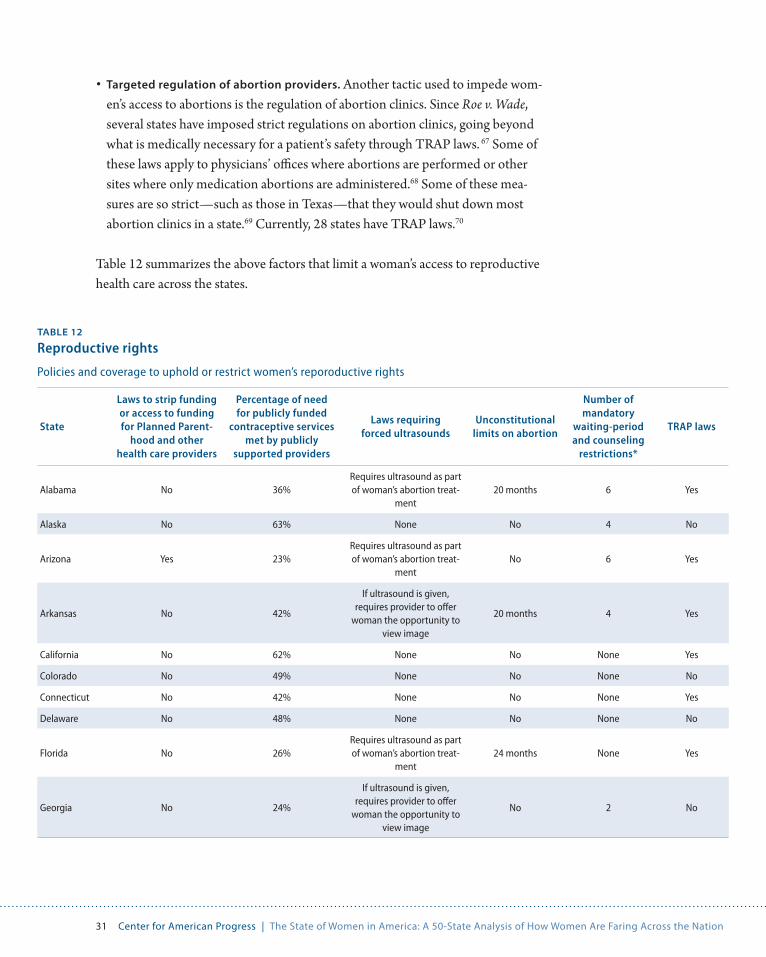
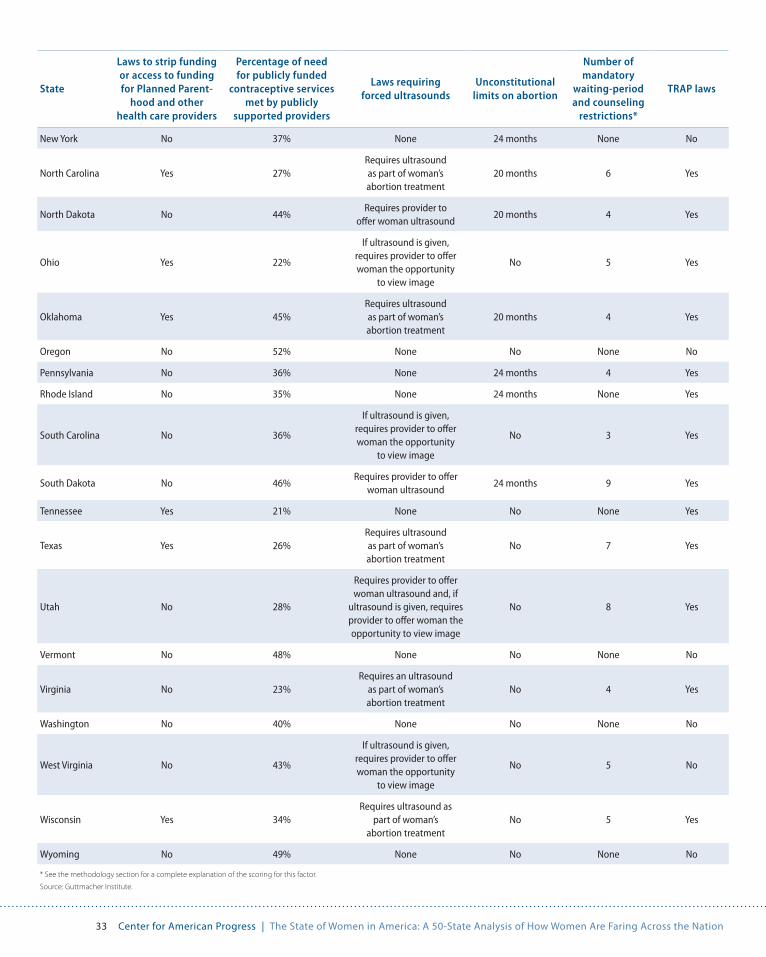
• Targeted regulation of abortion providers. Another tactic used to impede wom-en’s access to abortions is the regulation of abortion clinics. Since Roe v. Wade, several states have imposed strict regulations on abortion clinics, going beyond what is medically necessary for a patient’s safety through TRAP laws. 67 Some of these laws apply to physicians’ offices where abortions are performed or other sites where only medication abortions are administered.68 Some of these mea-sures are so strict—such as those in Texas—that they would shut down most abortion clinics in a state.69 Currently, 28 states have TRAP laws.70
Table 12 summarizes the above factors that limit a woman’s access to reproductive health care across the states.
State
Laws to strip funding or access to funding for Planned Parent-
hood and other health care providers
Percentage of need for publicly funded
contraceptive services met by publicly
supported providers
Laws requiring forced ultrasounds
Unconstitutional limits on abortion
Number of mandatory
waiting-period and counseling
restrictions*
TRAP laws
Alabama No 36%Requires ultrasound as part of woman’s abortion treat-
ment20 months 6 Yes
Alaska No 63% None No 4 No
Arizona Yes 23%Requires ultrasound as part of woman’s abortion treat-
mentNo 6 Yes
Arkansas No 42%
If ultrasound is given, requires provider to offer
woman the opportunity to view image
20 months 4 Yes
California No 62% None No None Yes
Colorado No 49% None No None No
Connecticut No 42% None No None Yes
Delaware No 48% None No None No
Florida No 26%Requires ultrasound as part of woman’s abortion treat-
ment24 months None Yes
Georgia No 24%
If ultrasound is given, requires provider to offer
woman the opportunity to view image
No 2 No
TABLE 12
Reproductive rights
Policies and coverage to uphold or restrict women’s reporoductive rights

32 Center for American Progress | The State of Women in America: A 50-State Analysis of How Women Are Faring Across the Nation
State
Laws to strip funding or access to funding for Planned Parent-
hood and other health care providers
Percentage of need for publicly funded
contraceptive services met by publicly
supported providers
Laws requiring forced ultrasounds
Unconstitutional limits on abortion
Number of mandatory
waiting-period and counseling
restrictions*
TRAP laws
Hawaii No 35% None No None No
Idaho No 29%
If ultrasound is given, requires provider to offer woman the opportunity
to view image
No 5 No
Illinois No 26% None No None Yes
Indiana Yes 26%Requires ultrasound as part of woman’s abortion treatment
20 months 7 Yes
Iowa No 46% None No None No
Kansas Yes 28%Requires ultrasound as part of woman’s abortion treatment
22 months 10 Yes
Kentucky No 38% None No 3 Yes
Louisiana No 21%Requires ultrasound as part of woman’s abortion treatment
No 6 Yes
Maine Yes 43% None No None No
Maryland No 32% None No None Yes
Massachusetts No 30% None 27 months 1 No
Michigan No 25%
If ultrasound is given, requires provider to offer woman the opportunity
to view image
No 5 Yes
Minnesota No 32% None No 3 No
Mississippi No 39%Requires ultrasound as part of woman’s abortion treatment
No 5 Yes
Missouri No 25%Requires provider to
offer woman ultrasoundNo 8 Yes
Montana Yes 57% None No 1 No
Nebraska No 29%
If ultrasound is given, requires provider to offer woman the opportunity
to view image
20 months 3 Yes
Nevada No 21% None 24 months None No
New Hampshire Yes 37% None No None No
New Jersey Yes 35% None No None No
New Mexico No 47% None No None No
33 Center for American Progress | The State of Women in America: A 50-State Analysis of How Women Are Faring Across the Nation
State
Laws to strip funding or access to funding for Planned Parent-
hood and other health care providers
Percentage of need for publicly funded
contraceptive services met by publicly
supported providers
Laws requiring forced ultrasounds
Unconstitutional limits on abortion
Number of mandatory
waiting-period and counseling
restrictions*
TRAP laws
New York No 37% None 24 months None No
North Carolina Yes 27%Requires ultrasound as part of woman’s abortion treatment
20 months 6 Yes
North Dakota No 44%Requires provider to
offer woman ultrasound20 months 4 Yes
Ohio Yes 22%
If ultrasound is given, requires provider to offer woman the opportunity
to view image
No 5 Yes
Oklahoma Yes 45%Requires ultrasound as part of woman’s abortion treatment
20 months 4 Yes
Oregon No 52% None No None No
Pennsylvania No 36% None 24 months 4 Yes
Rhode Island No 35% None 24 months None Yes
South Carolina No 36%
If ultrasound is given, requires provider to offer woman the opportunity
to view image
No 3 Yes
South Dakota No 46%Requires provider to offer
woman ultrasound24 months 9 Yes
Tennessee Yes 21% None No None Yes
Texas Yes 26%Requires ultrasound as part of woman’s abortion treatment
No 7 Yes
Utah No 28%
Requires provider to offer woman ultrasound and, if
ultrasound is given, requires provider to offer woman the opportunity to view image
No 8 Yes
Vermont No 48% None No None No
Virginia No 23%Requires an ultrasound
as part of woman’s abortion treatment
No 4 Yes
Washington No 40% None No None No
West Virginia No 43%
If ultrasound is given, requires provider to offer woman the opportunity
to view image
No 5 No
Wisconsin Yes 34%Requires ultrasound as
part of woman’s abortion treatment
No 5 Yes
Wyoming No 49% None No None No
* See the methodology section for a complete explanation of the scoring for this factor.
Source: Guttmacher Institute.
34 Center for American Progress | The State of Women in America: A 50-State Analysis of How Women Are Faring Across the Nation
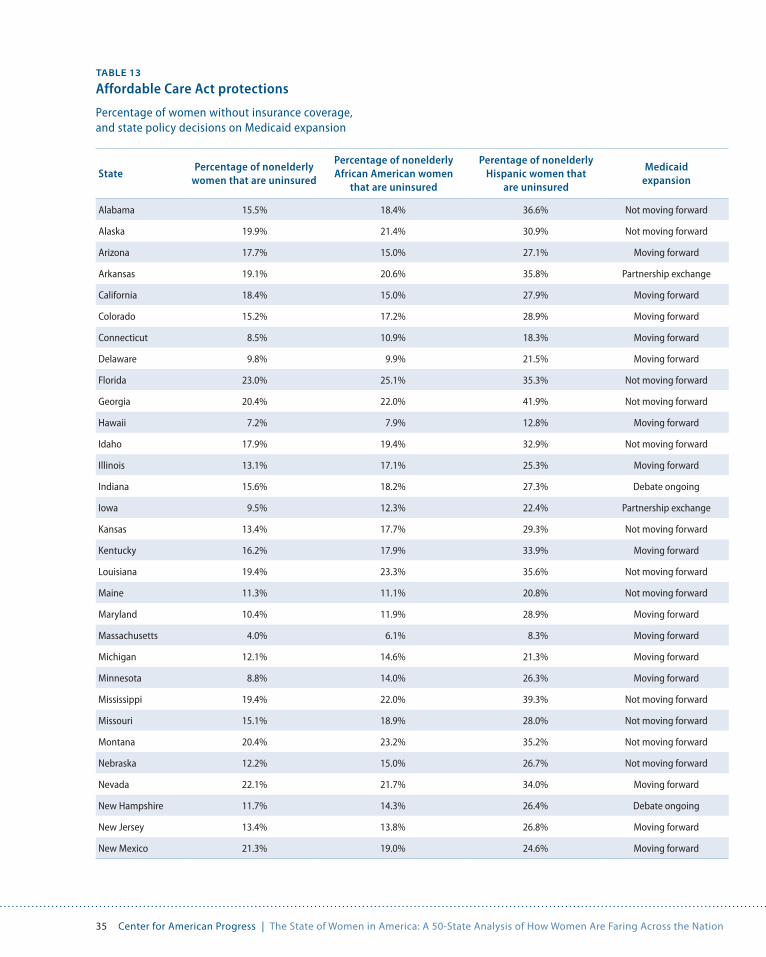
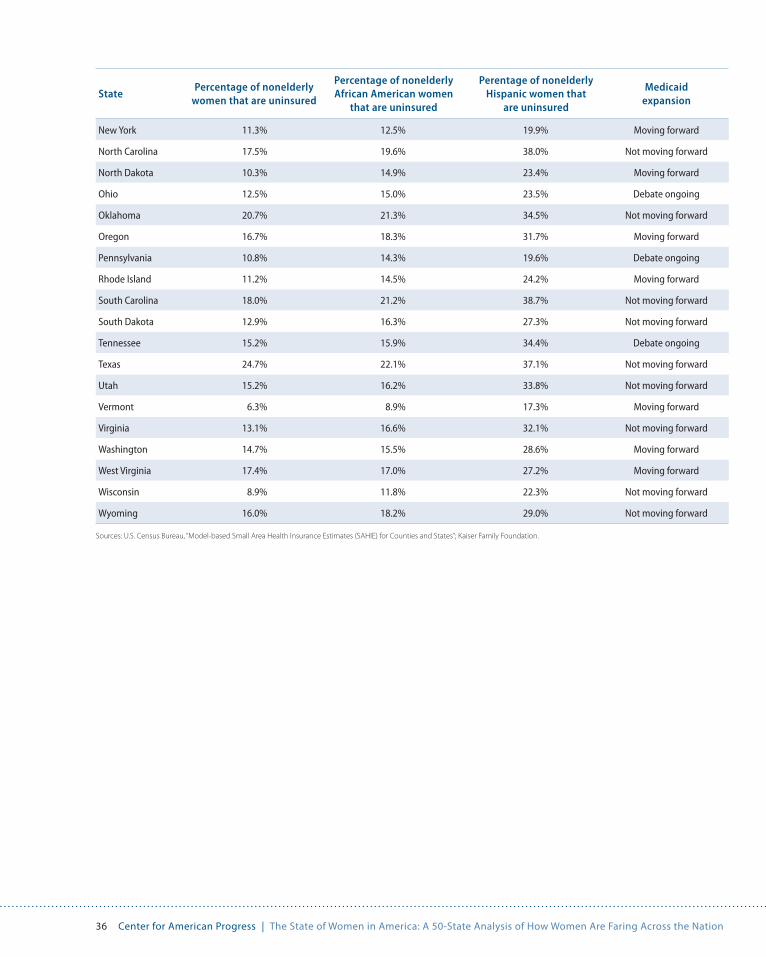
Implementation of Affordable Care Act protections
Women stand to benefit tremendously from the Affordable Care Act. Across the nation, about 21 million women currently lack health insurance.71 Under the Affordable Care Act, many of these women would be eligible for tax credits and cost-sharing subsidies to help them afford health care coverage. The health care law would also expand coverage for women by allowing states to expand Medicaid eligibility for individuals and families living up to 138 percent of the federal pov-erty level. If every state accepted the federal funds guaranteed under the law and expanded Medicaid, 17 million Americans, including at least 7 million women, would gain coverage.72 But as of mid-September 2013, conservative legislatures and governors in 22 states decided not to expand Medicaid coverage in their states, leaving many women without access to affordable health insurance.73
The Affordable Care Act will also end discrimination by insurance companies against women. Before the Affordable Care Act, insurance companies could discriminate against women, denying them coverage or charging them more for preexisting conditions such as pregnancy or being a victim of domestic violence. The health care law will end this discriminatory practice of gender rating and ensure that women will no longer have to pay more than men for the same health care coverage.
Table 13 shows the number of uninsured women by state, including African American and Hispanic women. It also shows where each state stands on Medicaid expansion.
35 Center for American Progress | The State of Women in America: A 50-State Analysis of How Women Are Faring Across the Nation
TABLE 13
Affordable Care Act protections
Percentage of women without insurance coverage, and state policy decisions on Medicaid expansion
State Percentage of nonelderly
women that are uninsured
Percentage of nonelderly African American women
that are uninsured
Perentage of nonelderly Hispanic women that
are uninsured
Medicaid expansion
Alabama 15.5% 18.4% 36.6% Not moving forward
Alaska 19.9% 21.4% 30.9% Not moving forward
Arizona 17.7% 15.0% 27.1% Moving forward
Arkansas 19.1% 20.6% 35.8% Partnership exchange
California 18.4% 15.0% 27.9% Moving forward
Colorado 15.2% 17.2% 28.9% Moving forward
Connecticut 8.5% 10.9% 18.3% Moving forward
Delaware 9.8% 9.9% 21.5% Moving forward
Florida 23.0% 25.1% 35.3% Not moving forward
Georgia 20.4% 22.0% 41.9% Not moving forward
Hawaii 7.2% 7.9% 12.8% Moving forward
Idaho 17.9% 19.4% 32.9% Not moving forward
Illinois 13.1% 17.1% 25.3% Moving forward
Indiana 15.6% 18.2% 27.3% Debate ongoing
Iowa 9.5% 12.3% 22.4% Partnership exchange
Kansas 13.4% 17.7% 29.3% Not moving forward
Kentucky 16.2% 17.9% 33.9% Moving forward
Louisiana 19.4% 23.3% 35.6% Not moving forward
Maine 11.3% 11.1% 20.8% Not moving forward
Maryland 10.4% 11.9% 28.9% Moving forward
Massachusetts 4.0% 6.1% 8.3% Moving forward
Michigan 12.1% 14.6% 21.3% Moving forward
Minnesota 8.8% 14.0% 26.3% Moving forward
Mississippi 19.4% 22.0% 39.3% Not moving forward
Missouri 15.1% 18.9% 28.0% Not moving forward
Montana 20.4% 23.2% 35.2% Not moving forward
Nebraska 12.2% 15.0% 26.7% Not moving forward
Nevada 22.1% 21.7% 34.0% Moving forward
New Hampshire 11.7% 14.3% 26.4% Debate ongoing
New Jersey 13.4% 13.8% 26.8% Moving forward
New Mexico 21.3% 19.0% 24.6% Moving forward
36 Center for American Progress | The State of Women in America: A 50-State Analysis of How Women Are Faring Across the Nation
State Percentage of nonelderly
women that are uninsured
Percentage of nonelderly African American women
that are uninsured
Perentage of nonelderly Hispanic women that
are uninsured
Medicaid expansion
New York 11.3% 12.5% 19.9% Moving forward
North Carolina 17.5% 19.6% 38.0% Not moving forward
North Dakota 10.3% 14.9% 23.4% Moving forward
Ohio 12.5% 15.0% 23.5% Debate ongoing
Oklahoma 20.7% 21.3% 34.5% Not moving forward
Oregon 16.7% 18.3% 31.7% Moving forward
Pennsylvania 10.8% 14.3% 19.6% Debate ongoing
Rhode Island 11.2% 14.5% 24.2% Moving forward
South Carolina 18.0% 21.2% 38.7% Not moving forward
South Dakota 12.9% 16.3% 27.3% Not moving forward
Tennessee 15.2% 15.9% 34.4% Debate ongoing
Texas 24.7% 22.1% 37.1% Not moving forward
Utah 15.2% 16.2% 33.8% Not moving forward
Vermont 6.3% 8.9% 17.3% Moving forward
Virginia 13.1% 16.6% 32.1% Not moving forward
Washington 14.7% 15.5% 28.6% Moving forward
West Virginia 17.4% 17.0% 27.2% Moving forward
Wisconsin 8.9% 11.8% 22.3% Not moving forward
Wyoming 16.0% 18.2% 29.0% Not moving forward
Sources: U.S. Census Bureau, “Model-based Small Area Health Insurance Estimates (SAHIE) for Counties and States”; Kaiser Family Foundation.
37 Center for American Progress | The State of Women in America: A 50-State Analysis of How Women Are Faring Across the Nation
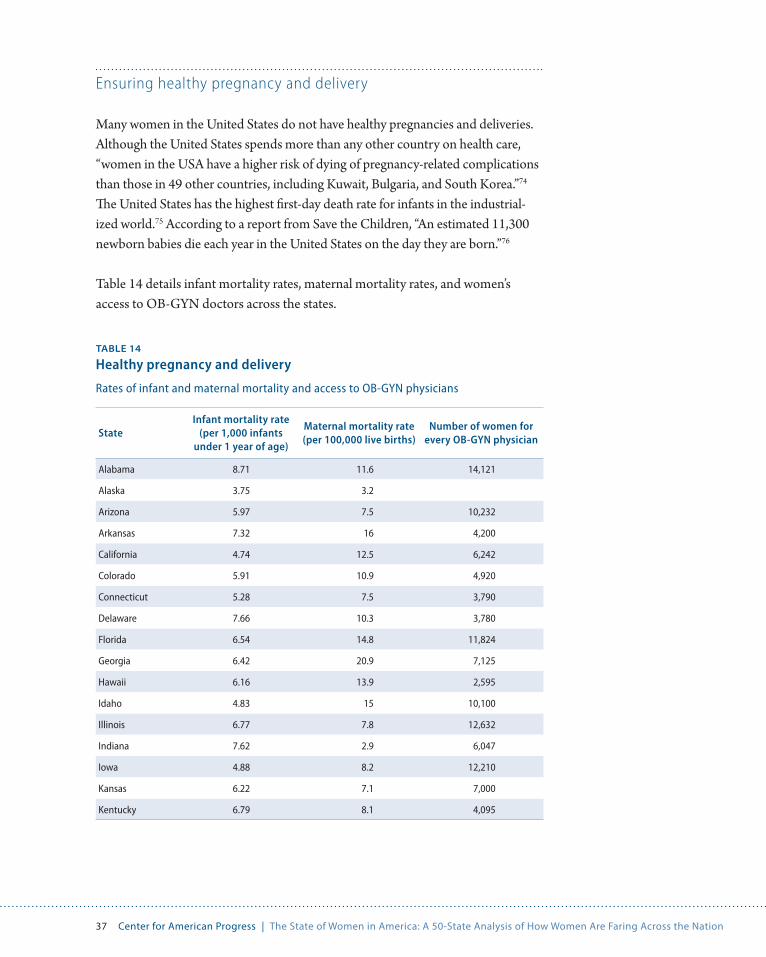
Ensuring healthy pregnancy and delivery
Many women in the United States do not have healthy pregnancies and deliveries. Although the United States spends more than any other country on health care, “women in the USA have a higher risk of dying of pregnancy-related complications than those in 49 other countries, including Kuwait, Bulgaria, and South Korea.”74 The United States has the highest first-day death rate for infants in the industrial-ized world.75 According to a report from Save the Children, “An estimated 11,300 newborn babies die each year in the United States on the day they are born.”76
Table 14 details infant mortality rates, maternal mortality rates, and women’s access to OB-GYN doctors across the states.
TABLE 14
Healthy pregnancy and delivery
Rates of infant and maternal mortality and access to OB-GYN physicians
StateInfant mortality rate
(per 1,000 infants under 1 year of age)
Maternal mortality rate (per 100,000 live births)
Number of women for every OB-GYN physician
Alabama 8.71 11.6 14,121
Alaska 3.75 3.2
Arizona 5.97 7.5 10,232
Arkansas 7.32 16 4,200
California 4.74 12.5 6,242
Colorado 5.91 10.9 4,920
Connecticut 5.28 7.5 3,790
Delaware 7.66 10.3 3,780
Florida 6.54 14.8 11,824
Georgia 6.42 20.9 7,125
Hawaii 6.16 13.9 2,595
Idaho 4.83 15 10,100
Illinois 6.77 7.8 12,632
Indiana 7.62 2.9 6,047
Iowa 4.88 8.2 12,210
Kansas 6.22 7.1 7,000
Kentucky 6.79 8.1 4,095

38 Center for American Progress | The State of Women in America: A 50-State Analysis of How Women Are Faring Across the Nation
StateInfant mortality rate
(per 1,000 infants under 1 year of age)
Maternal mortality rate (per 100,000 live births)
Number of women for every OB-GYN physician
Louisiana 7.6 17.9 13,136
Maine 5.4 1.2 5,082
Maryland 6.75 18.7 7,797
Massachusetts 4.43 4.8 5,245
Michigan 7.13 21 10,905
Minnesota 4.49 5 6,259
Mississippi 9.67 19 5,975
Missouri 6.61 12.7 4,418
Montana 5.89 10.1 5,700
Nebraska 5.25 9 6,564
Nevada 5.59 10 2,868
New Hampshire 3.96 9.2 3,627
New Jersey 4.81 16.5 4,067
New Mexico 5.64 16.5 13,700
New York 5.09 18.9
North Carolina 7.01 10.9 5,493
North Dakota 6.81 10.3 5,400
Ohio 7.71 7.2 3,983
Oklahoma 7.59 20.1 18,713
Oregon 4.94 6.5 2,829
Pennsylvania 7.25 10.1 19,656
Rhode Island 7.07 5.2 7,383
South Carolina 7.37 12 7,408
South Dakota 6.94 9 8,000
Tennessee 7.93 11 8,471
Texas 6.13 10.5 4,617
Utah 4.86 9.9 7,869
Vermont 4.18 2.6 4,367
Virginia 6.8 8.3 5,062
Washington 4.5 9 5,168
West Virginia 7.28 10.4 15,340
Wisconsin 5.84 10.9 9,156
Wyoming 6.75 17 4,380
Note: Blanks indicate that the sample size was too small to make a confident calculation for that subgroup.
Sources: National Center for Health Statistics, National Women’s Law Center, and U.S. Bureau of Labor Statistics.

39 Center for American Progress | The State of Women in America: A 50-State Analysis of How Women Are Faring Across the Nation
Conclusion
While women have come a long way over the past century, this report serves as a stark reminder that much remains to be done in order to achieve greater freedom, fairness, and equality for all. As we continue on the path to reaching this goal, we must keep in mind that we are not just improving the lives of women, but we are also improving the lives of their families and their children. Women and their families deserve a fair shot so that they can get ahead and not just get by.
40 Center for American Progress | The State of Women in America: A 50-State Analysis of How Women Are Faring Across the Nation
Methodology
Selecting the factors
The factors were selected based on the unique challenges facing women across three broad categories of life: economic security, leadership, and health. The factors were chosen based on their ability to cover different facets of each of these catego-ries. Therefore, the economic security portion incorporates not only state rank-ings on wage gaps and poverty rates but also evaluates states based on education, health, and labor policies that would have a positive impact on women’s economic security. The section on women’s leadership includes factors that assess both the public and private sectors. The health section ranges from looking at overall access to health care to reproductive health outcomes to abortion protections specifically. We aimed to include data on women of color where possible to provide a more complete picture of the progress made and challenges remaining for all women.
It should be noted, generally speaking, that it was not feasible to canvas every data source and include every piece of data pertaining to the three categories in this report. What’s more, data are not available for all issues of interest in each cat-egory. Therefore, it should also be noted that the rankings and grades assigned to the states in the report are based solely on the factors examined in the report and the grading system described in greater detail below.
41 Center for American Progress | The State of Women in America: A 50-State Analysis of How Women Are Faring Across the Nation
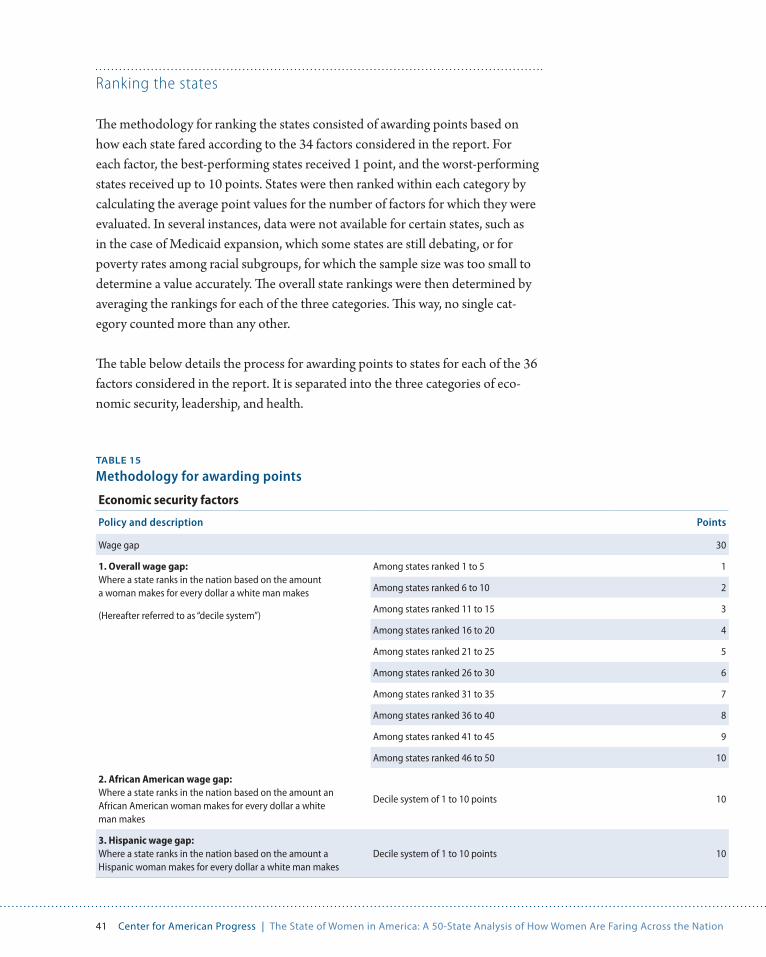
Ranking the states
The methodology for ranking the states consisted of awarding points based on how each state fared according to the 34 factors considered in the report. For each factor, the best-performing states received 1 point, and the worst-performing states received up to 10 points. States were then ranked within each category by calculating the average point values for the number of factors for which they were evaluated. In several instances, data were not available for certain states, such as in the case of Medicaid expansion, which some states are still debating, or for poverty rates among racial subgroups, for which the sample size was too small to determine a value accurately. The overall state rankings were then determined by averaging the rankings for each of the three categories. This way, no single cat-egory counted more than any other.
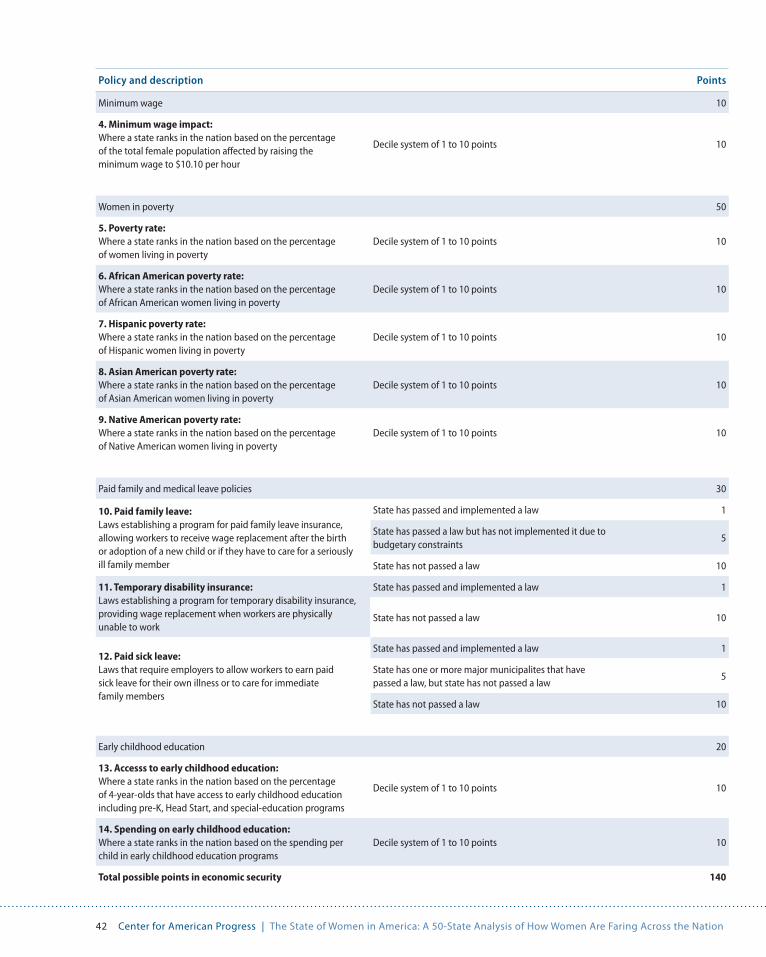
The table below details the process for awarding points to states for each of the 36 factors considered in the report. It is separated into the three categories of eco-nomic security, leadership, and health.
TABLE 15
Methodology for awarding points
Economic security factors
Policy and description Points
Wage gap 30
1. Overall wage gap: Where a state ranks in the nation based on the amount a woman makes for every dollar a white man makes
(Hereafter referred to as “decile system”)
Among states ranked 1 to 5 1
Among states ranked 6 to 10 2
Among states ranked 11 to 15 3
Among states ranked 16 to 20 4
Among states ranked 21 to 25 5
Among states ranked 26 to 30 6
Among states ranked 31 to 35 7
Among states ranked 36 to 40 8
Among states ranked 41 to 45 9
Among states ranked 46 to 50 10
2. African American wage gap: Where a state ranks in the nation based on the amount an African American woman makes for every dollar a white man makes
Decile system of 1 to 10 points 10
3. Hispanic wage gap: Where a state ranks in the nation based on the amount a Hispanic woman makes for every dollar a white man makes
Decile system of 1 to 10 points 10
42 Center for American Progress | The State of Women in America: A 50-State Analysis of How Women Are Faring Across the Nation
Policy and description Points
Minimum wage 10
4. Minimum wage impact: Where a state ranks in the nation based on the percentage of the total female population affected by raising the minimum wage to $10.10 per hour
Decile system of 1 to 10 points 10
Women in poverty 50
5. Poverty rate: Where a state ranks in the nation based on the percentage of women living in poverty
Decile system of 1 to 10 points 10
6. African American poverty rate: Where a state ranks in the nation based on the percentage of African American women living in poverty
Decile system of 1 to 10 points 10
7. Hispanic poverty rate: Where a state ranks in the nation based on the percentage of Hispanic women living in poverty
Decile system of 1 to 10 points 10
8. Asian American poverty rate: Where a state ranks in the nation based on the percentage of Asian American women living in poverty
Decile system of 1 to 10 points 10
9. Native American poverty rate: Where a state ranks in the nation based on the percentage of Native American women living in poverty
Decile system of 1 to 10 points 10
Paid family and medical leave policies 30
10. Paid family leave: Laws establishing a program for paid family leave insurance, allowing workers to receive wage replacement after the birth or adoption of a new child or if they have to care for a seriously ill family member
State has passed and implemented a law 1
State has passed a law but has not implemented it due to budgetary constraints
5
State has not passed a law 10
11. Temporary disability insurance: Laws establishing a program for temporary disability insurance, providing wage replacement when workers are physically unable to work
State has passed and implemented a law 1
State has not passed a law 10
12. Paid sick leave: Laws that require employers to allow workers to earn paid sick leave for their own illness or to care for immediate family members
State has passed and implemented a law 1
State has one or more major municipalites that have passed a law, but state has not passed a law
5
State has not passed a law 10
Early childhood education 20
13. Accesss to early childhood education: Where a state ranks in the nation based on the percentage of 4-year-olds that have access to early childhood education including pre-K, Head Start, and special-education programs
Decile system of 1 to 10 points 10
14. Spending on early childhood education: Where a state ranks in the nation based on the spending per child in early childhood education programs
Decile system of 1 to 10 points 10
Total possible points in economic security 140
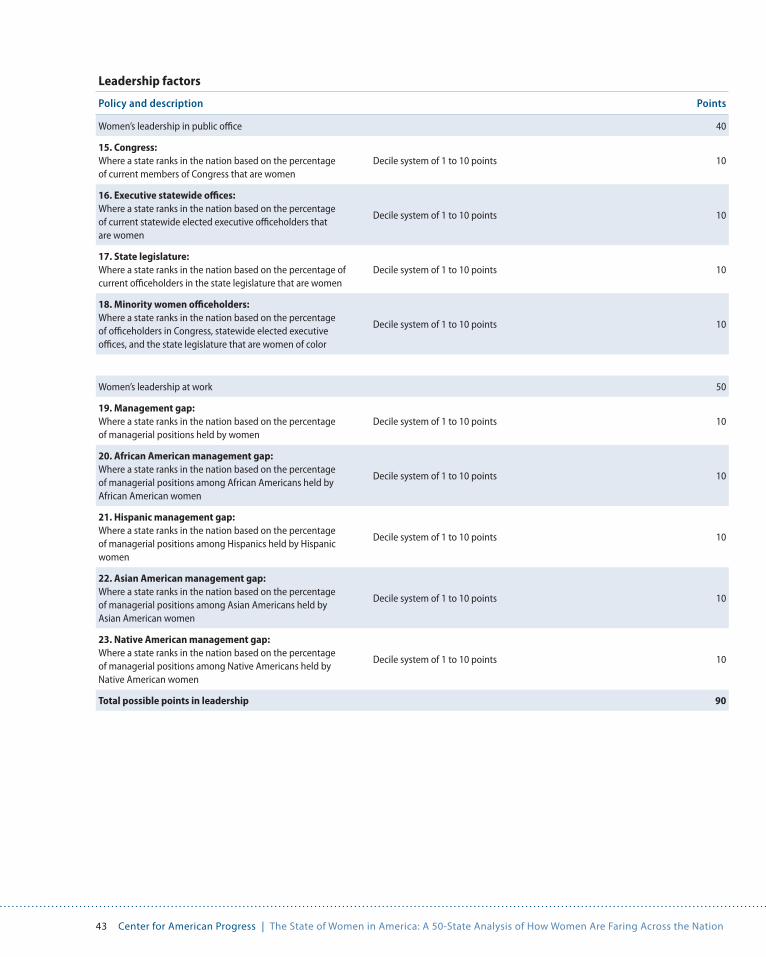
43 Center for American Progress | The State of Women in America: A 50-State Analysis of How Women Are Faring Across the Nation
Leadership factors
Policy and description Points
Women’s leadership in public office 40
15. Congress: Where a state ranks in the nation based on the percentage of current members of Congress that are women
Decile system of 1 to 10 points 10
16. Executive statewide offices: Where a state ranks in the nation based on the percentage of current statewide elected executive officeholders that are women
Decile system of 1 to 10 points 10
17. State legislature: Where a state ranks in the nation based on the percentage of current officeholders in the state legislature that are women
Decile system of 1 to 10 points 10
18. Minority women officeholders: Where a state ranks in the nation based on the percentage of officeholders in Congress, statewide elected executive offices, and the state legislature that are women of color
Decile system of 1 to 10 points 10
Women’s leadership at work 50
19. Management gap: Where a state ranks in the nation based on the percentage of managerial positions held by women
Decile system of 1 to 10 points 10
20. African American management gap: Where a state ranks in the nation based on the percentage of managerial positions among African Americans held by African American women
Decile system of 1 to 10 points 10
21. Hispanic management gap: Where a state ranks in the nation based on the percentage of managerial positions among Hispanics held by Hispanic women
Decile system of 1 to 10 points 10
22. Asian American management gap: Where a state ranks in the nation based on the percentage of managerial positions among Asian Americans held by Asian American women
Decile system of 1 to 10 points 10
23. Native American management gap: Where a state ranks in the nation based on the percentage of managerial positions among Native Americans held by Native American women
Decile system of 1 to 10 points 10
Total possible points in leadership 90
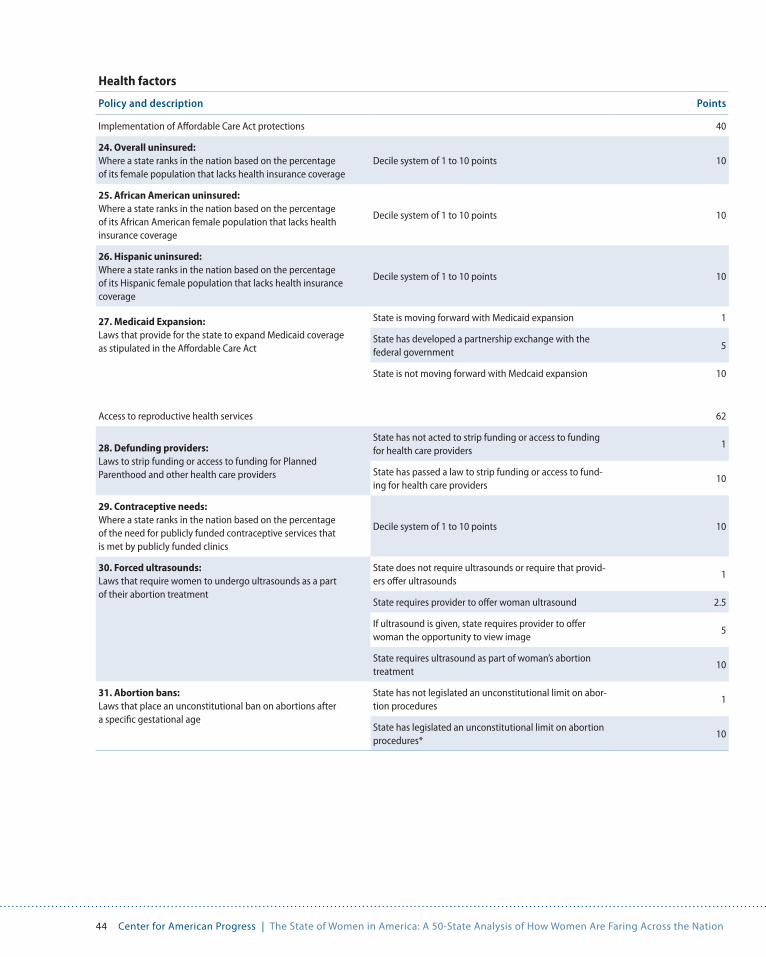
44 Center for American Progress | The State of Women in America: A 50-State Analysis of How Women Are Faring Across the Nation
Health factors
Policy and description Points
Implementation of Affordable Care Act protections 40
24. Overall uninsured: Where a state ranks in the nation based on the percentage of its female population that lacks health insurance coverage
Decile system of 1 to 10 points 10
25. African American uninsured: Where a state ranks in the nation based on the percentage of its African American female population that lacks health insurance coverage
Decile system of 1 to 10 points 10
26. Hispanic uninsured: Where a state ranks in the nation based on the percentage of its Hispanic female population that lacks health insurance coverage
Decile system of 1 to 10 points 10
27. Medicaid Expansion: Laws that provide for the state to expand Medicaid coverage as stipulated in the Affordable Care Act
State is moving forward with Medicaid expansion 1
State has developed a partnership exchange with the federal government
5
State is not moving forward with Medcaid expansion 10
Access to reproductive health services 62
28. Defunding providers: Laws to strip funding or access to funding for Planned Parenthood and other health care providers
State has not acted to strip funding or access to funding for health care providers
1
State has passed a law to strip funding or access to fund-ing for health care providers
10
29. Contraceptive needs: Where a state ranks in the nation based on the percentage of the need for publicly funded contraceptive services that is met by publicly funded clinics
Decile system of 1 to 10 points 10
30. Forced ultrasounds: Laws that require women to undergo ultrasounds as a part of their abortion treatment
State does not require ultrasounds or require that provid-ers offer ultrasounds
1
State requires provider to offer woman ultrasound 2.5
If ultrasound is given, state requires provider to offer woman the opportunity to view image
5
State requires ultrasound as part of woman’s abortion treatment
10
31. Abortion bans: Laws that place an unconstitutional ban on abortions after a specific gestational age
State has not legislated an unconstitutional limit on abor-tion procedures
1
State has legislated an unconstitutional limit on abortion procedures*
10
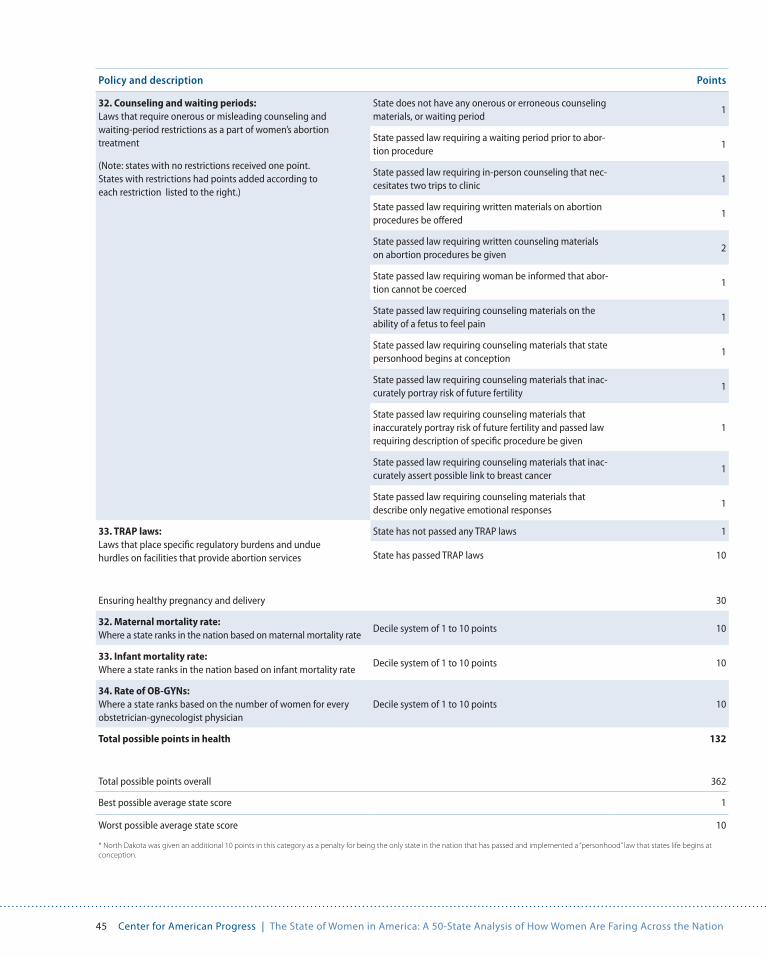
45 Center for American Progress | The State of Women in America: A 50-State Analysis of How Women Are Faring Across the Nation
Policy and description Points
32. Counseling and waiting periods: Laws that require onerous or misleading counseling and waiting-period restrictions as a part of women’s abortion treatment
(Note: states with no restrictions received one point. States with restrictions had points added according to each restriction listed to the right.)
State does not have any onerous or erroneous counseling materials, or waiting period
1
State passed law requiring a waiting period prior to abor-tion procedure
1
State passed law requiring in-person counseling that nec-cesitates two trips to clinic
1
State passed law requiring written materials on abortion procedures be offered
1
State passed law requiring written counseling materials on abortion procedures be given
2
State passed law requiring woman be informed that abor-tion cannot be coerced
1
State passed law requiring counseling materials on the ability of a fetus to feel pain
1
State passed law requiring counseling materials that state personhood begins at conception
1
State passed law requiring counseling materials that inac-curately portray risk of future fertility
1
State passed law requiring counseling materials that inaccurately portray risk of future fertility and passed law requiring description of specific procedure be given
1
State passed law requiring counseling materials that inac-curately assert possible link to breast cancer
1
State passed law requiring counseling materials that describe only negative emotional responses
1
33. TRAP laws: Laws that place specific regulatory burdens and undue hurdles on facilities that provide abortion services
State has not passed any TRAP laws 1
State has passed TRAP laws 10
Ensuring healthy pregnancy and delivery 30
32. Maternal mortality rate: Where a state ranks in the nation based on maternal mortality rate
Decile system of 1 to 10 points 10
33. Infant mortality rate: Where a state ranks in the nation based on infant mortality rate
Decile system of 1 to 10 points 10
34. Rate of OB-GYNs: Where a state ranks based on the number of women for every obstetrician-gynecologist physician
Decile system of 1 to 10 points 10
Total possible points in health 132
Total possible points overall 362
Best possible average state score 1
Worst possible average state score 10
* North Dakota was given an additional 10 points in this category as a penalty for being the only state in the nation that has passed and implemented a “personhood” law that states life begins at conception.
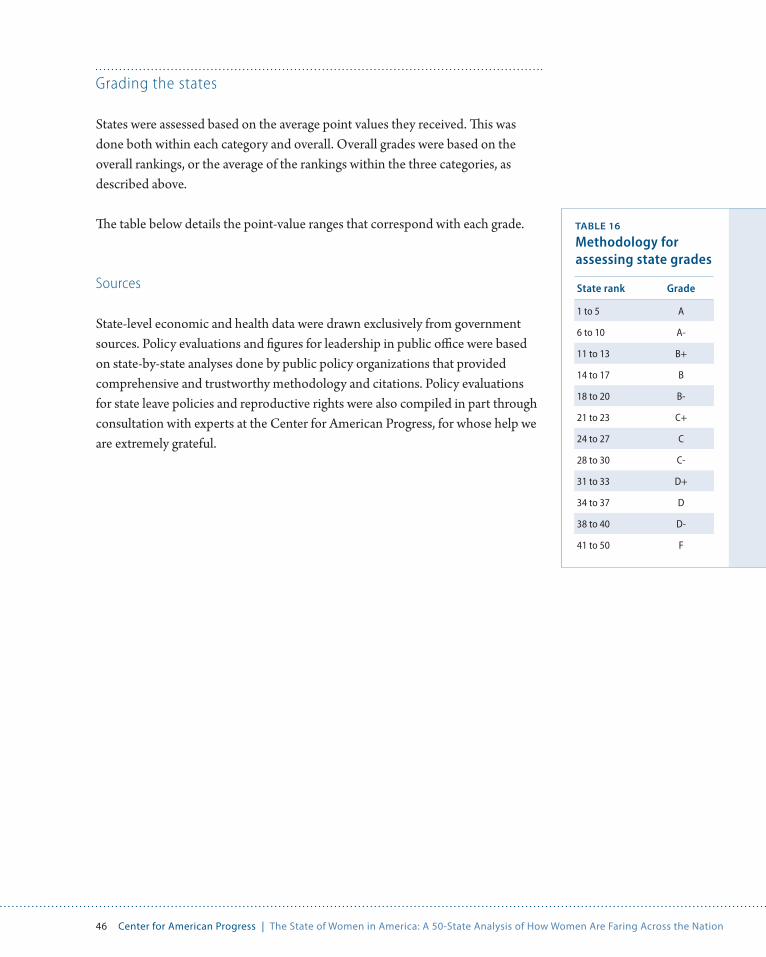
46 Center for American Progress | The State of Women in America: A 50-State Analysis of How Women Are Faring Across the Nation
Grading the states
States were assessed based on the average point values they received. This was done both within each category and overall. Overall grades were based on the overall rankings, or the average of the rankings within the three categories, as described above.
The table below details the point-value ranges that correspond with each grade.
Sources
State-level economic and health data were drawn exclusively from government sources. Policy evaluations and figures for leadership in public office were based on state-by-state analyses done by public policy organizations that provided comprehensive and trustworthy methodology and citations. Policy evaluations for state leave policies and reproductive rights were also compiled in part through consultation with experts at the Center for American Progress, for whose help we are extremely grateful.
State rank Grade
1 to 5 A
6 to 10 A-
11 to 13 B+
14 to 17 B
18 to 20 B-
21 to 23 C+
24 to 27 C
28 to 30 C-
31 to 33 D+
34 to 37 D
38 to 40 D-
41 to 50 F
TABLE 16
Methodology for assessing state grades
47 Center for American Progress | The State of Women in America: A 50-State Analysis of How Women Are Faring Across the Nation
Author bios
Anna Chu is the Policy Director for the ThinkProgress War Room at the Center for American Progress Action Fund. She brings experience serving as the policy director for the Democratic Senatorial Campaign Committee during the suc-cessful 2012 cycle that saw Democrats adding two seats to their majority in the Senate. As policy director, Anna oversaw and managed all policy issues for the committee and Democratic Senate candidates. Prior to working at the Democratic Senatorial Campaign Committee, Anna served as the policy advisor for the House Democratic Caucus. She previously served as a federal law clerk and worked as an associate at Paul Hastings. Anna graduated from the University of California, Berkeley, and has a J.D. from the University of Southern California.
Charles Posner is the State Communications Assistant for the ThinkProgress War Room. Prior to joining American Progress, he worked at Greenberg Quinlan Rosner Research, specializing in U.S. political issues, and as a field organizer in Ohio on campaigns to overturn a voter suppression law and protect collective bar-gaining rights for public-sector unions. Posner graduated with a bachelor’s degree in political science from Brown University, where he was captain of the men’s ten-nis team in his senior year. He hails from Cambridge, Massachusetts.
Acknowledgements
Countless people gave their time, advice, and assistance on this report. We cannot begin to thank everyone, but we are particularly grateful to Jocelyn Frye, Sarah Jane Glynn, Heidi Williamson, Judith Warner, Melissa Boteach, Sarah Baron, Katie Wright, and Arkadi Gerney.
48 Center for American Progress | The State of Women in America: A 50-State Analysis of How Women Are Faring Across the Nation
Endnotes
1 Judith Warner, “Lessons Learned” (Washington: Center for American Progress, 2013), available at http://www.americanprogress.org/issues/labor/re-port/2013/04/26/61538/lessons-learned/.
2 Jane Farrell, “Infographic: Where Are U.S. Women in 2013?”, Center for American Progress, March 8, 2013, available at http://www.americanprogress.org/issues/labor/news/2013/03/08/55678/infographic-where-are-u-s-women-in-2013/.
3 Calculations based on data from the U.S. Census Bureau, 2012 American Community Survey (U.S. Depart-ment of Commerce, 2013).
4 Ibid.
5 Farrell, “Infographic: Where Are U.S. Women in 2013?”
6 Calculations based on data from the U.S. Census Bureau, 2012 American Community Survey.
7 Kaiser Family Foundation, “Health Insurance Coverage of Nonelderly Women 0-64,” available at http://kff.org/other/state-indicator/nonelderly-women/ (last accessed August 2013).
8 U.S. Census Bureau, Women in the Workforce (U.S. De-partment of Commerce, 2010), available at http://www.census.gov/newsroom/pdf/women_workforce_slides.pdf.
9 Heather Boushey, Ann O’Leary, and Sarah Jane Glynn, “Our Working Nation” (Washington: Center for Ameri-can Progress, 2013), available at http://www.american-progress.org/issues/labor/report/2013/02/05/51720/our-working-nation-in-2013/.
10 Wendy Wang, Kim Parker, and Paul Taylor, “Breadwinner Moms” (Washington: Pew Research Center, 2013), avail-able at http://www.pewsocialtrends.org/2013/05/29/breadwinner-moms/.
11 Wage-gap calculations based on data from the U.S. Census Bureau, 2012 American Community Survey.
12 Ibid.
13 Ibid.
14 Ibid.
15 Ibid.
16 Ibid.
17 Ibid.
18 Wang, Parker, and Taylor, “Breadwinner Moms.”
19 Ibid.
20 Calculations based on data from the U.S. Census Bureau, 2012 American Community Survey.
21 Ibid.
22 Ibid.
23 David Madland and Karla Walter, “Top 6 Policies to Help the Middle Class that Won’t Cost Taxpayers a Penny,” Center for American Progress, April 24, 2013, available at http://www.americanprogress.org/issues/labor/news/2013/04/24/61295/top-6-policies-to-help-the-middle-class-that-wont-cost-taxpayers-a-penny/.
24 U.S. Bureau of Labor Statistics, “CPI Inflation Calculator,” available at http://www.bls.gov/data/inflation_calcula-tor.htm (last accessed August 2013).
25 Madland and Walter, “Top 6 Policies to Help the Middle Class that Won’t Cost Taxpayers a Penny.”
26 National Women’s Law Center, “60 Percent of Women’s Job Gains in the Recovery Are in the 10 Largest Low-Wage Jobs” (2013), available at http://www.nwlc.org/sites/default/files/pdfs/60percentfactsheet.pdf.
27 Economic Policy Institute, “Characteristics of workers who would be affected by increasing the federal mini-mum wage to $10.10 by July 1, 2015” (2013), available at http://www.epi.org/files/2013/EPI-federal-minimum-wage-state-impact.pdf.
28 Ibid.
29 Kai Filion, “Fact Sheet for 2009 minimum wage increase—Minimum Wage Issue Guide” (Washington: Economic Policy Institute, 2009), available at http://www.epi.org/publication/mwig_fact_sheet/.
30 Carmen DeNavas-Walt, Bernadette D. Proctor, and Jessica C. Smith, “Income Poverty, and Health Insurance Coverage in the United States: 2012” (Washington: U.S. Census Bureau, 2013), available at http://www.census.gov/prod/2013pubs/p60-245.pdf.
31 Ibid.
32 U.S. Census Bureau, 2012 American Community Survey.
33 Catherine Rampell, “In Most Rich Countries, Women Work More Than Men,” The New York Times, December 19, 2012, available at http://economix.blogs.nytimes.com/2012/12/19/in-most-rich-countries-women-work-more-than-men/?_r=0.
34 Heather Boushey and Jane Farrell, “A Women’s Agenda for the 21st Century” (Washington: Center for American Progress, 2013), available at http://www.americanprogress.org/issues/economy/report/2013/05/23/64276/a-womans-agenda-for-the-21st-century/.
35 Ibid.
36 HighScope, “HighScope Perry Preschool Study” (2005), available at http://www.highscope.org/Content.asp?ContentId=219.
37 Boushey and Farrell, “A Women’s Agenda for the 21st Century.”
38 Rob Grunewald and Arthur J. Rolnick, “Early Childhood Development: Economic Development with a High Public Return,” fedgazette, March 2003, available at http://www.minneapolisfed.org/publications_papers/pub_display.cfm?id=3832.
39 Farrell, “Infographic: Where Are U.S. Women in 2013?”
40 Ibid.
41 Ibid. The figure for state legislators comes from a Center for American Progress Action Fund analysis based on data from the Center for American Women and Politics. See Center for American Women and Politics, “Women in Elective Office,” available at http://www.cawp.rutgers.edu/ (last accessed September 2013).
49 Center for American Progress | The State of Women in America: A 50-State Analysis of How Women Are Faring Across the Nation
42 Catalyst, “Women in Government” (2012), available at http://www.catalyst.org/knowledge/women-govern-ment.
43 Farrell, “Infographic: Where Are U.S. Women in 2013?”
44 U.S. Census Bureau, “American FactFinder,” available at http://factfinder2.census.gov/faces/tableservices/jsf/pages/productview.xhtml?pid=EEO_10_5YR_EEOALL1R&prodType=table (last accessed August 2013).
45 Dan Mangan, “Medical Bills Are The Biggest Cause of US Bankruptcies,” CNBC News, June 25, 2013, available at http://www.cnbc.com/id/100840148.
46 NBC News, “Biggest cause of personal bankruptcy: Medical bills,” June 25, 2013, available at http://www.nbcnews.com/business/biggest-cause-personal-bank-ruptcy-medical-bills-6C10442408.
47 U.S. Census Bureau, “Model-based Small Area Health Insurance Estimates (SAHIE) for Counties and States,” available at http://www.census.gov/did/www/sahie/ (last accessed September 2013).
48 U.S. Bureau of Labor Statistics, “Occupational Employ-ment Statistics, Occupational Employment and Wages, May 2012,” available at http://www.bls.gov/oes/current/oes291064.htm (last accessed September 2013).
49 Amnesty International, “Maternal Health in the U.S.” (2011), available at http://www.amnestyusa.org/our-work/campaigns/demand-dignity/maternal-health-is-a-human-right/maternal-health-in-the-us.
50 National Women’s Law Center, “The Affordable Care Act and Covering More Women and Families in Medicaid” (2013), available at http://www.nwlc.org/sites/default/files/north_carolina.pdf.
51 Tara Culp-Ressler, “Texas Advances Sweeping Anti-Choice Bill That Will Force Most Abortion Clinics to Close,” ThinkProgress, June 19, 2013, available at http://thinkprogress.org/health/2013/06/19/2180571/texas-advances-trap-special-session/.
52 Laura Bassett, “North Carolina Abortion Bill Passes Sen-ate Despite GOP Governor’s Rebuke,” HuffPost Politics, July 3, 2013, available at http://www.huffingtonpost.com/2013/07/03/north-carolina-abortion_n_3541251.html.
53 Planned Parenthood, “Planned Parenthood at a Glance,” available at http://www.plannedparenthood.org/about-us/who-we-are/planned-parenthood-glance-5552.htm (last accessed August 2013).
54 Emilie Openchowski, “Abortion Is the Battle, but Wom-en’s Health Is the War,” Center for American Progress, August 23, 2012, available at http://www.american-progress.org/issues/women/news/2012/08/23/33841/abortion-is-the-battle-but-womens-health-is-the-war/.
55 Guttmacher Institute, “Laws Affecting Reproductive Health and Rights: State Trends at Midyear, 2013,” available at http://www.guttmacher.org/statecenter/updates/2013/statetrends22013.html (last accessed September 2013).
56 Rita Rubin, “The pill: 50 years of birth control changed women’s lives,” USA Today, May 8, 2010, available at http://usatoday30.usatoday.com/news/health/2010-05-07-1Apill07_CV_N.htm.
57 Jennifer J. Frost, Mia R. Zolna, and Lori Frohwirth, “Contraceptive Needs and Services, 2010” (New York: Guttmacher Institute, 2013), available at http://www.guttmacher.org/pubs/win/contraceptive-needs-2010.pdf.
58 Guttmacher Institute, “Facts on Publicly Funded Contra-ceptive Services in the United States” (2013), available at http://www.guttmacher.org/pubs/fb_contracep-tive_serv.html.
59 Guttmacher Institute, “Requirements for Ultrasound” (2013), available at http://www.guttmacher.org/state-center/spibs/spib_RFU.pdf.
60 Dahlia Lithwick, “Virginia’s Proposed Ultrasound Law Is an Abomination,” Slate, February 16, 2012, available at http://www.slate.com/articles/double_x/dou-blex/2012/02/virginia_ultrasound_law_women_who_want_an_abortion_will_be_forcibly_penetrated_for_no_medical_reason.html.
61 Erik Eckholm and Kim Severson, “Virginia Senate Passes Ultrasound Bill as Other States Take Notice,” The New York Times, February 28, 2012, available at http://www.nytimes.com/2012/02/29/us/virginia-senate-passes-revised-ultrasound-bill.html?pagewanted=all&_r=0.
62 Ibid.
63 Guttmacher Institute, “Requirements for Ultrasound.”
64 Guttmacher Institute, “State Policies on Later Abor-tions” (2013), available at http://www.guttmacher.org/statecenter/spibs/spib_PLTA.pdf.
65 Tara Culp-Ressler, “North Dakota Votes To Ban All Abor-tions By Defining Life At Conception,” ThinkProgress, March 22, 2013, available at http://thinkprogress.org/health/2013/03/22/1764141/north-dakota-passes-personhood/.
66 Guttmacher Institute, “Counseling and Waiting Periods for Abortion” (2013), available at http://www.guttm-acher.org/statecenter/spibs/spib_MWPA.pdf.
67 Guttmacher Institute, “Targeted Regulation of Abortion Providers” (2013), available at http://www.guttmacher.org/statecenter/spibs/spib_TRAP.pdf.
68 Ibid.
69 Culp-Ressler, “Texas Advances Sweeping Anti-Choice Bill That Will Force Most Abortion Clinics to Close.”
70 Guttmacher Institute, “Targeted Regulation of Abortion Providers.”
71 U.S. Census Bureau, “Model-based Small Area Health Insurance Estimates (SAHIE) for Counties and States.”
72 Boushey and Farrell, “A Women’s Agenda for the 21st Century.”
73 Kaiser Family Foundation, “Status of State Action on the Medicaid Expansion Decision, as of September 3, 2013,” available at http://kff.org/medicaid/state-indicator/state-activity-around-expanding-medicaid-under-the-affordable-care-act/ (last accessed September 2013).
74 Amnesty International, “Maternal Health in the U.S.”
75 Save the Children, “State of the World’s Mothers” (2013), available at http://www.savethechildrenweb.org/SOWM-2013/#/10/.
76 Ibid.
The Center for American Progress is a nonpartisan research and educational institute
dedicated to promoting a strong, just, and free America that ensures opportunity
for all. We believe that Americans are bound together by a common commitment to
these values and we aspire to ensure that our national policies reflect these values.
We work to find progressive and pragmatic solutions to significant domestic and
international problems and develop policy proposals that foster a government that
is “of the people, by the people, and for the people.”
1333 H STREET, NW, 10TH FLOOR, WASHINGTON, DC 20005 • TEL: 202-682-1611 • FAX: 202-682-1867 • WWW.AMERICANPROGRESS.ORG


![America re america [pdfstuff.blogspot.com]](https://img.dokumen.tips/doc/110x75/5599b0111a28ab1f2b8b4791/america-re-america-pdfstuffblogspotcom.jpg)