Embed Size (px)
Citation preview

The State of U.S. Seaborne Trade And Port Efforts to Green the Supply Chain
December 12, 2016
Gene Seroka
Executive Director
The International
Commission for
Environmental
Cooperation

North American Containerized Trade
Los Angeles Trade Gateway At A Glance
State of the Shipping Industry
The Need for Focusing on Supply Chain Efficiency
Advancing Environmental Initiatives
Presentation Overview

North American Container Traffic
Inbound via U.S. West Coast 21.4 Million TEUs
Inbound via U.S. East Coast
19.5 Million TEUs
Inbound via U.S. Gulf Coast 2.8 Million TEUs
UNITED STATES’ CONTAINER TRAFFIC: 43.7 Million TEUs
CANADA’s CONTAINER TRAFFIC: 5.4 Million TEUs
MEXICO’s CONTAINER TRAFFIC 5.8 Million TEUs
Source: American Association of Port Authorities CY 2015 Volumes
LA-Long Beach

• #1 U.S. Container Port
• Primary Gateway for
Pacific Rim Trade
• Connectivity to Every
Congressional District
in the U.S. (lower 48)
• Economic Engine
• A Full Service Port
Port of Los Angeles At-A-Glance
Scrap Metal 746,354 metric tons
Autos (WWL) 164,231 units
Fruit (SSA) 90,323 metric tons
Containers 8,160,457 TEUs
Our Lines of Business
+46%
Liquid Bulk (Petroleum) 93,660,059 barrels
Steel (PASHA) 2,690,097 metric tons
Visitors to LA Waterfront 1.6 million in 2015
+33%
-2.1%
-13%
+43%
Cruise 123 calls in 2015 (up by 1 call)
A “Full Service” Port
+29%

Source: Alphaliner. Average of APL, CMA CGM (fr 2010), CSCL, EMC, Hanjin, Hapag-Lloyd,HMM, KL, Maersk, MOL, NYK, WHL, YML, Zim.
-17
.9%
-1
9.6
%
-18
.1%
-1
2.0
%
-1.1
%
10
.7%
1
6.0
%
7.4
%
-0.2
%
-5.5
%
-7.0
%
-10
.5%
-1
2.1
%
1.3
%
4.7
%
-1.1
%
-3.2
%
-1.0
%
0.5
%
-4.3
%
-1.8
%
0.4
%
3.4
%
1.0
%
5.2
%
2.4
%
-1.8
%
-5.9
%
-5.5
%
-9.2
%
1Q
09
2Q
09
3Q
09
4Q
09
1Q
10
2Q
10
3Q
10
4Q
10
1Q
11
2Q
11
3Q
11
4Q
11
1Q
12
2Q
12
3Q
12
4Q
12
1Q
13
2Q
13
3Q
13
4Q
13
1Q
14
2Q
14
3Q
14
4Q
14
1Q
15
2Q
15
3Q
15
4Q
15
1Q
16
2Q
16
Ave
rage
Car
rie
r O
pe
rati
ng
Mar
gin
Container Shipping Lines Continue to Struggle

2M
Ocean 3
7
CKYHE
G6
Mega Shipping Alliances 2015-2016

H2M
THE Alliance
As of October 2016
Ocean Alliance
and others
* *
* Lines that have recently merged, announced plans to merge, or combined through acquisition *
Shipping Alliance Outlook by Q2 2017
} { *

WHY LARGER SHIPS?
A 14,000 TEU vessel costs as much 60% less per slot than a 4,800 TEU vessel
Photo: The 2 largest ships to ever call at a U.S. Port
Maersk Edmonton (15,000 TEUs) CMA CGM Benjamin Franklin (18,000 TEUS)
December 26, 2015
Big Ships Reduce Ocean Transit Costs
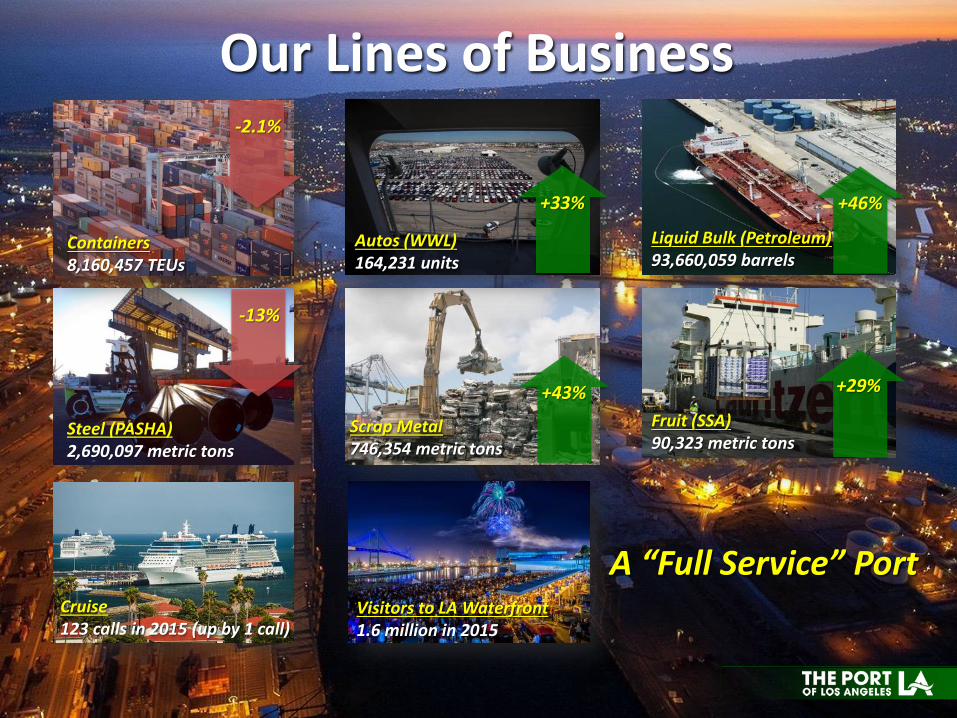
Cargo Surge Management Focus Points
Strategic Land Use
• Re-Purposing Land to Support Short- and Mid-Term Cargo
Needs
Process Management
• Supply Chain Optimization Initiative w/ 100+ Stakeholders
• Active Engagement with State & Federal Policymakers
Technology
• Bay-Wide Truck Reservation System
• Digital Port Information Portal Pilot Project Q2 2017
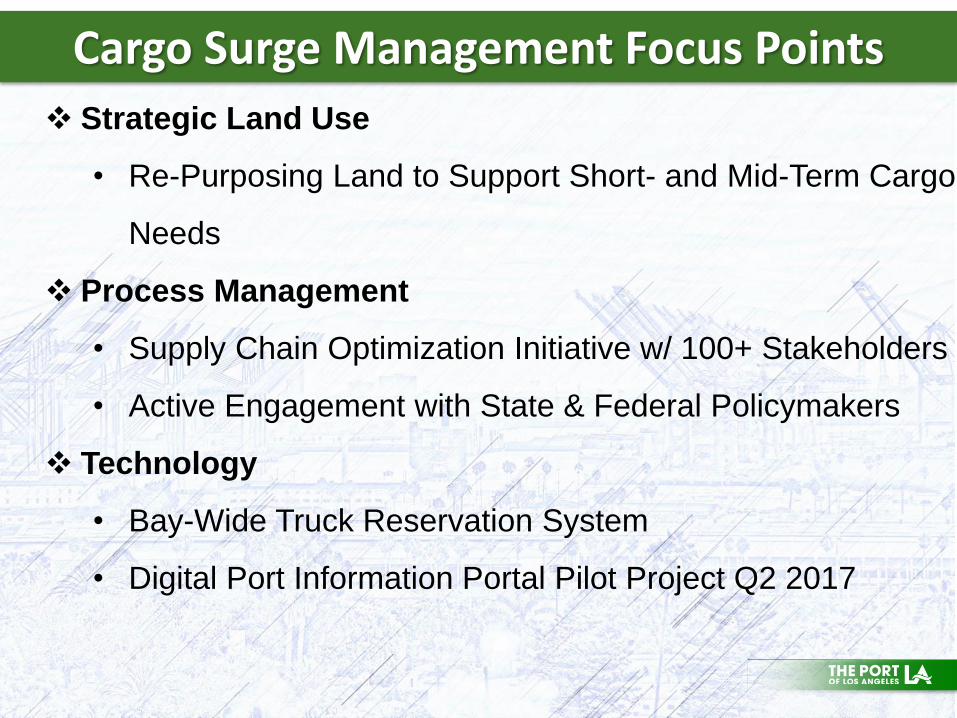
Cargo Data Information Portal Pilot Project

Improved Data-flow Will Give Port & Terminal
Operators Extended Line Of Site To Better…

San Pedro Bay Air Emission Reductions 2005-2015

Supports the State’s Sustainable Freight Action Plan
Establishes New Long-Term Greenhouse Gas Reduction
Goals
Proposed Strategies:
– Freight Efficiency Strategies
– Clean Vehicles, Equipment Technology and Fuels
– Freight Infrastructure Investment and Planning
– Energy Resource Planning
2017 Clean Air Action Plan

$380.5 Million Spent by the Port of Los Angeles since FY 2006
Bulk of Investment, $346.2M, spent on Three Air Quality Programs:
AMP/Shore-Side Power - $200M
Clean Truck Program - $113M
Clean Air Action Plan - $33.2M
15
Environmental Investments

Clean Air Action Plan (3rd update) Clean Truck Program
Vessel Speed Reduction Program
Technology Advancement Program
Annual Air Quality Emissions Inventory Including Operation of Real-Time Air
Monitoring Stations
Grant Programs Pasha Green Omni Terminal – ($14.5M)
Everport ZE/Near ZE Demo – ($5.8M)
Environmental Ship Index Program (IAPH) International Program with 80 Participating
Ports to Incentivize Cleanest Ships to Operate Between these Locations
Current Air Quality Initiatives
POLA’s July 2016 Draft Zero Emission White Paper outlines near-term plan for expanded testing and development of ZE technology

3PL Opportunities -- Pasha Green Omni Terminal $26.6M Demonstration Project
Solar-powered
LED lights
Strong EV Integration
Electric-powered rubber-tired gantry (RTG)
cranes, yard tractors, forklifts (8- &15 tons) and
bus (for worker transport). Standardized
bi-directional charging systems
Renewable Power
Integrated 1 MW
solar photovoltaic
and on-site battery
storage system
At-berth ship
emission capture
systems

Complete Multi-Party Testing and Demonstration Protocol
(completed Spring 2016)
Test and Deploy up to 40 Vehicles/Year
Up to $20 Million Annually from Grant Programs (this will require port
investment for grant fund matching)
Develop Infrastructure Plan (commenced Summer 2016)
Assign Harbor Port Staff, Budget and Resource Requirements
Produce an Annual Report on Technical, Operational and Cost
Feasibility Issues for Ongoing Zero Emission Demonstrations,
including Implementation Planning, as Appropriate
Zero Emissions Five Year Plan

In the Near-Term, Short-Haul Drayage and On-Terminal Container Handling Equipment are Two of the Most Viable Areas for Zero- and Near-Zero Technology Applications & Testing
Our Role
Facilitate Testing and Deployment Opportunities
Establish Clear Test Guidelines & Procedures
Plan & Develop Port Infrastructure (Battery Testing Standardization)
Collaborate with Regional Stakeholders on Testing and Development
Demonstrate Broad Commercial Availability and Cost
Help the Major Truck Manufacturers See the Opportunity and Develop Commercially Available Units
Increased Production Volume will Reduce Product Costs
Demonstrate Operational Reliability
Show that the Trucks and Yard Equipment meet Duty Cycles and have Long-Term Reliability
POLA Zero Emissions Program

Challenges for Ports & Terminals
Being Green in an Evolving Maritime Industry Presents Certain Challenges:
Regulatory Requirements are Increasingly Stringent and Challenging to Meet
Cargo Volume Growth is Slowing (reducing revenues)
Shipping Alliances are Extremely Cost-Focused
Increased Environmental Controls can Impact Port Competitiveness
Community Investment -- and Support from Community -- Remain Critical to Greening and Growing Cargo Operations

Technical Challenges
Ports are Expected to Continue Reducing Criteria Pollutants as Cargo Volumes Grow Over Time
Climate Change Requires more Innovation
The Main Reason Why We Must Reduce Dependence on Combustion-Based Engine Technologies
A Driver for 21st Century Energy Planning and Related Infrastructure Investments
Supply Chain Efficiency
A more Fluid and Efficient Supply Chain will Reduce our Carbon Footprint
Supply Chain Optimization Requires Extensive Stakeholder Engagement, Collaboration and Consensus

Environmental Partners & Affiliates
Autonome
de Cotonou
Autonome de Dakar
Kenya Ports
Authority
Ministry of
Transport, Kenya
Lagos State
Government
Autonome d’Abidjan
Dubai Port
Authority
Mundra
Port & Special
Economic Zone Ltd
Ministry of Transport
& Communications,
Oman
Maritime and Port
Authority of Singapore
Sohar Industrial
Port Company
Port Authority
of Thailand
Melbourne
Corporation
Associated British Ports
Hamburg Port Authority
Brunsbuttel
Ports
GmbH
Cork Company
Dunkerque Authority
Ashdod
Gdansk Authority
Bremen/Bremerhaven
Grand Port Maritime du Havre
Klaipeda State
Seaport Authority
London Authority
Marseille
Authority
Oslo
Freeport of
Riga Authority
Stockholm
Tallinn
Trelleborg
Authority
of
Valencia
Moerdijk
Authority of
Algeciras Bay
Vigo
Autoridad Portuaria de Gijon
Houston
Oakland
Seattle Vancouver
Kobe
Nagoya Port Authority
Yokohama
Bureau of Port and Harbor,
Tokyo Metropolitan
Government
Seoul Metropolitan
Government
Hong Kong
Sydney
Ports
Auckland Ltd.
Jakarta
Capital
City
Long Beach
Barcelona
Zeeland Seaports
Dublin Port Company
Vilagarcia
Transnet National
Ports Authority,
South Africa
Terminal Puerto Arica
Port of Santos
Port Authority
Puerto Mejillones, Chile
Puerto Valparaiso
Los Angeles
Montreal
New York/
New Jersey
Amsterdam
Rotterdam • Antwerp
Gothenburg
Shenzhen
Shanghai
Guangzhou
Busan
Global Port Collaboration is Essential

Thank You


![Rapport d’analyse boursière - Abidjan.net...[PAA] : Le Port Autonome d’Abidjan (PAA) procédera le 28 novembre au paiement des intérêts semestriels et au remboursement partiel](https://img.dokumen.tips/doc/110x75/608f39a74c1b9e5f6d569ea2/rapport-daanalyse-boursire-paa-le-port-autonome-daabidjan-paa.jpg)