Embed Size (px)
Citation preview

The State of the Urology Workforce and Practice in the United States
2018

American Urological Association (AUA) ©AUA 2019
American Urological Association, The State of Urology Workforce and Practice in the United States 2018 Linthicum, Maryland, U.S.A., April 5, 2019.
Retrieved on (date of download) from https://www.AUAnet.org/common/pdf/ research/census/State-Urology-Workforce-Practice-US.pdf.

1
PrefaceThe American Urological Association (AUA) has established a data platform to conduct its Annual Census of urologic professionals, which serves as a vehicle to understand the current urology workforce, identify existing workforce issues and prepare for the future urology work-force.
Since its inception in 2014, the AUA Annual Census consists of questions pertaining to im-portant provider-related topics such as geographic distribution, demographic characteristics, education and training, licensing and board certification, and scope and pattern of practice. Each year, the AUA receives a large number of potential questions from AUA committees, councils, sections, urology subspecialty societies and individual urologists. The ultimate goal of the Annual Census is to fill the knowledge gaps around the specialty with definitive and comparable information.
The AUA Annual Census is designed to not only identify practice characteristics and longitu-dinal variations through base questions that are asked annually, but also delve into emerging topics through new questions collected from the specialty leadership and the urology commu-nity that vary year by year. Responses to base questions in previous years are pre-populated in each subsequent year to be reviewed and updated as needed by the respondent. This strategy allows more time for participants to respond to the important questions on new topics; many of which provide data for use in lobbying and advocacy activities on behalf of the specialty.
The State of the Urology Workforce and Practice in the United States, the annual publication summariz-ing Census findings, has emerged as a primary source of information about urology. Addition-ally, de-identified public use Census datasets from each survey are available to researchers for a nominal fee. Researchers have used these data to conduct studies and generate publications on the urologic practice and workforce.
As one of the AUA’s primary data programs, the AUA Annual Census is now entering its sixth year of data collection. We encourage all urology community members to take part in and contribute to this important data effort each year. Please visit the AUA Census webpage at AUAnet.org/Census for more information and results.
Steven M. Schlossberg, MD, MBA
Chair, AUA Data Committee Chief Medical Information Officer John Muir Health
David F. Penson, MD, MPH
Chair, AUA Science and Quality CouncilThe Paul V. Hamilton, M.D. and Virginia E.
Howd Chair in Urologic OncologyProfessor of Urologic Surgery and MedicineVanderbilt University Medical Center

The AUA would like to thank all members of the urology community for their continued support of and participation in the AUA Annual Census.
2 The State of the Urology Workforce and Practice in the United States 2018

3
Table of ContentsPreface 1
Executive Summary 4ABOUT THE AMERICAN UROLOGICAL ASSOCIATION (AUA) . . . . . . . 8
ABOUT THE AUA ANNUAL CENSUS . . . . . . . . . . . . . . . . . 8
DEFINITION OF TERMS . . . . . 9
GLOSSARY . . . . . . . . . . . . . . . 9
METHODOLOGY . . . . . . . . . 10
LIST OF TABLES . . . . . . . . . . 12
LIST OF FIGURES . . . . . . . . . 15
Practicing Urologists in the United States 16SECTION 1:GEOGRAPHIC DISTRIBUTION . . . . . . . . . . . . . . 17
SECTION 2:DEMOGRAPHIC CHARACTERISTICS . . . . . . . . . 25
SECTION 3:EDUCATION, TRAINING, STATE LICENSING, CER-TIFICATION AND YEARS OF PRACTICE . . . . . . 28
SECTION 4:CHARACTERISTICS OF THEUROLOGY PRACTICE . . . . . . . . . . . . . . . . . . . . 33
SECTION 5:WORK HOURS, PATIENT ENCOUNTERS ANDOTHER PRACTICE CHARACTERISTICS . . . . . . . 43
SECTION 6:PRACTICE INTERNAL POLICIESAND SUPPORT . . . . . . . . . . . . . . . . . . . . . . . . . 52
SECTION 7:TOPICS RELATED TO GENDERAND FAMILY . . . . . . . . . . . . . . . . . . . . . . . . . . 57
SECTION 8:TELEMEDICINE . . . . . . . . . . . . . . . . . . . . . . . . . 64
SECTION 9:QUALITY IMPROVEMENT AND USE OFELECTRONIC HEALTH RECORD SYSTEMS . . . . . 67
SECTION 10:PRESCRIPTION OF OPIOIDS . . . . . . . . . . . . . . . 75
CONTRIBUTORS . . . . . . . . . . . . . . . . . . . . . . . . 78
REFERENCE . . . . . . . . . . . . . . . . . . . . . . . . . . . 80

Executive Summary

5
The AUA, with more than 22,000 members worldwide, is committed to providing the urologic community with the education, research, advocacy and data required to address the increasing number of challenges and opportunities presented to the profession as the demand for urologic care grows. Data relating to the urology workforce and practice patterns play an important role in generating knowledge to inform urologic care and workforce policy.
Data collection for the 2018 AUA Annual Census began in May 2018 at the AUA Annual Meeting in San Francis-co, CA, and continued online until the end of September 2018. A total of 5,870 urologists and other urologic care professionals, representing 114 countries and regions throughout the world, completed the 2018 AUA Annual Census. The results on U.S. practicing urologists were adjusted for non-responses and are reported in this annu-al publication.
The AUA Annual Census is a primary data source to explore the profession of urology from multiple angles through the collection of information from practicing urologists and other professionals worldwide. The data collected assist in filling knowledge gaps and meeting research needs while, ultimately, improving patient care.
Definition of the Urologist Population Practicing urologists are defined as those with valid medical licenses reported in the National Provider Identifier (NPI) file as either urologists or pediatric urol-ogists. Those who were reported as either surgeons or specialists in the NPI file and those who did not report a medical degree (MD or DO) were checked against the American Board of Urology (ABU) certification records maintained by the American Board of Medi-cal Specialties (ABMS) and the American Osteopathic Board of Surgery (AOBS) certification records listed on the American Osteopathic Association (AOA) website. Urologists in residency training were excluded from this report; however, their results will be published in a separate report.
The 2018 U.S. urologist population consists of a total of 12,660 practicing urologists, an increase of 1.1 percent from 12,517 practicing urologists in 2017.
Data Collection and Justification for Non-ResponseA total of 5,870 respondents completed the 2018 AUA Annual Census—3,622 of whom were from the United
States. Of these, 2,339 Census respondents were val-idated to be practicing urologists in the United States and formed the Census sample data for analysis. The population file and the Census survey sample file were linked using post-stratification factors (i.e., gender, loca-tion, certification status, years since initial certification) to adjust for the non-response bias in a Census survey by the assigned proper sample weight.
KEY FINDINGSIn 2018, 12,660 urologists were identified as “practicing urologists” in the United States. Of those, 84.5 percent were “actively” practicing (Table 1-1), which is higher than the 80 percent reported a year ago.
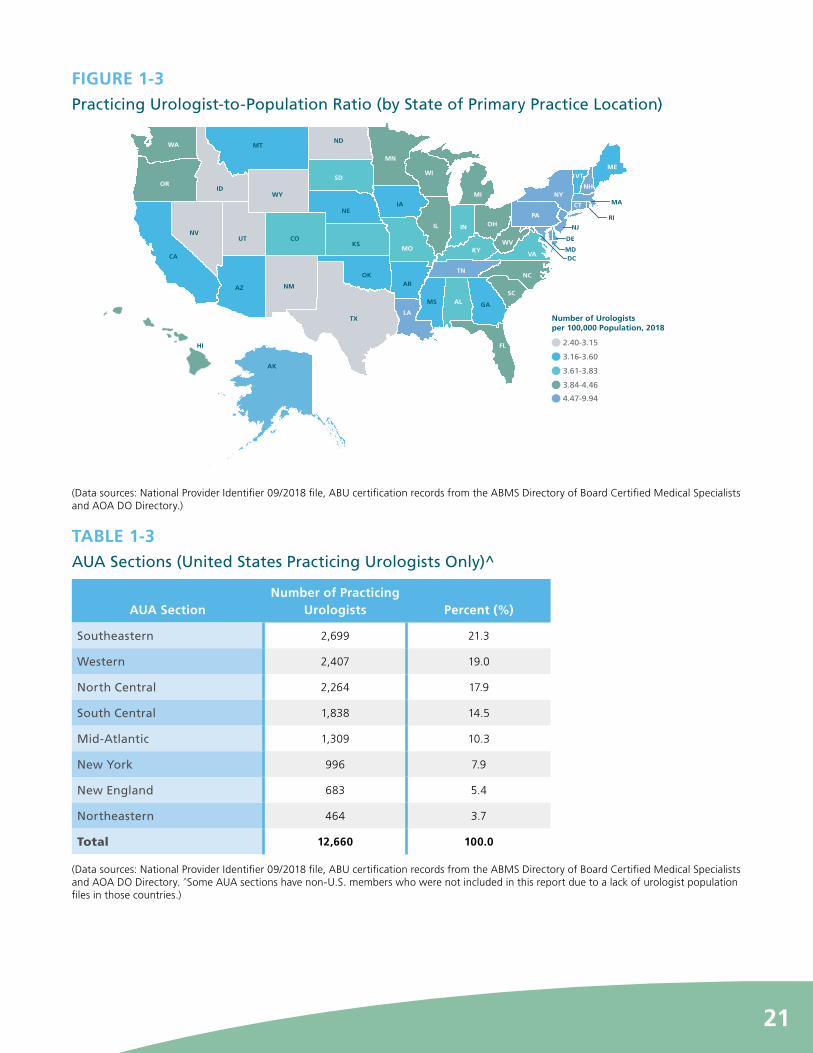
The national urologist-to-population ratio in-creased to 3.89 per 100,000 population in 2018, up from 3.85 in 2017 and 3.77 in 2016. Among the 50 U.S. states, New Hampshire has the highest urologist-to-population ratio, while Nevada has the lowest (Table 1-2).
• The AUA’s Southeastern Section has the greatest number of practicing urologists, accounting for 21.3 percent of the total practicing urologist population in the United States (Table 1-3).
• Practicing urologists maintain their primary practice locations in 37.4 percent of U.S. counties (Table 1-4), slightly down from 37.8 percent a year ago.
• The percentage of practicing urologists in the United States who maintain their primary practice locations outside of metropolitan areas remained stable, slightly higher than 10 percent (Table 1-5). The likelihood of practicing urologists maintaining their primary practice locations in non-metropolitan areas increases with the age of the urologist (Figure 1-6).
• The median age of practicing urologists in the United States is 56 years; one year older than what was reported a year ago (Table 2-1).
While the urologic workforce in the United States is predominantly male, the percentage of female urologists continued to rise to 9.2 in 2018, up from 8.8 in 2017 (Table 2-2).
84.5% ACTIVELY PRACTICING
12,660 UROLOGISTS

6 The State of the Urology Workforce and Practice in the United States 2018
• The urologic workforce in the United States is predominantly non-Hispanic white (Table 2-3 and Table 2-4). The percentage of practicing urologists with Hispanic origin was only 3.9 in 2018, while the Hispanic population accounted for 18.1 percent of the U.S. population.1
• If given the opportunity, nearly 91 percent of practicing urologists would not be interested in shortening residency training to only be allowed to perform lower risk procedures (Table 3-2).
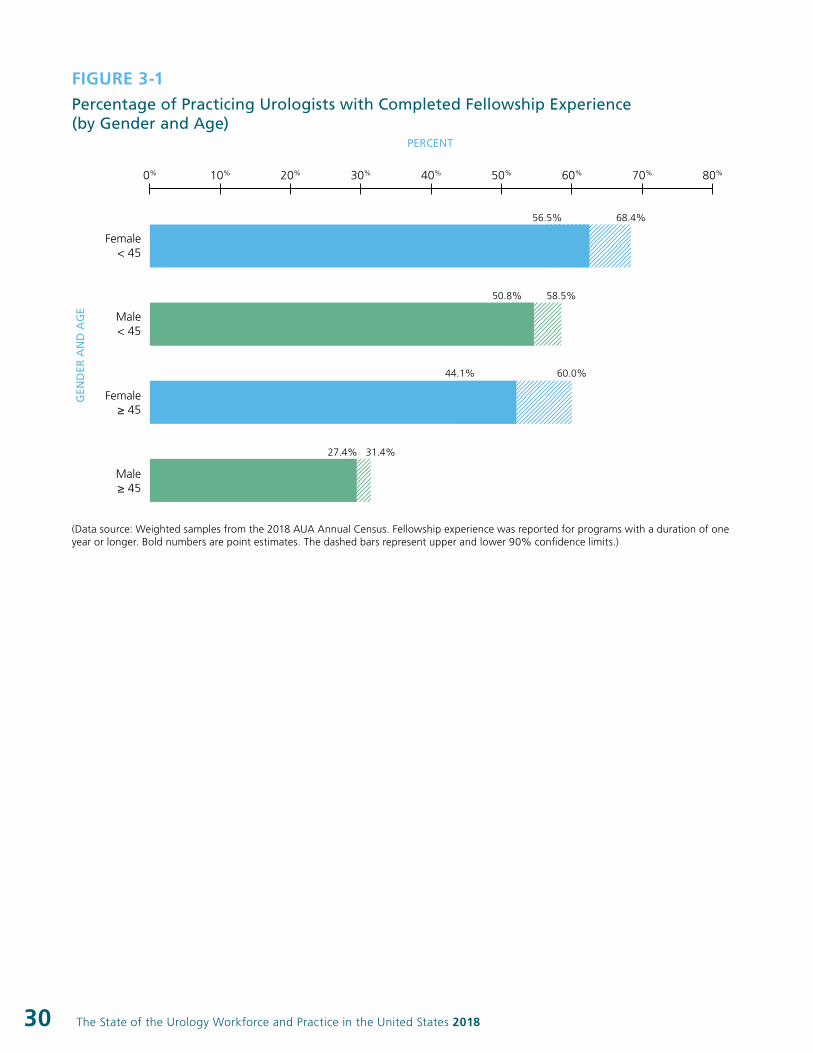
• Nearly 38 percent of urologists have completed at least one fellowship program during their career (Table 3-3). Younger urologists and female urologists are more likely to have completed fellowship training than their older and male counterparts (Figure 3-1).
• The top three areas for fellowship are oncology, robotic surgery, and endourology/stone disease among male practicing urologists and female pelvic medicine and reconstructive surgery, pediatrics, and oncology among female practicing urologists (Table 3-4).
• Approximately 85 percent of practicing urologists in the United States are certified by the ABU (Table 3-7).
The number of practicing urologists who directly work with physician assistants and nurse practitioners significantly increased from 62.7 percent in 2015 to 72.5 percent in 2018 (Table 4-2).
• The percentage of practicing urologists in private practices in the United States decreased to 56.9 in 2018 from 59.5 in 2017 (Table 4-4). Male urologists aged 45 years or older are most likely to work in private practices (Figure 4-1).
• Female practicing urologists are more likely to work in academic medical centers than their male counterparts (32.7 percent and 24.2 percent, respectively) (Table 4-5).
• Nearly 38 percent of practicing urologists in the United States have a primary subspecialty (Table 4-8); oncology is the most common subspecialty area (Table 4-9).
• Approximately 80 percent of practicing urologists in the United States reported performing at least one major inpatient surgical procedure in a typical month (Table 4-10). The percentage of practicing urologists who perform inpatient surgical procedures decreases with age (Table 4-11).
The median number of hours practicing urologists worked per week was 55. Nearly one-third of urologists work more than 60 hours a week (Table 5-1).
• The average number of work hours per week increased to 52.9 hours in 2018 from 51.6 hours in 2017 (Table 5-4).
• The median number of minutes a practicing urologist spends with a patient in a typical office visit is 15 (Table 5-5). On average, female urologists spend more minutes with patients than their male counterparts whereas practicing urologists in single urology groups spend the least amount of time with patients in a typical office visit (Table 5-6).
• Practicing urologists see 75 patients in a typical week (Table 5-7) and work a median 48 weeks per year (Table 5-10), suggesting an estimated 3,600 patients visits/encounters per urologist in 2018, which was higher than 3,360 patient visits/encounters per urologist in 2017.
The top reason urologists plan to retire before the age of 65 is a lack of time for personal and/or family life while they work (Table 5-12). The top reason urologists plan to retire after the age of 70 is they enjoy practicing (Table 5-13).
• Approximately 70 percent of practicing urologists reported their practices took steps to increase practice profitability in the previous year (Table 6-1). The top three steps taken were to see more patients, reduce spending in areas other than reducing staff or travel to meetings and decrease staff size (Table 6-2).
• Approximately 75 percent of practicing urologists received financial support from their practices to attend in-person meetings (Table 6-3).
• Approximately 78 percent and 63 percent of practicing urologists reported their practices made efforts to hire women and underrepresented minorities, respectively (Table 6-5 and Table 6-6).
• The majority of practicing urologists do not feel a gender bias exists within their practice (Table 7-1).
60+ hours

7
• Nearly 60 percent of urologists stated their practice has at least one female partner (Table 7-7).
• Approximately 55 percent of male urologists and 40 percent of female urologists were satisfied or very satisfied with their work-life balance (Table 7-12).
• Nearly 12 percent of practicing urologists in the United States participated in a telemedicine program in 2018 (Table 8-1), which is significantly higher than the 8.5 percent in 2016.
• The top motivation for implementing telemedicine capabilities is to provide care to patients from underserved areas (Table 8-3).
• A vast majority (83.3 percent) of urologists who currently participate in telemedicine expected their organizations’ telemedicine services to increase in three years (Table 8-5).
• Of practicing urologists, 85 percent reported their practices made steps to incorporate Quality Payment Program participation (via the Merit-based Incentive Payment System or an Alternative Payment Model) into their practice (Table 9-1). To do so, the majority of practices upgraded or purchased a new EHR system, or committed new resources (Table 9-2).
• The top three quality programs in which urologists participated in the past 12 months included standardization of clinical care through protocols or guidelines, participation in morbidity and mortality conferences and collection of quality metrics for internal review (Table 9-3).
• Approximately 95 percent of practicing urologists used an EHR system in their practices in 2018 (Table 9-7), an increase from 91.9 percent in 2014. Lower utilization was found in male urologists 45 years of age or older (Figure 9-1) and urologists in solo practices (Figure 9-2).
• Approximately 90 percent of practicing urologists prescribed opioids for their patients undergoing surgical procedures (Table 10-1).
• Nearly 15 percent of practicing urologists prescribe opioids based on procedure-specific guidance developed by their practice or institution (Table 10-2).
• Nearly three-fourths of urologists decreased their number of opioid prescriptions compared to three years ago for patients undergoing surgical procedures (Table 10-4).
CONCLUSION
The AUA Annual Census provides the urology com-munity with a reliable and sustainable mechanism to describe practicing urologists in the United States, to un-derstand their medical training and scope of practice and to identify cross-sectional and longitudinal variations across the specialty. This mechanism not only generates a unique data source to explore the profession of urolo-gy, but can be adapted to all medical specialties as well. The results are being used to inform health care policy and to prepare for the future urologic care workforce.
The AUA strongly encourages all members to complete the Census each year either during the AUA Annual Meeting or online anytime between May and September at AUAnet.org/TakeCensus.

8 The State of the Urology Workforce and Practice in the United States 2018
About the American Urological Association (AUA) THE ORGANIZATION Founded in 1902 and headquartered near Baltimore, Maryland, the AUA serves more than 22,000 members throughout the world as a leading advocate for the specialty of urology. The AUA is a premier urologic association, providing invaluable support to the urologic community by fostering the highest standards of urolog-ic care through education, research, and the formulation of health policy.
AUA MISSION The AUA mission is to promote the highest standards of urological clinical care through education, research, and the formulation of health care policy.
AUA VISION The AUA vision is to be the premier professional association for the advancement of professional urologic patient care.
For more information about the AUA, please visit AUAnet.org.
About the AUA Annual CensusThe AUA supports the generation and dissemination of urologic knowledge through a sophisticated statistical approach. The AUA’s Annual Census is a systematical-ly designed, specialty-representative survey of urology (similar to the U.S. Census). The results of the AUA’s Annual Census are weighted to adjust for non-response bias to accurately represent the entire specialty and address the broad landscape of urology.
This publication serves as a primary source of infor-mation for the urology workforce in its effort to effec-tively convey the needs and demands of the urologic community. The findings also depict current clinical practice including the use of EHRs, mechanisms to report quality measures and medications, along with procedures to treat urologic conditions. The results from this publication provide an array of information that can bridge knowledge gaps, provide data to meet increasing research needs and, ultimately, improve patient care. Be-sides publications on practicing urologists in the United States, publications on practicing urologists and urology residents across the globe are also available.

9
Definition of TermsPRACTICE STATUSIn order to understand the manner in which this report classifies urologists, a Definition of Terms is provided:
UROLOGISTS: Physicians and surgeons who are spe-cially trained for the diagnosis and treatment of genito-urinary and adrenal gland diseases in patients of any age and of either sex
PRACTICING UROLOGISTS: Urologists who maintain current medical licensures and treat patients with uro-logic conditions
PRACTICING UROLOGISTS IN THE UNITED STATES: Practicing urologists with primary practice locations in at least one of the 50 U.S. states or the District of Columbia
ACTIVE PRACTICING UROLOGISTS: Practicing urol-ogists who treat patients with urologic conditions and who work at least 25 clinical hours per week
CERTIFIED UROLOGISTS: Urologists who are certified either by the ABU or the AOBS
LEVEL OF RURALITYThe ZIP code of each practicing urologist’s primary practice location was converted to a rural-urban commut-ing area (RUCA) code based on RUCA3.102 (developed collaboratively by the Health Resources and Service Administration’s Office of Rural Health Policy [ORHP], the United States Department of Agriculture’s Economic Research Service [ERS], the WWAMI Rural Health Research Center [RHRC] based on 2010 United States Census work-commuting data and 2012 United States Census Bureau revised urban area definition based on 2010 Census data and 2013 ZIP codes).
RUCA3.10 codes were grouped into four levels of rurality. An area with population size ≥ 50,000 was defined as a Metropolitan Area. An area with population size < 50,000 was defined as a Non-Metropolitan Area. The Non-Met-ropolitan Area was further classified: Micropolitan Area (population = 10,000-49,999), Small Town (population = 2,500-9,999), and Rural Area (population < 2,500).
Glossary90% CI 90 Percent Confidence Interval
90% MOE Margin of Error at 90 Percent Confidence Level
ABMS American Board of Medical Specialties
ABU American Board of Urology
AOA American Osteopathic Association
AOBS American Osteopathic Board of Surgery
AUA American Urological Association
CME Continuing Medical Education
DO Doctor of Osteopathic Medicine
EHR Electronic Health Record
HMO Health Maintenance Organization
MD Medical Doctor
NPI National Provider Identifier
PPO Preferred Provider Organization
RUCA Rural-Urban Commuting Area
VA Veteran Affairs

10 The State of the Urology Workforce and Practice in the United States 2018
MethodologyData in the AUA Annual Census were collected and analyzed using survey methodology developed by Groves et al.3 Two data files were established. One file was a population file containing basic demographic, geographic and certification information for all prac-ticing urologists in the United States in 2018. Another file was a sample data file containing a broad range of information collected from the Census. The popula-tion file and the Census survey sample file were linked through post-stratification factors to adjust for non-re-sponses and the contribution of each respondent in a Census survey by assigned sample weight.
PRACTICING UROLOGISTS POPULATIONPracticing urologists were identified jointly from the NPI file (which includes all physicians in the United States who hold valid medical licenses), ABU certification re-cords maintained by the ABMS and AOBS certification records from the AOA website if the following criteria were met:
• Either urology or pediatric urology was listed as the medical specialty.
• A provider was listed as either a surgeon or a specialist and matched to either the 2018 ABU certification records as a urologist or the AOBS certification records as a urological surgeon. Manual checks of all individual urologists’ and urologic surgeons’ websites were performed to confirm that these physicians provided urologic care in 2018.
• Urologists in residency training were excluded from this report; however, these results will be published in a separate report.
• Additionally, urologists who were identified as certified by the ABU and/or AOBS but not listed in the NPI file were excluded in order to ensure inclusion of only currently practicing urologists.
ORGANIZATION OF QUESTIONSThe Census consists of “base” and “supplemental” questions. Base questions that target the entire urology specialty will be asked annually in order to identify cross-sectional and longitudinal patterns. Examples of base question topics include practice status, clinical practice setting, primary and secondary subspecialties, patient encounters and employment status. Supplemental questions will vary each year and focus on emerging issues; these questions may be distributed to all partici-pants or to a random subset of participants.
CENSUS TIMELINEThe AUA Annual Census officially launches during the AUA Annual Meeting and is available online to respon-dents through September of that same year. Census data are analyzed and reported in the annual publication The State of the Urology Workforce and Practice in the United States, which is available in the spring of the following year.
CENSUS DATA COLLECTIONData collection for the 2018 AUA Annual Census began on May 18, 2018 during the 2018 AUA Annu-al Meeting and ended on September 30, 2018. Each respondent was assigned an identification number prior to the submission of responses to the Census questions. This step ensured the results could be linked to the population file and no respondent could take the survey more than once.
A total of 5,870 respondents completed the 2018 AUA Annual Census—2,339 of whom were practicing urol-ogists in the United States. Those who self-reported as practicing urologists were checked against the practicing urologist population file and removed if there were no matches found. Those urologists who were either prac-ticing outside the United States or in residency training were removed from this study, but their responses were analyzed and reported separately with final analysis available on the AUA website.4

11
SAMPLE WEIGHTINGIn order to adjust for non-responses and resulting biases in the 2018 AUA Census sample, a standard post-strat-ification weighting technique5 was used to identify post-stratification factors. Identified factors include gen-der, geographic location, certification status and years since initial certification. These factors were used to develop stratification cells for calculating sample weights.
CENSUS REPORTING WITH STATISTICAL CONFIDENCEResults were based on either weighted Census samples or the practicing urologist population data described earlier in this report. Reported statistics based on the population data were preferred given the lack of sam-pling bias. In contrast, when reported findings were based on weighted Census samples, error estimates were reported in the form of either margin of error (MOE) or confidence interval (CI), with estimation of measure-ment precision at a 90 percent level of confidence.
DATA ANALYSISAfter post-stratification weighting adjustment, the Census data were analyzed with IBM-SPSS Complex Samples 22.0.
MARGIN OF ERROR (MOE)Estimates of characteristics of the practicing urologists from the AUA Census sample data can differ from those that would be obtained if all practicing urologists were surveyed. MOE values at the 90 percent confidence level were used to measure and report the precision of each es-timate. The MOE is the difference between an estimate and its upper or lower confidence bounds.6 The AUA reports both estimates and their associated MOE values in alignment with the U.S. Census Bureau in reporting the U.S. Census/American Community Survey.
CONFIDENCE INTERVALS (CI)Estimates based on the AUA Census samples can differ from those that would be obtained if all practicing urol-ogists were surveyed. A 90 percent confidence interval (90% CI) was used to mark the upper or lower confi-dence bounds of the estimated parameter by Census samples with 90 percent statistical confidence.
LIMITATIONSThe results of the AUA Annual Census are subject to the following limitations:
• As a population-based and weighted survey, the analysis of the AUA Annual Census data relied on the absolute number of responses to report statistics for small geographic, demographic and clinical categories. Racial/ethnic minority groups were not well represented in the urologist population and, therefore, were difficult to analyze.
• AOBS certification of osteopathic doctors was obtained via the AOA’s online urologic surgeon list without direct verification by the AOBS. Information contained in the AOA’s “DO Directory” (public list) is not the primary source for verification of physician credentials.
• The AUA Annual Census is subject to sampling and estimate errors. Thus, the MOE is the appropriate tool when comparing two groups. Sums from numbers and percentages may contrast with calculated totals due to intrinsic rounding errors.
• The practicing urologist population in the United States was based on the assumption that urologists who maintain their medical licenses in the Census year are considered practicing urologists.
• Geographic classifications, such as levels of rurality and state, were determined based on the primary office location in the NPI file. The actual geographic coverage of practice for each practicing urologist may be beyond the area reported.
• Census data are self-reported, non-validated and subject to bias or misrepresentation.

12 The State of the Urology Workforce and Practice in the United States 2018
List of TablesTABLE 1-1: Practice Status
TABLE 1-2: Urologist-to-Population Ratio by State of Primary Practice Location (Ranked from Highest to Lowest)
TABLE 1-3: AUA Sections (United States Practicing Urologists Only)
TABLE 1-4: County of Primary Practice Location
TABLE 1-5: Level of Rurality of Primary Practice Location
TABLE 2-1: Age
TABLE 2-2: Gender
TABLE 2-3: Ethnicity
TABLE 2-4: Race
TABLE 2-5: Country of Origin
TABLE 3-1: Age at Completion of Residency
TABLE 3-2: If You Had Been Able to Shorten Your Residency Training by One to Two Years, Allowing You to Only Perform the Lower Risk Procedures, Would You Have Pursued Such a Residency Program Track?
TABLE 3-3: Completion of Fellowship Experience
TABLE 3-4: Fellowship Area
TABLE 3-5: Age at Completion of Most Recent Fellowship
TABLE 3-6: Number of State Medical Licenses
TABLE 3-7: Certification Status
TABLE 3-8: Total Number of Years of Practicing Urology Since Completion of Residency
TABLE 4-1: Number of Urologists per Practice
TABLE 4-2: Number of Practicing Urologists Who Work Directly with Physician Assistants (PAs) and Nurse Practitioners (NPs) in Their Primary Practices
TABLE 4-3: Does Your Practice Allow PAs or NPs to Perform the Following Procedures?
TABLE 4-4: Practice Setting
TABLE 4-5: Practice Setting (by Gender)
TABLE 4-6: Number of Practicing Urologists per Practice (by Practice Setting)
TABLE 4-7: Number of Office Locations per Practice
TABLE 4-8: Primary Subspecialty
TABLE 4-9: Any Subspecialty (by Gender)
TABLE 4-10: Number of Major Inpatient Operative Procedures Performed in a Typical Month
TABLE 4-11: Performing Major Inpatient Operative Procedures (by Age)
TABLE 4-12: Do You Currently Provide Care for Transgender Patients?
TABLE 4-13: Other Professional Roles
TABLE 4-14: Employment Status
TABLE 4-15: On Average, What Percentage of Patient Cases You See Could Have Been Handled by Primary Care Physicians?
TABLE 5-1: Total Number of Hours Worked in a Typical Week
TABLE 5-2: Number of Clinical Hours Directly Related to Patient Care in a Typical Week
TABLE 5-3: Number of Non-Clinical (e.g., Administration, Teaching, Research) Hours in a Typical Week
TABLE 5-4: Mean Number of Clinical, Non-Clinical and Total Work Hours in a Typical Week (by Gender)
TABLE 5-5: Number of Minutes Spent with a Patient in a Typical Office Visit
TABLE 5-6: Mean Number of Minutes Spent with a Patient in a Typical Office Visit (by Gender and Practice Setting)
TABLE 5-7: Number of Patient Visits/Encounters in a Typical Week

TABLE 5-8: Mean Number of Patient Visits/Encounters in a Typical Week (by Gender and Practice Setting)
TABLE 5-9: Percentage of Patient Visits/Encounters Made by Female Patients (by Gender)
TABLE 5-10: Number of Weeks Taken for Vacation Leave in the Previous Year (by Gender)
TABLE 5-11: Age at Planned Full Retirement from Practice (by Gender)
TABLE 5-12: Among Those Who Plan to Retire Before the Age of 65, What Factors May Lead to Early Retirement?
TABLE 5-13: Among Those Who Plan to Retire at the Age of 70 or Later, What Factors May Delay Your Retirement?
TABLE 6-1: Has Your Practice Taken Steps to Increase Practice Profitability?
TABLE 6-2: For Those Who Were Aware That Their Practices Took Steps to Increase Profitability, What Steps Were Taken?
TABLE 6-3: Does Your Practice Provide Enough Financial Support for You to Do the Following?
TABLE 6-4: I Have Adequate Time to Complete the Following Educational Activities to Keep up with Changes in the Field of Urology (by Practice Size).
TABLE 6-5: Is Your Practice Making Efforts to Hire Women?
TABLE 6-6: Is Your Practice Making Efforts to Hire Underrepresented Minorities?
TABLE 7-1: Do You Feel That There Is a Gender Bias in Your Practice (by Gender)?
TABLE 7-2: For Those Who Felt There Was a Gender Bias, Are You Limited to Seeing Certain Patients/Diagnoses Due to Your Gender (by Gender)?
TABLE 7-3: For Those Who Felt They Were Limited to Seeing Patients Due to Gender, Was It Driven by Any of the Following?
TABLE 7-4: Does Seeing Certain Patients/Diagnoses in Your Group Due to Your Gender Contribute to Feelings of Dissatisfaction?
TABLE 7-5: Have You Been Personally Exposed to Sexual Harassment in the Workplace (by Gender)?
TABLE 7-6: Locations Where Practicing Urologists Were Exposed to Sexual Harassment (by Gender)
TABLE 7-7: Are There Any Female Partners in Your Practice (by Gender)?
TABLE 7-8: Do You Have a Domestic Partner (by Gender)?
TABLE 7-9: Who Is Primarily Responsible for Day-to-Day Family Responsibilities (e.g., Caring for Sick Children) (by Gender)?
TABLE 7-10: Does Your Practice Offer Paid Maternity Leave?
TABLE 7-11: Does Your Practice Offer Paid Paternity Leave?
TABLE 7-12: How Satisfied Do You Feel with Your Work-Life Balance (by Gender)?
TABLE 8-1: Telemedicine Program Participation (by Practice Setting)
TABLE 8-2: What Percentage of Your Encounters Are Considered Telemedicine?
TABLE 8-3: What Is Your Organization’s Primary Motivation for Implementing Telemedicine Capabilities?
TABLE 8-4: What Are the Significant Concerns Regarding Reimbursement for Telemedicine Services?
TABLE 8-5: How Do You Anticipate Your Organization Will Utilize Telemedicine Services Three Years from Now?
TABLE 9-1: Is Your Practice Taking Steps to Incorporate the MIPS or an APM?
TABLE 9-2: What Changes Have You Made to Your Practice to Incorporate the MIPS or an APM?
13
14 The State of the Urology Workforce and Practice in the United States 2018
TABLE 9-3: What Quality Programs Have You/Your Practice Participated in Over the Last 12 Months?
TABLE 9-4: What Patient Safety Initiatives Have You/Your Practice Participated in Over the Last 12 Months?
TABLE 9-5: Which of the Following Quality and Patient Safety Domains Are Present Within Your Practice Group?
TABLE 9-6: Number of Hours Devoted to Learning about the Science of Patient Safety or Quality Improvement Methodology Over the Past 12 Months
TABLE 9-7: Do You Use an Electronic Health Record (EHR) System in Your Practice?
TABLE 9-8: Use of A Medical Scribe in Your Practice for EHR Documentation
TABLE 9-9: Reasons for Using a Medical Scribe for EHR Documentation
TABLE 9-10: Does Using an EHR Increase the Quality and Accuracy of Your Work?
TABLE 9-11: Using an EHR Has Enhanced My Productivity
TABLE 9-12: If the AUA Could Produce Templates for Specific Visit Types for Your EHR (e.g., Localized Prostate Cancer, Overactive Bladder [OAB]), Would You Use Them in Your Practice?
TABLE 10-1: Do You Prescribe Opioids for Patients Undergoing Surgical Procedures?
TABLE 10-2: I Choose the Number of Opioid Pills at Discharge Due to the Following Reasons
TABLE 10-3: How Many Opioid Pills, on Average, Do You Prescribe (by Procedure)?
TABLE 10-4: Compared to Three Years Ago, How Has the Number of Opioid Prescriptions You Prescribe for Patients Undergoing Surgical Procedures Changed?
14 The State of the Urology Workforce and Practice in the United States 2018
15
List of FiguresFIGURE 1-1: Number of Practicing Urologists and Urologist-to-Population Ratios (per 100,000 Population) from 2015 to 2018
FIGURE 1-2: Number of Practicing Urologists (by State of Primary Practice Location)
FIGURE 1-3: Practicing Urologist-to-Population Ratio (by State of Primary Practice Location)
FIGURE 1-4: Practicing Urologists (by AUA Section) (United States Practicing Urologists Only)
FIGURE 1-5: Number of Practicing Urologists (by County) (Based on Primary Practice Location)
FIGURE 1-6: Percentage of Practicing Urologists Whose Primary Practice Locations are Outside Metropolitan Areas (by Age)
FIGURE 2-1: Percentage of Female Practicing Urologists (by Age)
FIGURE 3-1: Percentage of Practicing Urologists with Completed Fellowship Experience (by Gender and Age)
FIGURE 4-1: Percentage of Practicing Urologists in Private Practices (by Gender and Age)
FIGURE 4-2: Percentage of Practicing Urologists Who Reported Performing Major Inpatient Operative Procedures (by Gender and Age)
FIGURE 4-3: Percentage of Practicing Urologists Employed by Others (by Gender and Age)
FIGURE 5-1: Mean Number of Work Hours per Week (by Age)
FIGURE 5-2: Percentage of Practicing Urologists with More Than 100 Patient Visits/Encounters in a Typical Week (by Gender and Age)
FIGURE 9-1: Do You Use an EHR System in Your Practice (by Gender and Age)?
FIGURE 9-2: Do You Use an EHR System in Your Practice (by Practice Setting)?

Practicing Urologistsin the United States

17
Section 1: Geographic DistributionPrimary Observations• In 2018, 12,660 urologists were identified as
“practicing urologists” in the United States. Of those, 84.5 percent were “actively” practicing (Table 1-1), which is higher than the 80 percent reported a year ago. The national urologist-to-population ratio increased to 3.89 per 100,000 population in 2018, up from 3.85 in 2017 and 3.77 in 2016. Among the 50 U.S. states, New Hampshire has the highest urologist-to-population ratio, while Nevada has the lowest (Table 1-2).
• The AUA’s Southeastern Section has the greatest number of practicing urologists, accounting for 21.3 percent of the total practicing urologist population in the United States (Table 1-3).
• Practicing urologists maintain their primary practice locations in 37.4 percent of U.S. counties (Table 1-4), slightly down from 37.8 percent a year ago.
• The percentage of practicing urologists in the United States who maintain their primary practice locations outside of metropolitan areas remained stable, slightly higher than 10 percent (Table 1-5). The likelihood of practicing urologists maintaining their primary practice locations in non-metropolitan areas increases with the age of the urologist (Figure 1-6).
TABLE 1-1Practice Status
Type of UrologistPracticing Urologists Represented
Number Percent (%) +/- MOE (%)
Practicing Urologists 12,660 100.0 N/A
Active Practicing Urologists^ 10,693 84.5 1.5
(Data sources: National Provider Identifier 09/2018 file, ABU certification records from the ABMS Directory of Board Certified Medical Specialists and AOA DO Directory. ^Active practicing urologists are defined as those who work 25 or more clinical hours per week.)

18 The State of the Urology Workforce and Practice in the United States 2018
TABLE 1-2Urologist-to-Population Ratio by State of Primary Practice Location (Ranked from Highest to Lowest)
StateNumber of Practicing
Urologists*Urologist-to-Population
Ratio^Relative Position
U.S. (50 States & DC^^) 12,660 3.89 National Average
New Hampshire 70 5.21
High
New York 992 5.00
Massachusetts 337 4.91
Louisiana 219 4.68
Pennsylvania 598 4.67
Connecticut 164 4.57
New Jersey 410 4.55
Maryland 273 4.51
Tennessee 300 4.47
Hawaii 63 4.41
West Virginia 80 4.41
Ohio 496 4.25
Medium High
Florida 882 4.20
Oregon 172 4.15
Rhode Island 44 4.15
North Carolina 422 4.11
Wisconsin 236 4.07
Michigan 401 4.03
Illinois 508 3.97
Washington 293 3.96
Minnesota 218 3.91
Medium
South Carolina 195 3.88
South Dakota 33 3.79
Kentucky 167 3.75
Virginia 315 3.72
Alabama 181 3.71
Indiana 247 3.70
Colorado 205 3.66
Missouri 223 3.65
Kansas 106 3.64

19
StateNumber of Practicing
Urologists*Urologist-to-Population
Ratio^Relative Position
Maine 47 3.52
Medium Low
Arizona 246 3.51
Nebraska 67 3.49
California 1,359 3.44
Montana 36 3.43
Oklahoma 134 3.41
Vermont 21 3.37
Iowa 105 3.34
Delaware 32 3.33
Mississippi 96 3.22
Georgia 333 3.19
Low
Arkansas 95 3.16
Alaska 23 3.11
New Mexico 63 3.02
Texas 849 3.00
Utah 83 2.68
North Dakota 20 2.65
Idaho 45 2.62
Wyoming 15 2.59
Nevada 72 2.40
(Data sources: National Provider Identifier 09/2018 file, ABU certification records from the ABMS Directory of Board Certified Medical Specialists and AOA DO Directory. *In reporting results from the 2018 AUA Annual Census, states with fewer than 50 reported urologists were manually checked against the urologists’ websites. ^Urologist-to-population ratio is per 100,000 population. ^^ District of Columbia was not listed sepa-rately due to its incomparability with the other 50 U.S. states.)
TABLE 1-2Urologist-to-Population Ratio by State of Primary Practice Location (Ranked from Highest to Lowest) (Continued)

20 The State of the Urology Workforce and Practice in the United States 2018
FIGURE 1-1Number of Practicing Urologists and Urologist-to-Population Ratios (per 100,000 Population) from 2015 to 2018
Blue: Number of Practicing Urologists; Green: Urologist-to-population ratios (per 100,000 population)
(Data sources: National Provider Identifier 09/2018 file, ABU certification records from the ABMS Directory of Board Certified Specialists Medical, AOA DO Directory and U.S. Census Bureau U.S. population files.)
FIGURE 1-2Number of Practicing Urologists (by State of Primary Practice Location)
(Data sources: National Provider Identifier 09/2018 file, ABU certification records from the ABMS Directory of Board Certified Medical Specialists and AOA DO Directory.)
11,500
11,700
11,900
12,100
12,300
12,500
12,700
2018201720162015
3.55
3.60
3.65
3.70
3.75
3.80
3.85
3.90
3.95
4.00
NU
MB
ER O
F PR
AC
TIC
ING
UR
OLO
GIS
TS UR
OLO
GIST-TO
-POPU
LATIO
N R
ATIO
11,990
3.72
12,186
3.77
12,517
3.85
12,660
3.89
WA
ORID
NVUT
NM
NEIA
KY
WVMD
DE
NJ
VT
NH
ME
CT
RI
MA
DC
KS
OKAR
MS ALSC
MT
WY
ND
SD
CA
AZ
CO
MO
TNNC
VA
GA
FL
MN
WI
IL IN
MI
OHPA
NY
TXLA
AK
HI
Number of Urologists by State, 2018
15-43
44-92
93-182
183-269
270-413
414-1359
21
FIGURE 1-3Practicing Urologist-to-Population Ratio (by State of Primary Practice Location)
(Data sources: National Provider Identifier 09/2018 file, ABU certification records from the ABMS Directory of Board Certified Medical Specialists and AOA DO Directory.)
TABLE 1-3AUA Sections (United States Practicing Urologists Only)^
AUA SectionNumber of Practicing
Urologists Percent (%)
Southeastern 2,699 21.3
Western 2,407 19.0
North Central 2,264 17.9
South Central 1,838 14.5
Mid-Atlantic 1,309 10.3
New York 996 7.9
New England 683 5.4
Northeastern 464 3.7
Total 12,660 100.0
(Data sources: National Provider Identifier 09/2018 file, ABU certification records from the ABMS Directory of Board Certified Medical Specialists and AOA DO Directory. ^Some AUA sections have non-U.S. members who were not included in this report due to a lack of urologist population files in those countries.)
Number of Urologists per 100,000 Population, 2018
2.40-3.15
3.16-3.60
3.61-3.83
3.84-4.46
4.47-9.94
WA
ORID
NVUT
NM
NEIA
KYWV
MD
DE
NJ
VT
NH
ME
CT
RI
MA
DC
KS
OKAR
MS ALSC
MT
WY
ND
SD
CA
AZ
CO
MO
TNNC
VA
GA
FL
MN
WI
IL IN
MI
OHPA
NY
TXLA
AK
HI

22 The State of the Urology Workforce and Practice in the United States 2018
FIGURE 1-4Practicing Urologists by AUA Section (United States Practicing Urologists Only)^
(Data sources: National Provider Identifier 09/2018 file, ABU certification records from the ABMS Directory of Board Certified Medical Specialists and AOA DO Directory. ^Some AUA sections have non-U.S. members who were not included in this report due to a lack of urologist population files in those countries.)
TABLE 1-4County of Primary Practice Location
Urologist Supply Number of Counties Percent (%)
Counties with 0 Urologists 1,968^ 62.6
Counties with at least 1 Urologist 1,176 37.4
Counties with 1 Urologist 291 9.3
Counties with 2-3 Urologists 302 9.6
Counties with 4-8 Urologists 273 8.7
Counties with 9 or more Urologists 310 9.9
Total 3,144 100.0
(Data source: National Provider Identifier 09/2018 file. ^Based on the U.S. Census 2013 population estimates, these 1,968 counties represent a population of 47,300,238 residents.)
NEW YORK
NEW ENGLAND
WESTERN
WESTERN
SOUTHEASTERN
SOUTH CENTRAL
NORTH CENTRAL
Total Urologists by AUA Section, 2018
MID-ATLANTIC 1,309
NEW ENGLAND 683
NEW YORK 996
NORTH CENTRAL 2,264
NORTHEASTERN 464
SOUTH CENTRAL 1,838
SOUTHEASTERN 2,699
WESTERN 2,407
NORTHEASTERN
MID-ATLANTIC

23
FIGURE 1-5Number of Practicing Urologists (by County) (Based on Primary Practice Location)
(Data source: National Provider Identifier 09/2018 file.)
TABLE 1-5Level of Rurality of Primary Practice Location
Rurality LevelNumber of Practicing
Urologists Percent (%)
Metropolitan 11,323 89.4
Non-Metropolitan 1,337 10.6
Micropolitan 1,067 8.4
Small Town 214 1.7
Rural 56 0.4
Total 12,660 100.0
(Data source: National Provider Identifier 09/2018 file, Rural Urban Commuting Area Codes Data from RUCA3.10)

24 The State of the Urology Workforce and Practice in the United States 2018
FIGURE 1-6Percentage of Practicing Urologists Whose Primary Practice Locations Are Outside Metropolitan Areas (by Age)
0% 5% 10% 15% 20%
≥ 65
55 - 64
45 - 54
< 45
AG
E
PERCENT
7.5%
9.4%
14.6%
10.5%
5.8% 9.2%
7.3% 11.6%
12.2% 17.0%
8.0% 13.1%
(Data sources: National Provider Identifier 09/2018 file and weighted samples from the 2018 AUA Annual Census and Rural Urban Commuting Area Codes Data from RUCA3.10. Bold numbers are point estimates. The dashed bars represent upper and lower 90% confidence limits.)

25
Section 2: Demographic Characteristics Primary Observations• The median age of practicing urologists in the United
States is 56 years, up from 55 in 2017 (Table 2-1).
• While the urologic workforce in the United States is predominantly male, the percentage of female urologists continued to rise to 9.2 in 2018, up from 8.8 in 2017 (Table 2-2).
• The urologic workforce in the United States is predominantly non-Hispanic white (Table 2-3 and Table 2-4). The percentage of practicing urologists with Hispanic origin is only 3.9 in 2018, while the Hispanic population accounts for 18.1 percent of the U.S. population.7
TABLE 2-1Age
Age Group (Year)
Practicing Urologists
Number Percent (%) +/- MOE (%)
≤ 34 541 4.3 0.7
35-44 2,840 22.4 1.0
45-54 2,633 20.8 0.9
55-64 2,875 22.7 1.0
≥ 65 3,771 29.8 0.8
Total 12,660 100.0
(Data source: Weighted samples from the 2018 AUA Annual Census. The median age is 56.)
TABLE 2-2Gender
GenderNumber of Practicing
Urologists Percent (%)
Male 11,493 90.8
Female 1,167 9.2
Total 12,660 100.0
(Data source: National Provider Identifier 09/2018 file.)

26 The State of the Urology Workforce and Practice in the United States 2018
FIGURE 2-1Percentage of Female Practicing Urologists (by Age)
0% 5% 10% 15% 20% 25%
≥ 65
55 - 64
45 - 54
< 45
AG
E
PERCENT
21.6%
20.5%
9.4%
5.1%
1.1%
22.7%
8.2% 10.7%
4.2% 5.9%
0.7% 1.6%
(Data sources: National Provider Identifier 09/2018 file and weighted samples from the 2018 AUA Annual Census. Bold numbers are point esti-mates. The dashed bars represent upper and lower 90% confidence limits.)
TABLE 2-3Ethnicity
EthnicityPracticing Urologists Represented
Number Percent (%) +/- MOE (%)
Hispanic 484 3.9 0.7
Non-Hispanic 11,870 96.1 0.7
Total Reported 12,354 100.0
I Prefer Not to Report 306
Total 12,660
(Data source: Weighted samples from the 2018 AUA Annual Census.)

27
TABLE 2-4Race
RacePracticing Urologists Represented
Number Percent (%) +/- MOE (%)
White 10,082 84.1 1.3
Asian 1,469 12.2 1.2
African American/Black 262 2.2 0.6
Other Races (Including Multiple Races)
180 1.5 0.5
Total Reported 11,992 100.0
I Prefer Not to Report 668
Total 12,660
(Data source: Weighted samples from the 2018 AUA Annual Census.)
TABLE 2-5Country of Origin
Country of OriginPracticing Urologists Represented
Number Percent (%) +/- MOE (%)
North and South America 10,913 86.2 1.3
United States 10,425 82.3 1.4
Canada 185 1.5 0.4
Others 303 2.4 0.6
Asia 1,262 10.0 1.1
India 459 3.6 0.7
Others 803 6.3 0.9
Europe 326 2.6 0.6
Africa 159 1.3 0.4
Total 12,660 100.0
(Data source: Weighted samples from the 2018 AUA Annual Census.)

28 The State of the Urology Workforce and Practice in the United States 2018
Section 3: Education, Training, State Licensing, Certification and Years of PracticePrimary Observations• If given the opportunity, nearly 91 percent of
practicing urologists would not be interested in shortening residency training to only be allowed to perform lower risk procedures (Table 3-2).
• Nearly 38 percent of urologists have completed at least one fellowship program during their career (Table 3-3). Younger urologists and female urologists are more likely to have completed fellowship training than their older and male counterparts (Figure 3-1).
• The top three areas for fellowship are oncology, robotic surgery, and endourology/stone disease among male practicing urologists and female pelvic medicine and reconstructive surgery, pediatrics, and oncology among female practicing urologists (Table 3-4).
• Approximately 85 percent of practicing urologists in the United States are certified by the ABU (Table 3-7).
TABLE 3-1Age at Completion of Residency
Age at Completion of Residency
Practicing Urologists Represented
Number Percent (%) +/- MOE (%)
≤ 30 1,111 8.8 1.2
31 2,281 18.0 1.5
32 3,320 26.2 1.6
33 2,540 20.1 1.5
34 1,226 9.7 1.1
35 799 6.3 0.9
≥ 36 1,383 10.9 1.1
Total 12,660 100.0
(Data source: Weighted samples from the 2018 AUA Annual Census. The median age at completion of residency is 32.)

29
TABLE 3-2If You Had Been Able to Shorten Your Residency Training by One to Two Years, Allowing You to Only Perform Lower Risk Procedures, Would You Have Pursued Such a Residency Program Track?
Shorten Residency Training
Practicing Urologists Represented
Number Percent (%) +/- MOE (%)
Yes 1,036 9.1 1.7
No 10,330 90.9 1.7
Total Reported 11,367 100.0
Not Reported 1,293
Total 12,660
(Data source: Weighted samples from the 2018 AUA Annual Census.)
TABLE 3-3 Completion of Fellowship Experience
Fellowship Experience
Practicing Urologists Represented
Number Percent (%) +/- MOE (%)
No Fellowship 7,927 62.6 1.7
Fellowship Trained 4,733 37.4 1.7
One 3,287 26.0 1.6
Two or More 1,446 11.4 2.1
Total 12,660 100.0
(Data source: Weighted samples from the 2018 AUA Annual Census. Fellowship experience was reported for programs with a duration of one year or longer.)
30 The State of the Urology Workforce and Practice in the United States 2018
FIGURE 3-1Percentage of Practicing Urologists with Completed Fellowship Experience (by Gender and Age)
0% 10% 20% 30% 40% 50% 60% 70% 80%
Male≥ 45
Female≥ 45
Male< 45
Female< 45
GEN
DER
AN
D A
GE
PERCENT
62.5%
56.5%
54.6%
52.1%
29.4%
68.4%
50.8% 58.5%
44.1% 60.0%
27.4% 31.4%
(Data source: Weighted samples from the 2018 AUA Annual Census. Fellowship experience was reported for programs with a duration of one year or longer. Bold numbers are point estimates. The dashed bars represent upper and lower 90% confidence limits.)

31
TABLE 3-4Fellowship Area
Area of Fellowship
Male Urologists Represented Female Urologists Represented
NumberPercent
(%)+/- MOE
(%) NumberPercent
(%)+/- MOE
(%)
Endourology/Stone Disease
689 6.0 0.9 50 4.3 1.9
Erectile Dysfunction 367 3.2 0.7 53 4.5 2.4
Female Pelvic Medicine and Reconstructive Surgery
365 3.2 0.6 260 22.2 3.9
Male Genitourinary Reconstruction
342 3.0 0.7 86 7.3 2.4
Male Infertility 380 3.3 0.7 37 3.2 *
Oncology 1,401 12.2 1.3 108 9.2 3.1
Pediatrics 601 5.2 0.9 157 13.4 3.3
Renal Transplantation 180 1.6 0.5 0 n/a n/a
Research 451 3.9 0.8 45 3.9 1.9
Robotic Surgery 723 6.3 0.9 53 4.5 2.1
(Data source: Weighted samples from the 2018 AUA Annual Census. Fellowship experience was reported for programs with a duration of one year or longer. Respondents could select multiple answers; the total number of choices may not add up to the total number of practicing urolo-gists and the total percentages may not equal 100 percent. *Represents the estimated value should be used with caution due to small samples.)
TABLE 3-5Age at Completion of Most Recent Fellowship
Age at Completion of Most Recent
Fellowship
Practicing Urologists Represented
Number Percent (%) +/- MOE (%)
≤ 32 868 18.3 2.4
33 935 19.8 2.3
34 938 19.8 2.3
35 688 14.5 2.1
≥ 36 1,304 27.6 2.6
Fellowship Trained 4,733 100.0
Not Fellowship Trained 7,927
Total 12,660
(Data source: Weighted samples from the 2018 AUA Annual Census. Fellowship experience was reported for programs with a duration of one year or longer. The median age at completion of most recent fellowship is 34.)

32 The State of the Urology Workforce and Practice in the United States 2018
TABLE 3-6Number of State Medical Licenses
Number of Licenses
Practicing Urologists Represented
Number Percent (%)
1 10,196 80.5
2 2,008 15.9
3 374 3.0
4 72 0.6
Total Reported 12,650 100.0
Not Reported 10
Total 12,660
(Data source: National Provider Identifier 09/2018 file.)
TABLE 3-7Certification Status
Certification Status
Practicing Urologists Represented
Number Percent (%)
Certified by ABU 10,808 85.4
Not Certified by ABU 1,852 14.6
Total 12,660 100.0
(Data sources: National Provider Identifier 09/2018 file, ABU certification records from the ABMS Directory of Board Certified Medical Specialists.)
TABLE 3-8Total Number of Years of Practicing Urology Since Completion of Residency
Total Number of Years
Practicing Urologists Represented
Number Percent (%) +/- MOE (%)
1-5 2,135 16.9 0.9
6-10 1,327 10.5 0.7
11-15 1,283 10.1 0.7
16-20 1,360 10.7 0.7
21-25 1,321 10.4 0.7
26-30 1,348 10.7 0.7
≥ 31 3,885 30.7 0.8
Total 12,660 100.0
(Data source: Weighted samples from the 2018 AUA Annual Census. The median number of years practicing urology since the completion of residency is 21.)

33
Section 4: Characteristics of the Urology PracticePrimary Observations• The number of practicing urologists who directly
work with physician assistants and nurse practitioners significantly increased from 62.7 percent in 2015 to 72.5 percent in 2018 (Table 4-2).
• The percentage of practicing urologists in private practices in the United States decreased to 56.9 in 2018 from 59.5 in 2017 (Table 4-4). Male urologists aged 45 years or older are most likely to work in private practices (Figure 4-1).
• Female practicing urologists are more likely to work in academic medical centers than their male counterparts (32.7 percent and 24.2 percent, respectively) (Table 4-5).
• Nearly 38 percent of practicing urologists in the United States have a primary subspecialty (Table 4-8); oncology is the most common subspecialty area (Table 4-9).
• Approximately 80 percent of practicing urologists in the United States reported performing at least one major inpatient surgical procedure in a typical month (Table 4-10). The percentage of practicing urologists who perform inpatient surgical procedures decreases with age (Table 4-11).
TABLE 4-1Number of Practicing Urologists per Practice
Number of UrologistsPracticing Urologists Represented
Number Percent (%) +/- MOE (%)
1 2,165 17.1 1.5
2 1,136 9.0 1.1
3 1,002 7.9 1.0
4 984 7.8 1.0
5-9 3,002 23.7 1.6
10-15 2,060 16.3 1.4
≥ 16 2,312 18.3 1.4
Total 12,660 100.0
(Data source: Weighted samples from the 2018 AUA Annual Census. The median number of urologists per practice in the United States is 6.)

34 The State of the Urology Workforce and Practice in the United States 2018
TABLE 4-2Number of Practicing Urologists Who Work Directly with Physician Assistants (PAs) and Nurse Practitioners (NPs) in Their Primary Practices
Number of Physician Assistants and Nurse Practitioners
Practicing Urologists Represented
Number Percent (%) +/- MOE (%)
None 3,388 27.5 1.7
≥ 1 8,912 72.5 1.7
1 2,276 18.5 1.5
2 - 4 3,857 31.4 1.7
≥ 5 2,779 22.6 1.5
Total Reported 12,300 100.0
Not Reported 360
Total 12,660
(Data source: Weighted samples from the 2018 AUA Annual Census)
TABLE 4-3Does Your Practice Allow PAs or NPs to Perform the Following Procedures?
Practicing Urologists Represented
Yes Depending on Experience No
ProcedureNumber
Percent (%)
+/- MOE (%)
NumberPercent
(%)
+/- MOE (%)
NumberPercent
(%)
+/- MOE (%)
Circumcision 126 3.0 1.1 55 1.3 * 3,958 95.6 1.3
Cystoscopy 851 20.6 2.5 547 13.2 2.3 2,741 66.2 3.0
Hydrocele Aspiration 169 4.1 1.2 102 2.5 1.1 3,868 93.4 1.6
Intravesicle Botox 94 2.3 0.9 75 1.8 0.9 3,970 95.9 1.3
Prostate Biopsy 340 8.2 1.6 202 4.9 1.5 3,597 86.9 2.1
Testopel Injection 897 21.7 2.5 248 6.0 1.7 2,994 72.3 2.9
Vasectomy 47 1.1 * 47 1.1 * 4,044 97.7 1.0
Verapamil Injection 407 9.8 1.9 213 5.1 1.5 3,519 85.0 2.3
Xiaflex Injection 546 13.2 2.1 230 5.6 1.5 3,363 81.3 2.5
(Data source: Weighted samples from the 2018 AUA Annual Census. *Represents the estimated value should be used with caution due to small samples.)

35
TABLE 4-4Practice Setting
Practice Setting
Practicing Urologists Represented
Number Percent (%) +/- MOE (%)
Private Practices 7,198 56.9 1.8
Solo Practice 1,239 9.8 1.2
Single Urology Group 4,047 32.0 1.7
Multispecialty Group 1,913 15.1 1.3
Institutional Settings 5,368 42.4 1.8
Academic Medical Center 3,163 25.0 1.6
Public or Private Hospital 1,805 14.3 1.3
Private Hospital 723 5.7 0.9
Veteran Affairs (VA) 497 3.9 0.8
Non-VA Military Hospital 153 1.2 0.4
Other Public Hospital 432 3.4 0.6
Community Health Center/Health Maintenance Organization (HMO)/Managed Care Organization
399 3.2 0.7
Other Settings 94 0.7 *
Total 12,660 100.0
(Data source: Weighted samples from the 2018 AUA Annual Census. *Represents the estimated value should be used with caution due to small samples.)

36 The State of the Urology Workforce and Practice in the United States 2018
TABLE 4-5Practice Setting (by Gender)
Practice Setting
Male Urologists Represented Female Urologists Represented
NumberPercent
(%)+/- MOE
(%) NumberPercent
(%)+/- MOE
(%)
Academic Medical Center
2,782 24.2 1.7 381 32.7 4.4
Multispecialty Group 1,743 15.2 1.4 170 14.6 3.7
Single Urology Group 3,787 32.9 1.8 260 22.3 4.2
Others 3,181 27.7 1.8 356 30.5 4.5
Total 11,493 100.0 1,167 100.0
(Data source: Weighted samples from the 2018 AUA Annual Census.)
FIGURE 4-1Percentage of Practicing Urologists in Private Practices (by Gender and Age)
0% 10% 20% 30% 40% 50% 60% 70%
Male≥ 45
Female≥ 45
Male< 45
Female< 45
GEN
DER
AN
D A
GE
PERCENT
37.2%
31.2%
45.8%
46.5%
62.3%
43.2%
41.9% 49.6%
39.5% 53.4%
60.0% 64.6%
(Data source: Weighted samples from the 2018 AUA Annual Census. Bold numbers are point estimates. The dashed bars represent upper and lower 90% confidence limits.)

37
TABLE 4-6Number of Practicing Urologists per Practice (by Practice Setting)
Number of Practicing Urologists
Practicing Urologists Represented
Number Percent (%) +/- MOE (%)
Institutional Settings (Academic, Hospitals and Health Care Systems)
1 544 10.1 1.9
2-5 1,429 26.6 2.6
6-9 1,037 19.3 2.2
≥ 10 2,358 43.9 2.8
Total 5,368 100.0
Private Practices (Solo, Single Urology and Multispecialty)
1 1,573 21.9 2.1
2-5 2,442 33.9 2.3
6-9 1,169 16.2 1.8
≥ 10 2,014 28.0 2.2
Total 7,198 100.0
Other Settings
1 48 51.0 *
≥ 2 46 49.0 *
Total 94 100.0
Data source: Weighted samples from the 2018 AUA Annual Census. *Represents the estimated value should be used with caution due to small samples.)
TABLE 4-7Number of Office Locations per Practice
Number of Office Locations
Practicing Urologists Represented
Number Percent (%) +/- MOE (%)
1 4,346 34.3 1.8
2 2,458 19.4 1.5
3 1,629 12.9 1.2
4 1,058 8.4 1.0
≥ 5 3,169 25.0 1.6
Total 12,660 100.0
(Data source: Weighted samples from the 2018 AUA Annual Census. The median number of office locations per practice is 2.)

38 The State of the Urology Workforce and Practice in the United States 2018
TABLE 4-8Primary Subspecialty
Primary Subspecialty
Practicing Urologists Represented
Number Percent (%) +/- MOE (%)
General without Subspecialty 7,877 62.2 1.7
Oncology 1,394 11.0 1.2
Pediatrics 724 5.7 0.8
Female Pelvic Medicine and Reconstruction 604 4.8 0.6
Endourology/Stone Disease 523 4.1 0.8
Robotic Surgery 468 3.7 0.7
Male Genitourinary Reconstruction 360 2.8 0.6
Male Infertility 292 2.3 0.6
Erectile Dysfunction 266 2.1 0.6
Renal Transplantation/ Laparoscopic Surgery 114 0.9 0.3
Others 37 0.3 *
Total 12,660 100.0
(Data source: Weighted samples from the 2018 AUA Annual Census. *Represents the estimated value should be used with caution due to small samples.)
TABLE 4-9Any Subspecialty (by Gender)
Subspecialty
Male Urologists Represented
Female Urologists Represented
Total Urologists Represented
NumberPercent
(%)
+/- MOE (%) Number
Percent (%)
+/- MOE (%) Number
Percent (%)
+/- MOE (%)
Oncology 7,693 66.9 1.9 564 48.3 4.7 8,257 65.2 1.8
Endourology/Stone Disease
7,345 63.9 2.0 713 61.1 4.9 8,058 63.6 1.8
Erectile Dysfunction 6,574 57.2 2.0 445 38.2 4.6 7,020 55.4 1.9
Laparoscopic Surgery/Renal Transplantation
3,933 34.2 1.7 391 33.5 4.5 4,323 34.1 1.6
Female Pelvic Medicine and Reconstructive Surgery
3,569 31.1 1.8 697 59.7 4.5 4,266 33.7 1.7
Robotic Surgery 3,683 32.0 1.6 500 42.9 4.6 4,183 33.0 1.5

39
Subspecialty
Male Urologists Represented
Female Urologists Represented
Total Urologists Represented
NumberPercent
(%)
+/- MOE (%) Number
Percent (%)
+/- MOE (%) Number
Percent (%)
+/- MOE (%)
Male Infertility 3,665 31.9 1.9 188 16.1 3.8 3,853 30.4 1.7
Male Genitourinary Reconstruction
2,374 20.7 1.6 265 22.7 4.3 2,639 20.8 1.5
Pediatrics 2,235 19.4 1.6 264 22.6 4.2 2,499 19.7 1.5
(Data source: Weighted samples from the 2018 AUA Annual Census. Respondents could select multiple answers; the total number of choices may not add up to the total number of practicing urologists and the total percentages may not equal 100 percent.)
TABLE 4-10Number of Major Inpatient Operative Procedures Performed in a Typical Month
Number of Procedures per Month
Practicing Urologists Represented
Number Percent (%) +/- MOE (%)
None 2,513 19.8 1.6
At Least One 10,147 80.2 1.6
1-4 3,429 27.1 1.7
5-9 2,961 23.4 1.6
≥ 10 3,757 29.7 1.7
Total 12,660 100.0
(Data source: Weighted samples from the 2018 AUA Annual Census.)
TABLE 4-9 Any Subspecialty (by Gender) (continued)

40 The State of the Urology Workforce and Practice in the United States 2018
TABLE 4-11Performing Major Inpatient Operative Procedures (by Age)
Age of Physician
Practicing Urologists Represented
Number Percent (%) +/- MOE (%)
All Ages 10,147 80.2 1.6
< 45 3,127 92.5 1.8
45-54 2,346 89.1 2.2
55-64 2,322 80.8 2.7
65-74 1,891 70.8 4.6
≥ 75 462 42.0 8.5
(Data source: Weighted samples from the 2018 AUA Annual Census. The total number of choices may not add up to the total number of practic-ing urologists and the total percentages may not equal 100 percent.)
FIGURE 4-2Percentage of Practicing Urologists Who Reported Performing Major Inpatient Operative Procedures (by Gender and Age)
0% 10% 20% 30% 40% 50% 60% 70% 80% 90% 100%
Male≥ 45
Female≥ 45
Male< 45
Female< 45
GEN
DER
AN
D A
GE
PERCENT
87.3%
93.3%
79.9%
75.4%
82.9% 91.8%
73.0% 86.9%
92.0% 95.8%
73.4% 77.5%
(Data source: Weighted samples from the 2018 AUA Annual Census. Bold numbers are point estimates. The dashed bars represent upper and lower 90% confidence limits.)
41
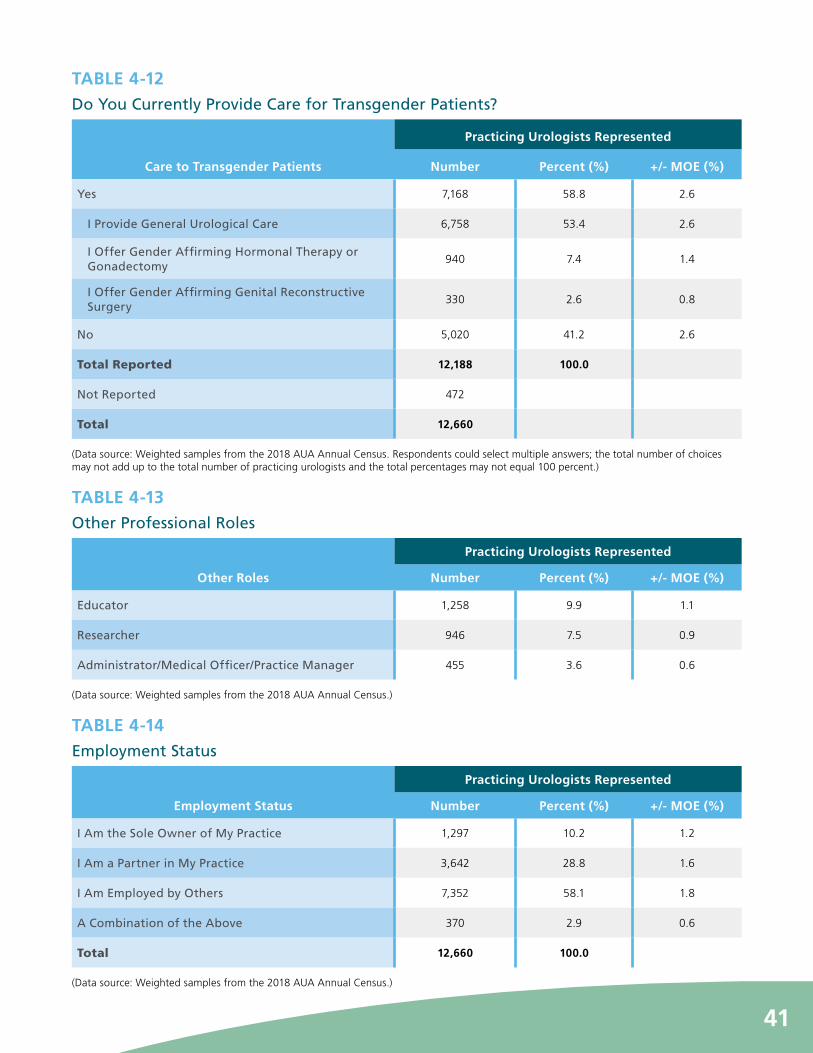
TABLE 4-12Do You Currently Provide Care for Transgender Patients?
Care to Transgender Patients
Practicing Urologists Represented
Number Percent (%) +/- MOE (%)
Yes 7,168 58.8 2.6
I Provide General Urological Care 6,758 53.4 2.6
I Offer Gender Affirming Hormonal Therapy or Gonadectomy
940 7.4 1.4
I Offer Gender Affirming Genital Reconstructive Surgery
330 2.6 0.8
No 5,020 41.2 2.6
Total Reported 12,188 100.0
Not Reported 472
Total 12,660
(Data source: Weighted samples from the 2018 AUA Annual Census. Respondents could select multiple answers; the total number of choices may not add up to the total number of practicing urologists and the total percentages may not equal 100 percent.)
TABLE 4-13Other Professional Roles
Other Roles
Practicing Urologists Represented
Number Percent (%) +/- MOE (%)
Educator 1,258 9.9 1.1
Researcher 946 7.5 0.9
Administrator/Medical Officer/Practice Manager 455 3.6 0.6
(Data source: Weighted samples from the 2018 AUA Annual Census.)
TABLE 4-14Employment Status
Employment Status
Practicing Urologists Represented
Number Percent (%) +/- MOE (%)
I Am the Sole Owner of My Practice 1,297 10.2 1.2
I Am a Partner in My Practice 3,642 28.8 1.6
I Am Employed by Others 7,352 58.1 1.8
A Combination of the Above 370 2.9 0.6
Total 12,660 100.0
(Data source: Weighted samples from the 2018 AUA Annual Census.)

42 The State of the Urology Workforce and Practice in the United States 2018
FIGURE 4-3Percentage of Practicing Urologists Employed by Others (by Gender and Age)
0% 10% 20% 30% 40% 50% 60% 70% 80% 90% 100%
Male≥ 45
Female≥ 45
Male< 45
Female< 45
GEN
DER
AN
D A
GE
PERCENT
80.2%
68.8%
72.8%
52.3%
75.3% 85.1%
65.4% 72.2%
50.5% 54.6%
66.9% 78.7%
Data source: Weighted samples from the 2018 AUA Annual Census. Bold numbers are point estimates. The dashed bars represent upper and lower 90% confidence limits.)
TABLE 4-15On Average, What Percentage of Patient Cases You See Could Have Been Handled by Primary Care Physicians?
Percent of Patient Cases
Practicing Urologists Represented
Number Percent (%) +/- MOE (%)
≤ 5 2,091 18.1 2.4
6-10 2,565 22.2 2.4
11-15 1,582 13.7 1.8
16-20 2,112 18.2 2.1
21-25 1,085 9.4 1.7
> 25 2,142 18.5 2.0
Total Reported 11,577 100.0
Not Reported 1,083
Total 12,660
(Data source: Weighted samples from the 2018 AUA Annual Census.)

43
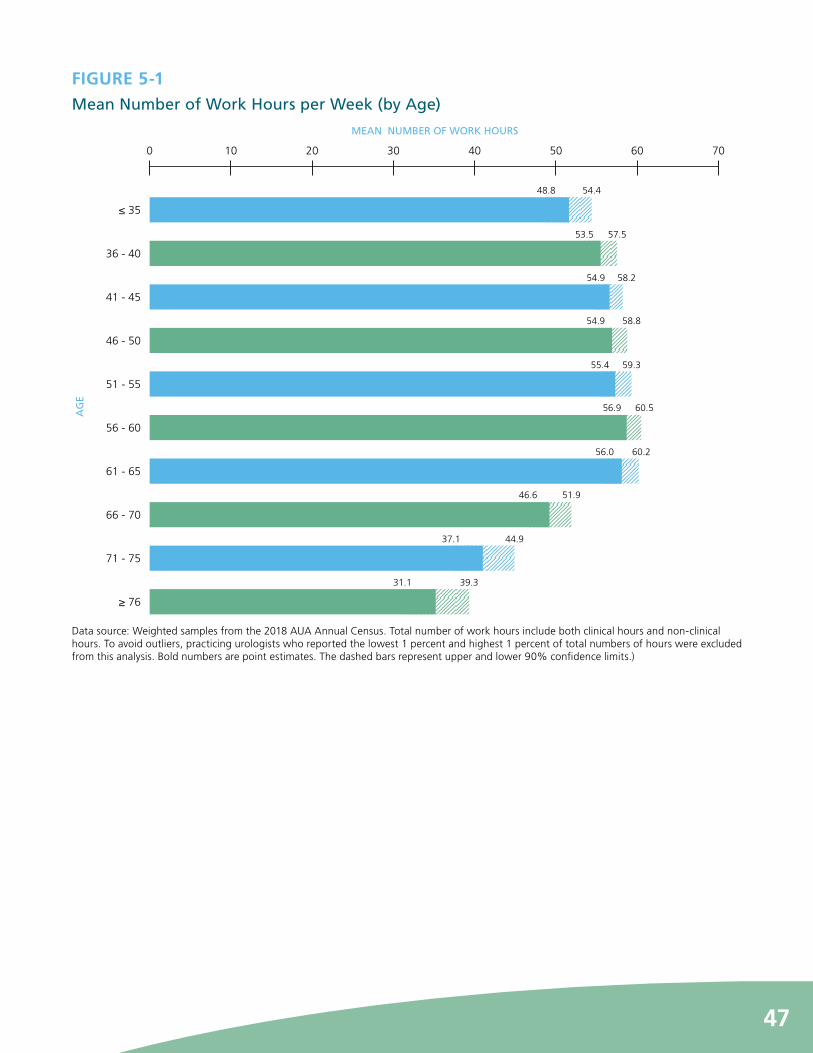
Section 5: Work Hours, Patient Encounters and Other Practice Characteristics Primary Observations• The median number of hours practicing urologists
worked per week was 55. Nearly one-third of urologists work more than 60 hours a week (Table 5-1).
• The average number of work hours per week increased to 52.9 hours in 2018 from 51.6 hours in 2017 (Table 5-4).
• The median number of minutes a practicing urologist spends with a patient in a typical office visit is 15 (Table 5-5). On average, female urologists spend more minutes with patients than their male counterparts, whereas practicing urologists in single urology groups spend the least amount of time with patients in a typical office visit (Table 5-6).
• Practicing urologists see 75 patients in a typical week (Table 5-7) and work a median 48 weeks per year (Table 5-10), suggesting an estimated 3,600 patients visits/encounters per urologist in 2018, which was higher than 3,360 patient visits/encounters per urologist in 2017.
• The top reason urologists plan to retire before the age of 65 is a lack of time for personal and/or family life while they work (Table 5-12). The top reason urologists plan to retire after the age of 70 is they enjoy practicing (Table 5-13).
TABLE 5-1Total Number of Hours Worked in a Typical Week
Hours Worked per Week
Practicing Urologists Represented
Number Percent (%) +/- MOE (%)
≤ 35 2,279 18.0 1.5
36-40 596 4.7 0.9
41-45 886 7.0 0.9
46-50 1,491 11.8 1.1
51-55 1,473 11.6 1.1
56-60 1,861 14.7 1.3
≥ 61 4,075 32.2 1.7
Total 12,660 100.0
(Data source: Weighted samples from the 2018 AUA Annual Census. This table is based on a derived question consisting of work hours for both clinical and non-clinical activities. The median number of work hours per week is 55.)

44 The State of the Urology Workforce and Practice in the United States 2018
TABLE 5-2Number of Clinical Hours Directly Related to Patient Care in a Typical Week
Number of Clinical Hours per Week
Practicing Urologists Represented
Number Percent (%) +/- MOE (%)
< 25 1,967 15.5 1.5
≥ 25 10,693 84.5 1.5
25-30 1,042 8.2 1.1
31-35 573 4.5 0.8
36-40 1,753 13.8 1.3
41-45 893 7.1 0.9
46-50 2,153 17.0 1.3
51-55 678 5.4 0.7
56-60 2,042 16.1 1.3
≥ 61 1,560 12.3 1.2
Total 12,660 100.0
(Data source: Weighted samples from the 2018 AUA Annual Census. The median number of clinical hours directly related to patient care per week is 48.)
TABLE 5-3Number of Non-Clinical (e.g., Administration, Teaching, Research) Hours in a Typical Week
Number of Non-Clinical Hours per Week
Practicing Urologists Represented
Number Percent (%) +/- MOE (%)
≤ 1 2,174 17.2 1.5
2-5 4,591 36.3 1.8
6-10 3,282 25.9 1.7
11-15 865 6.8 0.9
16-20 967 7.6 1.0
≥ 21 781 6.2 0.9
Total 12,660 100.0
(Data source: Weighted samples from the 2018 AUA Annual Census. The median number of non-clinical hours per week is 5.)

45
TABLE 5-4Mean Number of Clinical, Non-Clinical and Total Work Hours in a Typical Week (by Gender)
Type of Work Hours
Male Urologists RepresentedFemale Urologists
RepresentedTotal Urologists Represented
Number of Urologists
Mean Number of Hours
+/- MOE
Number of
Urologists
Mean Number of Hours
+/- MOE
Number of Urologists
Mean Number of Hours
+/- MOE
Number of Clinical Hours
11,248
44.8 0.7
1,152
43.4 1.8
12,400
44.6 0.7
Number of Non-Clinical Hours
8.2 0.3 9.1 0.9 8.2 0.3
Total Number of Work Hours
52.9 0.8 52.4 1.8 52.9 0.7
(Data source: Weighted samples from the 2018 AUA Annual Census. To avoid outliers, practicing urologists who reported the lowest and high-est 1 percent of minutes were excluded from this analysis.)
TABLE 5-5Number of Minutes Spent with a Patient in a Typical Office Visit
Number of Minutes
Practicing Urologists Represented
Number Percent (%) +/- MOE (%)
≤ 10 3,288 26.0 1.6
11-14 792 6.3 0.9
15-19 5,079 40.1 1.9
≥ 20 3,501 27.7 1.7
Total 12,660 100.0
(Data source: Weighted samples from the 2018 AUA Annual Census. The median number of minutes spent with a patient during a typical office visit is 15.)

46 The State of the Urology Workforce and Practice in the United States 2018
TABLE 5-6Mean Number of Minutes Spent with a Patient in a Typical Office Visit (by Gender and Practice Setting)
Practice Setting
Male Urologists RepresentedFemale Urologists
Represented Total Urologists Represented
Number of Urologists
Mean Number
of Minutes
+/- MOE
Number of
Urologists
Mean Number
of Minutes
+/- MOE
Number of Urologists
Mean Number
of Minutes
+/- MOE
Solo 1,194 17.4 1.7 45 17.9 2.8 1,239 17.4 1.6
Single 3,757 13.8 0.5 260 15.3 1.4 4,017 13.9 0.5
Multispecialty 1,719 15.2 0.5 166 18.7 3.1 1,884 15.5 0.5
Academic 2,777 16.9 0.6 381 20.0 1.1 3,159 17.3 0.5
VA and Other Military Hospitals
589 18.3 1.2 60 22.9 1.7 649 18.7 1.2
Private and Public Hospitals
974 16.3 1.3 180 16.2 2.0 1,153 16.2 1.1
Others 483 18.1 2.4 76 19.6 2.5 559 18.3 2.1
Total 11,493 15.8 0.3 1,167 18.2 0.8 12,660 16.0 0.3
(Data source: Weighted samples from the 2018 AUA Annual Census. To avoid outliers, practicing urologists who reported the lowest and high-est 1 percent of minutes were excluded from this analysis.)
47
FIGURE 5-1Mean Number of Work Hours per Week (by Age)
AG
E
MEAN NUMBER OF WORK HOURS
0 10 20 30 40 50 60 70
≥ 76
71 - 75
66 - 70
61 - 65
56 - 60
51 - 55
46 - 50
41 - 45
36 - 40
≤ 35 51.648.8
55.5
56.6
56.9
57.3
58.7
58.1
49.2
41.0
35.2
54.4
53.5 57.5
54.9 58.2
54.9 58.8
55.4 59.3
56.9 60.5
56.0 60.2
46.6 51.9
37.1 44.9
31.1 39.3
Data source: Weighted samples from the 2018 AUA Annual Census. Total number of work hours include both clinical hours and non-clinical hours. To avoid outliers, practicing urologists who reported the lowest 1 percent and highest 1 percent of total numbers of hours were excluded from this analysis. Bold numbers are point estimates. The dashed bars represent upper and lower 90% confidence limits.)

48 The State of the Urology Workforce and Practice in the United States 2018
TABLE 5-7Number of Patient Visits/Encounters in a Typical Week
Patient Visits/Encounters
Practicing Urologists Represented
Number Percent (%) +/- MOE (%)
≤ 50 3,868 30.6 1.8
51-75 3,037 24.0 1.6
76-100 3,779 29.8 1.7
101-125 1,183 9.3 1.0
≥ 126 793 6.3 0.9
Total 12,660 100.0
(Data source: Weighted samples from the 2018 AUA Annual Census. The median number of patient visits/encounters per week is 75.)
TABLE 5-8Mean Number of Patient Visits/Encounters in a Typical Week (by Gender and Practice Setting)
Practice Setting
Male Urologists RepresentedFemale Urologists
RepresentedTotal Urologists Represented
Number of Urologists
Mean Number of Visits
+/- MOE
Number of
Urologists
Mean Number of Visits
+/- MOE
Number of Urologists
Mean Number of Visits
+/- MOE
Solo 1,194 80.1 5.6 45 74.7 15.6 1,239 79.9 5.4
Single 3,787 91.6 2.5 260 87.6 6.5 4,047 91.4 2.4
Multispecialty 1,743 80.9 3.2 170 72.9 7.0 1,913 80.2 3.0
Academic 2,782 56.0 2.3 381 50.3 3.2 3,163 55.4 2.0
Private and Public Hospitals including VA and non-Military Hospitals
1,563 65.9 3.8 242 58.1 4.2 1,805 64.9 3.4
Others 424 41.9 7.6 69 67.3 12.9 494 45.5 7.0
Total 11,493 1,167 12,660
(Data source: Weighted samples from the 2018 AUA Annual Census. To avoid outliers, practicing urologists who reported the lowest and highest 1 percent of patient visits were excluded from this analysis.)

49
FIGURE 5-2Percentage of Practicing Urologists with More Than 100 Patient Visits/Encounters in a Typical Week (by Gender and Age)
0% 5% 10% 15% 20%
Male≥ 45
Female≥ 45
Male< 45
Female< 45 4.3%
1.7% 6.9%
9.6%
5.9% 14.2%
16.2% 19.5%
14.5%
GEN
DER
AN
D A
GE
PERCENT
12.1%
10.1%
17.9%
(Data source: Weighted samples from the 2018 AUA Annual Census. Bold numbers are point estimates. The dashed bars represent upper and lower 90% confidence limits.)
TABLE 5-9Percentage of Patient Visits/Encounters Made by Female Patients (by Gender)
Percentage of Female Patient
Visits
Male Urologists RepresentedFemale Urologists
RepresentedTotal Urologists Represented
Number of Urologists
Percent (%)
+/- MOE (%)
Number of
Urologists
Percent (%)
+/- MOE (%)
Number of Urologists
Percent (%)
+/- MOE (%)
≤ 25 4,845 42.2 2.0 195 16.7 3.6 5,039 39.8 1.8
26-50 6,248 54.4 2.0 398 34.1 4.7 6,646 52.5 1.9
51-74 286 2.5 0.6 257 22.0 4.1 543 4.3 0.7
≥ 75 114 1.0 0.4 318 27.3 3.6 432 3.4 0.5
Total 11,493 100.0 1,167 100.0 12,660 100.0
(Data source: Weighted samples from the 2018 AUA Annual Census. The median percentage of patient visits/encounters by female patients is 30.)

50 The State of the Urology Workforce and Practice in the United States 2018
TABLE 5-10Number of Weeks Taken for Vacation Leave in the Previous Year (by Gender)
Number of Weeks of
Vacation Leave
Male Urologists RepresentedFemale Urologists
RepresentedTotal Urologists Represented
Number of Urologists
Percent (%)
+/- MOE (%)
Number of
Urologists
Percent (%)
+/- MOE (%)
Number of Urologists
Percent (%)
+/- MOE (%)
≤ 2 2,116 18.4 1.6 200 17.2 3.7 2,316 18.3 1.5
3 2,321 20.2 1.5 252 21.6 3.8 2,574 20.3 1.4
4 3,070 26.7 1.7 299 25.6 3.9 3,369 26.6 1.6
5-6 2,697 23.5 1.7 306 26.2 3.7 3,003 23.7 1.6
≥ 7 1,289 11.2 1.4 110 9.4 2.8 1,398 11.0 1.3
Total 11,493 100.0 1,167 100.0 12,660 100.0
(Data source: Weighted samples from the 2018 AUA Annual Census. The median number of vacation weeks is 4.)
TABLE 5-11Age at Planned Full Retirement from Practice (by Gender)
Planned Retirement
Age
Male Urologists RepresentedFemale Urologists
RepresentedTotal Urologists Represented
Number of Urologists
Percent (%)
+/- MOE (%)
Number of
Urologists
Percent (%)
+/- MOE (%)
Number of Urologists
Percent (%)
+/- MOE (%)
< 60 470 4.1 0.7 223 19.1 3.5 693 5.5 0.7
60-65 3,961 34.5 1.5 605 51.8 4.8 4,566 36.1 1.4
66-70 3,551 30.9 1.7 305 26.1 4.1 3,856 30.5 1.6
71-75 2,119 18.4 1.6 22 1.9 * 2,142 16.9 1.5
> 75 1,391 12.1 1.1 12 1.0 * 1,403 11.1 1.3
Total 11,493 100.0 1,167 100.0 12,660 100.0
(Data source: Weighted samples from the 2018 AUA Annual Census. The median age at planned full retirement from practice is 68. *Represents the estimated value should be used with caution due to small samples.)

51
TABLE 5-12Among Those Who Plan to Retire Before the Age of 65, What Factors May Lead to Early Retirement?
Factors for Early Retirement
Practicing Urologists Represented
Number of Urologists Percent (%) +/- MOE (%)
Not Enough Time for Personal and/or Family Life
1,819 73.1 3.0
Work Related Stress 1,724 69.3 3.3
Complicated Regulatory Requirements 1,381 55.5 3.3
Too Many Patients to See 578 23.2 2.9
Malpractice 470 18.9 2.6
Others 426 17.1 2.5
Total 2,488
(Data source: Weighted samples from the 2018 AUA Annual Census. Respondents could select multiple answers; the total number of choices may not add up to the total number of practicing urologists and the total percentages may not equal 100 percent.)
TABLE 5-13Among Those Who Plan to Retire at the Age of 70 or Later, What Factors May Delay Your Retirement?
Factors for Late Retirement
Practicing Urologists Represented
Number of Urologists Percent (%) +/- MOE (%)
I Enjoy Practicing 4,365 76.0 2.5
I Want to Keep Working 3,278 57.1 3.1
Economic Pressure 1,953 34.0 2.7
Inability to Recruit a Replacement 534 9.3 1.9
Others 232 4.0 1.2
Total 5,742
(Data source: Weighted samples from the 2018 AUA Annual Census. Respondents could select multiple answers; the total number of choices may not add up to the total number of practicing urologists and the total percentages may not equal 100 percent.)

52 The State of the Urology Workforce and Practice in the United States 2018
Section 6: Practice Internal Policies and SupportPrimary Observations• Approximately 70 percent of practicing urologists
reported their practices took steps to increase practice profitability in the previous year (Table 6-1). The top three steps taken were to see more patients, reduce spending in areas other than reducing staff or travel to meetings and decrease staff size (Table 6-2).
• Approximately 75 percent of practicing urologists received financial support from their practices to attend in-person meetings (Table 6-3).
• Approximately 78 percent and 63 percent of practicing urologists reported their practices made efforts to hire women and underrepresented minorities, respectively (Table 6-5 and Table 6-6).
The following question was intended to ask practicing urologists about whether they were aware of the profitability issues around their practices.
TABLE 6-1Has Your Practice Taken Steps to Increase Practice Profitability?
Increase Practice Profitability
Practicing Urologists Represented
Number Percent (%) +/- MOE (%)
Yes 7,242 69.3 2.8
No 3,212 30.7 2.8
Total Reported 10,454 100.0
Not Reported 2,206
Total 12,660
(Data source: Weighted samples from the 2018 AUA Annual Census.)
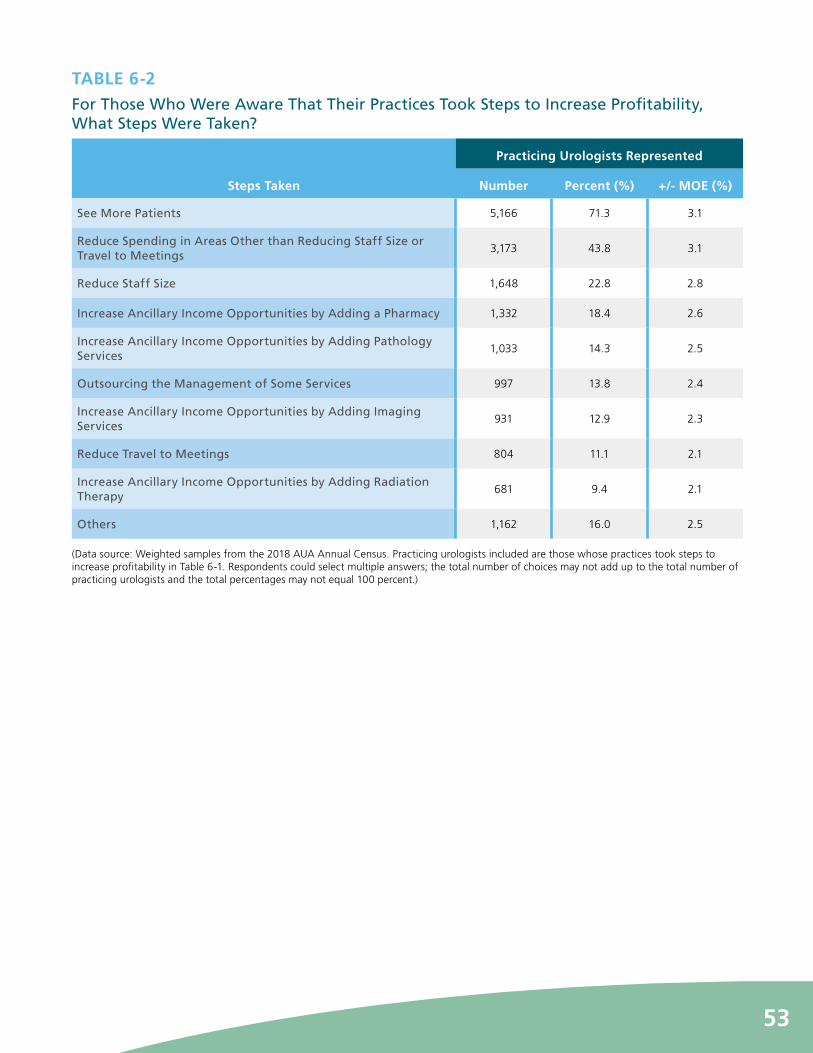
53
TABLE 6-2For Those Who Were Aware That Their Practices Took Steps to Increase Profitability, What Steps Were Taken?
Steps Taken
Practicing Urologists Represented
Number Percent (%) +/- MOE (%)
See More Patients 5,166 71.3 3.1
Reduce Spending in Areas Other than Reducing Staff Size or Travel to Meetings
3,173 43.8 3.1
Reduce Staff Size 1,648 22.8 2.8
Increase Ancillary Income Opportunities by Adding a Pharmacy 1,332 18.4 2.6
Increase Ancillary Income Opportunities by Adding Pathology Services
1,033 14.3 2.5
Outsourcing the Management of Some Services 997 13.8 2.4
Increase Ancillary Income Opportunities by Adding Imaging Services
931 12.9 2.3
Reduce Travel to Meetings 804 11.1 2.1
Increase Ancillary Income Opportunities by Adding Radiation Therapy
681 9.4 2.1
Others 1,162 16.0 2.5
(Data source: Weighted samples from the 2018 AUA Annual Census. Practicing urologists included are those whose practices took steps to increase profitability in Table 6-1. Respondents could select multiple answers; the total number of choices may not add up to the total number of practicing urologists and the total percentages may not equal 100 percent.)

54 The State of the Urology Workforce and Practice in the United States 2018
TABLE 6-3Does Your Practice Provide Enough Financial Support for You to Do the Following?
Financial Support Practicing Urologists Represented
Attend In-person Meetings You Want to Attend for Face-to-Face Interaction with Other Urologists?
Number Percent (%) +/- MOE (%)
No 3,047 24.5 2.4
Yes 9,394 75.5 2.4
Total Reported 12,442 100.0
Not Reported 218
Total 12,660
Obtain Needed Continuing Medical Education (CME) Number Percent (%) +/- MOE (%)
No 2,197 17.6 2.1
Yes 10,289 82.4 2.1
Total Reported 12,486 100.0
Not Reported 174
Total 12,660
(Data source: Weighted samples from the 2018 AUA Annual Census.)
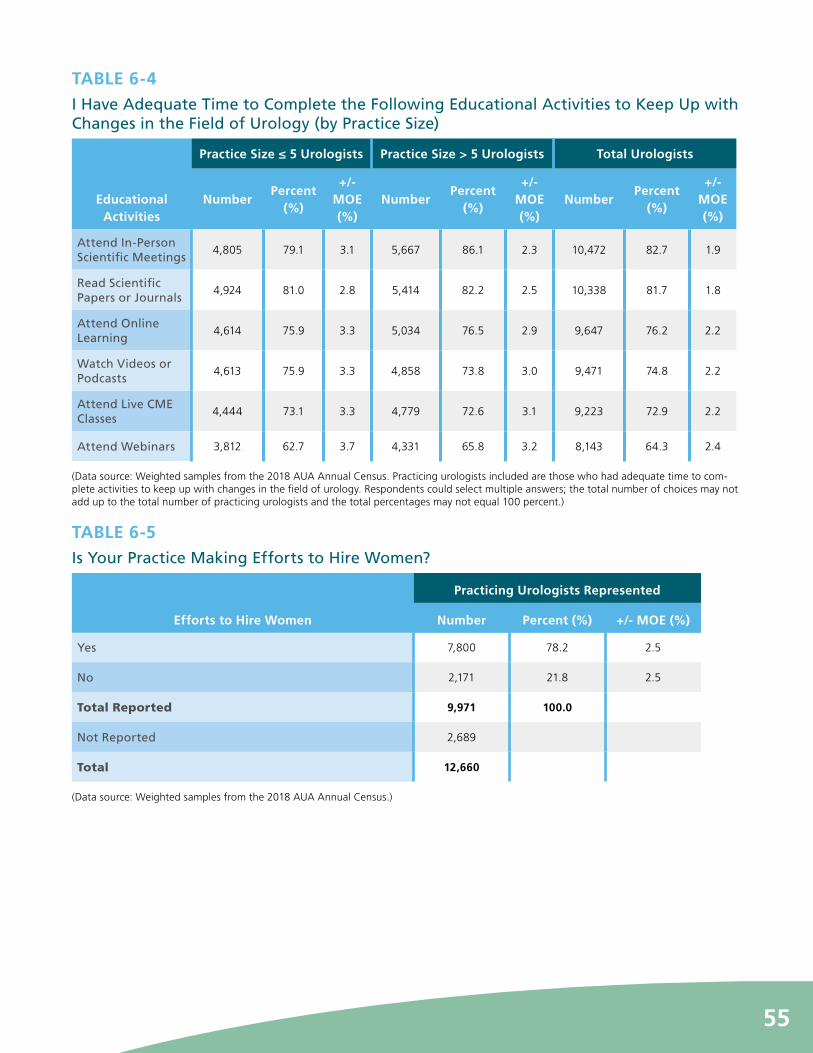
55
TABLE 6-4I Have Adequate Time to Complete the Following Educational Activities to Keep Up with Changes in the Field of Urology (by Practice Size)
Educational Activities
Practice Size ≤ 5 Urologists Practice Size > 5 Urologists Total Urologists
NumberPercent
(%)
+/- MOE (%)
NumberPercent
(%)
+/- MOE (%)
NumberPercent
(%)
+/- MOE (%)
Attend In-Person Scientific Meetings
4,805 79.1 3.1 5,667 86.1 2.3 10,472 82.7 1.9
Read Scientific Papers or Journals
4,924 81.0 2.8 5,414 82.2 2.5 10,338 81.7 1.8
Attend Online Learning
4,614 75.9 3.3 5,034 76.5 2.9 9,647 76.2 2.2
Watch Videos or Podcasts
4,613 75.9 3.3 4,858 73.8 3.0 9,471 74.8 2.2
Attend Live CME Classes
4,444 73.1 3.3 4,779 72.6 3.1 9,223 72.9 2.2
Attend Webinars 3,812 62.7 3.7 4,331 65.8 3.2 8,143 64.3 2.4
(Data source: Weighted samples from the 2018 AUA Annual Census. Practicing urologists included are those who had adequate time to com-plete activities to keep up with changes in the field of urology. Respondents could select multiple answers; the total number of choices may not add up to the total number of practicing urologists and the total percentages may not equal 100 percent.)
TABLE 6-5Is Your Practice Making Efforts to Hire Women?
Efforts to Hire Women
Practicing Urologists Represented
Number Percent (%) +/- MOE (%)
Yes 7,800 78.2 2.5
No 2,171 21.8 2.5
Total Reported 9,971 100.0
Not Reported 2,689
Total 12,660
(Data source: Weighted samples from the 2018 AUA Annual Census.)

56 The State of the Urology Workforce and Practice in the United States 2018
TABLE 6-6Is Your Practice Making Efforts to Hire Underrepresented Minorities?
Efforts to Hire Underrepresented Minorities
Practicing Urologists Represented
Number Percent (%) +/- MOE (%)
Yes 5,319 63.1 3.2
No 3,105 36.9 3.2
Total Reported 8,424 100.0
Not Reported 4,236
Total 12,660
(Data source: Weighted samples from the 2018 AUA Annual Census.)

57
Section 7: Topics Related to Gender and FamilyPrimary Observations• The majority of practicing urologists do not feel a
gender bias exists within their practice (Table 7-1).
• Nearly 60 percent of urologists stated their practice has at least one female partner (Table 7-7).
• Approximately 55 percent of male urologists and 40 percent of female urologists were satisfied or very satisfied with their work-life balance in 2018 (Table 7-12).
TABLE 7-1Do You Feel That There Is a Gender Bias in Your Practice (by Gender)?
Gender Bias
Male Urologists Represented Female Urologists Represented
NumberPercent
(%)+/- MOE
(%) NumberPercent
(%)+/- MOE
(%)
Yes 135 1.2 0.5 428 39.3 6.5
My Supervisor Considers Gender in Delegating Job Assignments
114 1.0 0.5 141 12.1 5.3
My Professional Growth Is Limited Because of My Gender
28 0.2 * 351 30.1 6.7
My Opportunities to Collaborate with My Colleagues Are Limited Because of My Gender
0 n/a n/a 133 11.4 4.1
No 11,145 98.8 0.5 660 60.7 6.5
Total 11,280 100.0 1,088 100.0
(Data source: Weighted samples from the 2018 AUA Annual Census. *Represents the estimated value should be used with caution due to small samples.)

58 The State of the Urology Workforce and Practice in the United States 2018
TABLE 7-2For Those Who Felt There Was a Gender Bias, Are You Limited to Seeing Certain Patients/Diagnoses Due to Your Gender (by Gender)?
Limited to Seeing Patients Due to Gender
Male Urologists Represented Female Urologists Represented
NumberPercent
(%)+/- MOE
(%) NumberPercent
(%)+/- MOE
(%)
Yes 20 14.6 * 211 50.1 13.7
No 115 85.4 14.7 210 49.9 13.7
Total Reported 135 100.0 421 100.0
Not Reported 0 7
(Data source: Weighted samples from the 2018 AUA Annual Census. The reported numbers are from those who felt there were gender biases in their practices [i.e., responded ‘yes’ in Table 7-1]. *Represents the estimated value should be used with caution due to small samples.)
TABLE 7-3 For Those Who Felt They Were Limited to Seeing Patients Due to Gender, Was It Driven by Any of the Following?
Source of Gender Bias
Practicing Urologists Represented
Number Percent (%) +/- MOE (%)
Your Patients 201 86.9 8.2
Your Partners 134 57.9 20.0
Yourself 67 28.9 *
Other Factors 89 38.6 19.1
(Data source: Weighted samples from the 2018 AUA Annual Census. These results represent those who reported limitations in the types of patients they see based on their gender. Respondents could select multiple answers; the total number of choices may not add up to the total number of practicing urologists and the total percentages may not equal 100 percent. *Represents the estimated value should be used with caution due to small samples.)

59
TABLE 7-4Does Seeing Certain Patients/Diagnoses in Your Group Due to Your Gender Contribute to Feelings of Dissatisfaction?
Contribute to Feelings of Dissatisfaction
Practicing Urologists Represented
Number Percent (%) +/- MOE (%)
Yes 114 56.6 13.3
No 87 43.4 13.3
Total Reported 201 100.0
I Prefer Not to Answer 30
(Data source: Weighted samples from the 2018 AUA Annual Census. These results represent those who reported limitations in the types of patients they see based on their gender.)
TABLE 7-5Have You Been Personally Exposed to Sexual Harassment^ in the Workplace (by Gender)?
Sexual Harassment Exposure
Male Urologists Represented Female Urologists Represented
NumberPercent
(%)+/- MOE
(%) NumberPercent
(%)+/- MOE
(%)
Yes 1,343 11.9 1.9 550 52.4 7.4
I Have Been Sexually Harassed in the Workplace
327 2.8 0.9 328 28.1 6.8
I Have Witnessed Sexual Harassment in the Workplace
1,071 9.3 1.7 303 26.0 5.1
No 9,907 88.1 1.9 500 47.6 7.4
Total Reported 11,250 1,050
Prefer Not to Report 243 117
Total 11,493 1,167
(Data source: Weighted samples from the 2018 AUA Annual Census. Respondents could select multiple answers; the total number of choices may not add up to the total number of practicing urologists and the total percentages may not equal 100 percent. ^Sexual harassment was defined in the 2018 AUA Annual Census as unwanted sexually-oriented comments, advances or touching.)

60 The State of the Urology Workforce and Practice in the United States 2018
TABLE 7-6Locations Where Practicing Urologists Were Exposed to Sexual Harassment (by Gender)
Location of Sexual Harassment
Male Urologists Represented Female Urologists Represented
NumberPercent
(%)+/- MOE
(%) NumberPercent
(%)+/- MOE
(%)
Operating Room 307 51.3 6.7 689 55.8 11.2
Office 657 48.9 6.4 277 50.3 9.7
Hospital Ward 436 32.5 6.6 198 36.0 8.1
Surgeons’ Lounge 225 16.8 6.0 153 27.9 8.5
Regional or National Meetings 188 14.0 5.9 160 29.1 4.9
Other 68 5.1 2.6 55 10.1 5.6
(Data source: Weighted samples from the 2018 AUA Annual Census. These results represent those who reported exposure to sexual harassment in the workplace. Respondents could select multiple answers; the total number of choices may not add up to the total number of practicing urologists and the total percentages may not equal 100 percent.)
TABLE 7-7Are There Any Female Partner(s) in Your Practice (by Gender)?
Female Partner(s)
Male Urologists RepresentedFemale Urologists
Represented Total Urologists Represented
NumberPercent
(%)
+/- MOE (%) Number
Percent (%)
+/- MOE (%) Number
Percent (%)
+/- MOE (%)
Yes 5,746 54.8 2.9 808 77.0 6.8 6,554 56.8 2.7
No 4,747 45.2 2.9 241 23.0 6.8 4,988 43.2 2.7
Total Reported
10,493 100.0 1,049 100.0 11,542 100.0
Not Applicable^ or Not Reported
1,000 118 1,118
Total 11,493 1,167 12,660
(Data source: Weighted samples from the 2018 AUA Annual Census. ^Partners may not exist in non-private practices.)

61
TABLE 7-8Do You Have a Domestic Partner (by Gender)?
Domestic Partner
Male Urologists RepresentedFemale Urologists
RepresentedTotal Urologists Represented
NumberPercent
(%)
+/- MOE (%)
NumberPercent
(%)
+/- MOE (%)
NumberPercent
(%)
+/- MOE (%)
Yes 10,320 91.7 1.7 1,066 92.3 3.2 11,386 91.8 1.6
My Domestic Partner/Spouse Is Either Employed or Self-Employed
5,184 46.1 2.7 943 81.6 6.0 6,127 49.4 2.5
My Domestic Partner/Spouse Is Neither Employed nor Self-Employed
5,136 45.7 2.8 123 10.6 5.2 5,259 42.4 2.6
No 928 8.3 1.7 89 7.7 3.2 1,018 8.2 1.6
Total Reported 11,248 100.0 1,156 100.0 12,404 100.0
Not Reported 245 11 256
Total 11,493 1,167 12,660
(Data source: Weighted samples from the 2018 AUA Annual Census.)
TABLE 7-9Who Is Primarily Responsible for Day-to-Day Family Responsibilities (e.g. Caring for Sick Children) (by Gender)?
Day-to-Day Family
Responsibilities
Male Urologists RepresentedFemale Urologists
RepresentedTotal Urologists Represented
NumberPercent
(%)
+/- MOE (%)
NumberPercent
(%)
+/- MOE (%)
NumberPercent
(%)
+/- MOE (%)
Both My Partner and I
4,218 38.9 2.9 481 42.1 7.5 4,699 39.2 2.7
Me 855 7.9 1.7 224 19.6 4.7 1,079 9 1.6
My Partner 5,280 48.8 2.9 281 24.6 5.8 5,562 46.5 2.7
Others 477 4.4 1.1 156 13.6 5.4 633 5.3 1.1
Total Reported 10,831 100.0 1,142 100.0 11,973 100.0
Not Reported 662 25 687
Total 11,493 1,167 12,660
(Data source: Weighted samples from the 2018 AUA Annual Census.)

62 The State of the Urology Workforce and Practice in the United States 2018
TABLE 7-10Does Your Practice Offer Paid Maternity Leave?
Paid Maternity Leave
Practicing Urologists Represented
Number Percent (%) +/- MOE (%)
Yes 5,338 60.4 3.2
No 3,507 39.6 3.2
Total Reported 8,844 100.0
Not Reported 3,816
Total 12,660
(Data source: Weighted samples from the 2018 AUA Annual Census.)
TABLE 7-11Does Your Practice Offer Paid Paternity Leave?
Paid Paternity Leave
Practicing Urologists Represented
Number Percent (%) +/- MOE (%)
Yes 2,313 28.0 2.9
No 5,938 72.0 2.9
Total Reported 8,250 100.0
Not Reported 4,410
Total 12,660
(Data source: Weighted samples from the 2018 AUA Annual Census.)

63
TABLE 7-12How Satisfied Do You Feel with Your Work-Life Balance (by Gender)?
Work-Life Balance
Satisfaction
Male Urologists RepresentedFemale Urologists
RepresentedTotal Urologists Represented
NumberPercent
(%)
+/- MOE (%)
NumberPercent
(%)
+/- MOE (%)
NumberPercent
(%)
+/- MOE (%)
Very Satisfied 1,982 17.4 2.2 79 6.7 3.3 2,060 16.4 2.1
Satisfied 4,305 37.9 2.8 388 33.3 7.6 4,692 37.4 2.6
Neutral 2,175 19.1 2.1 331 28.4 6.6 2,506 20.0 2.0
Dissatisfied 2,074 18.2 2.0 260 22.3 6.1 2,334 18.6 1.9
Very Dissatisfied
832 7.3 1.4 109 9.3 3.7 940 7.5 1.3
Total Reported
11,367 100.0 1,165 100.0 12,533 100.0
Not Reported 125 2 127
Total 11,492 1,167 12,660
(Data source: Weighted samples from the 2018 AUA Annual Census.)

64 The State of the Urology Workforce and Practice in the United States 2018
Section 8: TelemedicinePrimary Observations• Nearly 12 percent of practicing urologists in the United
States participated in a telemedicine program in 2018 (Table 8-1), which is significantly higher than the 8.5 percent in 2016.8
• The top motivation for implementing telemedicine capabilities is to provide care to patients from
underserved areas (Table 8-3).
• A vast majority (83.3 percent) of urologists who currently participate in telemedicine expected their organizations’ telemedicine services to increase in three years (Table 8-5).
TABLE 8-1Telemedicine Program Participation (by Practice Setting)
Practice Setting
Practicing Urologists Represented
Telemedicine Program
ParticipantsTotal Number of Urologists Percent (%) +/- MOE (%)
Private Groups (Solo, Single Urology and Multispecialty Groups)
347 7,013 4.9 1.4
Institutions (Academic Centers, Hospitals, HMO/Managed Care Organizations)
1,133 5,587 20.3 3.3
Total Reported 1,479 12,600 11.7 1.7
Not Reported 60
Total 12,660
(Data source: Weighted samples from the 2018 AUA Annual Census.)
TABLE 8-2What Percentage of Your Encounters Are Considered Telemedicine?
Percent of Telemedicine Encounters
Practicing Urologists Represented
Number Percent (%) +/- MOE (%)
< 5 1,108 74.9 6.1
5-10 244 16.5 5.3
11-20 81 5.5 *
> 20 46 3.1 *
Total 1,479 100.0
(Data source: Weighted samples from the 2018 AUA Annual Census. These results represent those who reported participating in telemedicine. *Represents the estimated value should be used with caution due to small samples.)

65
TABLE 8-3What Is Your Organization’s Primary Motivation for Implementing Telemedicine Capabilities?
Primary Motivation
Practicing Urologists Represented
Number Percent (%) +/- MOE (%)
Providing Care to Patients from Underserved Areas
906 61.2 5.0
Fully Utilizing Existing Operational Capacity
581 39.3 6.3
Providing Competitive Advantage Regionally
554 37.5 7.8
Improving Quality of Care for Patients from Underserved Areas
542 36.6 5.8
Seeing More Patients to Increase Revenue/Profitability
384 26.0 5.5
Conducting Research and Other Academic Activities
162 11.0 3.4
Others 192 13.0 3.5
(Data source: Weighted samples from the 2018 AUA Annual Census. These results represent those who reported participating in telemedicine. Respondents could select multiple answers; the total number of choices may not add up to the total number of practicing urologists and the total percentages may not equal 100 percent.)
TABLE 8-4What Are the Significant Concerns Regarding Reimbursement for Telemedicine Services?
Concerns Regarding Reimbursement for Telemedicine Services
Practicing Urologists Represented
Number Percent (%) +/- MOE (%)
There Is No or Insufficient Reimbursement from Medicare 714 48.2 7.9
There Is No or Insufficient Reimbursement from Medicaid 604 40.8 7.9
There Is No or Insufficient Reimbursement from PPO Fee for Service
562 38.0 5.8
There Is No or Insufficient Reimbursement from Other Payers 640 43.2 7.4
Other Concerns 24 1.6 *
No Concerns Regarding Reimbursement 629 42.5 7.4
(Data source: Weighted samples from the 2018 AUA Annual Census. These results represent those who reported participating in a telemedicine program. Respondents could select multiple answers; the total number of choices may not add up to the total number of practicing urologists and the total percentages may not equal 100 percent. *Represents the estimated value should be used with caution due to small samples.)

66 The State of the Urology Workforce and Practice in the United States 2018
TABLE 8-5How Do You Anticipate Your Organization Will Utilize Telemedicine Services Three Years from Now?
Future Use of Telemedicine
Practicing Urologists Represented
Number Percent (%) +/- MOE (%)
Increase 1,188 83.3 6.3
Same/Decrease 239 16.7 6.3
Total 1,427 100.0
(Data source: Weighted samples from the 2018 AUA Annual Census. These results represent those who reported participating in a telemedicine program.)

67
Section 9: Quality Improvement and Use of Electronic Health Record Systems Primary Observations• Of practicing urologists, 85 percent reported their
practices took steps to incorporate Quality Payment Program (QPP) participation (via the Merit-based Incentive Payment System [MIPS] or an Alternative Payment Model [APM]) into their practice (Table 9-1). To do so, the majority of practices upgraded or purchased a new EHR system or committed new resources (Table 9-2).
• The top three quality programs in which urologists participated in the past 12 months included standardization of clinical care through protocols or
guidelines, participation in a morbidity and mortality conferences and collection of quality metrics for internal review (Table 9-3).
• Approximately 95 percent of practicing urologists used an Electronic Health Record (EHR) system in their practices in 2018 (Table 9-7), an increase from 91.9 percent in 2014. Lower utilization was found in male urologists 45 years of age or older (Figure 9-1) and urologists in solo practices (Figure 9-2).
TABLE 9-1Is Your Practice Taking Steps to Incorporate the MIPS or an APM?
Taking Steps
Practicing Urologists Represented
Number Percent (%) +/- MOE (%)
Yes 6,951 85.0 2.6
No 1,231 15.0 2.6
Total Reported 8,182 100.0
Not Applicable to My Practice^ 999
Not Reported 3,479
Total 12,660
(Data source: Weighted samples from the 2018 AUA Annual Census. ^Practices within large institutions may not have direct reporting responsibility.)

68 The State of the Urology Workforce and Practice in the United States 2018
TABLE 9-2What Changes Have You Made to Your Practice to Incorporate the MIPS or an APM?
Changes Made
Practicing Urologists Represented
Number Percent (%) +/- MOE (%)
Upgraded or Purchased a New EHR System 3,409 49.0 3.5
Committed New Resources 3,222 46.4 3.6
Committed Other Financial Resources 1,846 26.6 3.1
Hired More Full Time Staff 1,420 20.4 2.8
Hired Part Time Staff 707 10.2 2.0
Purchased New Equipment 653 9.4 2.0
Others 380 5.5 1.4
No Change Has Been Made 1,249 18.0 2.8
(Data source: Weighted samples from the 2018 AUA Annual Census. These results represent those who reported that their practices made steps to incorporate MIPS/APM into the practice. Respondents could select multiple answers; the total number of choices may not add up to the total number of practicing urologists and the total percentages may not equal 100 percent.)
TABLE 9-3What Quality Programs Have You/Your Practice Participated in Over the Last 12 Months?
Quality Programs
Practicing Urologists Represented
Number Percent (%) +/- MOE (%)
Standardization of Clinical Care through Protocols or Guidelines
6,767 53.4 2.7
Morbidity and Mortality Conferences 6,736 53.2 2.7
Collection of Quality Metrics for Internal Review 6,719 53.1 2.6
Quality Education Curriculum 5,013 39.6 2.7
Structured Case Review 4,107 32.4 2.5
Collection of Quality Metrics for Public Reporting 3,851 30.4 2.4
None of the Above 1,742 13.8 2.1
Others 209 1.6 0.7
(Data source: Weighted samples from the 2018 AUA Annual Census. These results represent those who reported that their practices made steps to incorporate MIPS/APM into the practice. Respondents could select multiple answers; the total number of choices may not add up to the total number of practicing urologists and the total percentages may not equal 100 percent.)

69
TABLE 9-4What Patient Safety Initiatives Have You/Your Practice Participated in Over the Last 12 Months?
Patient Safety Initiatives
Practicing Urologists Represented
Number Percent (%) +/- MOE (%)
Morbidity and Mortality Conferences 6,730 53.2 2.7
Patient Safety Event Reporting System 5,957 47.1 2.7
Systematic Analysis of a Near Miss, Close Call, or Adverse Event
4,691 37.1 2.6
Patient Safety Education Curriculum 4,099 32.4 2.6
Patient Safety Culture Survey 3,675 29.0 2.5
Patient Safety Focused Management Conference 3,142 24.8 2.3
None of the Above 2,652 20.9 2.3
Others 124 1.0 *
(Data source: Weighted samples from the 2018 AUA Annual Census. Respondents could select multiple answers; the total number of choices may not add up to the total number of practicing urologists and the total percentages may not equal 100 percent. *Represents the estimated value should be used with caution due to small samples.)
TABLE 9-5Which of the Following Quality and Patient Safety Domains Are Present Within Your Practice Group?
Quality and Patient Safety Domains
Practicing Urologists Represented
Number Percent (%) +/- MOE (%)
Quality Officer 5,572 44.0 2.7
Regular Use of Quality Improvement Tools to Change Practice
4,932 39.0 2.7
Patient Safety Officer 4,346 34.3 2.6
Regular Use of Patient Safety Tools to Change Practice 3,542 28.0 2.4
Detailed Quality Improvement Strategy with Specific Aims to Change Practice
3,524 27.8 2.4
Learning Collaborative that Shares Best Practices to Change Practice
3,318 26.2 2.3
Detailed Patient Safety Strategy with Specific Aims to Change Practice
2,486 19.6 2.0
Others 127 1.0 0.5
None of the Above 2,924 23.1 2.4
(Data source: Weighted samples from the 2018 AUA Annual Census. Respondents could select multiple answers; the total number of choices may not add up to the total number of practicing urologists and the total percentages may not equal 100 percent.)

70 The State of the Urology Workforce and Practice in the United States 2018
TABLE 9-6Number of Hours Devoted to Learning about the Science of Patient Safety or Quality Improvement Methodology Over the Past 12 Months
Number of Hours
Practicing Urologists Represented
Number Percent (%) +/- MOE (%)
None 1,450 11.9 1.9
< 1 1,580 13.0 1.9
1-4 5,782 47.6 2.8
5-9 1,786 14.7 2.1
≥ 10 1,543 12.7 1.8
Total Reported 12,141 100.0
Not Reported 519
Total 12,660
(Data source: Weighted samples from the 2018 AUA Annual Census.)
TABLE 9-7Do You Use an Electronic Health Record (EHR) System in Your Practice?
Use of EHR
Practicing Urologists Represented
Number Percent (%) +/- MOE (%)
Yes 12,027 95.3 1.4
No 598 4.7 1.4
Total Reported 12,625 100.0
Not Reported 35
Total 12,660
(Data source: Weighted samples from the 2018 AUA Annual Census.)

71
FIGURE 9-1Do You Use an EHR System in Your Practice (by Gender and Age)?
0% 10% 20% 30% 40% 50% 60% 70% 80% 90% 100%
Male≥ 45
Female≥ 45
Male< 45
Female< 45
GEN
DER
AN
D A
GE
PERCENT
99.3%
99.3%
97.4%
93.6%
98.2% 100.0%
100.0%98.6%
95.7% 99.1%
91.6% 95.6%
(Data source: Weighted samples from the 2018 AUA Annual Census. Bold numbers are point estimates. The dashed bars represent upper and lower 90% confidence limits.)
TABLE 9-8Use of a Medical Scribe in Your Practice for EHR Documentation
Use of Medical Scribes
Practicing Urologists Represented
Number Percent (%) +/- MOE (%)
Yes 2,197 18.5 2.1
No 9,659 81.5 2.1
Total Reported 11,856 100.0
Not Reported 171
Total 12,027
(Data source: Weighted samples from the 2018 AUA Annual Census. The results represent those who reported that they use an EHR in their practice.)

72 The State of the Urology Workforce and Practice in the United States 2018
FIGURE 9-2Do You Use an EHR System in Your Practice (by Practice Setting)?
0% 10% 20% 30% 40% 50% 60% 70% 80% 90% 100%
Institutions
MultispecialtyGroups
Single Urology Groups
SoloPractices
PRA
CTI
CE
SETT
ING
PERCENT
77.1%
95.5%
95.7%
98.9%
67.9% 86.3%
93.3% 97.7%
91.8% 99.6%
97.6% 100.0%
(Data source: Weighted samples from the 2018 AUA Annual Census. Bold numbers are point estimates. The dashed bars represent upper and lower 90% confidence limits.)
TABLE 9-9Reasons for Using a Medical Scribe for EHR Documentation
Reasons
Practicing Urologists Represented
Number Percent (%) +/- MOE (%)
Improve Clinic Workflow/Efficiency 1,672 76.1 5.4
Decrease Overall Documentation Time 1,601 72.9 5.1
Improve Providers’ Quality of Life 1,576 71.7 5.7
Increase Productivity 1,436 65.4 5.9
Reduce Transcription Errors 311 14.1 4.6
Other 176 8.0 2.9
(Data source: Weighted samples from the 2018 AUA Annual Census. The results represent those who reported using a medical scribe for EHR documentation. Respondents could select multiple answers; the total number of choices may not add up to the total number of practicing urol-ogists and the total percentages may not equal 100 percent.)

73
TABLE 9-10Does Using an EHR Increase the Quality and Accuracy of Your Work?
Increase the Quality and Accuracy of Work
Practicing Urologists Represented
Number Percent (%) +/- MOE (%)
Strongly Agree 1,335 11.1 1.7
Agree 3,634 30.2 2.6
Neutral 2,927 24.3 2.3
Disagree 2,612 21.7 2.3
Strongly Disagree 1,520 12.6 1.9
Total 12,027 100.0
(Data source: Weighted samples from the 2018 AUA Annual Census. The results represent those who reported that they use an EHR in their practice.)
TABLE 9-11Using an EHR Has Enhanced My Productivity
Productivity Enhancement
Practicing Urologists Represented
Number Percent (%) +/- MOE (%)
Strongly Agree 913 7.6 1.4
Agree 1,883 15.7 2.0
Neutral 2,266 18.8 2.2
Disagree 3,972 33.0 2.6
Strongly Disagree 2,994 24.9 2.4
Total 12,027 100.0
(Data source: Weighted samples from the 2018 AUA Annual Census. The results represent those who reported that they use an EHR in their practice.)

74 The State of the Urology Workforce and Practice in the United States 2018
TABLE 9-12If the AUA Could Produce Templates for Specific Visit Types for Your EHR (e.g., Localized Prostate Cancer, Overactive Bladder [OAB]), Would You Use Them in Your Practice?
Use of EHR Templates
Practicing Urologists Represented
Number Percent (%) +/- MOE (%)
Yes 9,254 88.6 1.9
I Am Confident That the Templates Could Be Inserted into My EHR
4,245 40.6 3.0
I Am Not Confident That the Templates Could Be Inserted into My EHR
5,009 48.0 3.0
No 1,191 11.4 1.9
Total Reported 10,445 100.0
Not Reported 2,215
Total 12,660
(Data source: Weighted samples from the 2018 AUA Annual Census. The results represent those who reported using an EHR in their practice.)

75
Section 10: Prescription of Opioids Primary Observations• Approximately 90 percent of practicing urologists
prescribed opioids for their patients undergoing surgical procedures (Table 10-1).
• Nearly 15 percent of practicing urologists prescribe opioids based on procedure-specific guidance developed
by their practice or institution (Table 10-2).
• Nearly three-fourths of urologists decreased their number of opioid prescriptions compared to three years ago for patients undergoing surgical procedures (Table 10-4).
TABLE 10-1Do You Prescribe Opioids for Patients Undergoing Surgical Procedures?
Prescription of Opioids
Practicing Urologists Represented
Number Percent (%) +/- MOE (%)
Yes 11,205 89.4 1.9
No 1,334 10.6 1.9
Total Reported 12,539 100.0
Not Reported 121
Total 12,660
(Data source: Weighted samples from the 2018 AUA Annual Census.)
TABLE 10-2I Choose the Number of Opioid Pills at Discharge Due to the Following Reasons
Reasons
Practicing Urologists Represented
Number Percent (%) +/- MOE (%)
This Worked Well for My Patients in the Past
9,554 85.3 2.1
I Want to Avoid Patients Having to Call My Office During Their Recovery
2,665 23.8 2.4
My Practice/Institution Developed Guidelines for Procedure-Specific Prescribing
1,647 14.7 2.1
(Data source: Weighted samples from the 2017 AUA Annual Census. The results represent those who reported prescribing opiods for patients undergoing surgical procedures.)

76 The State of the Urology Workforce and Practice in the United States 2018
TABLE 10-3How Many Opioid Pills, on Average, Do You Prescribe (by Procedure)?
Number of Pills by Procedure
Practicing Urologists Represented
Number Percent (%) +/- MOE (%)
Open Abdominal Surgery
None 111 1.2 *
≤10 1,386 15.3 2.2
>10 7,557 83.5 2.3
Total 9,053 100.0
Laparoscopic Surgery
None 349 4.8 1.7
≤10 2,266 31.3 3.1
>10 4,615 63.8 3.2
Total 7,230 100.0
Scrotal Surgery
None 917 8.5 1.7
≤10 4,802 44.3 2.9
>10 5,116 47.2 2.9
Total 10,835 100.0
Endoscopic Surgery
None 2,256 21.2 2.4
≤10 4,491 42.1 2.9
>10 3,913 36.7 2.7
Total 10,660 100.0
Pelvic Floor Surgery
None 438 6.6 1.8
≤10 2,377 35.6 3.3
>10 3,860 57.8 3.4
Total 6,675 100.0
(Data source: Weighted samples from the 2018 AUA Annual Census. The results represent those who reported prescribing opioids for patients undergoing surgical procedures. *Represents the estimated value should be used with caution due to small samples.)

77
TABLE 10-4Compared to Three Years Ago, How Has the Number of Opioid Prescriptions You Prescribe for Patients Undergoing Surgical Procedures Changed?
Changes in Opioid Prescription
Practicing Urologists Represented
Number Percent (%) +/- MOE (%)
Increased 96 0.9 *
Remained Unchanged 2,999 26.8 2.6
Decreased 8,078 72.3 2.6
Total 11,173 100.0
(Data source: Weighted samples from the 2018 AUA Annual Census. The results represent those who reported prescribing opioids for patients undergoing surgical procedures. *Represents the estimated value should be used with caution due to small samples.)

78 The State of the Urology Workforce and Practice in the United States 2018
ContributorsPRINCIPAL PHYSICIAN ADVISORS: Steven M. Schlossberg, MD, MBA – Data Committee Chair
David F. Penson, MD, MPH – Science and Quality Council Chair
Patrick McKenna, MD – Workforce Work Group Chair
Christopher M. Gonzalez, MD, MBA – Public Policy Council Chair
Danil V. Makarov, MD, MHS – Data Committee Chair-Elect
PROJECT OVERSIGHT:Heddy Hubbard, PhD, MPH, RN, FAAN – Executive Vice President for Research, Quality and Scientific Affairs and Chief Science Officer, Program Advisor
PROJECT TEAM: Raymond Fang, MSc, MASc – Data Director, Principal Investigator
William Meeks III, MA – Data Operations Manager, Survey Programming and Statistical Analysis
Roxann Nottingham – Communication and Outreach Coordinator, Project Coordination and Communication
Daniel Pichardo – Manager, Data Analysis
Keonna Confesor, MSc – Data Support Specialist, Project Administration
Erin Kirkby, MSc – Medical Writer and Guidelines Manager, Report Editing
ADVISORY GROUPS: AUA Data Committee
AUA Workforce Work Group
KEY CONTRIBUTORS: (IN ALPHABETICAL ORDER)Jennifer T. Anger, MD
Timothy D. Averch, MD
Benjamin N. Breyer, MD, FACS
Thomas Chi, MD
Peter E. Clark, MD
Matthew R. Cooperberg, MD, MPH
Julie Franc-Guimond, MD
Matthew T. Gettman, MD
Gerald H. Jordan, MD, FAAP, FACS, FRCS
Melise A. Keays, MD
Amanda C. North, MD
Sandip Prasad, MD, MPHIL
Raj Pruthi, MD
Sanoj Punnen, MD

79
Matthew J. Resnick, MD, MPH
Eugene Rhee, MD
Jennifer Robles, PhD
Daniel J. Sadowski, MD
Jeremy B. Shelton, MD
Aaron Spitz, MD
Ronald S. Suh, MD
KEY STAFF COLLABORATORS: (IN ALPHABETICAL ORDER)Diane Bieri, JD – Vice President and General Counsel
Christine Frey – Senior Corporate Communications Manager
Wendy Isett – Manager, Advocacy Communications
Jessica Kessler – Marketing Coordinator
Suzanne Pope, MBA – Director for Quality
Bradley Stine – Director, Legislative and Political Affairs
Joshua Webster, MPA – Manager, Legislative and Political Affairs

80 The State of the Urology Workforce and Practice in the United States 2018
Reference1 US Census Quick Facts, https://www.census.gov/quickfacts/fact/table/US/IPE120217 accessed 1/12/2019.
2 Health Resources and Service Administration, the Department of Agriculture and WWAMI Rural Health Research Center. Zip Code Rural-Urban Commuting Area Codes (RUCAs) Approximation Version 3.10. (April 1, 2015). Last Accessed on January 12, 2019 from http://depts.washington.edu/uwruca/ruca-approx.php.
3 Groves, RM et al. (2009). Survey Methodology, Hoboken, NJ: John Wiley & Sons.
4 American Urological Association. Practicing Urologists across the Globe, 2016 https://www.auanet.org/research/research-resources/aua-census/census-results.
5 National Center for Research Methods (January 27, 2015). Adjusting for Non-response by Weighting. Retrieved from http://factfinder.census.gov/faces/tableservices/jsf/pages/productview.xhtml?pid=ACS_13_5YR_B01003&prod-Type=table.
6 Hogg, RV et al. (2014). Probability and Statistical Inference (9th Edition). Pearson Higher Ed.
7 US Census Quick Facts, https://www.census.gov/quickfacts/fact/table/US/IPE120217 accessed 1/12/2019.
8 American Urological Association, The State of the Urology Workforce and Practice in the United States 2016. https://www.auanet.org/Documents/research/census/DAT-17-2058%20Census%20Book%202016.pdf. Last ac-cessed on January 3, 2019.

81
Contact AUA at [email protected]
or visit AUAnet.org/Statistics
AUA Statistical Services
AUA provides members with full statistical services:
• Study design
• Data collection
• Data analysis
• Data reporting
• Data presentation