Embed Size (px)
Citation preview

THE STATE OF THE INTERNATIONAL TRAVELER2017
THE STATE OF THE INTERNATIONAL TRAVELER
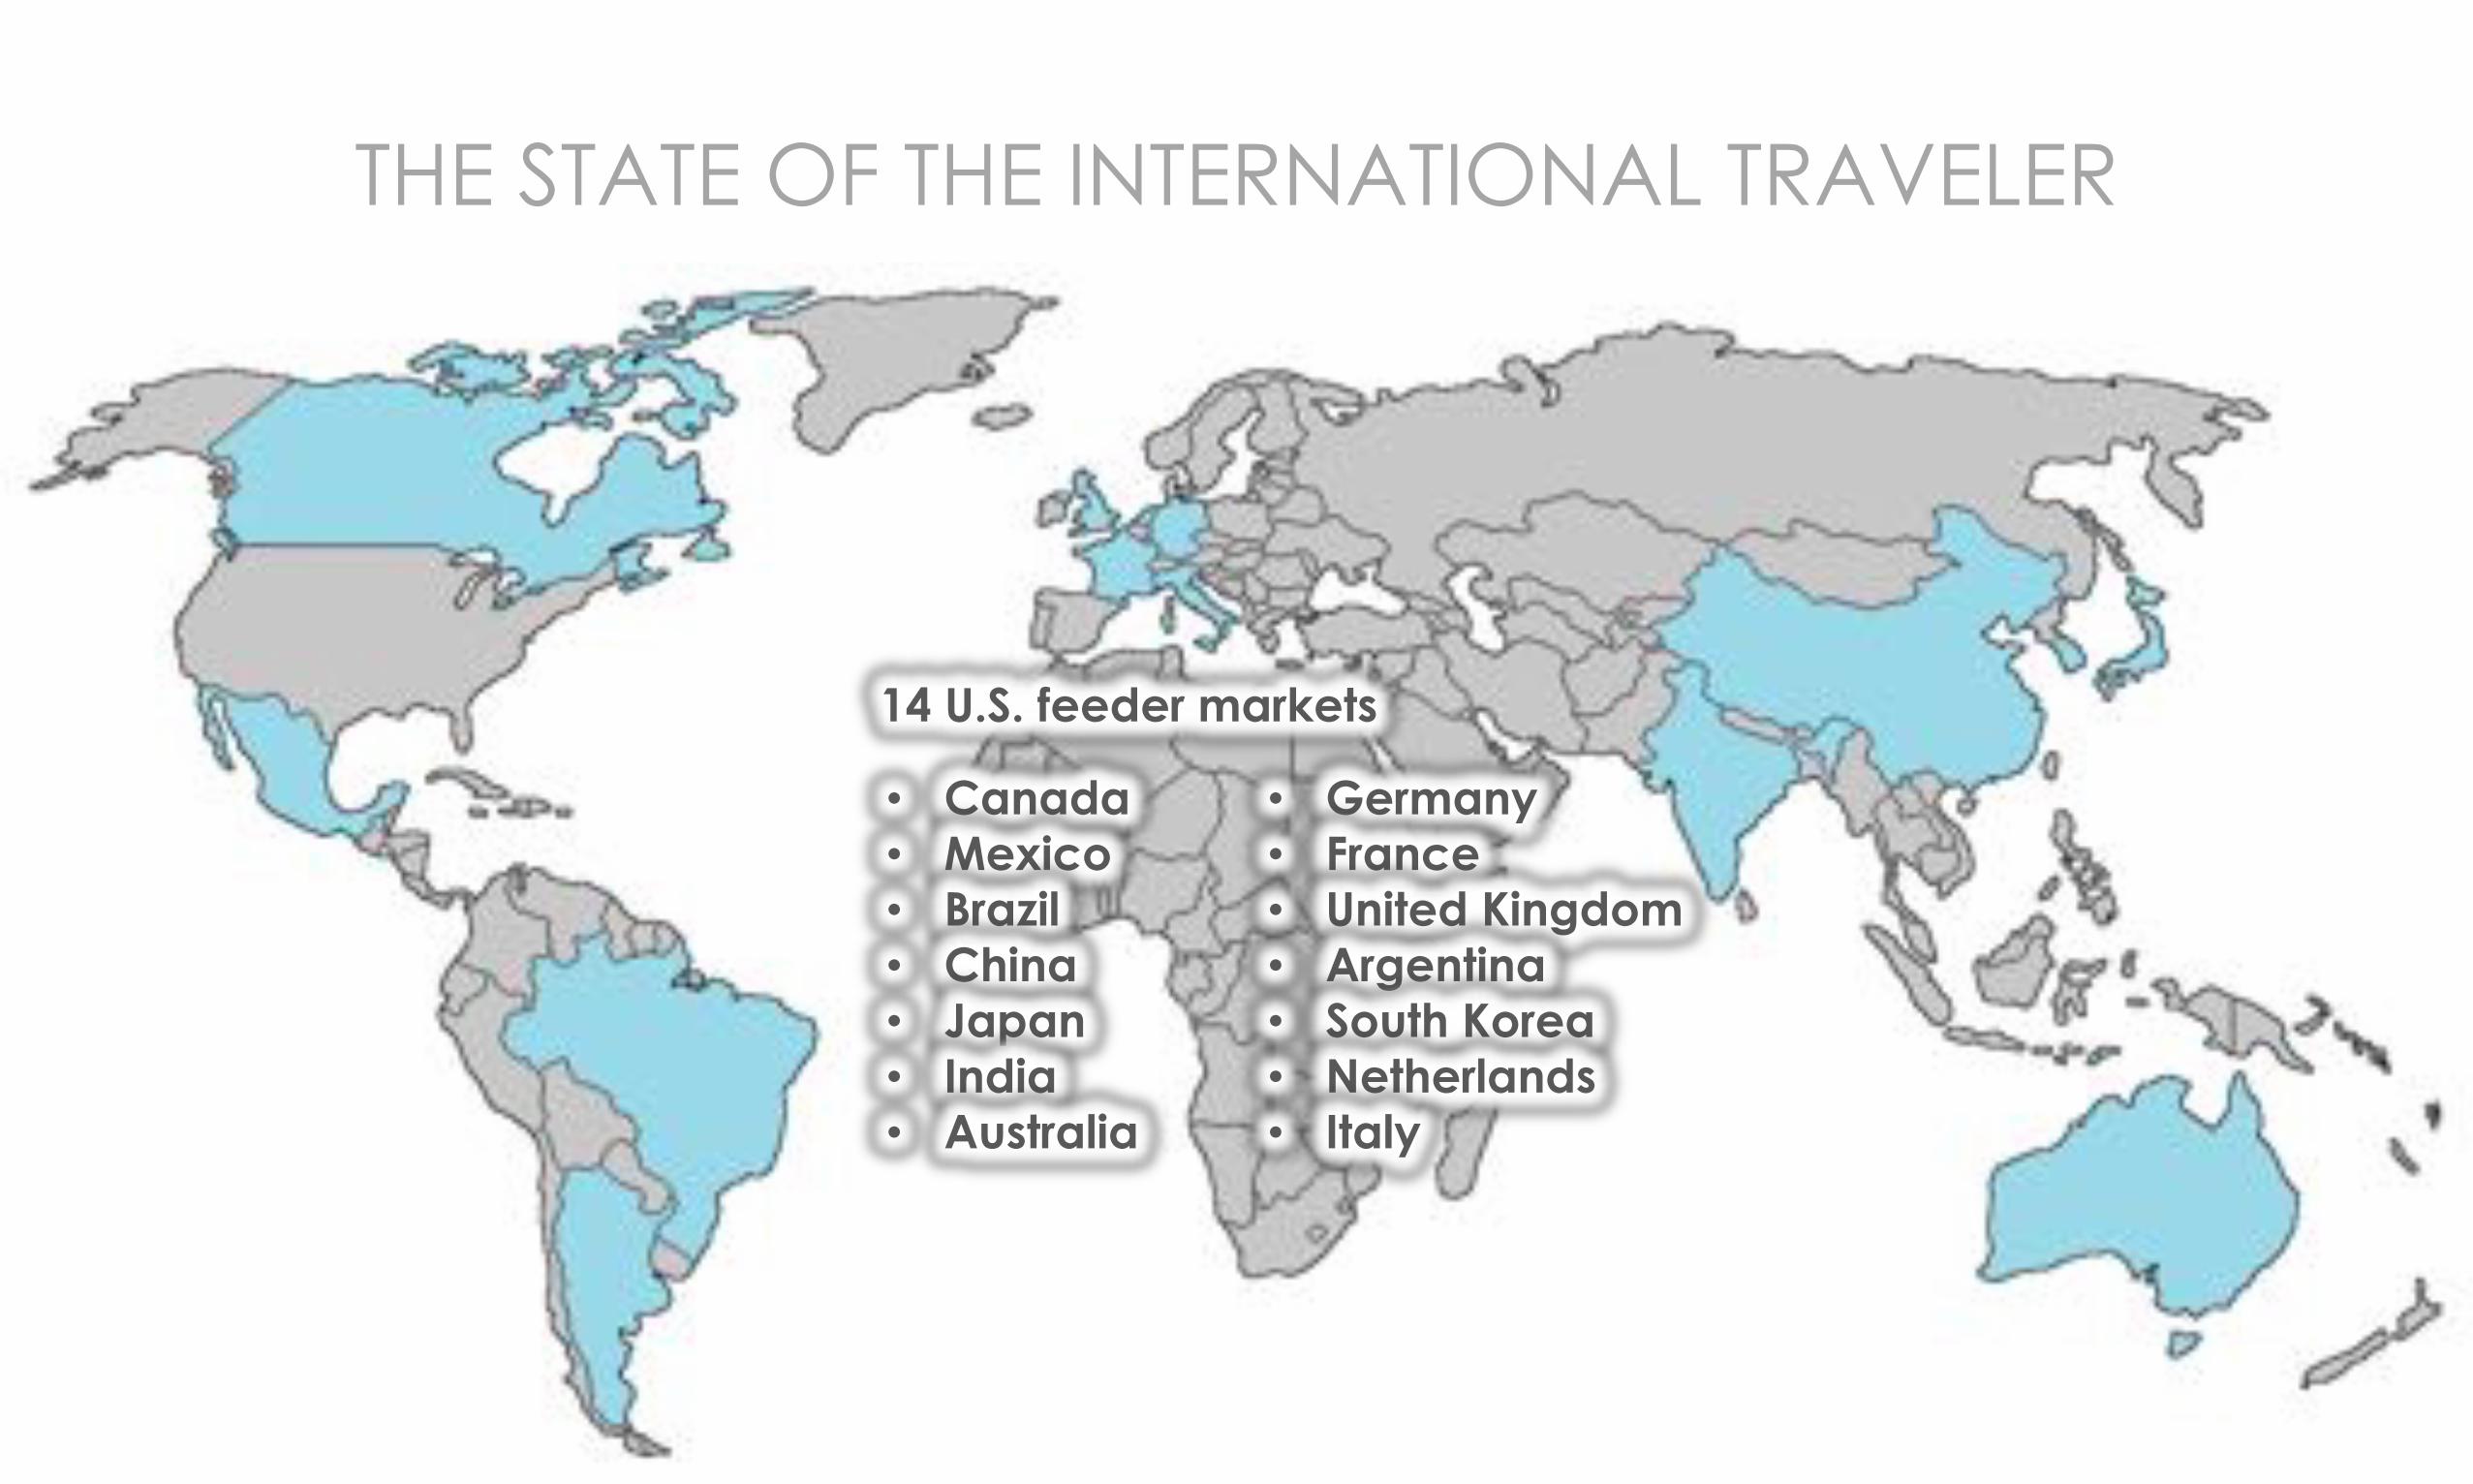
• Canada• Mexico• Brazil• China• Japan• India• Australia
• Germany• France• United Kingdom• Argentina• South Korea• Netherlands• Italy
14 U.S. feeder markets
THE STATE OF THE INTERNATIONAL TRAVELER
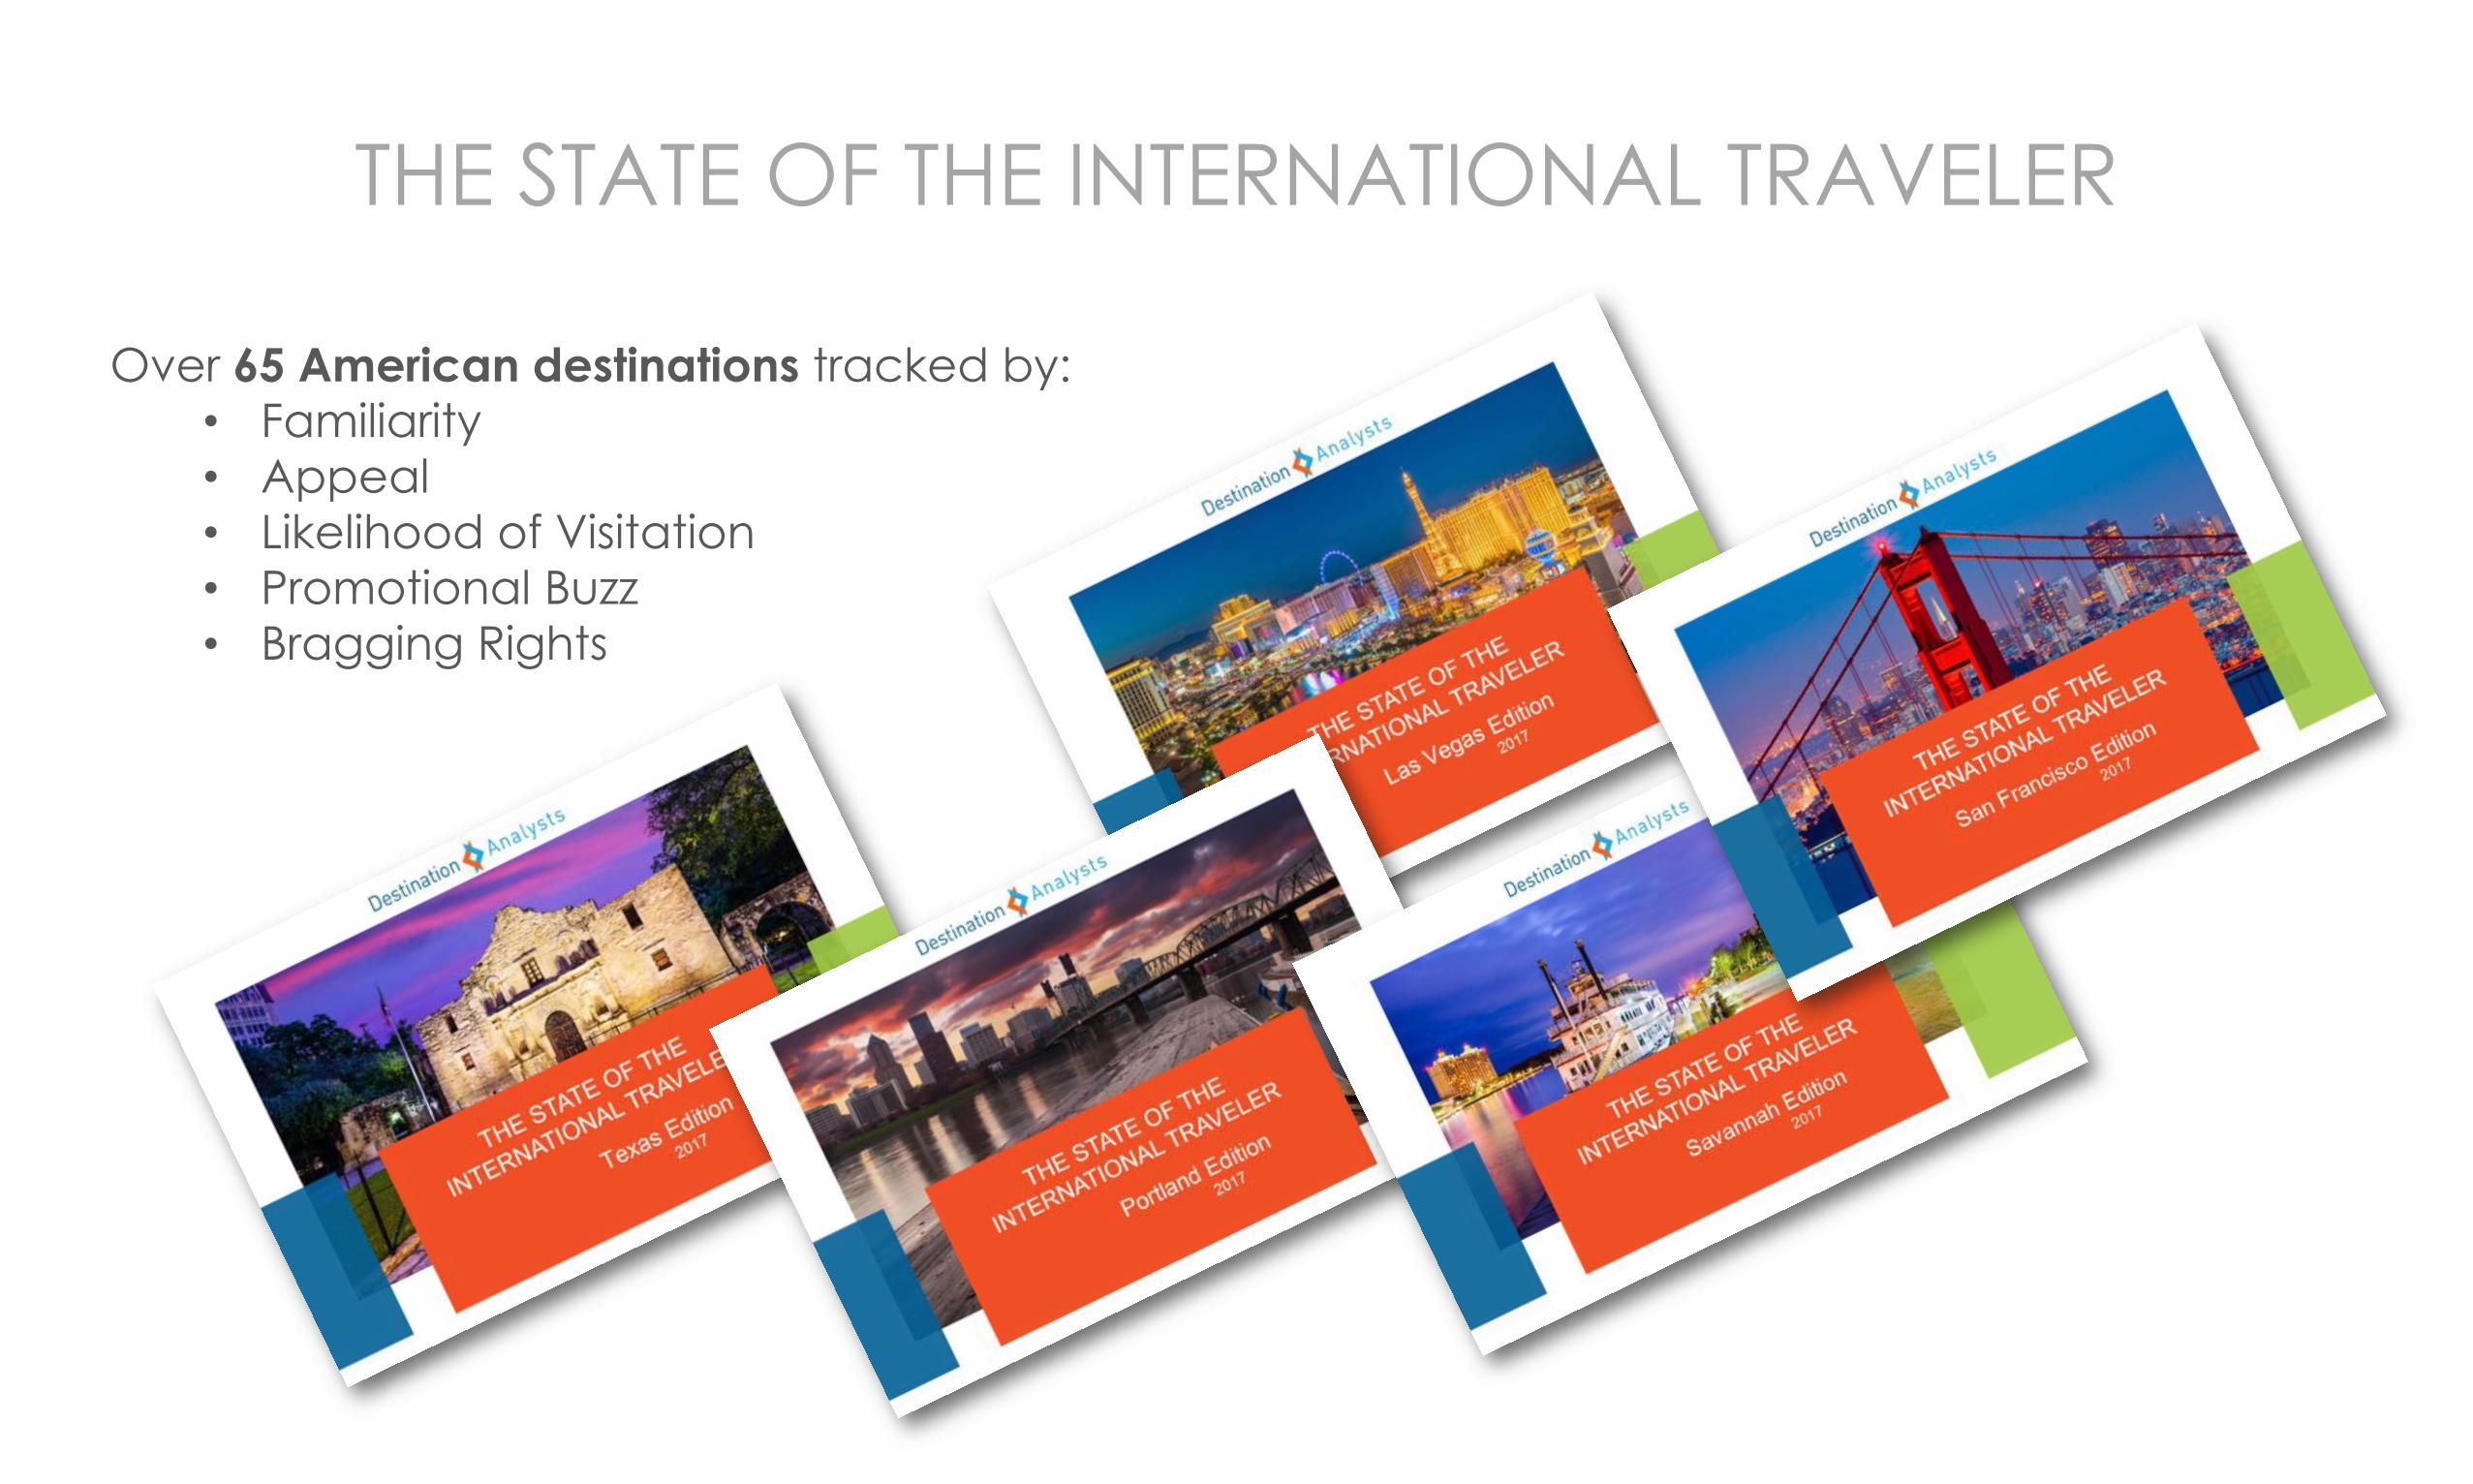
Over 65 American destinations tracked by:• Familiarity• Appeal• Likelihood of Visitation• Promotional Buzz• Bragging Rights

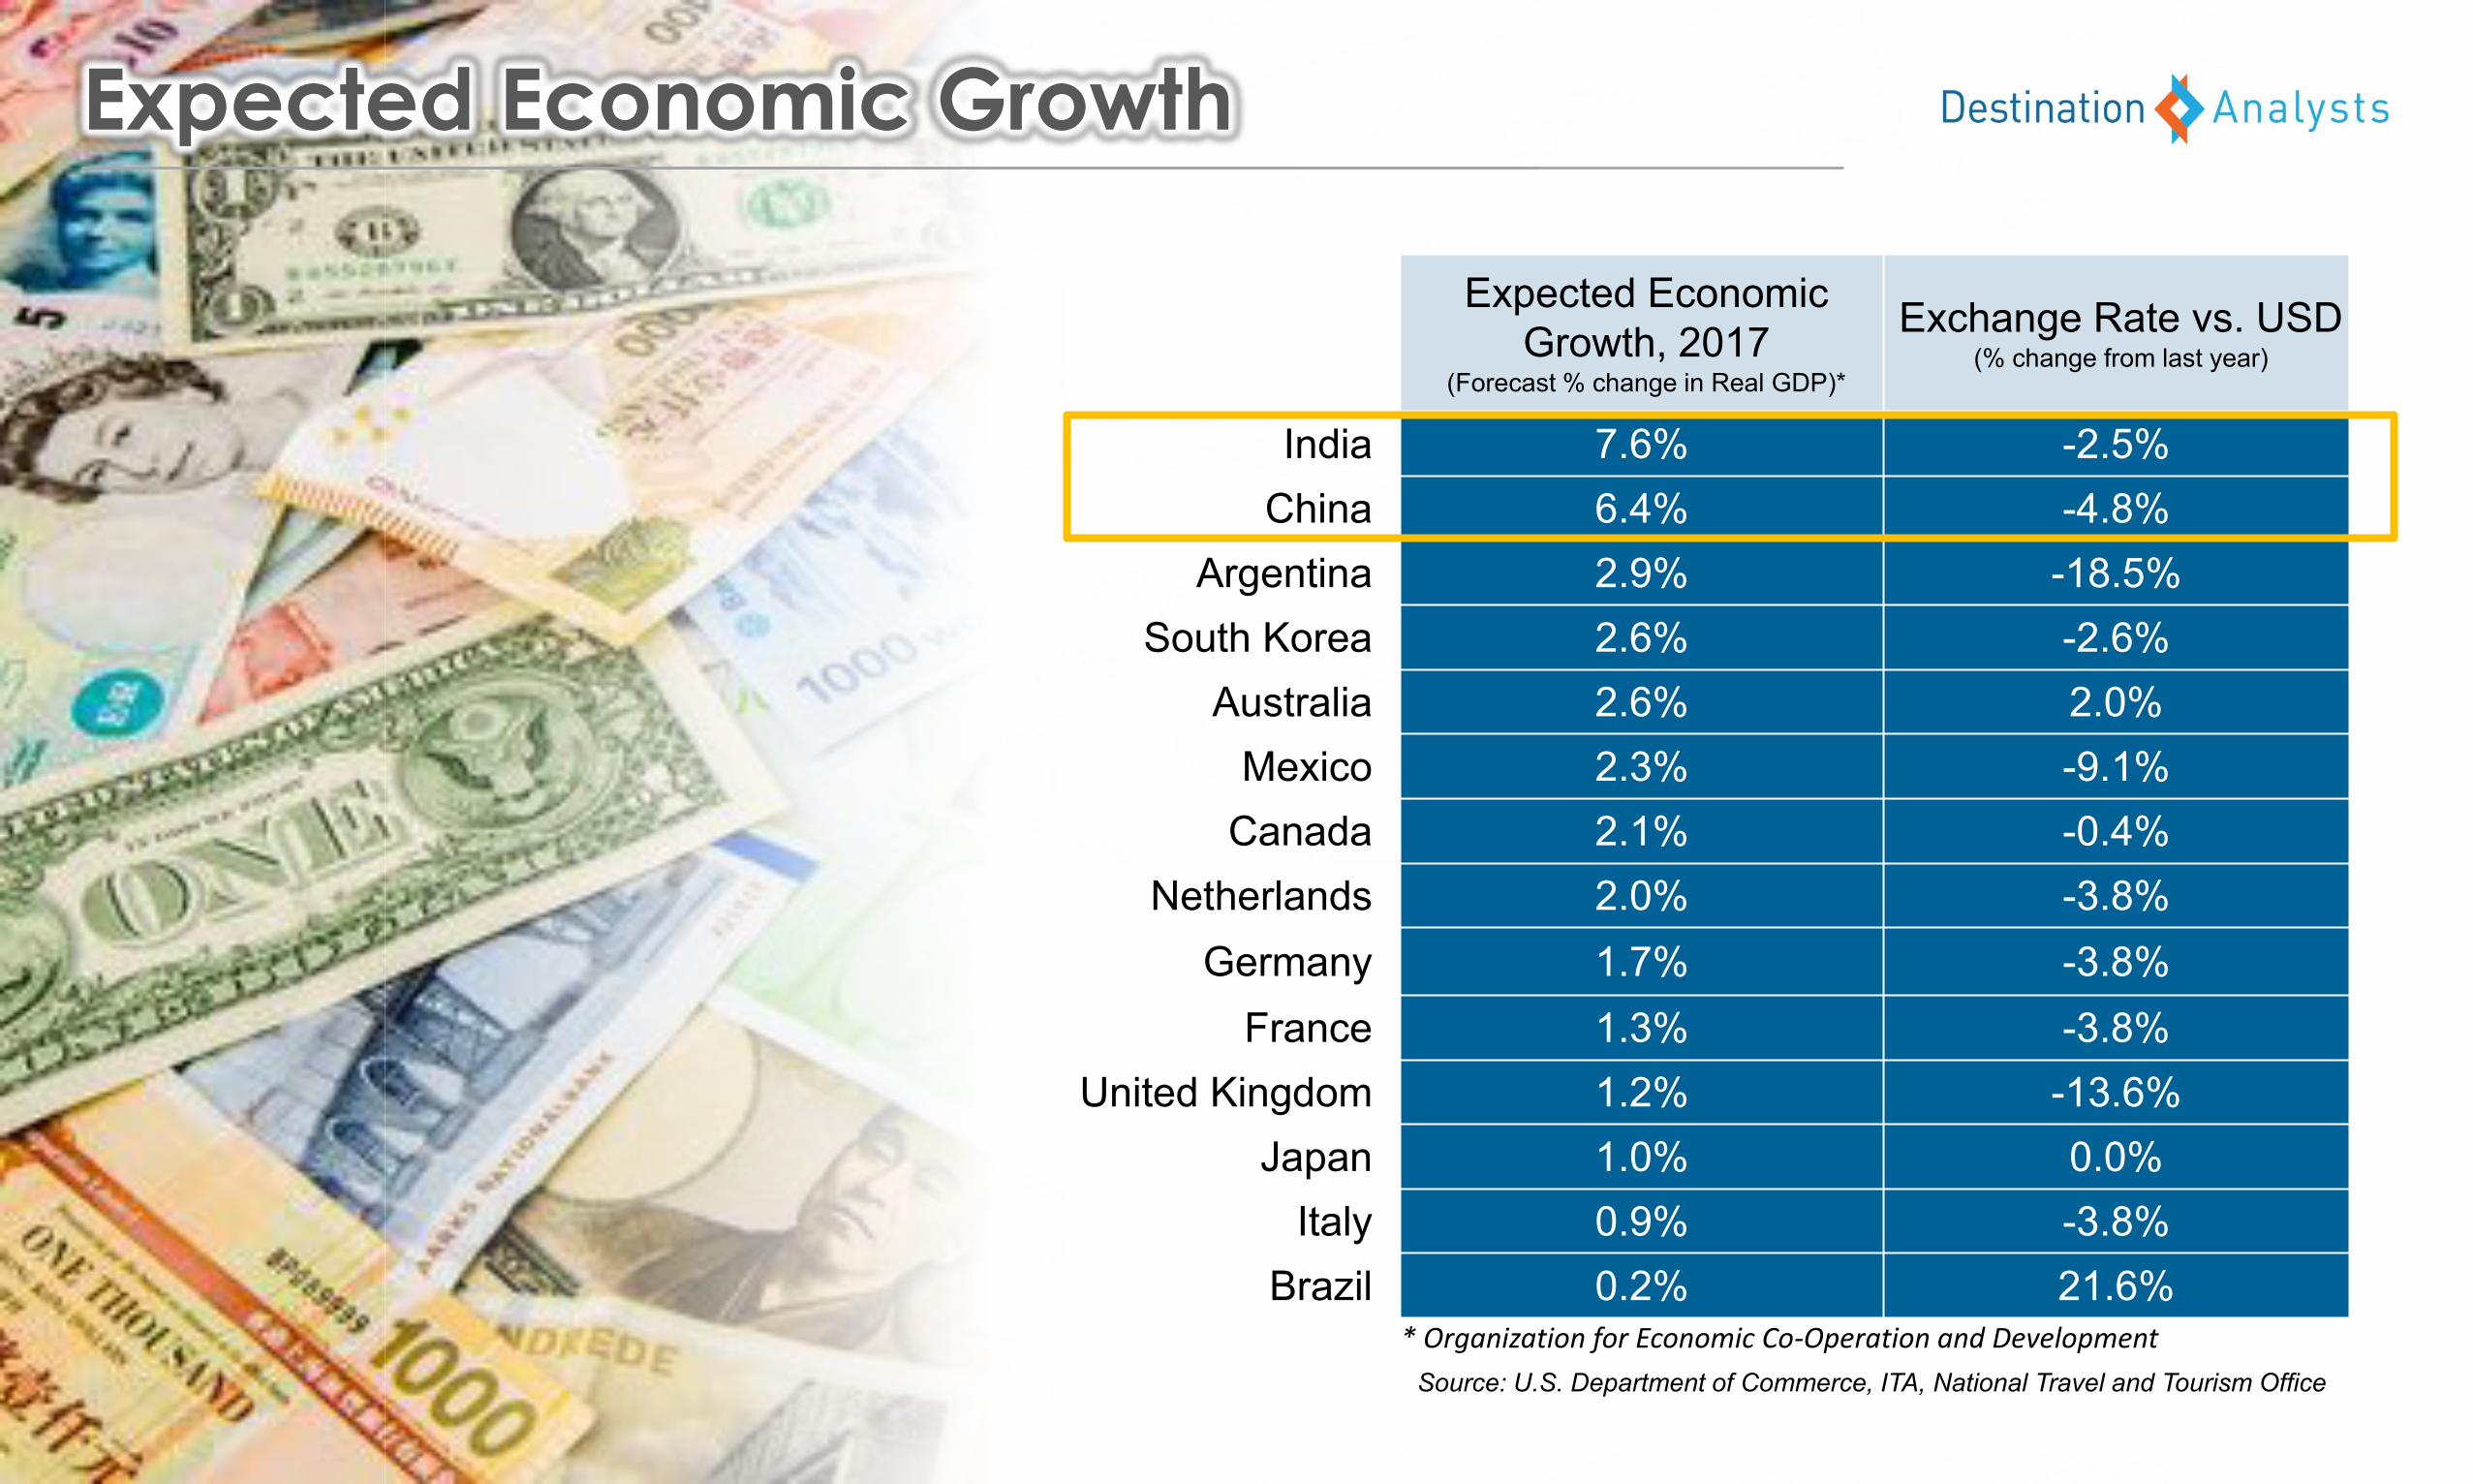
Expected Economic Growth, 2017
(Forecast % change in Real GDP)*
Exchange Rate vs. USD (% change from last year)
India 7.6% -2.5%China 6.4% -4.8%
Argentina 2.9% -18.5%South Korea 2.6% -2.6%
Australia 2.6% 2.0%Mexico 2.3% -9.1%
Canada 2.1% -0.4%Netherlands 2.0% -3.8%
Germany 1.7% -3.8%France 1.3% -3.8%
United Kingdom 1.2% -13.6%Japan 1.0% 0.0%
Italy 0.9% -3.8%Brazil 0.2% 21.6%
* Organization for Economic Co-Operation and DevelopmentSource: U.S. Department of Commerce, ITA, National Travel and Tourism Office
Expected Economic Growth
COUNTRY OF RESIDENCE
NUMBER OF ARRIVALS % CHANGE
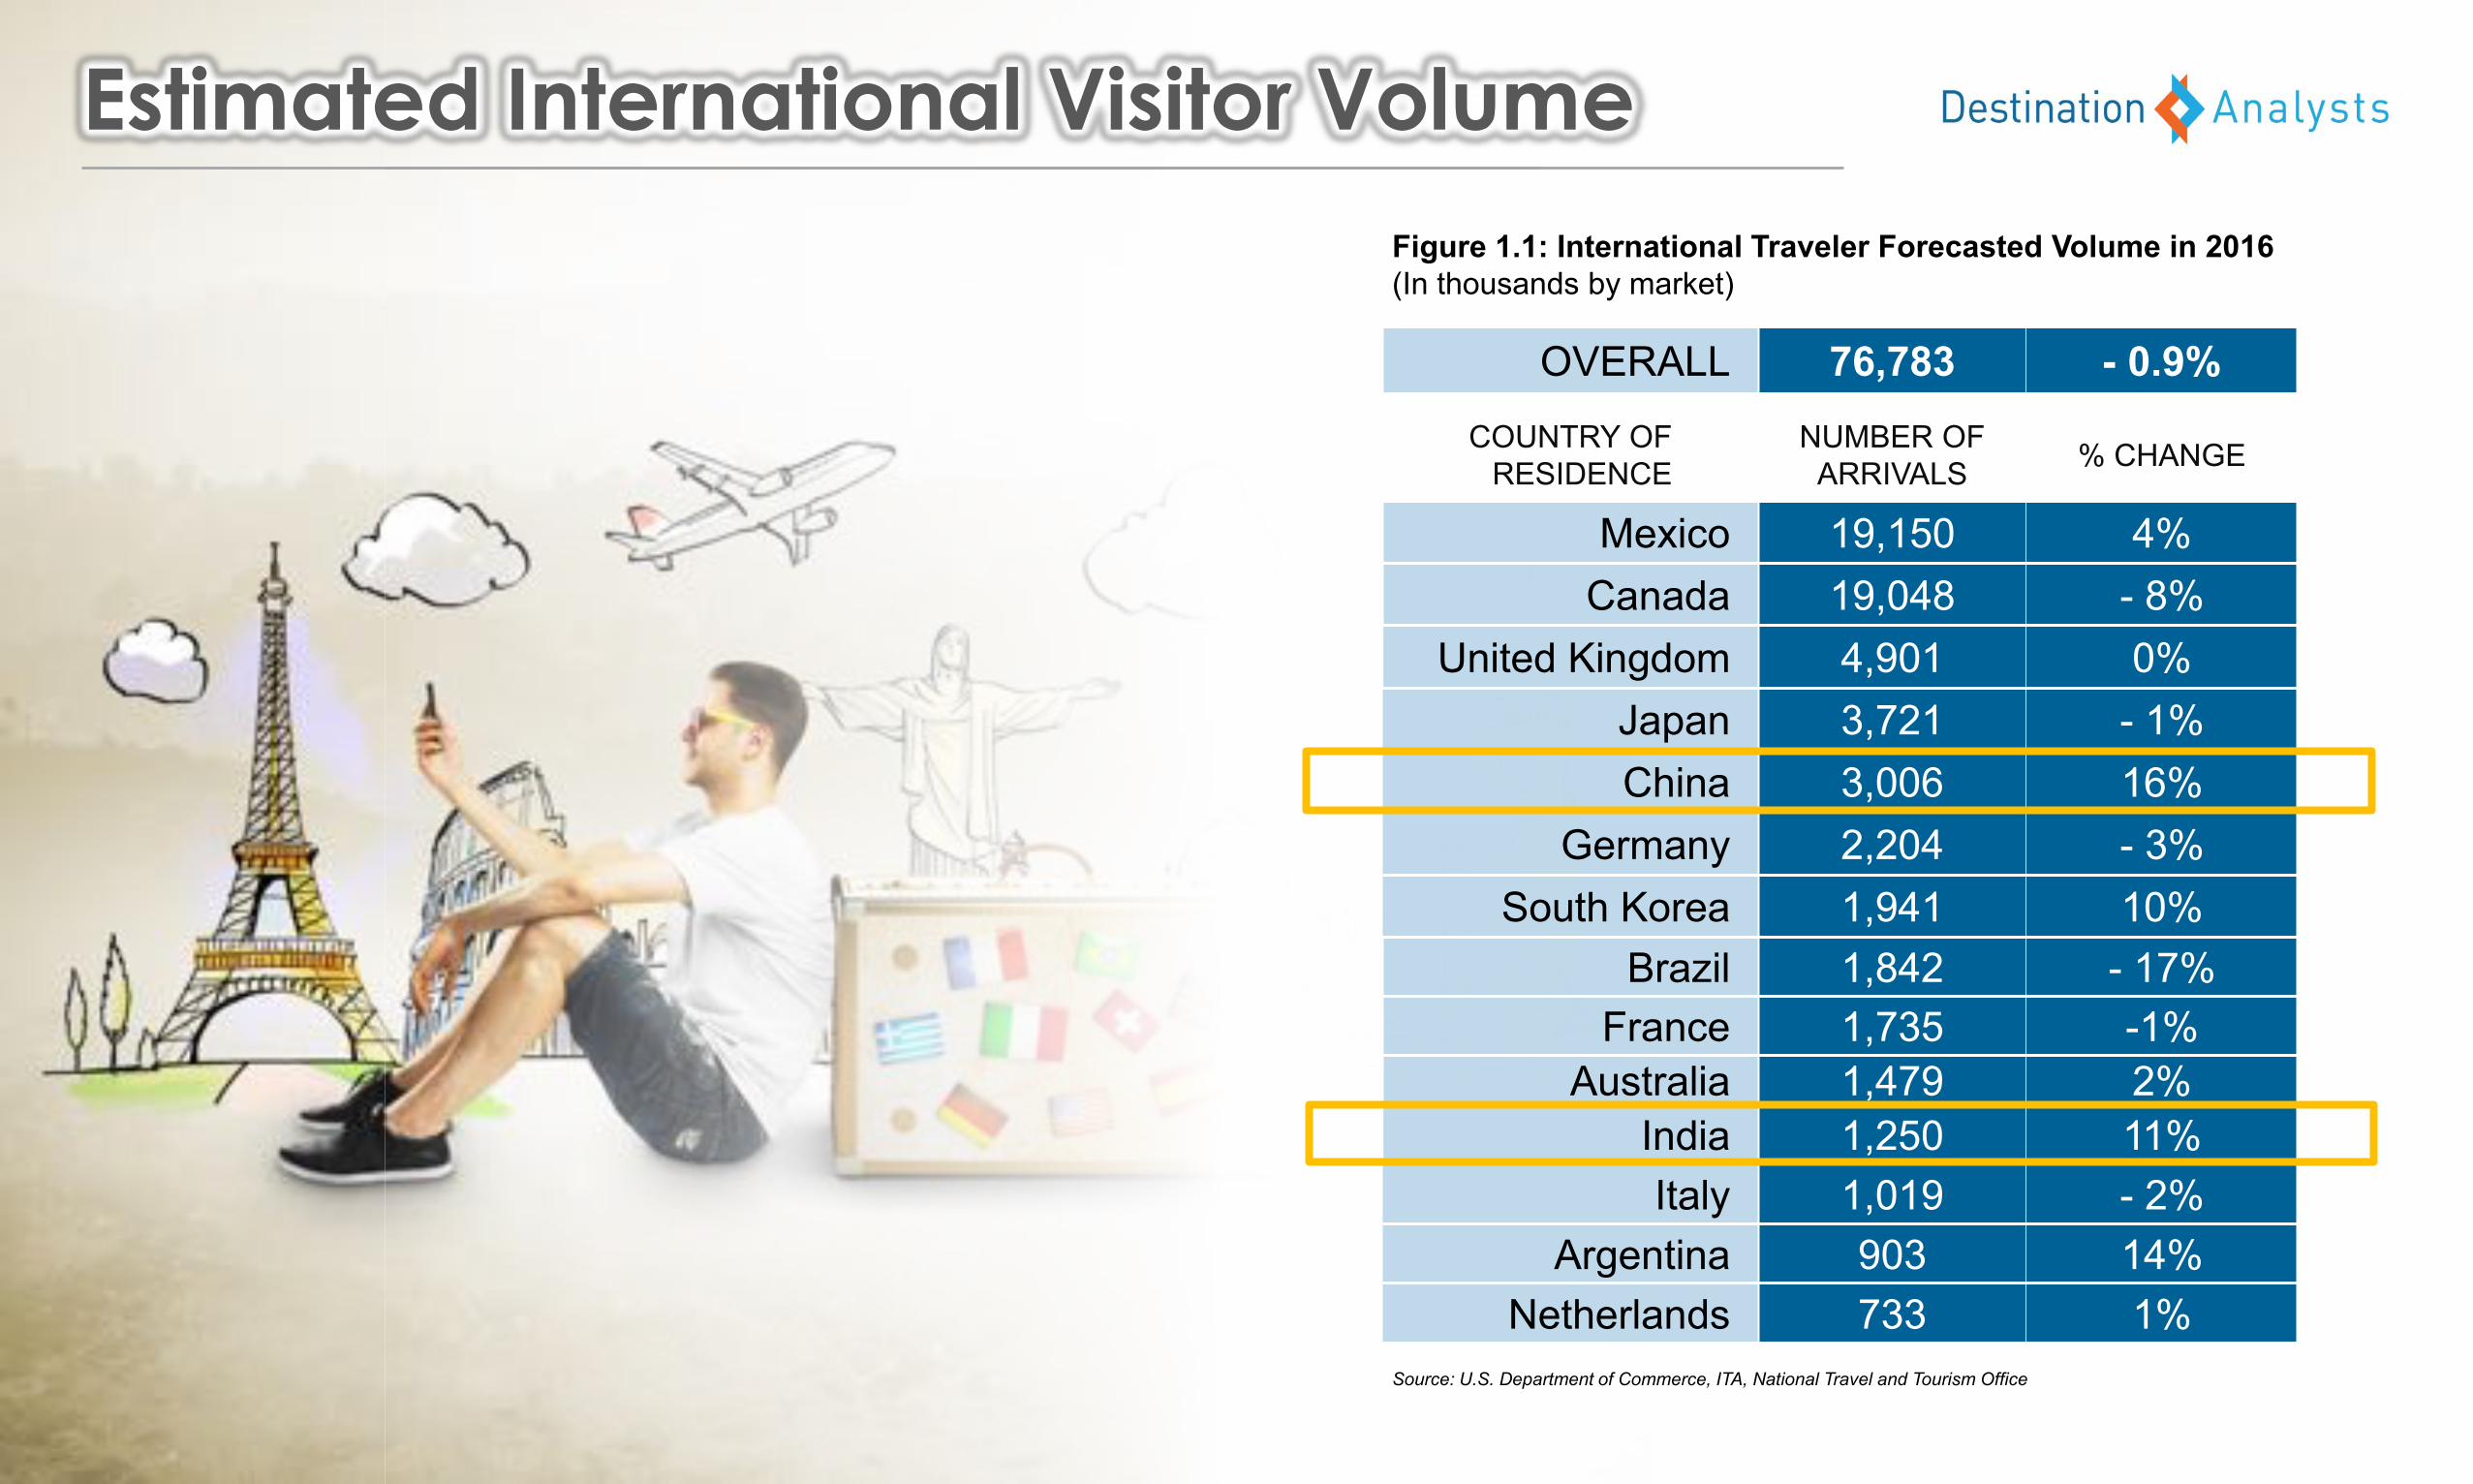
Mexico 19,150 4%Canada 19,048 - 8%
United Kingdom 4,901 0%Japan 3,721 - 1%China 3,006 16%
Germany 2,204 - 3%South Korea 1,941 10%
Figure 1.1: International Traveler Forecasted Volume in 2016 (In thousands by market)
Brazil 1,842 - 17%France 1,735 -1%
Australia 1,479 2%India 1,250 11%Italy 1,019 - 2%
Argentina 903 14%Netherlands 733 1%
Source: U.S. Department of Commerce, ITA, National Travel and Tourism Office
OVERALL 76,783 - 0.9%
Estimated International Visitor Volume

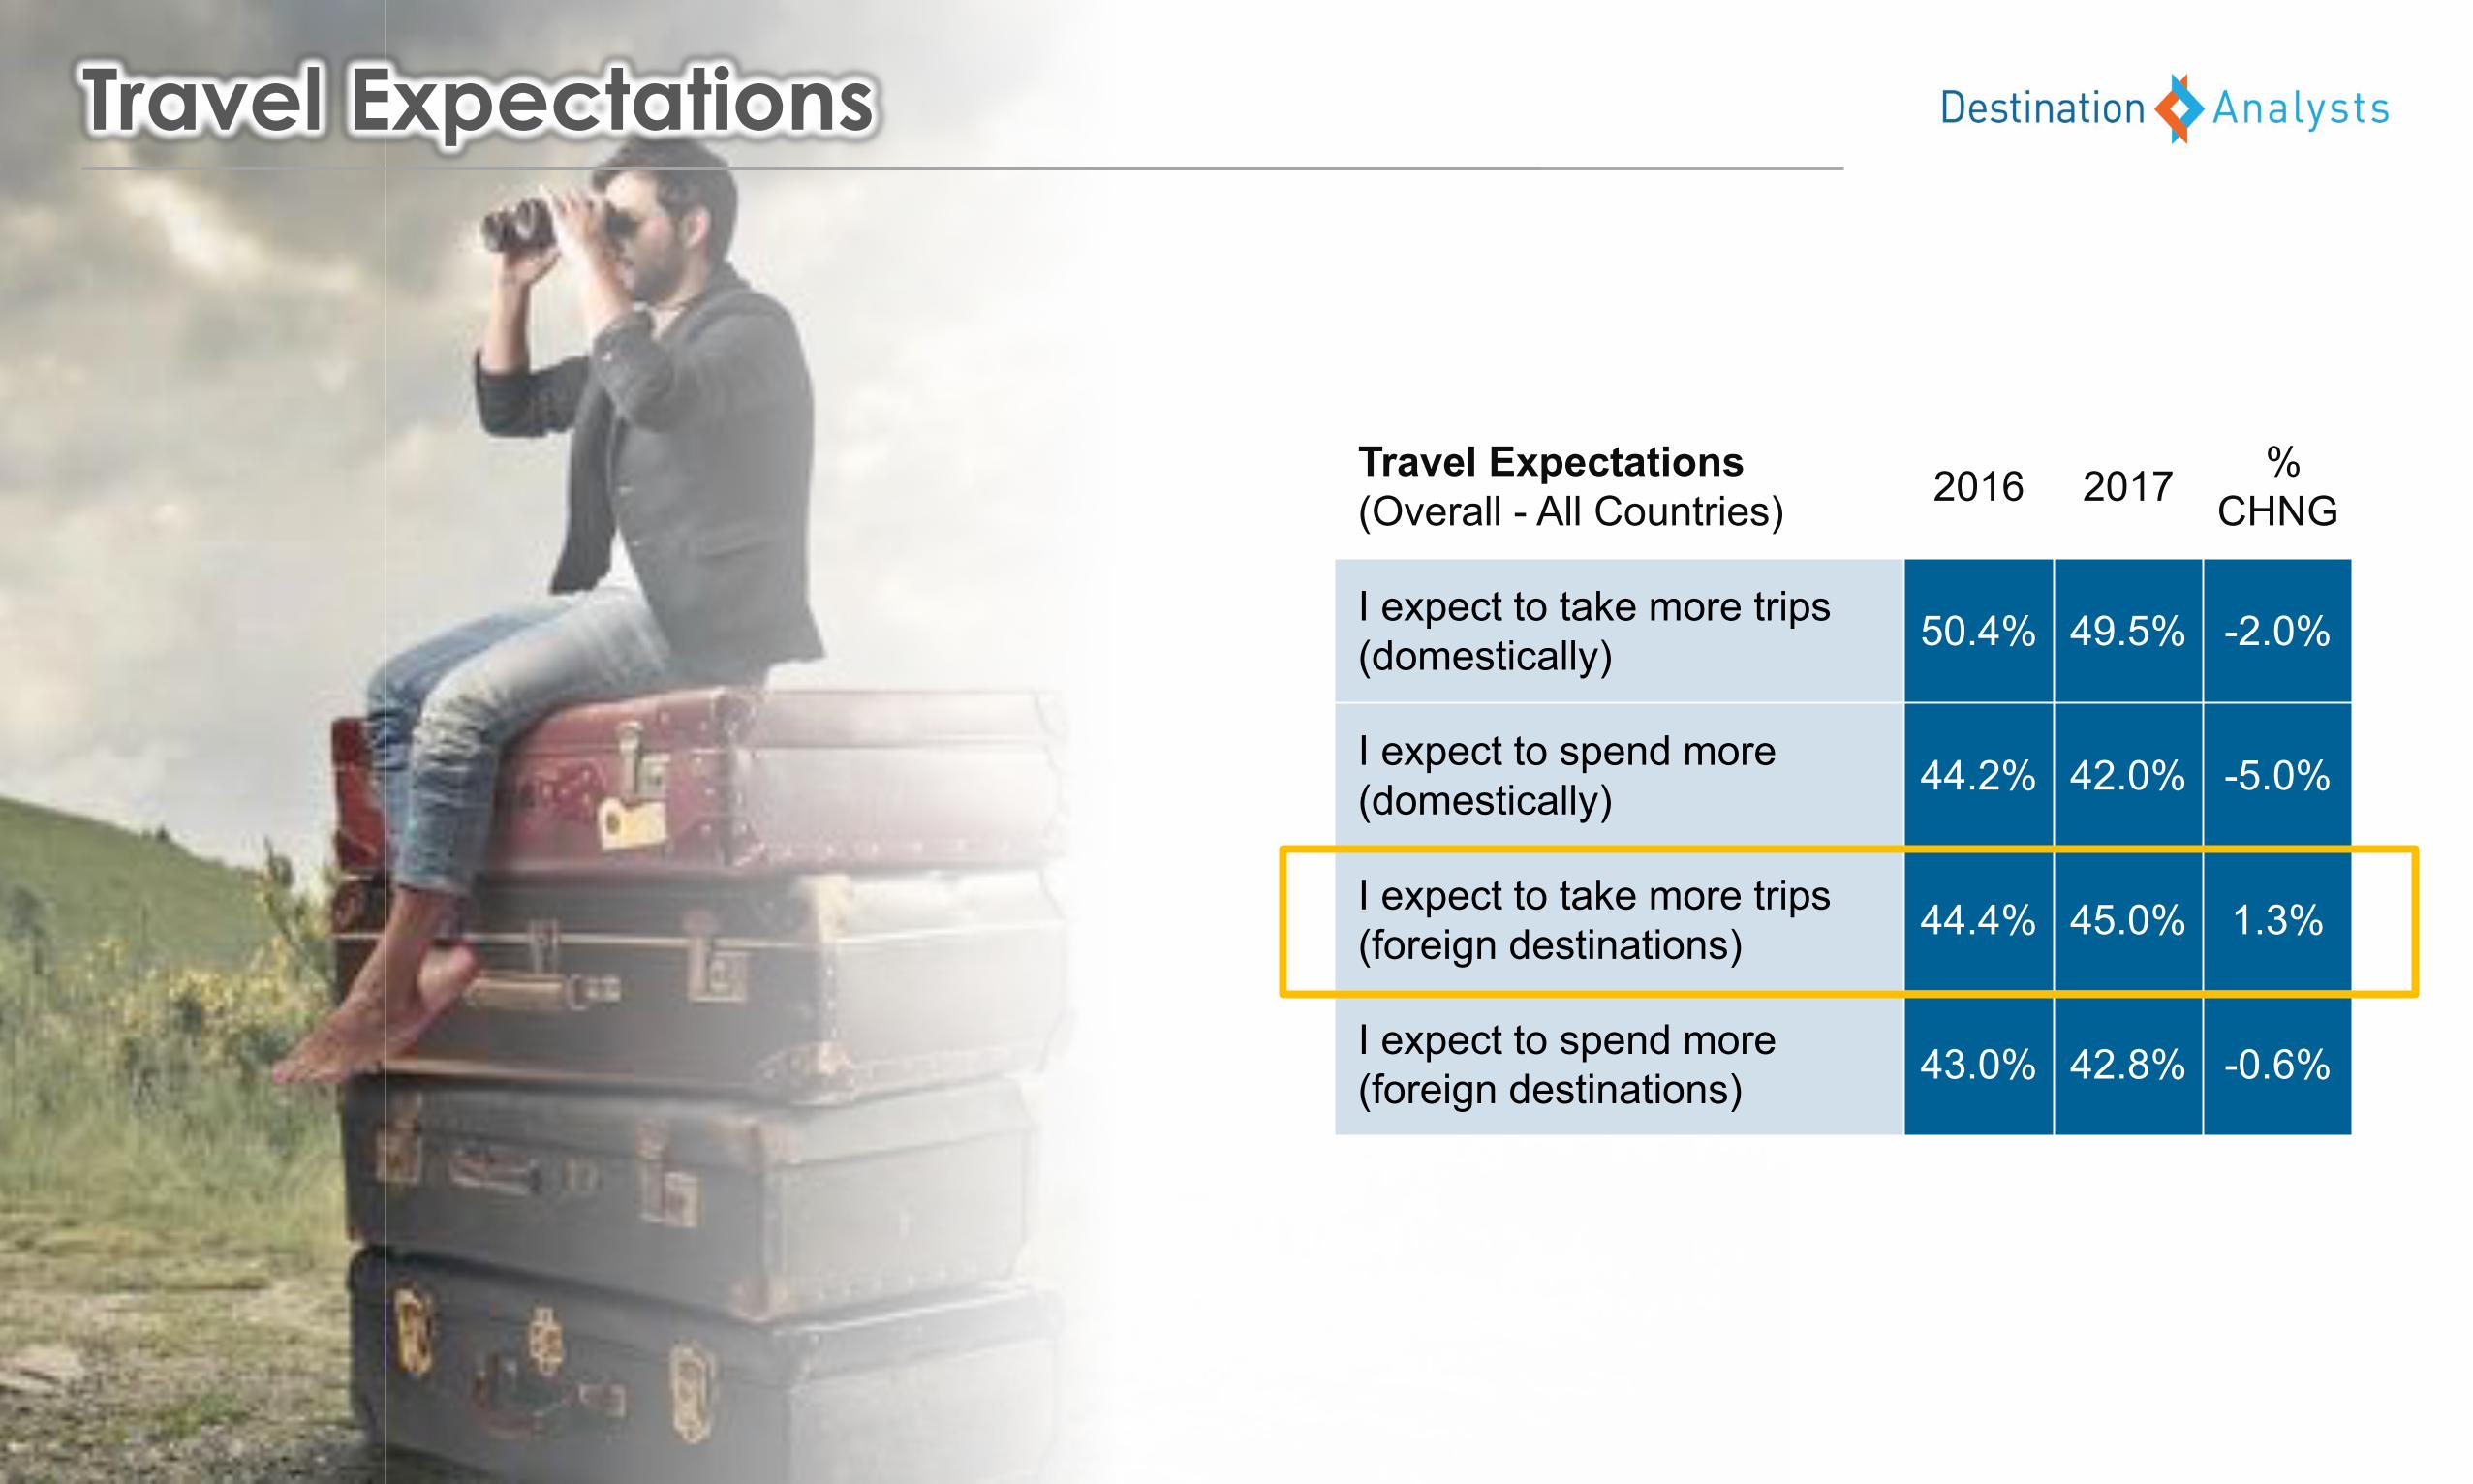
Travel Expectations
Travel Expectations (Overall - All Countries) 2016 2017 %
CHNG
I expect to take more trips (domestically) 50.4% 49.5% -2.0%
I expect to spend more (domestically) 44.2% 42.0% -5.0%
I expect to take more trips (foreign destinations) 44.4% 45.0% 1.3%
I expect to spend more (foreign destinations) 43.0% 42.8% -0.6%

International Travel Budget Priority
International Travel is a "High" or "Extremely high" Budget Priority (By market)
22.7%28.0%28.0%29.1%
33.3%33.9%34.5%36.5%40.0%41.5%44.5%46.2%49.1%
57.0%
0% 20% 40% 60% 80% 100%
NetherlandsArgentina
CanadaItaly
United KingdomFranceJapan
AustraliaMexico
BrazilSouth Korea
ChinaGermany
India

Days Available for International Travel
Days Available for International Travel Annually (By market)
Netherlands 23.3Australia 21.7Argentina 20.6United Kingdom 20.2Brazil 19.2Germany 19.1Canada 17.6India 16.3Mexico 15.8Italy 15.5China 14.7France 13.4South Korea 12.5Japan 7.9
USA

Global Destination Hotlist
2017
United States 34.3%
Spain 17.8%
France 18.1%
Italy 16.3%
United Kingdom 13.8%
Japan 12.0%
Canada 8.8%
Australia 8.7%
Germany 9.0%
Thailand 6.6%
Most Desired International Destinations (Unaided)(Overall - All Countries)
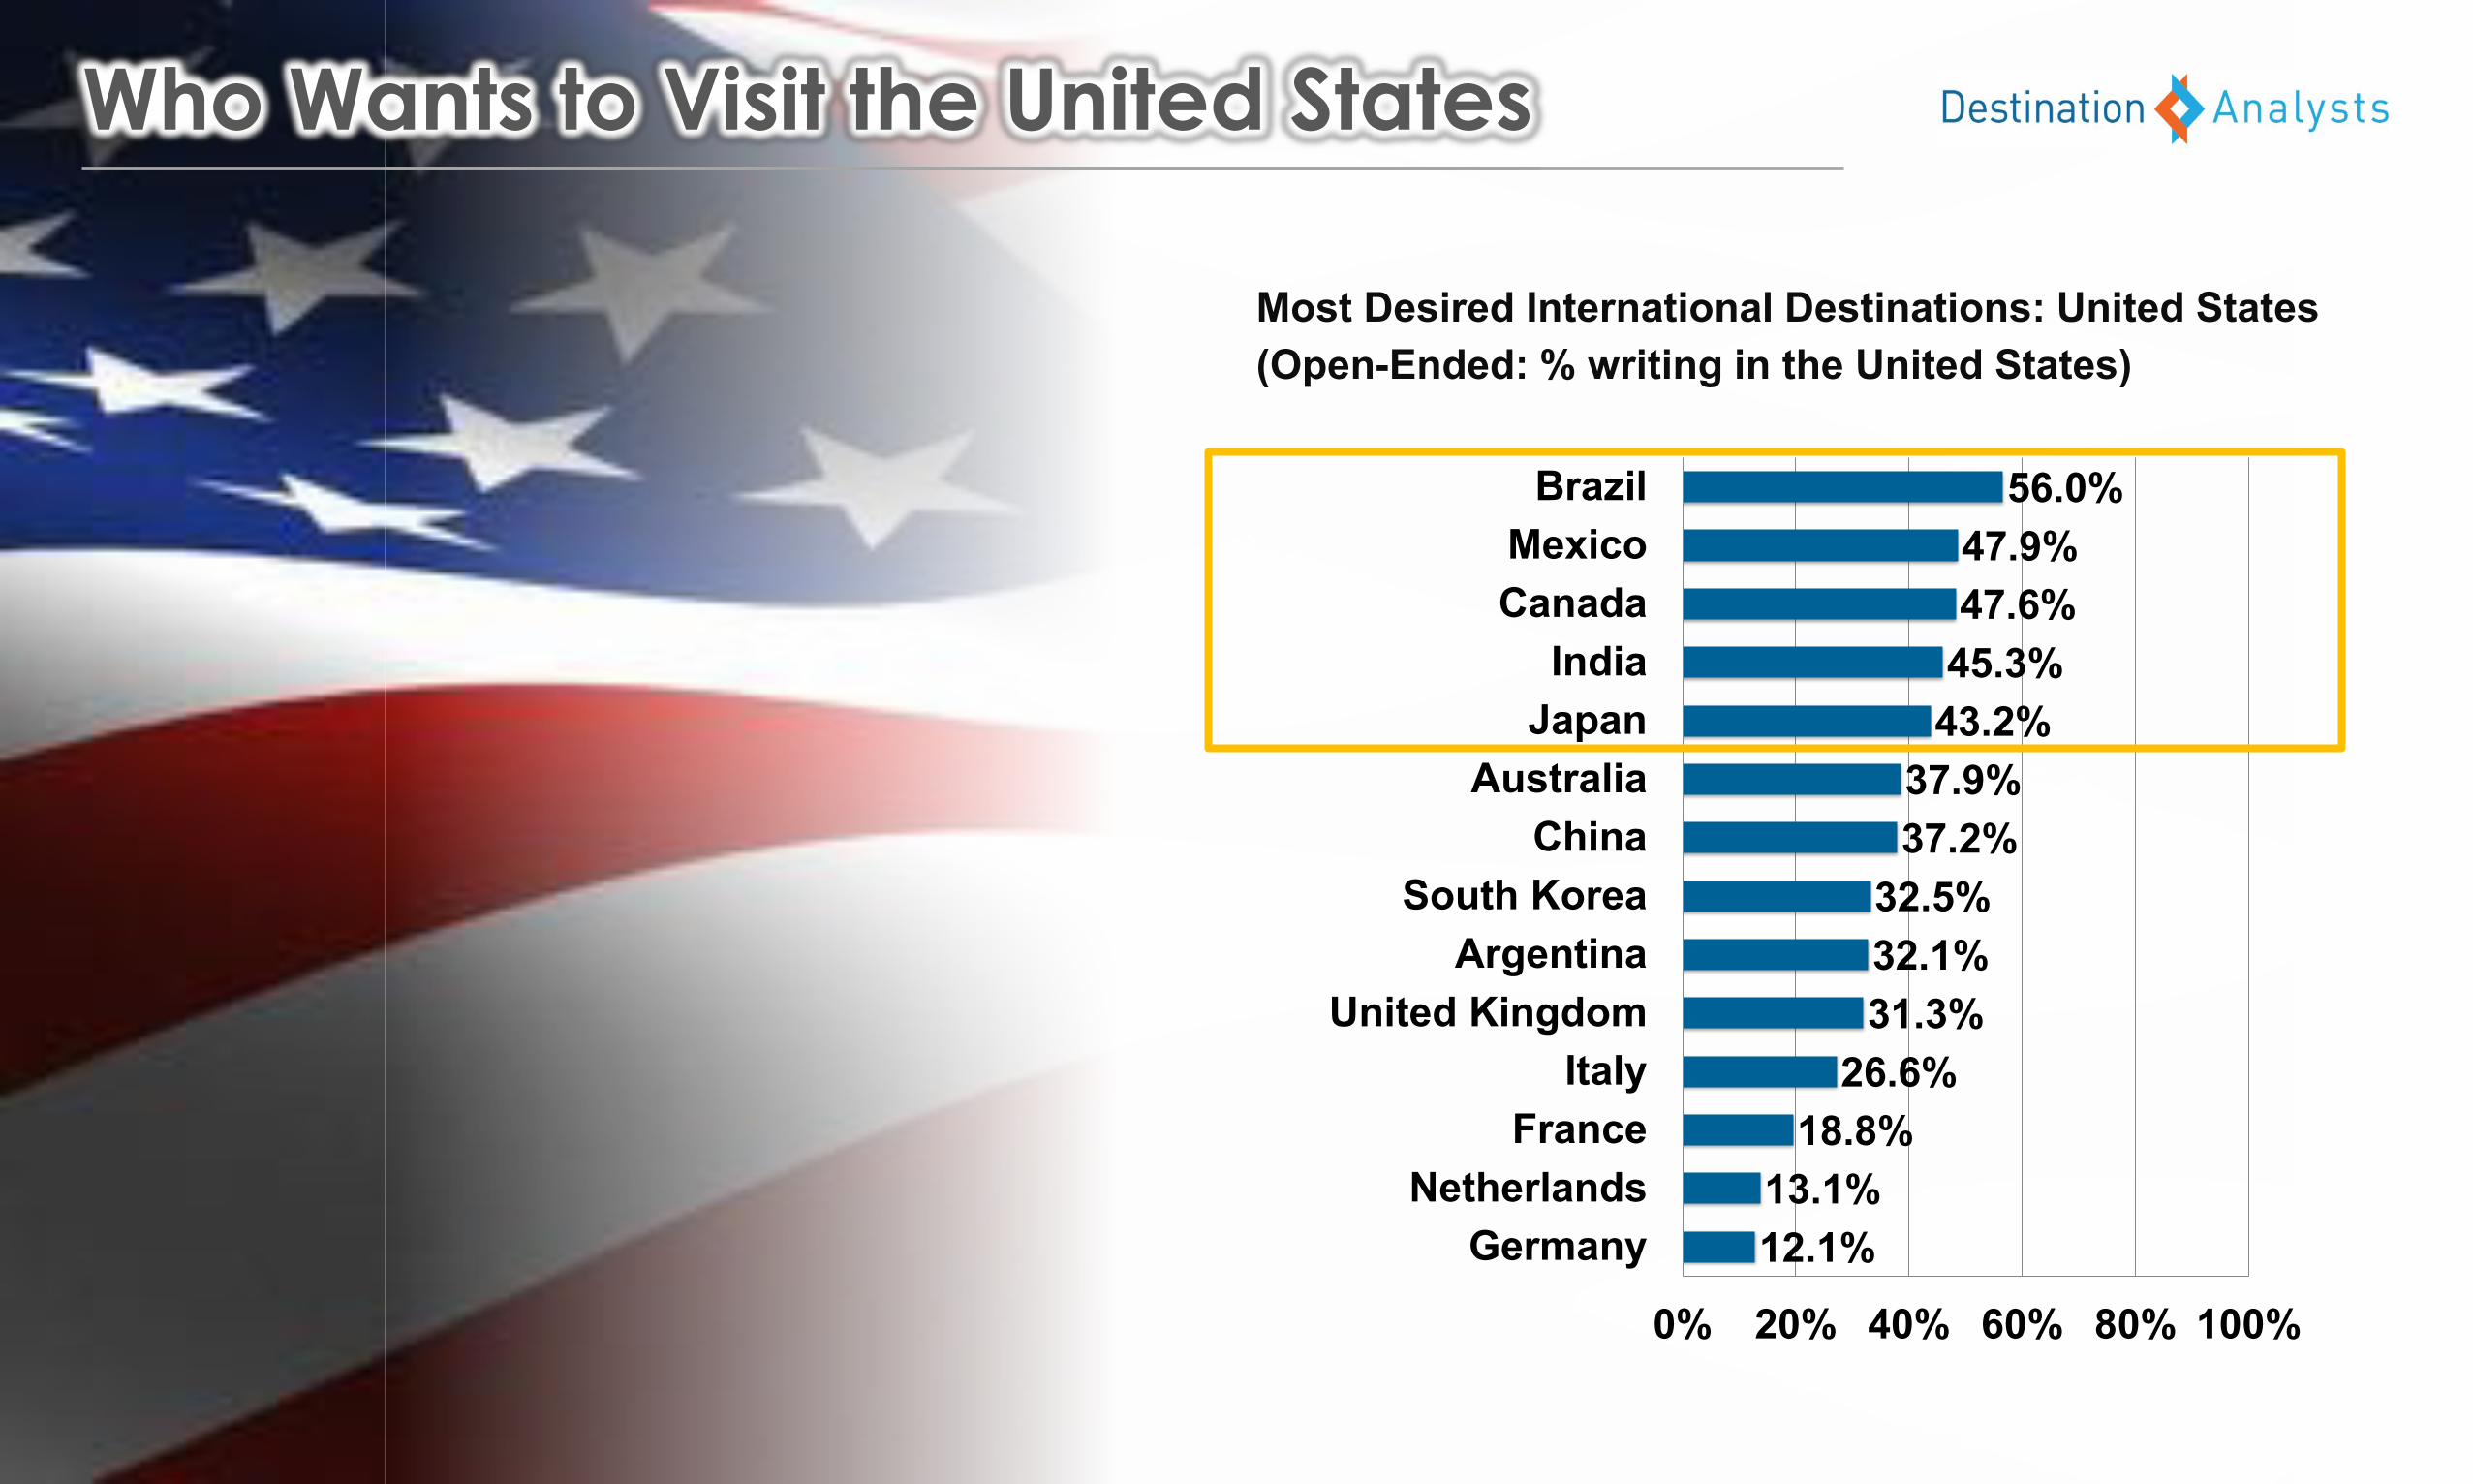
Who Wants to Visit the United States
12.1%13.1%
18.8%26.6%
31.3%32.1%32.5%
37.2%37.9%
43.2%45.3%47.6%47.9%
56.0%
0% 20% 40% 60% 80% 100%
GermanyNetherlands
FranceItaly
United KingdomArgentina
South KoreaChina
AustraliaJapanIndia
CanadaMexico
Brazil
Most Desired International Destinations: United States(Open-Ended: % writing in the United States)


"Certain" or "Very Likely" to Visit the US for Leisure 63.7%
Average Length of Stay for Ideal US Trip 9.9
Average Number of Cities Visited on Ideal US Trip 4.4
26.6%
31.9%
35.9%
43.6%
68.2%
0% 20% 40% 60% 80% 100%
Los Angeles
San Francisco
Hawaii
Washington D.C.
New York
Top U.S. destinations they want to visit:
Country Profile: CHINA
U.S. Travel Sentiment:
22.8%
25.2%
25.3%
37.2%
39.6%
0% 20% 40% 60% 80% 100%
Austrailia
South Korea
Thailand
United States
Japan
Top global destinations they want to visit:
United States
Most Desired U.S. Vacation Experiences:
Visit famous landmarks
(77.7%)
Relaxation(74.4%)
Visit Nat’lParks
(67.0%)
Sightseeing In cities(65.8%)
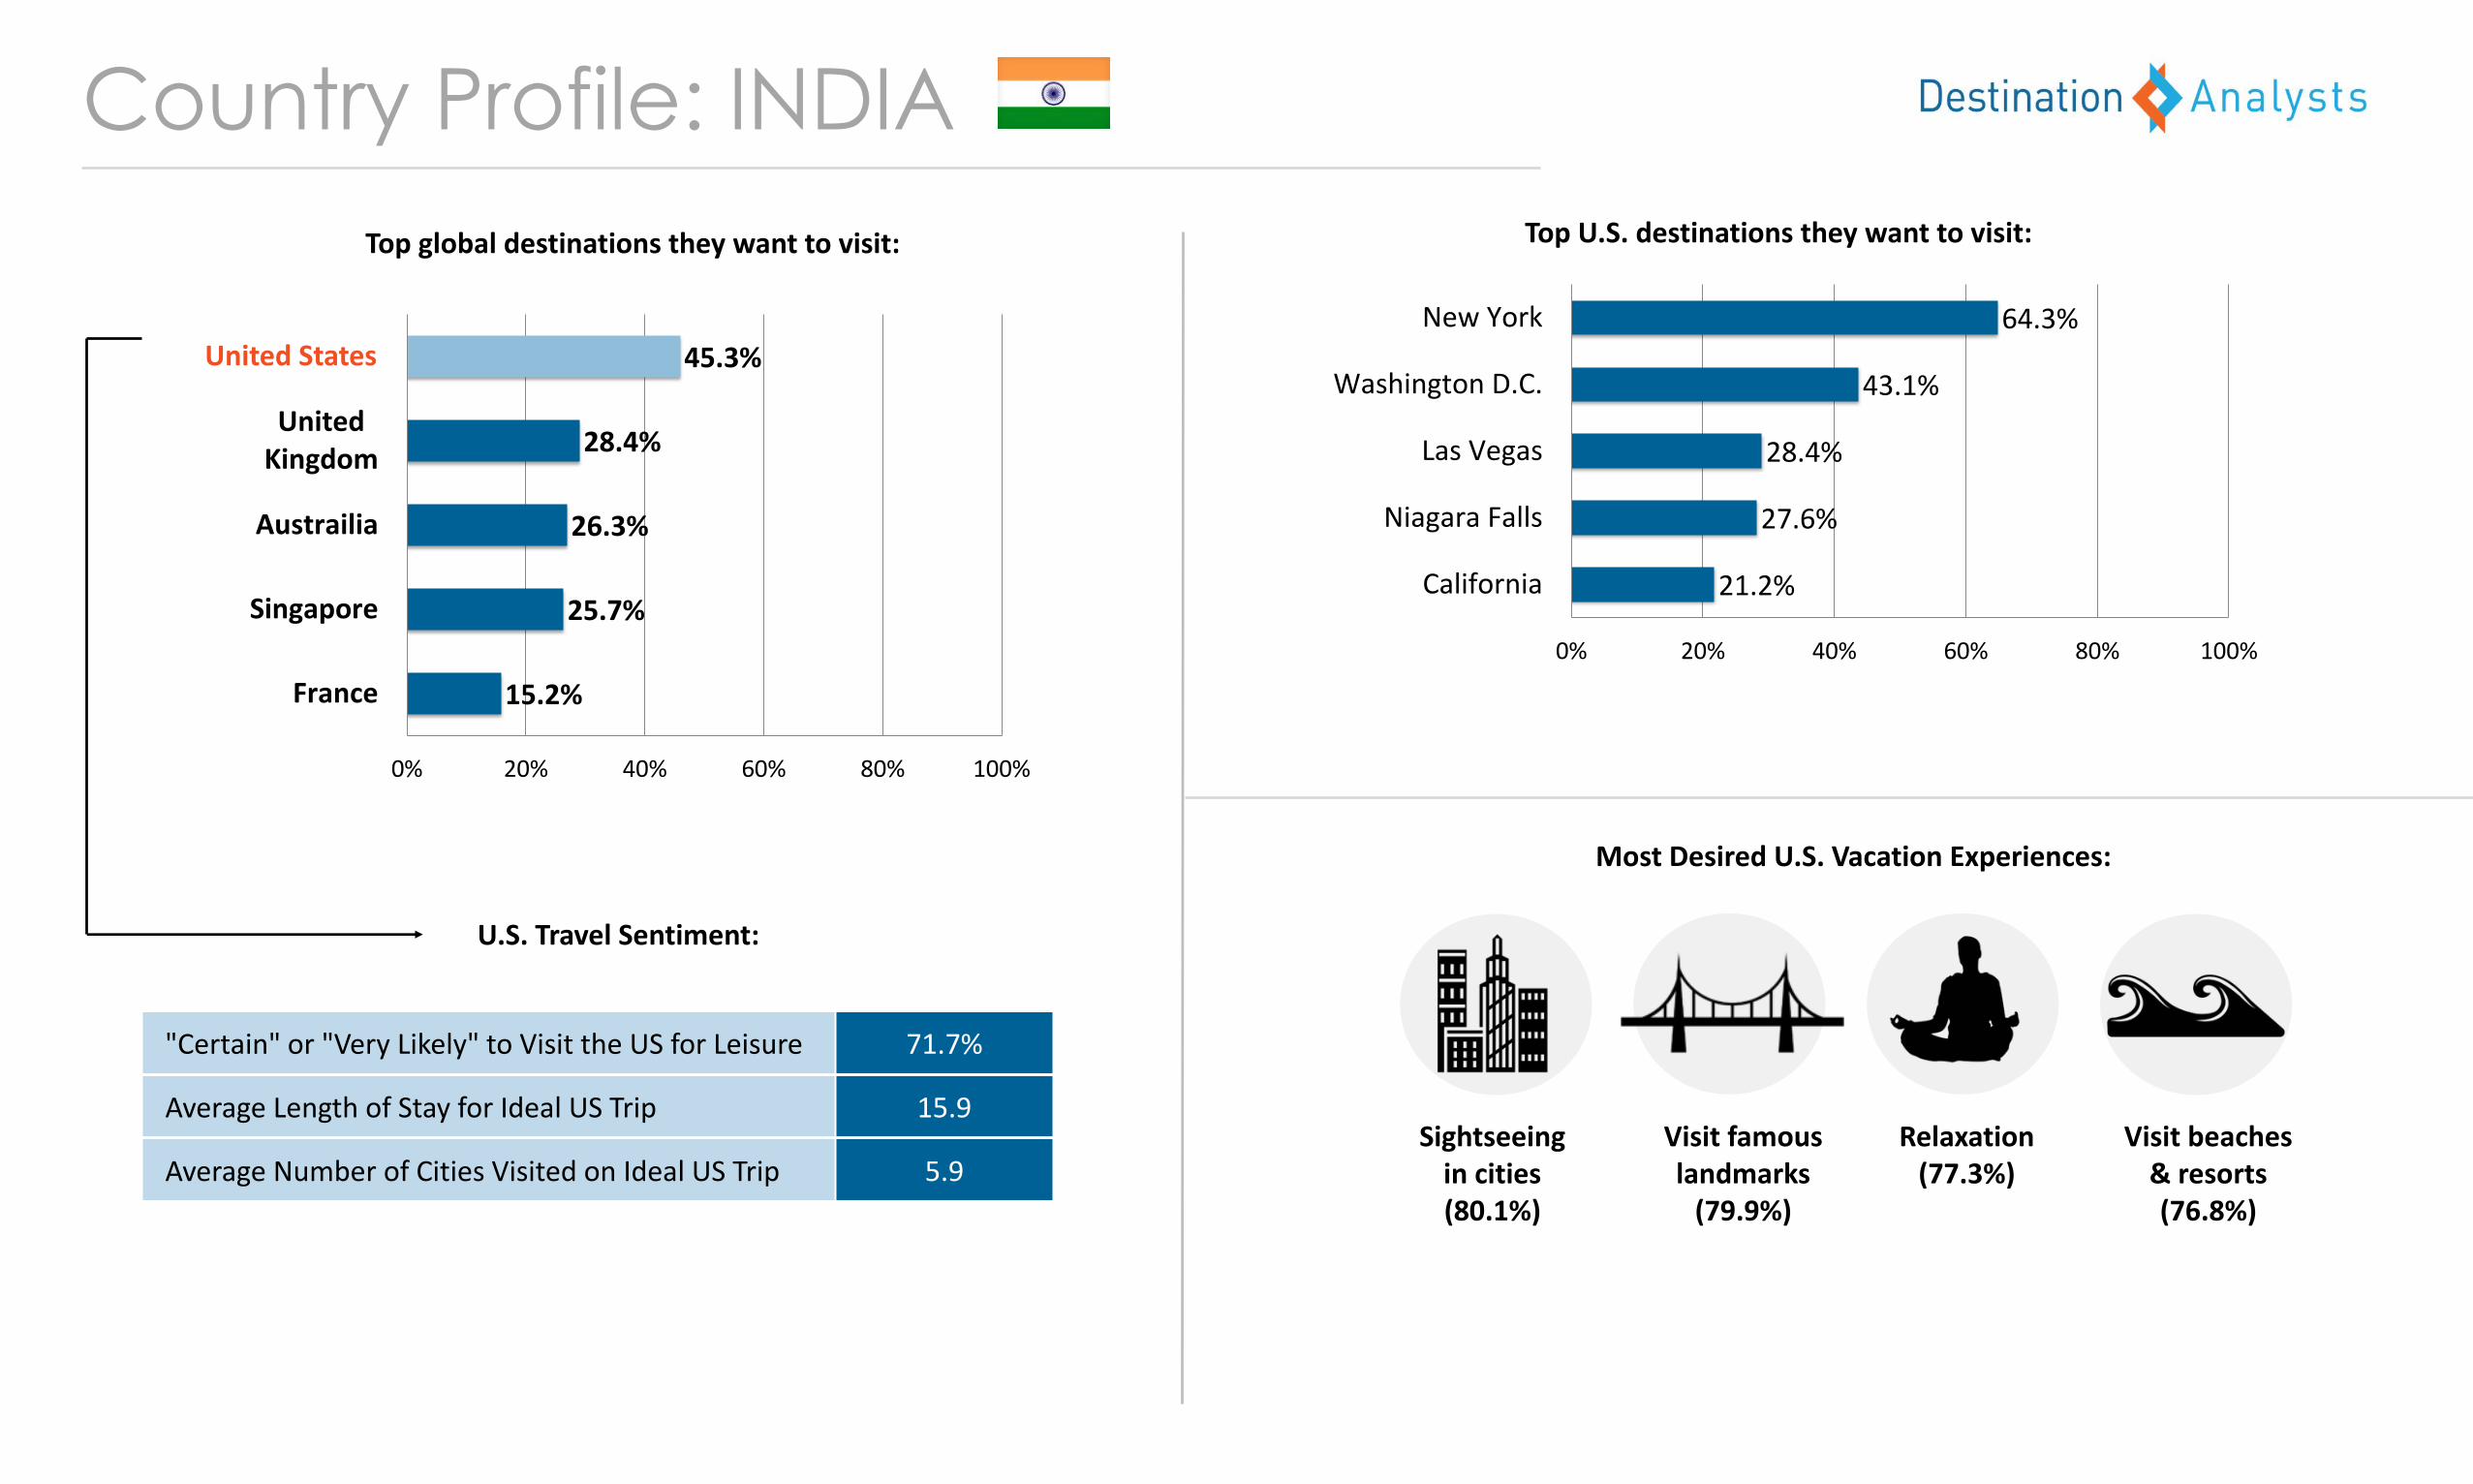
"Certain" or "Very Likely" to Visit the US for Leisure 71.7%
Average Length of Stay for Ideal US Trip 15.9
Average Number of Cities Visited on Ideal US Trip 5.9
21.2%
27.6%
28.4%
43.1%
64.3%
0% 20% 40% 60% 80% 100%
California
Niagara Falls
Las Vegas
Washington D.C.
New York
Top U.S. destinations they want to visit:
Country Profile: INDIA
U.S. Travel Sentiment:
15.2%
25.7%
26.3%
28.4%
45.3%
0% 20% 40% 60% 80% 100%
France
Singapore
Austrailia
UnitedKingdom
United States
Top global destinations they want to visit:
United States
Most Desired U.S. Vacation Experiences:
Sightseeingin cities(80.1%)
Visit famous landmarks
(79.9%)
Relaxation(77.3%)
Visit beaches& resorts(76.8%)

Post-Election Opinion of the United States
Post-Election Opinion of the U.S.
Better, 16.3%
Neutral, 38.6%
Worse, 42.9%
Question: Did the results of the recent U.S. Presidential election change your overall opinion of the United States of America? If so, how? (Please select the answer that best fills in the blank below) As a result of the election, my overall opinion of the United States is _____________________.

Question: Did the results of the recent U.S. Presidential election change your overall opinion of the United States of America? If so, how? (Please select the answer that best fills in the blank below) As a result of the election, my overall opinion of the United States is _____________________.
(1.2%, 2.4%)
(2.0%, 2.5%)
(2.2%, 2.8%)
(3.1%, 3.6%)
(3.6%,3.3%)
(2.3%,4.8%)
5.0%
5.7%
5.6%
5.1%
6.3%
5.1%
22.4%
(1.4%, 3.2%)
4.8%
4.7%
5.4%
8.9%
7.8%
9.9%
21.7%
0% 20% 40% 60%
Netherlands
Mexico
South Korea
Argentina
Germany
France
Japan
Brazil
United Kingdom
Canada
Italy
Australia
China
India
Better Opinion of The U.S. after Election(% responding "Better" or "Much Better")
Much better
Better
(2.0%, 2.1%)
5.2%
4.9%
9.3%
8.2%
11.0%
15.3%
19.6%
14.7%
18.8%
18.7%
19.8%
22.6%
16.2%
6.0%
10.8%
8.3%
12.7%
16.3%
14.2%
9.9%
15.3%
11.8%
16.0%
15.9%
13.7%
20.1%
0% 20% 40% 60%
India
China
Italy
Brazil
Argentina
South Korea
France
Australia
Japan
United Kingdom
Germany
Mexico
Canada
Netherlands
Worse Opinion of The U.S. after Election(% responding "Worse" or "Much Worse")
Much worse
Worse
Post-Election Opinion of United States

Warning: The next slides contains word clouds composed of travelers’ opinions about Donald Trump.
These word clouds contain words that some may find offensive.
Content Warning
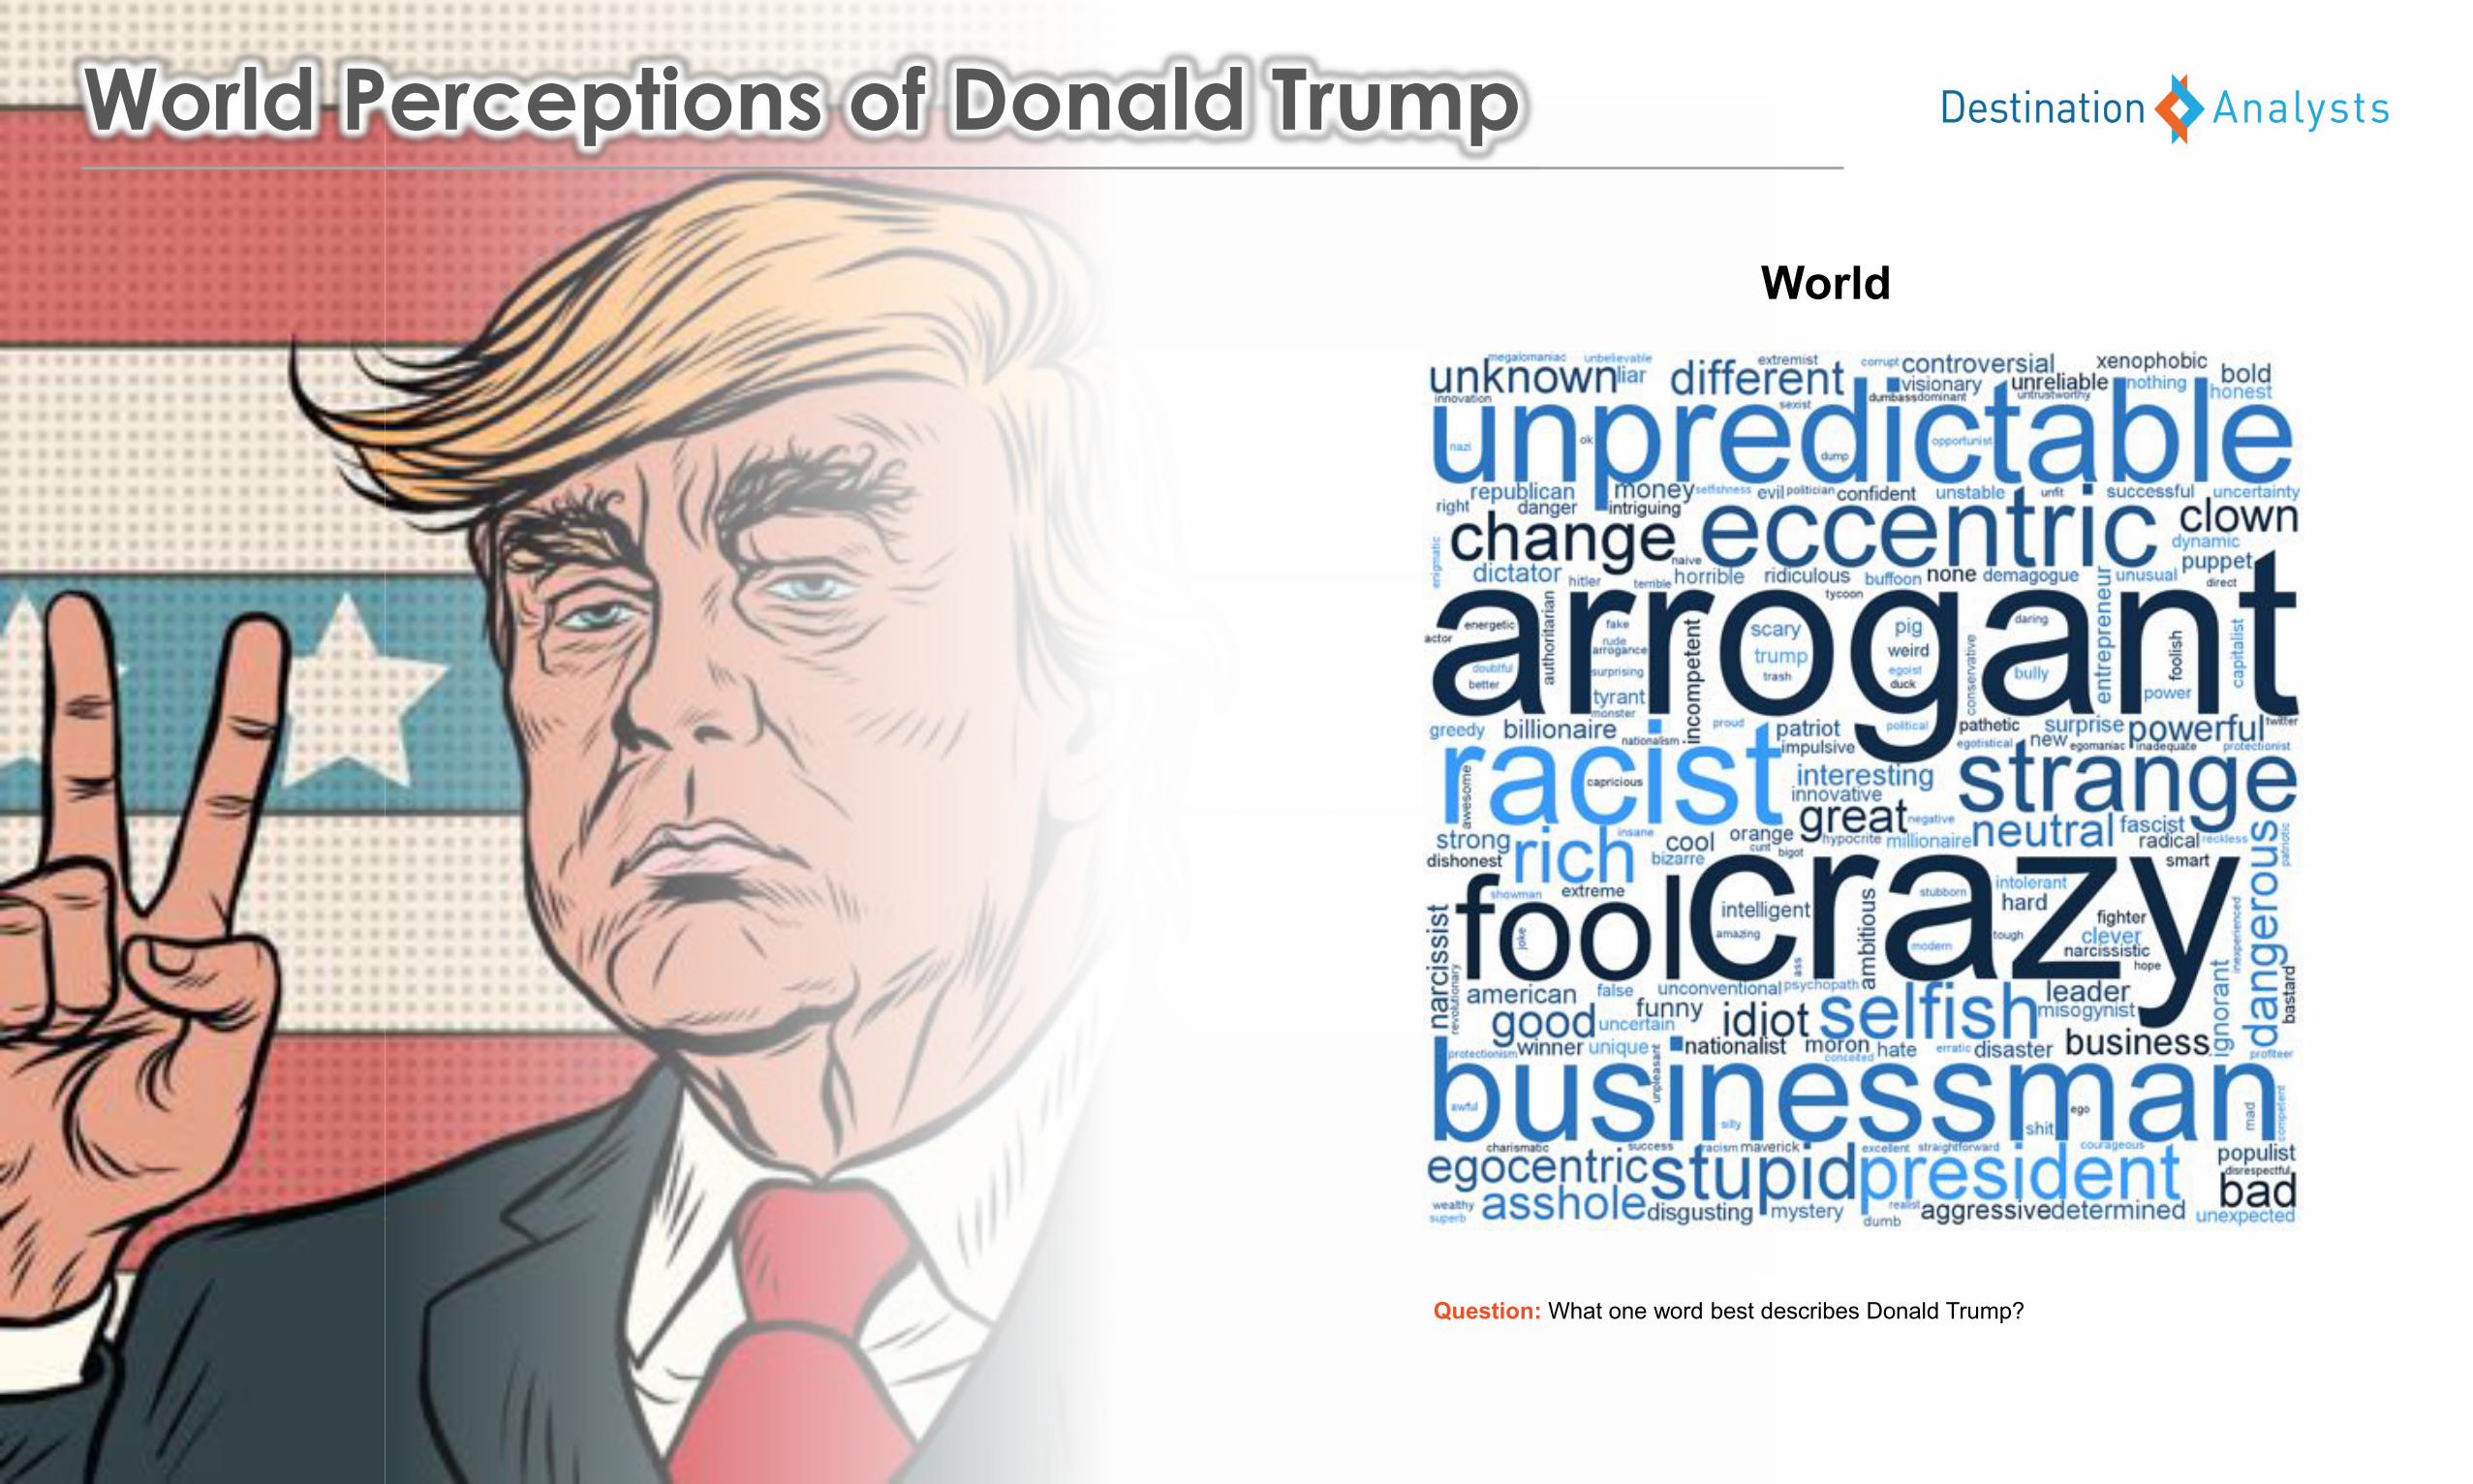
World Perceptions of Donald Trump
World
Question: What one word best describes Donald Trump?

Japan
World Perceptions of Donald Trump (continued)
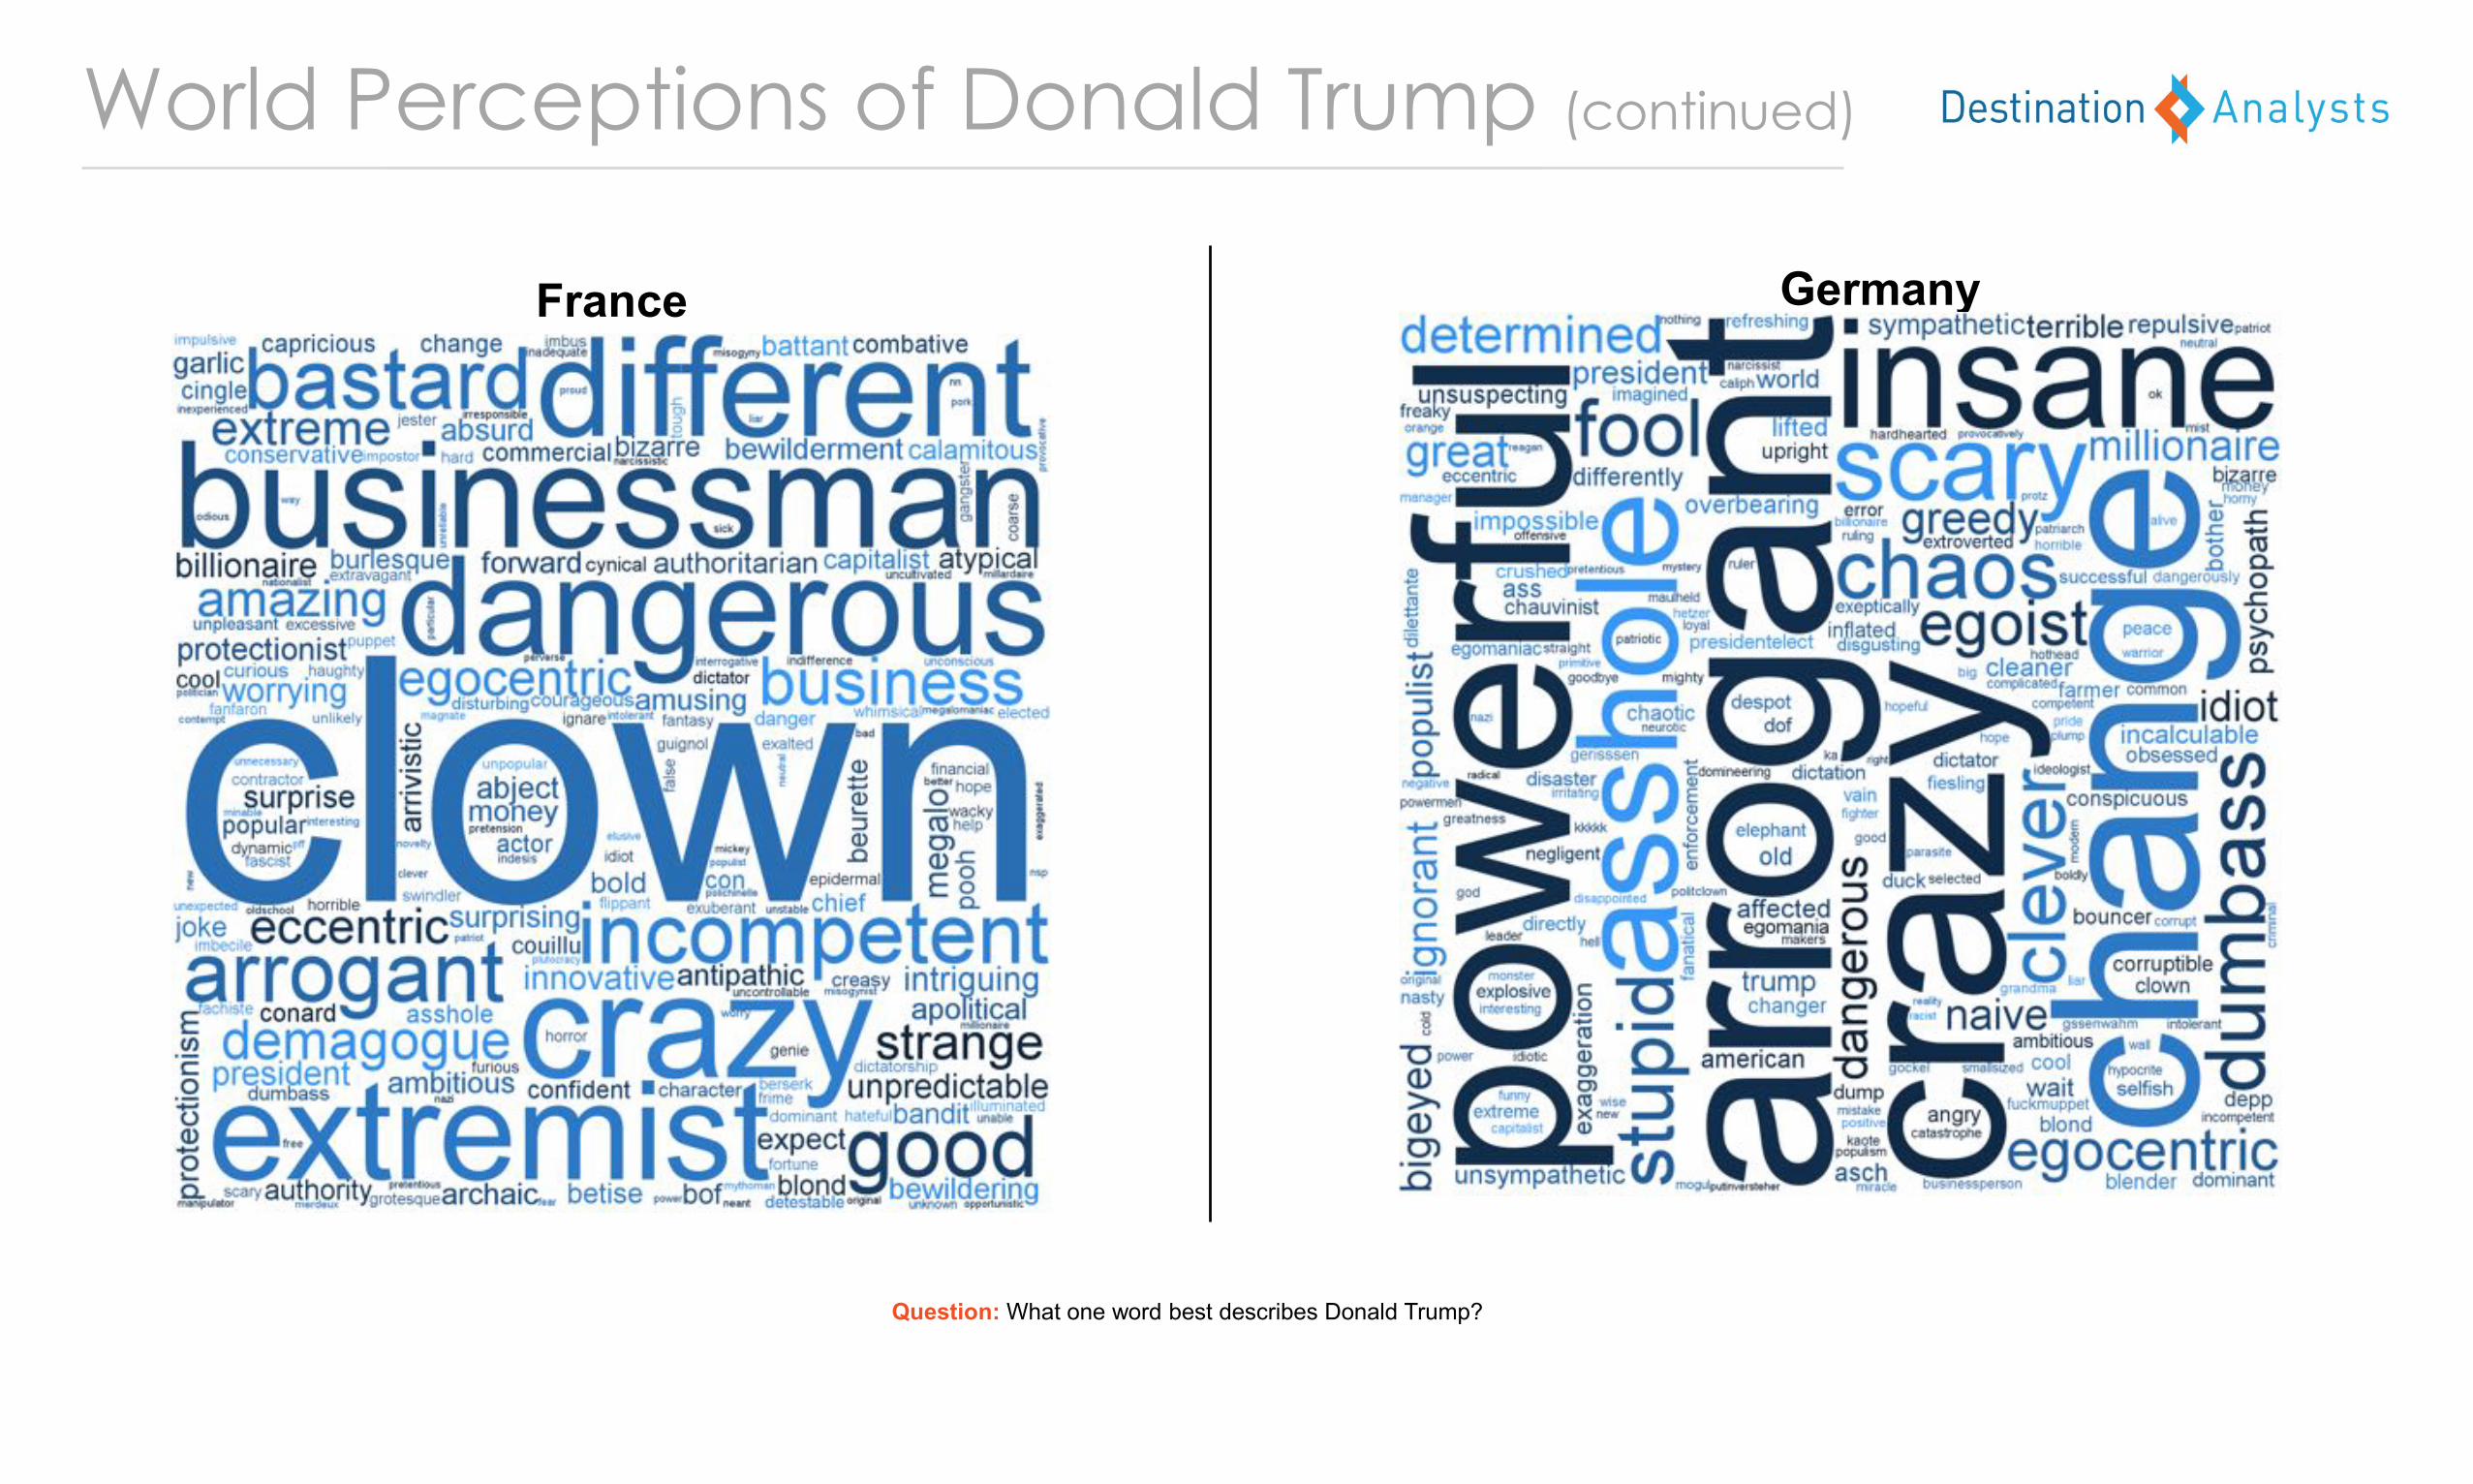
Question: What one word best describes Donald Trump?
China
Question: What one word best describes Donald Trump?
Australia
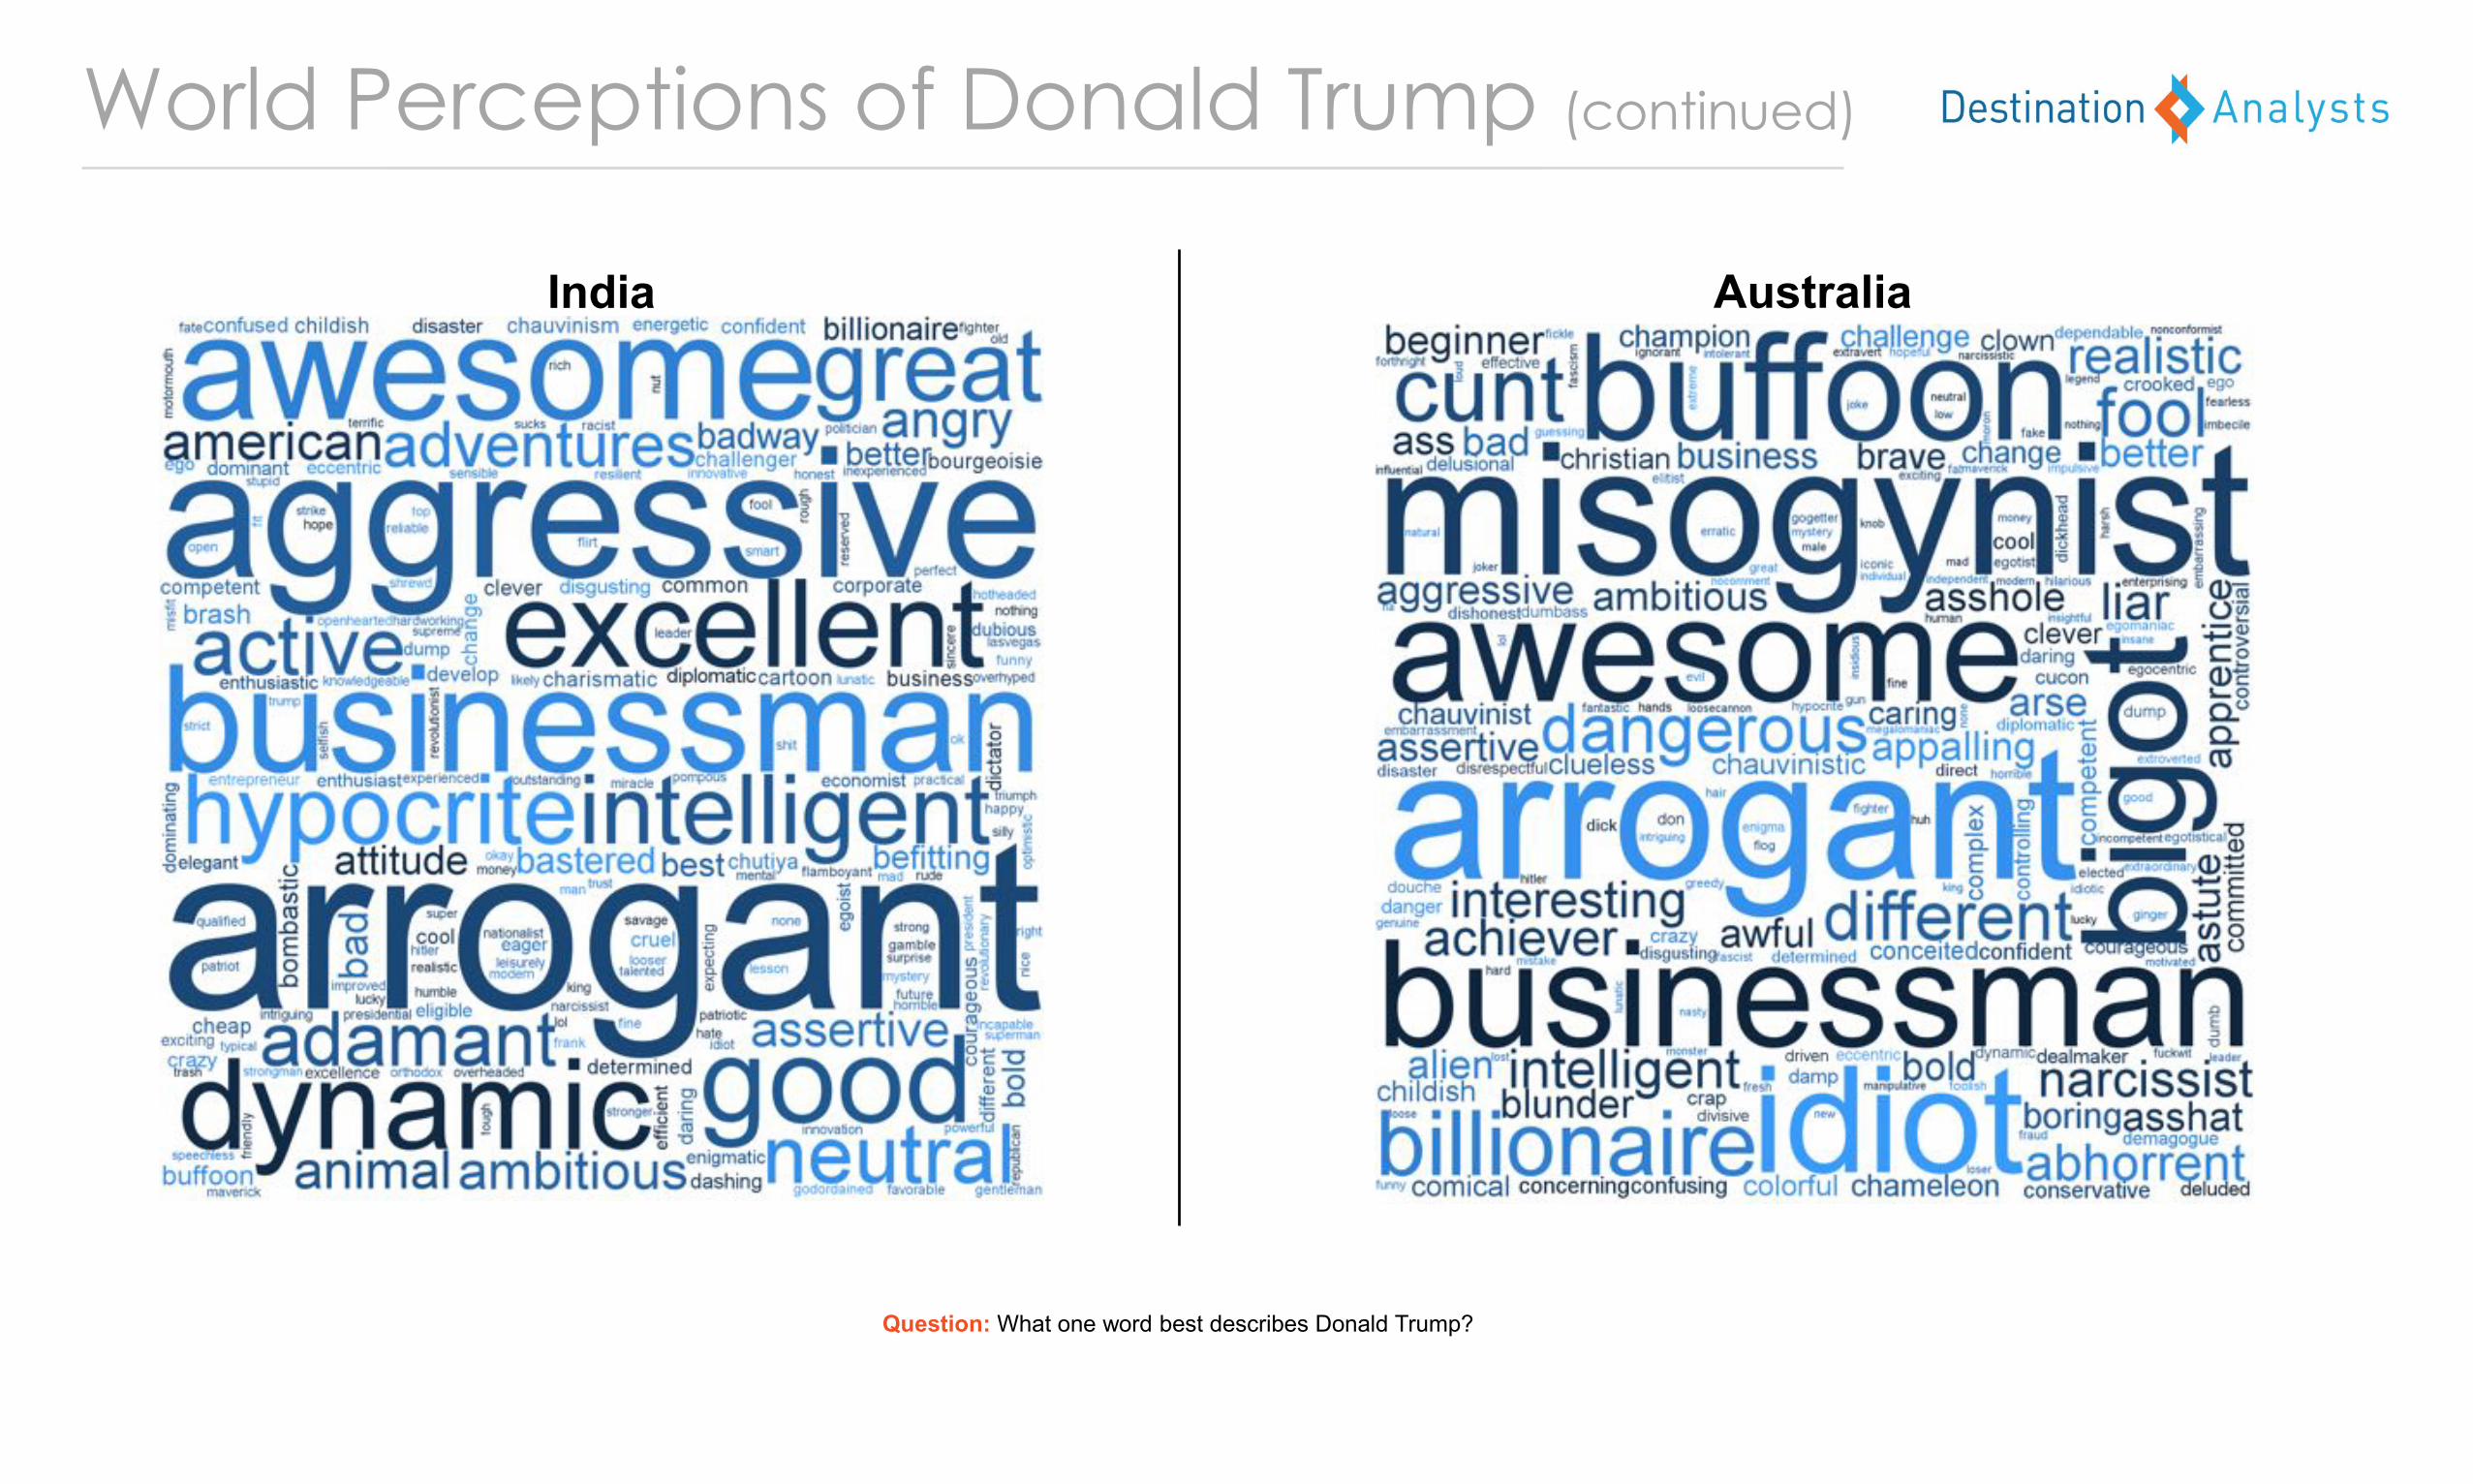
World Perceptions of Donald Trump (continued)
India
Question: What one word best describes Donald Trump?
France Germany
World Perceptions of Donald Trump (continued)
Question: What one word best describes Donald Trump?
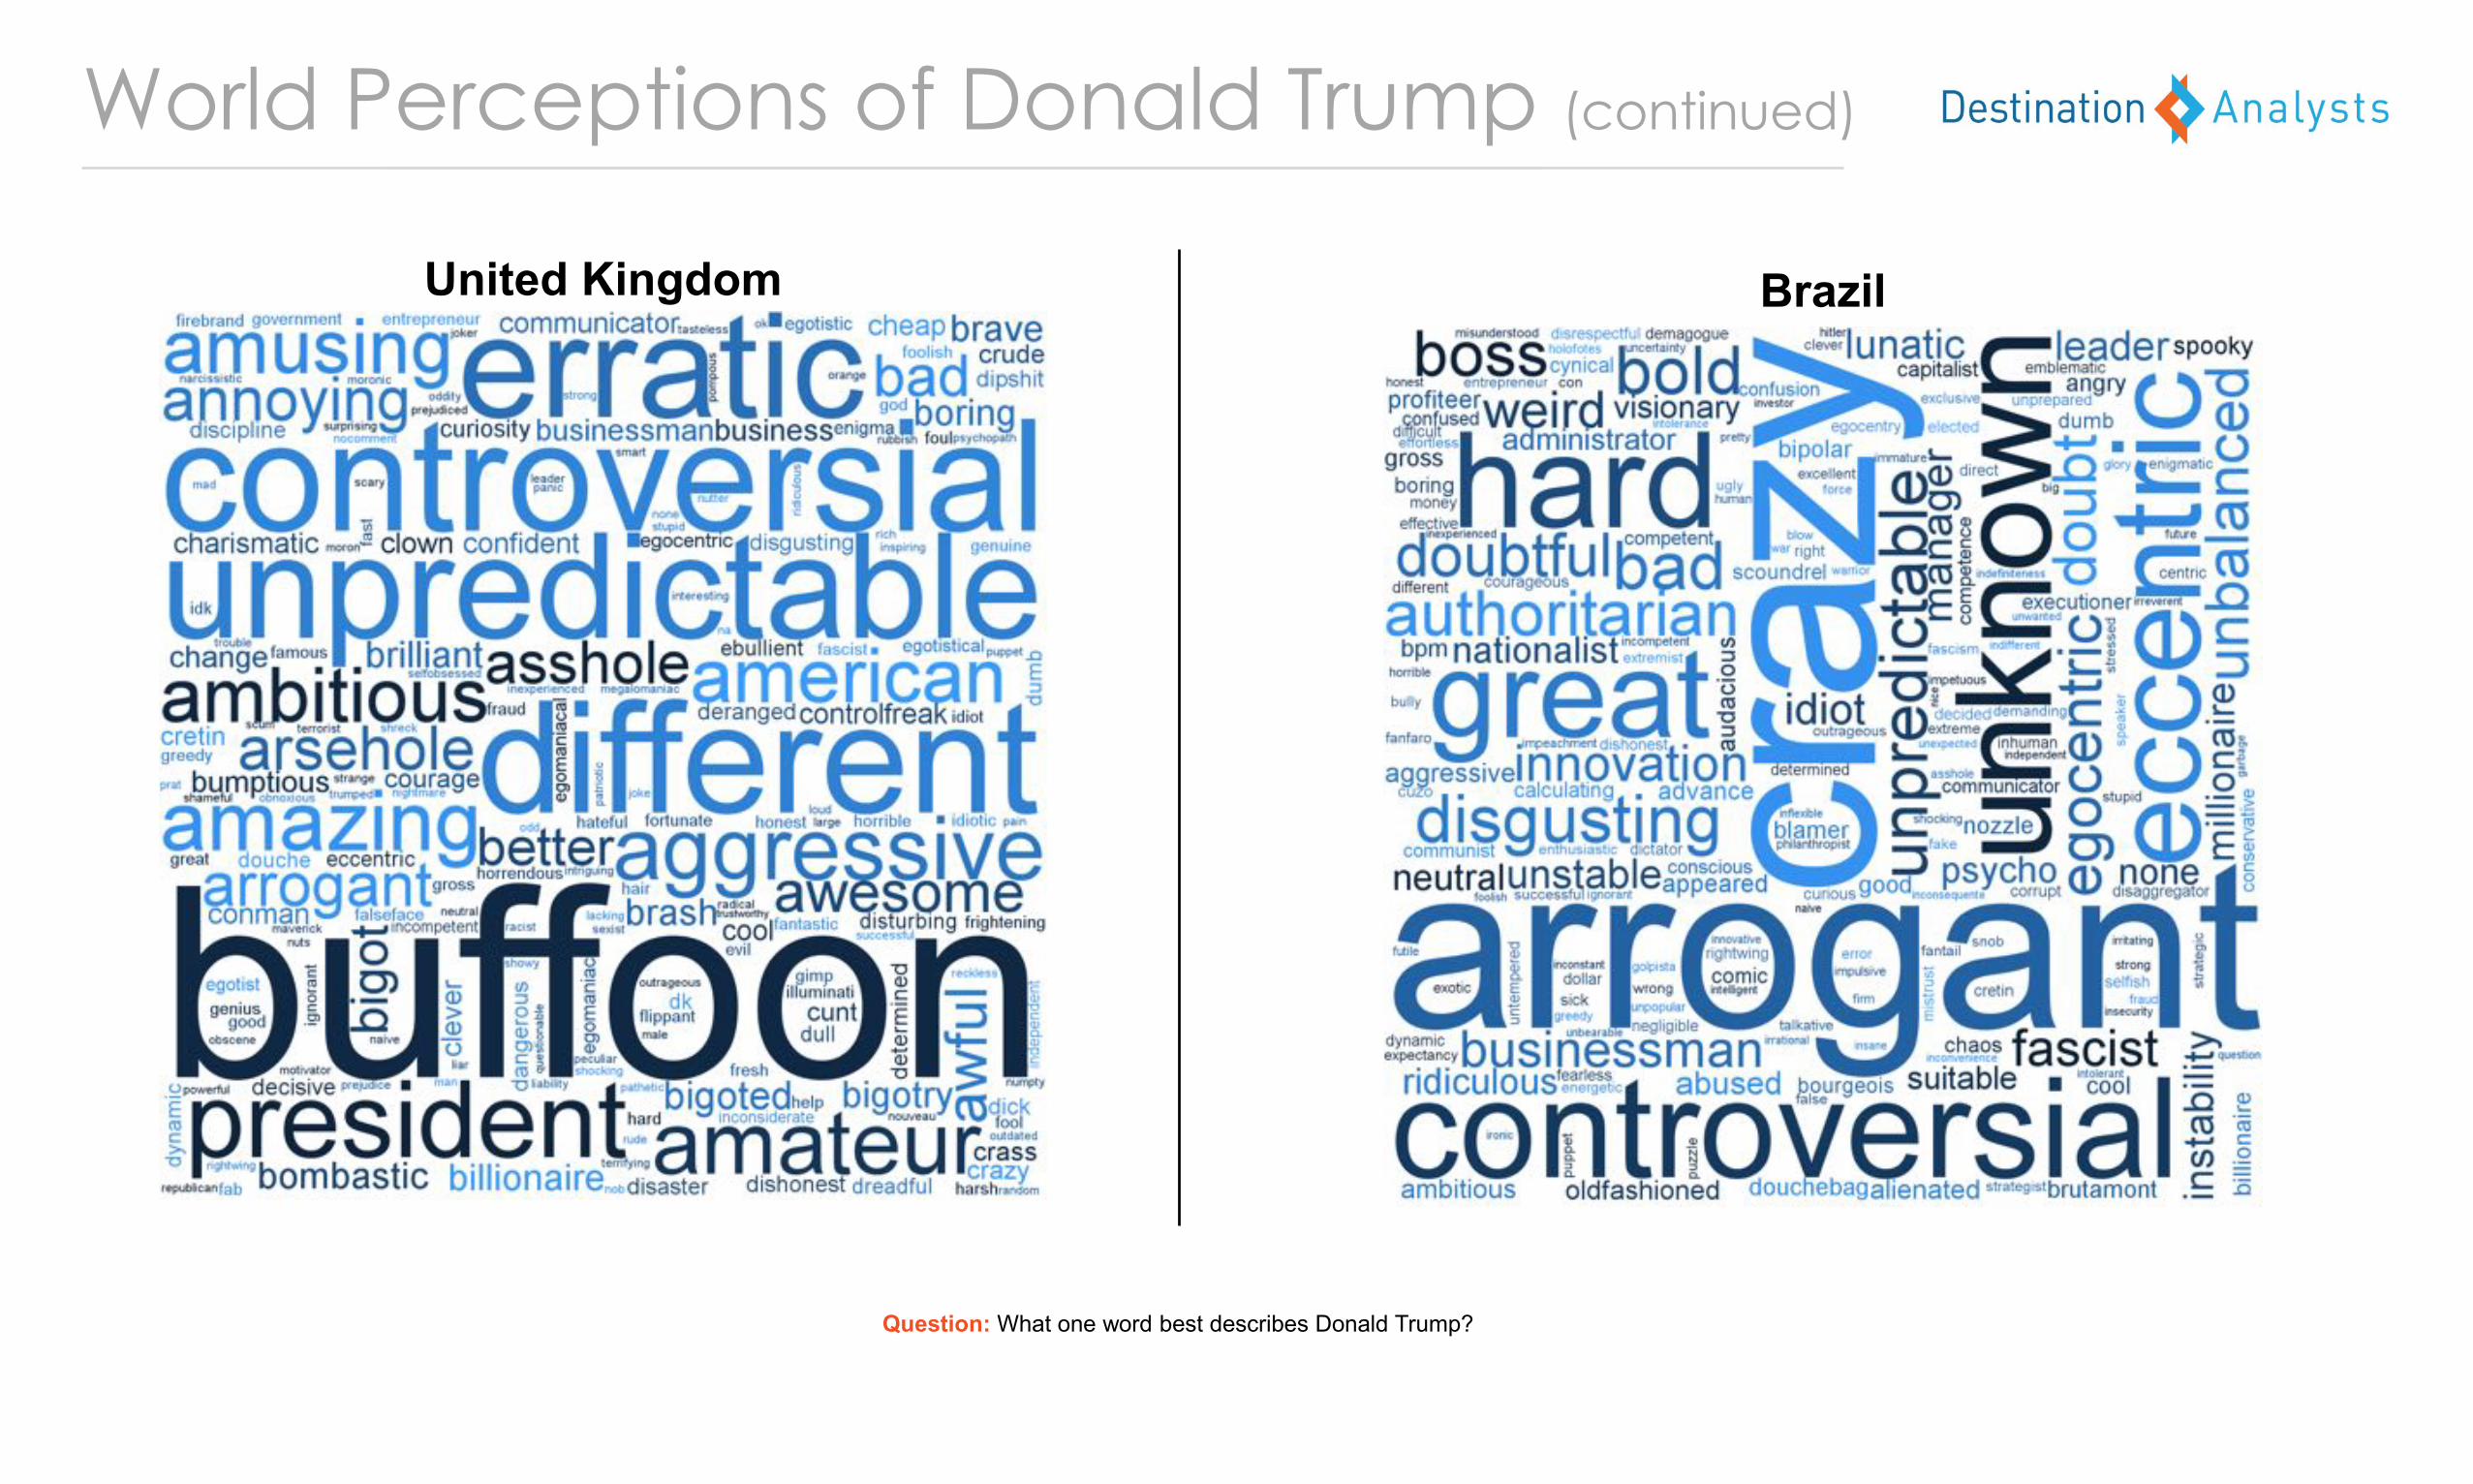
Brazil
World Perceptions of Donald Trump (continued)
United Kingdom
Question: What one word best describes Donald Trump?
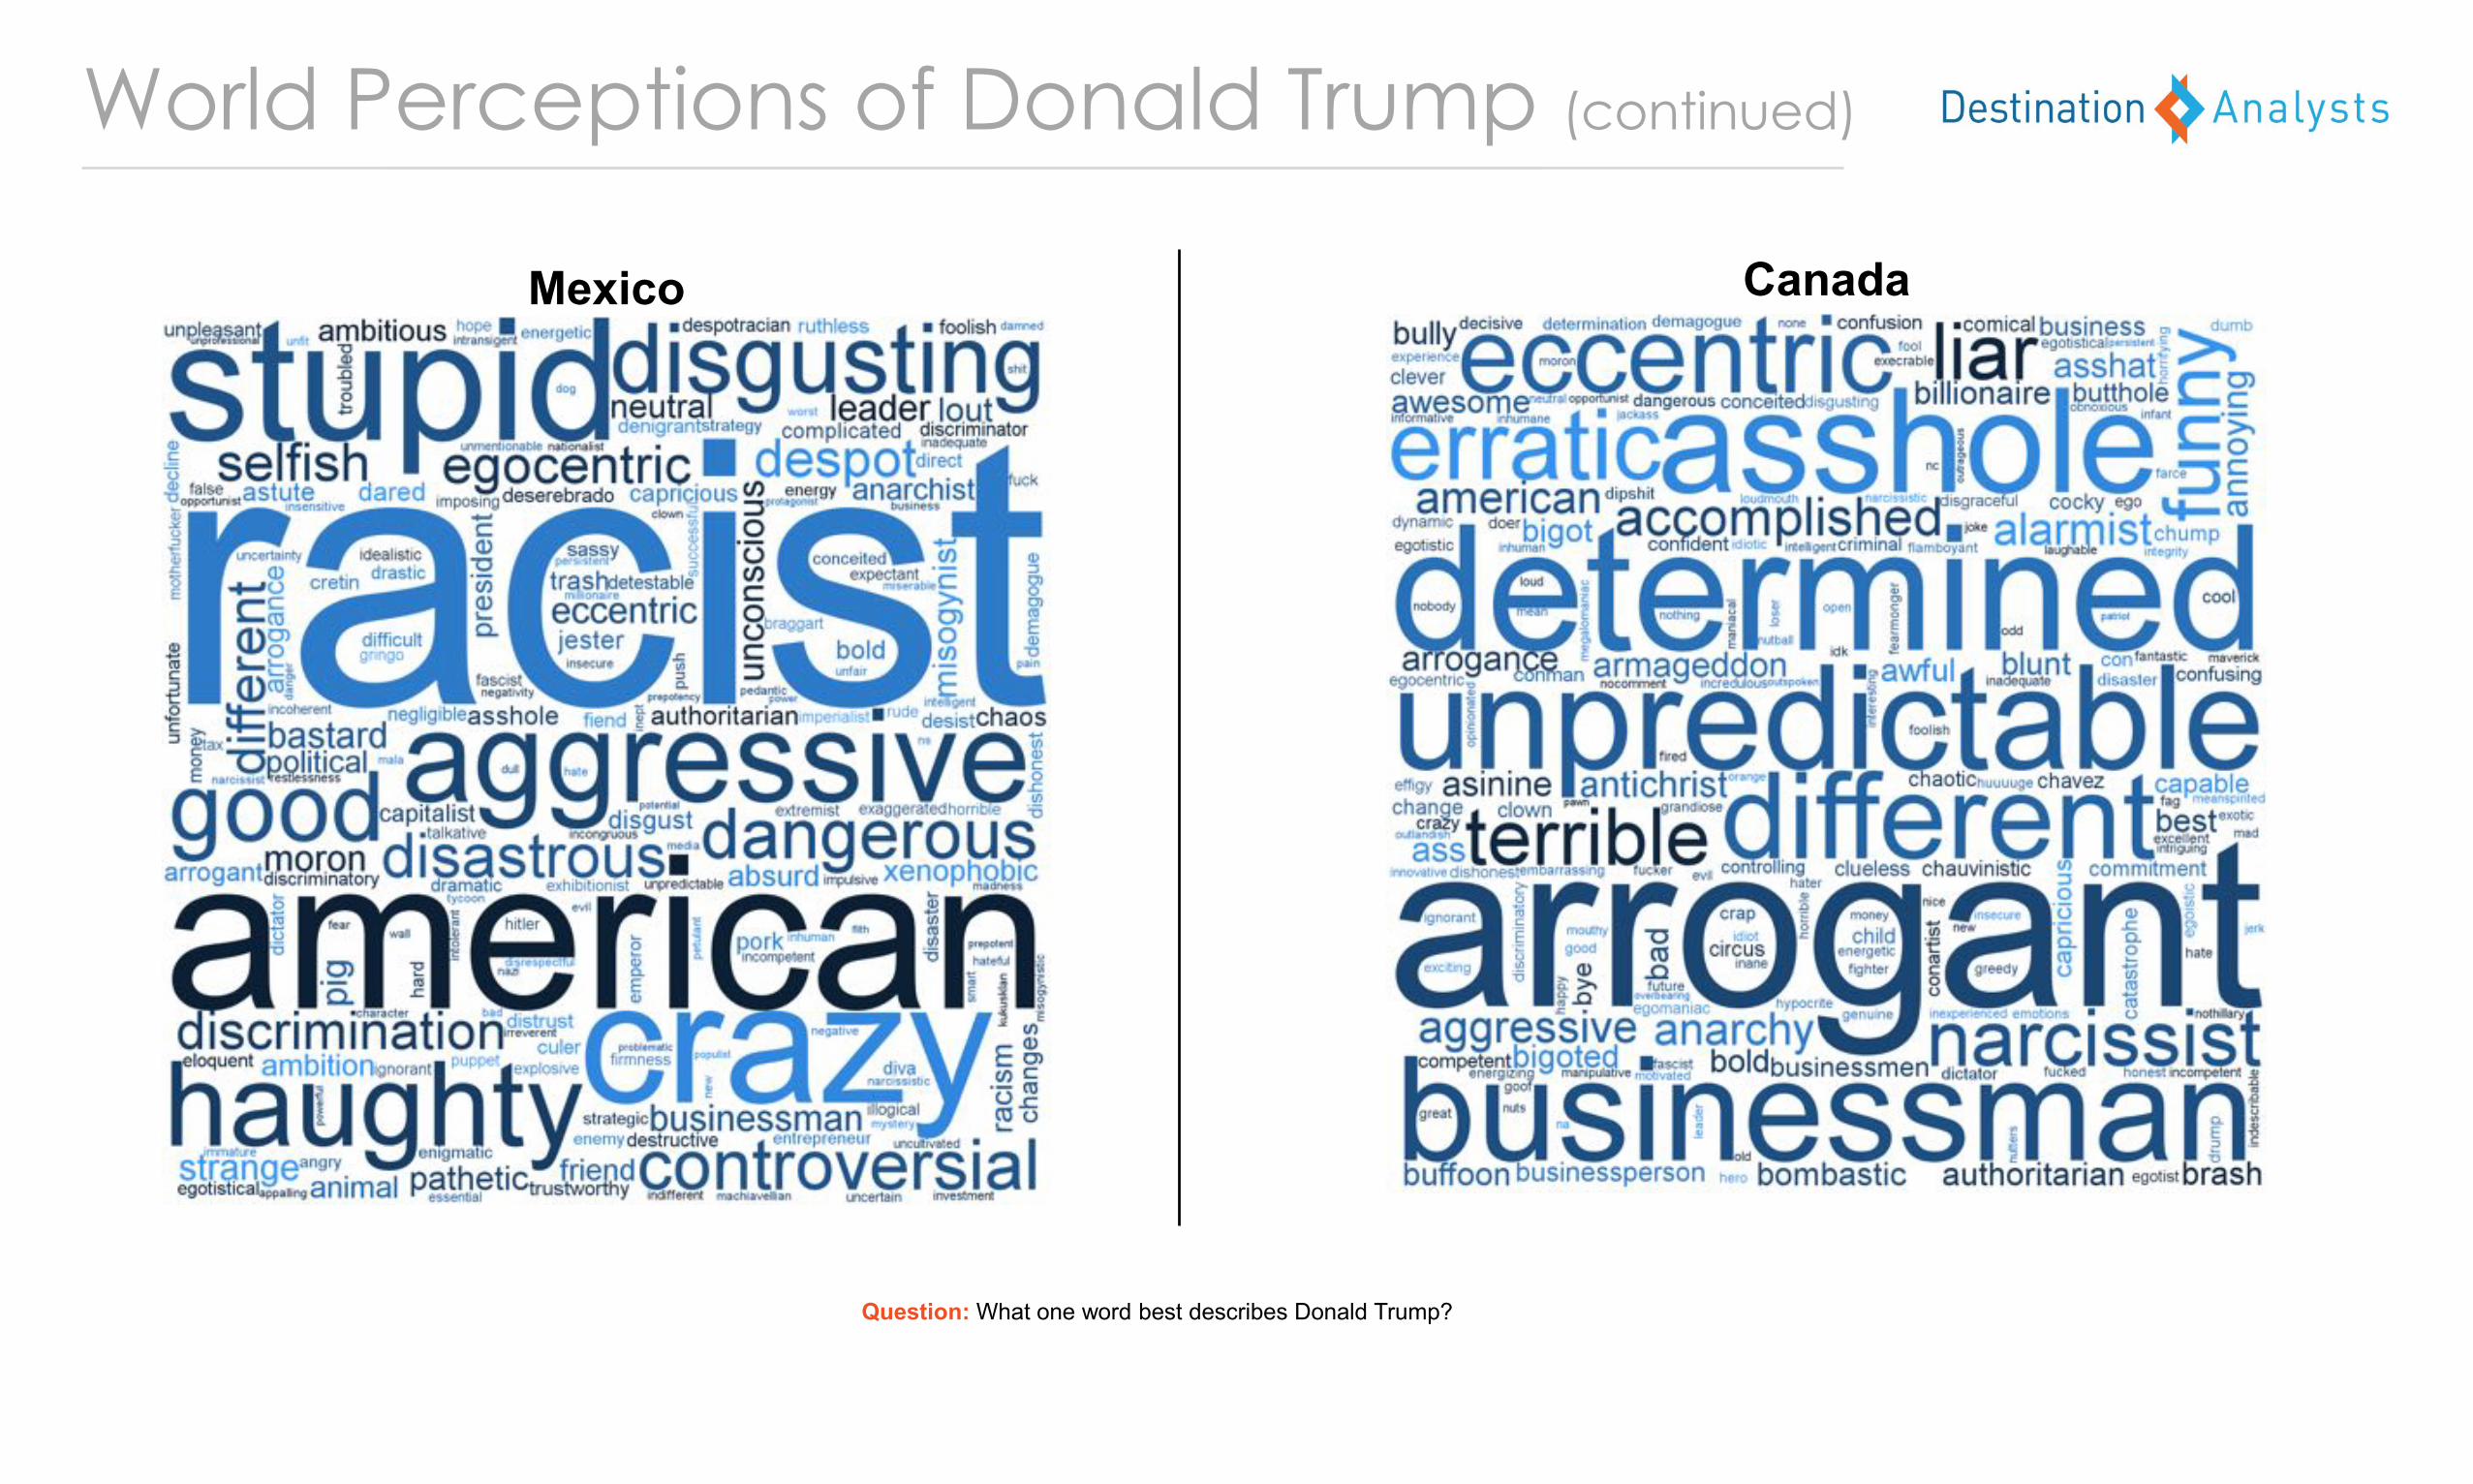
Canada
World Perceptions of Donald Trump (continued)
Mexico