Embed Size (px)
Citation preview

The STATE of POSTSECONDARY
EDUCATION in CANADA
2019

Higher Education Strategy Associates (HESA) is a Toronto-based firm providing strategic insight and guidance to governments, post-secondary institutions, and agencies through excellence and expertise in policy analysis, monitoring and evaluation, and strategic consulting services. Through these activities, HESA strives to improve the qual-ity, efficacy, and fairness of higher education systems in Canada and worldwide.
Author: Alex UsherEditors: Jonathan McQuarrie & Robert Burroughs
Please cite as:
Usher, A., (2019). The State of Postsecondary Education in Canada, 2019. Toronto: Higher Education Strategy Associates.
Contact:
Higher Education Strategy AssociatesSuite 207, 20 Maud Street, Toronto ON, M5V 2M5, Canada+1 (416) [email protected]
Design elements: Edward Wojciechowski
© Higher Education Strategy Associates, 2019

3
ABOUT THIS SERIES
Despite having one of the world’s more advanced and high-qual-ity systems of higher education, Canada has never been blessed
with readily available, up-to-date, and easily digestible data on its postsecondary sector. The purpose of this series from Higher Educa-tion Strategy Associates is to change that.
Canada’s higher education data challenges stem in part from the decentralized nature of our federal system, but in truth, Canadian governments and statistical agencies simply do not prioritize produc-ing high-quality data on education the way some other countries do. Though public data on institutional finances is as good as any in the world, data on employees (in particular non-academic ones) is scant; comprehensive data on student assistance is essentially non-existent, and data on students and graduates take an inordinately long time to appear—data on international students, for instance, routinely take three- to four-times as long to appear in Canada as they do in the US, the UK, or Australia. Further, our data on community colleges in particular is weak.
Ours is not the first attempt to present this kind of data. Until 2016, the Canadian Association of University Teachers (CAUT), put out an invaluable annual “almanac” (and continues to update the data on its website even if the almanac itself is not published in its old form), but the data skews towards universities and tends to be presented in tabular form rather than through more intuitive graphics. Universi-ties Canada has, over the years, put together some good publications on the state of the system, but these have become rarer as of late, and also largely miss the colleges and polytechnics. The Council of Min-isters of Education, Canada (CMEC) has an irregularly-published system of “Education Indicators” but these are more focused on edu-cation as a whole rather than on postsecondary, fall prey to the same preference for tables over graphs, and contain no narrative. Statistics

4
Canada produces a great deal of data (if not always very promptly) but does very little to help people interpret it.
It was for this reason that Higher Education Strategy Associates decided in 2018 to produce an annual publication called The State of Postsecondary Education in Canada, modelled on a set of pub-lications produced by Andrew Norton and his colleagues at the Grattan Institute in Melbourne entitled Mapping Australian Higher Education. This 2019 edition mostly covers the same topics as the inaugural edition: detailing trends in student and staff numbers, and looking at how the system is financed, both from an institutional and a student perspective. This year, we have augmented our coverage of these issues by adding some international comparisons and, in a couple of instances, new or more detailed data on Canadian students and academic staff. Next year, after the publication of results from the National Graduates’ Survey, we intend to put together a more thorough treatment of graduate outcomes in the Canadian system.
We hope that by putting all this information in a handy format, and providing some accompanying narrative, we can help improve the quality of public dialogue on postsecondary education policy issues. Any and all comments or suggestions about how to improve the publication for future years will be gratefully received.
Alex Usher August 2019

5
CONTENTSLIst of Figures 6List of tables 8
INTRODUCTION 9
CHAPTER ONE: Learners 131.1 Enrollment trends in postsecondary education 131.2 Enrollment trends in universities 141.3 Enrollment trends in colleges 181.4 Enrollment trends in apprenticeships 201.5 International students 211.6 Canada in international perspective 22
CHAPTER TWO: Staff 262.1 Academic staff at universities 262.2 Academic staff at colleges 29
CHAPTER THREE: Institutional Income and Expenditures 313.1 Income trends for PSE institutions 313.2 Expenditure trends for PSE institutions 34 Academic Wages 36
CHAPTER FOUR: Government Expenditures 384.1 Provincial expenditures on postsecondary education 384.2 Federal expenditures on postsecondary education 42
CHAPTER FIVE: Tuition & Student Aid 475.1 Tuition 47 Tuition by Field of Study 495.2 Student assistance 51 Need-based student assistance 51 Non-need-based student assistance 555.2 Student assistance 57
APPENDIX A: The Canadian Postsecondary Education System 60

6
LIST OF FIGURESFigure 1: PSE Institutions' Income from Non-governmental Sources as a Percentage of Total, 2001-02 to 2016-17 9Figure 2: The Gap Opens - Operating Expenditures vs. Provincial Grants, in billions ($2016), 2001-02 to 2016-17 10Figure 3: Closing the Gap - Growth in International and Domestic Tuition Fee Revenue, in billions ($2016), 2007-08 to 2016-17 11Figure 1.1: Full-time Equivalent Enrollments by Sector, 1992-93 to 2016-17 13Figure 1.2: Full- and Part-Time Students in Canadian Universities, 1992-93 to 2016-17 15Figure 1.3: Change in University Enrollments by Province, 2006-07 to 2016-17 15Figure 1.4: University Enrollments by Major Field of Study, 1992-93 to 2016-17 16Figure 1.5: First-Year Students by Visible Minority Status, 2017 17Figure 1.6: First-Year Students Reporting Disability, 2017 17Figure 1.7: Full- and Part-Time Student in Canadian Colleges, 1992-93 to 2016-17 18Figure 1.8: Change in College Enrollments by Province and Territories, 2006-07 to 2016-17 18Figure 1.9: College Enrollments by Major Field of Study, 1992-93 to 2016-17 19Figure 1.10: Apprenticeship Enrollments: 1995-2017 20Figure 1.11: International Enrollments by Sector 21Figure 1.12: Gross Enrollment Ratios, selected OECD Countries, 2017 23Figure 1.13: Proportion of Tertiary Students Studying in Predominantly Non-Bachelor’s Awarding Institutions, 2017 23Figure 1.14: Distribution of University Students by Field of Study, Selected OECD Countries, 2016 24Figure 2.1 Total Tenured & Tenure-track Academic Staff Numbers, Canada, 1992-93 to 2017-18 26Figure 2.2: Age Composition of Tenured & Tenure-track Staff, Canada, 1999-00 to 2015-16 27Figure 2.3 Average Salary by Rank 2001-02 to 2017-18, ($2017) 27Figure 2.4 Part-time Instructors’ Relationships with their Universities, Ontario, 2017 28Figure 2.5 Ratio of Full-time Academic Salaries to Non-Academic Salaries, all Canadian universities, 1979-80 to 2017-18 28

7
Figure 2.6: Full- and Part-time Academic Staff, Ontario Colleges, 2007-2018 29Figure 2.7: Full-time Academic, Support and Administrative Staff, Ontario Colleges, 2007-2018 29Figure 3.1: Total Income by Source for Public PSE Institutions, Canada, in billions ($2016), 2001-02 to 2016-17 31Figure 3.2: Tertiary Institutions’ Income by Source, as a Percentage of Gross Domestic Product, Canada and Selected OECD Countries, 2016 32Figure 3.3: Total Income by Source for Universities, Canada, in billions ($2017), 1979-90 to 2017-18 32Figure 3.5: Total Income by Source for Colleges, Canada, in billions ($2016), 2001-02 to 2016-17 33Figure 3.6 Expenditures on Administration as a Percentage of Total Spending, Universities vs. Colleges, 2001-02 to 2016-17 35Figure 3.7: Wages as a Percentage of Total Budget, Colleges, 2001-02 to 2016-17 36Figure 3.8: Wages as a Percentage of Total Budget, Universities, 2001-02 to 2017-18 36Figure 3.9: Percentage of Aggregate Academic Wages Going to Non-tenure Track Staff, 2000-01 to 2017-18 37Figure 4.1 Provincial Government Transfers to Institutions by Type of Institution, in billions ($2017), 2001-02 to 2017-18 38Figure 4.2: Changes in Provincial Transfers to Institutions by Province over 5 & 10 Years, ($2016) to 2016-17 39Figure 4.3: Budgeted Changes in Transfers to Postsecondary Institutions by Province, ($2019) 2016-17 to 2019-20 39Figure 4.4: Provincial Expenditures per FTE Student, in ($2016) 2016-17 40Figure 4.5 Total Provincial Funding per Full-Time Student, ($2016) 2001-02 to 2016-17 41Figure 4.6: Government PSE Expenditures as a Percentage of GDP by Province and by Sector, ($2016) 2016-17 41Figure 4.7: Research Granting Council Expenditures by Council, in millions ($2016), 2001-02 to 2016-17 42Figure 4.8: Direct Federal Funding to Postsecondary Institutions, excluding Tri-Council Funding, in millions ($2016), 2001-02 to 2016-17 44Figure 4.9: Federal and Provincial Own-Source Expenditures in Respect of PSE Institutions, Canada, in billions ($2016), 2007-08 to 2016-17 45Figure 5.1: Average Domestic Undergraduate Tuition and Fees, Canada, ($2019), 1995-96 to 2019-20 (est.) 47

8
Figure 5.2: Average Undergraduate Tuition and Mandatory Fees, by Province, 2019-20 (est.) 48Figure 5.3: Average Tuition Fees, by Field of Study, First-Entry Undergraduate Programs, 2018-19 49Figure 5.4: Average Tuition Fees, by Field of Study, Second-Entry Professional Undergraduate Programs, 2018-19 49Figure 5.5: Domestic vs. International Student Tuition, Canadian Universities, ($2018) 2006-07 to 2018-19 50Figure 5.6: International Student Tuition by Province, Canadian Universities, 2018-19 50Figure 5.7 Total Annual Loans & Grants Issued, Canada, Selected years, in millions ($2016) 53Figure 5.8 Total Annual Need-based Student Aid by Source, Selected years, in millions ($2016) 1996-97 to 2016-2017 53Figure 5.9: Total Value of Tax Credits, by Source, in millions ($2016) 55Figure 5.10 Total Canada Education Savings Grants Payments, in millions ($2016) 55Figure 5.11 Total Institutional Scholarships by Institutional Type, in millions ($2016) 56Figure 5.12 Total Student Financial Assistance by Type, Selected years, in millions ($2016) 1996-97 to 2016-2017 57Figure 5.13: Average Student Debt at Graduation, Universities and Colleges , Selected Years, ($2018) 1982-2018 59
LIST OF TABLESTable 1.1: Full-time Equivalent Enrollments by Sector and Province 14Table 1.2: Top Ten Major Trade Groups in Canada, 2007 vs. 2017 20Table 1.3 International Students by Sector and Province, 2016-17 22Table 1.4: Apprenticeship Registrations by Occupation, Canada vs. Germany, 2017 24Table 3.1: Distribution of Total Expenditures by Fund, Colleges and Universities, 2016-17 34Table 3.2: Distribution of Spending by Type, Universities and Colleges, 2016-17 35Table 4.1: Top 15 Institutional Recipients of Federal Research Grants, by Council 2018-19 43

9
The state of postsecondary education in Canada in 2019
is strong financially, but weak in terms of policy. For too long, postsecondary education has been a subject about which no one wants to debate too loudly. However, the consequences of policy neglect are piling up, and we may find in a few years that we have sleepwalked into a system that nobody actually wanted.
The most important new reality is that for the first time since the 1950s, public sources are no longer the dominant source of income for Canada’s postsecond-ary system. In other words, for the first time since the Second World War, more than half of university and college revenues do not come from the govern-ment. As a result, the country needs to update the way it talks about postsecondary education: we are transitioning from a
six-decade period where PSE was publicly-funded, into a new era where it can be better described as “publicly-aided”.
Declining provincial govern-ments’ funding of institutions is the main cause of this change. Funding peaked at about $22 billion (in constant $2016) in 2010-11 and has since fallen back by 5% to about $21 billion. This decline occurred despite enrol-ment increases; when measured
INTRODUCTION
Figure 1: PSE Institutions' Income from Non-governmental Sources as a Percentage of Total, 2001-02 to 2016-17
30%
35%
40%
45%
50%
55%
2016
-17
2015
-16
2014
-15
2013
-14
2012
-13
2011
-12
2010
-11
2009
-10
2008
-09
2007
-08
2006
-07
2005
-06
2004
-05
2003
-04
2002
-03
2001
-02

10
on a per-student basis, the decline in provincial funding is in the order of 15%. For the most part, these cuts have not been dramatic: in fact, the erosion of provincial funding has been rather quiet. A halt to construc-tion programs here, a nominal freeze in operating grants there. But even in the absence of drama, over a decade these little nicks and cuts add up.
This drift in provincial govern-ment policy has not resulted in diminished activity at Canadian universities and colleges. On the contrary, over the past decade,
Canadian institutions have accomplished some important things. Enrolment grew by 21%. Research output—both basic and applied—increased substan-tially. Institutions coped with higher IT costs as computing be-came ubiquitous, as the demand for student services increased, and—especially—as the pro-portion of students enrolling in expensive STEM programs grew.
Provincial governments aren’t paying for any of this new activity; students are. As figure 2 shows, the gap between institu-tional operating expenditures
and provincial grants widened from $6.1 billion ($2016) in 2007-08 to $12.0 billion in 2016-17. That $5.9 billion gap was filled almost exclusively by increases in tuition revenues, which rose from $8.1 billion to $13.7 billion over the same period.
How did universities and col-leges close this gap? In the early years after 2007-08, they met it through increased domestic enrolment. But there were two limits to this strategy. First, domestic students did not bring in a great deal of new money
Figure 2: The Gap Opens - Operating Expenditures vs. Provincial Grants, in billions ($2016), 2001-02 to 2016-17
$10
$15
$20
$25
$30
$35
Provincial GrantsOperating Expenditures
2016
-17
2015
-16
2014
-15
2013
-14
2012
-13
2011
-12
2010
-11
2009
-10
2008
-09
2007
-08
2006
-07
2005
-06
2004
-05
2003
-04
2002
-03
2001
-02

11
and governments in this period generally frowned upon tuition increases that were much higher than inflation. Second, demo-graphic change made young peo-ple scarcer: domestic enrolment in colleges peaked in 2011-12 and in universities in 2013-14. What that left was international stu-dents, who were an increasingly tempting source of revenue. By 2016-17, the number of interna-tional students had risen 123% over 2007-08 levels, but their fee revenue rose by over 218%, leav-ing institutions roughly $3.25 billion richer than they had been
nine years earlier (domestic fee revenue rose by a more modest $2.34 billion, or 35%).
This massive infusion of fee in-come is slowly but surely chang-ing the nature of the Canadian PSE system. Not only do many universities now derive more fee income from international stu-dents than domestic ones, many now derive more income from international students than from their provincial governments. The worry here is not so much that a system which is major-ity-privately funded cannot produce scholarly excellence or
provide wide access – the higher education systems of the United States, Australia and the UK all stand as proof that these things are possible. Nor is it even nec-essarily a worry that institutions become too “market-oriented”, as market discipline is useful to counteract some of academia’s more notorious inclination towards introspection. The question is whether this student market is primarily the one that will also pay taxes to maintain the institution, or one which resides across distant oceans and which has few reasons to care
Figure 3: Closing the Gap - Growth in International and Domestic Tuition Fee Revenue, in billions ($2016), 2007-08 to 2016-17
$0
$1
$2
$3
$4
$5
$6
Domestic International
2016-172015-162014-152013-142012-132011-122010-112009-102008-092007-08

12
about the health of the commu-nities in which institutions are situated. What is at stake is the public, local mission of universi-ties and colleges.
Having avoided open debate on this topic for so long, and allowed policy drift to set in, Canada is faced with three dis-tinct choices about the future its postsecondary system.
First, there is the option of significant domestic re-invest-ment in postsecondary funding, which would obviate (or miti-gate) the need to continue court-ing international students. This is not by any means impossible: in the 2000s, provincial gov-ernment transfers to institution regularly rose by 5% per year, on top of inflation. In provinces with balanced budgets—mainly British Columbia and Que-bec—such re-investments are at least conceivable. Elsewhere, we would likely need to see a return the kind of sustained high growth rates we saw in the 1960s (and again, briefly, in the early 2000s) to make this possible.
Second, there is the option of reducing the growth in univer-sity and college expenditures by relieving them of particular re-sponsibilities. Perhaps we could
reduce research output (basic or applied), which increases time available for teaching, allow facilities to age more before replacing them, offer fewer stu-dent services, or institute more aggressive minimum class size requirements.
That will not stop growth entirely—Baumol’s Law states that labour-intensive industries, such as education (which mostly cluster in the public sector) are less prone to capital substitution and thus become more expensive over time—but it will never-theless put at least some brakes on the relentless quest for new revenue.
Or, third, Canadian institu-tions could continue on our present path of continued expan-sion paid for mainly by interna-tional students. There are worse things in the world, presumably,
than ending up with a postsec-ondary system like Australia’s. But there are risks, too. The most important one, potential-ly, is a vicious spiral, where the need to focus on international students distracts from attention to local communities, which results in decreased local support for public funding, which leads to funding erosion, which leads to greater focus on international students…
There is, of course, the option to do a little bit of each of these three—i.e., be a bit more restrained in spending while receiving a bit more money from provinces and continuing to re-cruit international students only not quite as aggressively. But there is no fourth option, some unicorn solution that allows us to avoid hard choices. The hope is that we actually make such choices consciously, and with due deliberation, rather than drifting into choices we will later regret through inaction and inattention.
The choice is ours.
What is at stake is the public,
local mission of universities and
colleges.
13
Enrollments in universities and colleges have been rising steadily in Canada since the turn of the century. Throughout the 1990s, total enrollment (full-time and part-time) was relatively consistent, hovering between 1.3 and 1.4 million students. After 1999, numbers began to increase again until they touched 2 million in 2011-2012, since which time further growth has been mini-mal. In 2016-17, Statistics Canada reported total headcount enrollment at 2.05 million, though for reasons unknown this data appears to be missing at least one Ontario college; a more accurate count using data from Colleges Ontario to correct for the missing entries would put the number at 2.06 million.
Figure 1.1 shows changes in full-time equivalent (FTE) enrollment in Canada’s universities and
1. The term "full-time equivalent" (FTE) in Canada is a mathematical approximation equal to full-time students plus [part-time students ÷ 3.5]; it does not mean actual full-load equivalents based on credits taken.
colleges1. As of 2015-2016, there were roughly 1.7 million full-time equivalent students in Canadian PSE institutions, with roughly one-third enrolled in colleges and two-thirds in universities. Since the turn of the century, enrollments have been grow-ing more quickly in universities than in colleges.
CHAPTER ONE: Learners
Over 2.5 million Canadians are enrolled in universities, colleges, and apprenticeships. This represents roughly 6.8% of the entire population, a figure that is almost equivalent to the population of the
four Atlantic provinces put together, or the combined workforces of the construction and manufactur-ing industries. This chapter provides a high-level overview of where and what these students study.
1.1 Enrollment trends in postsecondary education
Figure 1.1: Full-time Equivalent Enrollments by Sec-tor, 1992-93 to 2016-17

14
UNIVERSITIES COLLEGES TOTALNewfouNdlaNd & labrador 15,507 6,969 22,476
PriNce edward islaNd 3,865 2,138 6,003
Nova scotia 38,022 10,203 48,226
New bruNswick 17,289 6,674 23,963
Quebec 241,124 200,952 442,076
oNtario 473,636 242,106 715,742
MaNitoba 40,061 11,796 51,857
saskatchewaN 32,256 11,808 44,065
alberta 116,697 52,695 169,392
british coluMbia 132,937 61,660 194,597
TerriTories 0 1,868 1,8681,111,394 608,870 1,720,264
Table 1.1: Full-time Equivalent Enrollments by Sector and Province
Canadian provinces differ vastly in size, and so too do their provincial systems of higher education. But comparing provincial enrollments can still bring surprises. For example, New Brunswick is nearly 45% larger than Newfoundland & Labrador in population, but its postsecondary sector is only 7% larger; similarly, Nova Scotia’s population is 25% larger than New Brunswick’s, but its post-secondary population is more than twice as large.
Ontario has the country’s most outsized univer-sity system, making up roughly 43% of total seats (compared to just 38% of the country’s popula-tion). Quebec, with just 22% of the population, has one-third of the college students, due mainly to the CEGEP system’s status as a pre-requisite to university study (see Appendix A for more on this system).
1.2 Enrollment trends in universities
Turning specifically to university stu-dents, the first decades of the 21st century look very different than the last decade of the 20th. In the late 1990s, full-time enrollment was essentially flat.
Part-time enrollment declined somewhat during the same period, following a period of expansion in the 1980s when professions such as nursing and teaching began retroactively requiring prac-

15
titioners to hold bachelor’s degrees, which they mainly attained through part-time study. Stagnant full-time enrollments during the 1990s were partly a product of demographics, but they were also the result of repeated provincial cuts to university grants, which led to capacity issues and a reluc-tance from institutions to admit more students.
From about 2000 onwards, growth—a constant for most of the post-war period—resumed, so that by 2016-17, full-time enrollments were 69% higher than they were in 2000-01.
In part, this increase was due to demography: by the late 1990s, the children of the baby-boomers (the so-called “baby boom echo”) were starting to flood into postsecondary education and in-crease the size of the potential cohort. In addition, demand for higher education increased due to technological change. Accommodating those twin pressures—higher demand and a growing
youth cohort—required some extraordinary measures. Two events stand out: the first was the Ontario government’s decision to end the system of Ontario Academic Credit (which, in practice, was a 13th grade of high school) in 2002, creating a “double-cohort.” Funding was granted to enlarge its universities, not only to accommodate the one-time system growth, but to permanently expand capacity as well. The second was the decision of the provinces of Alberta and British Columbia to ex-pand their postsecondary systems by transforming some former community colleges into universities.
However, growth in university enrollments has not been universal. In the Atlantic provinces, growth has been low or even negative over the past decade, mainly due to local demographic trends. Quebec, Ontario, Manitoba, and Saskatchewan have all had slightly better demographic trends (Quebec especially), and have seen growth in the 20-25% range since 2005-06. In addition to the conversion of several former colleges into universities since
Figure 1.2: Full- and Part-Time Students in Canadian Universities, 1992-93 to 2016-17
Figure 1.3: Change in University Enrollments by Province, 2006-07 to 2016-17

16
2005-06, Alberta and British Columbia have also had more favourable demographic growth; both factors account for these provinces’ much larger increases in university student numbers.
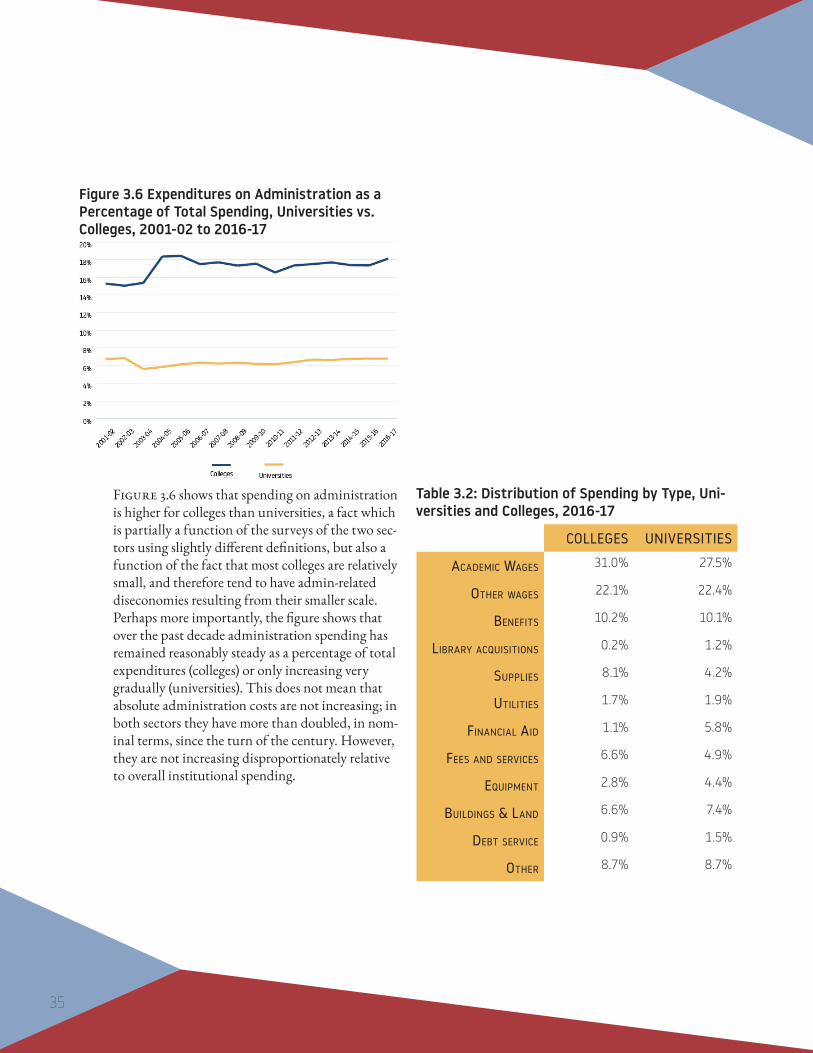
Changes in Field of Study
Figure 1.4 looks at changes in university enroll-ments by field of study. In the 1990s, when total enrollment was declining due to reductions in the number of part-time students, enrollments fell in Business, Science, Humanities, and Social Scienc-es. Starting at the end of the 1990s though, nearly all fields of study began to grow at roughly similar rates. The exception was Education: due to falling birth rates in the late 80s and early 90s, education systems began to require fewer teachers; univer-sities adapted by limiting enrollments to teacher training programs. Enrollment growth in most fields of study continued until 2010 or so, when Humanities enrollments began falling while other
fields continued to increase. Between 2009-10 and 2016-17, enrollment in Humanities was down by 17%, while Business increased by 20%, Health by 25%, Science by 28%, and Engineering by 38%.
Changes in Student Demographics
With the exception of a brief interlude in the 2000s when it twice ran a survey called the Postsecondary Education Participation Survey (PEPS), Statistics Canada has never really tried to measure anything about the Canadian student population. This ab-sence leaves us with neither administrative data nor fully comprehensive survey data on anything that would provide demographic information on the student body with respect to ethnicities, disabil-ities or family socio-economic background. But this does not mean that we know nothing about the composition of the student body. Every year, the Canadian Undergraduate Survey Consortium carries out a survey across a large number of Cana-dian campuses, alternating on a three-year sched-ule between first-, middle-and final-year students. While the sample from this survey is biased (it gets higher participation from smaller institutions and does not have high participation in Quebec), it is the best national source of data on student charac-teristics.
Perhaps the most interesting finding from the winter 2019 survey of first-year students is that 44% described themselves as being a “visible minori-ty” (see figure 1.5), which is more than triple the number of those who did in 2001. Even if we exclude all those who say they are international students (not all of whom are visible minorities), the figure is still 35%. Partly, this change reflects
Figure 1.4: University Enrollments by Major Field of Study, 1992-93 to 2016-17

17
the country’s changing ethnic composition, but it also reflects the fact that visible minorities are more likely to go to school than other Canadians. Consider, for example, that among Canadians aged 15-24 at the time of the 2016 census, only 27% indicated they identified as a visible minority; with somewhere between 35-44% of domestic students claiming the same, that suggests an over represen-tation of between 30-60%. Very few other coun-tries can say anything similar; normally, minority populations are much less likely to attend universi-ty than the visible majority.
Another significant shift over time is in the proportion of students who self-report having a disability/impairment (see figure 1.6). Between 2001 and 2013 this figure crept up from 5 to 9%—whether because more students with disabilities were accessing education or because of a reduced stigma in disclosing disabilities (or both) is im-possible to determine. In 2016, the wording of this question changed to explicitly include mental health issues, and the proportion shot up to 22% before rising again to 24% this year. More than half of these students indicated that they had a mental health issue.
Figure 1.6: First-Year Students Reporting Disability, 2017
Figure 1.5: First-Year Students by Visible Minority Status, 2017

18
1.3 Enrollment trends in colleges
College enrollment has increased sub-stantially over the past two decades, at rates rough-ly similar to those seen at universities (see figure 1.7). However, data collection on the college side is less reliable and Statistics Canada has changed the way it counts vocational education students, so some of the increase may be more nominal than real. Nevertheless, the increase on the college side is even more significant when one considers that many tens of thousands of college students were removed from the college count in Alberta and British Columbia when several institutional status-es changed from college to university.
Figure 1.8 shows changes in college enrollments by province over the last decade. The three biggest gainers—Manitoba, Saskatchewan, and the Terri-tories—all appear to be statistical anomalies, and figures reflect changes either in the way Statistics Canada counts students or the way institutions report them to Statistics Canada rather than an actual change in enrolment. Elsewhere, growth has been modest and in two provinces—Alberta and British Columbia—enrolments fell substantially, mainly due to both having several institutions switch status from college to university.
Figure 1.7: Full- and Part-Time Student in Canadian Colleges, 1992-93 to 2016-17
Figure 1.8: Change in College Enrollments by Prov-ince and Territories, 2006-07 to 2016-17

19
Figure 1.9 shows enrollments in colleges by field of study. This figure may surprise people who are used to thinking of colleges as being techni-cally-oriented, since it shows Humanities was the number one field of study for several years.
That is due in no small part to the unique nature of Quebec colleges: a very large proportion of those students headed to university in that province (via the CEGEP system) are enrolled in programs labelled as “Humanities”. The big increases in enrollment over the last twenty years have largely come in the areas of Business and Health, with smaller contributions from Social Sciences and Engineering.
Because Polytechnics (see What is a Polytechnic, Appendix a) are not an official category of institu-tion, we have no official count for students at these institutions. However, the 13 members of Polytech-nics Canada do self-report some data. For 2016-17, they reported a full-time equivalent enrollment of 261,771. 96% of these enrollments would be con-sidered college enrollments by Statistics Canada, while only 4% (those from Kwantlen Polytechnic University in British Columbia) would be counted as university students. The 13 self-described Poly-technics thus enrol 43% of all college students, and two-thirds of all college students outside Quebec.
Figure 1.9: College Enrollments by Major Field of Study, 1992-93 to 2016-17

20
2007 2017Electricians 59,421 Electricians 69,987Carpenters 47,871 Plumbers, pipefitters and steamfitters 44,931Automotive service 41,706 Carpenters 42,732Plumbers, pipefitters and steamfitters 35,106 Automotive service 41,115Hairstylists and estheticians 16,374 Food service 19,977Welders 16,350 Interior finishing 17,280Interior finishing 16,266 Hairstylists and estheticians 15,000Exterior finishing 12,909 Welders 14,517Food service 12,504 Heavy duty equipment mechanics 12,966Heavy equipment and crane operators 11,781 Heavy equipment and crane operators 12,825
Apprentices are considered postsecond- ary learners, but they are not enrolled in insti-tutions, per se. Their enrollment as apprentices merely means that they have a contract with an employer in which both sides agree the apprentice will follow a particular course of learning and will periodically attend in-class training (see Appren-ticeships, Appendix A). Apprentice numbers were very low in the mid-1990s, reflecting a roughly 15-year trough in commodity prices and a generally weak Canadian economy (see figure 1.10).
However, from the late-90s onward, the national economy began growing more rapidly, inducing an expansion of employment in construction and necessitating the creation of many new apprentice positions. The decade-long run-up in commodity prices also created new demand for apprentices,
particularly in Western Canada, in trades related to construction and resource extraction. The result was a rise in the number of apprentices, from
1.4 Enrollment trends in apprenticeshipsFigure 1.10: Apprenticeship Enrollments: 1995-2017
Table 1.2: Top Ten Major Trade Groups in Canada, 2007 vs. 2017

21
175,000 in 1997 to a peak of 450,000 in 2013.
Despite the recent slow-down of several sectors of the resource extraction economy, the decline in apprentice numbers has been relatively slow and muted. It is possible that this has something to do with companies being more far-sighted and keep-
ing apprentices on during a downturn rather than letting them go to cut costs. However, it is more likely that it has to do with the way apprentices are counted: New apprentices are registered right away because they submit forms, while individuals leav-ing apprenticeship positions are neither document-ed completely nor quickly.
1.5 International students
Since about 2000, the number of inter-national students at the postsecondary level in Canada has risen dramatically, from just under 40,000 in the late 1990s to over 245,000 in 2016-17. This rise was gradual at first, then rapid from 2009 onwards. There are some a couple secondary reasons for this growth: international students are appreciated because they bring diversity to class-rooms across the country and (marginally) because their presence burnishes institutions’ standings in world rankings, which regard the presence of inter-national students as an indicator of quality.
However, the main reason behind the growth is that international students pay much higher tuition fees than domestic students and are thus seen as a way of offsetting stagnant government funding. In 2016-17, international students made up 14% of all university enrollments and 11% of college enrollments
As with the general student population, interna-tional students are not distributed equally across all provinces. For instance, over half of all the international students in Atlantic Canada are in Nova Scotia; similarly, half of all international
students in Western Canada are in British Colum-bia, where they make up roughly a quarter of the student body at the university level (see Table 1.3 on next page).
Figure 1.11: International Enrollments by Sector

22
One perennial question about the post- secondary education system in Canada is how it fares in comparison to systems in other countries. This question is far harder to answer than one might think since systems in different countries contain different types of institutions and offer degrees of various length. Most comparative ques-tions can only be answered imperfectly; neverthe-less, some basic comparisons are possible.
The first question has to do with the size of the overall system and the number of students it contains. Ideally, one would do this by looking at “net enrollment ratios”, which is a way of divid-ing the number of students in “typical” tertiary attendance (i.e. domestic students attending
tertiary institutions between the ages of 18-24) and divide it by the total number of the country’s inhabitants in the same age range. This is difficult to do internationally because most countries do not make available sufficiently detailed data on the age distribution of their student body to allow for a net enrollment count. So, most international comparisons rely on something called the “Gross Enrollment Ratio”, which is total enrollment, divided by the number of inhabitants in a relevant age bracket.
For the purpose of figure 1.12, this bracket is the five-year age bracket between ages 20-24, and results are shown for Canada and seven other comparator countries: Australia, France, Germany,
1.6 Canada in international perspective
UNIVERSITIES COLLEGESNewfouNdlaNd & labrador 2,499 75
PriNce edward islaNd 810 186
Nova scotia 8,139 3
New bruNswick 2,814 498
Quebec 39,780 5,412
oNtario 64,932 37,614
MaNitoba 6,309 1,992
saskatchewaN 4,677 567
alberta 13,065 5,241
british coluMbia 36,765 14,514
Table 1.3 International Students by Sector and Province, 2016-17

23
Japan, South Korea, the United Kingdom and the United States. Canada’s figure is 84%, which is close to the median among these countries. Note that of the four countries below Canada, three offer undergraduate degrees of only three years in length (this is also true of Australia, but its figures are boosted by the very large number of interna-tional students enrolled there).
One of the remarkable features of the Canadian system is the high proportion of students enrolled in non-university institutions. This is partly a function of Quebec’s unique CEGEP system, but also because of the strong tradition of professional and vocational education carried out in these insti-tutions right across the country (see Appendix A, What is a College).
As figure 1.13 shows, over 35% of Canadian ter-tiary-level students are enrolled in these “non-uni-versities”, the highest among the selected countries.
The US, Korea, and Japan, all of which have some-what similar “junior” or “community” college systems, also have relatively high enrollment rates (over 20%) in these types of institutions.
The number is much lower in Europe where these types of institutions are relatively unknown: Germany has zero students in institutions of these types, which may seem strange given their vaunted technical education system. This is partly because its apprenticeship arrangements are considered a part of the secondary education system rather than postsecondary, and partly because their large number of Fachhochschule—institutions that are sometimes compared to community colleges on the grounds that they are not universities (and which educate roughly a third of all German ter-tiary students) – are actually closer to universities since 100% of the credentials they distribute are bachelor’s degrees.
Another useful international comparison has to do with the distribution of students by subject area, which we can broadly track via data collected by
Figure 1.12: Gross Enrollment Ratios, selected OECD Countries, 2017
Figure 1.13: Proportion of Tertiary Students Studying in Predominantly Non-Bachelor’s Awarding Institutions, 2017

24
the OECD on degrees awarded in each country. As figure 1.14 shows, science enrollments—that is, enrollments in STEM and Health disciplines combined—range from 36% of total enrollments in the US to 45% in Korea and Germany (Canada is at 38%). Meanwhile the disciplines which might be grouped together as “non-laboratory”—Arts, Social Science, Business, Law and Education—make up a majority of total enrollments in every country except Korea, and Canada is second-high-est behind Australia in this respect, with 60% of enrollments in these disciplines.
A final international comparison to make is with respect to apprenticeships. These are extraordinari-ly difficult to compare multilaterally because of the vast differences in how these programs are defined and delivered. Nevertheless, a comparison between Canada and Germany is instructive, mainly be-cause of the way that Germany’s “dual system” of education is so often credited with German success in manufacturing.
Yet, a closer look at the patterns of apprenticeship registrations in the two countries suggests this credit may be misplaced. One of the distinguish-ing features of Canadian apprenticeships is the way they are focussed on very traditional trades, particularly the construction trades. As table 1.4 shows, eight out of the top ten trades in Canada—accounting for 60% of all apprentices—are related to the construction or automotive industries.
CANADA GERMANYElectricians 69,987 Office clerk 71,226Plumbers, pipefitters and steamfitters
44,931 Automotive Mechanics 65,163
Carpenters 42,732 Retail Clerk 57,366Automotive service 41,115 Industrial Sales 49,089Food service 19,977 Industrial Mechanics 43,977Interior finishing 17,280 Medical Assistant 39,948Hairstylists and estheticians 15,000 Retail Sales 39,510Welders 14,517 Electrician 38,394Heavy duty equipment mechanics
12,966 Wholesale clerk 37,119
Heavy equipment and crane operators
12,825 Sanitary/HVAC System Mechanics
33,474
Table 1.4: Apprenticeship Registrations by Occupation, Canada vs. Germany, 2017
Figure 1.14: Distribution of University Stu-dents by Field of Study, Selected OECD Coun-tries, 2016

25
In Germany, nearly all of the top trades are in white-collar occupations, such as retail sales, indus-trial sales, office clerks, and medical assistant.
In fact, Canada has over 80% more apprentice elec-tricians than Germany, despite the latter country having a population more than twice as large. That said, apprenticeships in Germany last only half
as long, so the number of people qualifying from their apprenticeships may be more or less the same. All of which is simply to note that the German system of apprenticeships is much different to our own and given that, it is perhaps not a suitable model for policy emulation.

26
CHAPTER TWO: Staff
Such data as is available on staff in Canadian postsecondary institutions skews heavily towards univer-sities. Statistics Canada does not survey colleges with respect to academic staff numbers, and it asks
no questions at all in either sector about non-academic staff. Peak bodies, such as Universities Canada or Colleges and Institutes Canada, do not collect this data either, and for the most part individual insti-tutions do not provide this information on their own (though there are some notable and honourable exceptions). The main reason for this is that Canadian governments do not seem to care very much about these issues and have therefore not made institutional reporting on these topics a part of their account-ability frameworks. Because of this lack of data, our look at staff will necessarily be more partial than was our look at students.
Full-time academic staff in Canadian universities are counted through a national survey known as the University and College Academic Staff Survey or UCASS2. This survey was suspend-ed by Statistics Canada for budgetary reasons in 2011 but has since been re-instated and data from the missing years re-incorporated.
Figure 2.1 shows the number of “ranked” academ-ic staff in Canada, meaning those who are tenured or on the tenure-track3. The number of such indi-viduals reached an all-time high of 46,029 in 2017-
2. The term college in this context does not include commu-nity colleges, which Statistics Canada does not bother to measure.3. These academic staff will, with only a few exceptions, hold the rank of assistant, associate, or full professor.
18, an increase of almost 37% of the nadir-point of 1997-98. Though this is a substantial increase in numbers, it has not kept pace with the increase in the number of full-time equivalent students, which grew by 71% over the same period.
2.1 Academic staff at universities
Figure 2.1 Total Tenured & Tenure-track Academ-ic Staff Numbers, Canada, 1992-93 to 2017-18

27
The abolition of mandatory retirement led to a significant increase in the average age of the pro-fessoriate over the past decade and a half. Whereas just 30 professors (less than 1%) of all academic staff were over 65 in 2000, by 2016 that figure had risen to over 4,000 (10.2%). Figure 2.2 shows how the age composition of full-time academic staff has changed over time.
The effects of the aging professoriate can be seen in the changes in pay levels. Because pay in academia is seniority-driven, a disproportionate amount of salary is used to pay for aging staff, significantly reducing the amount of funds available for faculty renewal. Figure 2.3 compares salaries from 2017-18 with those of 2009-10 and 2001-02.
Over that sixteen-year period, average professorial salaries have increased 24% overall after inflation, from $111,147 to $137,582. Most of this increase happened in the period before 2009-10, when governments were the main source of new money in higher education rather than after, when income from students became the main source.
One persistent view in Canadian higher education is that full-time professors are increasingly being replaced by part-time, “casualized” staff. Statistics Canada does not track the number of casualized staff and nor do universities themselves report staff figures in a fashion to facilitate easy comparison. However, late in 2018, the Canadian Centre for Policy Alternatives released a study called Contract U: Contract Faculty Appointments at Canadian Universities. The report assessed the results of a survey on university hiring, which suggested that between 2006-07, contract faculty numbers na
tionally increased by about 1,800 (including major increases in Health Sciences and Business but sig-nificant decreases in Education and Humanities), while full-time numbers increased by about 1,300. There is reason to be skeptical about the exact numbers, as Statistics Canada has overall full-time staff numbers rising by over 4,000 during the
Figure 2.2: Age Composition of Tenured & Ten-ure-track Staff, Canada, 1999-00 to 2015-16
Figure 2.3 Average Salary by Rank 2001-02 to 2017-18, ($2017)

28
2006 to 2016 period, but the pattern of hiring—increasing numbers of part-timers in professional programs where they are likely to be practitioners with existing full-time jobs and decreasing num-bers in Arts, where part-timers tend to be graduate students or recent PhDs wanting to get a foothold in academia—seems broadly correct.
The CCPA report also in many ways corroborated findings from an earlier 2018 publication from the Council of Ontario Universities called Faculty at Work: The Composition and Activities of Ontario Universities’ Academic Workforce, which included data from nearly all of the province’s universi-ties (with the odd exception of the University of Toronto). Perhaps the most important finding of the latter study was that less than a quarter of part-time instructors are graduate students or postdocs. Roughly 4% of part-timers are either current staff on reduced load (some professors take this option in the last year or two before retirement) or are retired professors coming back to teach a class or two. The other roughly three-quarters do not otherwise have an identifiable a formal professional connection with the institution.
Other data in the report, based on a more restrict-ed sample of institutions, suggests that well over half of the part-time staff without previous affili-ation do not possess PhDs and are therefore likely not “faculty-in-waiting”.
When it comes to non-academic support staff, there are no national or even provincial counts available, even though a fair number of institutions do produce their own annual (non-standardized) reports. However, through financial data provided through Statistics Canada’s Financial Information of Universities and Colleges (FIUC) survey (which,
again, does not include community colleges despite the name), we are able to track changes in the ratio of aggregate salary expenditure on full-time academics to aggregate expenditures on non-ac-ademics. The data, shown above in figure 2.5, demonstrates that in the 1980s and 1990s, spending gradually shifted towards non-academic staff. Since the early 2000s, however, there has been very little change in the balance of spending on academ-ic and non-academic salaries.
Figure 2.5 Ratio of Full-time Academic Salaries to Non-Academic Salaries, all Canadian universities, 1979-80 to 2017-18
Figure 2.4 Part-time Instructors’ Relationships with their Universities, Ontario, 2017

29
2.2 Academic staff at colleges
There is very little public data about staff at community colleges in Canada. Statistics Canada does not collect it (though it has hopes of including teaching staff data in a new, expanded UCASS), and nor do any provincial governments. The lone exception here is Ontario, where Col-leges Ontario (that is, the association representing the community colleges) produces an excellent annual Environment Scan that provides a wealth of data on colleges, including on staff numbers. It is by no means certain if the trends in Ontario are replicated in other provinces; however, since the province represents close to 40% of national college enrollments, it is unlikely that national averages will diverge substantially from these and so we reproduce them here as being broadly indicative of national trends4.
In terms of academic staff numbers, figure 2.6 shows that there have been increases in the num-bers of both full- and part-time instructors at Ontario colleges over the past decade; however, growth has been much more pronounced among part-timers than full-timers. This part-time growth was one of the major triggers of the strike that shut down Ontario colleges in late 2017. The union tends to view this as a deliberate casualization and “precarization” of the workforce; employers will tend to defend it partly on budgetary grounds but also partly based on quality, since college programs are meant to provide students with exposure to real world practitioners (who, being practitioners, cannot teach full-time).
4. Given the particularities of the CEGEP system in Que-bec, these national trends may not wholly reflect the reality in that province.
Figure 2.6: Full- and Part-time Academic Staff, Ontario Colleges, 2007-2018
Figure 2.7: Full-time Academic, Support and Ad-ministrative Staff, Ontario Colleges, 2007-2018

30
The Colleges Ontario Environment Scan also pro-vides data on administrative staff and support staff (which is a useful distinction between white-collar administrators and managers and other employ-ees).
As figure 2.7 shows, both the numbers of full-time support staff and administrative staff have grown a bit more quickly than the number of full-time academic staff over the past ten years.
As this brief overview shows, the data available to Canadians on staffing at Canadian postsecondary institutions is not enough to accurately answer some rather basic questions about the changing
nature of those institutions. Media are rife with stories about the casualization of academic labour and academic bloat, and while some indirect and partial inquiries (such as those shown above) sug-gest there is less to these claims than meets the eye.
However, the lack of regular national or even pro-vincial data releases addressing these issues makes it impossible to definitively account for them. For those institutions which feel these claims are un-fair or wrong, there remains a simple answer: start releasing better data.

31
CHAPTER THREE: Institutional Income and
Expenditures
Public postsecondary education in Canada is a $51 billion per year industry. In terms of Gross Do-mestic Product, higher education makes up 2.4% of the national economy, which is a larger fraction
than agriculture, forestry, fishing, and hunting, combined. It is therefore of interest how this significant sector of the national economy generates and spends its money, and it is to this task which this chapter is devoted.
3.1 Income trends for PSE institutions
Over the past fifteen years, overall institution-al income has risen by just over 60% in real
terms, from $31.9 billion in 2001-02 to $51.3 billion in 2016-17. Until the financial crisis of 2008-09, in-come from all three main sources—governments, students, and other self-generated income—was increasing at similar rates of about 5% per year after inflation. The main change since then is that government income has stagnated and even reversed somewhat in real terms, while income from students has steadily increased mainly due to increases in international student numbers.
The self-generated income is more volatile than the other two because endowment returns are part of this category; results for this category jumped in 2016-17 because it was a particularly good year for
Figure 3.1: Total Income by Source for Public PSE Institutions, Canada, in billions ($2016), 2001-02 to 2016-17

32
equities. The year 2016 was particularly notable in that this was the first year since modern statistics began in which income from non-government sources ($25.9 billion) was larger than income from government sources ($25.4 billion).
Internationally, Canada’s higher education system is among the world’s best funded. In 2016, public and private expenditures on tertiary institutions amounted to 2.4% of Gross Domestic Product, which was not quite as high as the United States’ 2.6% but twice as high as much-vaunted Germa-ny and 50% higher than the OECD average. But as figure 3.2 shows, Canada is moving further and further from a Western European model of a largely publicly funded system, and towards the model of other anglophone countries where postsecondary education may be mostly publicly owned, but it is “publicly-aided” rather than “pub-licly-financed.”
Within Canada, data on university expenditures are available for a much longer period than for col-leges. Not only does available data stretch further back in time (to the late 1970s), university finance data is processed more quickly by Statistics Canada so there is usually one extra recent year (2016-17) to report as well. This sector’s data is shown in figure 3.3. The pattern we see here is somewhat cyclical—an expansion of income from all sources during the 1980s, followed by nearly a decade of stagnation in the 1990s during which total income actually fell, mainly because of real cuts to gov-ernment expenditures. Then, from about 1998 to 2009, there was very strong expansion once again, followed by another bout of post-recession stagna-tion in government expenditures. The difference
between the 1990s and the 2010s, however, is that universities have been able to keep their overall income rising, even as revenues from government declined slightly. This is partly due to better in-come generation and stock-market returns (endow-
Figure 3.2: Tertiary Institutions’ Income by Source, as a Percentage of Gross Domestic Prod-uct, Canada and Selected OECD Countries, 2016
Figure 3.3: Total Income by Source for Univer-sities, Canada, in billions ($2017), 1979-90 to 2017-18

33
ment income is a non-trivial part of self-generated income for many institutions), but it is also due to significant new tuition revenues, mainly from international students.
Figure 3.4 puts the major trends of the last decade into starker relief. In real terms, income from public sources was rising sharply prior to the recession—roughly 6% per year after inflation, in line with the growth of income from student fees. After 2009-10, however, government revenue went into a long, gentle decline in real terms before recovering slightly after 2015-16 due mainly to a federal infrastructure boost. Meanwhile, revenue from student fees has grown at about 6% per year continuously, straight through to 2017-18, resulting in a cumulative 80% increase in fee revenue over the decade.
On the college side, the trends look somewhat sim-ilar to those of universities, in that total incomes have continued rising over the past decade even as income from governments has stagnated. How-ever, the composition of the income is somewhat different. Revenues from government make up 61% of total revenue (compared to 46% for universities), and revenues from self-generated income make up just 12% of the total (compared to 27% in uni-versities). In both sectors, however, income from student fees makes up a little over a quarter of the total.
Figure 3.4: Change in Government & Student Fee Income, Universities (2006-07 = 100)
Figure 3.5: Total Income by Source for Colleges, Canada, in billions ($2016), 2001-02 to 2016-17

34
3.2 Expenditure trends for PSE institutions
Because institutions tend to want to spend all the money that they can raise, overall total expenditure trends follow total income trends closely. So closely, in fact, that it is not especial-ly interesting to track those expenditure trends over time since they show more or less identical patterns. However, examining changes in specific areas of expenditures reveals useful patterns.
Table 3.1 looks at total expenditures of universi-ties and colleges by “fund.” What is rather surpris-ing here is that, from certain methods of aggrega-tion, the two systems look extremely similar. Using the categories developed by Statistics Canada, we find the following trends: Research and teaching collectively make up 60% of the budget in universi-ties and 53% in colleges.
COLLEGES UNIVERSITIES
iNstructioN & research 53% 60%
adMiN + ict 18% 11%
Physical PlaNt 10% 6%
studeNt services 10% 6%
caPital 9% 6%
other 0% 10%
Table 3.1: Distribution of Total Expenditures by Fund, Colleges and Universities, 2016-17
Physical plant is 7% and 9%, respectively, while capital is 6% and 9%, and student services are 6% and 10%5. What this kind of aggregation hides is the single major difference between the two sectors – research. Within the research/teaching aggre-gation, the research side only accounts for 1.4% of total expenditures for colleges, but over 31% for universities.
5. University totals in this comparison are lower overall because about 10% of their total expenditures are not categoriz-able using definitions employed by colleges.6. For universities, the term means central administration only; in colleges, it includes all ICT costs as well as central administration, and seems to include a number of other miscellaneous items.
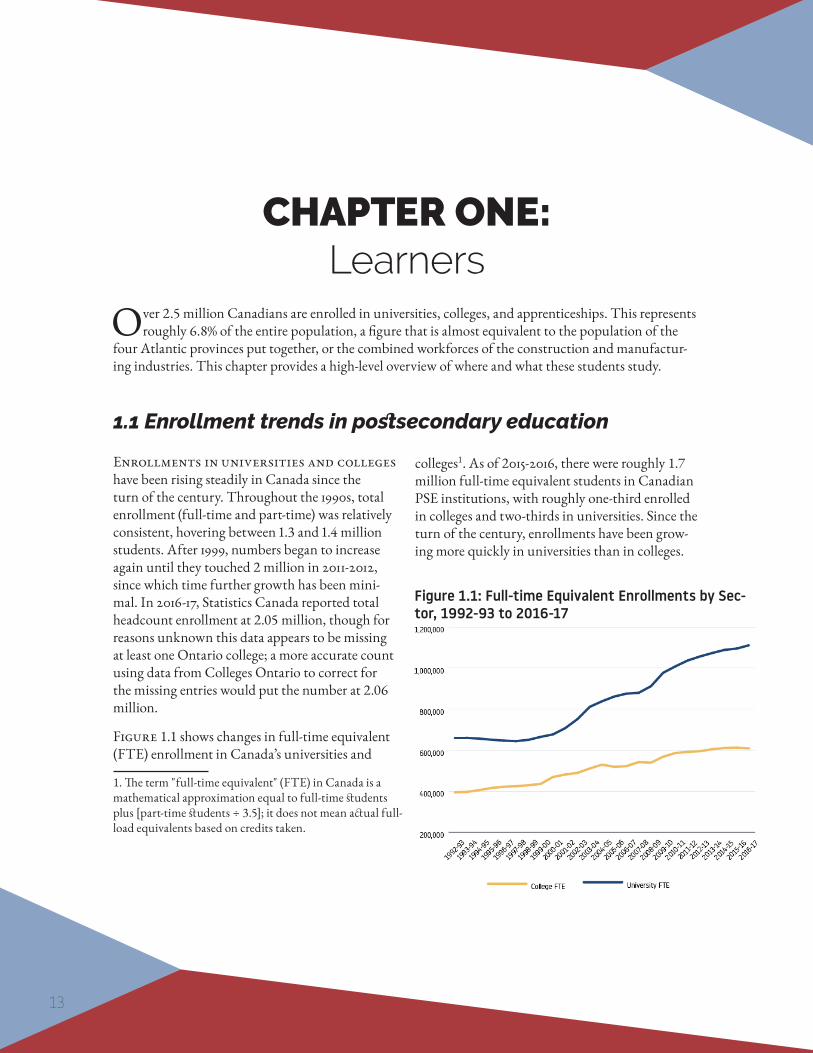
One perennial topic of conversation in higher education is the alleged tendency toward ever-in-creasing expenditures on administration. Statistics Canada data allows us to chart this trend over time in both the college and university sectors, though the definition of “administration” differs quite a bit from one sector to the other6. Still, despite differing definitions, trends over time can be compared.
35
Figure 3.6 shows that spending on administration is higher for colleges than universities, a fact which is partially a function of the surveys of the two sec-tors using slightly different definitions, but also a function of the fact that most colleges are relatively small, and therefore tend to have admin-related diseconomies resulting from their smaller scale. Perhaps more importantly, the figure shows that over the past decade administration spending has remained reasonably steady as a percentage of total expenditures (colleges) or only increasing very gradually (universities). This does not mean that absolute administration costs are not increasing; in both sectors they have more than doubled, in nom-inal terms, since the turn of the century. However, they are not increasing disproportionately relative to overall institutional spending.
Table 3.2: Distribution of Spending by Type, Uni-versities and Colleges, 2016-17
COLLEGES UNIVERSITIES
acadeMic wages 31.0% 27.5%
other wages 22.1% 22.4%
beNefits 10.2% 10.1%
library acQuisitioNs 0.2% 1.2%
suPPlies 8.1% 4.2%
utilities 1.7% 1.9%
fiNaNcial aid 1.1% 5.8%
fees aNd services 6.6% 4.9%
eQuiPMeNt 2.8% 4.4%
buildiNgs & laNd 6.6% 7.4%
debt service 0.9% 1.5%
other 8.7% 8.7%
Figure 3.6 Expenditures on Administration as a Percentage of Total Spending, Universities vs. Colleges, 2001-02 to 2016-17

36
Academic Wages
Wages are always an area of concern in the post-secondary sector. They have increased substan-tially (nearly doubling in nominal terms) at both universities and colleges over the past fifteen years. However, as a proportion of total expenditures they are remarkably stable, as figure 3.7 and figure 3.8 show. And it is not just that wages are stable overall, but the components of the wages budget (i.e. spending on academics vs. spending on non-academics) are stable as well. To the very limited extent there is any upward pressure on compensation as a percentage of total expenditure, it seems to be coming from benefits (and specifical-ly, the cost of pensions) rather than wages.
While figures 3.7 and 3.8 distinguish between spending on academic and non-academic staff, they do not shed light on the persistent debate within higher education, referred to in the previ-ous chapter, of “academic casualization”; that is, the alleged tendency of universities and colleges to hire fewer full-time staff and more part-time staff.
This debate was considered in chapter two, however, we can shed more light on this phenom-enon (in the university sector, at least) by disaggre-gating the proportion of academic wages going to staff who are tenure-track (technically, “possessing academic rank”) and those who are not. A similar analysis cannot be done with respect to colleges be-cause of the structure of the college finance survey.
Figure 3.7: Wages as a Percentage of Total Budget, Colleges, 2001-02 to 2016-17
Figure 3.8: Wages as a Percentage of Total Budget, Universities, 2001-02 to 2017-18

37
Figure 3.9 shows the proportion of total academic wages going to faculty who are without academic rank (which is roughly equivalent to wages going to “sessional” or “adjunct” professors) from 2000-01 to 2017-18. As the data shows, this percentage has in fact been falling very slightly for the last decade or so. This does not mean that total expen-diture on non-tenure track staffing is shrinking: it simply means it is growing less quickly than expenditures on tenure-track staff.
Figure 3.9: Percentage of Aggregate Academic Wages Going to Non-tenure Track Staff, 2000-01 to 2017-18

38
CHAPTER FOUR: Government Expenditures
As previous chapters have shown, institutional reliance on governments as a source of income is de-creasing. Still, grants from government—particularly operating grants from the provinces—remain
the largest single source of funding in the postsecondary sector. This chapter examines these expendi-tures in detail, both at the provincial and federal levels. In the main, the story is simple: during the first decade of the century, government expenditures increased at a substantial rate, both at the federal and provincial levels. In the aftermath of the global financial crisis of 2008- 09, expenditures began to fall in real terms and have continued to fall up to the present day. 2016-17 saw the first uptick in government expenditures in nearly a decade, but this was primarily the effect of a one-time increase engineered by the federal Strategic Infrastructure Fund (SIF), created by the Liberal government to counteract the brief and shallow 2015-16 economic slowdown.
4.1 Provincial expenditures on postsecondary education
Two Statistics Canada surveys—the Financial Information of Universities and Colleges (FIUC) and the Financial Information of Com-munity Colleges and Vocational Schools (FIN-COL)—provide information on PSE institutions’ sources of funding. Figure 4.1 shows provincial government transfers to PSE institutions, from 2001-02 to 2017-18 for universities and from 2001-02 to 2016-17 for colleges. What we see is a massive increase—over 50%—in funding for universities between 2001-02 and 2009-10, fuelled partly by the rise in enrollments in the sector and partly by the conversion of several former colleges into universi-ties in B.C. and Alberta.
Figure 4.1 Provincial Government Transfers to Institutions by Type of Institution, in billions ($2017), 2001-02 to 2017-18

39
Between 2009-10 and 2015-16, as provincial govern-ments have mostly tried to rein in spending, real expenditures decreased slightly but steadily before ticking up again slightly in 2016-17.
As is usually the case in Canada, the expenditure picture varies significantly not only depending on the time period chosen, but also from one province to another. For instance, a five-year time horizon demonstrates that across Canada, overall provin-cial expenditures fell by 1% after inflation between 2011-12 and 2016-17. In a few provinces, the drop was more substantial: 16% in Newfoundland, 8% in British Columbia and New Brunswick, and 7% in Prince Edward Island. Conversely, in the three Prairie provinces funding increased slightly over those same five years. However, a longer ten-year horizon demonstrates a net increase of 9% overall after inflation, with increases of 25% or more in the Prairie provinces, Newfoundland and Nova Sco-tia, and a decrease only in Ontario and B.C. (-1%).
Though a fully accurate accounting of more recent transfers (i.e. since 2016-17) cannot be made until relevant FIUC and FINCOL numbers are avail-able, it is still possible to look at provincial activity by using provincial budgets and their accompa-nying statements of what provinces intended to spend on institutions. Using this method, we can bring Figure 4.2, which ends in 2016-17, up to the present fiscal year (2019-20) in eight provinces. For the other two provinces—Alberta and Prince Edward Island—where late spring elections have delayed the adoption of 2019-20 budgets to Fall 2019, we can bring results up to 2018-19.
Figure 4.2: Changes in Provincial Transfers to Institutions by Province over 5 & 10 Years, ($2016) to 2016-17
Figure 4.3: Budgeted Changes in Transfers to Postsecondary Institutions by Province, ($2019) 2016-17 to 2019-20
Note: Alberta (AB) and Prince Edward Island (PE) are both to 2018-19.

40
The results of such an exercise are shown in fig-ure 4.3. Nationally, provincial funding is down by 0.3% in real terms, but the national result again masks major regional variation. Quebec, Nova Scotia, and British Columbia and Prince Edward Island all saw increases whereas the Prairie prov-inces, Ontario and Newfoundland & Labrador saw decreases of between five and nine percent. Not all of these decreases affect operating budgets, however; in a couple of provinces (Alberta and On-tario, in particular), the decreases in funding have tended to hit capital spending more than operating funds.
Simply looking at total expenditures by sector does not tell us much about relative funding differences, because provinces differ so much in size. Fig-ure 4.4 shows expenditures per FTE student by province in both the college and university sectors. Nationally, provincial government expenditures on universities and colleges are similar: $12,766 per student for universities and $11,194 for colleges. But again, results vary considerably by province. Four provinces—Nova Scotia, New Brunswick, Manitoba, and Alberta—each spend more per col-lege student than they do per university student. And in most provinces, expenditures for the two types of education are more or less consistent—within $2,500 per student or so.
The only exceptions are Nova Scotia (where expen-ditures per college student are $3,500 more than per university student) and Newfoundland (where expenditures per university student are nearly $10,500 more than per college student).
Another way to look at this kind of data is to track provincial expenditures per student over time. Figure 4.5 shows this data both per-FTE student
and per-domestic FTE student to account for the effects of the growth in international student num-bers (in many parts of the country, international students are excluded from provincial funding for-mulas). Per-student funding hit a high of $15,671 ($14,960 per domestic student) in 2008-09.
Over the next seven years, this figure fell by 18% (14% per domestic student) before rising slightly in 2016-17. As should be clear from figure 4.1, this decline in per-student funding is not a result of a significant decline in total funding; rather, it is a result of expenditures remaining largely constant while enrollment numbers grew.
However, per-student expenditures have limits when comparing provincial commitment to a sector, since they are based on attendance patterns, not a province’s ability to pay. A complementary way to compare provincial expenditures is to calcu-late higher education spending as a function of the size of the provincial economy. Figure 4.6 shows
Figure 4.4: Provincial Expenditures per FTE Student, in ($2016) 2016-17

41
provincial expenditures as a percentage of pro-vincial Gross Domestic Product. Nationally, this figure comes to about 1%, but, once again, it varies substantially by province. In Newfoundland it is 1.47% of GDP, while in Ontario it is just 0.75%.
The proportion going to colleges and universities is relatively close: in most provinces, the college share is between 25 and 33% of expenditures. The three exceptions are Newfoundland (20%), Quebec, with its very large CEGEP system (40%) and the three territories, where the college figure is 100% because they currently have no universities.
Figure 4.6: Government PSE Expenditures as a Percentage of GDP by Province and by Sector, ($2016) 2016-17
Figure 4.5 Total Provincial Funding per Full-Time Student, ($2016) 2001-02 to 2016-17

42
4.2 Federal expenditures on postsecondary education
The Government of Canada essentially has four mechanisms for transferring money to postsecondary institutions.
The first transfer mechanism is through the re-search granting councils: the Canadian Institutes for Health Research (CIHR), the Natural Science and Engineering Research Council (NSERC) and the Social Sciences and Humanities Research Council (SSHRC), which together are the larg-est source of federal dollars to most institutions. These three disciplinary-based councils are known collectively as “the Tri-Council” agencies; however, as of 2018, the Government of Canada now also considers the Canada Foundation for Innovation (CFI), which disburses money for scientific infra-structure, to be a fourth granting council.
The second transfer mechanism is through a variety of other scientific agencies and government departments (e.g. Health Canada), which transfer at least some of their money to postsecondary institutions.
The third mechanism is through occasional large investments in capital spent on postsecondary institutions, such as the Knowledge Infrastructure Program (KIP) of 2009-10 and the Strategic Infra-structure Fund (SIF) of 2016-17.
The fourth is an indirect method of transfers via funds included in the Canada Social Transfer that are (at least notionally) earmarked for fund-ing postsecondary education. Each of these are discussed in turn.
Granting councils
The four granting councils provide roughly $2.3 billion in funding to Canadian institutions every year. Close to 99% of this funding goes to universi-ties. This total expenditure figure rose very quickly in the first half of the 2000s, but the figure today, in real dollars, is roughly the same as it was in 2005-06. Funding from CIHR and NSERC tends to hew close to one another at around $850 million each; SSHRC funding has stayed very close to $260 million per year for over a decade. Funding from CFI is more erratic, reflecting the fact that it in the period covered in this graph, CFI did not yet receive annual funding allocations but instead received occasional endowment funding.
Figure 4.7: Research Granting Council Expendi-tures by Council, in millions ($2016), 2001-02 to 2016-17

43
Because research funding is granted on a compet-itive basis to individuals or groups of researchers, and these researchers tend to cluster at larger and wealthier institutions, it is more concentrated than operations funding, with the country’s top three institutions (Toronto, UBC and McGill) receiv-ing roughly 30% of all council funding. Table 4.1 presents the top fifteen institutions receiving funds from each of the three traditional granting coun-
cils, as well as the top fifteen when relevant grants from the tri-councils are combined into one figure.
There are a variety of other sources of federal fund-ing for universities and colleges. The largest single on-going source is the Canada Research Chairs program, which provides roughly $275 million every year to Canadian universities to support talented researchers (see figure 4.8). Other federal
Table 4.1: Top 15 Institutional Recipients of Federal Research Grants, by Council 2018-19
SSHRC* NSERC CIHR** TOTAL
insTiTuTion%
of ToTal
insTiTuTion % of ToTal
insTiTuTion % of ToTal
insTiTuTion % of ToTal
Toronto 9.5 Toronto 7.9 Toronto 8.9 Toronto 11.0
UBC 7.8 UBC 7.1 UBC 8.8 UBC 10.4
UQAM 6.3 Alberta 6.1 McGill 6.8 McGill 8.1
McGill 5.4 McGill 5.9 Calgary 4.6 Alberta 5.8
Ottawa 4.3 Waterloo 5.8 McMaster 4.5 Calgary 5.3
Montreal 4.3 Western 4.0 Alberta 4.4 McMaster 4.9
Laval 3.9 Calgary 3.7 Western 3.1 Montreal 4.4
York 3.3 Montreal 3.4 Montreal 3.0 Western 4.1
Calgary 3.2 McMaster 3.1 Laval 2.6 Laval 3.5
Waterloo 3.1 Laval 2.9 Ottawa 2.2 Ottawa 3.2
Alberta 3.0 Ottawa 2.9 Manitoba 2.0 Waterloo 2.7
Concordia 2.9 Queen’s 2.9 Queen’s 1.7 Queen’s 2.6
Western 2.8 Guelph 2.7 Dalhousie 1.7 Manitoba 2.6
Queen’s 2.6 SFU 2.7 Sherbrooke 1.6 Sherbrooke 2.2
McMaster 2.5 Sherbrooke 2.5 SFU 1.1 Dalhousie 2.2
*percentages are for Insight Program Grants only **percentages are for university-based recipients only, excluding awards to hospital-based researchers

44
funds arrive through departmental budgets and allocations. For instance, Health Canada provides universities with roughly $25 million per year for various services; Employment and Social Develop-ment provides similar funds to colleges. Research funds flow through various specialized science agencies such as Brain Canada and Genome Canada. Some money comes to PSE institutions through regional development agencies, mainly for infrastructure. Finally, the Government of Can-ada periodically spends large amounts of money on university and college infrastructure through one-time programs such as KIP (2009) and SIF (2016), which tend to appear during periods of economic downturn. From a government perspec-tive, these infrastructure programs are as much about Keynesian counter-cyclical support to the construction industry during economic down-turns as they are about higher education. Never-
theless, programs like KIP and SIF have permitted significant renewal and expansion of facilities on Canadian campuses over the past decade. Though detailed breakdowns are not readily available, total amounts are captured through the FIUC and FINCOL databases and amount to about $900 million per year in most years, though this increas-es to about $1.5 or $1.6 billion per year when major infrastructure drives are being undertaken, as seen below.
Finally, there is the matter of federal transfer payments to provinces for postsecondary educa-tion. Between 1957 and 1967, the Government of Canada attempted a modest form of direct support to institutions. This was achieved through trans-ferring a lump sum to a shell organization owned and managed by what is now Universities Canada, which then transferred the sums to individual institutions under its own formula. In 1967, this direct support was replaced by the Federal-Pro-vincial Fiscal Arrangements Act, under which the Government of Canada agreed to split the costs of PSE 50/50 with the provinces, though in 1972 this support was amended by setting an overall growth cap of 15% per year on federal spending in this pro-gram. This program was not entirely run through cash transfers; a substantial portion of the federal contribution came through what are known as “tax points” (that is, a cession of tax room so that when federal tax rates decrease, provincial ones could equivalently increase).
In 1977, this arrangement was replaced with something called Established Programs Financing (EPF), which combined federal contributions for health and postsecondary education into a
Figure 4.8: Direct Federal Funding to Postsecond-ary Institutions, excluding Tri-Council Funding, in millions ($2016), 2001-02 to 2016-17

45
single transfer made up of a combination of cash and tax points. The cash transfer under EPF was initially tied to the rate of nominal GDP growth; later, total EPF was linked to GDP growth and the cash was calculated as a residual after tax points, meaning the cash portion as a proportion of the overall transfer began to shrink. Subsequently, the growth rate was reduced to GDP minus 2%, then to GDP minus 3% before being frozen altogether in 1990, all in the name of deficit-reduction. Since tax points continued to increase in value, and the cash transfer was a residual, the cash portion of EPF began to dwindle rapidly. It was expected that it would fall to zero early in the early 2000s.
In 1995, the Government of Canada merged the EPF with another provincial transfer payment known as the Canada Assistance Plan (CAP) into a new program called the Canada Health and Social Transfer (CHST). This new, larger transfer was essentially one enormous block-grant of cash and tax points to the provinces, the only conditional el-ement of which was that the provinces respect the Canada Health Act. The cash portion of the new CHST was set at just $12.5 billion, which was $6.5 billion less than what had been available under the combined CAP/EPF. But the 1995 budget also placed a floor under cash transfers, which put to rest the fears that cash payments would eventually dwindle to zero. As the economy recovered after 1996, the CHST cash payments grew. Over the next few years as the economy improved, billions of new dollars were poured into the transfer, most-ly for the purposes of shoring up the health system; though accountability arrangements were not formally changed, provinces agreed to publicly an-nounce what they would do with any new monies
received through the transfer. By 2004, the value of the cash transfer had risen to $22.3 billion.
In 2004, the CHST was split into a dedicated Can-ada Health Transfer (CHT) and a Canada Social Transfer (CST), with the latter designed to include spending for PSE, social assistance and childcare. The initial value was set at $8.3 billion. In 2007, the Government of Canada announced an $800 million increase to CST specifically for postsec-ondary education, though there was no way to di-rectly tie this investment to specific actions by the provinces. Still, for the first time since the demise of EPF, it was possible to see the actual amount of cash transfer “designated” for PSE. Since then, 30.7% of the CST—which is now valued at over $14 billion—is deemed related to postsecondary education, meaning that federal transfers “in respect of” postsecondary education are currently just over $4 billion per year. This is equal to about
Figure 4.9: Federal and Provincial Own-Source Expenditures in Respect of PSE Institutions, Can-ada, in billions ($2016), 2007-08 to 2016-17

46
20% of provincial expenditures on postsecondary institutions, up from just 14% in 2007.
From 2007-08 onwards, thanks to the clarification about the division of CST funds, it is possible to look at the distribution of postsecondary fund-ing in Canada between federal and provincial governments without fear of double-counting the federal transfer. This is done above in figure
4.9. If we look at federal expenditures on research, infrastructure and unconditional transfers versus provincial own-source expenditures (i.e. their expenditures net of CST), a nearly perfect 2:1 ratio of provincial to federal expenditure emerges. This is significantly changed from what was effectively a 3:1 ratio in 2007-08 prior to the introduction of the CHST.

47
CHAPTER FIVE: Tuition & Student Aid
One of the most-watched elements of higher education policy relates to affordability. For the most part, the affordability debate focuses on the sticker price of tuition. However, this is only one part
of the equation, because for all the billions of dollars institutions collect from tuition, Canadian govern-ments and institutions also provide billions of dollars in subsidies and scholarships to offset these costs. Examining these issues in a pan-Canadian context is tricky because tuition and student aid policies vary across provinces. This chapter will encapsulate the issues around affordability as concisely as possible.
5.1 Tuition
Tuition fees in universities and colleges are a policy instrument that is subject to a great deal of tug-of-war between institutions and provincial governments. The former, generally, seek greater freedom to set fees, to raise more revenues; the latter, generally, seek greater control over institu-tional policy to limit negative headlines about the cost of education (though provinces often lack the concomitant desire to provide institutions with greater funding to compensate for lower tuition). This tug-of-war plays out differently across prov-inces and across time. Sometimes provinces impose tuition fee freezes, and in some narrowly defined cases they permit fees to be de-regulated. Genuine-ly pan-Canadian trends in fee policies are few and far between. What does seem to currently unite Canadian provinces is the willingness to allow institutions to make up for falling government funding through international student tuition dollars.
Figure 5.1 shows domestic student tuition plus mandatory fees at Canadian universities, in real dollars, from 1995 to 2019 (the latter figure is an estimate, as Statistics Canada’s official figures are about two weeks away at the time of writing). In the 1990s, annual average rises in tuition were to
Figure 5.1: Average Domestic Undergraduate Tuition and Fees, Canada, ($2019), 1995-96 to 2019-20 (est.)

48
the order of 5-7% per year, after inflation. After 2000 or so, once the era of significant austerity was over, rises in tuition began to moderate, and since that time annual averages increases in universi-ty fees have been very close to 2% per year after inflation, with the exception of this current year, where the Ontario government’s decision to cut all tuition by 10% will result in the national tuition average falling about two and a half percent.
Equivalent data for college tuition is unfortunately unavailable, as Statistics Canada has chosen not to survey institutions on this and institutions themselves prefer not to be overly transparent on this matter. The closest we can come to obtaining national college tuition figures is to look at reve-nue per full-time equivalent, which is available by combining data from FINCOL and PSIS. This is not ideal because it is impossible to disaggregate revenue from different sources (international vs. domestic, credential- vs. non-credential courses), but nonetheless this measure does suggest that the two types of institutions are similarly reliant on fee income: at universities, with much larger numbers
of international students, the figure is $9,353 per FTE student per year.
At colleges, if one pulls out the CEGEPs, which for all intents and purposes are free, the figure is around $7,743 per FTE student per year. What one should take from that is not that average college tuition is actually $7,743 per year, but rather that the gap between university and college tuition in Canada outside Quebec is on average somewhere between $1,000 and $2,000.
University tuition and fees do vary significantly by province. Quebec and Newfoundland have very low tuition fees, both resulting from lengthy periods of tuition fee freezes over the last 40 years. Ontario and Nova Scotia, on the other hand, have relatively high fees. Notably, participation rates in Canada universities do not appear to be driven by fee levels. Ontario has the highest participation rate in the country, and Nova Scotia is still able to attract proportionately the largest number of out-of-province students. Meanwhile, the lowest participation and attainment rates are found in the Western provinces.
Figure 5.2: Average Undergraduate Tuition and Mandato-ry Fees, by Province, 2019-20 (est.)
49
Tuition by Field of Study
Fees also vary considerably by field of study. Fig-ure 5.3 shows the variation for first-entry univer-sity undergraduate programs, while figure 5.4 shows tuition for programs that are primarily (but not exclusively) second-entry professional pro-grams. Note that these figures include only tuition and not mandatory fees; this is because Statistics Canada produces data on average mandatory fees (which run to about $750-800 per year) but does not break them down by field of study. Figure 5.3 demonstrates that the median program price across the main fields of study in Canada (Busi-ness, Science, Social Science, and Humanities) is probably in around the low $6,000s. Even adding on the $800 or so from ancillary fees not shown here would only bring the median tuition fee to about $7,000 at most, or about 10% lower than the national average noted in figures 5.1 and 5.2.
The reason for this average/median gap is simple: there are a small number of professional programs which charge fees dramatically over the median: over $23,000 per year in Dentistry, over $14,000 in Medicine and over $13,000 in Law. Even with rel-atively small numbers of students, these fee levels push the average up significantly, to the levels seen in figures 5.1 and 5.2.
But domestic tuition fees are only part of the story. As we saw in chapter two, international stu-dent numbers have been increasing in recent years, and as shown in chapter four, international student tuition dollars have become an increas-ingly important source of funding for universities and colleges. As figure 5.5 shows, the increasing funds are coming not just from increased numbers, but increased fees as well.
Figure 5.3: Average Tuition Fees, by Field of Study, First-Entry Undergraduate Programs, 2018-19
Figure 5.4: Average Tuition Fees, by Field of Study, Second-Entry Professional Undergraduate Programs, 2018-19

50
Whereas domestic student tuition has increased at roughly inflation plus 2% over the past decade, international student tuition fees have been rising at inflation plus 5%. Over time, the effect of com-pounding means those two numbers separate at an accelerated pace. In 2018-19, international student tuition averaged over $27,000 per year, up from just $16,000 (in inflation-adjusted dollars) a decade earlier. Notably, this rise in fees has gone in tandem with regular double-digit increases in international student numbers: there is no sign that Canadi-an institutions are pricing themselves out of the market.
However, as is usually the case in Canada, the picture for international student fees varies signifi-cantly from one part of the country to another. In the two provinces attracting the greatest number of migrants (where international education is frequently a gateway to migration), tuition fees are quite high: nearly $35,000 in Ontario and $25,000
in British Columbia. In the rest of the country, international student fees are more moderate. In the Prairies and the Maritime provinces, fees are more likely to be in the $14-21,000 range; in New-foundland they are a comparatively trifling $12,035 (though this is an increase of almost $3,000 from 2017-18). The reason for these gaps is unclear, but presumably provinces which do not boast a major metropolis feel they may have more difficulty attracting international students and price them-selves accordingly. What is perhaps most intrigu-ing here is that universities for the most part seem to set their prices below the average operating cost per student. This is presumably why so many of them claim not to be making money from interna-tional students despite the higher fees. Of course, the actual relevant metric here is not average costs but marginal costs, which are often quite low.
Figure 5.5: Domestic vs. International Student Tuition, Canadian Universities, ($2018) 2006-07 to 2018-19
Figure 5.6: International Student Tuition by Province, Canadian Universities, 2018-19

51
5.2 Student assistance
Student aid in Canada comes in many different forms. The largest and most prominent of these forms is need-based student assistance, or student loans and grants. However, there are several other very significant sources, including tax credits, education savings grants, institutional scholar-ships, and sundry other things like federal graduate scholarships and support for First Nations stu-dents. In this section, we look at each of these areas in turn.
Student aid in Canada is difficult to summarize briefly. Student assistance, however, is an area of joint responsibility with the federal government. Not only is there a national program—the Canada Student Loans Program, run by the Government of Canada—but every province has its own student aid program as well. In nine provinces and one territory, these programs run alongside the federal program. Quebec, Nunavut, and the Northwest Territories have opted out of the Canada Student Loans Program and receive compensation for this, which they use to fund their own standalone pro-grams. In provinces where federal and provincial loan programs run side-by-side, the provincial gov-ernment is the one which manages both programs, permitting them to integrate the two programs in a relatively seamless fashion. As such, students only make a single application to the two programs (though the needs assessment processes for each program may be quite different). To a large extent, provinces treat the federal program as a base,
and use their own resources to build a program around it. Therefore, student programs can look very different from one province to another, given different provincial priorities and desires to invest in student aid.
Student loans are based on “assessed need”. An aid applicant’s costs of education (tuition, materials, books) and living (housing, food) are assessed, the latter according to a standardized allowance, to arrive at a total annual cost figure. Then the students’ income and (in some cases) assets are assessed; if a student is considered a dependent then their parents’ income is also assessed, and if a student is married then the spouse is assessed. This assessment leads to a determination of “resources” the student has available. Costs minus resourc-es equals need, subject to some total assistance maximum. This maximum varies somewhat by province and student status, but it is at least equal to $350/week of study ($11,900 per academic year). This need figure equals the size of the student loan.
Many grants, on the other hand, tend not to be need-based, but income-based. This is the case for nearly all the federal grants, as well as those in Ontario, which is the source of over half of all provincial grants. Most other provincial grants are based either directly or indirectly on need, though a non-negligible portion of both provincial and assistance is also provided based on the presence of a disability. Grants usually displace loans: that is, a student eligible for $10,000 in loans and $3,000 in grants will tend to end up with the grant plus
Need-based student assistance

52
$7,000 in loans. However, this is not universally the case.
One peculiarity of the Canadian student aid sys-tem has been the tendency of provinces to deliver at least a portion of their non-repayable assistance (i.e. grants) in the form of forgivable loans. For example, prior to 2017 in Ontario, single students enrolled for two standard-length terms per aca-demic year could borrow up to $11,900, of which $4,300 (that is, the entire provincial portion of the loan) could be forgiven if the student successfully completed the year. For the most part, these pro-grams have been on the wane, though they remain significant in Manitoba, Saskatchewan, Nova Scotia and Prince Edward Island.
Actual figures on loans and grants in Canada are difficult to come by for a variety of reasons. Federal data is, at best, three years out of date by the time an annual report is released. Apart from Quebec and Saskatchewan, most provinces – for reasons that defy easy comprehension - do not publicly re-lease data on the amounts of loans and grants they delivered, though all provinces release public data on student aid expenditures through their supple-mentary estimates or public accounts processes. Inexplicably, Statistics Canada does not collect data on provincial student aid either, even though they have an obligation to provide data on this to the OECD for the annual Education at a Glance series. Instead, it chooses to provide data on the federal program only, meaning Canada’s student aid effort is grossly under-reported in international statistics.
Through to about 2010, provincial governments did publicly release some loan/grant statistics via an annual survey run by the Canada Millennium Scholarship Foundation, so reasonably good data is available until the end of the last decade. Since then, it has been more difficult to obtain data, but on the basis of Canada Student Loans program data and such data as is made available by provinc-es, it is possible to make some educated estimates about loans and grants across Canada since that time. Figure 5.7 shows the total loans and grants available in Canada at five-year intervals going back to the mid-1990s.
Total need-based aid provided to students in 2016-17 was roughly $7 billion, of which 62% of that was delivered in the form of loans, and the remainder in grants. This is a very different system from the one which prevailed in 1996-97, when 84% of all aid was given in the form of loans (this was probably the high-point of Canada’s loan-based system—over the past 30 years, the average has been about 70%). In real dollars, the amount of student loans issued in 2016-17 was actually lower than it was 20 years earlier. Meanwhile, the volume of grants, which here also includes various forms of loan remission, more than tripled, from $852 million to over $2.6 billion.
There have also been shifts over time in the sources of student aid, shown below in figure 5.8. In the mid-1990s, most of the aid provided came from provincial governments. After 2000, and the creation of the Canada Millennium Scholar-ship Foundation, the balance shifted towards the centre and an increasing proportion of funds were provided either directly or indirectly by the federal

53
government. Over the last few years, however, provincial funding has grown substantially, and it is provinces who once again provide over 50% of support to students. Note, however, that this increase in provincial spending since 2010 was not
widely distributed and was mostly confined to Ontario and Quebec.
Figure 5.7 Total Annual Loans & Grants Issued, Canada, Selected years, in millions ($2016)
Figure 5.8 Total Annual Need-based Student Aid by Source, Selected years, in millions ($2016) 1996-97 to 2016-2017

54
Education Tax Credits in Canada
A Short Explainer
Tax-based assistance for post-secondary education in Canada pre-dates the student loan system. The Diefenbaker government introduced the first tax deductions for education in the late 1950s as an alternative to student aid. The tax deductions were for tuition and a set monthly allowance and could be used either by a student or passed to another family member. From then until 1996 there were only minimal changes: the value of the allowance went up somewhat, and the deduc-tions were turned into credits (thus mostly eliminating the regressive aspect of the associated tax expenditure) as part of a major reform of taxation carried out by the Mulroney Government in 1987.
In 1996, the Government of Canada increased the value of the education credit from $60 per month to $80 per month. In 1997, it increased it again to $120 and then to $200 per month for 1998; it also allowed part-time students to enjoy partial access to the credit and incorporated mandatory ancillary fees within the ambit of the tuition tax credit. A change was also made to allow students to carry-forward any unused amounts of tax credits to future years, which was very beneficial to students who did not have enough income to be liable for tax. In 2000, the monthly amount doubled to $400 per month, with a concomitant increase for part-time stu-dents. In 2006, the Government of Canada created a new Textbook Tax Credit worth $65 per month, which worked precisely the same way the education credit did.
Until 2000, provincial taxes were calculated as a function of federal taxes. Therefore, whenever a federal tax credit was implemented, implicitly the credit reduced one’s provincial tax payable as well.
In 2000, the country moved from a TONT (tax-on-tax) system to a TONI (tax-on-income) one, under which provinces were given a great deal more freedom over the way taxes were calculated (e.g. they could have different rates at different income bands) and how tax concessions could be created (e.g. they could design their own tax credits), provided they all agreed to let Ottawa both collect the taxes and define “income”. A majority of provinces froze tuition tax credits at the level they were at prior to the 2000 budget (i.e. $200 per month), and some chose to mirror the federal government’s $400 rate. Alberta and Ontario decided to do the federal government one better by matching the $400 credit rate and then indexing the rate to inflation.
The federal Liberal government elected in 2015 came in with a plan to move away from tax credits as a funding mechanism. In the 2016 budget, the government eliminated the education amount and textbook tax credits, leaving only the tuition tax deduction. They money was used to pay for an increase in student grants (this switch does not completely show up in this chap-ter’s data, because tax credits continue to be redeemed for several years after the measures are enacted due to the carry-forward provision). Roughly half the proceeds from this measure were announced and spent in the 2016 budget; the other half are due to be announced in the 2019 budget. Ontario and New Brunswick followed suit by getting rid of their education credits later in starting in 2017 and similarly re-investing the proceeds in student grants; in 2019 New Bruns-wick reversed policy and stated it intention to re-instate tax credits though it has yet to do so.
In future, the value of tax credits will decrease; but until 2016 the value of tax credits was es-sentially on a never-ending escalator, one which moved very quickly from 1995 to 2001, and then slowly, more or less in line with tuition and enrolment increases, from 2001 onwards.

55
While need-based assistance provides targeted aid to students with low-income and/or high-need, there are billions of dollars in other forms of aid sent to students and their families without needs testing. The first and most important of these forms are tax credits. As figure 5.9 shows, the val-ue of these credits rose, in real dollars, from under $1 billion in 1996-97, to over $3.1 billion in 2016-17.
The other important government transfer program for postsecondary education is Education Savings Grants. Since 1971, Canada has had the Registered Education Savings Plan—that is, a savings account in which growth was permitted to escape tax. In 1998, the Government of Canada introduced a sav-ings matching scheme, where it would contribute 20 cents for every dollar contributed to a RESP, up to an annual maximum of $400 (later increased to $500). The grants for the Canada Education Sav-ing program were very popular, and take-up rose rapidly (see figure 5.10, below). The one major change to the program came in 2004, when the government decided to address the complaint that Canada Education Saving grants (CESGs) were mostly a regressive give-away to wealthier families. First, the matching rate was increased for lower-in-come parents, up to 40% (this was known as the A-CESG). Second, a new program called the Can-ada Learning Bond was introduced. This program adds money to children’s RESPs automatically if their parents’ income is less than $46,000 per year (the threshold amount adjusts upward if the family has more than three children). The first year this occurs, the child’s account receives $500; in every subsequent year this occurs until the child turns
Non-need-based student assistance
Figure 5.9: Total Value of Tax Credits, by Source, in millions ($2016)
Figure 5.10 Total Canada Education Savings Grants Payments, in millions ($2016)

56
18 another $100 is added. The barrier, of course, is that the parents need to open an account for the transfer to occur, and many do not, thus leaving the program with an only mediocre take-up rate.
The CESGs have, in many ways, been successful beyond the wildest dreams of its creators. In its first few years of operation, it was expected to cost $300 million per year or so; today, the amount is close to $900 million per year and will likely hit $1 billion before the end of the decade. In 2017, over 2.8 million RESP accounts received CESGs and/or A-CESG and 52% of all Canadians under 18 have a RESP in their name. In the same year, 430,000 current students used money from their RESPs to pay for education, in an amount totalling $3.8 billion.
The final major source of funding for students is institutions themselves, which provide nearly $2.2 billion per year in scholarship and bursary funding to students. The overwhelming majority of this money (94%) comes from universities rather than colleges, in part because they have greater fund-raising resources and in part because financial aid is a more important part of the enrolment man-agement process at universities. Scholarships are perhaps the fastest-growing element of university expenditures in Canada, having increased eight-fold in the past twenty years or so. Total university expenditures on scholarships now equal about $1,850 per FTE student.
Institutions provide very little in the way of break-down with respect to how this money is spent, specifically whether the money is awarded based on need or merit, and whether funds are being
used to support undergraduates or graduate stu-dents. Surveys conducted in the 2000s suggested that only about 25% of funds were going to under-graduates, and those funds were split on roughly a 50/50 basis between merit and need-based aid. This implies that the bulk of the funding—75% of it—is supporting graduate students, and that therefore institutional aid spending is probably something like $600 per student annually at the undergraduate level and $7,500 per student annu-ally at the graduate level.
Figure 5.11 Total Institutional Scholarships by Institutional Type, in millions ($2016)

57
5.2 Student assistance
The preceding sections have looked at the four major sources of assistance: need-based student aid, tax credits, education savings grants, and institu-tional scholarships. These are not the only sources of student aid expenditures in Canada. Among the other sources of aid are the Government of Canada payments to First Nations and Inuit stu-dents through the Postsecondary Student Support Program (PSSSP), which are roughly $300 million per year, and scholarships for graduate students through the three traditional granting councils, which are roughly $200-$250 million per year.
There are also sundry provincial merit programs, which at one point accounted for nearly $137 million per year but have declined significantly over the past few years. Provincial graduate tax
credits—which provided tax rebates to PSE grad-uates who stayed in a particular province—were quite popular about a decade ago and accounted for nearly $100 million per year at their height, but now only Saskatchewan maintains such a pro-gram. Quebec and Saskatchewan also have small programs which top-up contributions to Canada Education Savings Grants.
Figure 5.12 aggregates the four major sources of aid (excluding the programs noted in the paragraph above) to provide a near-complete picture of how student assistance has increased over the past two decades. There are three key points to be made here based on this data:
• Overall, the amount of money given to indi-vidual Canadians has roughly doubled over the past twenty years, even after accounting for inflation.
• The Canadian student aid system is less loan-based than it used to be. In 1996-97 loans made up 67% of total student aid; in 2015-16 that figure is down to just 32.8% and the total dollar amount fell by 4% in real terms (1996-97 was the all-time high-point for student lending in Canada). During those intervening 20 years, government grants have increased by 208% after inflation, tax credits by 188% after inflation, institutional grants 484% after infla-tion, and education savings grants have gone from zero to over $892 million per year. This is, in total, a sea change in the way post-sec-ondary education is financed.
Figure 5.12 Total Student Financial Assistance by Type, Selected years, in millions ($2016) 1996-97 to 2016-2017

58
• The total amount of non-repayable assistance (that is, total assistance minus loans) was over $8.8 billion in 2016-17: if money from the additional sources not covered by figure 5.12 are included, it increases to about $9.5 billion. We know from chapter three that the total amount of tuition paid to Canadian universi-ties and colleges was in the region of $13.7 bil-lion in that same year; however, we also know that roughly $4.7 billion of this was paid by international students. Since very little student assistance is available to international students, it is possible to say that the total amount of non-repayable assistance given to Canadians each year is roughly the same as the amount of tuition fees paid by Canadian students. Or, put another way, Canada has net-zero tuition for domestic students.
The effect of all this extra financial aid is most easily seen in statistics on student debt. In the late 1990s, prior to all these major increases, there was considerable concern that Canadian students would soon be carrying debt loads like students from 4-year private institutions in the United States (which, at the time, were in the neighbour-hood of C$37,000 in today’s dollars). Average stu-dent debt loads in Canada did increase sharply in the 1990s, but since that time have remained very constant and by some measures have decreased.
We have two data sources for looking at student debt over time. The first is the National Graduates Survey (NGS), which surveys every fifth (formerly fourth) graduating class three (formerly two) years after graduation. Despite the capricious survey timetable, it still is the country’s most thorough examination of graduate debt because of the large sample, drawn from the entire graduate cohort of
both universities and colleges. The drawback is that data can be nearly a decade out of date by the time it is published: at the time of writing in the summer of 2018, the most recent observation is from 2010. The second is the Canadian Undergrad-uate Survey Consortium (CUSC)’s triennial survey of graduating students. These have the benefit of being published almost immediately; but they have the drawbacks of a somewhat inconsistent sample (consortium members are not entirely consistent from iteration to iteration), they exclude colleges, and it has low participation from the province of Quebec. The lack of Quebec figures tends to raise national estimates of debt because of lower average debt levels in that province. Both the NGS and CUSC sources are included in figure 5.13.
Figure 5.13 shows average student debt among those students who incurred debt. Evidence from various surveys suggests that the majority of Canadian college and undergraduate students do not incur any debt at all during their studies. Moreover, in the three most recent National Graduates Surveys, the percentage of graduates who indicated they had student debt was decreasing; from 45% to 40% for university students and from 45% to 30% for college students (CUSC data, no doubt due to the different sample frame, showed higher incidences of debt for university graduates around the same time—58% in 2009 and 59% in 2012—but has since shown a decline in incidence to 50% in 2018). As a result, the data shown in figure 5.13 applies only to a minority of students who finish a college diploma or undergraduate degree.
In terms of debt trends, what we see is a significant run-up in student debt levels in the 1990s, but a flattening out in real terms since 2000. Of the six national surveys that have been undertaken

59
since 2006, the value for undergraduate debt has moved around in a relatively narrow band between $24,000 and $29,000, with a mean value of just under $27,000. Thus, despite all the frequent platitudes about “ever-increasing student debt”, the massive increase in student aid shown in figure 5.12 has in fact brought the student debt problem relatively under control and since 2010 at latest, we have not seen any increase at all in student debt.
Figure 5.13: Average Student Debt at Graduation, Univer-sities and Colleges, Selected Years, ($2018) 1982-2018

60
APPENDIX A:The Canadian Postsecondary
Education System
Traditionally, the Canadian postsecondary system is un-derstood to consist of uni-versities and community colleges; however, the line between these types of institu-tions is no longer so tidy. New hybrid organizations, often referred to as polytechnics,
have evolved out of the college system to become a distinct part of the educational landscape. In Canada, the term “postsecond-ary” also includes a system of apprenticeships, which is quite unlike its European counter-parts in both its structure and its target population. Addition-
ally, a reasonably large private vocational school sector provides certifications, mostly for short training programs of less than 12 months’ duration. This appen-dix provides a detailed overview of the sector’s main components.
Defining the postsecondary sectors
What is a university?
Most of the earliest universities in Canada were denominational institutions, designed to provide either religious education for future clerics or religiously-in-spired education for future pri-mary/secondary school teachers. State funding for universities began in the nineteenth century, but that funding did not become a formal annual expenditure in most provinces until the Second World War. Formula funding—
that is, stable and predictable amounts given to universities based on objective characteristics like student numbers—dates only from the late 1960s or early 1970s.
Universities in Canada follow the global standard Bachelor’s–Master’s–Doctorate procession. The typical length of a bache-lor’s degree program is four years except in Quebec, where it is
three. Most professional pro-grams (medicine, dentistry, law) are technically undergraduate programs but are usually consid-ered “second-entry” bachelor’s programs, to be started only after one’s first bachelor program has finished. Quebec is a partial exception in that some spots in these programs are reserved for students entering directly from a CEGEP (see below, colleges).

61
How many universities are there in Canada?
There is no standard definition of what constitutes a university in Canada. Each province has legislation defining the use of the term, but these vary considerably in their stringency. Membership in Universities Canada, the country’s peak representative body for universities, is often seen as an “unofficial” form of national accreditation, though the organization itself distances itself from such claims.
Because of this definitional vagueness, it is difficult to come to a standard count of uni-versities in Canada. The most restrictive definition—provin-cially-funded institutions re-porting to a single President and not in a federated arrangement with a larger institution—would produce a count of 64 institu-tions, but other definitions could produce counts of up to 120 or so. Universities Canada has 96 members, but it excludes a num-ber of institutions which call themselves universities (e.g. Tyn-dale University, Quest Universi-ty—see below, nonstandard universities) while including a number of degree-granting bodies which are federated with other institutions (e.g. Huron
College/Western University, Trinity College/University of Toronto). Complicating matters is the Université du Quebec system, which consists of ten separate postsecondary insti-tutions, as well as a number of institutions, such as the Univer-sity of New Brunswick and the University of British Columbia, which have multiple campuses but are not usually described as “systems”.
What types of universi-ties are there in Canada?
Until the late 1980s, universities had a monopoly on the delivery of bachelor’s degrees in Canada, and they still do in Quebec and the four Atlantic provinces. Over the past 30 years, the gov-ernments of British Columbia, Alberta and Ontario have begun to allow some colleges to deliver degrees as well, sometimes to widen access to the four-year degree, and sometimes simply to promote more competition in the postsecondary sector. Some of these institutions have since become universities in their own right (e.g. Vancouver Island University, Mount Royal Uni-versity); of the remainder, a good number have begun to style themselves as polytechnics. Universities do, however, main-
tain a monopoly over graduate education and basic research, though colleges and polytechnics have begun to carve out their own niches in applied research.
Although Canada has no official university typology—and while Canadian universities come in a variety of shapes and sizes—they do tend to converge on several “types”. Firstly, there are the large research universities with medical schools. There are fourteen of these, and they make up nearly all of what is known as the “U-15” group. There are also a large number of small, non-research-intensive institutions, including a number of denominational universities (e.g. Redeemer), art schools (e.g. Nova Scotia College of Art and Design), the “Maple League” of Liberal Arts Colleges (e.g. Bishop’s, Mount Allison, St. Francis Xavier and Acadia), or institutions that serve small cities and associated rural areas (e.g. University of Northern British Columbia, University of Prince Edward Island, Brandon University). In between, there are many institutions ranging in enrolment from about 5,000 to 50,000 which are usually given the label of comprehensive uni-versities. The smaller ones (e.g. Trent University) to some degree

62
resemble liberal arts colleges in their focus on undergraduate instruction while the larger ones (e.g. Guelph, Simon Fraser) are, on some counts, more research intensive than some members of the U-15.
How do university boards work?
By international standards, Canadian universities are relatively autonomous from governments. Though some of the country’s older institutions have governing boards which are entirely independent of provin-cial governments, most Cana-dian universities do have some government appointees on their boards. That said, these boards
tend not to “take direction” from government and it is rare that a government tries to get its appointees to follow a particular line on a specific issue. Provincial governments are more inclined to steer institutions through the power of the purse; for a variety of historical reasons, govern-ments’ inclination to engage in detail grows as one goes further west across the country.
Boards are mainly responsible for universities’ financial affairs, as well as selecting presidents and monitoring/evaluating their performance (notably, Laval and Sherbrooke are exceptions in that their presidents are elected through an electoral college of internal stakeholders). In
academic matters, universities are governed by bodies which are usually known as Senates, though they sometimes go by other names, such as “Faculty Councils”. Elected academics usually make up a majority on these bodies, though elected students and various adminis-trators sitting ex-officio can take up a large proportion of seats. A few universities have a tricam-eral system in which the Board and Senate are joined by a body made up of elected alumni; the University of Toronto is unique in having a unicameral system consisting of a singular Govern-ing Council which effectively acts as both Board and Senate.

63
Nonstandard Universities A Short Explainer
When the term “university” is used in Canada, it generally refers to stand-alone public institu-tions. But many institutions in Canada do not fit that definition and yet use the term “university” themselves or are classified as such by others. Broadly, these fit into one of five categories:
AffiliAted Colleges: There are a large number of small, usually denominational, colleges which have federation agreements with larger, public institutions. The majority of these are in Ontario, and in many cases, the colleges are older than the public institution with which they are affiliated. When Ontario finally agreed to publicly finance higher education on a large scale in the 1950s, it did so on the understanding it would not finance religious institutions, which at the time far outnumbered the non-denominational schools. For example, Laurentian University has Thorn-loe (Anglican), Huntingdon (United) and Sudbury (Catholic) Universities, and Assumption Universi-ty is a federated body of the University of Windsor. Outside Ontario, we see similar arrangements at places like the University of Manitoba, which has St. Paul’s (Catholic) and St. John’s (Anglican) Colleges, and the University of Regina, which has two religious federated colleges (Campion and Luther) as well as an affiliation with the First Nations University of Canada. Occasionally, universi-ties have minority-language associated colleges, such as St. Boniface at the University of Manito-ba or Glendon at York University.
stAnd-Alone Religious institutions: While many religious institutions sought arrangements with public universities, others did not. Some of these have membership in Universities Canada, such as Trin-ity Western University in British Columbia, King’s University in Alberta, and Canadian Mennonite University in Winnipeg. A few have degree-granting powers but stay outside Universities Canada, such as the St. Stephen’s University in New Brunswick, Tyndale University in Toronto and Burman University in Alberta.
PRivAte non-denominAtionAl univeRsities: There are very few of these. Quest University in British Columbia is perhaps the best known of this type, due to its rather unique “block-plan” course system. This group also includes the business-orientated Canada University West in Vancouver, as well as the multi-campus Yorkville University and the online University of Fredericton in New Brunswick.
indigenous institutions: Across Canada there are roughly 50 institutions, mostly in West-ern Canada, which provide postsecondary education specifically for Indigenous peoples. The funding arrangements for these institutions vary by province. With only one or two exceptions, they are not degree-granting institutions; to a large extent they serve as delivery platforms for programs established by a mainstream institution.
offshoRe institutions: Canada has had a few foreign universities set up shop in Canada, but they often do not last very long. Charles Sturt University of Australia, for instance, offered teacher education programs at a campus in Brampton for about a decade before closing in 2016. Currently, City University of Seattle, the New York Institute of Technology, and Farleigh Dickinson University all have campuses in Vancouver, while Northeastern University recently opened a cam-pus in Toronto.

64
What is a college?
Vocational education in Cana-da has a long history, but most publicly-funded postsecondary vocational education dates from the 1960s. Colleges are the most heterogenous part of the Ca-nadian educational system: the institutions which go by this name vary significantly in nature from one end of the country to the other.
The “classic” form of communi-ty college primarily delivers vocational/trades programs to mature students (i.e. not di-rect-from high school) in 2-year programs. At one point, this was the dominant form of commu-nity college in Saskatchewan, Manitoba, Ontario and the four Atlantic provinces. Over time, as the economy has become more service-driven, the offerings of colleges have become white-col-lar orientated. They remain fo-cused on professional education leading directly to careers, but increasingly, these careers are in health care, technology and busi-ness. With a more professional orientation has come an increase in program length (Ontario college programs are now mostly three years) and, outside the Atlantic provinces, an increase
in the provision of actual degrees as well. Over time, Ontario has drifted the most from the “classic” model of colleges, the Atlantic colleges the least.
Alberta and British Columbia always had a slightly different model for community colleges, one which was much closer to the American model of “junior colleges”. In these two prov-inces, community colleges had professional orientations like those in the other seven majority anglophone provinces. However, they also had a university-trans-fer function. Both provinces initially were very cautious about expanding universities and so kept it concentrated to just two (Alberta) or three (B.C.) institutions, with students from outside the urban centres doing the first two years at regional colleges before transferring to the universities. Since the turn of the century, both provinces have been expanding their university systems (British Columbia more so than Alberta), and so the university-transfer aspect of col-leges has eroded somewhat. Yet because of the transfer mission, both Alberta and British Colum-bia have extensive inter-institu-
tional credit-transfer arrange-ments not replicated anywhere else in the country.
Quebec’s college system is quite different from those in the rest of the country. Quebec has only five years of secondary school compared to six in the rest of the country (the regular leaving age is 16 or 17 rather than 17 or 18). Students may then attend a College d’enseignement général et professionnel (CEGEP) for two years. As in Alberta and British Columbia, there are two streams—a vocational/profes-sional one which leads to the labour market, and a general one which ends with the awarding of a diplôme d’ études collégiales (DEC), which is a prerequisite to attend university. All univer-sity-bound students in Quebec must therefore attend college. This model made a great deal of sense 50 years ago when the province’s small postsecondary system was mostly composed of Catholic Collèges classiques offering education that was more rigorous than secondary educa-tion but less than a full degree. During Quebec’s Quiet Revolu-tion of the 1960s, these religious colleges chose to become CE-

65
GEPs, except for Bishop’s, which converted to university status. It is doubtful that this model would be adopted deliberately today, mainly because it is not clear that there is much call for an intermediate non-vocational credential between secondary school and university. Neverthe-less, Quebec’s current system is so entrenched that it will survive simply through inertia; i.e., while there may not be a reason to adopt such a system now, there is no compelling reason to abandon it.
All told, there are over 200 com-munity colleges across Canada.
Colleges tend to have greater responsibility for ensuring access to postsecondary education than do universities; most are open-access, and they are more likely to be located in rural and remote parts of the country. In-digenous peoples are more likely to be found at colleges than at universities. Individual colleges also tend to be smaller than individual universities; there are only a dozen or so community colleges with more than 10,000 students.
From a governance perspective, colleges are usually under tighter government control than univer-
sities; indeed, in several provinc-es, colleges were government de-partments until the 1990s. Their boards contain more members directly appointed from gov-ernment and they tend to have less freedom to independently innovate in programming. In Nova Scotia, New Brunswick, and Saskatchewan there are single “systems” of college educa-tion. On the labour side, college employees tend to be unionized at the provincial rather than the institutional level, meaning there is sector-wide bargaining in col-leges whereas with universities, bargaining usually occurs on an institution-by-institution basis.
Who Controls Degree-Granting Authority?
Universities, by definition, have authority to grant degrees. But in many parts of the country, so too do other organizations, including private institutions and community colleges. How did these bodies become degree-granting?
The power to authorize the granting of degrees rests with the various provincial ministers of advanced education. In nearly all provinces, the process by which institutions—be they commu-nity colleges or private institutions—can apply to offer degrees is enshrined in law. Interested institutions must apply separately for each degree they wish to offer. Processes exist for dedi-cated arms-length organizations (such as Ontario’s Postsecondary Education Quality Assessment Board, Campus Alberta, and BCcampus) to evaluate whether the institution has the financial and human resources to offer the degree. If this is the first time an institution has made a request, there is usually a separate inquiry made into the suitability of the institution itself and its pro-moters.
While the dedicated organizations evaluate the proposals, their role is formally only advisory: Min-isters retain the final power to decide the merits of any given proposal. In practice, the recom-mendations of the arms-length organizations are accepted in the majority of cases.

66
What is a polytechnic?
The term polytechnic has a number of uses around the world. In France, it refers to one specific elite engineering school (the École Polytechnique). In the United Kingdom (up until 1992), it referred to a kind of junior college, offering universi-ty-style programming, but not permitted to issue degrees. It had a similar definition in New Zealand for a long time, though recently those polytechnics have come to have more professional and technical foci as well. In Finland, polytechnics (technical-ly ammattikorkeakoulu or AMK) are also known as universities of applied sciences, and while they focus on practical and professionally-oriented educa-tion, they also engage in applied research and issue both bache-lor’s and master’s degrees.
In Canada, the term polytechnic does not have a legal meaning outside the province of Alberta, where the term refers to two spe-cific institutions (the Northern and Southern Alberta Institutes of Technology). However, as some Canadian community colleges—mainly the large ones from Ontario westward—have become more professionally-ori-
ented and technologically so-phisticated, as well as increased their involvement in applied re-search and begun teaching bach-elor’s level programs, there has been a move on the part of some of these institutions to rebrand themselves with the term poly-technic. These institutions band together to lobby at the federal level under the banner “Polytechnics Canada”; however, most Polytechnics Canada mem-bers also remain members of Colleges and Institutes Canada, the peak representative body for community colleges.
Prior to the adoption of the term polytechnic about a decade ago, the last major institution to carry this label was Ryerson Polytechnic, which transformed into a university in the early 1990s. For this reason, the move by some institutions to adopt the polytechnics moniker is seen in some quarters as evidence that these institutions are simply colleges which want to become universities. In one or two cases that is clearly true: Sheridan College, a Toronto area member of Polytechnics Canada, has been quite open in seeking uni-versity status, while Kwantlen
Polytechnic University in British Columbia has already achieved it. Others have decided to turn down university status when offered (for example, the British Columbia Institute of Technol-ogy) and many major colleges, like Humber and Seneca, seem focused on forging an indepen-dent identity which straddles the traditional line between colleges and universities.

67
Apprenticeships
Apprenticeships in Canada are a form of postsecondary ed-ucation where learners combine periods in the workforce under the supervision of experienced tradespeople with periods of in-class study which occurs mainly, but not exclusively, in communi-ty colleges.
Technically, apprentices are not “students” and so do not show up as such in enrolment statis-tics. Rather, they are employ-ees who have signed specific apprenticeship contracts with employers and who periodically attend courses. Apprenticeships are organized by trade, and most trades are of the traditional voca-tional variety, particularly those related to housing, construction, automobile, and food indus-tries. In the last decade, there have been various attempts to bring apprenticeships to other, more service-oriented occupa-tions (mainly: aestheticians, early childhood educators and IT service professionals), with mixed results. Though efforts have been made to increase apprenticeship options in sec-ondary schools, for the most part apprentices in Canada tend to be men in their early-to-mid 20s.
Apprentices pass through vari-ous “levels” before certification as journeypersons. The number of levels, as well as the number of work hours and weeks of in-class training, can vary significantly by trade and province. Broadly speaking, most of the major trades have four levels that re-quire one year each to complete. Finishing the final level and passing the relevant exams enti-tles the individual to a provincial trades certificate; to work outside the province, individuals must complete a second set of tests known as Red Seal exams.
In international context, Cana-dian apprenticeships are outliers for a variety of reasons. The first is that they are considered post-secondary rather than a part of the secondary education system: hence the relatively advanced age of its apprentices. The second is the length of the programs, which is typically four years compared to two in most of Europe. The third is the release system for theoretical in-class training. Most countries use a day-release system which sees apprentices spend 3-4 days a week at work and 1-2 in class. This is not unknown in Can-
ada, but more common is the block release system which sees apprentices work for 35-40 weeks at a time and then go to class for blocks of 8-12 weeks. The final reason is the relatively limited number of occupations for which apprenticeships are available: Canadian apprentice-ship trades are heavily blue-collar in nature and the number of white-collar trades, which dom-inate the scene in Germany for instance, is quite small
68
Private Vocational Colleges
The final element of Cana-da’s postsecondary education system is the private, mainly for-profit, vocational colleges. These resemble the private for-profit sector in the United States except they focus almost exclusively on programs of one year or less rather than degree-level programming. They are quite common in certain fields not covered at community colleges, such as music produc-
tion, aesthetician training, and dental assistance, but they also offer some relatively advanced IT training as well. language schools are another large sec-tor, though they mainly focus on students from outside Canada. Because they operate without subsidy, their programs tend to be significantly more expensive than those of community col-leges; on the other hand, because they operate on a continuous-in-
take basis, they offer students more convenience than institu-tions whose only intakes are in September and January. There are several hundred of these in-stitutions registered across Cana-da. Most are small, independent businesses, but a substantial portion of students are enrolled at large, chain institutions such as triOS or CDI, which tend to have a business or IT focus.
Federalism and Postsecondary Education: Who funds what
The basic tension in the Canadi-an Confederation debates of the 1860s was how to reconcile the ideal of a national government with a system of representation by population with francophone Quebec’s desire to maintain over its own cultural institutions—in particular those dealing with education. The eventual solution was a federal system with a feder-al government elected through a rough representation by popula-tion, but with responsibility for education (among other things) vested firmly at the provincial level. This compromise is en-shrined very specifically in s. 93 of the Canadian Constitution,
which allocates responsibility for postsecondary institutions and their funding to the provinces. This is why Canada effectively has ten provincial systems of postsecondary education rather than a single national one.
Though operating funds (which includes both provincial gov-ernment funding and tuition fees) are exclusively provincial in nature, the federal govern-ment contributes to the higher education sector in three ways: through transfer payments to provinces, support for scientific research, and various forms of student financial assistance.
The federal government trans-fers funds to provincial govern-ments in two ways: first, through equalization payments designed to allow poorer provinces to pro-vide services at levels similar to richer ones and second, through per-capita payments via the Canada Health Transfer and the Canada Social Transfer. These transfer programs originated in the 1940s, when the federal government “borrowed” tax room from provinces to pay for the war effort, and they contin-ued in the 1950s/60s when the government began to use these tax revenues to pay provinces for the development of what we

69
now know as our social safety net. Roughly 30% of the Canada Social Transfer is theoretically allocated to postsecondary edu-cation; however, since there is no way to track federal funds once they are in provincial coffers, this allocation is purely notional. In total the $3.5 billion or so from this source would account for only about 6% of total insti-tutional revenue in Canadian PSE. Further details about these arrangements may be found in chapter five.
Public funding for scientific research at universities did not begin until World War II, but it only became a major source of institutional revenue during the 1970s. For many years, this fund-ing was directed not to institu-
tions, but to individual research-ers (or groups thereof) through the granting councils. From the early 1990s onwards, however, there has been a gradual move to-wards funding research at an in-stitutional level, first through the Network Centres of Excellence, then through the Canada Foun-dation for Innovation (which funds research infrastructure) and most recently through the Canada First Research Excel-lence Fund. Some provinces also fund research separately (notably Quebec), but the main sources of funding lie in Ottawa.
Student assistance in Canada takes various forms (see chap-ter five), but both provinces and the federal government contribute to students’ educa-
tion through loans, grants and tax credits. In addition, the federal government spends over $1 billion per year in educational savings incentives.
In addition to the above, there is funding for capital, which tends to be erratic and come in bursts, often in the form of “stimulus” programs during times of eco-nomic downturn. Increasingly, outside Quebec at least, provin-cial governments are relying on occasional federal government spending sprees to take care of capital funding, though institu-tional fundraising is also rising in importance as a source of capital funds.