Embed Size (px)
Citation preview

The State of Nonprofit Governance AMY BLACKWOOD, NATHAN DIETZ, AND TOM POLLAK SEPTEMBER 2014

Copyright © September 2014. The Urban Institute.
Permission is granted for reproduction of this file, with attribution to the Urban Institute.
The Urban Institute is a nonprofit, nonpartisan policy research and educational organization that examines the social, economic, and governance problems facing the nation. The views expressed are those of the authors and should not be attributed to the Urban Institute, its trustees, or its funders.
Cover image: Rawpixel/Shutterstock.com.

Contents Introduction 1
Background 1
Board Composition and Board Independence 2
Board Size 2
Board Independence 3
2010 Snapshot of Governance Practices 5
Audits and Audit Committees 5
Compensation Review and Approval 5
Conflicts of Interest 6
Whistleblower Policies and Document Retention and Destruction Policies 6
Governance Practices Vary by Organizational Characteristics 7
Larger Organizations More Likely to Have Adopted Good Governance Practices 9
Health Care Organizations Are More Likely to Have Adopted These Practices; Arts Organization Less Likely 9
Organizations Receiving Government Grants More Likely to Have Good Governance Practices in Place 12
Board Size Negatively Related to Some Good Governance Practices 12
Board Independence Positively Related to All Good Governance Practices 12
Older Organizations More Likely to Follow Good Governance Practices 13
Discussion 14
Appendix A. Additional Tables 15
Notes 21

Introduction Theft, scams and phantom purchases—not words often associated with public charities. However, an investigative report by the Washington Post found just over a thousand tax-exempt organizations had reported a diversion of assets on their Form 990 since 2008.1 Unfortunately, the organizations featured in the investigation are not the only examples of theft and embezzlement in the nonprofit sector. In the past five years, well-known and respected charities such as the Smithsonian and the Metropolitan New York Council on Jewish Poverty found that their chief executives had embezzled millions of charitable dollars.
Does this mean that the nonprofit sector is a “hidden world of thefts, scams and phantom purchases” as the Washington Post suggests? Though it makes a great headline, these organizations represent less than half of 1 percent of the nonprofit sector.2 However small in scope, though, no dollar diverted from its charitable purpose is acceptable. Reports like this should raise questions about board practices, polices, and effectiveness. Are board members governing, that is, setting direction, overseeing and monitoring performance, and ensuring accountability (Renz 2010, 126)? Are practices in place to guard against these types of incidents?
Though the most effective governance strategies and practices will vary from organization to organization, the IRS and charity watchdog groups agree that having certain governance policies and procedures is an indicator of a well-governed entity (Renz 2010, 60). The IRS, in particular, has encouraged organizations to adopt recommended practices and policies since 2008 when they redesigned the Form 990 and included questions on governance policies.
This brief provides a snapshot of nonprofit governance practices among operating public charities, as they are reported on IRS Form 990. It also explores the relationship between board and organizational characteristics and the adoption of certain governance practices, similar to the work by Francie Ostrower in the first nationally representative study of nonprofit governance, also conducted by the Urban Institute (Ostrower 2007).
Using 2010 IRS Form 990 data, we focus on eight governance practices:
• Board independence
• Conflict-of-interest policies
• Whistleblower polices
• Document-retention and -destruction polices
• Compensation review and approval processes for chief executives
• Compensation review and approval processes for other key employees
• Audits
• Audit committees
Background In the wake of such scandals as Enron and Worldcom, Congress passed the Sarbanes-Oxley Act (SOX) in 2002 to reform fraudulent governance practices in the corporate sector and restore investor confidence. Though aimed almost entirely at for-profit corporations,3 SOX has had a profound effect on current nonprofit governance thought and practice (Ostrower 2007). Following its passage, some nonprofit organizations began to adopt SOX-like practices such as audits, audit committees, conflict-of-interest policies, whistleblower policies, and document-retention and -destruction policies.

Although the Senate Finance Committee held hearings in 2004 and issued a white paper outlining good nonprofit governance practices similar to those in SOX,4 no federal legislation has been passed mandating certain governance practices among nonprofits.5 In 2007, however, the IRS entered the governance debate by issuing its own white paper on good governance practices, noting that these practices lead to better tax compliance.6 In 2008, the IRS redesigned Form 990, the annual reporting document for larger nonprofits,7 and included a new section on governance policies and practices.8 The IRS does not currently require organizations to implement these policies, but the disclosure requirements certainly provide incentive for nonprofits to adopt these practices.
Board Composition and Board Independence Undoubtedly, the people composing the board are vital to effective governance and successful organizations. The presence of major donors on the board, board member diversity, and board member commitment have all been linked to improved organizational performance (Callen, Klein, and Tinkelman 2003; Siciliano 1996; Preston and Brown 2005). At a minimum, however, boards of directors, both nonprofit and for-profit alike, have two fundamental duties—the duty of care and the duty of loyalty. Established in case law long before any federal statutes governed exempt organizations, these duties require board members to participate in board meetings and fulfill other duties that could be expected from a reasonable person in that role (duty of care) and to make decisions with the best interest of the organization in mind and not for personal gain (duty of loyalty).
IRS Form 990 asks several questions regarding the duties of care and loyalty. To gauge the participation of board members, the IRS asks the number of board members, the average number of hours per week spent on board activities by each board member, and whether each board member received a copy of Form 990 before it was filed with the IRS. As for the duty of loyalty, the IRS asks each organization (1) to report the number of independent board members, (2) if the organization has a written conflict-of-interest policy, and (3) whether or not the policy is enforced through disclosure requirements and monitoring.
In this section we focus on the size and independence of public charity boards. In later sections, we discuss how these board attributes relate to governance policies and practices.
Board Size In order to qualify for tax-exempt status, nonprofits must have one or more board members. Many states, however, mandate that nonprofit boards have at least three board members (Hopkins and Gross 2009, 9). Beyond meeting these minimum requirements, the size of the board is largely up to the nonprofit organization. Board size will vary based on many factors, including type of organization, age, and primary funding type. In general, most agree that boards need to be large enough to allow full and diverse discussion and opinions on board business, but not so large as to hinder board member participation.9 In its Principles for Good Governance and Independent Practice, Independent Sector recommends at least five board members except for very small organizations.10
In 2010, 85 percent of nonprofits had at least five board members (figure 1). The median board size was nine members (table A.1). As expected, this varies widely when we examined board size by such organizational characteristics as size (measured by total expenses), type, age, and primary funding source. Smaller organizations tend to have fewer board members than larger organizations. Organizations spending less than $250,000 per year had a median of seven board members compared with organizations that spend $10 million or more per year, which had a median board size of 15 members.
2 URBAN INSTITUTE

Figure 1. Board Size, 2010
Source: IRS Statistics of Income sample files, 2010.
Higher-education organizations had much larger boards when compared with other types of organizations. The median board size of 21 was nearly double the median size of every other type. Hospitals and arts organizations also had slightly larger boards. The median hospital and arts organization had 12 to 13 board members, compared with 8 to 10 board members across the other types of organizations.
Board size varied only slightly by primary funding source.11 Organizations that had a diverse funding base and those that relied more heavily on private contributions had slightly larger boards than those relying primarily on government grants or program service revenue. Most likely, these organizations rely on their board members for fundraising, and larger boards provide a broader funding base.
As expected, older organizations tend to have larger boards. Organizations that are older than 30 years had a median board size of 13, compared with a median board size of seven for organizations less than five years old. This may indicate that older organizations have more professionalized recruitment processes for potential board members and a broader and deeper pool of candidates—or that people might be more willing to serve on the boards of well-established organizations.
Board Independence Board members are bound by a duty of loyalty to the organization that requires them to make decisions in the best interest of the organization rather than in their own self-interest. One way to ensure the best interest of the organization is represented is to adopt a conflict-of-interest policy, which we will discuss in the next section. Another is to have a largely independent board. Board members are considered independent if they do not receive, directly or indirectly, material financial benefits from the organization or related organizations and are not related to anyone who does. As an example, if the chief executive or
2.9
11.5
40.6
32.7
12.3
0.0
5.0
10.0
15.0
20.0
25.0
30.0
35.0
40.0
45.0
Fewer than3 members
3–4 members
5–10 members
11–20 members
20 or moremembers
Per
cent
of o
rgan
izat
ions
Board size
THE STATE OF NONPROFIT GOVERNANCE 3

any other staff member or contractor of the organization sits on the board of directors, he or she is not considered independent.
Only a handful of states mandate that a majority of a nonprofit’s board members must be independent.12 For the vast majority of nonprofits, board independence is left to the organization’s discretion. Independent Sector, however, recommends that at least two-thirds of board members be independent.
In 2010, 83 percent of nonprofit organizations had boards in which at least two-thirds of the members were independent (figure 2). The remaining 17 percent of nonprofits with less than two-thirds independent board members account for 19 percent of nonprofit revenues and 14 percent of nonprofit assets.
Figure 2. Board Independence, 2010
Source: IRS Statistics of Income sample files, 2010.
Smaller organizations (measured by total expenses) may rely more heavily on staff and family members to compose their boards. Just over one-quarter of nonprofit organizations with less than $250,000 in annual expenses had less than two-thirds independent board members. Only 11.5 percent of organizations with $10 million or more in annual expenses had less than two-thirds independent board members (see table A.2).
Twenty-three percent of education organizations (excluding higher education), which includes parent teacher organizations, private elementary and secondary schools, and after-school programs, had boards where less than two-thirds of the members were independent. Surprisingly, given that they tend to be larger organizations, hospitals also had a higher proportion of boards with fewer independent board members—19 percent under the two-thirds recommendation.
Organizations relying primarily on program service revenue and private contributions had a higher proportion of boards with less than two-thirds independent board members. Of those organizations, 18 to 19 percent had boards less than two-thirds independent—potentially surprising to those who would expect a much higher percentage because private donors would seemingly prefer a more independent
14.5
2.6 0.7
82.2
0.0
10.0
20.0
30.0
40.0
50.0
60.0
70.0
80.0
90.0
Less thanone-half
independent
One-half totwo-thirds
independent
Two-thirds tothree-quartersindependent
Three-quartersand greaterindependent
Per
cent
of o
rgan
izat
ions
Board independence
4 URBAN INSTITUTE

board. Meanwhile, organizations with more-diverse funding streams had slightly fewer boards below the recommended independence level (16 percent), and only 12 percent of organizations relying primarily on government grants had boards with less than two-thirds independent board members.
Younger organizations may also be relying more on staff members and family members to fill their governing boards. More than one-fifth of organizations 10 years or younger had a board less than two-thirds independent, compared with only 10 percent of organizations that had been around for more than 30 years.
2010 Snapshot of Governance Practices In 2010, many public charities were practicing the good governance principles recommended by the IRS and other entities such as Independent Sector and the Senate Finance Committee. Having an independent accountant compile, review, or audit annual financial statements; having a review and approval process for executive compensation; and having a written conflict-of-interest policy were the most widely adopted good governance practices; more than 60 percent of organizations adopted these practices (figure 3). Less than half of the public charities had whistleblower policies or document retention and destruction policies.
Audits and Audit Committees Though no blanket mandate exists for any good governance practice at the federal or state level, an independent review or audit of financial statements is the most often mandated good governance practice. Currently, organizations spending $500,000 or more in federal awards in a given year are required to conduct an independent audit.13 Additionally, 26 states require nonprofits to submit a copy of an independent audit review if it meets specific financial thresholds.14 Usually based on total contributions received or total revenue, the thresholds vary across states. California is the only state that currently requires an audit committee for some organizations (those with $2 million or more in gross revenue), but New York has recently passed legislation that mandates organizations filing an independent auditor’s report have an audit committee.
Fully 64 percent of public charities had an independent accountant compile, review, or audit their financial statements for tax year 2010 (figure 3). Of these organizations, 79 percent had an audit committee responsible for both overseeing the compilation, review, or audit and selecting an independent accountant. In 2005, Ostrower found that 67 percent of public charities had an audit during the last two years, meaning the percentage remained relatively steady over the 5-year period. However, we see a large increase in the percentage of organizations that had an audit committee. Only 20 percent of organizations surveyed had an audit committee in 2005, compared with 50 percent of all public charities filing Form 990 in 2010.15
Compensation Review and Approval California is the only state to require board review and approval of chief executive compensation for nonprofits. However, the federal Taxpayers’ Bill of Rights encourages nonprofits to establish procedures to review and approve the compensation of its chief executive through the rebuttable presumption test. Under this test, compensation is presumed to be reasonable if the board of the nonprofit, which is composed of independent members with no conflicts of interest related to the compensation decision, approved the decision in advance using comparability data and documented the process.16
Fully 63 percent of organizations had a compensation review and approval process for the CEO, executive director, or other top management official in 2010 (figure 3).17 Some organizations were also incorporating more-formal reviews of compensation for other key employees. Fully 46 percent of organizations had a process for reviewing and approving key employees’ salaries other than the chief executive.18
THE STATE OF NONPROFIT GOVERNANCE 5

Conflicts of Interest Currently, no state requires nonprofits to adopt a conflict-of-interest policy, although recent New York legislation will require all nonprofits incorporated or doing business in New York to have one. Many states, however, define in their nonprofit statutes what constitutes a conflict-of-interest transaction and require nonprofits to follow a certain process when determining if the transaction is in the best interest of the organization. The process usually includes making the conflict of interest known to all voting board members and only proceeding with the transaction if a majority of board members without conflicting interests approve the transaction.19
In 2010, 62 percent of public charities had a conflict-of-interest policy (figure 3), a 12 percentage-point increase from Ostrower’s 2005 findings. Most of these organizations report being active in ensuring the policy is followed and a member’s potential conflicts of interests were monitored. Of those organizations that had a conflict-of-interest policy, 89 percent required officers, directors and key employees to disclose annually interests that could give rise to conflicts, and 84 percent regularly and consistently monitored and enforced compliance with the policy.
Whistleblower Policies and Document Retention and Destruction Policies Only two SOX provisions apply to both for profit and nonprofit corporations: (1) whistleblower protection and (2) document retention and destruction. SOX makes it illegal for an organization to retaliate against a whistleblower and makes it a crime for an organization to alter or destroy documents that may be needed in investigations or litigation. It is thus surprising that the adoption of a written document-retention and -destruction policy and a written whistleblower policy were the two least adopted good-governance practices. Only 49 percent of public charities had a written document-retention and -destruction policy, and 42 percent had a written whistleblower policy (figure 3). Comparing these figures with Ostrower’s findings, we see a big jump in the percentage of organizations that had a written document-retention and -destruction policy: 30 percent in 2005 to 49 percent in 2010. However, there is a 10 percentage-point decrease in the number of public charities that report having a whistleblower policy: 52 percent in 2005 to 42 percent in 2010.
It seems unlikely that we’d see a decline in the number of organizations having a whistleblower policy. The decline may be largely due to the wording of the question on the 2005 survey versus the redesigned Form 990. Though Form 990 simply asks if the organization has a written whistleblower policy, Ostrower defined a whistleblower policy in her survey asking the respondents if they had “a formal process for employees to report complaints without retaliation.” This may indicate a need for the IRS to use more specific language on Form 990 itself when asking about certain policies.20
6 URBAN INSTITUTE

Figure 3. Percent of Organizations Following Recommended Governance Practices, 2010
Source: Statistics of Income Tax-Exempt File for Public Charities, 2010. Notes: “Compensation review and approval process for CEO” is limited to organizations reporting at least one employee. “Compensation review and approval process for other officers or key employees” is limited to organizations reporting at least two employees. “Audit committee” is limited to organizations using an independent accountant.
Governance Practices Vary by Organizational Characteristics Based on 2005 survey data, Ostrower found that board characteristics, organizational characteristics, and environment all affected whether or not an organization had adopted SOX-like practices (Ostrower 2007). Specifically, she found that having a corporate member on the board, having a culturally and ethnically diverse board, having women serve on the board, organization size, type of organization, sources of funding, and whether or not the CEO was a voting board member were all related to whether or not a board had adopted at least one of the six governance practices studied (Ostrower 2007).
Since 2005, however, the governance landscape has changed significantly. The IRS redesigned Form 990 in 2008 and added a new section on governance, and, more recently, charity watchdog groups like Charity Navigator have begun incorporating disclosure and governance policies into their rating systems. These developments put increased pressure on public charities to reevaluate their governance policies and practices. In this section, we examine the relationships between board composition and organizational characteristics and the adoption of good governance practices using multivariate logistic regression analysis. In most instances, we see similar relationships to what Ostrower found in 2005 (see table 1).
61.8
42.4
48.6
62.5
45.7
63.5
79.1
0
10
20
30
40
50
60
70
80
90
100
Conflict-of-interestpolicy
Whistleblowerpolicy
Document-retentionand
-destruction policy
Compensationreview and approval
process forCEO
Compensationreview andapproval
process forother officers
or keyemployees
Financialstatementscompiled,
reviewed, oraudited by
independentaccountant
Auditcommittee
Perc
ent o
f org
aniz
atio
ns
THE STATE OF NONPROFIT GOVERNANCE 7

Table 1. Board and Organizational Characteristics Associated with Good Governance Practices, 2010
Conflict-of-interest policy
Whistleblower policy
Document retention and destruction
policy
Compensation review and approval
process for CEO
Compensation review and approval
process for other officers
or key employees
Independent accountant
compiles, reviews, or audits financial
statements Audit
committee
Organization size + + + + + + +
Type of organization
Arts - - - - - - -
Education - - - + -
Environment + - - - - - -
Health + + + + + + +
Human services - - - + - +
International + + + +
Received government grants + + + + + + +
Board size - - + - +
Board independence + + + + + + +
Age + + + + + + +
Source: IRS Statistics of Income sample files, 2010. Notes: + represents a significant positive relationship at 0.05 level or below; – represents a significant negative relationship at a 0.05 level or below. Full logistic regression results can be found in table A.4. “Compensation review and approval process for CEO” is limited to organizations reporting at least one employee. “Compensation review and approval process for other officers or key employees” is limited to organizations reporting at least two employees. “Audit committee” is limited to organizations using an independent accountant.
8 URBAN INSTITUTE

Larger Organizations More Likely to Have Adopted Good Governance Practices The governance practices of small charities and large charities varied greatly. Larger organizations were much more likely to follow each of the good governance practices examined. If we look at organizations with $10 million or more in annual expenses, more than 90 percent of organizations had a conflict-of-interest policy, an independent audit, an audit committee, or a compensation review and approval process for the chief executive. Eighty-eight percent had a whistleblower policy or a document retention policy, and 78 percent had a compensation review and approval process for key employees other than the chief executive (table 2).
On the other hand, organizations with less than $250,000 in annual expenses showed much lower adoption rates of these governance practices. Only 40 percent had an independent accountant compile, review, or audit their financial statements, 39 percent had a conflict-of-interest policy, 33 percent had a compensation review and approval process for the chief executive, 26 percent had a document-retention and -destruction policy, 20 percent had a compensation process for other key employees, and 19 percent had a whistleblower policy.
Logistic regression confirmed that organization size was positively related to the adoption of all seven governance practices study and holds when controlling for other factors such as age and type of organization (table 1).
Health Care Organizations Are More Likely to Have Adopted These Practices; Arts Organization Less Likely When comparing governance practices by type of organization, health care organizations ranked as one of the highest in terms of proportion following each practice, and arts organizations consistently ranked at the bottom. More than two-thirds of health care organizations had a conflict-of-interest policy; a document retention policy; a compensation process for the chief executive; or had an independent accountant compile, review, or audit their financial statements (table 3).
Arts organizations, on the other hand, had the lowest percentage of organizations following each of the good governance practices, with the exception of having an independent accountant compile, review, or audit financial statements, where it ranked 5th. Less than one-third of arts organizations had a whistleblower policy or a document retention and destruction policy, only 34 percent had a compensation review and approval process for other key employees, and, less than half of arts organizations had a conflict-of-interest policy.
As displayed in table 1, even when we control for other factors, health organizations were more likely to have adopted all of the practices and arts organizations were less likely. We also see positive relationships between other types of organizations and a few of the governance practices. For instance, environment and international organizations were more likely to have a conflict-of-interest policy. International charities were also more likely to have a whistleblower policy and an audit committee. Education, human services, and international organizations were all positively associated with having a compensation review and approval process for the chief executive. Human services organizations were also more likely to have an independent accountant compile, review, or audit their financial statements.
THE STATE OF NONPROFIT GOVERNANCE 9

Table 2. Percent of Organizations with Good Governance Practices by Organization Size, 2010
Organization size (total expenses)
Conflict-of-interest
policy Whistleblower
policy
Document-retention and -
destruction policy
Compensation review and approval
process for CEO
Compensation review and approval process
for other officers or key employees
Independent accountant compiles,
reviews, or audits financial statements
Audit committee
< $250,000 38.8 18.9 26.3 33.3 20.4 39.9 64.9
$250,000–$500,000 49.3 29.3 35.1 49.3 31.0 51.4 73.4
$500,000– $1 million 68.5 43.3 52.9 62.8 40.7 68.3 74.4
$1 million– $5 million 81.0 61.4 67.4 76.0 53.1 85.5 84.7
$5 million– $10 million 91.9 78.4 80.2 86.6 71.1 93.3 91.5
> $10 million 97.4 88.0 88.1 91.0 77.5 96.4 94.2
Source: IRS Statistics of Income sample files, 2010. Notes: “Compensation review and approval process for CEO” is limited to organizations reporting at least one employee. “Compensation review and approval process for other officers or key employees” is limited to organizations reporting at least two employees. “Audit committee” is limited to organizations using an independent accountant.
10 URBAN INSTITUTE

Table 3. Percent of Organizations with Good Governance Practices by Type of Organization
Organization type
Conflict-of-interest policy
Whistleblower policy
Document-retention and -
destruction policy
Compensation review and approval
process for CEO
Compensation review and approval process for other
officers or key employees
Independent accountant compiles,
reviews, or audits financial statements
Audit committee
Arts 47.1 30.6 32.3 53.3 34.0 56.8 75.3
Education 60.8 41.7 46.5 62.2 44.6 62.5 77.2
Environment 63.4 35.7 41.5 54.9 43.1 52.0 76.7
Health care 79.6 65.4 69.9 74.8 58.2 76.3 87.6
Human services 60.1 39.9 47.1 62.2 44.7 64.5 77.6
International 72.8 51.2 60.8 75.4 51.5 59.3 89.8
Other 58.7 36.1 45.6 55.9 42.0 55.9 77.3
Source: IRS Statistics of Income sample files, 2010. Notes: “Compensation review and approval process for CEO” is limited to organizations reporting at least one employee. “Compensation review and approval process for other officers or key employees” is limited to organizations reporting at least two employees. “Audit committee” is limited to organizations using an independent accountant.
THE STATE OF NONPROFIT GOVERNANCE 11
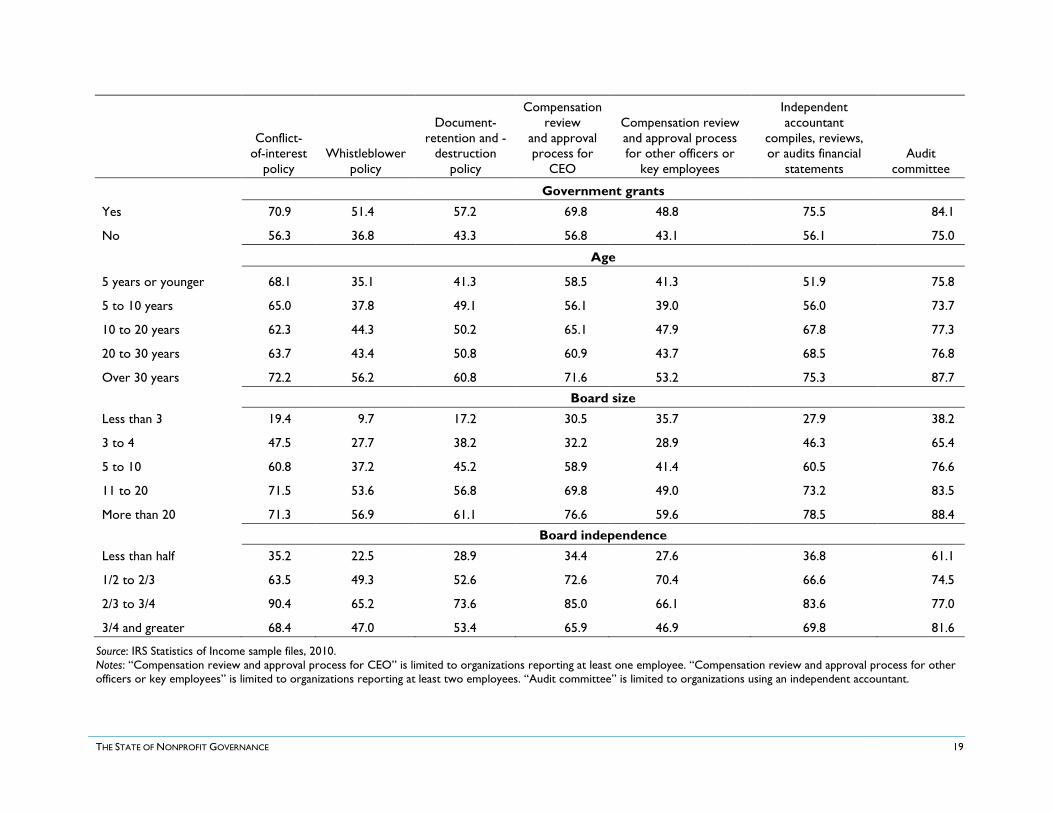
Organizations Receiving Government Grants More Likely to Have Good Governance Practices in Place Organizations receiving government grants were more likely to follow these good governance practices. Seventy-six percent of organizations that receive government grants had an independent auditor compile, review, or audit their financial statements; 71 percent had a written conflict-of-interest policy; 70 percent had a compensation review process for the chief executive; 57 percent had a document-retention and -destruction policy, 51 percent had a whistleblower policy; and 49 percent had a compensation process for key employees other than the chief executive.
When we compare governance practices of those that received government grants versus those that did not, the differences are quite significant. Nineteen percent more government-grants organizations had an independent auditor compile, review, or audit their financial statements; 15 percent more had a conflict-of-interest policy and whistleblower policy; 14 percent more had a document-retention and -destruction policy; 13 percent more had a compensation review process for the chief executive; 9 percent more had an audit committee; and 6 percent more had a compensation review and approval process for key employees other than the chief executive when compared with organizations with no government grants (table A.3). Organizations receiving government grants (local, state, or federal) most likely have to follow at least some of the practices as a condition of their funding.
Board Size Negatively Related to Some Good Governance Practices Though it may seem that as board size increases so do the adoption rates of good governance practices (table A.3), once we control for other factors such as organization size, organization type, and whether or not an organization received government grants, we actually see a negative relationship between board size and some of the practices (table 1). Organizations with larger boards were less likely to have a conflict-of-interest policy, a whistleblower policy, and a compensation review and approval process for the chief executive. However, these organizations were more likely to have a document-retention and -destruction policy and an audit committee.
In 2005, Ostrower found that organizations with larger boards were more likely to have had an audit in the past two years, have an audit committee, and have a written conflict-of-interest policy. We are not sure why we are seeing different results than Ostrower or why board size might be negatively related to some of the good governance practices. A possible explanation could be increased attention and guidance in determining board size issued by the Senate Finance Committee in 2004 (a year before Ostrower’s 2005 survey), which suggested a maximum board size of 15 members, and the Panel on the Nonprofit Sector (convened by Independent Sector) in 2007, which issued some guiding principle to consider when determining board size.21 Though there is no limit to the number of board members an organization may have, organizations with large boards seeking to improve their governance structure may have reduced the size of their boards since Ostrower’s 2005 study.
Board Independence Positively Related to All Good Governance Practices Board independence, measured as the ratio of independent board members to total board members, was positively related to the adoption of each governance practice (table 1). Seventy percent of organizations with at least two-thirds independent board members had an independent accountant compile, review, or audit their financial statements; 69 percent had a written conflict-of-interest policy; 66 percent had a compensation review and approval process for the chief executive; 54 percent had a document-retention and -destruction policy; and 47 percent had a whistleblower policy and a compensation review and approval process for key employees other than the chief executive (figure 4).
If we compare organizations that had at least two-thirds independent board members with organizations that had less than two-thirds independent members, we see drastic differences in governance practices (see figure 4). Twenty-nine percent more organizations with at least two-thirds
12 URBAN INSTITUTE

independent members had a conflict-of-interest policy; 28 percent more had an independent accountant compile, review, or audit their financial statements; 24 percent more had a compensation review and approval process for the chief executive; 21 percent more had a document-retention and -destruction policy and a whistleblower policy; 17 percent more had an audit committee; and 9 percent more had a compensation process for key employees other than the chief executive. In fact, as seen in table 1, board independence was positively associated with each of these good governance practices even after controlling for the size of the board, the size of the organization (measured by total expenses), organization type, whether it received government grants or not, and the age of the organization.
Figure 4. Percent of Organizations with Good Governance Practices by Board Independence, 2010
Source: IRS Statistics of Income sample files, 2010. Notes: “Compensation review and approval process for CEO” is limited to organizations reporting at least one employee. “Compensation review and approval process for other officers or key employees” is limited to organizations reporting at least two employees. “Audit committee” is limited to organizations using an independent accountant.
Older Organizations More Likely to Follow Good Governance Practices Though the differences between age groups are not as pronounced as the differences between sizes or even between types of organizations, once we control for other factors, age was positively associated with each of the seven governance practices. If we compare the organizations that have been operating more than 30 years with those that are only five years old, we see only a 4 percent difference in the proportion of organizations with conflict-of-interest polices: 68 percent of organizations five years old or younger compared with 72 percent of organizations over 30 years old. However, older organizations have much higher adoption rates on the other practices. Seventy-five percent of organizations 30 years old and older had an independent accountant compile, review, or audit their financial statements; 72 percent had a
39.6
26.6 32.6
42.2 37.6
41.4
64.5 68.5
47.2 53.5
66.1
47.1
69.9
81.5
0
10
20
30
40
50
60
70
80
90
100
Conflict-of-interestpolicy
Whistleblowerpolicy
Document-retention and
-destruction policy
Compensationreview
and approvalprocess for
CEO
Compensationreview and approvalprocess for other
officers or keyemployees
Independentaudit
Auditcommittee
Per
cent
Less than 2/3 independent At least 2/3 independent
THE STATE OF NONPROFIT GOVERNANCE

compensation review and approval process for their chief executive; 61 percent had a document-retention and -destruction policy; 56 percent had a whistleblower policy; and 53 percent had a compensation review and approval process for key employees other than the chief executive. If we compare these adoption rates with adoption rates of organizations that are 5 years old or younger, at least 20 percent more organizations over 30 years old had a whistleblower policy; had a document-retention and -destruction policy; and had an independent accountant compile, review, or audit their financial statements than those five years old or younger.
Discussion The adoption of good governance practices is certainly on the rise. If we compare Ostrower’s 2005 findings to our findings, we see increases in the percentage of organizations adopting many of the good governance practices recommended by the IRS. The percentage of public charities with audit committees increased 30 percentage points, up from 20 percent in 2005. We also see an increase from 2005 to 2010 in the percentage of organizations with document-retention and -destruction policies and those with conflict-of-interest policies. Though we don’t have comparable information from 2005, we see high adoption rates for other IRS-recommended practices. In 2010, more than 60 percent of organizations had a compensation review and approval process for chief executives and 46 percent of organizations had a similar process for other key employees.
With such large increases in the percentage of organizations following these practices, it certainly seems that the addition to the Form 990 of Part VI (Governance, Management and Disclosure), described by former IRS Commissioner Steven Miller as the “crown jewel” of the IRS governance initiative, has influenced the governance practices of public charities for the better.22 The number of nonprofits adopting these practices will likely continue to rise as charity watchdog groups, such as Charity Navigator, begin incorporating organizational governance practices in their ratings systems.
Noting that “poor governance leads to wasted assets, inefficient use of assets, and loss of public trust in the sector,”23 the IRS governance initiative seeks to improve nonprofit governance and therefore create a more effective nonprofit sector. Does the required disclosure of certain governance practices lead to better nonprofit governance, though? Is it a pathway to reflective evaluation of governance practices for nonprofits or another way to gain legitimacy in the eyes of government and potential donors? Could there be unintended negative consequences for public charities?
In 2006, Nezhina and Brudney conducted a national survey of nonprofit organizations that asked about SOX adoption and possible benefits and costs associated with adoption. They found that organizations adopting SOX practices cited better financial controls, reduced risk of accounting fraud, and a more effective board as benefits of SOX adoption (Nezhina and Brudney 2012). Increased fees for an external audit, longer and more frequent audit committee meetings, reallocation of resources from program to administrative expenses, and increased expenses for CEO and board training were the primary costs associated with SOX adoption (Nezhina and Brudney 2012). Only 35 percent of the organizations surveyed, though, had voluntarily adopted any of the SOX practices. It would be interesting to replicate this study in the current environment, in which the IRS has significantly raised visibility through required disclosure of certain governance practices, to see if similar costs and benefits are found.
Though the percentage of organizations following these best practices is encouraging for the sector, our results raise several questions. Why are smaller public charities and arts organizations less likely to adopt these practices? Are there costs associated with adoption that make it more difficult for smaller organizations? Is there some unique characteristic of arts organizations or their governance structures that makes it difficult or undesirable for them to adopt these practices? And, most important, does the required disclosure of these practices lead to a better-governed nonprofit sector and therefore a more effective sector as the IRS intended? Unfortunately, we cannot answer these questions by looking only at Form 990 data. The IRS governance initiative may very well be creating a more effective culture of governance in the nonprofit sector, but without a more in-depth look at the costs and benefits of adoption of these practices as well as how these policies and practices are carried out at the organizational level, we simply don’t know.
14 URBAN INSTITUTE

Appendix A. Additional Tables
Table A.1. Board Size by Organizational Characteristics, 2010 (Percent Distribution)
Fewer than 3
members 3–4
members 5–10
members 11–20
members
20 or more
members Total
Average board size
Median board size
All 2.9 11.5 40.6 32.7 12.3 100.0 14.5 9
Organization size (total expenses)
< $250,000 5.2 15.9 43.8 26.6 8.5 100.0 19.9 7
$250,000–$500,000 3.7 14.4 46.4 26.3 9.2 100.0 13.8 8
$500,000– $1 million 2.7 8.7 40.7 37.3 10.5 100.0 12.3 10
$1 million– $5 million 0.8 8.3 38.6 38.4 13.9 100.0 13.1 11
$5 million–$10 million 0.1 7.3 34.5 37.4 20.8 100.0 17.0 12
> $10 million 0.1 4.5 23.8 44.3 27.4 100.0 18.2 15
Organization type Arts 3.5 7.9 33.0 34.9 20.7 100.0 16.9 12
Education 2.6 12.4 40.9 31.2 12.9 100.0 14.4 9
Higher education 0.0 2.4 14.1 30.1 53.4 100.0 22.4 21
Education other 2.9 13.3 43.2 31.3 9.3 100.0 13.7 9
Environment 0.3 12.8 38.2 36.2 12.5 100.0 20.4 10
Health 1.3 8.1 42.8 38.1 9.6 100.0 14.8 10
Hospitals 1.5 2.4 34.6 51.1 10.4 100.0 14.6 13
Health care other 1.3 9.0 44.0 36.2 9.5 100.0 14.8 10
Human services 2.5 11.4 43.4 31.9 10.9 100.0 13.1 9
International 5.4 9.9 39.1 38.1 7.6 100.0 10.3 8
Other 6.7 17.5 34.9 27.5 13.5 100.0 16.0 9
Primary revenue sourcea
Diversified 1.5 9.2 36.9 35.8 16.5 100.0 16.8 11
Government grants 0.8 11.6 47.3 29.4 10.8 100.0 11.5 9
Private contributions 4.9 13.3 37.0 33.8 11.0 100.0 15.0 10
THE STATE OF NONPROFIT GOVERNANCE 15

Fewer than 3
members 3–4
members 5–10
members 11–20
members
20 or more
members Total
Average board size
Median board size
Program service revenue 3.4 12.2 43.9 30.3 10.1 100.0 13.3 9
Age
5 years or younger 3.6 16.5 55.1 22.2 2.5 100.0 8.0 7
5 to 10 years 3.7 11.9 52.8 26.1 5.5 100.0 9.7 7
10 to 20 years 2.1 13.9 46.0 31.8 6.3 100.0 12.1 9
20 to 30 years 3.8 10.9 39.6 33.9 11.8 100.0 19.3 10
Over 30 years 0.5 4.4 30.5 41.3 23.3 100.0 17.1 13
Source: IRS Statistics of Income sample files, 2010. a At least two-thirds of revenue is from a single type—government grants, private contributions, or program service revenue.
Table A.2. Board Independence by Organizational Characteristics, 2010 (Percent Distribution)
Less than half
One-half to two-thirds
Two-thirds to three-quarters
Three-quarters and greater Total
All boards 14.5 2.6 0.7 82.2 100.0
Organization size (total expenses)
Less than $250,000 24.2 2.0 0.3 73.5 100.0
$250,000 to $500,000 15.4 2.2 0.1 82.3 100.0
$500,000 to $1 million 10.2 2.8 0.2 86.8 100.0
$1 million to $5 million 8.3 3.0 1.1 87.6 100.0
$5 million to $10 million 7.6 2.4 0.8 89.2 100.0
$10 million and greater 6.6 4.9 3.0 85.5 100.0
Organization type
Arts 11.6 1.8 0.1 86.5 100.0
Education 18.2 3.2 0.7 77.9 100.0
Higher education 3.9 6.1 1.2 88.8 100.0
Education other 19.6 2.9 0.6 76.9 100.0
Environment 14.2 0.4 0.6 84.8 100.0
16 URBAN INSTITUTE

Less than half
One-half to two-thirds
Two-thirds to three-quarters
Three-quarters and greater Total
Health 11.8 4.3 2.1 81.8 100.0
Hospitals 6.1 13.1 7.2 73.6 100.0
Health care other 12.7 2.9 1.3 83.1 100.0
Human services 13.8 2.0 0.4 83.7 100.0
International 11.2 0.5 1.4 86.9 100.0
Other 18.6 4.1 0.5 76.8 100.0
Primary revenue sourcea
Diversified 14.4 1.9 0.1 83.6 100.0
Government grants 10.5 1.3 0.8 87.5 100.0 Private contributions 16.4 1.7 0.9 81.0 100.0 Program service revenue 14.5 4.4 1.0 80.1 100.0
Age
5 years or younger 19.8 2.2 0.7 77.2 100.0
5 to 10 years 17.0 3.8 0.4 78.8 100.0
10 to 20 years 11.6 4.2 1.3 82.9 100.0
20 to 30 years 9.6 3.2 0.4 86.8 100.0
Over 30 years 8.6 1.6 0.7 89.1 100.0
Source: IRS Statistics of Income sample files, 2010. a At least two-thirds of revenue is from a single type—government grants, private contributions, or program service revenue.
THE STATE OF NONPROFIT GOVERNANCE 17

Table A.3. Percent of Organizations with Good Governance Practices by Board and Organizational Characteristics
Conflict-of-interest
policy Whistleblower
policy
Document-retention and -
destruction policy
Compensation review
and approval process for
CEO
Compensation review and approval process for other officers or
key employees
Independent accountant
compiles, reviews, or audits financial
statements Audit
committee
All 61.8 42.4 48.6 62.5 45.7 63.5 79.1
Organization size (total expenses)
Less than $250,000 38.8 18.9 26.3 33.3 20.4 39.9 64.9
$250,000 to $500,000 49.3 29.3 35.1 49.3 31.0 51.4 73.4
$500,000 to $1 million 68.5 43.3 52.9 62.8 40.7 68.3 74.4
$1 million to $5 million 81.0 61.4 67.4 76.0 53.1 85.5 84.7
$5 million to $10 million 91.9 78.4 80.2 86.6 71.1 93.3 91.5
$10 million and greater 97.4 88.0 88.1 91.0 77.5 96.4 94.2
Organization type
Arts 47.1 30.6 32.3 53.3 34.0 56.8 75.3
Education 60.8 41.7 46.5 62.2 44.6 62.5 77.2
Environment 63.4 35.7 41.5 54.9 43.1 52.0 76.7
Health 79.6 65.4 69.9 74.8 58.2 76.3 87.6
Human services 60.1 39.9 47.1 62.2 44.7 64.5 77.6
International 72.8 51.2 60.8 75.4 51.5 59.3 89.8
Other 58.7 36.1 45.6 55.9 42.0 55.9 77.3
18 URBAN INSTITUTE
Conflict-of-interest
policy Whistleblower
policy
Document-retention and -
destruction policy
Compensation review
and approval process for
CEO
Compensation review and approval process for other officers or
key employees
Independent accountant
compiles, reviews, or audits financial
statements Audit
committee
Government grants
Yes 70.9 51.4 57.2 69.8 48.8 75.5 84.1
No 56.3 36.8 43.3 56.8 43.1 56.1 75.0
Age
5 years or younger 68.1 35.1 41.3 58.5 41.3 51.9 75.8
5 to 10 years 65.0 37.8 49.1 56.1 39.0 56.0 73.7
10 to 20 years 62.3 44.3 50.2 65.1 47.9 67.8 77.3
20 to 30 years 63.7 43.4 50.8 60.9 43.7 68.5 76.8
Over 30 years 72.2 56.2 60.8 71.6 53.2 75.3 87.7
Board size
Less than 3 19.4 9.7 17.2 30.5 35.7 27.9 38.2
3 to 4 47.5 27.7 38.2 32.2 28.9 46.3 65.4
5 to 10 60.8 37.2 45.2 58.9 41.4 60.5 76.6
11 to 20 71.5 53.6 56.8 69.8 49.0 73.2 83.5
More than 20 71.3 56.9 61.1 76.6 59.6 78.5 88.4
Board independence
Less than half 35.2 22.5 28.9 34.4 27.6 36.8 61.1
1/2 to 2/3 63.5 49.3 52.6 72.6 70.4 66.6 74.5
2/3 to 3/4 90.4 65.2 73.6 85.0 66.1 83.6 77.0
3/4 and greater 68.4 47.0 53.4 65.9 46.9 69.8 81.6
Source: IRS Statistics of Income sample files, 2010. Notes: “Compensation review and approval process for CEO” is limited to organizations reporting at least one employee. “Compensation review and approval process for other officers or key employees” is limited to organizations reporting at least two employees. “Audit committee” is limited to organizations using an independent accountant.
THE STATE OF NONPROFIT GOVERNANCE 19

Table A.4. Logistic Regression Results
Conflict-of-interest policy
Whistleblower policy
Document-retention and -
destruction policy
Compensation review
and approval process for
CEO
Compensation review and approval process for other
officers or key employees
Independent accountant
compiles, reviews, or audits financial
statements Audit committee
C S C S C S C S C S C S C S
Intercept -0.3562*** 0.0240 -1.3279*** 0.0242 -0.8813*** 0.0231 -0.8096*** 0.0299 -0.7979*** 0.0319 -0.8545*** 0.0240 -0.2105*** 0.0350
Total expenses 0.0000*** 0.0000 0.0000*** 0.0000 0.0000*** 0.0000 0.0000*** 0.0000 0.0000*** 0.0000 0.0000*** 0.0000 0.0000*** 0.0000
Government grants 0.4758*** 0.0135 0.3989*** 0.0122 0.4336*** 0.0120 0.4426*** 0.0146 0.1232*** 0.0140 0.6764*** 0.0137 0.4930*** 0.0183
Arts -0.9265*** 0.0261 -0.5395*** 0.0256 -0.9269*** 0.0253 -0.4829*** 0.0296 -0.5995*** 0.0314 -0.2603*** 0.0260 -0.3197*** 0.0377
Education -0.3902*** 0.0247 -0.0753*** 0.0230 -0.1133*** 0.0224 0.1853*** 0.0275 -0.1452*** 0.0274 -0.0154 0.0244 -0.0649 0.0343
Environment 0.1332*** 0.0348 -0.1619*** 0.0317 -0.2326*** 0.0310 -0.1802*** 0.0367 -0.0755* 0.0371 -0.3162*** 0.0324 -0.1548** 0.0487
Health 0.2690*** 0.0270 0.6625*** 0.0232 0.6834*** 0.0232 0.3774*** 0.0282 0.0945*** 0.0270 0.1918*** 0.0254 0.4448*** 0.0364
Human services -0.3803*** 0.0202 -0.1348*** 0.0188 -0.1115*** 0.0184 0.0707** 0.0229 -0.0547* 0.0233 0.1287*** 0.0197 -0.0467 0.0281
International 0.6686*** 0.0579 0.1093* 0.0470 -0.0576 0.0456 0.4312*** 0.0609 -0.0805 0.0607 -0.0308 0.0491 1.2512*** 0.1016
Board size -0.0032*** 0.0002 -0.0010*** 0.0002 0.0012*** 0.0002 -0.0007*** 0.0002 -0.0002 0.0002 -0.0002 0.0001 0.0043*** 0.0006
Board independence 0.0102*** 0.0002 0.0076*** 0.0002 0.0074*** 0.0002 0.0103*** 0.0002 0.0054*** 0.0003 0.0094*** 0.0002 0.0115*** 0.0003
Age 0.0023*** 0.0003 0.0099*** 0.0003 0.0078*** 0.0002 0.0051*** 0.0003 0.0036*** 0.0003 0.0088*** 0.0003 0.0079*** 0.0004
Source: IRS Statistics of Income sample files, 2010. Notes: C is coefficient. S is standard error. “Compensation review and approval process for CEO” is limited to organizations reporting at least one employee. “Compensation review and approval process for other officers or key employees” is limited to organizations reporting at least two employees. “Audit committee” is limited to organizations using an independent accountant. * p ≤ 0.05 ** p ≤ 0.01 *** p ≤ 0.001
20 URBAN INSTITUTE

Notes 1 Joe Stephens and Mary Pat Flaherty. “Inside the Hidden World of Thefts, Scams and Phantom Purchases at the Nation’s Nonprofits,” Washington Post, October 27, 2013. 2 Defined as all public charities in the National Center for Charitable Statistics core files (including all public charities and other exempt organizations) filing a Form 990 from 2008 until 2011 (the latest year of data available). 3 Only two SOX provisions apply to both for-profit and nonprofit organizations. SOX prohibits nonprofits from retaliating against whistleblowers and it prohibits the destruction of certain documents by nonprofits. 4 For the Senate Finance Committee’s proposals for reforms and best practices for tax-exempt organizations, see Senate Finance Committee, “Staff Discussion Draft,” accessed August 11, 2014, http://www.finance.senate.gov/imo/media/doc/062204stfdis.pdf. 5 To date, only two states have passed comprehensive nonprofit governance reform legislation. In 2004, California passed the Nonprofit Integrity Act, which mandates audits, audit committees, and compensation review for chief executives. New York also passed legislation that mandates conflict of interest policies, whistleblower policies, and a compensation review of the chief executive, which went into effect in 2014. Additionally, 26 states require nonprofits to submit a copy of an independent audit review if it meets specific financial thresholds, and a handful state that boards must have a majority of independent board members. 6 Good Governance Practices for 501(c)(3) Organizations is no longer available on the IRS website. Instead, the IRS directs organizations to the redesigned Form 990 to see IRS current position on governance practices. See Internal Revenue Service, “Governance of Charitable Organizations and Related Topics,” last modified November 6, 2012, http://www.irs.gov/Charities-&-Non-Profits/Governance-of-Charitable-Organizations-and-Related-Topics. 7 In 2008, organizations with gross receipts over $1 million were required to file a Form 990. In 2009, organizations with gross receipts over $500,000 were required to file a Form 990. For 2010 and after, organizations with $200,000 or more in gross receipts are required to file the Form 990. 8 See Part VI of the Form 990 (2008 and later). Though not all SOX practices relevant to the nonprofit sector are asked about on the redesigned Form 990, most of the questions are related to SOX requirements including conflict-of-interest policies, whistleblower policies, document-retention and -destruction policies, audits, audit committees, and board member independence. See Nezhina and Brudney (2012). 9 In practice, organizations with very large boards can still govern themselves effectively by organizing a system of committees. 10 See Independent Sector, “Principle 10: Board Size and Structure,” accessed August 11, 2014, http://www.independentsector.org/board_size_structure_principle_10. 11 We divide revenue sources into four types: government grants, private contributions, program service revenue, and diversified revenue. If two-thirds or more of an organization’s revenue comes from government grants, private contributions, or program service revenue, then it is classified into one of these three categories. If there is no primary funding type (does not meet the two-thirds threshold), the organization is classified as having a diverse revenue stream. 12North Dakota, Maine, California and Vermont all mandate that no more than 49 percent of board members can be financially interested. New Hampshire requires that five members of the board not be related. See Panel on the Nonprofit Sector (2007, 24). 13 For audit requirements of organizations received federal awards see, White House Office of Management and Budget, “OMB Circular A-133,” accessed August 17, 2014, http://www.whitehouse.gov/sites/default/files/omb/assets/omb/circulars/a133/a133.pdf. 14 For a complete list of states and requirements, see National Council of Nonprofits, “State Law Nonprofit Audit Requirements,” accessed August 11, 2014, http://www.councilofnonprofits.org/nonprofit-audit-guide/state-law-audit-requirements. 15 This is for all public charities filing a Form 990 in 2010. The earlier percentage (79) was for organizations that reported having an independent accountant compile, review, or audit their financial statements for tax year. 16 Treas. Reg. § 53.4958-6(a). See also Form 990 Instructions (page 23), accessed August 15, 2014, http://www.irs.gov/pub/irs-prior/i990--2012.pdf. 17 Analysis limited to organizations reporting at least 1 employee on line 5 of summary. 18 Analysis limited to organizations reporting at least 2 employees on line 5 of summary. 19 Committee on Nonprofit Corporations. “Model Nonprofit Corporation Act § 8.60, Third Edition” (model legislation, American Bar Association, 2008). 20 Though not on Form 990 itself, definitions of all terms on the governance section of the form, including a detailed definition of a whistleblower policy, are included in Form 990 instructions. 21 For the Senate Finance Committee’s proposals for reforms and best practices for tax-exempt organizations, see Senate Finance Committee, “Staff Discussion Draft,” accessed August 11, 2014. See also Independent Sector, “Principle 10: Board Size and Structure,” accessed August 11, 2014, http://www.independentsector.org/board_size_structure_principle_10.
THE STATE OF NONPROFIT GOVERNANCE 21

22 Steven T. Miller, “Remarks of Steven T. Miller, Commissioner, Tax Exempt and Government Entities, Internal Revenue Service” (speech, Georgetown Seminar Exempt Organizations Panel on Nonprofit Governance, April 23, 2008). http://www.irs.gov/pub/irs-tege/gulc_governance_speech_042308.pdf. 23 Ibid.
References Callen, Jeffrey L., April Klein, and Daniel Tinkelman. 2003. “Board Composition, Committees, and
Organizational Efficiency: The Case of Nonprofits.” Nonprofit and Voluntary Sector Quarterly, 32 (4): 493–520.
Hopkins, Bruce R., and Virginia C. Gross. 2009. Nonprofit Governance: Law, Practices and Trends. Hoboken, NJ: Wiley & Sons.
Nezhina, Tamara G., and Jeffrey L. Brudney. 2012. “Unintended? The Effects of Adoption of the Sarbanes-Oxley Act on Nonprofit Organizations.” Nonprofit Management & Leadership, 22 (3).
Ostrower, Francie. 2007. Nonprofit Governance in the United States: Findings on Performance and Accountability from the First National Representative Study. Washington, DC: Urban Institute.
Preston, Jennifer Bright, and William A. Brown. 2005. “Commitment and Performance of Nonprofit Board Members.” Nonprofit Management and Leadership, 15 (2): 221–38.
Renz, David O, ed. 2010. The Jossey-Bass Handbook of Nonprofit Leadership & Management. 3rd ed. San Francisco: Jossey-Bass.
Siciliano, Julie I. 1996. “The Relationship of Board Member Diversity to Organizational Performance.” Journal of Business Ethics, 15 (12): 1313–20.
22 URBAN INSTITUTE