Embed Size (px)
Citation preview
THE STATE OF MOBILE VOICE APP EXPERIENCE October 2019
Authors Peter Boyland, Senior Analyst Hardik Khatri, Technical Analyst
Opensignal active userbase:
Opensignal is the independent global standard for analyzing consumer mobile
experience. Our industry reports are the definitive guide to understanding
the true experience consumers receive on wireless networks.
Total Devices
Total Measurements
Data Collection Period
23,822,550 57,564,535,468 Jun 1 – Aug 30, 2019

2
Mobile Network Experience Report The State of Mobile Voice App Experience
Our Metrics
Key FindingsVoice apps are changing the way we
communicate.
The insatiable growth in smartphone use along
with the increasing ubiquity of data
connections means that apps such as
WhatsApp, Skype and Facebook Messenger are
offering an entirely new platform for users to
talk to each other.
Europe dominates Opensignal’s new measure
of mobile Voice App Experience.
Of the 19 countries who achieved a Good
rating (80 to 87), only six were from outside
Europe. And all of these six were relatively
highly developed Asian markets, including
Singapore, South Korea and Taiwan.
It is difficult to have a decent Voice App
Experience using 3G networks — but it's not
impossible.
Nine countries had a difference of less than 5
points between their 3G and 4G Voice App
Experience scores, with all ranking Acceptable
for 3G. And many of these were highly mature
markets, including Germany, Hong Kong,
Singapore and Switzerland — an indicator of
what the mobile network experience will be in
the future for markets where 4G Availability is
rising and is replacing 3G.
3G-only Voice App Experience scores were
much lower than 4G scores in every country.
Over a third of the countries we analyzed
ranked as Good or above for 4G Voice App
Experience — over 50% more countries than
rated Good for overall Voice App Experience.
But most of these countries gained Acceptable
3G ratings. At the other end of the table, all the
countries that ranked Poor or below for 4G
Voice App Experience rated Very Poor or lower
for 3G.
There is a clear voice experience divide
between mature markets and developing
countries.
Nearly two-thirds of Latin American countries,
along with the vast majority of African and
Middle Eastern markets, rated Poor or below.
But all the European markets we analyzed,
along with the U.S. and Canada, ranked as
Acceptable or above for Voice App Experience.
In over two-thirds of the countries we analyzed
users experienced a ranking of Poor or below in
3G Voice App Experience.
This highlights the importance of 4G
Availability to enjoying a decent Voice App
Experience.
There were a few interesting anomalies to the
3G/4G pattern.
Indonesian users were the only ones to
experience a Poor rating on both network
types, while Hong Kong's users had the closest
Voice App Experience, with just 1.4 points
separating the 3G and 4G scores.
Voice App Experience is calculated on a scale
from 0 to 100:
95-100 Excellent – Most users are very satisfied.
87-95 Very Good – Most users are satisfied.
80-87 Good – Many users are satisfied.
74-80 Acceptable – Users are satisfied.
66-74 Poor – Many users dissatisfied.
60-66 Very Poor – Most users dissatisfied.
45-60 Unintelligible – Nearly all users dissatisfied.
0-45 Impossible to communicate.

3
Mobile Network Experience Report The State of Mobile Voice App Experience
Our Metrics
From phone to app, consumer communications have evolved The spread of mobile data networks is changing the way we communicate
with each other. The world of telecom was transformed when Alexander
Graham Bell made the first voice call in 1876, followed by the first cellular call
nearly a century later. For over 100 years, voice was the primary way of
communicating via telephone. But just as cellular signalled the beginning of
the decline of copper public switched telephone networks (PSTNs), so voice
apps and voice over Internet protocol (VoIP) have triggered a drop in
traditional cellular telephone calls.
Voice apps such as WhatsApp, Skype and Facebook Messenger offer an
entirely new platform for users to call each other, bypassing the traditional
cellular channels and offering a true online experience. Voice apps offer
flexibility across a number of devices and networks, and have soared in
popularity as smartphones become more and more ubiquitous. WhatsApp has
an estimated 1.6 billion users worldwide, Facebook Messenger boasts 1.3
billion, while Skype has an estimated 300 million users — including its paid-for
Business arm. But what's the mobile user experience like on these voice apps
on today's mobile networks?
As voice apps grow in popularity, their performance will contribute to a
customer’s overall satisfaction with their network provider. Despite the
importance of these apps, it's difficult to get a clear picture of the experience
customers receive when using them and it certainly can't be properly judged
from looking at just network speeds or latency tests.
Voice App Experience is a unique measure of users’ perceived experience for over-the-top (OTT) voice services In order to measure the true quality of app-based voice-over-IP (VoIP) calls,
Opensignal has begun analyzing how consumers experience these apps and
services which they use on their mobile phones. We inaugurate this
pioneering approach with an analysis of Voice App Experience. It seeks to
answer a simple but exceedingly relevant question for today’s mobile

4
Mobile Network Experience Report The State of Mobile Voice App Experience
Our Metrics
consumers: How good or bad does a call on voice apps like WhatsApp, Skype,
and Facebook Messenger render on my operator’s network?
A unique, first-of-its-kind measurement, Opensignal’s Voice App Experience
measures the quality of experience for over-the-top (OTT) voice services —
mobile voice apps such as WhatsApp, Skype, Facebook Messenger etc. —
using a model derived from the International Telecommunication Union
(ITU)-based approach for quantifying overall voice call quality with a series of
calibrated technical parameters. Other companies may be doing similar things
on a small scale (e.g. a provider tracking their own voice delivery, or small-
scale drive tests), but this is the industry’s largest, independent measure to
date, offering the greatest amount of service-agnostic, comparative data.
Read more about our methodology.
For this report, we've analyzed 80 countries from across the globe, drawn on
our active user base of over 57 billion measurements from over 23 million
Android and iOS smartphones, to see how users’ Voice App Experience
compares in different mobile markets.
Europe dominates our Good Voice App Experience rankings Of the 80 countries we analyzed for overall Voice App Experience, 19
achieved a Good rating (80 to 87) — and only six were from outside Europe.
These six included some of the usual high-flyers that appear in the top tens for
our other metrics, including Singapore, South Korea and Taiwan.
Among the European countries who gained a Good ranking in Voice App
Experience were some of the most mature mobile markets including Belgium,
the Netherlands, Denmark and Hungary. But some other smaller European
markets also achieved Good ratings, including Slovakia, Croatia and Serbia.
Interestingly, none of the "big five" European countries — France, Germany,
Italy, Spain and the U.K. — gained Good rankings, with all of these in the
Acceptable bracket (74 – 80) for Voice App Experience.

5
Mobile Network Experience Report The State of Mobile Voice App Experience
Our Metrics
The brackets represent confidence intervals. Read why confidence intervals are important.
56.1
56.561.262.1
62.6
62.963.6
63.764.8
65.867.4
68.669.5
69.6
69.870.1
70.871.071.1
71.371.471.6
72.0
72.272.572.7
73.0
73.173.573.5
73.874.2
74.5
74.874.875.0
75.2
75.3
75.476.176.9
77.077.1
77.277.2
77.778.1
78.178.378.3
78.478.4
78.578.678.878.9
79.279.479.779.9
79.980.380.4
80.480.5
80.981.281.3
81.481.4
81.581.781.781.9
82.082.082.182.2
82.482.6
0 10 20 30 40 50 60 70 80 90 100
UzbekistanLibya
KenyaCambodia
GhanaPhilippines
AlgeriaPakistan
BangladeshEcuadorNigeria
NicaraguaSri Lanka
KazakhstanColombiaMorocco
PeruEl Salvador
PanamaIndonesia
EgyptIndia
Dominican RepublicCosta Rica
South AfricaGuatemala
BoliviaParaguay
Saudi ArabiaTunisiaKuwaitMexico
ThailandMalaysia
JordanHonduras
ChileUkraine
Russian Federat ionArgent ina
United States of AmericaBrazil
BelarusFrance
MyanmarItaly
TurkeyQatar
IrelandVietnamRomania
United KingdomPuerto Rico
UruguaySpain
PolandCanada
GermanyGreece
Hong Kong (SAR China)Israel
SerbiaBulgariaCroatia
PortugalAustralia
New ZealandTaiwan
JapanSouth Korea
SwedenAustria
SingaporeSwitzerland
HungaryFinland
SlovakiaDenmark
NetherlandsBelgium
Voice App Experience scores by count ry and geography
6
Mobile Network Experience Report The State of Mobile Voice App Experience
Our Metrics
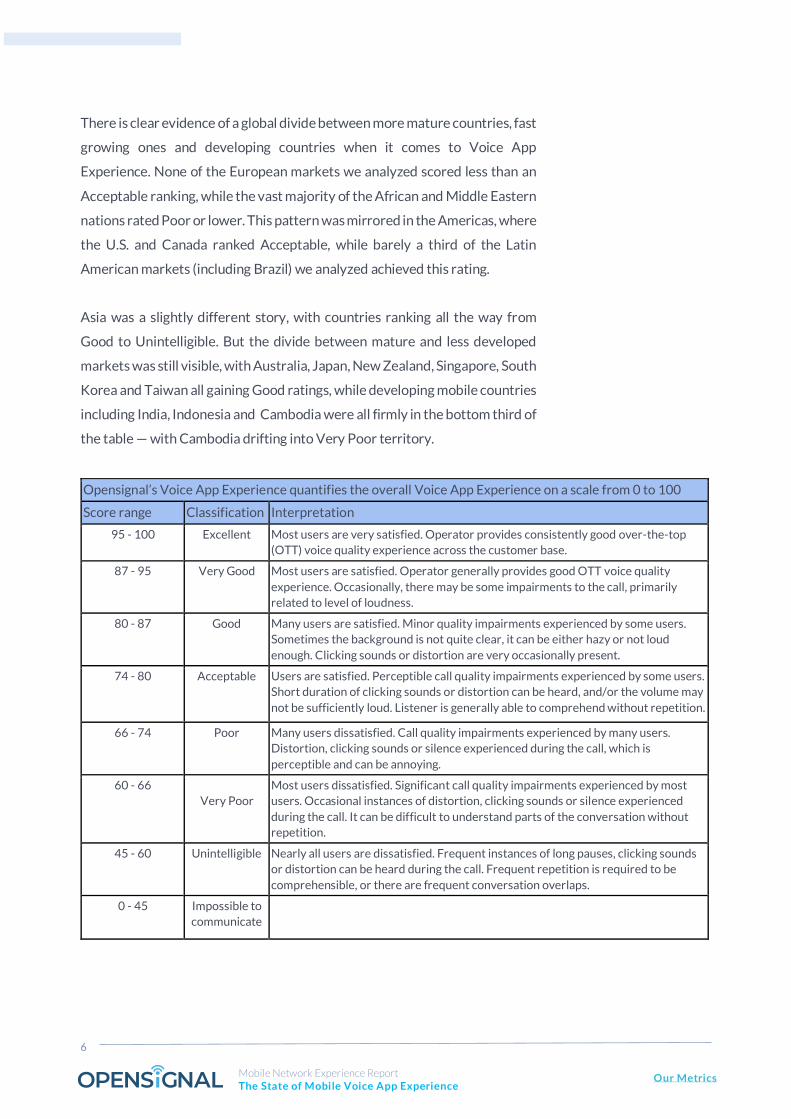
There is clear evidence of a global divide between more mature countries, fast
growing ones and developing countries when it comes to Voice App
Experience. None of the European markets we analyzed scored less than an
Acceptable ranking, while the vast majority of the African and Middle Eastern
nations rated Poor or lower. This pattern was mirrored in the Americas, where
the U.S. and Canada ranked Acceptable, while barely a third of the Latin
American markets (including Brazil) we analyzed achieved this rating.
Asia was a slightly different story, with countries ranking all the way from
Good to Unintelligible. But the divide between mature and less developed
markets was still visible, with Australia, Japan, New Zealand, Singapore, South
Korea and Taiwan all gaining Good ratings, while developing mobile countries
including India, Indonesia and Cambodia were all firmly in the bottom third of
the table — with Cambodia drifting into Very Poor territory.
Opensignal’s Voice App Experience quantifies the overall Voice App Experience on a scale from 0 to 100
Score range Classification Interpretation
95 - 100 Excellent Most users are very satisfied. Operator provides consistently good over-the-top
(OTT) voice quality experience across the customer base.
87 - 95 Very Good Most users are satisfied. Operator generally provides good OTT voice quality
experience. Occasionally, there may be some impairments to the call, primarily
related to level of loudness.
80 - 87 Good Many users are satisfied. Minor quality impairments experienced by some users.
Sometimes the background is not quite clear, it can be either hazy or not loud
enough. Clicking sounds or distortion are very occasionally present.
74 - 80 Acceptable Users are satisfied. Perceptible call quality impairments experienced by some users.
Short duration of clicking sounds or distortion can be heard, and/or the volume may
not be sufficiently loud. Listener is generally able to comprehend without repetition.
66 - 74 Poor Many users dissatisfied. Call quality impairments experienced by many users.
Distortion, clicking sounds or silence experienced during the call, which is
perceptible and can be annoying.
60 - 66
Very Poor
Most users dissatisfied. Significant call quality impairments experienced by most
users. Occasional instances of distortion, clicking sounds or silence experienced
during the call. It can be difficult to understand parts of the conversation without
repetition.
45 - 60 Unintelligible Nearly all users are dissatisfied. Frequent instances of long pauses, clicking sounds
or distortion can be heard during the call. Frequent repetition is required to be
comprehensible, or there are frequent conversation overlaps.
0 - 45 Impossible to
communicate

7
Mobile Network Experience Report The State of Mobile Voice App Experience
Our Metrics
Voice App Experience will be added to our key award metrics in all of
Opensignal's country-specific national reports going forward, alongside 4G
Availability, Video Experience, Download and Upload Speed Experience, and
Latency Experience — just like our recent Mobile Network Experience report
on Malaysia. We will also publish two supporting metrics for the overall Voice
App Experience scores: 3G and 4G Voice App Experience.
Voice App Experience on 4G networks is most often Good, whereas on 3G it is Poor When we look at the Voice App Experience by country divided between 3G
and 4G networks, we can see the variation between the user experience by
mobile technology. The 3G Voice App Experience scores are lower in every
country compared with their 4G equivalents. But the difference between
these scores is far from uniform.
Over a third of the countries we analyzed ranked as Good or above for 4G
Voice App Experience — this is 50% more markets than we saw achieving this
rating for overall Voice App Experience. By comparison, our users in only one
country, Sweden, enjoyed a 3G Voice App Experience in the Good category.
Less than 30% of the countries we analyzed secured an Acceptable ranking for
users when connected on 3G networks, while the majority (38%) rated Poor.

8
Mobile Network Experience Report The State of Mobile Voice App Experience
Our Metrics
The brackets represent confidence intervals. Read why confidence intervals are important. 63.0
65.3
65.8
67.4
68.4
69.8
71.9
72.6
72.6
72.8
73.0
73.0
73.2
73.6
73.8
74.0
74.3
74.6
75.0
75.1
75.2
75.6
75.6
76.3
76.4
76.6
76.6
76.8
77.4
77.5
77.6
77.6
77.6
77.7
77.7
77.9
78.0
78.2
78.3
78.7
78.7
79.2
79.2
79.2
79.3
79.7
79.9
80.0
80.0
80.0
80.1
80.2
80.5
80.8
80.8
80.9
81.0
81.2
81.3
81.7
81.7
81.8
81.8
81.9
81.9
82.0
82.3
82.3
82.3
82.6
82.6
82.7
82.7
82.9
82.9
83.0
83.0
83.2
83.2
83.5
52.9
54.3
56.8
53.5
59.7
60.2
53.8
59.2
62.5
66.6
60.1
59.4
61.8
63.8
64.2
64.4
62.9
64.3
60.9
66.2
67.1
67.3
64.5
66.5
66.4
70.3
66.5
67.3
66.6
66.7
68.0
64.0
66.1
71.0
65.5
69.4
61.6
64.5
69.3
76.4
69.8
73.1
73.5
71.8
74.0
70.4
70.9
78.6
75.4
76.2
71.5
66.4
73.0
70.2
75.4
72.1
73.4
74.5
70.1
80.4
74.8
74.7
76.1
65.5
74.7
71.1
72.1
78.3
78.7
78.1
76.3
74.5
79.3
75.9
76.1
75.9
75.8
76.2
75.5
75.6
100 80 60 40 20 0 20 40 60 80 100
Uzbekistan
Cambodia
Kenya
Philippines
Pakistan
Algeria
Libya
Ghana
India
Indonesia
Bangladesh
Ecuador
Kazakhstan
Peru
Nicaragua
Sri Lanka
Panama
Morocco
Colombia
Kuwait
South Africa
Paraguay
Nigeria
Saudi Arabia
Bolivia
Tunisia
Costa Rica
Thailand
Malaysia
Egypt
Chile
Dominican Republic
El Salvador
Jordan
Guatemala
Argentina
United States of America
Mexico
Russian Federation
Qatar
Honduras
Myanmar
Puerto Rico
Ukraine
United Kingdom
Italy
Brazil
Hong Kong (SAR China)
Belarus
Germany
Spain
France
Uruguay
Canada
Greece
Romania
Turkey
Vietnam
Poland
Sweden
South Korea
Taiwan
Croatia
Japan
Portugal
Aust ralia
Ireland
Switzerland
Singapore
Hungary
Austria
Israel
Slovakia
New Zealand
Finland
Netherlands
Denmark
Serbia
Bulgaria
Belgium
Global comparison of 3G and 4G Voice App Experience scores
3G 4G

9
Mobile Network Experience Report The State of Mobile Voice App Experience
Our Metrics
There was a degree of correlation between 3G and 4G scores: for instance, the
majority of the countries which ranked Good for 4G Voice App Experience
had users experiencing at least an Acceptable rating when connected using
3G. Likewise, at the other end of the table, in the countries that ranked Poor
or below for 4G Voice App Experience users also had a Very Poor or lower
experience using 3G.
There were a few interesting anomalies to this pattern though: Japan ranked
Good for 4G but Very Poor for 3G likely because 4G completely dominates
the market; Indonesia was the only country where users had a Poor rating for
both types of networks; while Hong Kong's networks were the closest, with
just 1.4 points separating users’ 3G and 4G Voice App Experience scores.
A look at our 3G Voice App Experience scores plotted on a global heatmap
shows not only the large proportion of countries with rankings of Poor or
below — shown in lighter blue — but also the wide distribution of these
countries across the globe.

10
Mobile Network Experience Report The State of Mobile Voice App Experience
Our Metrics
Voice App Experience rankings improve with access to 4G networks
When we look at the proportion of countries gaining Good rankings, we see it
is much higher for 4G Voice App Experience. Our 4G users in 33 countries saw
Good rankings — slightly more than the 32 countries that were rated
Acceptable. Less than a third of the countries we analyzed ranked Poor or
below for 4G Voice Experience. This highlights the importance of
Opensignal’s 4G Availability measure — the proportion of time users spend
connected to 4G — as an indicator of overall Voice App Experience.
Looking at overall Voice App Experience, which combines users’ scores for
both 3G and 4G networks, we see the highest number of countries — over a
third of them — achieving an Acceptable ranking. This ranking was bracketed
by a similar number of countries — around 20 — achieving both Good and Poor
ratings. And just 10 countries ranked below Poor in overall Voice App
Experience.

11
Mobile Network Experience Report The State of Mobile Voice App Experience
Our Metrics
A Good 3G Voice App Experience is difficult, but not impossible Our users in the majority of countries — 31 in total — saw Poor rankings and
another 25 ranked Very Poor or lower. Meanwhile, there were users in just 25
countries gaining Acceptable, or above, for 3G Voice App Experience which
demonstrates the challenges faced by operators offering a good experience
without 4G connectivity.
The spread of these Voice App Experience rankings by 3G and 4G
technologies comes as little surprise. As we can see in the chart above, the
ratio of countries scoring Poor rankings and below is significantly higher for
3G Voice App Experience. This serves to highlight how important 4G
Availability is to our users when using voice apps. It's pretty hard for our users
to get even an acceptable level of user experience using 3G technology.
Our data shows it's difficult to get a decent Voice App Experience on 3G
networks, but not impossible. Nine countries had a difference of less than five
points between their users’ 3G and 4G Voice App Experience scores, with all
ranking Acceptable for 3G. And many of these were highly mature markets
with legacy 3G networks supported by strong fixed-line infrastructure,
including Germany, Hong Kong, Singapore and Switzerland.
10%
3%
20%
10%
4%
39%
26%
15%
30%
38%
40%
1%
24%
41%
0% 20% 40% 60% 80% 100%
3G
Overall
4G
Voice App Experience: Proportion of countries by rating
Unintelligible (45-60) Very Poor (60-66) Poor (66-74) Acceptable (74-80) Good (80-87)
12
Mobile Network Experience Report The State of Mobile Voice App Experience
Our Metrics
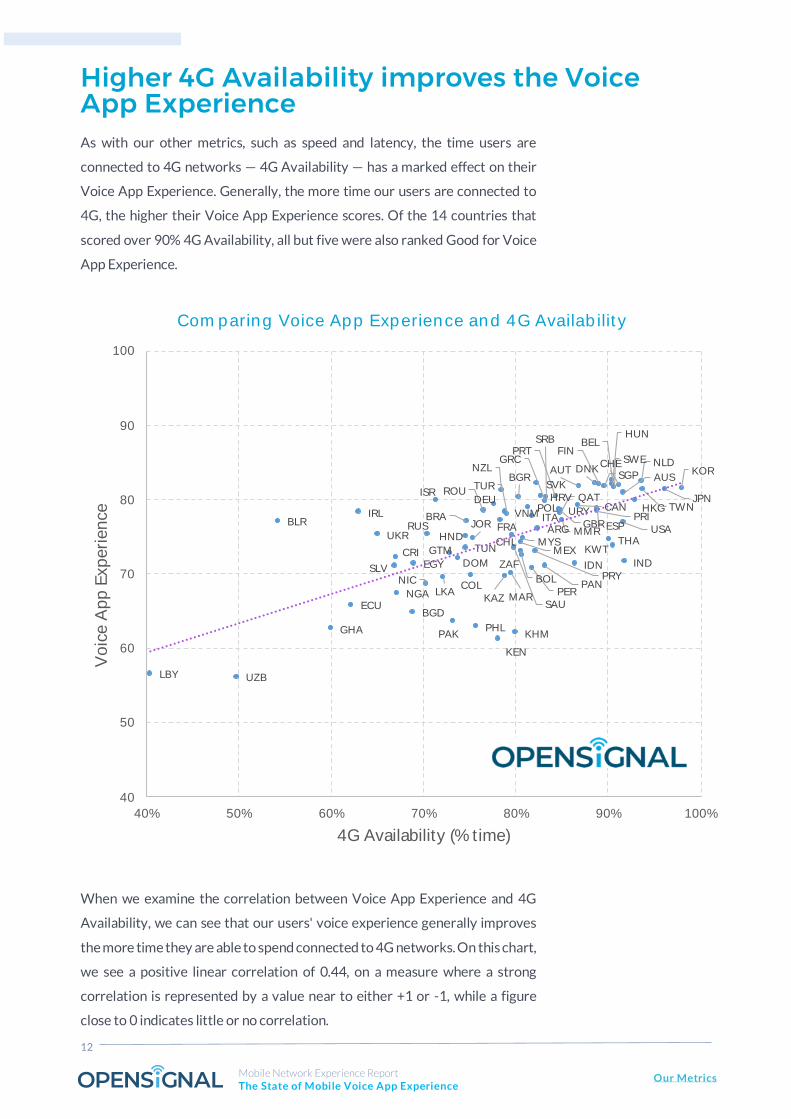
Higher 4G Availability improves the Voice App Experience As with our other metrics, such as speed and latency, the time users are
connected to 4G networks — 4G Availability — has a marked effect on their
Voice App Experience. Generally, the more time our users are connected to
4G, the higher their Voice App Experience scores. Of the 14 countries that
scored over 90% 4G Availability, all but five were also ranked Good for Voice
App Experience.
When we examine the correlation between Voice App Experience and 4G
Availability, we can see that our users' voice experience generally improves
the more time they are able to spend connected to 4G networks. On this chart,
we see a positive linear correlation of 0.44, on a measure where a strong
correlation is represented by a value near to either +1 or -1, while a figure
close to 0 indicates little or no correlation.
BEL
NLDDNK
SVK
FIN
HUN
CHESGP
AUTSWE
KOR
JPNTWN
NZLAUS
PRT
HRV
BGR
SRB
ISR
HKG
GRC
DEUCANPOL
ESP
URYPRI
GBR
ROU
VNMIRL
QATTUR
ITA
MMRFRABLR
BRA
USAARGRUSUKR
CHLHND
JOR
MYS THAMEX KWTTUN
SAU
PRYBOL
GTM
ZAFCRI
DOM INDEGY IDN
PAN
SLV
PERMAR
COL
KAZLKA
NIC
NGAECU
BGD
PAKPHLGHA KHM
KEN
LBY UZB
40
50
60
70
80
90
100
40% 50% 60% 70% 80% 90% 100%
Vo
ice A
pp
Exp
eri
en
ce
4G Availability (% time)
Com paring Voice App Experience and 4G Availab ilit y
13
Mobile Network Experience Report The State of Mobile Voice App Experience
Our Metrics
However, this doesn't mean it's impossible to get an Acceptable 3G Voice App
Experience. In some countries like Libya, Uzbekistan, and Belarus, where 4G
Availability is lower, meaning our users are forced to spend more time on 3G
networks, they were still able to get an Acceptable Voice App Experience on
3G networks.
There is little doubt that voice apps are here to stay, and they will only become
more sophisticated and even more widespread as mobile data consumption
increases and 5G networks arrive, heralding the next generation of the mobile
network experience. And, as these communication apps become
commonplace, it's all the more vital that users and operators alike are able to
access a reliable and independent measure of the user Voice App Experience
to understand the real mobile experience and how it compares across
countries and across operators.

14
Mobile Network Experience Report The State of Mobile Voice App Experience
Our Metrics
APPENDIX - DEFINITIONS Opensignal's Voice App Experience measures the quality of experience for
over-the-top (OTT) voice services — mobile voice apps such as WhatsApp,
Skype, Facebook Messenger etc. — using a model derived from the
International Telecommunication Union (ITU)-based approach for
quantifying overall voice call quality and a series of calibrated technical
parameters.
This model characterizes the exact relationship between the technical
measurements and perceived call quality.
Voice App Experience is calculated on a scale from 0 to 100.
95-100 Excellent – Most users are very satisfied.
87-95 Very Good – Most users are satisfied.
80-87 Good – Many users are satisfied.
74-80 Acceptable – Users are satisfied.
66-74 Poor – Many users dissatisfied.
60-66 Very Poor – Most users dissatisfied.
45-60 Unintelligible – Nearly all users dissatisfied.
0-45 Impossible to communicate.
4G Voice App Experience
This metric quantifies the quality of experience over mobile voice services for
each operator on LTE connections as experienced by Opensignal users.
3G Voice App Experience
This metric quantifies the quality of experience over mobile voice services for
each operator on 3G connections as experienced by Opensignal users.

15
Mobile Network Experience Report The State of Mobile Voice App Experience
Our Metrics
APPENDIX - COUNTRY DATA
Overall Voice App
Experience
3G Voice App
Experience
4G Voice App
Experience
Algeria 63.6 60.2 69.8
Argentina 76.1 69.4 77.9
Australia 80.9 71.1 82.0
Austria 81.7 76.3 82.6
Bangladesh 64.8 60.1 73.0
Belarus 77.1 75.4 80.0
Belgium 82.6 75.6 83.5
Bolivia 73.0 66.4 76.4
Brazil 77.0 70.9 79.9
Bulgaria 80.4 75.5 83.2
Cambodia 62.1 54.3 65.3
Canada 79.2 70.2 80.8
Chile 75.2 68.0 77.6
Colombia 69.8 60.9 75.0
Costa Rica 72.2 66.5 76.6
Croatia 80.4 76.1 81.8
Denmark 82.2 75.8 83.0
Dominican Republic 72.0 64.0 77.6
Ecuador 65.8 59.4 73.0
Egypt 71.4 66.7 77.5
El Salvador 71.0 66.1 77.6
Finland 82.0 76.1 82.9
France 77.2 66.4 80.2
Germany 79.4 76.2 80.0
Ghana 62.6 59.2 72.6
Greece 79.7 75.4 80.8
Guatemala 72.7 65.5 77.7
Honduras 75.0 69.8 78.7
Hong Kong
(SAR China) 79.9 78.6 80.0

16
Mobile Network Experience Report The State of Mobile Voice App Experience
Our Metrics
Overall Voice App
Experience
3G Voice App
Experience
4G Voice App
Experience
Hungary 82.0 78.1 82.6
India 71.6 62.5 72.6
Indonesia 71.3 66.6 72.8
Ireland 78.3 72.1 82.3
Israel 79.9 74.5 82.7
Italy 77.7 70.4 79.7
Japan 81.4 65.5 81.9
Jordan 74.8 71.0 77.7
Kazakhstan 69.6 61.8 73.2
Kenya 61.2 56.8 65.8
Kuwait 73.8 66.2 75.1
Libya 56.5 53.8 71.9
Malaysia 74.8 66.6 77.4
Mexico 74.2 64.5 78.2
Morocco 70.1 64.3 74.6
Myanmar 77.2 73.1 79.2
Netherlands 82.4 75.9 83.0
New Zealand 81.2 75.9 82.9
Nicaragua 68.6 64.2 73.8
Nigeria 67.4 64.5 75.6
Pakistan 63.7 59.7 68.4
Panama 71.1 62.9 74.3
Paraguay 73.1 67.3 75.6
Peru 70.8 63.8 73.6
Philippines 62.9 53.5 67.4
Poland 78.9 70.1 81.3
Portugal 80.5 74.7 81.9
Puerto Rico 78.5 73.5 79.2
Qatar 78.1 76.4 78.7
Romania 78.4 72.1 80.9
Russian Federation 75.4 69.3 78.3

17
Mobile Network Experience Report The State of Mobile Voice App Experience
Our Metrics
Overall Voice App
Experience
3G Voice App
Experience
4G Voice App
Experience
Saudi Arabia 73.5 66.5 76.3
Serbia 80.3 76.2 83.2
Singapore 81.7 78.7 82.3
Slovakia 82.1 79.3 82.7
South Africa 72.5 67.1 75.2
South Korea 81.4 74.8 81.7
Spain 78.8 71.5 80.1
Sri Lanka 69.5 64.4 74.0
Sweden 81.5 80.4 81.7
Switzerland 81.9 78.3 82.3
Taiwan 81.3 74.7 81.8
Thailand 74.5 67.3 76.8
Tunisia 73.5 70.3 76.6
Turkey 78.1 73.4 81.0
Ukraine 75.3 71.8 79.2
United Kingdom 78.4 74.0 79.3
United States of
America 76.9 61.6 78.0
Uruguay 78.6 73.0 80.5
Uzbekistan 56.1 52.9 63.0
Vietnam 78.3 74.5 81.2
18
Mobile Network Experience Report The State of Mobile Voice App Experience
Our Metrics
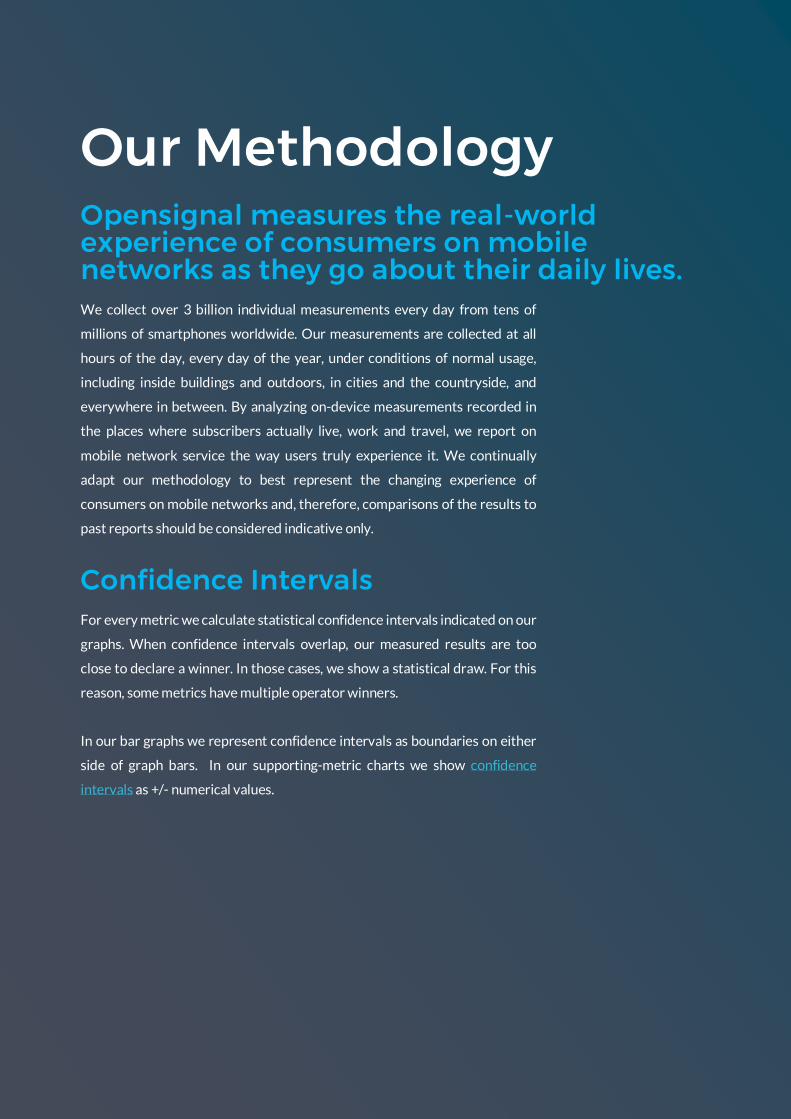
Our Methodology
Opensignal measures the real-world experience of consumers on mobile networks as they go about their daily lives. We collect over 3 billion individual measurements every day from tens of
millions of smartphones worldwide. Our measurements are collected at all
hours of the day, every day of the year, under conditions of normal usage,
including inside buildings and outdoors, in cities and the countryside, and
everywhere in between. By analyzing on-device measurements recorded in
the places where subscribers actually live, work and travel, we report on
mobile network service the way users truly experience it. We continually
adapt our methodology to best represent the changing experience of
consumers on mobile networks and, therefore, comparisons of the results to
past reports should be considered indicative only.
Confidence Intervals For every metric we calculate statistical confidence intervals indicated on our
graphs. When confidence intervals overlap, our measured results are too
close to declare a winner. In those cases, we show a statistical draw. For this
reason, some metrics have multiple operator winners.
In our bar graphs we represent confidence intervals as boundaries on either
side of graph bars. In our supporting-metric charts we show confidence
intervals as +/- numerical values.

19
Mobile Network Experience Report The State of Mobile Voice App Experience
Our Metrics
Our Metrics4G Availability
4G Availability shows the proportion of time Opensignal
users with a 4G device have a 4G connection. 4G
Availability is not a measure of coverage or the
geographic extent of a network.
Video Experience
Video Experience quantifies the quality of mobile video
experienced by Opensignal users on real-world video
streams.
To calculate Video Experience, we directly measure video
streams from end-user devices, using an ITU-based
approach to quantify factors such as load times, stalling
and video resolution over both an operator's 3G and 4G
networks. Video Experience for each operator is
calculated on a scale from 0 to 100.
4G Video Experience This metric quantifies the quality of
mobile video for each operator on LTE connections as
experienced by Opensignal users on real-world video
streams.
3G Video Experience This metric quantifies the quality of
mobile video for each operator on 3G connections as
experienced by Opensignal users on real-world video
streams.
Voice App Experience
Measures the quality of experience for over-the-top
(OTT) voice services — mobile voice apps such as
WhatsApp, Skype, Facebook Messenger etc. — using a
model derived from the International Telecommunication
Union (ITU)-based approach for quantifying overall voice
call quality and a series of calibrated technical
parameters. This model characterizes the exact
relationship between the technical measurements and
perceived call quality. Voice App Experience for each
operator is calculated on a scale from 0 to 100.
4G Voice App Experience This metric quantifies the
quality of experience over mobile voice services for each
operator on LTE connections as experienced by
Opensignal users.
3G Voice App Experience This metric quantifies the
quality of experience over mobile voice services for each
operator on 3G connections as experienced by
Opensignal users.
Download Speed Experience
Download Speed Experience shows the average
download speed experienced by Opensignal users across
an operator’s 3G and 4G networks.
It factors in 3G and 4G download speeds along with the
availability of each technology.
4G Download Speed This metric shows the average
download speed for each operator on LTE connections as
measured by Opensignal users.
3G Download Speed This metric shows the average
download speed for each operator on 3G connections as
measured by Opensignal users.
Upload Speed Experience
Upload Speed Experience measures the average upload
speeds experienced by Opensignal users across an
operator’s 3G and 4G networks.
It factors in 3G and 4G upload speeds along with the
availability of each technology.
4G Upload Speed This metric shows the average upload
speed for each operator on LTE connections as measured
by Opensignal users.
3G Upload Speed This metric shows the average upload
speed for each operator on 3G connections as measured
by Opensignal users.
Latency Experience
Measured in milliseconds, latency refers to the delay
users experience as data makes a round trip through the
network.
Our Latency Experience metric is calculated as an
average of the individual 3G and 4G latency
measurements based on the proportion of time
Opensignal users spend connected to each network type.
A lower score in this metric is a sign of a more responsive
network.
4G Latency This metric shows the average latency for
each operator on LTE connections as measured by
Opensignal users.
3G Latency This metric shows the average latency for
each operator on 3G connections as measured by
Opensignal users.