Embed Size (px)
Citation preview

The State of Hawaii Airport Activity Statistics by Calendar Year
An Annual Statistical Publication
of the
State of Hawaii Department of Transportation
Airports Division Airports Planning Office
Honolulu International Airport 400 Rodgers Boulevard, Suite 700
Honolulu, Hawaii 96819

NIIHAIJJ
MAUl
ll!:\W:\II1l Gj iili~l
s
••--~Upokl Airport
i Hi/o t.nfl'->rn~~fib.n·;;;~l
Air(XJft
HAWAII
STATE OF HAWAII
Department of Transportation
AIRPORTS DIVISION

. TERMINOLOGY
Enplaned
Deplaned
Revenue
Nonrevenue
International Transit: True transit
Bonded transit
. Domestic Transit: U.S. to Foreign
Neighbor Island (N.I.) to Mainland
Aircraft Operations:
Air Carrier Operations
Air Taxi Operations
General Aviation Operations
Military Operations
DEFINITION ·
Passengers, caigo, and mail boarding an aircraft.
Passengers, cargo, and mail disembarking an aircraft.
Passengers, cargo, and mail whose transportation has been paid for.
Passengers, cargo, and mail whose transportation has not been paid for.
Passengers who clear U.S. Immigration and Customs at Honolulu · International Airport (HNL) and then proceed to another city. ·
Passengers who are held ·in a sterile lounge area and reboard an aircraft without being processed by either U.S. Immigration or Customs .
Passengers who arrive at HNL from the Mainland or the Neighbor Islands and reboard an aircraft destined for a foreign country (without leaving HNL).
Passengers who arrive at HNL from a Neighbor Island airport and reboard an aircraft destined for the Mainland (without leaving HNL). ·
Total aircraft movements, landings and takeoffs combined. Reported by the United States Federal Aviation Administration's (FAA's) air traffic control towers.
The landings and takeoffs of large commercial aircraft having more than 60 seats. ·
The landings and takeoffs of small commercial aircraft having 60 seats or less.
All types of civil aviation including private jets, corporate jets, and helicopters. General aviation excludes commercial and military aircraft operations.
All military landings and takeoffs, including military helicopters.
Revised 11/28/89, 4/14/93, 5/3/2001.

Calendar Year 2015 Air Traffic Statistics
PASSENGERS % change CARGO % change MAIL % change AIRCRAFT % changeOPERATIONS
2015 2015 2015 2015vs. (U.S. vs. (U.S. vs. (takeoffs + vs.
AIRPORT 2014 tons) 2014 tons) 2014 landings) 2014
1 Honolulu International 19,869,707 1.5 413,401 0 98,123 11.9 312,655 0.52 Kahului 6,678,772 6.9 31,217 6.6 11,529 9.1 134,674 4.73 Kona International 3,070,772 6.6 19,564 5.6 9,393 10.9 135,064 4.24 Lihue 2,820,998 3.7 18,194 12.4 3,979 11.5 132,398 4.65 Hilo International 1,324,596 0.6 20,222 6.1 5,047 13.4 81,269 -6.66 Molokai 242,157 25.3 1,055 4.4 0 0 37,328 8.67 Kapalua 62,228 33.4 1,293 6.6 0 0 12,847 408 Lanai 78,638 -24.1 885 2.2 0 0 6,458 -15.99 Kalaupapa 12,297 27.9 111 -11.2 0 0 2,282 -6.2
10 Hana 3,826 12.4 0 0 0 0 2,138 7.411 Waimea-Kohala 10,255 2.1 0 0 1,787 23.4 2,634 11.912 Kalaeloa - - - - - - 128,558 -2.913 Dillingham Airfield - - - - - - 32,079 -2214 Port Allen - - - - - - 420 -81.815 Upolu - - - - - - 2 -50
Total Statewide 34,174,246 3.2 505,942 1.2 129,858 11.8 1,020,806 0.4 (all airports)
StatewideCargo + Mail(U.S. tons)
Including transits.2015 2014 % change
CY = Calendar Year (Jan. - Dec.) ---------------------- ------------------ - ----------------------635,800 615,875 3.2%
6-30-99 Ford Island (USN) closed.7-1-99 Kalaeloa owned by the State of Hawaii.
HonoluluSource: State of Hawaii Cargo + Mail
Department of TransportationDepartment of Transportation (U.S. tons) Airports Division, AIR-PSAirports Division, AIR-EP Honolulu International AirportHonolulu International Airport 2015 2014 % change 400 Rodgers Boulevard, Suite 700400 Rodgers Boulevard, Suite 700 ---------------------- ------------------ - ---------------------- Honolulu, Hawaii 96819-1880Honolulu, Hawaii 96819-1880 511,524 501,060 2.1%
Total operations for the 5 major airports
2015 2014 % change---------------------- ------------------ - ----------------------
796,060 782,965 1.7%
Statewide international passenger arrivals
2015 2014 % change---------------------- ------------------ - ----------------------
2,890,794 2,816,930 2.6%
Honolulu's international passenger arrivals
2015 2014 % change---------------------- --------------------- ----------------------
AIR-EP 2,678,092 2,613,779 2.5%

Calendar Year 2014 Air Traffic Statistics
PASSENGERS % change CARGO % change MAIL % change AIRCRAFT % changeOPERATIONS
2014 2014 2014 2014vs. (U.S. vs. (U.S. vs. (takeoffs + vs.
AIRPORT 2013 tons) 2013 tons) 2013 landings) 2013
1 Honolulu International 19,808,497 -0.6 413,397 5.8 87,663 24.5 311,138 7.22 Kahului 6,246,075 2.4 29,296 8.2 10,564 3.5 128,612 0.23 Kona International 2,879,716 1.2 18,534 9.8 8,468 -6.7 129,655 9.84 Lihue 2,721,445 0.4 16,192 4.7 3,570 4.6 126,577 0.25 Hilo International 1,316,162 -2.1 19,067 -14.7 4,449 20.3 86,983 -7.86 Molokai 193,250 13.3 1,011 13.5 12 +100 34,363 -0.47 Kapalua 46,634 -11.7 1,213 13.4 0 0 9,179 1.38 Lanai 103,633 4.4 866 4.5 0 0 7,680 29 Kalaupapa 9,617 192.4 125 -12 0 0 2,434 -66.7
10 Hana 3,403 -75.9 0 -100 0 0 1,990 -8.711 Waimea-Kohala 10,044 282.8 0 0 1,448 234.4 2,354 29.112 Kalaeloa 4,079 +100 - - - - 132,385 -4.813 Dillingham Airfield - - - - - - 41,144 -4.814 Port Allen - - - - - - 2,306 -58.915 Upolu - - - - - - 4 -92.6
Total Statewide 33,342,555 0.2 499,701 5.1 116,174 19.5 1,016,804 0.9 (all airports)
StatewideCargo + Mail(U.S. tons)
Including transits.2014 2013 % change
CY = Calendar Year (Jan. - Dec.) --------------------- ------------------ -- ---------------------615,875 572,683 7.5%
6-30-99 Ford Island (USN) closed.7-1-99 Kalaeloa owned by the State of Hawaii.
HonoluluSource: State of Hawaii Cargo + Mail
Department of Transportation (U.S. tons) Airports Division, AIR-EP Honolulu International Airport 2014 2013 % change 400 Rodgers Boulevard, Suite 700 --------------------- ------------------ -- --------------------- Honolulu, Hawaii 96819-1880 501,060 461,159 8.7%
Total operations for the 5 major airports
2014 2013 % change--------------------- ------------------ -- ---------------------
782,965 757,190 3.4%
Statewide international passenger arrivals
2014 2013 % change--------------------- ------------------ -- ---------------------
2,816,930 2,755,731 2.2%
Honolulu's international passenger arrivals
2014 2013 % change--------------------- ------------------ -- ---------------------
AIR-EP GC 2,613,779 2,574,701 1.5%

Calendar Year 2012 Air Traffic Statistics
PASSENGERS % change CARGO % change MAIL % change AIRCRAFT % changeOPERATIONS
2012 2012 2012 2012vs. (U.S. vs. (U.S. vs. (takeoffs + vs.
AIRPORT 2011 tons) 2011 tons) 2011 landings) 2011
1 Honolulu International 19,293,941 6.9 383,003 10.4 71,396 -5.6 278,145 5.62 Kahului 5,926,052 8 25,824 3.6 10,166 -12.6 130,010 6.23 Kona International 2,841,935 6.1 18,234 6.5 8,303 2.5 116,654 4.24 Lihue 2,659,043 7.6 14,613 9.8 30 10 118,431 17.95 Hilo International 1,349,359 7.3 21,671 -13 3,473 13.9 79,064 0.56 Molokai 171,356 -0.9 863 11.4 0 0 34,672 14.57 Kapalua 84,577 -5.8 757 -14.4 0 0 7,270 15.18 Lanai 90,511 -2.4 885 42.1 0 0 7,804 247.99 Kalaupapa 173 -82.8 198 17.2 0 0 4,760 82
10 Hana 6,785 20.5 0 0 0 0 2,472 42.711 Waimea-Kohala 21 -48.8 0 0 0 0 54 812 Kalaeloa - - - - - - 121,114 -1.713 Dillingham Airfield - - - - - - 39,329 -8.614 Port Allen - - - - - - 4,640 34.315 Upolu - - - - - - 154 11
Total Statewide 32,423,753 7 466,048 8.5 93,368 -5.1 944,573 6 (all airports)
StatewideCargo + Mail(U.S. tons)
Including transits.2012 2011 % change
CY = Calendar Year (Jan. - Dec.) ---------------------- ------------------ - ----------------------559,416 527,911 6.0%
6-30-99 Ford Island (USN) closed.7-1-99 Kalaeloa owned by the State of Hawaii.
HonoluluSource: State of Hawaii Cargo + Mail
Department of TransportationDepartment of Transportation (U.S. tons) Airports Division, AIR-PSAirports Division, AIR-EP Honolulu International AirportHonolulu International Airport 2012 2011 % change 400 Rodgers Boulevard, Suite 700400 Rodgers Boulevard, Suite 700 ---------------------- ------------------ - ---------------------- Honolulu, Hawaii 96819-1880Honolulu, Hawaii 96819-1880 454,399 422,414 7.6%
Total operations for the 5 major airports
2012 2011 % change---------------------- ------------------ - ----------------------
722,304 676,945 6.7%
Statewide international passenger arrivals
2012 2011 % change---------------------- ------------------ - ----------------------
2,666,578 2,248,200 18.6%
Honolulu's international passenger arrivals
2012 2011 % change---------------------- ------------------ - ----------------------
AIR-EP 2,482,396 2,097,877 18.3%

Calendar Year 2011 Air Traffic Statistics
PASSENGERS % change CARGO % change MAIL % change AIRCRAFT % changeOPERATIONS
2011 2011 2011 2011vs. (U.S. vs. (U.S. vs. (takeoffs + vs.
AIRPORT 2010 tons) 2010 tons) 2010 landings) 2010
1 Honolulu International 18,043,203 -2.4 346,783 -6.1 75,631 -34.8 263,354 -0.032 Kahului 5,485,973 2.6 24,921 -2.2 11,628 -20 122,449 33 Kona International 2,679,716 1.1 17,125 -13 8,100 -8.2 111,968 -10.34 Lihue 2,471,833 2.3 13,311 -7.5 3 200 100,487 -5.95 Hilo International 1,257,446 -1.7 24,908 -1.3 3,050 -5.2 78,687 0.036 Molokai 172,941 2.2 775 -5 0 0 30,274 14.37 Kapalua 89,771 11.3 884 1.2 0 0 6,316 88 Lanai 92,749 2.4 623 8.9 0 0 3,148 -61.19 Kalaupapa 1,006 -44 169 5.8 0 0 2,616 5.8
10 Hana 331 -50.2 0 -100 0 0 1,732 -2.511 Waimea-Kohala 41 -24.1 0 0 0 0 50 -96.512 Kalaeloa - - - - - - 123,219 9.213 Dillingham Airfield - - - - - - 43,022 148.114 Port Allen - - - - - - 3,454 2.615 Upolu - - - - - - 14 100
Total Statewide 30,295,010 -0.6 429,499 -5.9 98,412 -36.9 890,790 2.1 (all airports)
StatewideCargo + Mail(U.S. tons)
Including transits.2011 2010 % change
CY = Calendar Year (Jan. - Dec.) --------------------- ------------------ -- ---------------------527,911 599,211 -11.9%
6-30-99 Ford Island (USN) closed.7-1-99 Kalaeloa owned by the State of Hawaii.
HonoluluSource: State of Hawaii Cargo + Mail
Department of Transportation (U.S. tons) Airports Division, AIR-EP Honolulu International Airport 2011 2010 % change 400 Rodgers Boulevard, Suite 700 --------------------- ------------------ -- --------------------- Honolulu, Hawaii 96819-1880 422,414 485,389 -13.0%
Total operations for the 5 major airports
2011 2010 % change--------------------- ------------------ -- ---------------------
676,945 692,703 -2.3%
Statewide international passenger arrivals
2011 2010 % change--------------------- ------------------ -- ---------------------
2,248,200 2,172,384 3.5%
Honolulu's international passenger arrivals
2011 2010 % change--------------------- ------------------ -- ---------------------
AIR-EP 2,097,877 1,991,642 5.3%

Final Calendar Year 2010 Air Traffic Statistics
PASSENGERS % change CARGO % change MAIL % change AIRCRAFT % changeOPERATIONS
2010 2010 2010 2010vs. (U.S. vs. (U.S. vs. (takeoffs + vs.
AIRPORT 2009 tons) 2009 tons) 2009 landings) 2009
1 Honolulu International 18,443,873 2 369,360 9 116,029 29 263,440 -42 Kahului 5,346,694 3 25,482 4 14,533 7 118,896 03 Kona International 2,649,493 -2 19,688 8 8,822 11 124,889 144 Lihue 2,416,812 -3 14,386 16 0 -100 106,815 85 Hilo International 1,279,342 -5 25,245 6 3,218 20 78,663 166 Molokai 169,233 -10 816 -12 0 -100 26,491 97 Kapalua 80,627 -11 873 8 0 0 5,846 -138 Lanai 90,567 -1 572 -4 0 -100 8,094 119 Kalaupapa 1,795 -61 160 -5 0 -100 2,472 -20
10 Hana 664 -50 27 1536 0 0 1,776 -3011 Waimea-Kohala 54 -91 0 0 0 -100 1,418 -3712 Kalaeloa - - - - - - 112,830 -1213 Dillingham Airfield - - - - - - 17,338 -6514 Port Allen - - - - - - 3,368 5915 Upolu - - - - - - 0 -100
Total Statewide 30,479,154 1 456,609 9 142,602 25 872,336 -3 (all airports)
StatewideCargo + Mail(U.S. tons)
Including transits.2010 2009 % change
CY = Calendar Year (Jan. - Dec.) --------------------- ------------------ -- ---------------------599,211 532,792 12.5%
6-30-99 Ford Island (USN) closed.7-1-99 Kalaeloa owned by the State of Hawaii.
HonoluluSource: State of Hawaii Cargo + Mail
Department of Transportation (U.S. tons) Airports Division, AIR-EP Honolulu International Airport 2010 2009 % change 400 Rodgers Boulevard, Suite 700 --------------------- ------------------ -- --------------------- Honolulu, Hawaii 96819-1880 485,389 427,292 13.6%
Total operations for the 5 major airports
2010 2009 % change--------------------- ------------------ -- ---------------------
692,703 669,837 3.4%
Statewide international passenger arrivals
2010 2009 % change--------------------- ------------------ -- ---------------------
2,172,384 1,960,653 10.8%
Honolulu's international passenger arrivals
2010 2009 % change--------------------- ------------------ -- ---------------------
AIR-EP June 23, 2011 1,991,642 1,798,991 10.7%Final

Final
PASSENGERS
AIRPORT
1 Honolulu International 18,171,937 2 Kahului 5,192,693 3 Kona International 2,713,624 4 Lihue 2,488.018 5 Hilo International 1,350,281 6 Molokai 188,573 7 Kapalua 90,279 8 Lanai 91,856 9 Kalaupapa 4,579
10 Han a 1,327 11 Waimea-Kohala 570 12 Kalaeloa -13 Dillingham Airfield -14 Port Allen -15 Upolu -
Total Statewide 30,293.737 (all airports)
Including transits.
CY =Calendar Year (Jan.- Dec.)
6-30-99 Ford Island (USN) closed. 7-1-99 Kalaeloa owned by the State of Hawaii.
Source: State of Hawaii Department of Transportation Airports Division. AI R-EP Honolulu International Airport 400 Rodgers Boulevard, Suite 700 Honolulu, Hawaii 96819-1880
AIR-EP revised September 14,2010 Final
%change
2009 vs.
2008
-3 -5 -2 -5
-0.2 -13 -24 -19 -38 -56 -33
----
-4
Calendar Year 2009 Air Traffic Statistics
CARGO
(U.S. tons)
338,080 24,324 18,053 12.163 23,639
928 811 593 168
2 0 ----
418,761
2009
532,792
2009
427,292
%change
2009 vs.
2008
-6 -10 -15 -13
6 -1
-14 -18 -13 -62
0 ----
-6
Statewide Cargo+ Mail (U.S. tons)
2008
567,733
Honolulu Cargo+ Mail (U.S. tons)
2008
452,839
(U.S. tons)
89,212 13,300 7,583
404 2,516
235 0
99 14 0
668 ----
114,031
%change
-6.2%
%change
-5.6%
Total operations for the 5 major airports
2009 2008 %change
669,837 731.380 -8.4%
Statewide international passenger arrivals
2009 2008 %change
1.960,653 2.016,587 -2.8%
Honolulu's international passenger arrivals
2009 2008 %change
1,798,991 1,860,164 -3.3%
%change AIRCRAFT %change OPERATIONS
2009 2009 vs. (takeoffs+ VS.
2008 landings) 2008
-5 274.434 -4 -7 118,800 -7 -4 109,581 -14
-69 99,171 -13 10 67,851 -10
-42 24,295 -22 0 6,746 -36
-40 7,266 -8 -29 3,094 18
0 2,546 -22 -47 2,238 67
- 128,732 -3 - 49,758 -7 - 2,120 -43 - 2 100
-6 896.634 -8
Final
PASSENGERS
AIRPORT
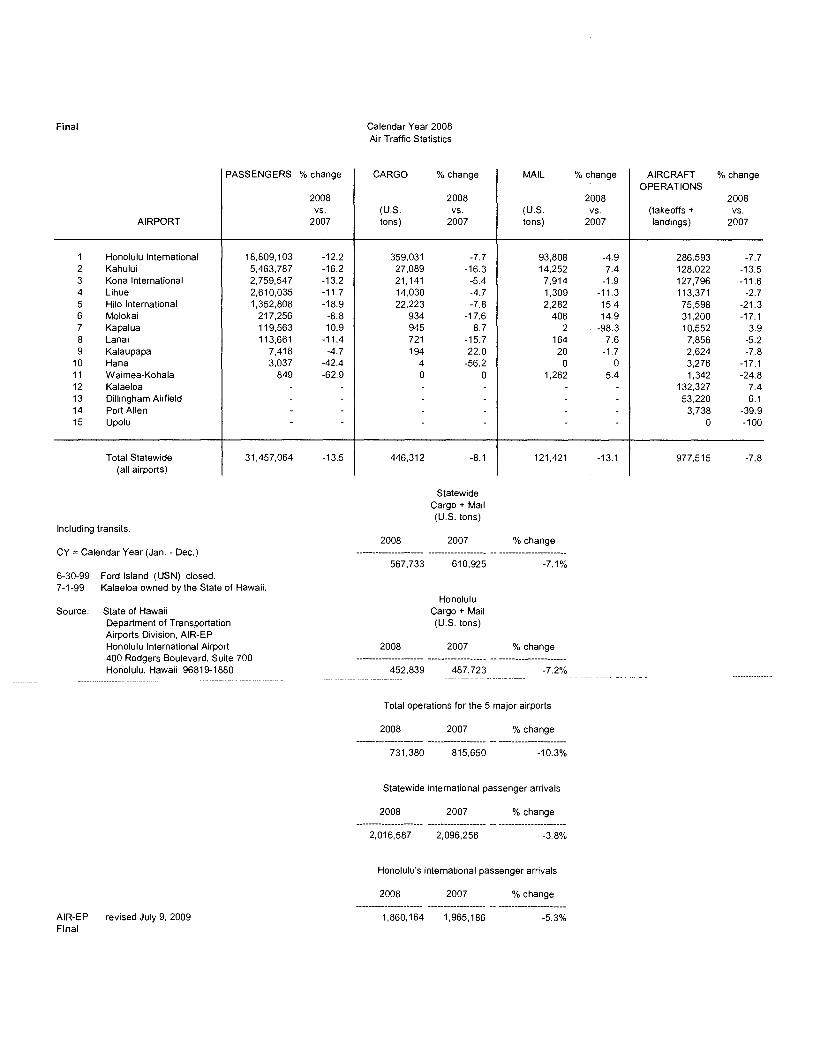
1 Honolulu International 18,809,103 2 Kahului 5,463,787 3 Kona International 2,759,547 4 Lihue 2,610,035 5 Hilo International 1,352,808 6 Molokai 217,256 7 Kapalua 119,563 8 Lanai 113,661 9 Kalaupapa 7,418
10 Han a 3,037 11 Waimea-Kohala 849 12 Kalaeloa -13 Dillingham Airfield -14 Port Allen -15 Upolu -
Total Statewide 31,457,064 (all airports)
Including transits.
CY =Calendar Year (Jan.- Dec.)
6-30-99 Ford Island (USN) closed. 7-1-99 Kalaeloa owned by the State of Hawaii.
Source: State of Hawaii Department of Transportation Airports Division, AIR-EP Honolulu International Airport 400 Rodgers Boulevard, Suite 700 Honolulu, Hawaii 96819-1880
AIR-EP revised July 9, 2009 Final
%change
2008 vs.
2007
-12.2 -16.2 -13.2 -11.7 -18.9 -8.8 10.9
-11.4 -4.7
-42.4 -62.9
----
-13.5
Calendar Year 2008 Air Traffic Statistics
CARGO
(U.S. tons)
359,031 27,089 21,141 14,030 22,223
934 945 721 194
4 0 ----
446,312
2008
567,733
2008
452,839
%change
2008 vs.
2007
-7.7 -16.3
-5.4 -4.7 -7.8
-17.6 8.7
-15.7 22.0
-56.2 0 ----
-8.1
Statewide Cargo+ Mail (U.S. tons)
2007
610,925
Honolulu Cargo+ Mail (U.S. tons)
2007
487,723
(U.S. tons)
93,808 14,252 7,914 1,309 2,282
408 2
164 20
0 1,262
----
121,421
%change
-7.1%
%change
-7.2%
Total operations for the 5 major airports
2008 2007 %change
731,380 815,650 -10.3%
Statewide international passenger arrivals
2008 2007 %change
2,016,587 2,096,256 -3.8%
Honolulu's international passenger arrivals
2008 2007 %change
1,860,164 1,965,186 -5.3%
%change AIRCRAFT %change OPERATIONS
2008 2008 vs. (takeoffs+ vs.
2007 landings) 2007
-4.9 286,593 -7.7 7.4 128,022 -13.5
-1.9 127,796 -11.6 -11.3 113,371 -2.7 15.4 75,598 -21.3 14.9 31,200 -17.1
-98.3 10,552 3.9 7.6 7,856 -5.2
-1.7 2,624 -7.8 0 3,276 -17.1
5.4 1,342 -24.8 - 132,327 7.4 - 53,220 6.1 - 3,738 -39.9 - 0 -100
-13.1 977,515 -7.8

Final
PASSENGERS
AIRPORT
1 Honolulu International 21,517,476 2 Kahului 6,517,710 3 Kona International 3,216,642 4 Lihue 2,955,394 5 Hilo International 1,667,136 6 Molokai 238,337 7 Kapalua 107,777 8 Lanai 128,240 9 Kalaupapa 7,783
10 Hana 5,271 11 Waimea-Kohala 2,290 12 Kalaeloa -13 Dillingham Airfield -14 Port Allen -15 Upolu -
Total Statewide 36,364,056 (all airports)
Including transits.
CY =Calendar Year (Jan.- Dec.)
6-30-99 Ford Island (USN) closed. 7-1-99 Kalaeloa owned by the State of Hawaii.
Source: State of Hawaii Department of Transportation Airports Division, AIR-EP Honolulu International Airport 400 Rodgers Boulevard, Suite 700 Honolulu, Hawaii 96819-1880
AIR-EP June 20, 2008
Final
%change
2007 vs.
2006
6.2 14.5
6 19
15.1 8.7
-13.8 18.3
-35.2 -39.1 -49.1
----
8.9
Calendar Year 2007
Air Traffic Statistics
CARGO
(U.S. tons)
389,054 32,368 22,349 14,721 24,110
1,133 870 856 159
10 1 ----
485,631
2007
610,925
%change
2007 vs.
2006
1.9 5.9
-6.4 6.1 4.2 1.3
-4.7 5.7
-13.1 -55.5 -67.3
----
2.2
Statewide Cargo+ Mail (U.S. tons)
2006
605,413
Honolulu Cargo+ Mail (U.S. tons)
2007 2006
487,723 483,999
(U.S. tons)
98,669 13,269 8,067 1,476 1,978
355 111 152
20 0
1,197 ----
125,294
%change
0.9%
%change
0.8%
Total operations for the 5 major airports
2007 2006 %change
815,650 840,613 -3.0%
Statewide international passenger arrivals
2007 2006 %change
2,096,256 2,143,799 -2.2%
Honolulu's international passenger arrivals
2007 2006 %change
1,965,186 2,012,968 -2.4%
%change AIRCRAFT %change OPERATIONS
2007 2007 VS. (takeoffs+ vs.
2006 landings) 2006
-3.5 310,607 -2.1 -3.4 148,034 -10.3 -5.2 144,537 0.8 -12 116,461 -1.4
-2.7 96,011 -D.? 28.6 37,615 -5.2
5450 10,158 6.1 -26.8 8,284 2.6 -25.1 2,846 -31.5
0 3,952 -36.9 -4.5 1,784 -28.7
- 123,184 -15 - 50,162 -1.8 - 6,224 22.5 - 14 6
-3.6 1,059,873 -4.7

PASSENGERS
AIRPORT
1 Honolulu International 20,268,376 2 Kahului 5,690,876 3 Kana International 3,033,212 4 Lihue 2,484,448 5 Hila International 1,448,914 6 Molokai 219,195 7 Kapalua 125,036 8 Lanai 108,338 9 Kalaupapa 12,009
10 Han a 8,648 11 Waimea-Kohala 4,502 12 Kalaeloa -13 Dillingham Airfield -14 Port Allen -15 Upolu -
Total Statewide 33,403,554 (all airports)
Including transits.
CY =Calendar Year (Jan.- Dec.)
6-30-99 Ford Island (USN) closed. 7-1-99 Kalaeloa owned by the State of Hawaii.
Source: State of Hawaii
AI R-EP
Department of Transportation Airports Division, AI R-EP Honolulu International Airport 400 Rodgers Boulevard, Suite 700 Honolulu, Hawaii 96819-1880
April 26, 2007 10:55 a.m.
%change
2006 vs.
2005
0.4 -3.5 2.5
-3.0 11.4 11.4 13.0 9.3
-6.4 13.8 -6.2
----
0.2
Calendar Year 2006 Air Traffic Statistics
CARGO
(U.S. tons)
381,723 30,561 23,878 13,868 23,142
981 306 746 180
18 4 ----
475,407
2006
605,413
%change
2006 VS.
2005
-4.5 -6.8 -2.4 0.9
-5.8 -13.2 -65.3 -20.9 -14.3 125.0 300.0
----
-4.6
Statewide Cargo+ Mail (U.S. tons)
2005
628,579
Honolulu Cargo+ Mail (U.S. tons)
2006 2005
483,999 503,354
(U.S. tons)
102,276 13,740
8,512 1,679 2,032
276 2
208 27
0 1,254
----
130,006
%change
-3.7%
%change
-3.8%
Total operations for the 5 major airports
2006 2005 % change
840,613 869,881 -3.4%
Statewide international passenger arrivals
2006 2005 %change
2,143,799 2,259,386 -5.1%
Honolulu's international passenger arrivals
2006 2005 %change
2,012,968 2,123,469 -5.2%
%change AIRCRAFT %change OPERATIONS
2006 2006 VS. (takeoffs+ vs.
2005 landings) 2005
-1.5 317,317 -4.0 21.6 164,992 -2.1 35.3 143,411 -7.5
-47.8 118,169 9.9 -45.3 96,724 -10.8 224.7 39,685 0.8 100.0 9,572 3.5 -48.3 8,074 4.4
0.0 4,156 -14.2 0.0 6,266 12.6
-12.1 2,502 24.4 - 145,264 -11.9 - 51,104 -10.8 - 5,082 332.1 - 2 -65.7
-0.2 1,112,320 -4.3

Final CALENDAR YEAR 2005 Air Traffic Statistics
| PASSENGERS % change | CARGO % change | MAIL % change | AIRCRAFT % change| | | | OPERATIONS| 2005 | 2005 | 2005 | 2005| vs. | (U.S. vs. | (U.S. vs. | (takeoffs + vs.
AIRPORT | 2004 | tons) 2004 | tons) 2004 | landings) 2004==== === =================== | ============ ======== | ============ ========== | ============ ======== | ============== ========
| | | |1 Honolulu International | 20,179,634 4.2 | 399,537 2.8 | 103,817 16.4 | 330,506 3.12 Kahului | 5,896,989 7.1 | 32,802 -12.2 | 11,300 5.4 | 168,449 4.93 Kona International | 2,959,727 11.8 | 24,477 -4.3 | 6,290 22.6 | 154,967 12.44 Lihue | 2,561,324 1.5 | 13,751 -4.0 | 3,219 59.3 | 107,497 2.95 Hilo International | 1,300,736 6.3 | 24,560 -3.4 | 3,714 29.2 | 108,462 0.56 Upolu | 0 0 | 0 0 | 0 0 | 14 0.07 Waimea-Kohala | 4,798 -13.9 | 0 -100.0 | 1,426 61.5 | 2,012 -29.78 Hana | 7,602 10.3 | 8 -88.6 | 0 0 | 5,566 -9.19 Molokai | 196,847 2.5 | 1,130 -7.6 | 85 25.0 | 39,364 7.1
10 Kalaupapa | 12,836 19.3 | 210 -9.5 | 27 26.0 | 4,846 14.611 Lanai | 99,122 0.5 | 943 10.2 | 402 38.6 | 7,734 -3.612 Kapalua | 110,673 7.9 | 881 8.5 | 0 0 | 9,250 27.813 Kalaeloa | - - | - - | - - | 164,948 17.214 Dillingham Field (USA) | - - | - - | - - | 57,272 -16.515 Port Allen | - - | - - | - - | 1,176 -52.8
==== === =================== | ============ ======== | ============ ========== | ============ ======== | ============== ========| | | |
Total Statewide | 33,330,288 5.2 | 498,299 0.7 | 130,280 17.2 | 1,162,063 4.8 (all airports) | | | |
StatewideCargo + Mail(U.S. tons)
Including transits.2005 2004 % change
CY = Calendar Year (Jan. - Dec.) --------------------- ------------------ -- ---------------------628,579 605,765 3.8%
6-30-99 Ford Island (USN) closed.7-1-99 Kalaeloa owned by the State of Hawaii.
HonoluluSource: State of Hawaii Cargo + Mail
Department of Transportation (U.S. tons) Airports Division, AIR-PS Honolulu International Airport 2005 2004 % change 400 Rodgers Boulevard, Suite 700 --------------------- ------------------ -- --------------------- Honolulu, Hawaii 96819-1880 503,354 477,861 5.3%
Total operations for the 5 major airports
2005 2004 % change--------------------- ------------------ -- ---------------------
869,881 831,376 4.6%
Statewide international passenger arrivals
2005 2004 % change--------------------- ------------------ -- ---------------------
2,259,386 2,207,944 2.3%
Honolulu's international passenger arrivals
2005 2004 % change--------------------- ------------------ -- ---------------------
AIR-PS SL 2,123,469 2,096,380 1.3%3-29-06 Final

CALENDAR YEAR 2004 AIR TRAFFIC STATISTICS
AIRPORT PASSENGERS % change CARGO % change MAIL % change AIRCRAFT % change 2004 2004 2004 OPERATIONS 2004 vs. U.S. tons vs. vs. Takeoffs & vs.
2003 2003 2003 Landings 2003
1. Honolulu International 19,334,674 3.4 336,021 -2.7 83,952 2.9 320,520 6.22. Kahului 5,362,898 -0.4 37,049 -23.0 10,736 8.3 160,552 5.9 3. Kona International 2,653,562 4.4 25,814 -0.1 5,350 13.6 137,918 15.7 4. Lihue 2,522,838 1.4 14,172 -3.8 2,487 -3.7 104,506 7.1 5. Hilo International 1,223,141 2.2 25,930 39.5 2,875 120.0 107,880 8.5 6. Molokai 192,037 -2.7 1,229 -14.2 68 17.3 36,757 -10.2 7. Kapalua 102,579 7.3 976 57.2 0 7,236 37.0 8. Lanai 98,617 -12.5 867 6.8 290 100.0 8,026 16.2 9. Kaulapapa 10,764 -2.5 233 21.3 16 4,228 13.8 10. Hana 6,895 -10.1 79 -6.0 0 6,122 26.0 11. Waimea-Kohala 5,571 -16.5 2 -91.7 883 100.0 2,860 3.3 12. Kalaeloa 0 0 0 0 140,736 -15.3 13. Dillingham Field 0 0 0 0 68,553 -10.914. Port Allen 0 0 0 0 2,492 40.0 15. Upolu 0 0 0 0 14 0.0
Total Statewide 31,513,576 2.5 442,372 -3.0 106,657 6.5 1,108,400 15.1

CALENDAR YEAR 2003 Air Traffic Statistics
| PASSENGERS % change | CARGO % change | MAIL % change | AIRCRAFT % change| | | | OPERATIONS| 2003 | 2003 | 2003 | 2003| vs. | (U.S. vs. | (U.S. vs. | (takeoffs + vs.
AIRPORT | 2002 | tons) 2002 | tons) 2002 | landings) 2002============================ | ============= ========= | ============= =========== | ============= ========= | =============== =========
| | | |1 Honolulu International | 18,690,888 -5.4 | 345,407 -6.3 | 81,554 -7.7 | 301,919 -6.72 Kahului | 5,382,271 -0.6 | 48,118 16.9 | 9,912 0.8 | 151,558 -4.03 Kona International | 2,542,566 -2.3 | 25,836 -5.4 | 4,709 16.6 | 119,210 -3.64 Lihue | 2,487,795 -3.5 | 14,717 4.6 | 2,578 192.0 | 97,576 -4.75 Hilo International | 1,196,650 -14.6 | 18,588 -15.7 | 1,307 -32.7 | 99,415 1.96 Upolu | 0 0 | 0 0 | 0 0 | - -7 Waimea-Kohala | 6,674 118.0 | 24 338.7 | 0 0 | - -8 Hana | 7,673 55.4 | 84 7.2 | 0 0 | - -9 Molokai | 197,343 -5.5 | 1,432 12.7 | 58 9855.2 | 40,944 -4.9
10 Kalaupapa | 11,044 139.8 | 192 -6.7 | 0 0 | - -11 Lanai | 112,681 -19.5 | 812 -2.4 | 0 0 | - -12 Kapalua | 95,596 15.9 | 621 12.4 | 0 0 | - -13 Kalaeloa | - - | - - | - - | 166,160 -12.014 Dillingham Field (USA) | - - | - - | - - | 76,938 -7.615 Port Allen | - - | - - | - - | - -
============================ | ============= ========= | ============= =========== | ============= ========= | =============== =========| | | |
Total Statewide | 30,731,181 -4.5 | 455,831 -4.3 | 100,118 -4.7 | 1,053,720 -6.0 (all airports) | | | |
StatewideCargo + Mail(U.S. tons)
Including transits.2003 2002 % change
CY = Calendar Year (Jan. - Dec.) ----------------------- ------------------- - -----------------------555,949 581,224 -4.3%
6-30-99 Ford Island (USN) closed.7-1-99 Kalaeloa owned by the State of Hawaii.
HonoluluSource: State of Hawaii Cargo + Mail
Department of Transportation (U.S. tons) Airports Division, AIR-PS Honolulu International Airport 2003 2002 % change 400 Rodgers Boulevard, Suite 700 ----------------------- ------------------- - ----------------------- Honolulu, Hawaii 96819-1880 426,961 456,989 -6.6%
Total operations for the 5 major airports
2003 2002 % change----------------------- ------------------- - -----------------------
769,678 805,264 -4.4%
Statewide international passenger arrivals
2003 2002 % change----------------------- ------------------- - -----------------------
2,031,586 2,195,631 -7.5%
Honolulu's international passenger arrivals
2003 2002 % change----------------------- ------------------- - -----------------------
1,920,342 2,090,913 -8.2%FinalRanking by the Airports Council International (ACI)CY 2000 and 2001 Kona
Honolulu International HiloInternational Kahului Lihue Airport International
Airport Airport Airport at Keahole Airport
TOTAL CY CY CY CY CY2000 2001 2000 2001 2000 2001 2000 2001 2000 2001
PassengersWorld ranking 39 44 139 149 227 244 231 245 312 321U.S. ranking 22 24
Cargo (includes mail)World ranking 44 50 200 198 292 310 247 255 258 260
Aircraft OperationsWorld ranking 37 38 104 120 179 194 207 188 176 208
Top 30 Domestic City-Pair Markets, Origin and Destination
CY 1997 Rank5 Honolulu, Hawaii -- Kahului, Maui
15 Honolulu, Hawaii -- Lihue, Kauai18 Honolulu, Hawaii -- Kona, Hawaii22 Los Angeles, California -- Honolulu, Hawaii26 Honolulu, Hawaii -- Hilo, Hawaii
AIR-PS

CALENDAR YEAR 2002 Air Traffic Statistics
| PASSENGERS % change | CARGO % change | MAIL % change | AIRCRAFT % change| | | | OPERATIONS| 2002 | 2002 | 2002 | 2002| vs. | (U.S. vs. | (U.S. vs. | (takeoffs + vs.
AIRPORT | 2001 | tons) 2001 | tons) 2001 | landings) 2001===============================| ========================| ==========================| ========================| ==========================
| | | |1 Honolulu International | 19,749,905 -2.0 | 368,665 33.6 | 88,324 -7.9 | 323,726 -1.02 Kahului | 5,416,503 -5.5 | 41,148 11.6 | 9,829 -5.7 | 157,868 -1.53 Kona International | 2,601,739 -1.5 | 27,323 29.4 | 4,038 -31.7 | 123,704 14.84 Lihue | 2,578,655 -3.7 | 14,070 3.9 | 883 -72.8 | 102,426 -1.25 Hilo International | 1,401,664 -5.3 | 22,056 -4.5 | 1,942 -45.2 | 97,540 1.46 Upolu | 0 0 | 0 0 | 0 0 | - -7 Waimea-Kohala | 3,062 23.9 | 6 277.2 | 0 -100.0 | - -8 Hana | 4,937 -13.6 | 79 17.5 | 0 0 | - -9 Molokai | 208,761 -3.2 | 1,271 -3.9 | 1 -99.3 | 43,065 -1.7
10 Kalaupapa | 4,605 80.8 | 205 11.1 | 0 -100.0 | - -11 Lanai | 139,901 -3.9 | 831 21.4 | 0 -99.3 | - -12 Kapalua | 82,513 -13.5 | 553 -5.0 | 0 0 | - -13 Kalaeloa | - - | - - | - - | 188,831 2.814 Dillingham Field (USA) | - - | - - | - - | 83,288 2.815 Port Allen | - - | - - | - - | - -
===============================| ========================| ==========================| ========================| ==========================| | | |
Total Statewide | 32,192,245 -2.9 | 476,207 27.4 | 105,017 -12.1 | 1,120,448 1.5 (all airports) | | | |
StatewideCargo + Mail(U.S. tons)
Including transits.2002 2001 % change
CY = Calendar Year (Jan. - Dec.) -----------------------------------------------------------------------581,224 493,344 17.8%
6-30-99 Ford Island (USN) closed.7-1-99 Kalaeloa owned by the State of Hawaii.
HonoluluSource: State of Hawaii Cargo + Mail
Department of TransportationDepartment of Transportation (U.S. tons) Airports Division, AIR-PSAirports Division, AIR-PS Honolulu International AirportHonolulu International Airport 2002 2001 % change 400 Rodgers Boulevard, Suite 700400 Rodgers Boulevard, Suite 700 ----------------------------------------------------------------------- Honolulu, Hawaii 96819-1880Honolulu, Hawaii 96819-1880 456,989 371,840 22.9%
Total operations for the 5 major airports
2002 2001 % change-----------------------------------------------------------------------
805,264 795,016 1.3%
Statewide international passenger arrivals
2002 2001 % change-----------------------------------------------------------------------
2,195,631 2,209,722 -0.6%
Honolulu's international passenger arrivals
2002 2001 % change-----------------------------------------------------------------------
2,090,913 2,074,106 0.8%FinalRanking by the Airports Council International (ACI)CY 2000 and 2001 Kona
Honolulu International HiloInternational Kahului Lihue Airport International
Airport Airport Airport at Keahole Airport
TOTAL CY CY CY CY CY2000 2001 2000 20012000 20012000 2001 2000 20012000 20012000 2001
PassengersWorld ranking 39 44 139 149 227 244 231 245 312 321U.S. ranking 22 24
Cargo (includes mail)World ranking 44 50 200 198 292 310 247 255 258 260
Aircraft OperationsWorld ranking 37 38 104 120 179 194 207 188 176 208
Top 30 Domestic City-Pair Markets, Origin and Destination
CY 1997 Rank5 Honolulu, Hawaii -- Kahului, Maui
15 Honolulu, Hawaii -- Lihue, Kauai18 Honolulu, Hawaii -- Kona, Hawaii22 Los Angeles, California -- Honolulu, Hawaii26 Honolulu, Hawaii -- Hilo, Hawaii
AIR-PS3-21-03

CALENDAR YEAR 2001 Air Traffic Statislics
I PASSENGERS %change CARGO % cha'lge MAIL 'Yo change AIRCRAn I OPERATIONS
%change
I 2001 2001 2001 2001 1 vs. {U.S. vs. (U.S. vs. {takeoffs.. vs.
AIRPORT I 2000 I tons) 2000 I tons) 2000 I landings) 2000 ::;;::=:=:c:=;;:;;z:;;;;;;===j =======:=;; ====== J ;;;;;;c:..-:=;;:;; =;;;;c;;==== I :============= =:::;::=;;;;I :=:::;;;;;:::=:==:= a=c:c:=
I I I I 1 Honolulu lntemalional 1 20,151,936 -12.5 1 275,941 -29.1 1 95,899 ·10.9 1 2 Kahukli I 5,729,093 -7.6 I 36,887 -3.2 I 10,422 0.8 1 3 Kona International I 2.640,318 -7.1 1 21,540 -8.6 1 5.909 ·3.5 1 4 Uhue I 2,678,917 -7.1 1 13,543 -11.4 I 3,245 ·7.7 1 5 Hilo International I 1,480,598 -6.8 I 23,09-4 5.9 I 3,541 -4.7 1 6 Upolu I 0 01 0 01 0 Ol 7 waimea-Konala I 2,472 -46.3 I 1 ·92.5 I 347 -53.2 1 8 Hana I 5.714 ·21.9 I 67 90.2 1 o o I 9 Molokai I 215,638 -16.4 I 1,322 -0.7 I 84 -52.3 1
10 Kalaupapa 1 2.547 -58.2 1 185 -8.3 1 4 ·0.2 1 11 Lanai 1 145,536 -10.6 I 685 -4.7 I 46 -54.0 1 12 Kapalua I 95.390 ·22.2 I 582 ·1.2 I o o 1 13 KaJaeloa 1 ·1 ·I ·I 14 Oilfngham Field (USA) I • 1 • I • I 15 Ford Island (USN) 1 · I • I · I 16 PortAIIen I ·I ·I -1
327,006 160,324 107,793 103,655 96,238
43,806
183,600 81,023
-6.3 9.9 -9.0
-16.7
-2.0
14.6
="'"'""'"'"'"'"'=--========"'"! ================I"""""'===:======"'"'"'"'"'"'== I=====--============= I========="' ========= I I I I
Total Statewide (all airports)
I 33,148,159 -10.7 1 373,847 -23.8 I 119,497 ·9.7 1 1 I I I
Final
Including transits.
CY =Calendar Year (Jan. ·Dec.)
6-30-99 FOfd Island (USN) dosed. 7·1·99 Kalaetoa owned by the State of Hawaii.
Source: State of Hawaii Department ol Tram;portatiOn Airports Division, AIR·PS Honolulu International Aitport 400 Rodgers Boulevard, Suite 700 Honolulu, Hawaii 96619-1880
Ranking by the Airports Couneillntemationat (ACI) CY 1999 and CY 2000
Honolulu lntemational
Airport
CY 1999 2000
Passengers lntematioflal 36 39 National 21 22
C•'9' (includes mail) International 34 44 National 17 19
Aircraft Operations lnlemation.al 37 37 National 31 31
Kahuh.li Airport
CY 1999 2000
135 139 54 52
188 200 73 73
91 104 63 ..
Top 30 Domestic City-Pair Marnets, Origin and DestinatiOn
CY 1997 Rallk 5 Honolulu, Hawaii- Kahului, Maui
15 Honolulu, Hawaii- Uhue, Kauai 18 Honolulu, Hawaii- Kona. Hawaii 22 Los Angeles, CaliWmia- Honolulu. Hawaii 26 Honolulu, Hawaii - Hilo, Hawaii
Revised after 9100 to add the final ACI rankings. AIR-PS 6-20.02
2001
Statewide Cargo+ Mail
(U.S. tons)
2000
493,344 623.263
2001
371,840
Honolulu Cargo+ Ma1l
(U.S. tons)
2000
496,841
%change
-20.8%
%change
-25.2%
Total operations lor the 5 major airports
2001 2000 .. """'" 795,016 848,074 -6.3%
Stetewide international pass~ger arrivals
2001 2000 %change
2,209,722 2,664,373 -17.1%
Komo International H~o
lihue Airport tntemational Airport at Keahole Airport
CY CY CY 1999 2000 1999 2000 1999 2000
218 227 223 231 287 312 72 71 74 73 83 83
268 292 234 247 251 258 98 96 .. 84 94 ..
179 179 237 207 178 176 107 109 131 121 106 107
1,103,445 ·3.0
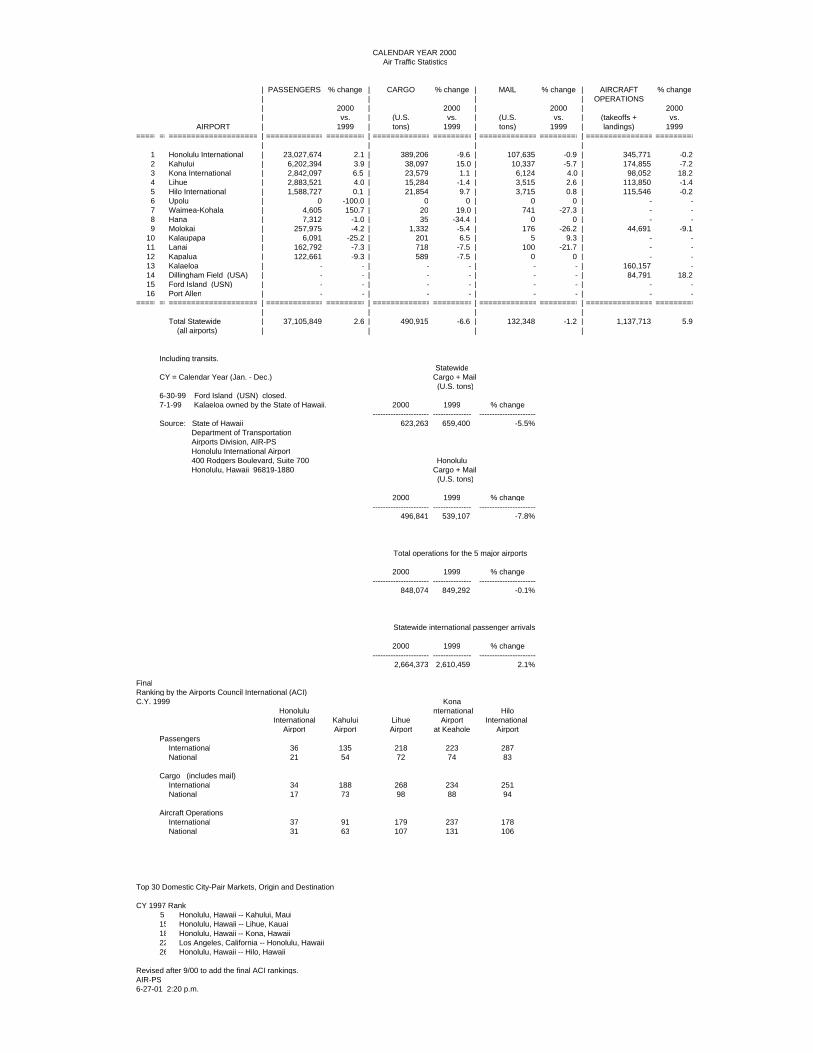
CALENDAR YEAR 2000 Air Traffic Statistics
| PASSENGERS % change | CARGO % change | MAIL % change | AIRCRAFT % change| | | | OPERATIONS| 2000 | 2000 | 2000 | 2000| vs. | (U.S. vs. | (U.S. vs. | (takeoffs + vs.
AIRPORT | 1999 | tons) 1999 | tons) 1999 | landings) 1999==============================| ========================| ========================| ========================| ==========================
| | | |1 Honolulu International | 23,027,674 2.1 | 389,206 -9.6 | 107,635 -0.9 | 345,771 -0.22 Kahului | 6,202,394 3.9 | 38,097 15.0 | 10,337 -5.7 | 174,855 -7.23 Kona International | 2,842,097 6.5 | 23,579 1.1 | 6,124 4.0 | 98,052 18.24 Lihue | 2,883,521 4.0 | 15,284 -1.4 | 3,515 2.6 | 113,850 -1.45 Hilo International | 1,588,727 0.1 | 21,854 9.7 | 3,715 0.8 | 115,546 -0.26 Upolu | 0 -100.0 | 0 0 | 0 0 | - -7 Waimea-Kohala | 4,605 150.7 | 20 19.0 | 741 -27.3 | - -8 Hana | 7,312 -1.0 | 35 -34.4 | 0 0 | - -9 Molokai | 257,975 -4.2 | 1,332 -5.4 | 176 -26.2 | 44,691 -9.1
10 Kalaupapa | 6,091 -25.2 | 201 6.5 | 5 9.3 | - -11 Lanai | 162,792 -7.3 | 718 -7.5 | 100 -21.7 | - -12 Kapalua | 122,661 -9.3 | 589 -7.5 | 0 0 | - -13 Kalaeloa | - - | - - | - - | 160,157 -14 Dillingham Field (USA) | - - | - - | - - | 84,791 18.215 Ford Island (USN) | - - | - - | - - | - -16 Port Allen | - - | - - | - - | - -
==============================| ========================| ========================| ========================| ==========================| | | |
Total Statewide | 37,105,849 2.6 | 490,915 -6.6 | 132,348 -1.2 | 1,137,713 5.9 (all airports) | | | |
Including transits.Statewide
CY = Calendar Year (Jan. - Dec.) Cargo + Mail (U.S. tons)
6-30-99 Ford Island (USN) closed.7-1-99 Kalaeloa owned by the State of Hawaii. 2000 1999 % change
---------------------------------------- --------------------------Source: State of Hawaii 623,263 659,400 -5.5% Department of Transportation Department of Transportation
Airports Division, AIR-PS Honolulu International Airport 400 Rodgers Boulevard, Suite 700 Honolulu Honolulu, Hawaii 96819-1880 Cargo + Mail
(U.S. tons)
2000 1999 % change---------------------------------------- --------------------------
496,841 539,107 -7.8%
Total operations for the 5 major airports
2000 1999 % change---------------------------------------- --------------------------
848,074 849,292 -0.1%
Statewide international passenger arrivals
2000 1999 % change---------------------------------------- --------------------------
2,664,373 2,610,459 2.1%
FinalRanking by the Airports Council International (ACI)C.Y. 1999 Kona
Honolulu International HiloInternational Kahului Lihue Airport International
Airport Airport Airport at Keahole AirportPassengers
International 36 135 218 223 287National 21 54 72 74 83
Cargo (includes mail)International 34 188 268 234 251National 17 73 98 88 94
Aircraft OperationsInternational 37 91 179 237 178National 31 63 107 131 106
Top 30 Domestic City-Pair Markets, Origin and Destination
CY 1997 Rank5 Honolulu, Hawaii -- Kahului, Maui15 Honolulu, Hawaii -- Lihue, Kauai18 Honolulu, Hawaii -- Kona, Hawaii22 Los Angeles, California -- Honolulu, Hawaii26 Honolulu, Hawaii -- Hilo, Hawaii
Revised after 9/00 to add the final ACI rankings.AIR-PS6-27-01 2:20 p.m.

CALENDAR YEAR 1999 Air Traffic Statistics
| PASSENGERS % change | CARGO % change | MAIL % change | AIRCRAFT % change| | | | OPERATIONS| 1999 | 1999 | 1999 | 1999| vs. | (U.S. vs. | (U.S. vs. | (takeoffs + vs.
AIRPORT | 1998 | tons) 1998 | tons) 1998 | landings) 1998===== == =================== | ============ ======== | ============ ======== | ============ ======== | ============== ========
| | | |1 Honolulu International | 22,560,399 -0.3 | 430,476 11.1 | 108,631 7.1 | 346,609 3.82 Kahului | 5,972,079 2.3 | 33,117 3.2 | 10,958 4.3 | 188,385 4.13 Kona International | 2,668,182 0.6 | 23,316 5.6 | 5,889 96.8 | 82,955 2.14 Lihue | 2,773,053 5.0 | 15,494 4.8 | 3,426 8.5 | 115,523 9.05 Hilo International | 1,586,925 1.8 | 19,928 -3.5 | 3,684 6.6 | 115,820 3.06 Upolu | 3 0 | 0 0 | 0 0 | - -7 Waimea-Kohala | 1,837 14.7 | 25 66.7 | 1,020 59.0 | - -8 Hana | 8,093 -14.6 | 54 1250.0 | 0 0 | - -9 Molokai | 269,752 6.8 | 1,408 16.7 | 239 36.3 | 49,184 -0.3
10 Kalaupapa | 8,146 -9.0 | 189 17.4 | 4 -9.5 | - -11 Lanai | 175,641 -0.6 | 777 -9.0 | 128 13.9 | - -12 Kapalua | 135,302 -6.6 | 637 -12.3 | 0 -100.0 | - -13 Princeville * | 132 135.7 | 0 0 | 0 0 | - -14 Kalaeloa | - - | - - | - - | 75,293 -15 Dillingham Field (USA) | - -100.0 | - - | - - | 71,716 5.616 Ford Island (USN) | - - | - - | - - | 29,128 21.217 Port Allen | - - | - - | - - | - -
===== == =================== | ============ ======== | ============ ======== | ============ ======== | ============== ========| | | |
Total Statewide | 36,159,544 0.7 | 525,421 9.5 | 133,979 9.4 | 1,074,613 9.4 (all airports) | | | |
Including transits.
* Leased by the State of Hawaii.
CY = Calendar Year (Jan. - Dec.) StatewideCargo + Mail
Ford Island, Calendar Year 1998 50,441 (U.S. tons)
6-30-99 Ford Island (USN) closed.7-1-99 Kalaeloa owned by the State of Hawaii. 1999 1998 % change
--------------------- --------------- -- ---------------------Source: State of Hawaii 659,400 602,559 9.4% Department of Transportation Department of Transportation Airports Division Airports Division, AIR-PS Honolulu International Airport Honolulu International Airport 400 Rodgers Boulevard, Suite 700 400 Rodgers Boulevard, Suite 700 Honolulu, Hawaii 96819-1880 Honolulu, Hawaii 96819-1880
PreliminaryRanking by the Airports Council International (ACI)C.Y. 1999 Kona
Honolulu International HiloInternational Kahului Lihue Airport International
Airport Airport Airport at Keahole AirportPassengers
International 36 129 207 211 269National 21 50 72 74 82
Cargo (includes mail)International 34 169 239 207 226National
Aircraft OperationsInternational 36 87 167 214 166National
The above involved 598 participating airports.
Top 30 Domestic City-Pair Markets, Origin and DestinationC.Y. 1999
CY 1997 Rank5 Honolulu, Hawaii -- Kahului, Maui
15 Honolulu, Hawaii -- Lihue, Kauai18 Honolulu, Hawaii -- Kona, Hawaii22 Los Angeles, California -- Honolulu, Hawaii26 Honolulu, Hawaii -- Hilo, Hawaii
3-16-00AIR-PS

CALENDAR YEAR 1998 Air Traffic Statistics
| PASSENGERS % change | CARGO % change | MAIL % change | AIRCRAFT % change| | | | OPERATIONS| 1998 | 1998 | 1998 | 1998| vs. | (U.S. vs. | (U.S. vs. | (takeoffs + vs.
AIRPORT | 1997 | tons) 1997 | tons) 1997 | landings) 1997==== = ================ | ========== ======= | ========== ======= | ========== ======= | ============ =======
| | | |1 Honolulu International | 22,636,354 -5.2 | 387,482 -14.9 | 101,463 5.5 | 334,046 -6.92 Kahului | 5,840,417 -0.6 | 32,087 -26.9 | 10,508 49.5 | 180,890 4.43 Kona International | 2,652,955 0.9 | 22,084 -10.3 | 2,993 34.7 | 81,285 -7.04 Lihue | 2,640,000 2.3 | 14,781 12.1 | 3,159 13.3 | 105,979 -4.85 Hilo International | 1,559,494 -6.6 | 20,642 -25.6 | 3,457 -1.8 | 112,479 10.86 Upolu | 3 -66.7 | 0 0 | 0 0 | - -7 Waimea-Kohala | 1,601 -24.8 | 15 -79.5 | 641 279.5 | - -8 Hana | 9,482 -5.9 | 4 786.4 | 0 0 | - -9 Molokai | 252,592 0.1 | 1,207 24.0 | 175 166.0 | 49,353 10.5
10 Kalaupapa | 8,954 3.8 | 161 2169.0 | 5 674.3 | - -11 Lanai | 176,619 -1.0 | 853 -2.5 | 112 64.8 | - -12 Kapalua | 144,928 -18.5 | 726 1.1 | 4 100.0 | - -13 Princeville * | 56 -73.1 | 0 0 | 0 0 | - -14 Dillingham Field (USA) | 4 100.0 | - - | - - | 67,943 -6.515 Ford Island (USN) | - - | - - | - - | 50,441 26.116 Port Allen | - - | - - | - - | - -
==== = ================ | ========== ======= | ========== ======= | ========== ======= | ============ =======| | | |
Total Statewide | 35,923,459 -3.6 | 480,042 -15.4 | 122,517 9.3 | 982,416 -0.7 (all airports) | | | |
Including transits.Statewide
* Leased by the State of Hawaii. Cargo + Mail (U.S. tons)
CY = Calendar Year (Jan. - Dec.)1998 1997 % change
Source: State of Hawaii ----------------- ------------ - ----------------- Department of Transportation Department of Transportation 602,559 679,494 -11.3% Airports Division Airports Division, AIR-PS Honolulu International Airport Honolulu International Airport 400 Rodgers Boulevard, Suite 700 400 Rodgers Boulevard, Suite 700 Honolulu, Hawaii 96819-1880 Honolulu, Hawaii 96819-1880
Ranking by the Airports Council International (ACI)C.Y. 1998 Kona
Honolulu International HiloInternational Kahului Lihue Airport International
Airport Airport Airport at Keahole AirportPassengers
International 37 136 216 215 277National 23 58 80 79 92
Cargo (includes mail)International 34 192 270 237 241National 18 78 105 93 96
Aircraft OperationsInternational 37 96 187 228 172National 33 70 118 136 109
The above involved 598 participating airports.
Top 30 Domestic City-Pair Markets, Origin and DestinationC.Y. 1998
CY 1997 Rank5 Honolulu, Hawaii -- Kahului, Maui
15 Honolulu, Hawaii -- Lihue, Kauai18 Honolulu, Hawaii -- Kona, Hawaii22 Los Angeles, California -- Honolulu, Hawaii26 Honolulu, Hawaii -- Hilo, Hawaii
3-31-99AIR-PS

CALENDAR YEAR 1997 Air Traffic Statistics
| PASSENGERS % change | CARGO % change | MAIL % change | AIRCRAFT % change| | | | OPERATIONS| CY 1997 | CY 1997 | CY 1997 | CY 1997| vs. | (U.S. vs. | (U.S. vs. | (takeoffs + vs.
AIRPORT | CY 1996 | tons) CY 1996 | tons) CY 1996 | landings) CY 1996==== = ================ | ========== ======= | ========== ======= | ========== ======= | ============ =======
| | | |1 Honolulu International | 23,880,346 -1.8 | 455,393 18.5 | 96,182 0.2 | 358,784 -3.62 Kahului | 5,877,611 -0.5 | 43,867 9.1 | 7,029 18.6 | 173,342 -2.93 Kona International | 2,628,157 4.1 | 24,616 9.5 | 2,221 -9.3 | 87,358 13.44 Lihue | 2,580,343 0.7 | 13,184 7.1 | 2,791 6.4 | 111,349 4.75 Hilo International | 1,669,314 2.9 | 27,740 8.2 | 3,519 -9.6 | 101,521 15.56 Upolu | 9 100.0 | 0 0 | 0 0 | - -7 Waimea-Kohala | 2,130 14.1 | 74 -16.1 | 169 100.0 | - -8 Hana | 10,081 -5.8 | 1 -65.9 | 0 0 | - -9 Molokai | 252,237 1.9 | 973 43.0 | 66 -21.8 | 44,667 -9.3
10 Kalaupapa | 8,625 6.5 | 7 100.0 | 1 -91.4 | - -11 Lanai | 178,403 6.2 | 875 65.9 | 68 -22.9 | - -12 Kapalua | 177,929 13.5 | 718 5.5 | 0 0 | - -13 Princeville * | 208 -98.4 | 0 0 | 0 0 | - -14 Dillingham Field (USA) | - - | - - | - - | 72,643 -2.915 Ford Island (USN) | - - | - - | - - | 39,992 0.816 Port Allen | - - | - - | - - | - -
==== = ================ | ========== ======= | ========== ======= | ========== ======= | ============ =======| | | |
Total Statewide | 37,265,393 -0.8 | 567,448 16.5 | 112,046 0.8 | 989,656 0.4% (all airports) | | | |
Including transits.Statewide
* Leased by the State of Hawaii. Cargo + Mail (U.S. tons)
CY = Calendar Year (Jan. - Dec.)1997 1996 % change
Source: State of Hawaii ----------------- ------------ - ----------------- Department of Transportation Department of Transportation 679,494 598,047 13.6% Airports Division Airports Division, AIR-EP Honolulu International Airport Honolulu International Airport 400 Rodgers Boulevard, Suite 700 400 Rodgers Boulevard, Suite 700 Honolulu, Hawaii 96819-1880 Honolulu, Hawaii 96819-1880
Ranking by the Airports Council International (ACI)C.Y. 1997 Kona
Honolulu International HiloInternational Kahului Lihue Airport International
Airport Airport Airport at Keahole AirportPassengers
International 33 133 213 211 272National 18 57 80 79 90
Cargo (includes mail)International 30 174 274 237 223National 15
Aircraft OperationsInternational 34 107 17 218 195National NA
The above ranking involved 729 participating airports.
Top 30 Domestic City-Pair Markets, Origin and DestinationC.Y. 1997
Rank5 Honolulu, Hawaii -- Kahului, Maui
15 Honolulu, Hawaii -- Lihue, Kauai18 Honolulu, Hawaii -- Kona, Hawaii22 Los Angeles, California -- Honolulu, Hawaii26 Honolulu, Hawaii -- Hilo, Hawaii
3-8-98AIR-PS

Final CALENDAR YEAR 1996 Air Traffic Statistics
| PASSENGERS % change | CARGO % change | MAIL % change | AIRCRAFT % change| | | | OPERATIONS| CY 1996 | CY 1996 | CY 1996 | CY 1996| vs. | (U.S. vs. | (U.S. vs. | (takeoffs + vs.
AIRPORT | CY 1995 | tons) CY 1995 | tons) CY 1995 | landings) CY 1995===== == ===================== | ============ ======== | ============ ======== | ============ ======== | ============== ========
| | | |1 Honolulu International | 24,326,737 2.8 | 384,325 6.2 | 96,033 -1.4 | 372,268 -0.42 Kahului | 5,906,135 -2.5 | 40,211 14.9 | 5,928 14.6 | 178,590 -0.73 Keahole-Kona International | 2,524,402 9.6 | 22,486 15.2 | 2,449 -9.7 | 77,025 4.74 Lihue | 2,561,807 3.7 | 12,313 -4.5 | 2,623 2.7 | 106,332 9.25 Hilo International | 1,622,743 -0.3 | 25,631 5.1 | 3,891 19.2 | 87,862 3.56 Upolu | 0 0 | 0 0 | 0 0 | - -7 Waimea-Kohala | 1,866 -34.4 | 89 394.4 | 0 0 | - -8 Hana | 10,699 -15.9 | 1 54.7 | 0 0 | - -9 Molokai | 247,477 1.8 | 680 21.7 | 84 3.2 | 49,221 8.1
10 Kalaupapa | 8,101 -32.4 | 0 0 | 7 100.0 | - -11 Lanai | 167,919 -1.0 | 527 -11.3 | 88 34.8 | - -12 Kapalua | 156,748 6.4 | 681 -13.5 | 0 0 | - -13 Princeville * | 12,698 -36.1 | 0 0 | 0 0 | - -14 Dillingham Field (USA) | - - | - - | - - | 74,800 -3.415 Ford Island (USN) | - - | - - | - - | 39,671 -24.816 Port Allen | - - | - - | - - | - -
===== == ===================== | ============ ======== | ============ ======== | ============ ======== | ============== ========| | | |
Total Statewide | 37,547,332 2.2 | 486,944 6.8 | 111,103 -0.1 | 985,769 0.05 (all airports) | | | |
Including transits.
Statewide* Leased by the State of Hawaii. Cargo + Mail
(U.S. tons)CY = Calendar Year (Jan. - Dec.)
1996 1995 % changeSource: State of Hawaii --------------------- --------------- -- --------------------- Department of Transportation 598,047 566,988 5.5% Airports Division Honolulu International Airport 400 Rodgers Boulevard, Suite 700 Honolulu, Hawaii 96819-1880
3-20-97Revised 4-10-97.

FINAL CALENDAR YEAR 1995 Air Traffic Statistics
| PASSENGERS % change | CARGO % change | MAIL % change | AIRCRAFT % change| | | | OPERATIONS| CY 1995 | CY 1995 | CY 1995 | CY 1995| vs. | (U.S. vs. | (U.S. vs. | (takeoffs + vs.
AIRPORT | CY 1994 | tons) CY 1994 | tons) CY 1994 | landings) CY 1994==== = ================= | ========== ======= | ========== ======= | ========== ======= | ============ =======
| | | |1 Honolulu International | 23,672,894 2.9 | 362,037 -3.2 | 97,372 -1.5 | 373,926 4.0%2 Hilo International | 1,627,715 1.5 | 24,377 -2.6 | 3,264 -0.7 | 84,917 -1.6%3 Upolu | 0 0 | 0 0 | 0 0 | - -4 Waimea-Kohala | 2,845 -4.1 | 18 50.0 | 0 0 | - -5 Keahole-Kona International | 2,303,455 2.9 | 19,512 -16.9 | 2,710 -3.9 | 73,537 10.7%6 Kahului | 6,054,761 4.9 | 34,992 0.3 | 5,176 0.1 | 179,883 0.4%7 Hana | 12,719 -7.5 | 1 100.0 | 0 0 | - -8 Kapalua | 147,298 -21.9 | 787 19.1 | 0 0 | - -9 Molokai | 243,131 -4.1 | 559 2.0 | 82 -17.2 | 45,517 18.6%
10 Kalaupapa | 11,977 -16.1 | 0 -100.0 | 0 0 | - -11 Lanai | 169,682 -0.9 | 595 -14.0 | 66 78.4 | - -12 Lihue | 2,470,487 7.4 | 12,887 -4.3 | 2,553 0.1 | 97,400 6.4%13 Princeville * | 19,860 -28.9 | 0 0 | 0 0 | - -14 Dillingham Field (USA) | - - | - - | - - | 77,414 -6.7%15 Ford Island (USN) | - - | - - | - - | 52,731 1.5%16 Port Allen | - - | - - | - - | - -
==== = ================= | ========== ======= | ========== ======= | ========== ======= | ============ =======| | | |
Total Statewide | 36,736,824 3.2 | 455,765 -3.6 | 111,223 -1.5 | 985,325 3.0% (all airports) | | | |
Including transits.
* Privately-owned airport. StatewideCargo + Mail
CY = Calendar Year (Jan. - Dec.) (U.S. tons)
Source: State of Hawaii 1995 1994 % change Department of Transportation ----------------- ------------ - ----------------- Airports Division, AIR-EP 566,988 585,834 -3.2% Honolulu International Airport 400 Rodgers Boulevard, Suite 700 Honolulu, Hawaii 96819-1880
3-25-96
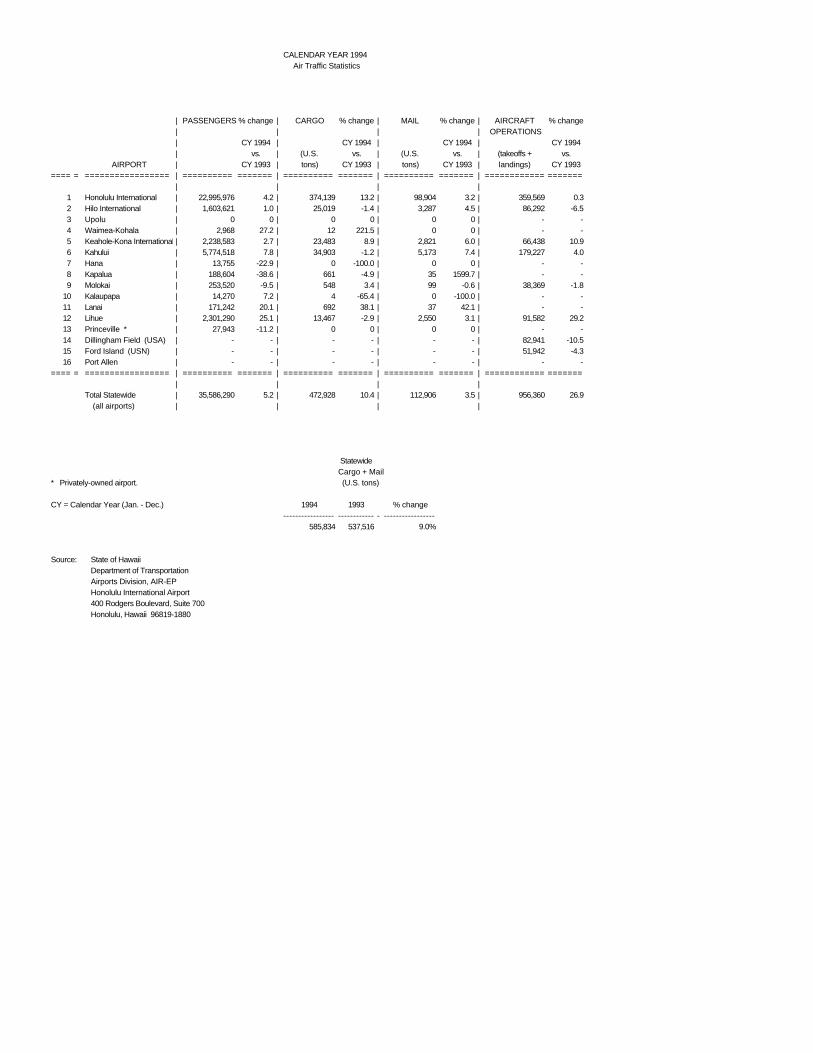
CALENDAR YEAR 1994 Air Traffic Statistics
| PASSENGERS % change | CARGO % change | MAIL % change | AIRCRAFT % change| | | | OPERATIONS| CY 1994 | CY 1994 | CY 1994 | CY 1994| vs. | (U.S. vs. | (U.S. vs. | (takeoffs + vs.
AIRPORT | CY 1993 | tons) CY 1993 | tons) CY 1993 | landings) CY 1993==== = ================= | ========== ======= | ========== ======= | ========== ======= | ============ =======
| | | |1 Honolulu International | 22,995,976 4.2 | 374,139 13.2 | 98,904 3.2 | 359,569 0.32 Hilo International | 1,603,621 1.0 | 25,019 -1.4 | 3,287 4.5 | 86,292 -6.53 Upolu | 0 0 | 0 0 | 0 0 | - -4 Waimea-Kohala | 2,968 27.2 | 12 221.5 | 0 0 | - -5 Keahole-Kona International | 2,238,583 2.7 | 23,483 8.9 | 2,821 6.0 | 66,438 10.96 Kahului | 5,774,518 7.8 | 34,903 -1.2 | 5,173 7.4 | 179,227 4.07 Hana | 13,755 -22.9 | 0 -100.0 | 0 0 | - -8 Kapalua | 188,604 -38.6 | 661 -4.9 | 35 1599.7 | - -9 Molokai | 253,520 -9.5 | 548 3.4 | 99 -0.6 | 38,369 -1.8
10 Kalaupapa | 14,270 7.2 | 4 -65.4 | 0 -100.0 | - -11 Lanai | 171,242 20.1 | 692 38.1 | 37 42.1 | - -12 Lihue | 2,301,290 25.1 | 13,467 -2.9 | 2,550 3.1 | 91,582 29.213 Princeville * | 27,943 -11.2 | 0 0 | 0 0 | - -14 Dillingham Field (USA) | - - | - - | - - | 82,941 -10.515 Ford Island (USN) | - - | - - | - - | 51,942 -4.316 Port Allen | - - | - - | - - | - -
==== = ================= | ========== ======= | ========== ======= | ========== ======= | ============ =======| | | |
Total Statewide | 35,586,290 5.2 | 472,928 10.4 | 112,906 3.5 | 956,360 26.9 (all airports) | | | |
StatewideCargo + Mail
* Privately-owned airport. (U.S. tons)
CY = Calendar Year (Jan. - Dec.) 1994 1993 % change----------------- ------------ - -----------------
585,834 537,516 9.0%
Source: State of Hawaii Department of Transportation Airports Division, AIR-EP Honolulu International Airport 400 Rodgers Boulevard, Suite 700 Honolulu, Hawaii 96819-1880

STATE DEPARTMENT OF TRANSPORTATION AIRPORTS DIVISION AIRPORT ACTIVITY STATISTICS CALENDAR YEAR 2003
OVERSEAS
| PASSENGERS | CARGO (U.S. tons) | MAIL (U.S. tons)-------------------------- | ------------------------- ------------------------- | ----------------------- ----------------------- | ----------------------- -----------------------
| Enplaned Deplaned | Enplaned Deplaned | Enplaned Deplaned| | |
Honolulu | 5,637,009 5,566,407 | 171,508 173,899 | 35,076 46,479Kahului | 1,271,118 1,282,431 | 15,699 8,184 | 773 35Kona | 321,379 397,057 | 9,058 2,127 | 433 1Lihue | 243,062 246,263 | 0 118 | 0 0Hilo | 0 114 | 0 0 | 0 0-------------------------- | ------------------------- ------------------------- | ----------------------- ----------------------- | ----------------------- -----------------------TOTAL | 7,472,568 7,492,272 | 196,265 184,328 | 36,282 46,515HNL transit 125,253
INTRASTATE
| PASSENGERS | CARGO (U.S. tons) | MAIL (U.S. tons)-------------------------- | ------------------------- ------------------------- | ----------------------- ----------------------- | ----------------------- -----------------------
| Enplaned Deplaned | Enplaned Deplaned | Enplaned Deplaned| | |
Honolulu | 3,642,671 3,719,548 | 50,022 20,928 | 14,378 3,033Kahului | 1,414,088 1,414,634 | 6,134 18,101 | 1,547 7,557Kona | 948,007 876,123 | 4,670 9,981 | 656 3,620Lihue | 1,001,742 996,728 | 3,691 10,908 | 850 1,728Hilo | 599,635 596,901 | 7,555 11,033 | 6 1,302Upolu | 0 2 | 0 0 | 0 0Waimea-Kohala | 3,437 3,237 | 1 24 | 0 137Hana | 3,863 3,810 | 23 61 | 0 0Kapalua | 47,569 48,027 | 285 337 | 0 0Molokai | 97,180 100,163 | 617 815 | 19 39Kalaupapa | 5,947 5,097 | 17 174 | 0 9Lanai | 56,406 56,275 | 79 732 | 2 33Dillingham (USA) | 0 0 | 0 0 | 0 0-------------------------- | ------------------------- ------------------------- | ----------------------- ----------------------- | ----------------------- -----------------------TOTAL | 7,820,545 7,820,545 | 73,094 73,094 | 17,458 17,458
AIRCRAFT OPERATIONS
General TOTAL Air Carrier Air Taxi Aviation Military OPERATIONS
Honolulu 165,406 46,012 74,293 16,208 301,919Kahului 47,295 76,261 24,169 3,833 151,558Kona 22,317 14,524 66,798 15,571 119,210Lihue 23,833 48,767 19,961 5,015 97,576Hilo 12,829 47,774 28,163 10,649 99,415Molokai 656 27,116 11,450 1,722 40,944Kalaeloa 0 1,162 141,397 23,601 166,160
Civilian Powered Glider Military TOTAL Dillingham 46,947 26,084 3,907 76,938
Deleted Princeville * and * Leased by the State of Hawaii.
CY = Calendar Year (Jan. - Dec.)
Ford Island, Calendar Year 1998 50,441
6-30-99 Ford Island (USN) closed.7-1-99 Kalaeloa owned by the State of Hawaii.
AIR-PS

STATE DEPARTMENT OF TRANSPORTATION
Honolulu Kahului Kona Lihue Hilo
TOTAL HNL transit
Honolulu Kahului Kona Lihue Hilo Upolu Waimea·Kohala Hana Kapalua Molokai Kalaupapa Lanai Dillingham (USA} Princeville •
TOTAL
Honolulu Kahului Kona Lihue Hilo Molokai Kalaeloa
Dillingham
PASSENGERS
Enplaned
5,781,553 1,067,849
275,062 138,951
0
7,263,415 275,853
PASSENGERS
Enplaned
4,496,754 1,4-49,602 1,05<1,349 1,200,676
733,107 0
1,242 2,933
47,609 106,898
1,295 72,714
0 3
9,169,162
Air Carrier
186,000 55,937 27,183 30,593 19,450 1,138
0
Civilian Powered 51,437
• Leased by the State of Hawaii.
CY • Calendar Year (Jan. • Dec.)
Ford Island, Calendar Year 1998 50,4-41
6·30-99 Ford Island (USN) closed.
AIRPORTS DIVISION AIRPORT ACTIVITY STATISTICS
CALENDAR YEAR 2001
OVERSEAS
I CARGO (U.S. tons) I I I
Deplaned I Enplaned Deplaned I I I
5,691,752 I 107,781 94,939 1 1,079,0151 7,919 5,511 I
356,118 1 5,778 1,785 1 143,485 1 0 59 I
162 I 0 0 1 I I
7,270,532 I 121,478 102,294 1
INTRASTATE
I CARGO (U.S. tons) I I I
Deplaned I Enplaned Deplaned I I I
3,904,023 I .. 8.099 25,121 1 2,132,627 I 6,135 17,321 1
95<1,789 I 4,223 9,754 1 1,195,805 I 3,490 9,995\
747,329 I 12,187 10,907 I 01 0 01
1,230 I 0 1 I 2,781 1 51 16 I
47,781 1 278 3041 108,740 I 486 8361
1,252 I 15 110 I 72,822 1 73 612 I
OJ 0 OJ 31 0 01
I I 9,169,162 I 75,037 75,037 1
AIRCRAFT OPERATIONS
General Air Taxi Aviation Military
37,676 86,283 17,047 69,635 31,816 2,936 10,926 55,094 1 ... 590 55,586 12,230 5,246 42,426 25,077 9 ,285 26,890 12,532 3,246
284 159,631 23,705
Glider Military 27,221 2,365
7-1-99 Kalaeloa owned by the State of Hawaii.
AIR-PS 6-2().()2
MAIL (U.S. tons)
Enplaned Deplaned
23,331 51 ,147 1,133 136
876 8 0 0 0 0
25,340 51 .291
MAIL (U.S. tons)
Enplaned Deplaned
16,306 5,115 1,977 7,176
948 4,077 975 2,270
1,126 2 ,415 0 0
69 278 0 0 0 0
22 62 1 3 9 37 0 0 0 0
21,433 21,433
TOTAL OPERATIONS
327,006 160,324 107,793 103,655 96,238 43,806
183,600
TOTAL 81 ,023
CIVIL+ MILITARY
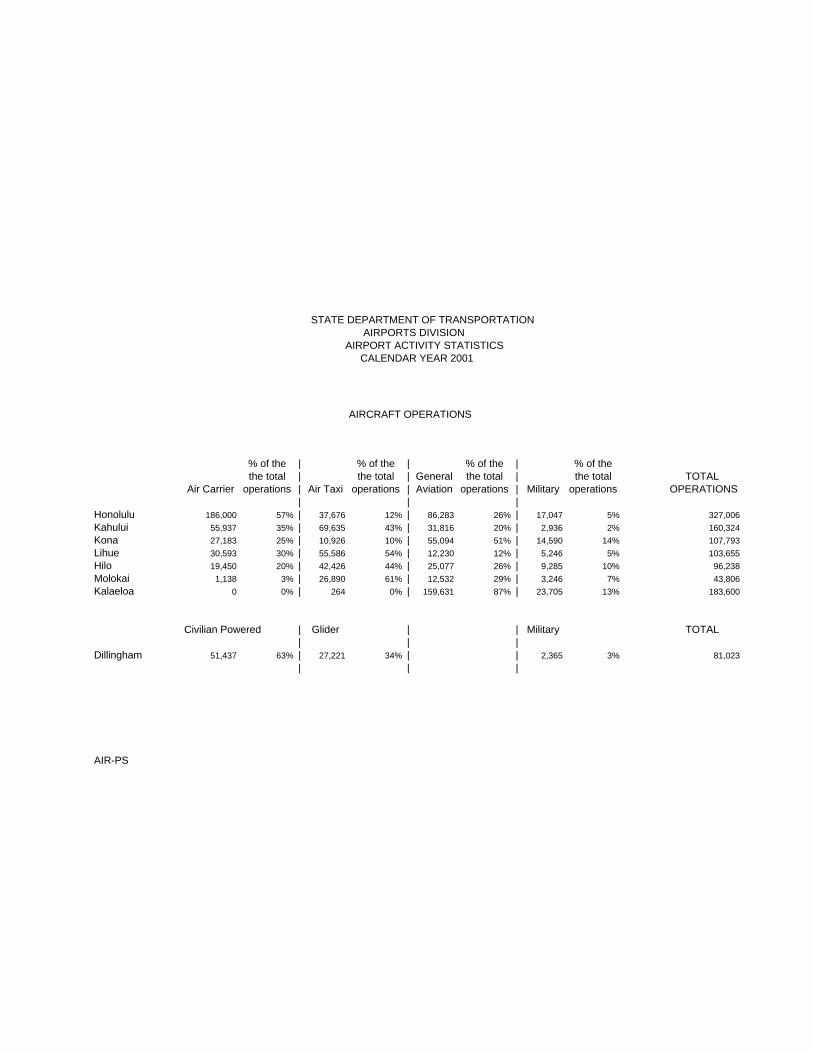
STATE DEPARTMENT OF TRANSPORTATION AIRPORTS DIVISION AIRPORTS DIVISION AIRPORT ACTIVITY STATISTICS CALENDAR YEAR 1998 CALENDAR YEAR 2001
AIRCRAFT OPERATIONS
% of the | % of the | % of the | % of thethe total | the total | General the total | the total TOTAL
Air Carrier operations | Air Taxi operations | Aviation operations | Military operations OPERATIONS| | |
Honolulu 186,000 57% | 37,676 12% | 86,283 26% | 17,047 5% 327,006Kahului 55,937 35% | 69,635 43% | 31,816 20% | 2,936 2% 160,324Kona 27,183 25% | 10,926 10% | 55,094 51% | 14,590 14% 107,793Lihue 30,593 30% | 55,586 54% | 12,230 12% | 5,246 5% 103,655Hilo 19,450 20% | 42,426 44% | 25,077 26% | 9,285 10% 96,238Molokai 1,138 3% | 26,890 61% | 12,532 29% | 3,246 7% 43,806Kalaeloa 0 0% | 264 0% | 159,631 87% | 23,705 13% 183,600
Civilian Powered | Glider | | Military TOTAL | | |
Dillingham 51,437 63% | 27,221 34% | | 2,365 3% 81,023| | |
AIR-PS

STATE DEPARTMENT OF TRANSPORTATION
Honolulu Kahului Kona Lihue Hilo
TOTAL HNL transit
Honolulu Kahului Kona LihUe Hllo Upotu Waimea-Kohala Hana Kapalua Motollai Kalaupapa Lanai Dillingham (USA) Princeville •
TOTAL
Honolulu Kahufui Kona Lihue Hilo Molokai Kalaeloa
Dillingham
Ford Island
PASSENGERS
Enplaned
6,642,705 965,586 254,670
96,364 0
?.959,325 407,359
PASSENGERS
Enplaned
4,629,187 2.1~.703 1,194,754 1,345,787
783,254 0
2 ,283 3 ,779
61 ,695 126,810
3 ,110 81,o409
0 4
10,378,775
/WCanier
206,870 63,799 29,561 33,645 22,266
1,484 0
Civlian Powered 54,346
• Leased by the State of Hawaii.
CY • Calendar Year (Jan. - Dec.)
Ford Island , Calendar Year 1998 50,441
6-30-99 Ford Island (USN) closed.
AIRPORTS DIVISION AIRPORT ACTIVITY STATISTICS
CALENDAR YEAR 2000
OVERSEAS
I CARGO (U.S. tons) I I I
Deplaned I Enplaned Deplaned I I I
6,553,097 I 165,247 151.299 1 1,009,205 I 7,390 6 ,688 I
316,211 I 7,244 2,180 1 103,127 I 0 841
01 0 01 I I
7,981 ,640 1 179,881 160.251 1
INTRASTATE
I CARGO (U.S. tons) I I I
Deplaned I Enplaned Deplaned I I I
4,795,326 1 46,543 26,118 1 2,080,900 1 6,147 17,872 1 1,076,462 888 4,911 1 1,338.243 4,827 10,373 1
805,473 11 ,909 9,896 I 0 0 01
2,322 5 15 I 3,533 25 10 I
60,966 273 316 I 131 ,165 485 847 I
2,981 12 190 I 81 ,383 76 642 I
0 0 o I 21 0 01
I 10,378,775 71 ,190 71 ,190 1
AIRCRAFT OPERATIONS
General Air Taxi Aviation Military
31,539 91,484 .15,878 77,779 29,983 3,294
9,547 47,021 11 ,923 57,883 17,800 4,522 48,680 32,908 11,692 27,385 11 ,869 3,953
532 133,466 26,159
Glider Military 27,287 3,158
7-1-99 Kalaeloa owned by the State of Hawaii.
AIR-PS
MAIL (U.S. tons)
Enplaned Deplaned
28.n3 55,166 641 32 326 0
0 0 0 0
29,740 55,198
MAIL (U.S. tons)
Enplaned Deplaned
20,158 3 ,538 2,730 7,607 1,213 4,91 1 4,827 10,457 1,169 2,547
0 0 8 733 0 0
273 316 5 171 0 5 1 99 0 0 0 0
30,384 30,384
TOTAL OPERATIONS ........_
345,771 174,855 98,052
113,850 115,546 44,691
160,157
TOTAL 84,791
CML +MILITARY

-"""""" """' ....... --""""""
"'"""'
%ofN I ....... , I
$TAT£ OEPAA'I'MEHT OF TRAN$POAl ATI()H AIRPORTS DMSION
AIAP()Al ACnYITY $TAT1STtCS CAl.EHOAA YEAR 2000
AIRCRAFT OPEAATJONS
....... I .... .,. ....... , I Goooool ....... , I I """" ... _ 1-JtC.Iflet cpetalbnt I Nt TU opeu1i0nt I A""liOn cpete--.. I Mlil6ly operadone
I
""""' ... I """ ...... - I "·"' ..... , ... I .... , ...... -I ., .... ...... , .. I ...... ..... "'I """ " ""I ... ¢MI~tn Powtt-811 I Glidtt
I s.t.M .. '!1. I n#
I
I .. I "" I ... I ''"I "" I t1"' 1 "' I
I I
"" I I
...... ...... """ ...... ....,. " ... , ......
I "" I
,...,. '"' I
..,.. ... I """' "" I
. .... "" I ...... "" I ...., ... I ... ...
I I I l.Hit I
•• "' ,.,. •• "'" .. ""
.. .. ,. t1ol,856 ..... t tl.OSO .. ..... ..... . 180..157
TOTAL

STATE DEPARTMENT OF TRANSPORTATION AIRPORTS DIVISION AIRPORT ACTIVITY STATISTICS CALENDAR YEAR 1999
OVERSEAS
| PASSENGERS | CARGO (U.S. tons) | MAIL (U.S. tons)------------------------ | --------------------- --------------------- | --------------------- --------------------- | --------------------- ---------------------
| Enplaned Deplaned | Enplaned Deplaned | Enplaned Deplaned| | |
Honolulu | 6,604,650 6,392,667 | 193,282 171,115 | 29,267 55,487Kahului | 854,706 969,881 | 6,945 5,937 | 1,102 1Kona | 198,599 253,630 | 7,070 2,562 | 336 0Lihue | 79,539 83,498 | 0 100 | 0 0Hilo | 0 0 | 42 0 | 0 0------------------------ | --------------------- --------------------- | --------------------- --------------------- | --------------------- ---------------------TOTAL | 7,737,494 7,699,676 | 207,339 179,714 | 30,705 55,488HNL transit 376,236
INTRASTATE
| PASSENGERS | CARGO (U.S. tons) | MAIL (U.S. tons)------------------------ | --------------------- --------------------- | --------------------- --------------------- | --------------------- --------------------
| Enplaned Deplaned | Enplaned Deplaned | Enplaned Deplaned| | |
Honolulu | 4,493,189 4,693,657 | 41,221 24,858 | 18,381 5,496Kahului | 2,129,704 2,017,788 | 5,324 14,911 | 2,263 7,592Kona | 1,166,265 1,049,688 | 5,513 8,172 | 805 4,748Lihue | 1,306,322 1,303,694 | 5,328 10,066 | 1,053 2,373Hilo | 778,771 808,154 | 10,906 8,980 | 1,193 2,491Upolu | 3 0 | 0 0 | 0 0Waimea-Kohala | 931 906 | 5 20 | 147 873Hana | 4,184 3,909 | 42 11 | 0 0Kapalua | 68,336 66,966 | 277 360 | 0 0Molokai | 132,540 137,212 | 441 967 | 35 204Kalaupapa | 4,150 3,996 | 15 174 | 1 3Lanai | 88,598 87,043 | 112 665 | 15 113Dillingham (USA) | 0 0 | 0 0 | 0 0Princeville * | 76 56 | 0 0 | 0 0------------------------ | --------------------- --------------------- | --------------------- --------------------- | --------------------- --------------------TOTAL | 10,173,069 10,173,069 | 69,184 69,184 | 23,893 23,893
AIRCRAFT OPERATIONS
General TOTAL Air Carrier Air Taxi Aviation Military OPERATIONS
Honolulu 197,839 36,985 91,743 20,042 346,609Kahului 62,883 92,569 29,575 3,358 188,385Kona 27,500 8,860 37,588 9,007 82,955Lihue 33,173 58,778 18,995 4,577 115,523Hilo 22,189 51,875 33,248 8,508 115,820Molokai 1,469 30,286 14,169 3,260 49,184Kalaeloa 0 27 64,160 11,106 75,293
Civilian Powered Glider Military TOTAL Dillingham 47,269 22,537 1,910 71,716
CIVIL + MILITARYFord Island 29,128
* Leased by the State of Hawaii.
CY = Calendar Year (Jan. - Dec.)
Ford Island, Calendar Year 1998 50,441
6-30-99 Ford Island (USN) closed.7-1-99 Kalaeloa owned by the State of Hawaii.
AIR-PS3-23-2000
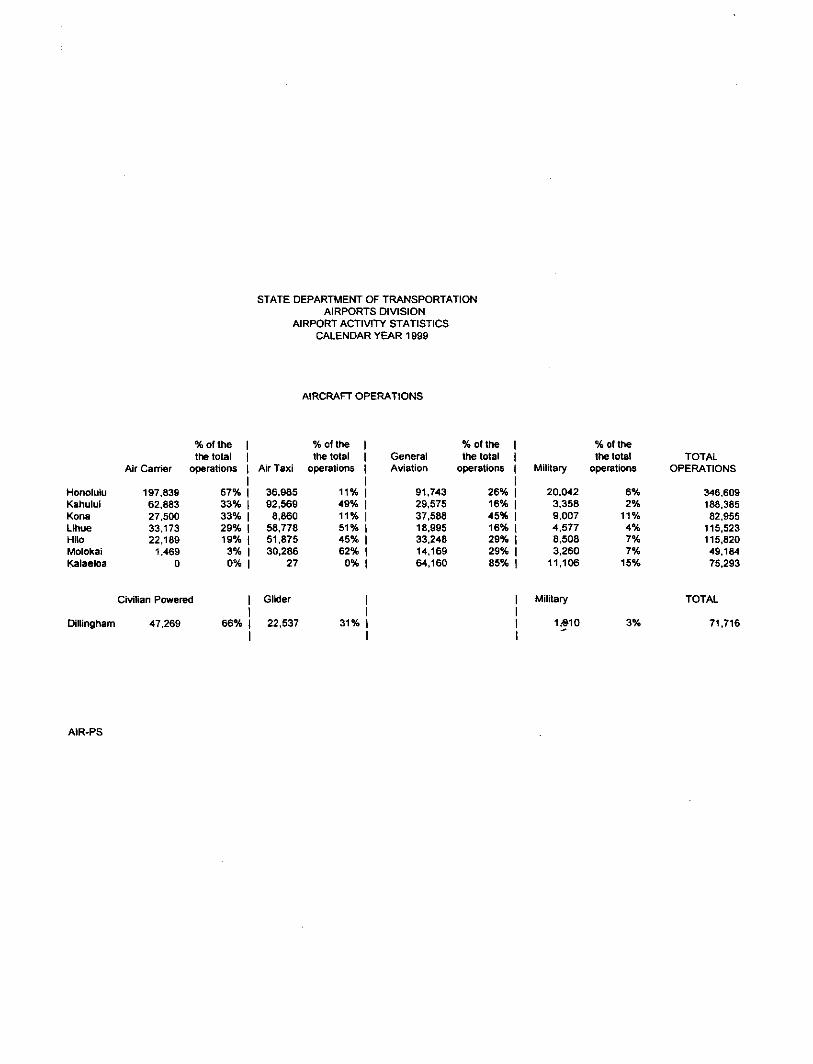
%of the I the total I
Air Carrier operations I I
Honolulu 197,839 57% I Kahului 62,883 33% I Kona 27,500 33% I Lihue 33.173 29% I Hilo 22,189 19% I Molokai 1,469 3% I Kalaeloa 0 0% I
Civilian Powered I I
Dillingham 47,269 66%1 I
AIR-PS
STATE DEPARTMENT OF TRANSPORTATION AIRPORTS DIVISION
AIRPORT ACTIVITY STATISTICS CALENDAR YEAR 1999
AIRCRAFT OPERATIONS
%of the I the total I General
Air Taxi operations I Aviation I
36,985 11% I 91,743 92,569 49% 1 29,575
8,860 11% 1 37,588 58,778 51% I 18,995 51,875 45% I 33,248 30,286 62% I 14,169
27 o% I 64,160
Glider I I
22,537 31% 1 I
%of the I the total I
operations I I
26% I 16% I 45% I 16% I 29% I 29% I 85% I
%of the the total TOTAL
Military operations OPERATIONS
20,042 6% 346,609 3,358 2% 188,385 9,007 11% 82,955 4,577 4% 115,523 8,508 7% 115,820 3,260 7% 49,184
11,106 15% 75,293
Military TOTAL
1:!10 3% 71,716

STATE DEPARTMENT OF TRANSPORTATION AIRPORTS DIVISION AIRPORT ACTIVITY STATISTICS CALENDAR YEAR 1998
OVERSEAS
| PASSENGERS | CARGO (U.S. tons) | MAIL (U.S. tons)------------------------ | --------------------- --------------------- | --------------------- --------------------- | --------------------- ---------------------
| Enplaned Deplaned | Enplaned Deplaned | Enplaned Deplaned| | |
Honolulu | 6,694,626 6,374,715 | 171,892 148,778 | 27,737 53,493Kahului | 837,015 910,058 | 6,804 5,179 | 642 25Kona | 159,291 251,899 | 5,715 1,620 | 70 0Lihue | 37,836 40,316 | 0 21 | 2 1Hilo | 0 0 | 0 0 | 0 0------------------------ | --------------------- --------------------- | --------------------- --------------------- | --------------------- ---------------------TOTAL | 7,728,768 7,576,988 | 184,411 155,598 | 28,451 53,519HNL transit 466,807
INTRASTATE
| PASSENGERS | CARGO (U.S. tons) | MAIL (U.S. tons)------------------------ | --------------------- --------------------- | --------------------- --------------------- | --------------------- --------------------
| Enplaned Deplaned | Enplaned Deplaned | Enplaned Deplaned| | |
Honolulu | 4,429,574 4,670,632 | 41,674 25,137 | 14,950 5,282Kahului | 2,111,692 1,981,652 | 5,587 14,517 | 2,199 7,643Kona | 1,184,128 1,057,637 | 5,323 9,427 | 698 2,226Lihue | 1,283,603 1,278,245 | 5,439 9,321 | 1,041 2,116Hilo | 770,659 788,835 | 11,285 9,357 | 1,092 2,364Upolu | 3 0 | 0 0 | 0 0Waimea-Kohala | 805 796 | 5 11 | 201 440Hana | 4,877 4,605 | 4 0 | 0 0Kapalua | 72,573 72,355 | 237 489 | 0 4Molokai | 124,917 127,675 | 319 888 | 54 121Kalaupapa | 4,546 4,408 | 8 153 | 1 4Lanai | 88,035 88,584 | 136 717 | 38 74Dillingham (USA) | 4 0 | 0 0 | 0 0Princeville * | 32 24 | 0 0 | 0 0------------------------ | --------------------- --------------------- | --------------------- --------------------- | --------------------- --------------------TOTAL | 10,075,448 10,075,448 | 70,017 70,017 | 20,274 20,274
AIRCRAFT OPERATIONS
General TOTAL Air Carrier Air Taxi Aviation Military OPERATIONS
Honolulu 182,795 39,179 90,135 21,937 334,046Kahului 63,336 84,546 29,509 3,499 180,890Kona 27,068 9,346 37,137 7,734 81,285Lihue 30,691 55,953 15,951 3,384 105,979Hilo 21,537 54,894 28,087 7,961 112,479Molokai 1,163 30,080 15,425 2,685 49,353
Civilian Powered Glider Military TOTAL Dillingham 47,025 17,243 3,675 67,943
CIVIL + MILITARYFord Island 50,441
* Leased by the State of Hawaii.
AIR-PS

%of the I the total I
Air Carrier operations I I
Honolulu 182,795 55% I Kahului 63,336 35% 1 Kona 27,058 33% I Lihue 30,691 29% I Hilo 21,537 19% I Molokai 1,163 2% I
Civilian Powered I I
Dillingham 47,025 69% I I
Ford Island
AIR-PS
STATE DEPARTMENT OF TRANSPORTATION AIRPORTS DIVISION
AIRPORT ACTIVITY STATISTICS CALENDAR YEAR 1998
AIRCRAFT OPERATIONS
%of the I the total I General
Air Taxi operations I Aviation I
39,179 12% I 90,135 84,546 47% I 29,509
9,346 11% 1 37,137 55,953 53% I 15,951 54,894 49% I 28,087 30,080 61% I 15,425
Glider I I
17,243 25% I I
%of the I the total I
operations I I
27% I 16% I 46% I 15% 1 25% I 31% I
%of the the total TOTAL
Military operations OPERATIONS
21,937 7% 33<4,046 3,499 2% 180,890 7,73<4 10% 81,285 3,384 3% 105,979 7,961 7% 112,479 2,685 5% 49,353
Military TOTAL
3,675 5% 67,943
CIVIL + MILITARY
50,441

STATE DEPARTMENT OF TRANSPORTATION AIRPORTS DIVISION AIRPORT ACTIVITY STATISTICS CALENDAR YEAR 1997
OVERSEAS
| PASSENGERS | CARGO (U.S. tons) | MAIL (U.S. tons)------------------------ | --------------------- --------------------- | --------------------- --------------------- | --------------------- ---------------------
| Enplaned Deplaned | Enplaned Deplaned | Enplaned Deplaned| | |
Honolulu | 6,941,107 6,740,962 | 201,757 174,411 | 25,437 55,144Kahului | 770,110 828,364 | 6,988 5,772 | 167 23Kona | 157,671 213,268 | 3,750 1,616 | 0 0Lihue | 5,910 5,773 | 0 0 | 2 1Hilo | 0 0 | 0 0 | 0 0------------------------ | --------------------- --------------------- | --------------------- --------------------- | --------------------- ---------------------TOTAL | 7,874,798 7,788,367 | 212,495 181,799 | 25,606 55,168HNL transit 706,030
INTRASTATE
| PASSENGERS | CARGO (U.S. tons) | MAIL (U.S. tons)------------------------ | --------------------- --------------------- | --------------------- --------------------- | --------------------- --------------------
| Enplaned Deplaned | Enplaned Deplaned | Enplaned Deplaned| | |
Honolulu | 4,645,878 4,846,369 | 49,983 29,242 | 10,317 5,284Kahului | 2,208,703 2,070,434 | 8,984 22,122 | 2,195 4,643Kona | 1,175,607 1,081,611 | 7,284 11,966 | 823 1,399Lihue | 1,284,323 1,284,337 | 3,843 9,341 | 934 1,855Hilo | 819,946 849,368 | 15,774 11,966 | 1,251 2,268Upolu | 0 9 | 0 0 | 0 0Waimea-Kohala | 1,300 830 | 54 21 | 48 121Hana | 5,126 4,955 | 1 0 | 0 0Kapalua | 88,485 89,444 | 236 482 | 0 0Molokai | 125,471 126,766 | 263 710 | 31 35Kalaupapa | 4,393 4,232 | 1 6 | 0 0Lanai | 88,777 89,626 | 154 721 | 37 31Princeville * | 90 118 | 0 0 | 0 0------------------------ | --------------------- --------------------- | --------------------- --------------------- | --------------------- --------------------TOTAL | 10,448,099 10,448,099 | 86,577 86,577 | 15,636 15,636
AIRCRAFT OPERATIONS
General TOTAL Air Carrier Air Taxi Aviation Military OPERATIONS
Honolulu 185,557 61,894 87,584 23,749 358,784Kahului 64,599 81,105 25,211 2,427 173,342Kona 27,462 14,954 37,549 7,393 87,358Lihue 29,996 60,267 17,259 3,827 111,349Hilo 21,616 47,229 25,020 7,656 101,521Molokai 1,017 31,290 10,844 1,516 44,667
Civilian Powered Glider Military TOTAL Dillingham 47,018 21,717 3,908 72,643
CIVIL + MILITARYFord Island 39,992
* Leased by the State of Hawaii.
AIR-EP

%of the I the total I
Air Carrier operations I I
Honolulu 185,557 52% 1 Kahului 64,599 37% I Kana 27,462 31% 1 Lihue 29,996 27% 1 Hilo 21,616 21% 1 Molokai 1,017 2% I
Civilian Powered I I
Dillingham 47,018 65% I I
Ford Island
AIR-PS
STATE DEPARTMENT OF TRANSPORTATION AIRPORTS DIVISION
AIRPORT ACTIVITY STATISTICS CALENDAR YEAR 1997
AIRCRAFT OPERATIONS
%of the the total General
Air Taxi operations Aviation
61,894 17% 87,584 81,105 47% 25,211 14,954 17% 37,549 60,267 54% 17,259 47,229 47% 25,020 31,290 70% 10,844
Glider
21,717 30%
%of the I the total I
operations I I
24% I 15% 1 43% I 15% I 25% I 24% I
%of the the total TOTAL
Military operations OPERATIONS
23,749 7% 358,784 2,427 1% 173,342 7,393 8% 87,358 3,827 3% 111,349 7,656 8% 101,521 1,516 3% 44,667
Military TOTAL
3,908 5% 72,643
CIVIL+ MILITARY
39,992

STATE DEPARTMENT OF TRANSPORTATION AIRPORTS DIVISION AIRPORT ACTIVITY STATISTICS CALENDAR YEAR 1996
OVERSEAS
| PASSENGERS | CARGO (U.S. tons) | MAIL (U.S. tons)------------------------ | --------------------- --------------------- | --------------------- --------------------- | --------------------- ---------------------
| Enplaned Deplaned | Enplaned Deplaned | Enplaned Deplaned| | |
Honolulu | 7,186,081 6,773,519 | 167,341 141,060 | 24,327 57,204Kahului | 680,302 768,174 | 7,184 5,776 | 0 0Keahole-Kona | 121,704 154,187 | 3,050 1,573 | 0 0Lihue | 4,533 4,349 | 0 0 | 0 0Hilo | 0 0 | 158 19 | 0 0------------------------ | --------------------- --------------------- | --------------------- --------------------- | --------------------- ---------------------TOTAL | 7,992,620 7,700,229 | 177,733 148,428 | 24,327 57,204HNL transit 690,833
INTRASTATE
| PASSENGERS | CARGO (U.S. tons) | MAIL (U.S. tons)------------------------ | --------------------- --------------------- | --------------------- --------------------- | --------------------- --------------------
| Enplaned Deplaned | Enplaned Deplaned | Enplaned Deplaned| | |
Honolulu | 4,785,165 4,891,139 | 46,743 29,180 | 9,113 5,389Kahului | 2,270,201 2,187,458 | 7,505 19,746 | 2,287 3,641Keahole-Kona | 1,154,761 1,093,750 | 7,358 10,505 | 966 1,482Lihue | 1,276,454 1,276,471 | 3,034 9,279 | 903 1,720Hilo | 795,216 827,527 | 15,363 10,092 | 1,502 2,389Upolu | 0 0 | 0 0 | 0 0Waimea-Kohala | 1,014 852 | 43 46 | 0 0Hana | 5,441 5,258 | 1 0 | 0 0Kapalua | 78,381 78,367 | 200 480 | 0 0Molokai | 121,872 125,605 | 126 555 | 8 76Kalaupapa | 4,216 3,885 | 0 0 | 1 6Lanai | 82,882 85,037 | 19 509 | 6 83Princeville * | 6,222 6,476 | 0 0 | 0 0------------------------ | --------------------- --------------------- | --------------------- --------------------- | --------------------- --------------------TOTAL | 10,581,825 10,581,825 | 80,392 80,392 | 14,786 14,786
AIRCRAFT OPERATIONS
General TOTAL Air Carrier Air Taxi Aviation Military OPERATIONS
Honolulu 203,671 62,516 82,541 23,540 372,268Kahului 67,136 78,722 29,976 2,756 178,590Keahole-Kona 29,195 16,556 21,591 9,683 77,025Lihue 29,246 60,489 12,705 3,892 106,332Hilo 21,109 36,228 22,845 7,680 87,862Molokai 1,003 34,753 10,744 2,721 49,221
* Leased by the State of Hawaii.
AIR-EP

%of the I the total I
Air Carrier operations I I
Honolulu 203,671 55% 1 Kahului 67,136 38% 1 Kona 29,195 38% 1 Lihue 29,246 28% 1 Hila 21,109 24% 1 Molokai 1,003 2% I
Civilian Powered I I
Dillingham 49,670 66% 1 I
Ford Island
AIR-PS
STATE DEPARTMENT OF TRANSPORTATION AIRPORTS DIVISION
AIRPORT ACTIVITY STATISTICS CALENDAR YEAR 1996
AIRCRAFT OPERATIONS
%of the I the total I General
Air Taxi operations I Aviation
I 62,516 17% 1 82.541 78,722 44%1 29,976 16,556 21% I 21,591 60,489 57% I 12,705 36,228 41% I 22,845 34,753 71% 1 10,744
GIK:Ier I I
21,280 28% I I
%of the I the total I
operations I I
22% I 17% 1 28% 1 12% 1 26% 1 22% I
%of the the total TOTAL
Military operations OPERATIONS
23,540 6% 372,268 2,756 2% 178,590 9,683 13% 77,025 3,892 4% 106,332 7,680 9% 87,862 2,721 6% 49,221
Military TOTAL
3,850 5% 74,800
CIVIL+ MILITARY
39,671
STATE DEPARTMENT OF TRANSPORTATION AIRPORTS DIVISION AIRPORT ACTIVITY STATISTICS CALENDAR YEAR 1995
OVERSEAS
| PASSENGERS | CARGO (U.S. tons) | MAIL (U.S. tons)------------------------ | --------------------- --------------------- | --------------------- --------------------- | --------------------- ---------------------
| Enplaned Deplaned | Enplaned Deplaned | Enplaned Deplaned| | |
Honolulu | 6,842,155 6,616,072 | 158,817 130,825 | 24,503 59,049Hilo | 0 0 | 50 0 | 15 0Kahului | 737,044 791,601 | 6,092 5,586 | 10 0Keahole | 113,115 108,972 | 3,423 1,797 | 0 0Lihue | 180 628 | 0 0 | 0 0------------------------ | --------------------- --------------------- | --------------------- --------------------- | --------------------- ---------------------TOTAL | 7,692,494 7,517,273 | 168,382 138,208 | 24,528 59,049HNL transit 750,495
INTRASTATE
| PASSENGERS | CARGO (U.S. tons) | MAIL (U.S. tons)------------------------ | --------------------- --------------------- | --------------------- --------------------- | --------------------- --------------------
| Enplaned Deplaned | Enplaned Deplaned | Enplaned Deplaned| | |
Honolulu | 4,700,528 4,763,644 | 44,339 28,055 | 8,751 5,069Hilo | 803,417 824,298 | 15,121 9,206 | 1,204 2,045Upolu | 0 0 | 0 0 | 0 0Waimea | 1,651 1,194 | 8 10 | 0 0Keahole | 1,051,409 1,029,959 | 5,207 9,085 | 948 1,762Kahului | 2,295,009 2,231,107 | 6,020 17,294 | 2,021 3,145Hana | 6,446 6,273 | 1 0 | 0 0Kapalua | 74,014 73,284 | 249 538 | 0 0Molokai | 121,371 121,760 | 162 397 | 53 29Kalaupapa | 6,211 5,766 | 0 0 | 0 0Lanai | 83,138 86,544 | 6 589 | 0 66Lihue | 1,235,203 1,234,476 | 3,474 9,413 | 846 1,707Princeville * | 9,884 9,976 | 0 0 | 0 0------------------------ | --------------------- --------------------- | --------------------- --------------------- | --------------------- --------------------TOTAL | 10,388,281 10,388,281 | 74,587 74,587 | 13,823 13,823
AIRCRAFT OPERATIONS
General TOTAL Air Carrier Air Taxi Aviation Military OPERATIONS
Honolulu 198,248 71,703 80,522 23,453 373,926Hilo 21,402 33,084 22,384 8,047 84,917Kahului 65,791 80,349 30,691 3,052 179,883Lihue 27,788 56,024 9,597 3,991 97,400Keahole 25,436 17,556 21,444 9,101 73,537Molokai 1,194 30,365 9,460 4,498 45,517
* Privately-owned airport.
AIR-EP 3-25-96

%of the I the total I
Air Carrier operations I I
Honolulu 198,248 53% 1 Kahului 65,791 37% 1 Kona 25,436 35% 1 Lihue 27,788 29% 1 Hilo 21,402 25% 1 Molokai 1,194 3% I
Civilian Powered I I
Dillingham 51,439 66%1 I
Ford Island
AIR-PS
STATE DEPARTMENT OF TRANSPORTATION AIRPORTS DIVISION
AIRPORT ACTIVITY STATISTICS CALENDAR YEAR 1995
AIRCRAFT OPERA liONS
%of the I the total I General
Air Taxi operations I Aviation
I 71,703 19% I 80,522 80,349 45% I 30,691 17,556 24% I 21,444 56,024 58% 1 9,597 33,084 39% I 22,384 30,365 67% I 9,460
Glider I I
22,511 29% 1
I
%of the I the total I
operations I I
22% I 17% 1 29% 1 10% I 26% I 21% I
%of the the total TOTAL
Military operations OPERATIONS
23,453 6% 373,926 3,052 2%, 179,883 9,101 12% 73,537 3,991 4% 97,400 8,047 9% 84,917 4,498 10% 45,517
Military TOTAL
3,464 4% 77,414
CIVIL+ MILITARY
52,731

STATE DEPARTMENT OF TRANSPORTATION AIRPORTS DIVISION AIRPORT ACTIVITY STATISTICS CALENDAR YEAR 1994
OVERSEAS
PASSENGERS CARGO (U.S. tons) MAIL (U.S. tons)------------------ -- --------------------- --------------------- --------------------- --------------------- --------------------- ---------------------
Enplaned Deplaned Enplaned Deplaned Enplaned Deplaned
Honolulu 6,621,058 6,387,930 157,771 144,024 23,961 60,981Hilo 0 0 0 0 0 0Kahului 710,174 771,304 4,533 7,016 0 0Keahole 146,820 150,660 7,239 3,440 0 0Lihue 0 0 0 0 0 0------------------ -- --------------------- --------------------- --------------------- --------------------- --------------------- ---------------------TOTAL 7,478,052 7,309,894 169,543 154,480 23,961 60,981HNL transit 956,926
INTRASTATE
PASSENGERS CARGO (U.S. tons) MAIL (U.S. tons)------------------ -- --------------------- --------------------- --------------------- --------------------- --------------------- --------------------
Enplaned Deplaned Enplaned Deplaned Enplaned Deplaned
Honolulu 4,489,460 4,540,602 45,857 26,487 8,800 5,162Hilo 790,172 813,449 15,518 9,501 1,210 2,077Upolu 0 0 0 0 0 0Waimea 1,513 1,455 4 8 0 0Keahole 981,913 959,190 4,329 8,474 1,038 1,783Kahului 2,173,862 2,119,178 5,104 18,250 1,991 3,182Hana 6,966 6,789 0 0 0 0Kapalua 95,994 92,610 253 407 1 35Molokai 128,466 125,054 168 381 69 29Kalaupapa 7,340 6,930 0 4 0 0Lanai 81,990 89,252 24 668 21 16Lihue 1,149,319 1,151,971 3,195 10,272 852 1,698Princeville * 13,714 14,229 0 0 0 0------------------ -- --------------------- --------------------- --------------------- --------------------- --------------------- --------------------TOTAL 9,920,709 9,920,709 74,452 74,452 13,982 13,982
AIRCRAFT OPERATIONS
General TOTAL Air Carrier Air Taxi Aviation Military OPERATIONS
Honolulu 193,615 56,067 87,986 21,901 359,569Hilo 21,194 36,564 20,519 8,015 86,292Kahului 56,393 85,373 33,292 4,169 179,227Lihue 24,133 54,199 7,674 5,576 91,582Keahole 24,923 14,460 21,003 6,052 66,438Molokai 1,445 25,637 8,452 2,835 38,369
* Privately-owned airport.
AIR-EP

STATE DEPARTMENT OF TRANSPORTATION AIRPORTS DIVISION
AIRPORT ACTIVITY STATISTICS CALENDAR YEAR 1994
AIRCRAFT OPERATIONS
% of the | % of the | % of the | % of thethe total | the total | General the total | the total TOTAL
Air Carrier operations | Air Taxi operations | Aviation operations | Military operations OPERATIONS| | |
Honolulu 193,615 54% | 56,067 16% | 87,986 24% | 21,901 6% 359,569Kahului 56,393 31% | 85,373 48% | 33,292 19% | 4,169 2% 179,227Kona 24,923 38% | 14,460 22% | 21,003 32% | 6,052 9% 66,438Lihue 24,133 26% | 54,199 59% | 7,674 8% | 5,576 6% 91,582Hilo 21,194 25% | 36,564 42% | 20,519 24% | 8,015 9% 86,292Molokai 1,445 4% | 25,637 67% | 8,452 22% | 2,835 7% 38,369
Civilian Powered | Glider | | Military TOTAL | | |
Dillingham 53,391 64% | 24,774 30% | | 4,776 6% 82,941| | |
CIVIL + MILITARY
Ford Island 51,942
AIR-PS

STATE DEPARTMENT OF TRANSPORTATION AIRPORTS DIVISION AIRPORT ACTIVITY STATISTICS CALENDAR YEAR 1993
OVERSEAS
PASSENGERS CARGO (U.S. tons) MAIL (U.S. tons)------------------ -- --------------------- --------------------- --------------------- --------------------- --------------------- ---------------------
Enplaned Deplaned Enplaned Deplaned Enplaned Deplaned
Honolulu 6,147,034 6,102,968 141,643 117,274 26,162 56,485Hilo 86 86 0 0 0 0Kahului 610,124 666,067 5,581 7,004 0 0Keahole 145,980 150,796 6,269 3,300 0 0Lihue 4,012 4,654 158 180 0 0------------------ -- --------------------- --------------------- --------------------- --------------------- --------------------- ---------------------TOTAL 6,907,236 6,924,571 153,651 127,758 26,162 56,485HNL transit 1,298,684
INTRASTATE
PASSENGERS CARGO (U.S. tons) MAIL (U.S. tons)------------------ -- --------------------- --------------------- --------------------- --------------------- --------------------- --------------------
Enplaned Deplaned Enplaned Deplaned Enplaned Deplaned
Honolulu 4,251,863 4,261,404 46,928 24,749 8,163 5,014Hilo 785,043 802,227 15,044 10,322 1,164 1,983Upolu 0 0 0 0 0 0Waimea 1,128 1,205 1 2 0 0Keahole 952,901 929,385 4,062 7,934 1,009 1,659Kahului 2,044,021 2,037,827 4,999 17,738 1,937 2,878Hana 8,987 8,854 0 2 0 0Kapalua 156,712 150,651 190 504 1 1Molokai 139,012 141,032 149 382 85 14Kalaupapa 6,878 6,431 0 10 0 0Lanai 71,220 71,375 33 468 23 3Lihue 911,993 918,968 2,121 11,416 821 1,651Princeville * 15,562 15,961 0 0 0 0------------------ -- --------------------- --------------------- --------------------- --------------------- --------------------- --------------------TOTAL 9,345,320 9,345,320 73,527 73,527 13,203 13,203
AIRCRAFT OPERATIONS
General TOTAL Air Carrier Air Taxi Aviation Military OPERATIONS
Honolulu 185,959 53,742 96,504 22,300 358,505Hilo 20,779 34,886 23,999 12,633 92,297Kahului 51,648 77,212 37,097 6,308 172,265Lihue 20,139 33,751 7,053 9,967 70,910Keahole 25,353 10,697 18,326 5,528 59,904Molokai 100 26,512 9,465 2,980 39,057
* Privately-owned airport.
AIR-EP

STATE DEPARTMENT OF TRANSPORTATION AIRPORTS DIVISION AIRPORT ACTIVITY STATISTICS CALENDAR YEAR 1992
OVERSEAS
PASSENGERS CARGO (U.S. tons) MAIL (U.S. tons)------------------ -- --------------------- --------------------- --------------------- --------------------- --------------------- ---------------------
Enplaned Deplaned Enplaned Deplaned Enplaned Deplaned
Honolulu 6,269,504 6,399,543 140,360 139,232 19,628 33,018Hilo 0 167 215 33 0 2Kahului 627,604 654,193 7,503 8,670 6 6Keahole 137,803 141,192 4,242 3,633 0 0Lihue 52,552 53,550 292 1,261 0 0------------------ -- --------------------- --------------------- --------------------- --------------------- --------------------- ---------------------TOTAL 7,087,463 7,248,645 152,612 152,829 19,634 33,026HNL transit 1,318,044
INTRASTATE
PASSENGERS CARGO (U.S. tons) MAIL (U.S. tons)------------------ -- --------------------- --------------------- --------------------- --------------------- --------------------- --------------------
Enplaned Deplaned Enplaned Deplaned Enplaned Deplaned
Honolulu 4,298,495 4,322,602 51,153 23,268 8,028 4,753Hilo 773,327 800,320 14,228 10,580 1,153 1,964Upolu 0 0 2 2 0 0Waimea 7,197 6,814 0 2 0 0Keahole 957,567 925,374 3,657 8,234 970 1,609Kahului 1,952,964 1,947,749 5,360 18,738 1,740 2,800Hana 11,178 11,035 0 10 0 0Kapalua 167,064 166,461 183 510 0 0Molokai 156,041 158,448 272 792 78 17Kalaupapa 6,806 6,722 0 21 0 0Lanai 69,171 69,501 66 1,612 26 10Lihue 1,145,729 1,130,436 2,035 13,187 802 1,644Princeville * 22,895 22,972 0 0 0 0------------------ -- --------------------- --------------------- --------------------- --------------------- --------------------- --------------------TOTAL 9,568,434 9,568,434 76,956 76,956 12,797 12,797
AIRCRAFT OPERATIONS
General TOTAL Air Carrier Air Taxi Aviation Military OPERATIONS
Honolulu 202,559 58,782 113,623 28,664 403,628Hilo 21,426 37,182 21,593 10,854 91,055Kahului 57,159 68,832 47,281 5,480 178,752Lihue 29,564 48,387 16,172 9,563 103,686Keahole 29,477 9,200 21,066 4,196 63,939Molokai 148 23,644 9,553 2,317 35,662
* Privately-owned airport.
September 11, 1992 -- Hurricane Iniki hits Kauai. The hurricane prompted an emergency landing in Hilo of 167 overseas passengers who were traveling from the continental United States to Honolulu, Hawaii.
New -- presenting Kapalua-West Maui Airport and Princeville separately in the CY 1992 summary.
AIR-EP

STATE DEPARTMENT OF TRANSPORTATION AIRPORTS DIVISION AIRPORT ACTIVITY STATISTICS CALENDAR YEAR 1991
OVERSEAS
PASSENGERS CARGO (U.S. tons) MAIL (U.S. tons)------------------ -- --------------------- --------------------- --------------------- --------------------- --------------------- ---------------------
Enplaned Deplaned Enplaned Deplaned Enplaned Deplaned
Honolulu 6,457,548 6,341,675 142,674 158,211 16,829 22,135Hilo 0 0 218 117 0 0Kahului 551,558 580,305 6,511 8,351 0 6Keahole 128,630 134,006 3,515 3,068 0 0Lihue 77,587 79,609 270 1,268 0 0------------------ -- --------------------- --------------------- --------------------- --------------------- --------------------- ---------------------TOTAL 7,215,323 7,135,595 153,188 171,015 16,829 22,141HNL transit 1,020,464
INTRASTATE
PASSENGERS CARGO (U.S. tons) MAIL (U.S. tons)------------------ -- --------------------- --------------------- --------------------- --------------------- --------------------- --------------------
Enplaned Deplaned Enplaned Deplaned Enplaned Deplaned
Honolulu 4,195,036 4,209,871 47,596 21,616 7,143 4,685Hilo 709,223 730,588 14,359 10,505 1,165 1,756Upolu 0 3 2 5 0 0Waimea 7,275 6,374 1 3 0 0Keahole 941,346 914,795 3,209 8,478 945 1,480Kahului 1,812,791 1,797,247 4,890 18,088 1,690 2,527Hana 11,829 11,854 0 25 0 0Kaanapali * 0 0 0 0 0 0Molokai 156,890 159,686 367 587 69 31Kalaupapa 7,421 7,440 1 25 0 0Lanai 63,125 64,332 63 1,542 15 2Lihue 1,270,073 1,269,480 1,411 10,699 809 1,355Others * 193,567 196,906 153 479 0 0------------------ -- --------------------- --------------------- --------------------- --------------------- --------------------- --------------------TOTAL 9,368,576 9,368,576 72,052 72,052 11,836 11,836
AIRCRAFT OPERATIONS
General TOTAL Air Carrier Air Taxi Aviation Military OPERATIONS
Honolulu 196,037 65,390 113,799 28,340 403,566Hilo 19,596 38,504 20,802 9,304 88,206Kahului 51,668 74,410 49,717 5,062 180,857Lihue 30,825 64,341 11,027 6,486 112,679Keahole 26,478 11,069 15,265 3,328 56,140Molokai 124 35,304 10,367 2,103 47,898
* Privately-owned airports.

STATE DEPARTMENT OF TRANSPORTATION AIRPORTS DIVISION AIRPORT ACTIVITY STATISTICS CALENDAR YEAR 1990
OVERSEAS
PASSENGERS CARGO (U.S. tons) MAIL (U.S. tons)------------------ -- --------------------- --------------------- --------------------- --------------------- --------------------- ---------------------
Enplaned Deplaned Enplaned Deplaned Enplaned Deplaned
Honolulu 6,837,726 6,549,459 138,797 157,376 16,011 19,099Hilo 0 0 177 83 0 0Kahului 550,169 567,073 5,418 7,748 0 0Keahole 109,947 119,265 3,012 2,436 0 0Lihue 64,314 74,838 259 1,219 0 0------------------ -- --------------------- --------------------- --------------------- --------------------- --------------------- ---------------------TOTAL 7,562,156 7,310,635 147,663 168,862 16,011 19,099HNL transit 1,065,408
INTRASTATE
PASSENGERS CARGO (U.S. tons) MAIL (U.S. tons)------------------ -- --------------------- --------------------- --------------------- --------------------- --------------------- --------------------
Enplaned Deplaned Enplaned Deplaned Enplaned Deplaned
Honolulu 4,445,160 4,470,017 49,309 20,979 6,786 4,529Hilo 721,104 739,506 14,247 10,887 1,231 1,680Upolu 5 8 0 7 0 0Waimea 7,312 7,187 100 39 0 0Keahole 987,598 961,886 3,159 8,683 922 1,379Kahului 1,920,221 1,899,508 3,883 18,770 1,616 2,501Hana 11,216 11,005 0 34 0 0Kaanapali * 0 0 0 0 0 0Molokai 164,472 166,777 328 455 65 26Kalaupapa 6,315 5,929 0 4 0 0Lanai 56,240 56,599 31 579 6 0Lihue 1,358,837 1,350,334 1,487 11,774 798 1,309Others * 228,674 238,398 165 498 0 0------------------ -- --------------------- --------------------- --------------------- --------------------- --------------------- --------------------TOTAL 9,907,154 9,907,154 72,709 72,709 11,424 11,424
AIRCRAFT OPERATIONS
General TOTAL Air Carrier Air Taxi Aviation Military OPERATIONS
Honolulu 194,357 57,506 122,349 32,836 407,048Hilo 19,709 42,249 23,550 13,247 98,755Kahului 56,532 75,923 44,209 6,022 182,686Lihue 34,656 63,754 8,230 7,220 113,860Keahole 27,608 10,838 17,504 4,136 60,086Molokai 12 33,145 9,121 1,231 43,509
* Privately-owned airports.
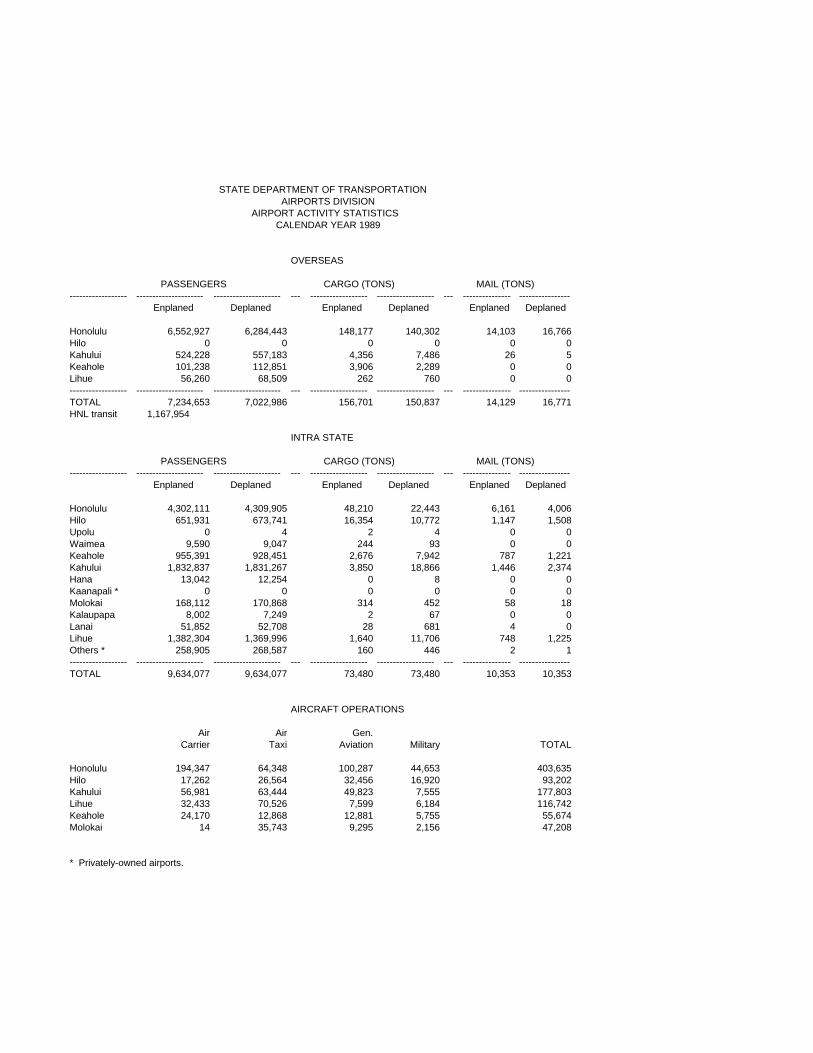
STATE DEPARTMENT OF TRANSPORTATION AIRPORTS DIVISION AIRPORT ACTIVITY STATISTICS CALENDAR YEAR 1989
OVERSEAS
PASSENGERS CARGO (TONS) MAIL (TONS)------------------ --------------------- --------------------- --- ------------------ ------------------ --- --------------- ----------------
Enplaned Deplaned Enplaned Deplaned Enplaned Deplaned
Honolulu 6,552,927 6,284,443 148,177 140,302 14,103 16,766Hilo 0 0 0 0 0 0Kahului 524,228 557,183 4,356 7,486 26 5Keahole 101,238 112,851 3,906 2,289 0 0Lihue 56,260 68,509 262 760 0 0------------------ --------------------- --------------------- --- ------------------ ------------------ --- --------------- ----------------TOTAL 7,234,653 7,022,986 156,701 150,837 14,129 16,771HNL transit 1,167,954
INTRA STATE
PASSENGERS CARGO (TONS) MAIL (TONS)------------------ --------------------- --------------------- --- ------------------ ------------------ --- --------------- ----------------
Enplaned Deplaned Enplaned Deplaned Enplaned Deplaned
Honolulu 4,302,111 4,309,905 48,210 22,443 6,161 4,006Hilo 651,931 673,741 16,354 10,772 1,147 1,508Upolu 0 4 2 4 0 0Waimea 9,590 9,047 244 93 0 0Keahole 955,391 928,451 2,676 7,942 787 1,221Kahului 1,832,837 1,831,267 3,850 18,866 1,446 2,374Hana 13,042 12,254 0 8 0 0Kaanapali * 0 0 0 0 0 0Molokai 168,112 170,868 314 452 58 18Kalaupapa 8,002 7,249 2 67 0 0Lanai 51,852 52,708 28 681 4 0Lihue 1,382,304 1,369,996 1,640 11,706 748 1,225Others * 258,905 268,587 160 446 2 1------------------ --------------------- --------------------- --- ------------------ ------------------ --- --------------- ----------------TOTAL 9,634,077 9,634,077 73,480 73,480 10,353 10,353
AIRCRAFT OPERATIONS
Air Air Gen.Carrier Taxi Aviation Military TOTAL
Honolulu 194,347 64,348 100,287 44,653 403,635Hilo 17,262 26,564 32,456 16,920 93,202Kahului 56,981 63,444 49,823 7,555 177,803Lihue 32,433 70,526 7,599 6,184 116,742Keahole 24,170 12,868 12,881 5,755 55,674Molokai 14 35,743 9,295 2,156 47,208
* Privately-owned airports.

STATE DEPARTMENT OF TRANSPORTATION AIRPORTS DIVISION AIRPORT ACTIVITY STATISTICS CALENDAR YEAR 1988
OVERSEAS
PASSENGERS CARGO (TONS) MAIL (TONS)--------------- --------------------- --------------------- --- ------------------ ------------------ --- --------------- --------------------------------
Enplaned Deplaned Enplaned Deplaned Enplaned Deplaned
Honolulu 6,125,170 6,018,891 136,648 113,150 13,831 15,510Gen. Lyman 0 0 0 0 0 0Kahului 473,528 498,793 2,394 7,625 51 4Keahole 74,772 84,978 3,229 2,545 0 0Lihue 40,151 50,684 120 267 0 0--------------- --------------------- --------------------- --- ------------------ ------------------ --- --------------- ----------------TOTAL 6,713,621 6,653,346 142,391 123,587 13,882 15,514Hon. transit 1,421,707
INTRA STATE
PASSENGERS CARGO (TONS) MAIL (TONS)--------------- --------------------- --------------------- --- ------------------ ------------------ --- --------------- ----------------
Enplaned Deplaned Enplaned Deplaned Enplaned Deplaned
Honolulu 3,993,250 4,018,523 41,772 21,351 5,444 3,804Gen. Lyman 593,138 613,412 15,382 9,721 1,074 1,341Upolu 0 0 0 0 0 0Waimea 9,311 7,803 0 0 0 0Keahole 845,864 817,935 2,801 6,337 737 1,126Kahului 1,714,848 1,732,064 3,335 16,826 1,358 2,068Hana 11,377 11,630 0 0 0 0Kaanapali* 0 0 0 0 0 0Molokai 165,038 166,965 319 380 57 7Kalaupapa 7,131 6,547 2 12 0 0Lanai 48,085 47,411 15 106 8 1Lihue 1,318,869 1,310,823 1,404 10,059 683 1,075Others* 258,017 231,815 72 310 63 2--------------- --------------------- --------------------- --- ------------------ ------------------ --- --------------- ----------------TOTAL 8,964,928 8,964,928 65,102 65,102 9,424 9,424
AIRCRAFT OPERATIONS
Air Air Gen.Carrier Taxi Aviation Military TOTAL
Honolulu 185,282 60,628 91,971 40,038 377,919Gen. Lyman 16,882 17,905 36,709 13,771 85,267Kahului 61,990 60,385 43,792 6,886 173,053Lihue 34,169 71,133 8,468 8,498 122,268Keahole 20,733 17,509 11,710 6,632 56,584Molokai 7 39,962 8,473 2,014 50,456
*indicates privately owned airports.

STATE DEPARTMENT OF TRANSPORTATION AIRPORTS DIVISION AIRPORT ACTIVITY STATISTICS CALENDAR YEAR 1987
OVERSEAS
PASSENGERS CARGO (TONS) MAIL (TONS)--------------- --------------------- --------------------- --- ------------------ ------------------ --- --------------- ----------------
Enplaned Deplaned Enplaned Deplaned Enplaned Deplaned
Honolulu 5,756,190 5,684,126 110,724 96,722 11,780 14,502Gen. Lyman 460 453 --- --- --- ---Kahului 426,384 437,617 1,331 6,715 --- ---Keahole 98,649 98,663 4,899 2,802 --- ---Lihue 36,064 44,352 100 140 --- ------------------ --------------------- --------------------- --- ------------------ ------------------ --- --------------- ----------------TOTAL 6,317,747 6,265,211 117,054 106,379 11,780 14,502Hon. transit 1,109,850
INTRA STATE
PASSENGERS CARGO (TONS) MAIL (TONS)--------------- --------------------- --------------------- --- ------------------ ------------------ --- --------------- ----------------
Enplaned Deplaned Enplaned Deplaned Enplaned Deplaned
Honolulu 3,898,325 3,931,551 39,617 19,458 5,023 3,529Gen. Lyman 590,793 611,870 12,493 8,682 1,122 1,251Upolu 0 0 0 0 0 0Waimea 9,222 8,903 0 0 0 0Keahole 815,184 791,094 3,162 5,184 727 1,025Kahului 1,814,090 1,818,413 3,307 17,480 1,272 2,041Hana 10,848 11,211 0 0 0 0Kaanapali* 0 0 0 0 0 0Molokai 162,300 164,591 233 254 53 5Kalaupapa 5,051 4,659 0 0 0 0Lanai 28,152 29,131 11 40 7 0Lihue 1,304,441 1,288,292 2,374 10,011 625 978Others* 164,188 142,879 43 131 0 0--------------- --------------------- --------------------- --- ------------------ ------------------ --- --------------- ----------------TOTAL 8,802,594 8,802,594 61,240 61,240 8,829 8,829
AIRCRAFT OPERATIONS
Air Air Gen.Carrier Taxi Aviation Military TOTAL
Honolulu 216,044 62,172 83,558 23,501 385,275Gen. Lyman 20,920 9,888 29,354 19,961 80,123Kahului 76,368 54,845 26,534 8,173 165,920Lihue 44,599 70,813 10,730 8,353 134,495Keahole 29,171 17,866 10,628 9,832 67,497Molokai 5,916 34,473 8,334 2,106 50,829
*indicates privately owned airports.

STATE DEPARTMENT OF TRANSPORTATION AIRPORTS DIVISION AIRPORT ACTIVITY STATISTICS CALENDAR YEAR 1986
OVERSEAS
PASSENGERS CARGO (TONS) MAIL (TONS)--------------- --------------------- --------------------- --- ------------------ ------------------ --- --------------- ----------------
Enplaned Deplaned Enplaned Deplaned Enplaned Deplaned
Honolulu 5,490,360 5,384,490 98,053 87,748 11,248 11,862Gen. Lyman 10,610 10,304 517 137 103 ---Kahului 478,557 521,232 1,070 4,082 70 1Keahole 73,410 85,686 455 417 --- ---Lihue 30,571 39,366 33 63 --- ------------------ --------------------- --------------------- --- ------------------ ------------------ --- --------------- ----------------TOTAL 6,083,508 6,041,078 100,128 92,447 11,421 11,863Hon. transit 841,241
INTRA STATE
PASSENGERS CARGO (TONS) MAIL (TONS)--------------- --------------------- --------------------- --- ------------------ ------------------ --- --------------- ----------------
Enplaned Deplaned Enplaned Deplaned Enplaned Deplaned
Honolulu 3,659,556 3,700,748 36,833 17,967 4,842 3,513Gen. Lyman 541,564 565,647 11,966 9,202 1,126 1,253Upolu 438 436 --- --- --- ---Waimea 9,585 9,649 4 13 --- ---Keahole 779,328 752,918 2,859 5,104 631 917Kahului 1,876,065 1,853,476 3,046 16,423 1,187 1,836Hana 8,769 8,469 --- --- --- ---Kaanapali* 3,986 3,672 --- --- --- ---Molokai 164,262 165,913 219 250 50 8Kalaupapa 3,568 3,497 1 40 --- ---Lanai 24,917 25,286 3 14 4 ---Lihue 1,244,608 1,226,544 2,398 8,315 616 929Others* 23,402 23,793 --- 1 --- ------------------ --------------------- --------------------- --- ------------------ ------------------ --- --------------- ----------------TOTAL 8,340,048 8,340,048 57,329 57,329 8,456 8,456
AIRCRAFT OPERATIONS
Air Air Gen.Carrier Taxi Aviation Military TOTAL
Honolulu 191,890 69,918 78,985 27,256 368,049Gen. Lyman 17,965 5,587 18,776 19,186 61,514Kahului 78,820 56,361 30,338 9,041 174,560Lihue 41,750 82,244 11,622 8,289 143,905Keahole 30,265 20,679 17,360 13,163 81,467Molokai 5,471 35,913 8,267 2,617 52,268
*indicates privately owned airports.

STATE DEPARTMENT OF TRANSPORTATION AIRPORTS DIVISION AIRPORT ACTIVITY STATISTICS CALENDAR YEAR 1985
OVERSEAS
PASSENGERS CARGO (TONS) MAIL (TONS)--------------- --------------------- --------------------- --- ------------------ ------------------ --- --------------- ----------------
Enplaned Deplaned Enplaned Deplaned Enplaned Deplaned
Honolulu 4,849,471 4,833,147 88,500 71,862 10,620 11,059Gen. Lyman 9,211 9,457 518 145 174 ---Kahului 349,668 369,779 672 1,688 35 ---Keahole 59,740 70,193 531 1,408 --- ---Lihue 25,438 35,286 15 45 --- ------------------ --------------------- --------------------- --- ------------------ ------------------ --- --------------- ----------------TOTAL 5,293,528 5,317,862 90,236 75,148 10,829 11,059Hon. transit 858,501
INTRA STATE
PASSENGERS CARGO (TONS) MAIL (TONS)--------------- --------------------- --------------------- --- ------------------ ------------------ --- --------------- ----------------
Enplaned Deplaned Enplaned Deplaned Enplaned Deplaned
Honolulu 3,458,592 3,497,493 33,529 14,782 4,476 3,521Gen. Lyman 514,068 541,193 9,193 8,930 1,278 1,213Upolu 1,065 1,079 --- --- --- ---Waimea 7,928 7,859 --- --- --- ---Keahole 693,454 662,426 2,868 3,405 517 829Kahului 1,799,826 1,786,262 3,311 15,399 1,149 1,622Hana 10,721 10,250 --- 70 --- ---Kaanapali* 57,066 56,491 --- --- --- ---Molokai 170,300 170,532 160 276 50 11Kalaupapa 5,513 5,333 4 100 --- ---Lanai 26,459 26,442 3 36 4 ---Lihue 1,115,728 1,094,792 1,782 7,852 562 840Others* 17,878 18,446 --- --- --- ------------------ --------------------- --------------------- --- ------------------ ------------------ --- --------------- ----------------TOTAL 7,878,598 7,878,598 50,850 50,850 8,036 8,036
AIRCRAFT OPERATIONS
Air Air Gen.Carrier Taxi Aviation Military TOTAL
Honolulu 167,154 79,329 81,103 29,925 357,511Gen. Lyman 15,336 6,423 20,555 18,911 61,225Kahului 71,745 43,777 30,558 11,151 157,231Lihue 27,224 80,665 13,006 10,860 131,755Keahole 20,510 31,473 22,313 19,583 93,879Molokai 4,884 38,669 8,693 3,802 56,048
*indicates privately owned airports.

STATE DEPARTMENT OF TRANSPORTATION AIRPORTS DIVISION AIRPORT ACTIVITY STATISTICS CALENDAR YEAR 1984
OVERSEAS
PASSENGERS CARGO (TONS) MAIL (TONS)--------------- --------------------- --------------------- --- ------------------ ------------------ --- --------------- --------------------------------
Enplaned Deplaned Enplaned Deplaned Enplaned Deplaned
Honolulu 4,939,652 4,916,332 92,759 74,151 11,263 14,748Gen. Lyman 18,983 18,388 4,443 1,539 337 ---Kahului 241,232 239,639 404 485 50 1Keahole 53,700 75,902 492 636 28 ---Lihue 7,806 12,952 9 117 --- ------------------ --------------------- --------------------- --- ------------------ ------------------ --- --------------- ----------------TOTAL 5,261,373 5,263,213 98,107 76,928 11,678 14,749Hon. transit it 727,947
INTRA STATE
PASSENGERS CARGO (TONS) MAIL (TONS)--------------- --------------------- --------------------- --- ------------------ ------------------ --- --------------- ----------------
Enplaned Deplaned Enplaned Deplaned Enplaned Deplaned
Honolulu 3,339,498 3,364,191 36,346 16,362 4,861 3,243Gen. Lyman 484,769 539,142 9,799 8,640 1,139 1,268Upolu 1,186 1,230 --- --- --- ---Waimea 4,602 4,767 100 173 --- ---Keahole 687,288 610,542 2,825 3,777 459 914Kahului 1,796,714 1,799,911 3,736 17,674 1,085 1,768Hana 9,682 9,219 --- 11 --- ---Kaanapali* 64,332 63,360 --- --- --- ---Molokai 135,665 136,678 157 349 51 24Kalaupapa 3,942 3,961 2 48 --- ---Lanai 24,430 24,344 4 106 5 ---Lihue 1,065,139 1,059,684 2,767 8,584 541 924Others* 14,992 15,210 --- 12 --- ------------------ --------------------- --------------------- --- ------------------ ------------------ --- --------------- ----------------TOTAL 7,632,239 7,632,239 55,736 55,736 8,141 8,141
AIRCRAFT OPERATIONS
Air Air Gen.Carrier Taxi Aviation Military TOTAL
Honolulu 154,121 75,445 82,961 31,291 343,818Gen. Lyman 14,165 7,455 18,335 22,588 62,543Kahului 67,230 37,128 26,333 11,620 142,311Lihue 21,848 67,403 9,692 2,049 100,992Keahole 17,033 29,569 19,528 17,190 83,320Molokai 5,000 34,533 10,429 3,551 53,513
*indicates privately owned airports.

PAGE 1 OF 3
CALENDAR YEAR 2001 HIGHLIGHTS
% % % %CY 2001 change CY 2000 change CY 1999 change CY 1998 change
------------------------------------ ----- -------------------- - ---------------- -- -------------------- - ----------------- - -------------------- - ------------ --- -------------------- ----- -----------------STATEWIDE:
PASSENGERS 33,148,159 -10.7% 37,105,849 2.6% 36,159,544 0.7% 35,923,459 -3.6% CARGO (U.S. tons) 373,847 -23.8% 490,915 -6.6% 525,421 9.5% 480,042 -15.4% MAIL (U.S. tons) 119,497 -9.7% 132,348 -1.2% 133,979 9.4% 122,517 9.3%
HONOLULU INTERNATIONAL AIRPORT:
PASSENGERS Overseas (enplaned, deplaned, and transits)
11,749,158 -13.6% 13,603,161 1.7% 13,373,553 -1.2% 13,536,148 -5.9%
Interisland 8,402,777 -10.8% 9,424,513 2.6% 9,186,846 1.0% 9,100,206 -4.1%TOTAL 20,151,935 -12.5% 23,027,674 2.1% 22,560,399 -0.3% 22,636,354 -5.2%
CARGO (U.S. tons) Overseas 202,720 -36.0% 316,546 -13.1% 364,397 13.6% 320,670 -14.8% Interisland 73,220 0.8% 72,661 10.0% 66,079 -1.1% 66,812 -15.7%
TOTAL 275,940 -29.1% 389,207 -9.6% 430,476 11.1% 387,482 -14.9%
MAIL (U.S. tons) 95,899 -10.9% 107,635 -0.9% 108,631 7.1% 101,463 5.5%
AIRCRAFT OPERATIONS 1,103,445 -3.0% 1,137,713 228.2% 346,609 3.8% 334,046 -6.9%
HILO INTERNATIONAL AIRPORT:
PASSENGERS Overseas 162 100.0% 0 0.0% 0 0.0% 0 0.0% Interisland 1,480,436 -6.8% 1,588,727 0.1% 1,586,925 1.8% 1,559,494 -6.6%
TOTAL 1,480,598 -6.8% 1,588,727 0.1% 1,586,925 1.8% 1,559,494 -6.6%
CARGO (U.S. tons) Overseas 0 0.0% 0 -100.0% 42 100.0% 0 0.0% Interisland 23,094 5.9% 21,805 9.7% 19,886 -3.7% 20,642 -25.6%
TOTAL 23,094 5.9% 21,805 9.4% 19,928 -3.5% 20,642 -25.6%
MAIL (U.S. tons) 3,541 -4.7% 3,716 0.9% 3,684 6.6% 3,457 -1.8%
AIRCRAFT OPERATIONS 96,238 -16.7% 115,546 -0.2% 115,820 3.0% 112,479 10.8%

PAGE 2 OF 3
CALENDAR YEAR 2001 HIGHLIGHTS
% % % %
CY 2001 change CY 2000 change CY 1999 change CY 1998 change
--------------------------------- ---- ------------------ ---- --------------- ---------------- ------------------ ---- --------------- ---------------- ------------------ ---- --------------- ---------------- ------------------ ---- ---------------
KAHULUI AIRPORT:
PASSENGERS
Overseas 2,146,864 8.7% 1,974,791 8.2% 1,824,587 4.4% 1,747,073 9.3%
Interisland 3,582,229 -15.3% 4,227,603 1.9% 4,147,492 1.3% 4,093,344 -4.3%
TOTAL 5,729,093 -7.6% 6,202,394 3.9% 5,972,079 2.3% 5,840,417 -0.6%
CARGO (U.S. tons)
Overseas 13,430 -4.6% 14,078 9.3% 12,882 7.5% 11,983 -6.1%
Interisland 23,456 -2.3% 24,019 18.7% 20,235 0.7% 20,104 -35.4%
TOTAL 36,886 -3.2% 38,097 15.0% 33,117 3.2% 32,087 -26.9%
MAIL (U.S. tons) 10,422 -5.3% 11,010 0.5% 10,958 4.3% 10,508 49.5%
AIRCRAFT OPERATIONS 160,324 -8.3% 174,855 -7.2% 188,385 4.1% 180,890 4.4%
LIHUE AIRPORT:
PASSENGERS
Overseas 282,436 41.6% 199,491 22.4% 163,037 108.6% 78,152 568.9%
Interisland 2,396,481 -10.7% 2,684,030 2.8% 2,610,016 1.9% 2,561,848 -0.3%
TOTAL 2,678,917 -7.1% 2,883,521 4.0% 2,773,053 5.0% 2,640,000 2.3%
CARGO (U.S. tons)
Overseas 59 -29.8% 84 -16.0% 100 354.5% 22 100.0%
Interisland 13,485 -11.3% 15,200 -1.3% 15,394 4.3% 14,760 12.0%
TOTAL 13,544 -11.4% 15,284 -1.4% 15,494 4.8% 14,782 12.1%
MAIL (U.S. tons) 3,245 -78.8% 15,284 346.1% 3,426 8.5% 3,159 13.2%
AIRCRAFT OPERATIONS 103,655 -9.0% 113,850 -1.4% 115,523 9.0% 105,979 -4.8%
KONA INTERNATIONAL AIRPORT at KEAHOLE
PASSENGERS
Overseas 631,180 10.6% 570,881 26.2% 452,229 10.0% 411,190 10.9%
Interisland 2,009,138 -11.5% 2,271,216 2.5% 2,215,953 -1.2% 2,241,765 -0.7%
TOTAL 2,640,318 -7.1% 2,842,097 6.5% 2,668,182 0.6% 2,652,955 0.9%
CARGO (U.S. tons)
Overseas 7,563 -19.7% 9,424 -2.2% 9,632 31.3% 7,335 36.7%
Interisland 13,977 141.0% 5,799 -57.6% 13,685 -7.2% 14,749 -23.4%
TOTAL 21,540 41.5% 15,223 -34.7% 23,317 5.6% 22,084 -10.3%
MAIL (U.S. tons) 5,909 -8.4% 6,450 9.5% 5,889 96.8% 2,993 34.8%
AIRCRAFT OPERATIONS 107,793 9.9% 98,052 18.2% 82,955 2.1% 81,285 -7.0%

PAGE 3 OF 3
CALENDAR YEAR 2001 HIGHLIGHTS
% % % %
CY 2001 change CY 2000 change CY 1999 change CY 1998 change
------------------------------------------ ------ ------------------------ ------ -------------------- ---------------------- ------------------------ ------ -------------------- ---------------------- ------------------------ ------ -------------------- ---------------------- ------------------------ ------ --------------------
PASSENGERS for other airports:
Upolu 0 0.0% 0 -100.0% 3 0.0% 3 -66.7%
Waimea-Kohala 2,472 -46.3% 4,605 150.7% 1,837 14.7% 1,601 -24.8%
Hana 5,714 -21.9% 7,312 -9.7% 8,093 -14.6% 9,482 -5.9%
Kapalua 95,390 -22.2% 122,661 -9.3% 135,302 -6.6% 144,928 -18.5%
Molokai 215,638 -16.4% 257,975 -4.4% 269,752 6.8% 252,592 0.1%
Kalaupapa 2,547 -58.2% 6,091 -25.2% 8,146 -9.0% 8,954 3.8%
Lanai 145,536 -10.6% 162,792 -7.3% 175,641 -0.6% 176,619 -1.0%
Dillingham 0 0.0% 0 0.0% 0 -100.0% 4 100.0%
Princeville * 6 -76.0% 25 -81.1% 132 135.7% 56 -73.1%
TOTAL 467,303 -16.8% 561,461 -6.3% 598,906 0.8% 594,239 -5.6%
CARGO (U.S. tons) for other airports:
Upolu 0 0.0% 0 0.0% 0 0.0% 0 0.0%
Waimea-Kohala 1 -95.0% 20 -20.0% 25 66.7% 15 -79.7%
Hana 67 91.4% 35 -35.2% 54 1250.0% 4 300.0%
Kapalua 582 -1.2% 589 -7.5% 637 -12.3% 726 1.1%
Molokai 1,322 -0.8% 1,332 -5.4% 1,408 16.7% 1,207 24.0%
Kalaupapa 185 -8.4% 202 6.9% 189 17.4% 161 2200.0%
Lanai 685 -4.6% 718 -7.6% 777 -8.9% 853 -2.5%
Princeville * 0 0.0% 0 0.0% 0 0.0% 0 0.0%
TOTAL 2,842 -1.9% 2,896 -6.3% 3,090 4.2% 2,966 12.0%
* Leased by the State of Hawaii.
AIR-PS

PAGE 1 OF 3
CALENDAR YEAR 2000 HIGHLIGHTS
STATEWIDE:
PASSENGERS CARGO (U.S. tons) MAIL (U.S. tons)
CY 2000
37,105,849 490,915 132,348
HONOLULU INTERNATIONAL AIRPORT:
PASSENGERS Overseas (enplaned, deplaned, and transits)
13,603,161
Interisland 9,424,513 TOTAL 23,027,674
CARGO (U.S. tons) Overseas 316,546 Interisland 72,661
TOTAL 389,207
MAIL (U.S. tons) 107,635
AIRCRAFT OPERATIONS 1,137,713
HILO INTERNATIONAL AIRPORT:
PASSENGERS Overseas 0 Interisland 1,588,727
TOTAL 1,588,727
CARGO (U.S. tons) Overseas 0 Interisland 21,805
TOTAL 21,805
MAIL (U.S. tons) 3,716
AIRCRAFT OPERATIONS 115,546
% change
2.6% -6.6% -1.2%
1.7%
2.6% 2.1%
-13.1% 10.0% -9.6%
-0.9%
228.2%
0.0% 0.1% 0.1%
-100.0% 9.7% 9.4%
0.9%
-0.2%
CY 1999
36,159,544 525.421 133,979
13,373,553
9,186,846 22,560,399
364,397 66,079
430,476
108,631
346,609
0 1,586,925 1,586,925
42 19,886 19,928
3,684
115,820
% change
0.7% 9.5% 9.4%
-1.2%
1.0% -0.3%
13.6% -1.1% 11.1%
7.1%
3.8%
0.0% 1.8% 1.8%
100.0% -3.7% -3.5%
6.6%
3.0%
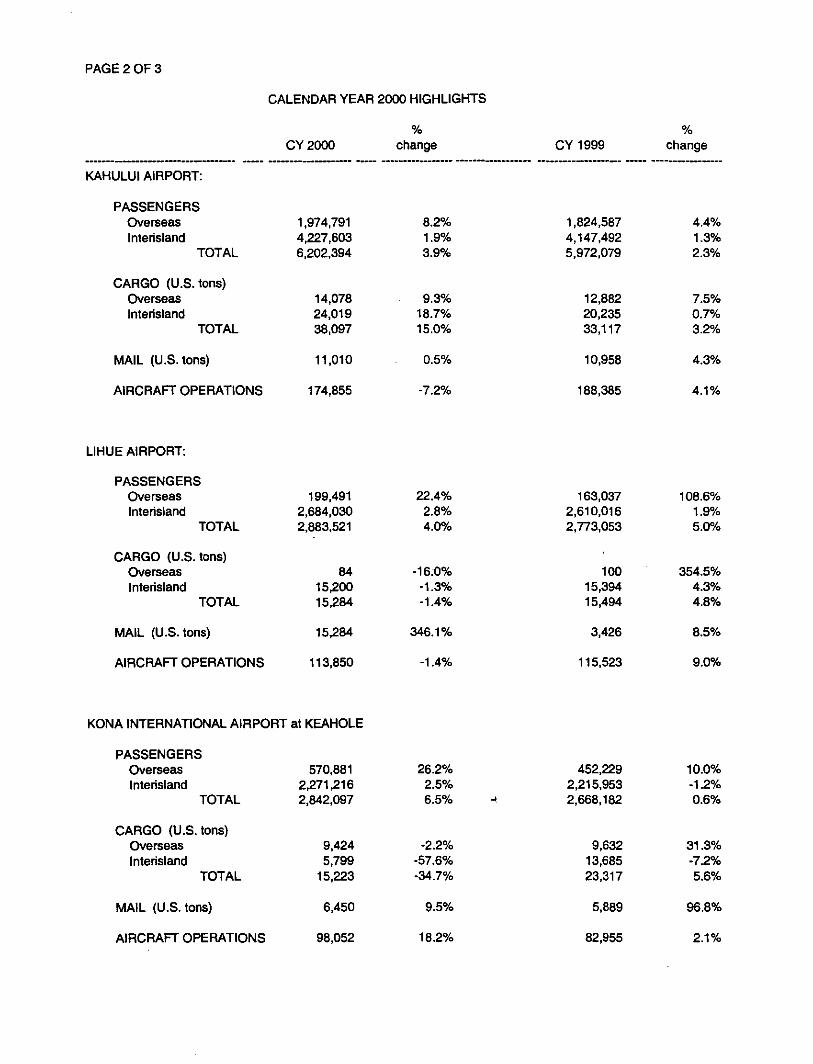
PAGE20F3
KAHULUI AIRPORT:
PASSENGERS Overseas Interisland
TOTAL
CARGO (U.S. tons) Overseas Interisland
TOTAL
MAIL (U.S. tons)
AIRCRAFT OPERATIONS
LIHUE AIRPORT:
PASSENGERS Overseas Interisland
TOTAL
CARGO (U.S. tons) Overseas Interisland
TOTAL
MAIL (U.S. tons)
AIRCRAFT OPERATIONS
CALENDAR YEAR 2000 HIGHLIGHTS
CY2000
1,974,791 4,227,603 6,202,394
14,078 24,019 38,097
11,010
174,855
199,491 2,684,030 2,883,521
84 15,200 15,284
15,284
113,850
% change
8.2% 1.9% 3.9%
9.3% 18.7% 15.0%
0.5%
-7.2%
22.4% 2.8% 4.0%
-16;0% -1.3% -1.4%
346.1%
-1.4%
KONA INTERNATIONAL AIRPORT at KEAHOLE
PASSENGERS Overseas 570,881 26.2% Interisland 2,271,216 2.5%
TOTAL 2,842,097 6.5%
CARGO (U.S. Ions) Overseas 9,424 -2.2% Interisland 5,799 -57.6%
TOTAL 15,223 -34.7%
MAIL (U.S. tons) 6,450 9.5%
AIRCRAFT OPERATIONS 98,052 18.2%
CY 1999
1,824,587 4,147,492 5,972,079
12,882 20,235 33,117
10,958
188,385
163,037 2,610,016 2,n3,os3
100 15,394 15,494
3,426
115,523
452,229 2,215,953 2,668,182
9,632 13,685 23,317
5,889
82,955
% change
4.4% 1.3% 2.3%
7.5% 0.7% 3.2%
4.3%
4.1%
108.6% 1.9% 5.0%
354.5% 4.3% 4.8%
8.5%
9.0%
10.0% -1.2% 0.6%
31.3% -7.2% 5.6%
96.8%
2.1%

PAGE30F3
CALENDAR YEAR 2000 HIGHLIGHTS
% %
CY2000 change CY 1999 change
PASSENGERS for other airports:
Upolu 0 -100.0% 3 0.0% Waimea-Kohala 4,605 150.7% 1,837 14.7% Han a 7,312 -9.7% 8,093 -14.6% Kapalua 122,661 -9.3% 135,302 -6.6% Molokai 257,975 -4.4% 269,752 6.8% Kalaupapa 6,091 -25.2% 8,146 ·9.0% Lanai 162,792 -7.3% 175,641 -0.6% Dillingham 0 0.0% 0 -100.0% Princeville • 25 -81.1% 132 135.7%
TOTAL 561,461 -6.3% 598,906 0.8%
CARGO (U.S. tons) for other airports:
Upolu 0 0.0% 0 0.0"/o Waimea-Kohala 20 -20.0% 25 66.7% Hana 35 -35.2% 54 1250.0"/o Kapalua 589 -7.5% 637 -12.3% Molokai 1,332 -5.4% 1,408 16.7% Kalaupapa 202 6.9% 189 17.4% Lanai 718 -7.6% m -8.9% Princeville • 0 0.0% 0 0.0"/o
TOTAL 2,896 -6.3% 3,090 4.2%
• Leased by the State of Hawaii.
AIR-PS

PAGE 1 OF 3
CALENDAR YEAR 1999 HIGHLIGHTS
% %CY 1999 change CY 1998 change
------------------------------------ ----- -------------------- ----- ---------------- ------------------ -------------------- ----- ----------------STATEWIDE:
PASSENGERS 36,159,544 0.7% 35,923,459 -3.6% CARGO (U.S. tons) 525,421 9.5% 480,042 -15.4% MAIL (U.S. tons) 133,979 9.4% 122,517 9.3%
HONOLULU INTERNATIONAL AIRPORT:
PASSENGERS Overseas (enplaned, deplaned, and transits)
13,373,553 -1.2% 13,536,148 -5.9%
Interisland 9,186,846 1.0% 9,100,206 -4.1%TOTAL 22,560,399 -0.3% 22,636,354 -5.2%
CARGO (U.S. tons) Overseas 364,397 13.6% 320,670 -14.8% Interisland 66,079 -1.1% 66,812 -15.7%
TOTAL 430,476 11.1% 387,482 -14.9%
MAIL (U.S. tons) 108,631 7.1% 101,463 5.5%
AIRCRAFT OPERATIONS 346,609 3.8% 334,046 -6.9%
HILO INTERNATIONAL AIRPORT:
PASSENGERS Overseas 0 0.0% 0 0.0% Interisland 1,586,925 1.8% 1,559,494 -6.6%
TOTAL 1,586,925 1.8% 1,559,494 -6.6%
CARGO (U.S. tons) Overseas 42 100.0% 0 0.0% Interisland 19,886 -3.7% 20,642 -25.6%
TOTAL 19,928 -3.5% 20,642 -25.6%
MAIL (U.S. tons) 3,684 6.6% 3,457 -1.8%
AIRCRAFT OPERATIONS 115,820 3.0% 112,479 10.8%

PAGE 2 OF 3
CALENDAR YEAR 1999 HIGHLIGHTS
% %CY 1999 change CY 1998 change
------------------------------------ ----- -------------------- ----- ---------------- ------------------ -------------------- ----- ----------------KAHULUI AIRPORT:
PASSENGERS Overseas 1,824,587 4.4% 1,747,073 9.3% Interisland 4,147,492 1.3% 4,093,344 -4.3%
TOTAL 5,972,079 2.3% 5,840,417 -0.6%
CARGO (U.S. tons) Overseas 12,882 7.5% 11,983 -6.1% Interisland 20,235 0.7% 20,104 -35.4%
TOTAL 33,117 3.2% 32,087 -26.9%
MAIL (U.S. tons) 10,958 4.3% 10,508 49.5%
AIRCRAFT OPERATIONS 188,385 4.1% 180,890 4.4%
LIHUE AIRPORT:
PASSENGERS Overseas 163,037 108.6% 78,152 568.9% Interisland 2,610,016 1.9% 2,561,848 -0.3%
TOTAL 2,773,053 5.0% 2,640,000 2.3%
CARGO (U.S. tons) Overseas 100 354.5% 22 100.0% Interisland 15,394 4.3% 14,760 12.0%
TOTAL 15,494 4.8% 14,782 12.1%
MAIL (U.S. tons) 3,426 8.5% 3,159 13.2%
AIRCRAFT OPERATIONS 115,523 9.0% 105,979 -4.8%
KONA INTERNATIONAL AIRPORT at KEAHOLE
PASSENGERS Overseas 452,229 10.0% 411,190 10.9% Interisland 2,215,953 -1.2% 2,241,765 -0.7%
TOTAL 2,668,182 0.6% 2,652,955 0.9%
CARGO (U.S. tons) Overseas 9,632 31.3% 7,335 36.7% Interisland 13,685 -7.2% 14,749 -23.4%
TOTAL 23,317 5.6% 22,084 -10.3%
MAIL (U.S. tons) 5,889 96.8% 2,993 34.8%
AIRCRAFT OPERATIONS 82,955 2.1% 81,285 -7.0%

PAGE 3 OF 3
CALENDAR YEAR 1999 HIGHLIGHTS
% %
CY 1999 change CY 1998 change------------------------------------ ----- -------------------- ----- ---------------- ------------------ -------------------- ----- ----------------
PASSENGERS for other airports:
Upolu 3 0.0% 3 -66.7% Waimea-Kohala 1,837 14.7% 1,601 -24.8% Hana 8,093 -14.6% 9,482 -5.9% Kapalua 135,302 -6.6% 144,928 -18.5% Molokai 269,752 6.8% 252,592 0.1% Kalaupapa 8,146 -9.0% 8,954 3.8% Lanai 175,641 -0.6% 176,619 -1.0% Dillingham 0 -100.0% 4 100.0% Princeville * 132 135.7% 56 -73.1%
TOTAL 598,906 0.8% 594,239 -5.6%
CARGO (U.S. tons) for other airports:
Upolu 0 0.0% 0 0.0% Waimea-Kohala 25 66.7% 15 -79.7% Hana 54 1250.0% 4 300.0% Kapalua 637 -12.3% 726 1.1% Molokai 1,408 16.7% 1,207 24.0% Kalaupapa 189 17.4% 161 2200.0% Lanai 777 -8.9% 853 -2.5% Princeville * 0 0 0.0%
TOTAL 3,090 4.2% 2,966 12.0%
* Leased by the State of Hawaii.
AIR-PS
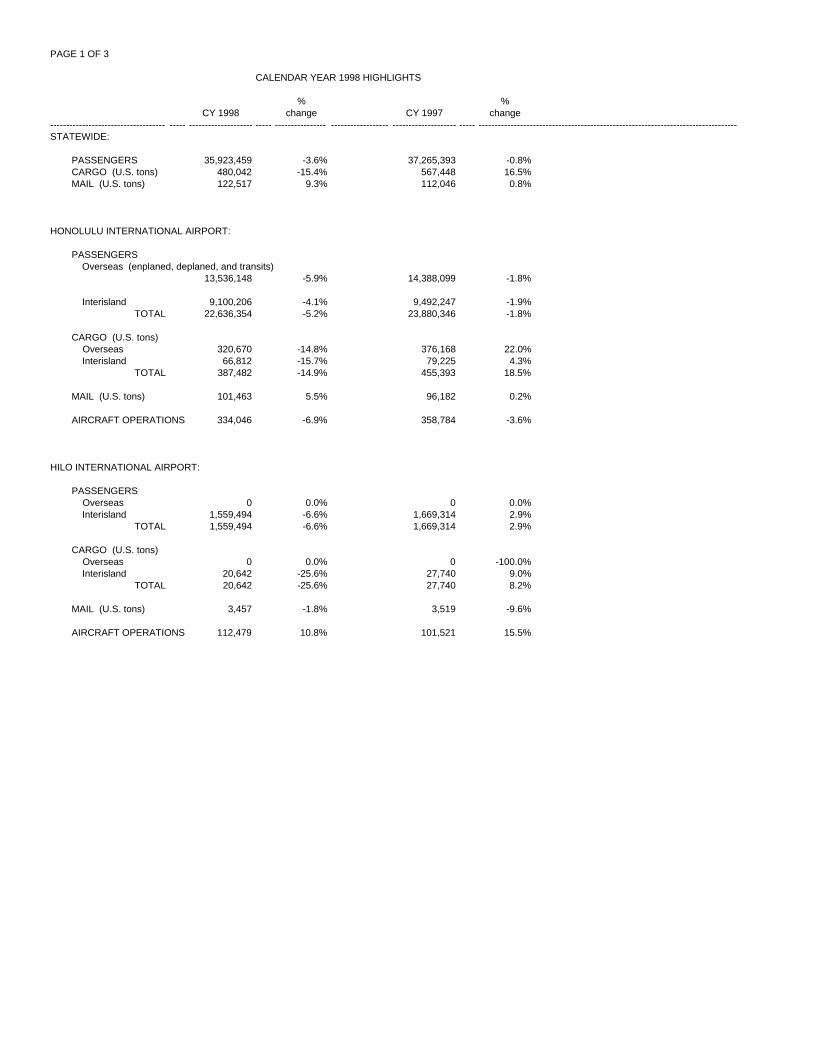
PAGE 1 OF 3
CALENDAR YEAR 1998 HIGHLIGHTS
% %CY 1998 change CY 1997 change
------------------------------------ ----- -------------------- ----- ---------------- ------------------ -------------------- ----- ---------------------------------------------------------------------------------STATEWIDE:
PASSENGERS 35,923,459 -3.6% 37,265,393 -0.8% CARGO (U.S. tons) 480,042 -15.4% 567,448 16.5% MAIL (U.S. tons) 122,517 9.3% 112,046 0.8%
HONOLULU INTERNATIONAL AIRPORT:
PASSENGERS Overseas (enplaned, deplaned, and transits)
13,536,148 -5.9% 14,388,099 -1.8%
Interisland 9,100,206 -4.1% 9,492,247 -1.9%TOTAL 22,636,354 -5.2% 23,880,346 -1.8%
CARGO (U.S. tons) Overseas 320,670 -14.8% 376,168 22.0% Interisland 66,812 -15.7% 79,225 4.3%
TOTAL 387,482 -14.9% 455,393 18.5%
MAIL (U.S. tons) 101,463 5.5% 96,182 0.2%
AIRCRAFT OPERATIONS 334,046 -6.9% 358,784 -3.6%
HILO INTERNATIONAL AIRPORT:
PASSENGERS Overseas 0 0.0% 0 0.0% Interisland 1,559,494 -6.6% 1,669,314 2.9%
TOTAL 1,559,494 -6.6% 1,669,314 2.9%
CARGO (U.S. tons) Overseas 0 0.0% 0 -100.0% Interisland 20,642 -25.6% 27,740 9.0%
TOTAL 20,642 -25.6% 27,740 8.2%
MAIL (U.S. tons) 3,457 -1.8% 3,519 -9.6%
AIRCRAFT OPERATIONS 112,479 10.8% 101,521 15.5%

PAGE 2 OF 3
CALENDAR YEAR 1998 HIGHLIGHTS
% %CY 1998 change CY 1997 change
------------------------------------ ----- -------------------- ----- ---------------- ------------------ -------------------- ----- ---------------------------------------------------------------------------------KAHULUI AIRPORT:
PASSENGERS Overseas 1,747,073 9.3% 1,598,474 10.4% Interisland 4,093,344 -4.3% 4,279,137 -4.0%
TOTAL 5,840,417 -0.6% 5,877,611 -0.5%
CARGO (U.S. tons) Overseas 11,983 -6.1% 12,760 -1.5% Interisland 20,104 -35.4% 31,106 14.1%
TOTAL 32,087 -26.9% 43,866 9.1%
MAIL (U.S. tons) 10,508 49.5% 7,029 18.6%
AIRCRAFT OPERATIONS 180,890 4.4% 173,342 -2.9%
LIHUE AIRPORT:
PASSENGERS Overseas 78,152 568.9% 11,683 31.5% Interisland 2,561,848 -0.3% 2,568,660 0.6%
TOTAL 2,640,000 2.3% 2,580,343 0.7%
CARGO (U.S. tons) Overseas 22 100.0% 0 0.0% Interisland 14,760 12.0% 13,184 7.1%
TOTAL 14,782 12.1% 13,184 7.1%
MAIL (U.S. tons) 3,159 13.2% 2,791 6.4%
AIRCRAFT OPERATIONS 105,979 -4.8% 111,349 4.7%
KONA INTERNATIONAL AIRPORT at KEAHOLE
PASSENGERS Overseas 411,190 10.9% 370,939 34.5% Interisland 2,241,765 -0.7% 2,257,218 0.4%
TOTAL 2,652,955 0.9% 2,628,157 4.1%
CARGO (U.S. tons) Overseas 7,335 36.7% 5,366 16.1% Interisland 14,749 -23.4% 19,250 7.8%
TOTAL 22,084 -10.3% 24,616 9.5%
MAIL (U.S. tons) 2,993 34.8% 2,221 -9.3%
AIRCRAFT OPERATIONS 81,285 -7.0% 87,358 13.4%

PAGE 3 OF 3
CALENDAR YEAR 1998 HIGHLIGHTS
% %
CY 1998 change CY 1997 change------------------------------------ ----- -------------------- ----- ---------------- ------------------ -------------------- ----- ---------------------------------------------------------------------------------
PASSENGERS for other airports:
Upolu 3 -66.7% 9 100.0% Waimea-Kohala 1,601 -24.8% 2,130 14.1% Hana 9,482 -5.9% 10,081 -5.8% Kapalua 144,928 -18.5% 177,929 13.5% Molokai 252,592 0.1% 252,237 1.9% Kalaupapa 8,954 3.8% 8,625 6.5% Lanai 176,619 -1.0% 178,403 6.2% Dillingham 4 100.0% 0 0.0% Princeville * 56 -73.1% 208 -98.4%
TOTAL 594,239 -5.6% 629,622 4.0%
CARGO (U.S. tons) for other airports:
Upolu 0 0.0% 0 0.0% Waimea-Kohala 15 -79.7% 74 -16.1% Hana 4 300.0% 1 -65.9% Kapalua 726 1.1% 718 5.4% Molokai 1,207 24.0% 973 43.1% Kalaupapa 161 2169.0% 7 100.0% Lanai 853 -2.5% 875 66.0% Princeville * 0 0.0% 0 0.0%
TOTAL 2,966 12.0% 2,648 33.9%
* Leased by the State of Hawaii.
AIR-PS
E33 for CY 1998, 2169.0%, was typed in because the formula produced 2200.0. The format remained the same.

PAGE 1 OF 3
CALENDAR YEAR 1997 HIGHLIGHTS
% %CY 1997 change CY 1996 change
------------------------------------ ----- -------------------- ----- ---------------- ------------------ -------------------- ----- ------------------STATEWIDE:
PASSENGERS 37,265,393 -0.8% 37,547,332 2.2% CARGO (U.S. tons) 567,448 16.5% 486,944 6.8% MAIL (U.S. tons) 112,046 0.8% 111,103 -0.1%
HONOLULU INTERNATIONAL AIRPORT:
PASSENGERS Overseas (enplaned, deplaned, and transits)
14,388,099 -1.8% 14,650,433 3.1%
Interisland 9,492,247 -1.9% 9,676,304 2.2%TOTAL 23,880,346 -1.8% 24,326,737 2.8%
CARGO (U.S. tons) Overseas 376,168 22.0% 308,401 6.5% Interisland 79,225 4.3% 75,923 4.9%
TOTAL 455,393 18.5% 384,324 6.2%
MAIL (U.S. tons) 96,182 0.2% 96,033 -1.4%
AIRCRAFT OPERATIONS 358,784 -3.6% 372,268 -0.4%
HILO INTERNATIONAL AIRPORT:
PASSENGERS Overseas 0 0.0% 0 0.0% Interisland 1,669,314 2.9% 1,622,743 -0.3%
TOTAL 1,669,314 2.9% 1,622,743 -0.3%
CARGO (U.S. tons) Overseas 0 -100.0% 177 254.0% Interisland 27,740 9.0% 25,455 4.6%
TOTAL 27,740 8.2% 25,632 5.2%
MAIL (U.S. tons) 3,519 -9.6% 3,891 19.2%
AIRCRAFT OPERATIONS 101,521 15.5% 87,862 3.5%

PAGE 2 OF 3
CALENDAR YEAR 1997 HIGHLIGHTS
% %CY 1997 change C.Y. 1996 change
------------------------------------ ----- -------------------- ----- ---------------- ------------------ -------------------- ----- ------------------KAHULUI AIRPORT:
PASSENGERS Overseas 1,598,474 10.4% 1,448,476 -5.2% Interisland 4,279,137 -4.0% 4,457,659 -1.5%
TOTAL 5,877,611 -0.5% 5,906,135 -2.5%
CARGO (U.S. tons) Overseas 12,760 -1.5% 12,960 11.0% Interisland 31,106 14.1% 27,251 16.9%
TOTAL 43,866 9.1% 40,211 14.9%
MAIL (U.S. tons) 7,029 18.6% 5,928 14.5%
AIRCRAFT OPERATIONS 173,342 -2.9% 178,590 -0.7%
LIHUE AIRPORT:
PASSENGERS Overseas 11,683 31.5% 8,882 999.3% Interisland 2,568,660 0.6% 2,552,925 3.4%
TOTAL 2,580,343 0.7% 2,561,807 3.7%
CARGO (U.S. tons) Overseas 0 0.0% 0 0.0% Interisland 13,184 7.1% 12,313 -4.5%
TOTAL 13,184 7.1% 12,313 -4.5%
MAIL (U.S. tons) 2,791 6.4% 2,623 2.7%
AIRCRAFT OPERATIONS 111,349 4.7% 106,332 9.2%
KONA INTERNATIONAL AIRPORT at KEAHOLE
PASSENGERS Overseas 370,939 34.5% 275,891 24.2% Interisland 2,257,218 0.4% 2,248,511 8.0%
TOTAL 2,628,157 4.1% 2,524,402 9.6%
CARGO (U.S. tons) Overseas 5,366 16.1% 4,623 -11.4% Interisland 19,250 7.8% 17,863 25.0%
TOTAL 24,616 9.5% 22,486 15.2%
MAIL (U.S. tons) 2,221 -9.3% 2,448 -9.7%
AIRCRAFT OPERATIONS 87,358 13.4% 77,025 4.7%

PAGE 3 OF 3
CALENDAR YEAR 1997 HIGHLIGHTS
% %CY 1997 change C.Y. 1996 change
------------------------------------ ----- -------------------- ----- ---------------- ------------------ -------------------- ----- ------------------
PASSENGERS FOR OTHER AIRPORTS:
Upolu 9 100.0% 0 0.0% Waimea-Kohala 2,130 14.1% 1,866 -34.4% Hana 10,081 -5.8% 10,699 -15.9% Kapalua 177,929 13.5% 156,748 6.4% Molokai 252,237 1.9% 247,477 1.8% Kalaupapa 8,625 6.5% 8,101 -32.4% Lanai 178,403 6.2% 167,919 -1.0% Princeville * 208 -98.4% 12,698 -36.1%
TOTAL 629,622 4.0% 605,508 -0.3%
CARGO (U.S. TONS) FOR OTHER AIRPORTS:
Upolu 0 0.0% 0 0.0% Waimea-Kohala 74 -16.9% 89 394.4% Hana 1 0.0% 1 54.7% Kapalua 718 5.4% 681 -13.5% Molokai 973 43.1% 680 21.6% Kalaupapa 7 0.0% 0 0.0% Lanai 875 66.0% 527 -11.4% Princeville * 0 0.0% 0 0.0%
TOTAL 2,648 33.9% 1,978 0.9%
* Leased by the State of Hawaii.
AIR-EP

PAGE 1 OF 3
CALENDAR YEAR 1996 HIGHLIGHTS
% %CY 1996 change C.Y. 1995 change
------------------------------------ ----- -------------------- ----- ---------------- ------------------ -------------------- ----- ------------------STATEWIDE:
PASSENGERS 37,547,332 2.2% 36,736,824 3.2% CARGO (U.S. TONS) 486,944 6.8% 455,765 -3.6% MAIL (U.S. TONS) 111,103 -0.1% 111,223 -1.5%
HONOLULU INTERNATIONAL AIRPORT:
PASSENGERS Overseas (enplaned, deplaned, and transits)
14,650,433 3.1% 14,208,722 1.7%
Interisland 9,676,304 2.2% 9,464,172 4.8%TOTAL 24,326,737 2.8% 23,672,894 2.9%
CARGO (U.S. TONS) Overseas 308,401 6.5% 289,642 -4.0% Interisland 75,923 4.9% 72,395 0.1%
TOTAL 384,324 6.2% 362,037 -3.2%
MAIL (U.S. TONS) 96,033 -1.4% 97,372 -1.5%
AIRCRAFT OPERATIONS 372,268 -0.4% 373,926 4.0%
HILO INTERNATIONAL AIRPORT:
PASSENGERS Overseas 0 0.0% 0 0.0% Interisland 1,622,743 -0.3% 1,627,715 1.5%
TOTAL 1,622,743 -0.3% 1,627,715 1.5%
CARGO (U.S. TONS) Overseas 177 254.0% 50 100.0% Interisland 25,455 4.6% 24,326 -2.8%
TOTAL 25,632 5.2% 24,376 -2.6%
MAIL (U.S. TONS) 3,891 19.2% 3,264 -0.7%
AIRCRAFT OPERATIONS 87,862 3.5% 84,917 -1.6%

PAGE 2 OF 3
CALENDAR YEAR 1996 HIGHLIGHTS
% %C.Y. 1996 change C.Y. 1995 change
------------------------------------ ----- -------------------- ----- ---------------- ------------------ -------------------- ----- ------------------KAHULUI AIRPORT:
PASSENGERS Overseas 1,448,476 -5.2% 1,528,645 3.2% Interisland 4,457,659 -1.5% 4,526,116 5.4%
TOTAL 5,906,135 -2.5% 6,054,761 4.9%
CARGO (U.S. TONS) Overseas 12,960 11.0% 11,678 1.1% Interisland 27,251 16.9% 23,314 -0.2%
TOTAL 40,211 14.9% 34,992 0.3%
MAIL (U.S. TONS) 5,928 14.5% 5,176 0.1%
AIRCRAFT OPERATIONS 178,590 -0.7% 179,883 0.4%
LIHUE AIRPORT:
PASSENGERS Overseas 8,882 999.3% 808 100.0% Interisland 2,552,925 3.4% 2,469,679 7.3% TOTAL 2,561,807 3.7% 2,470,487 7.4%
CARGO (U.S. TONS) Overseas 0 0.0% 0 0.0% Interisland 12,313 -4.5% 12,887 -4.3%
TOTAL 12,313 -4.5% 12,887 -4.3%
MAIL (U.S. TONS) 2,623 2.7% 2,553 0.1%
AIRCRAFT OPERATIONS 106,332 9.2% 97,400 6.4%
KEAHOLE-KONA INTERNATIONAL AIRPORT
PASSENGERS Overseas 275,891 24.2% 222,087 -25.3% Interisland 2,248,511 8.0% 2,081,368 7.2%
TOTAL 2,524,402 9.6% 2,303,455 2.9%
CARGO (U.S. TONS) Overseas 4,623 -11.4% 5,220 -51.1% Interisland 17,863 25.0% 14,291 11.6%
TOTAL 22,486 15.2% 19,511 -16.9%
MAIL (U.S. TONS) 2,448 -9.7% 2,710 -3.9%
AIRCRAFT OPERATIONS 77,025 4.7% 73,537 10.7%

PAGE 3 OF 3
CALENDAR YEAR 1996 HIGHLIGHTS
% %C.Y. 1996 change C.Y. 1995 change
------------------------------------ ----- -------------------- ----- ---------------- ------------------ -------------------- ----- ------------------
PASSENGERS FOR OTHER AIRPORTS:
Upolu 0 0.0% 0 0.0% Waimea-Kohala 1,866 -34.4% 2,845 -4.1% Hana 10,699 -15.9% 12,719 -7.5% Kapalua 156,748 6.4% 147,298 -21.9% Molokai 247,477 1.8% 243,131 -4.1% Kalaupapa 8,101 -32.4% 11,977 -16.1% Lanai 167,919 -1.0% 169,682 -90.0% Princeville * 12,698 -36.1% 19,860 -28.9%
TOTAL 605,508 -0.3% 607,512 -9.6%
CARGO (U.S. TONS) FOR OTHER AIRPORTS:
Upolu 0 0.0% 0 0.0% Waimea-Kohala 89 394.4% 18 50.0% Hana 1 54.7% 1 100.0% Kapalua 681 -13.5% 787 19.1% Molokai 680 21.6% 559 1.8% Kalaupapa 0 0.0% 0 -100.0% Lanai 527 -11.4% 595 -14.0% Princeville * 0 0.0% 0 0.0%
TOTAL 1,978 0.9% 1,960 2.2%
* Leased by the State of Hawaii.

PAGE 1 OF 3
CALENDAR YEAR 1995 HIGHLIGHTS
% %C.Y. 1995 change C.Y. 1994 change
------------------------------------ ----- -------------------- ----- ---------------- ------------------ -------------------- ----- ------------------STATEWIDE:
PASSENGERS 36,736,824 3.2% 35,586,290 5.2% CARGO (U.S. TONS) 455,765 -3.6% 472,928 10.4% MAIL (U.S. TONS) 111,223 -1.5% 112,906 3.5%
HONOLULU INTERNATIONAL AIRPORT:
PASSENGERS Overseas (enplaned, deplaned, and transits)
14,208,722 1.7% 13,965,914 3.1%
Interisland 9,464,172 4.8% 9,030,062 6.1%TOTAL 23,672,894 2.9% 22,995,976 4.2%
CARGO (U.S. TONS) Overseas 289,642 -4.0% 301,795 16.6% Interisland 72,395 0.1% 72,344 0.9%
TOTAL 362,037 -3.2% 374,139 13.2%
MAIL (U.S. TONS) 97,372 -1.5% 98,904 3.2%
AIRCRAFT OPERATIONS 373,926 4.0% 359,569 0.3%
HILO INTERNATIONAL AIRPORT:
PASSENGERS Overseas 0 0.0% 0 -100.0% Interisland 1,627,715 1.5% 1,603,621 1.0%
TOTAL 1,627,715 1.5% 1,603,621 1.0%
CARGO (U.S. TONS) Overseas 50 100.0% 0 0.0% Interisland 24,326 -2.8% 25,019 -1.4%
TOTAL 24,376 -2.6% 25,019 -1.4%
MAIL (U.S. TONS) 3,264 -0.7% 3,287 4.4%
AIRCRAFT OPERATIONS 84,917 -1.6% 86,292 -6.5%

PAGE 2 OF 3
CALENDAR YEAR 1995 HIGHLIGHTS
% %C.Y. 1995 change C.Y. 1994 change
------------------------------------ ----- -------------------- ----- ---------------- ------------------ -------------------- ----- ------------------KAHULUI AIRPORT:
PASSENGERS Overseas 1,528,645 3.2% 1,481,478 16.1% Interisland 4,526,116 5.4% 4,293,040 5.2%
TOTAL 6,054,761 4.9% 5,774,518 7.8%
CARGO (U.S. TONS) Overseas 11,678 1.1% 11,549 -8.2% Interisland 23,314 -0.2% 23,354 2.7%
TOTAL 34,992 0.3% 34,903 -1.2%
MAIL (U.S. TONS) 5,176 0.1% 5,173 7.4%
AIRCRAFT OPERATIONS 179,883 0.4% 179,227 4.0%
LIHUE AIRPORT:
PASSENGERS Overseas 808 100.0% 0 -100.0% Interisland 2,469,679 7.3% 2,301,290 25.7% TOTAL 2,470,487 7.4% 2,301,290 25.1%
CARGO (U.S. TONS) Overseas 0 0.0% 0 -100.0% Interisland 12,887 -4.3% 13,467 -0.5%
TOTAL 12,887 -4.3% 13,467 -2.9%
MAIL (U.S. TONS) 2,553 0.1% 2,550 3.2%
AIRCRAFT OPERATIONS 97,400 6.4% 91,582 29.2%
KEAHOLE-KONA INTERNATIONAL AIRPORT:
PASSENGERS Overseas 222,087 -25.3% 297,480 0.2% Interisland 2,081,368 7.2% 1,941,103 3.1%
TOTAL 2,303,455 2.9% 2,238,583 2.7%
CARGO (U.S. TONS) Overseas 5,220 -51.1% 10,679 11.6% Interisland 14,291 11.6% 12,803 6.7%
TOTAL 19,511 -16.9% 23,482 8.9%
MAIL (U.S. TONS) 2,710 -3.9% 2,821 5.7%
AIRCRAFT OPERATIONS 73,537 10.7% 66,438 10.9%

PAGE 3 OF 3
CALENDAR YEAR 1995 HIGHLIGHTS
% %C.Y. 1995 change C.Y. 1994 change
------------------------------------ ----- -------------------- ----- ---------------- ------------------ -------------------- ----- ------------------
PASSENGERS FOR OTHER AIRPORTS:
Upolu 0 0.0% 0 0.0% Waimea-Kohala 2,845 -4.1% 2,968 27.2% Hana 12,719 -7.5% 13,755 -22.9% Kapalua 147,298 -21.9% 188,604 -38.6% Molokai 243,131 -4.1% 253,520 -9.5% Kalaupapa 11,977 -16.1% 14,270 7.2% Lanai 169,682 -0.9% 171,242 20.1% Princeville * 19,860 -28.9% 27,943 -11.4%
TOTAL 607,512 -9.6% 672,302 -15.4%
CARGO (U.S. TONS) FOR OTHER AIRPORTS:
Upolu 0 0.0% 0 0.0% Waimea-Kohala 18 50.0% 12 300.0% Hana 1 100.0% 0 -100.0% Kapalua 787 19.1% 661 -4.8% Molokai 559 1.8% 549 3.4% Kalaupapa 0 -100.0% 4 -60.0% Lanai 595 -14.0% 692 38.1% Princeville * 0 0.0% 0 0.0%
TOTAL 1,960 2.2% 1,918 10.2%
* Privately-owned airport.
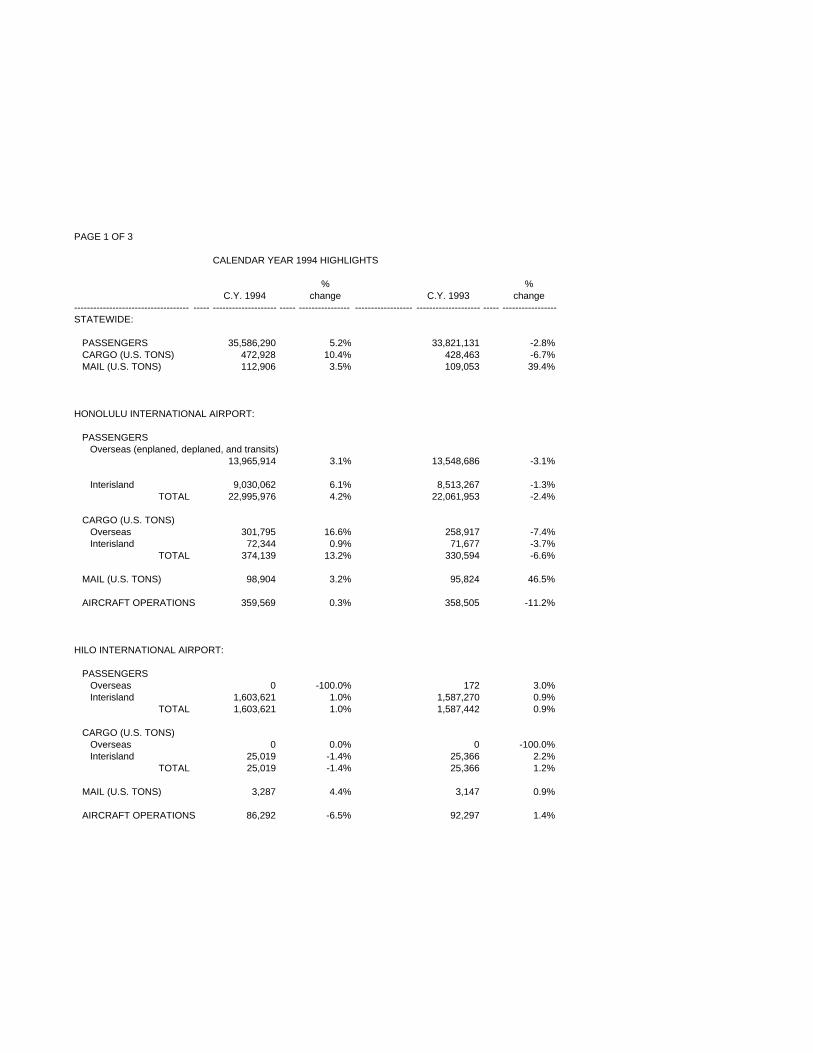
PAGE 1 OF 3
CALENDAR YEAR 1994 HIGHLIGHTS
% %C.Y. 1994 change C.Y. 1993 change
------------------------------------ ----- -------------------- ----- ---------------- ------------------ -------------------- ----- ------------------STATEWIDE:
PASSENGERS 35,586,290 5.2% 33,821,131 -2.8% CARGO (U.S. TONS) 472,928 10.4% 428,463 -6.7% MAIL (U.S. TONS) 112,906 3.5% 109,053 39.4%
HONOLULU INTERNATIONAL AIRPORT:
PASSENGERS Overseas (enplaned, deplaned, and transits)
13,965,914 3.1% 13,548,686 -3.1%
Interisland 9,030,062 6.1% 8,513,267 -1.3%TOTAL 22,995,976 4.2% 22,061,953 -2.4%
CARGO (U.S. TONS) Overseas 301,795 16.6% 258,917 -7.4% Interisland 72,344 0.9% 71,677 -3.7%
TOTAL 374,139 13.2% 330,594 -6.6%
MAIL (U.S. TONS) 98,904 3.2% 95,824 46.5%
AIRCRAFT OPERATIONS 359,569 0.3% 358,505 -11.2%
HILO INTERNATIONAL AIRPORT:
PASSENGERS Overseas 0 -100.0% 172 3.0% Interisland 1,603,621 1.0% 1,587,270 0.9%
TOTAL 1,603,621 1.0% 1,587,442 0.9%
CARGO (U.S. TONS) Overseas 0 0.0% 0 -100.0% Interisland 25,019 -1.4% 25,366 2.2%
TOTAL 25,019 -1.4% 25,366 1.2%
MAIL (U.S. TONS) 3,287 4.4% 3,147 0.9%
AIRCRAFT OPERATIONS 86,292 -6.5% 92,297 1.4%

PAGE 2 OF 3
CALENDAR YEAR 1994 HIGHLIGHTS
% %C.Y. 1994 change C.Y. 1993 change
------------------------------------ ----- -------------------- ----- ---------------- ------------------ -------------------- ----- ------------------KAHULUI AIRPORT:
PASSENGERS Overseas 1,481,478 16.1% 1,276,191 -0.4% Interisland 4,293,040 5.2% 4,081,848 4.6%
TOTAL 5,774,518 7.8% 5,358,039 3.4%
CARGO (U.S. TONS) Overseas 11,549 -8.2% 12,585 -22.2% Interisland 23,354 2.7% 22,737 -5.6%
TOTAL 34,903 -1.2% 35,322 -12.3%
MAIL (U.S. TONS) 5,173 7.4% 4,815 5.8%
AIRCRAFT OPERATIONS 179,227 4.0% 172,265 -3.6%
LIHUE AIRPORT:
PASSENGERS Overseas 0 -100.0% 8,666 91.8% Interisland 2,301,290 25.7% 1,830,961 -19.6% TOTAL 2,301,290 25.1% 1,839,627 -22.8%
CARGO (U.S. TONS) Overseas 0 -100.0% 338 -78.2% Interisland 13,467 -0.5% 13,537 -11.1%
TOTAL 13,467 -2.9% 13,875 -17.3%
MAIL (U.S. TONS) 2,550 3.2% 2,472 1.1%
AIRCRAFT OPERATIONS 91,582 29.2% 70,910 -31.6%
KEAHOLE-KONA INTERNATIONAL AIRPORT:
PASSENGERS Overseas 297,480 0.2% 296,776 6.4% Interisland 1,941,103 3.1% 1,882,286 0.0%
TOTAL 2,238,583 2.7% 2,179,062 0.8%
CARGO (U.S. TONS) Overseas 10,679 11.6% 9,569 21.5% Interisland 12,803 6.7% 11,996 0.9%
TOTAL 23,482 8.9% 21,565 9.1%
MAIL (U.S. TONS) 2,821 5.7% 2,668 3.5%
AIRCRAFT OPERATIONS 66,438 10.9% 59,904 -6.3%

PAGE 3 OF 3
CALENDAR YEAR 1994 HIGHLIGHTS
% %C.Y. 1994 change C.Y. 1993 change
------------------------------------ ----- -------------------- ----- ---------------- ------------------ -------------------- ----- ------------------
PASSENGERS FOR OTHER AIRPORTS:
Upolu 0 0.0% 0 0.0% Waimea-Kohala 2,968 27.2% 2,333 -83.3% Hana 13,755 -22.9% 17,841 -19.7% Kapalua 188,604 -38.6% 307,363 -7.8% Molokai 253,520 -9.5% 280,044 -11.0% Kalaupapa 14,270 7.2% 13,309 -1.6% Lanai 171,242 20.1% 142,595 2.8% Princeville * 27,943 -11.4% 31,523 -31.1%
TOTAL 672,302 -15.4% 795,008 -9.9%
CARGO (U.S. TONS) FOR OTHER AIRPORTS:
Upolu 0 0.0% 0 -100.0% Waimea-Kohala 12 300.0% 3 200.0% Hana 0 -100.0% 2 -80.0% Kapalua 661 -4.8% 694 0.1% Molokai 549 3.4% 531 -50.1% Kalaupapa 4 -60.0% 10 -52.4% Lanai 692 38.1% 501 -70.1% Princeville * 0 0.0% 0 0.0%
TOTAL 1,918 10.2% 1,741 -49.8%
* Privately-owned airport.

PAGE 1 OF 3
CALENDAR YEAR 1993 HIGHLIGHTS
% %C.Y. 1993 change C.Y. 1992 change
------------------------------------ ----- -------------------- ----- ---------------- ------------------ -------------------- ----- ------------------STATEWIDE:
PASSENGERS 33,821,131 -2.8% 34,791,020 2.0% CARGO (U.S. TONS) 428,463 -6.7% 459,353 -1.9% MAIL (U.S. TONS) 109,053 39.4% 78,255 24.9%
HONOLULU INTERNATIONAL AIRPORT:
PASSENGERS Overseas (enplaned, deplaned, and transits)
13,548,686 -3.1% 13,987,091 1.2%
Interisland 8,513,267 -1.3% 8,621,097 2.6%TOTAL 22,061,953 -2.4% 22,608,188 1.7%
CARGO (U.S. TONS) Overseas 258,917 -7.4% 279,592 -7.1% Interisland 71,677 -3.7% 74,421 7.5%
TOTAL 330,594 -6.6% 354,013 -4.3%
MAIL (U.S. TONS) 95,824 46.5% 65,427 28.8%
AIRCRAFT OPERATIONS 358,505 -11.2% 403,628 0.0%
HILO INTERNATIONAL AIRPORT:
PASSENGERS Overseas 172 3.0% 167 100.0% Interisland 1,587,270 0.9% 1,573,647 9.3%
TOTAL 1,587,442 0.9% 1,573,814 9.3%
CARGO (U.S. TONS) Overseas 0 -100.0% 248 -26.0% Interisland 25,366 2.2% 24,808 -0.2%
TOTAL 25,366 1.2% 25,056 -0.6%
MAIL (U.S. TONS) 3,147 0.9% 3,119 6.8%
AIRCRAFT OPERATIONS 92,297 1.4% 91,055 3.2%
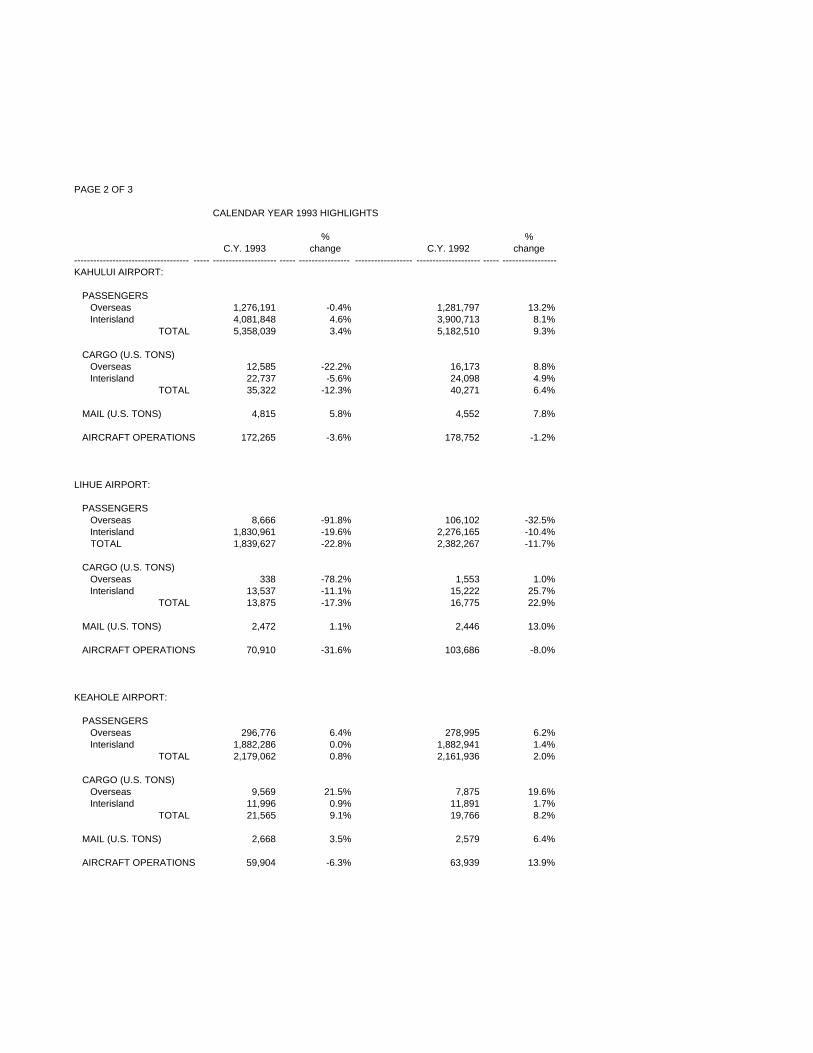
PAGE 2 OF 3
CALENDAR YEAR 1993 HIGHLIGHTS
% %C.Y. 1993 change C.Y. 1992 change
------------------------------------ ----- -------------------- ----- ---------------- ------------------ -------------------- ----- ------------------KAHULUI AIRPORT:
PASSENGERS Overseas 1,276,191 -0.4% 1,281,797 13.2% Interisland 4,081,848 4.6% 3,900,713 8.1%
TOTAL 5,358,039 3.4% 5,182,510 9.3%
CARGO (U.S. TONS) Overseas 12,585 -22.2% 16,173 8.8% Interisland 22,737 -5.6% 24,098 4.9%
TOTAL 35,322 -12.3% 40,271 6.4%
MAIL (U.S. TONS) 4,815 5.8% 4,552 7.8%
AIRCRAFT OPERATIONS 172,265 -3.6% 178,752 -1.2%
LIHUE AIRPORT:
PASSENGERS Overseas 8,666 -91.8% 106,102 -32.5% Interisland 1,830,961 -19.6% 2,276,165 -10.4% TOTAL 1,839,627 -22.8% 2,382,267 -11.7%
CARGO (U.S. TONS) Overseas 338 -78.2% 1,553 1.0% Interisland 13,537 -11.1% 15,222 25.7%
TOTAL 13,875 -17.3% 16,775 22.9%
MAIL (U.S. TONS) 2,472 1.1% 2,446 13.0%
AIRCRAFT OPERATIONS 70,910 -31.6% 103,686 -8.0%
KEAHOLE AIRPORT:
PASSENGERS Overseas 296,776 6.4% 278,995 6.2% Interisland 1,882,286 0.0% 1,882,941 1.4%
TOTAL 2,179,062 0.8% 2,161,936 2.0%
CARGO (U.S. TONS) Overseas 9,569 21.5% 7,875 19.6% Interisland 11,996 0.9% 11,891 1.7%
TOTAL 21,565 9.1% 19,766 8.2%
MAIL (U.S. TONS) 2,668 3.5% 2,579 6.4%
AIRCRAFT OPERATIONS 59,904 -6.3% 63,939 13.9%

PAGE 3 OF 3
CALENDAR YEAR 1993 HIGHLIGHTS
% %C.Y. 1993 change C.Y. 1992 change
------------------------------------ ----- -------------------- ----- ---------------- ------------------ -------------------- ----- ------------------
PASSENGERS FOR OTHER AIRPORTS:
Upolu 0 0.0% 0 -100.0% Waimea-Kohala 2,333 -83.3% 14,011 2.7% Hana 17,841 -19.7% 22,213 -6.2% Kapalua 307,363 -7.8% 333,514 -3.9% Molokai 280,044 -11.0% 314,489 -0.7% Kalaupapa 13,309 -1.6% 13,528 -9.0% Lanai 142,595 2.8% 138,672 8.8% Princeville * 31,523 -31.3% 45,867 5.7%
TOTAL 795,008 -9.9% 882,294 -0.5%
CARGO (U.S. TONS) FOR OTHER AIRPORTS:
Upolu 0 -100.0% 3 -57.0% Waimea-Kohala 3 200.0% 1 -75.0% Hana 2 -80.0% 10 -60.0% Kapalua 694 0.1% 693 9.7% Molokai 531 -50.1% 1,064 11.5% Kalaupapa 10 -52.4% 21 19.2% Lanai 501 -70.1% 1,678 4.5% Princeville * 0 0.0% 0 0.0%
TOTAL 1,741 -49.8% 3,470 6.7%
* Privately-owned airport.
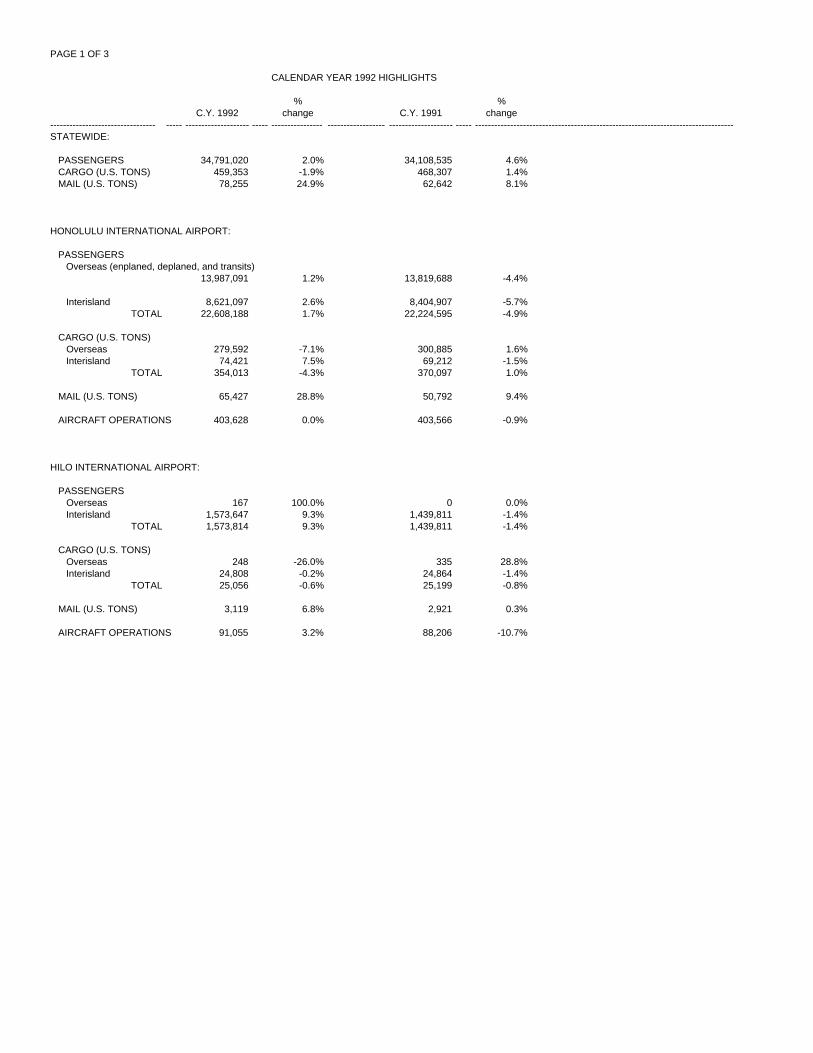
PAGE 1 OF 3
CALENDAR YEAR 1992 HIGHLIGHTS
% %C.Y. 1992 change C.Y. 1991 change
--------------------------------- ----- -------------------- ----- ---------------- ------------------ -------------------- ----- ---------------------------------------------------------------------------------STATEWIDE:
PASSENGERS 34,791,020 2.0% 34,108,535 4.6% CARGO (U.S. TONS) 459,353 -1.9% 468,307 1.4% MAIL (U.S. TONS) 78,255 24.9% 62,642 8.1%
HONOLULU INTERNATIONAL AIRPORT:
PASSENGERS Overseas (enplaned, deplaned, and transits)
13,987,091 1.2% 13,819,688 -4.4%
Interisland 8,621,097 2.6% 8,404,907 -5.7%TOTAL 22,608,188 1.7% 22,224,595 -4.9%
CARGO (U.S. TONS) Overseas 279,592 -7.1% 300,885 1.6% Interisland 74,421 7.5% 69,212 -1.5%
TOTAL 354,013 -4.3% 370,097 1.0%
MAIL (U.S. TONS) 65,427 28.8% 50,792 9.4%
AIRCRAFT OPERATIONS 403,628 0.0% 403,566 -0.9%
HILO INTERNATIONAL AIRPORT:
PASSENGERS Overseas 167 100.0% 0 0.0% Interisland 1,573,647 9.3% 1,439,811 -1.4%
TOTAL 1,573,814 9.3% 1,439,811 -1.4%
CARGO (U.S. TONS) Overseas 248 -26.0% 335 28.8% Interisland 24,808 -0.2% 24,864 -1.4%
TOTAL 25,056 -0.6% 25,199 -0.8%
MAIL (U.S. TONS) 3,119 6.8% 2,921 0.3%
AIRCRAFT OPERATIONS 91,055 3.2% 88,206 -10.7%
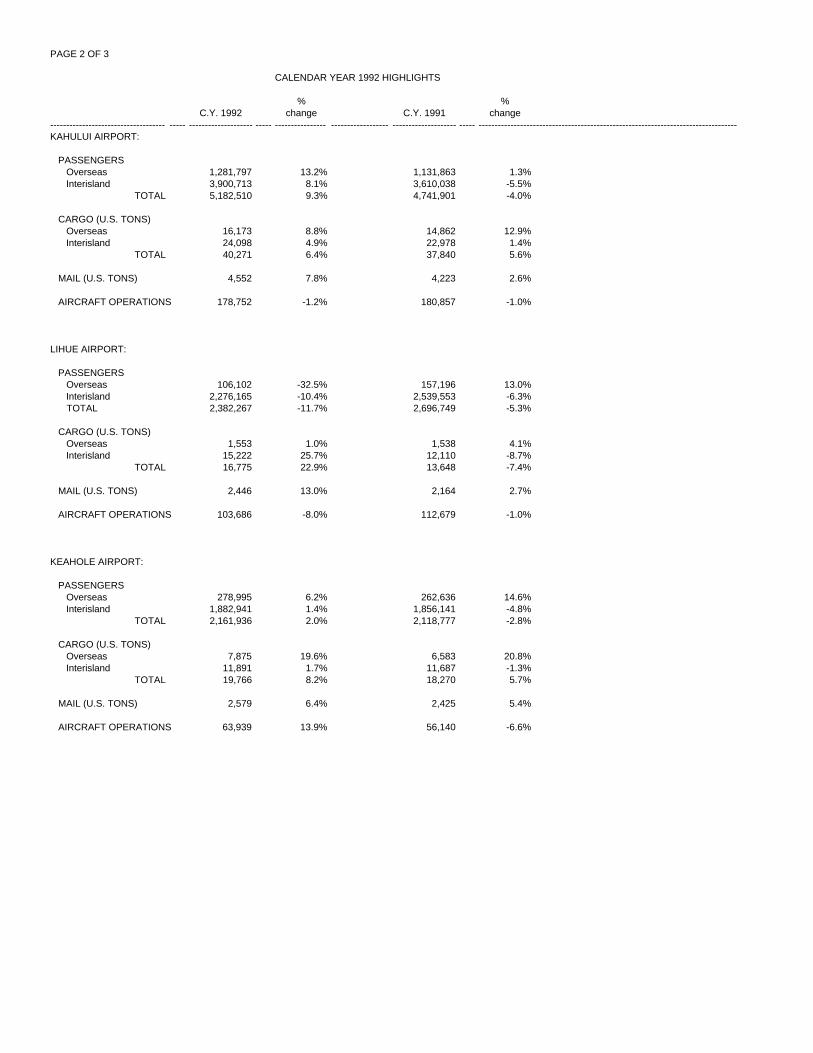
PAGE 2 OF 3
CALENDAR YEAR 1992 HIGHLIGHTS
% %C.Y. 1992 change C.Y. 1991 change
------------------------------------ ----- -------------------- ----- ---------------- ------------------ -------------------- ----- ---------------------------------------------------------------------------------KAHULUI AIRPORT:
PASSENGERS Overseas 1,281,797 13.2% 1,131,863 1.3% Interisland 3,900,713 8.1% 3,610,038 -5.5%
TOTAL 5,182,510 9.3% 4,741,901 -4.0%
CARGO (U.S. TONS) Overseas 16,173 8.8% 14,862 12.9% Interisland 24,098 4.9% 22,978 1.4%
TOTAL 40,271 6.4% 37,840 5.6%
MAIL (U.S. TONS) 4,552 7.8% 4,223 2.6%
AIRCRAFT OPERATIONS 178,752 -1.2% 180,857 -1.0%
LIHUE AIRPORT:
PASSENGERS Overseas 106,102 -32.5% 157,196 13.0% Interisland 2,276,165 -10.4% 2,539,553 -6.3% TOTAL 2,382,267 -11.7% 2,696,749 -5.3%
CARGO (U.S. TONS) Overseas 1,553 1.0% 1,538 4.1% Interisland 15,222 25.7% 12,110 -8.7%
TOTAL 16,775 22.9% 13,648 -7.4%
MAIL (U.S. TONS) 2,446 13.0% 2,164 2.7%
AIRCRAFT OPERATIONS 103,686 -8.0% 112,679 -1.0%
KEAHOLE AIRPORT:
PASSENGERS Overseas 278,995 6.2% 262,636 14.6% Interisland 1,882,941 1.4% 1,856,141 -4.8%
TOTAL 2,161,936 2.0% 2,118,777 -2.8%
CARGO (U.S. TONS) Overseas 7,875 19.6% 6,583 20.8% Interisland 11,891 1.7% 11,687 -1.3%
TOTAL 19,766 8.2% 18,270 5.7%
MAIL (U.S. TONS) 2,579 6.4% 2,425 5.4%
AIRCRAFT OPERATIONS 63,939 13.9% 56,140 -6.6%

PAGE 3 OF 3
CALENDAR YEAR 1992 HIGHLIGHTS
% %C.Y. 1992 change C.Y. 1991 change
------------------------------------ ----- -------------------- ----- ---------------- ------------------ -------------------- ----- ------------------
PASSENGERS FOR OTHER AIRPORTS:
Upolu 0 -100.0% 3 -7.3% Waimea-Kohala 14,011 2.7% 13,649 -5.9% Hana 22,213 -6.2% 23,683 6.6% Kapalua 333,514 -3.9% 347,076 -19.3% Molokai 314,489 -0.7% 316,576 -4.4% Kalaupapa 13,528 -9.0% 14,861 21.4% Lanai 138,672 8.8% 127,457 13% Others * 45,867 5.7% 43,397 16.6%
TOTAL 882,294 -0.5% 886,702 -7.6%
CARGO (U.S. TONS) FOR OTHER AIRPORTS:
Upolu 3 -57.1% 7 0% Waimea-Kohala 1 -75.0% 4 -97.1% Hana 10 -60.0% 25 -26.5% Kapalua 693 9.7% 632 -4.5% Molokai 1,064 11.5% 954 21.8% Kalaupapa 21 -19.2% 26 420.0% Lanai 1,678 4.5% 1,605 163.5% Others * 0 0.0% 0 0.0%
TOTAL 3,470 6.7% 3,253 45.3%
* Privately-owned airport(s).
Added Kapalua-West Maui Airport to the CY 1992 summary.

PAGE 1 OF 3
CALENDAR YEAR 1991 HIGHLIGHTS
% %C.Y. 1991 change C.Y. 1990 change
------------------------------------ --- -------------------- ----- ---------------- ------------------ -------------------- ----- ---------------------------------------------------------------------------------STATEWIDE:
PASSENGERS 34,108,534 -4.6% 35,752,507 3.1% CARGO (U.S. TONS) 468,307 1.4% 461,942 1.6% MAIL (U.S. TONS) 62,642 8.1% 57,959 12.3%
HONOLULU INTERNATIONAL AIRPORT:
PASSENGERS Overseas (enplaned, deplaned, and transits)
13,819,687 -4.4% 14,452,593 3.2%
Interisland 8,404,907 -5.7% 8,915,177 3.5%TOTAL 22,224,594 -4.9% 23,367,770 3.3%
CARGO (U.S. TONS) Overseas 300,885 1.6% 296,173 2.7% Interisland 69,212 -1.5% 70,288 -0.5%
TOTAL 370,097 1.0% 366,461 2.0%
MAIL (U.S. TONS) 50,792 9.4% 46,425 13.1%
AIRCRAFT OPERATIONS 403,566 -0.9% 407,048 0.8%
HILO INTERNATIONAL AIRPORT:
PASSENGERS Overseas 0 0.0% 0 0.0% Interisland 1,439,811 -1.4% 1,460,610 10.2%
TOTAL 1,439,811 -1.4% 1,460,610 10.2%
CARGO (U.S. TONS) Overseas 335 28.8% 260 100.0% Interisland 24,864 -1.1% 25,134 -7.3%
TOTAL 25,199 -0.8% 25,394 -6.4%
MAIL (U.S. TONS) 2,921 0.3% 2,911 9.6%
AIRCRAFT OPERATIONS 88,206 -10.7% 98,755 6.0%

PAGE 2 OF 3
CALENDAR YEAR 1991 HIGHLIGHTS
% %C.Y. 1991 change C.Y. 1990 change
------------------------------------ ----- -------------------- ----- ---------------- ------------------ -------------------- ----- ---------------------------------------------------------------------------------KAHULUI AIRPORT:
PASSENGERS Overseas 1,131,863 1.3% 1,117,242 3.3% Interisland 3,610,038 -5.5% 3,819,729 4.2%
TOTAL 4,741,901 -4.0% 4,936,971 4.0%
CARGO (U.S. TONS) Overseas 14,862 12.9% 13,166 11.2% Interisland 22,978 1.4% 22,653 -0.3%
TOTAL 37,840 5.6% 35,819 3.6%
MAIL (U.S. TONS) 4,223 2.6% 4,117 6.9%
AIRCRAFT OPERATIONS 180,857 -1.0% 182,686 2.7%
LIHUE AIRPORT:
PASSENGERS Overseas 157,196 13.0% 139,152 11.5% Interisland 2,539,553 -6.3% 2,709,171 -1.6% TOTAL 2,696,749 -5.3% 2,848,323 -1.0%
CARGO (U.S. TONS) Overseas 1,538 4.1% 1,478 44.6% Interisland 12,110 -8.7% 13,261 -0.6%
TOTAL 13,648 -7.4% 14,739 2.6%
MAIL (U.S. TONS) 2,164 2.7% 2,107 6.8%
AIRCRAFT OPERATIONS 112,679 -1.0% 113,860 -2.5%
KEAHOLE AIRPORT:
PASSENGERS Overseas 262,636 14.6% 229,212 7.1% Interisland 1,856,141 -4.8% 1,949,484 3.5%
TOTAL 2,118,777 -2.8% 2,178,696 3.8%
CARGO (U.S. TONS) Overseas 6,583 20.8% 5,448 -12.1% Interisland 11,687 -1.3% 11,842 11.5%
TOTAL 18,270 5.7% 17,290 2.8%
MAIL (U.S. TONS) 2,425 5.4% 2,301 14.6%
AIRCRAFT OPERATIONS 56,140 -6.6% 60,086 7.9%

PAGE 3 OF 3
CALENDAR YEAR 1991 HIGHLIGHTS
% %C.Y. 1991 change C.Y. 1990 change
------------------------------------ ----- -------------------- ----- ---------------- ------------------ -------------------- ----- ---------------------------------------------------------------------------------
PASSENGERS FOR OTHER AIRPORTS:
Upolu 3 -76.9% 13 225.0% Waimea-Kohala 13,649 -5.9% 14,499 -22.2% Hana 23,683 6.6% 22,221 -12.2% Kaanapali * 0 0.0% 0 0.0% Molokai 316,576 -4.4% 331,249 -2.3% Kalaupapa 14,861 21.4% 12,244 -19.7% Lanai 127,457 13.0% 112,839 7.9% Others * 390,473 -16.4% 467,072 11.5%
TOTAL 886,702 -7.6% 960,137 -6.8%
CARGO (U.S. TONS) FOR OTHER AIRPORTS:
Upolu 7 0.0% 7 16.7% Waimea-Kohala 4 -97.1% 139 -58.8% Hana 25 -26.5% 34 325.0% Kaanapali * 0 0.0% 0 0.0% Molokai 954 21.8% 783 2.2% Kalaupapa 26 420.0% 5 -92.8% Lanai 1,605 163.5% 609 -14.1% Others * 632 -4.7% 663 9.4%
TOTAL 3,253 45.2% 2,240 -10.4%
* Privately-owned airports.

PAGE 1 OF 3
CALENDAR YEA 1990 HIGHLIGHTS
% %C.Y. 1990 change C.Y. 1989 change
------------------------------------ --- -------------------- ----- ---------------- ------------------ -------------------- ----- ---------------------------------------------------------------------------------STATEWIDE:
PASSENGERS 35,752,507 3.1% 34,693,747 6.0% CARGO (U.S. TONS) 461,942 1.6% 454,498 14.7% MAIL (U.S. TONS) 57,959 12.3% 51,606 7.0%
HONOLULU INTERNATIONAL AIRPORT:
PASSENGERS Overseas (enplaned, deplaned, and transits)
14,452,593 3.2% 14,005,324 3.2%
Interisland 8,915,177 3.5% 8,612,016 7.5%TOTAL 23,367,770 3.3% 22,617,340 4.8%
CARGO (U.S. TONS) Overseas 296,173 2.7% 288,479 15.5% Interisland 70,288 -0.5% 70,653 11.9%
TOTAL 366,461 2.0% 359,132 14.8%
MAIL (U.S. TONS) 46,425 13.1% 41,036 6.3%
AIRCRAFT OPERATIONS 407,048 0.8% 403,635 6.8%
HILO INTERNATIONAL AIRPORT:
PASSENGERS Overseas 0 0.0% 0 0.0% Interisland 1,460,610 10.2% 1,325,672 9.9%
TOTAL 1,460,610 10.2% 1,325,672 9.9%
CARGO (U.S. TONS) Overseas 260 100.0% 0 0.0% Interisland 25,134 -7.3% 27,126 8.1%
TOTAL 25,394 -6.4% 27,126 8.1%
MAIL (U.S. TONS) 2,911 9.6% 2,655 9.9%
AIRCRAFT OPERATIONS 98,755 6.0% 93,202 9.3%
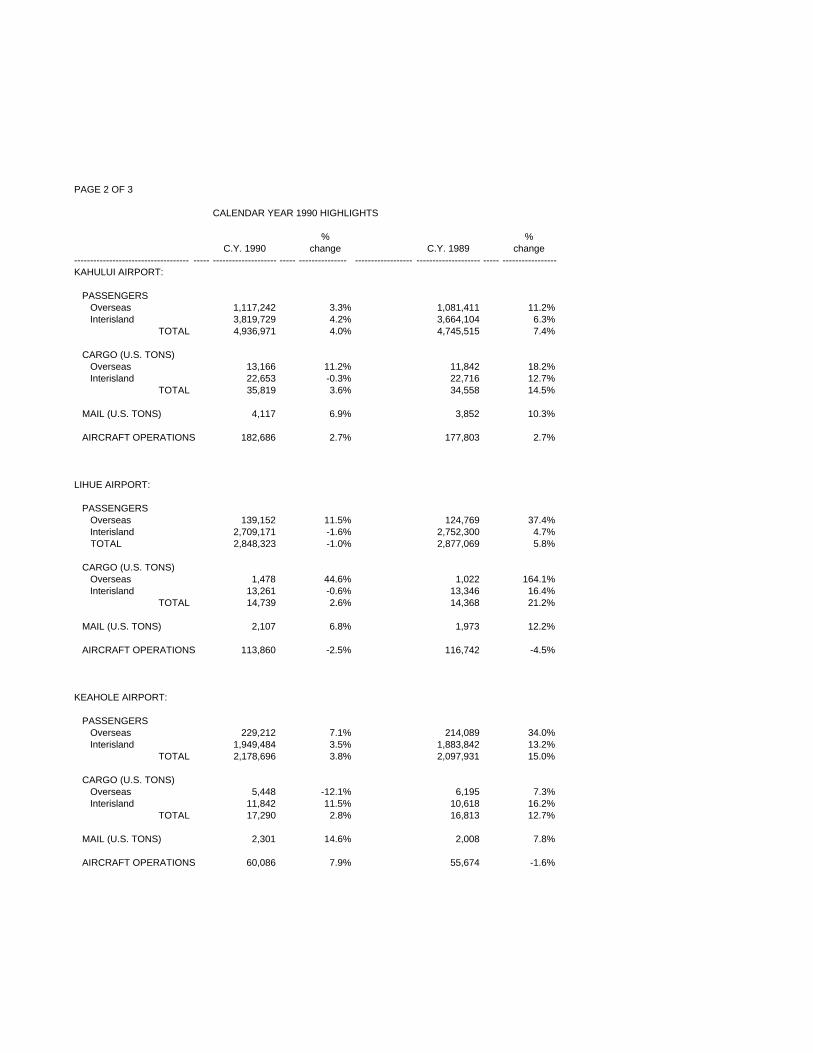
PAGE 2 OF 3
CALENDAR YEAR 1990 HIGHLIGHTS
% %C.Y. 1990 change C.Y. 1989 change
------------------------------------ ----- -------------------- ----- --------------- ------------------ -------------------- ----- ------------------KAHULUI AIRPORT:
PASSENGERS Overseas 1,117,242 3.3% 1,081,411 11.2% Interisland 3,819,729 4.2% 3,664,104 6.3%
TOTAL 4,936,971 4.0% 4,745,515 7.4%
CARGO (U.S. TONS) Overseas 13,166 11.2% 11,842 18.2% Interisland 22,653 -0.3% 22,716 12.7%
TOTAL 35,819 3.6% 34,558 14.5%
MAIL (U.S. TONS) 4,117 6.9% 3,852 10.3%
AIRCRAFT OPERATIONS 182,686 2.7% 177,803 2.7%
LIHUE AIRPORT:
PASSENGERS Overseas 139,152 11.5% 124,769 37.4% Interisland 2,709,171 -1.6% 2,752,300 4.7% TOTAL 2,848,323 -1.0% 2,877,069 5.8%
CARGO (U.S. TONS) Overseas 1,478 44.6% 1,022 164.1% Interisland 13,261 -0.6% 13,346 16.4%
TOTAL 14,739 2.6% 14,368 21.2%
MAIL (U.S. TONS) 2,107 6.8% 1,973 12.2%
AIRCRAFT OPERATIONS 113,860 -2.5% 116,742 -4.5%
KEAHOLE AIRPORT:
PASSENGERS Overseas 229,212 7.1% 214,089 34.0% Interisland 1,949,484 3.5% 1,883,842 13.2%
TOTAL 2,178,696 3.8% 2,097,931 15.0%
CARGO (U.S. TONS) Overseas 5,448 -12.1% 6,195 7.3% Interisland 11,842 11.5% 10,618 16.2%
TOTAL 17,290 2.8% 16,813 12.7%
MAIL (U.S. TONS) 2,301 14.6% 2,008 7.8%
AIRCRAFT OPERATIONS 60,086 7.9% 55,674 -1.6%

PAGE 3 OF 3
CALENDAR YEAR 1990 HIGHLIGHTS
% %C.Y. 1990 change C.Y. 1989 change
------------------------------------ ----- -------------------- ----- ---------------- ------------------ -------------------- ----- ------------------
PASSENGERS FOR OTHER AIRPORTS:
Upolu 13 225.0% 4 100.0% Waimea-Kohala 14,499 -22.2% 18,637 8.9% Hana 22,221 -12.2% 25,296 9.9% Kaanapali * 0 0.0% 0 0.0% Molokai 331,249 -2.3% 338,980 2.1% Kalaupapa 12,244 -19.7% 15,251 11.5% Lanai 112,839 7.9% 104,560 9.5% Others * 467,072 -11.5% 527,492 7.7%
TOTAL 960,137 -6.8% 1,030,220 6.1%
CARGO (U.S. TONS) FOR OTHER AIRPORTS:
Upolu 7 16.7% 6 100.0% Waimea-Kohala 139 -58.8% 337 100.0% Hana 34 325.0% 8 100.0% Kaanapali * 0 0.0% 0 0.0% Molokai 783 2.2% 766 9.6% Kalaupapa 5 -92.8% 69 430.0% Lanai 609 -14.1% 709 486.0% Others * 663 9.4% 606 58.6%
TOTAL 2,240 -10.4% 2,501 105.8%
* Privately-owned airports.

PAGE 1 OF 3
CALENDAR YEAR 1989 HIGHLIGHTS
% %C.Y. 1989 change C.Y. 1988 change
------------------------------------ ----- -------------------- ----- ---------------- ------------------ -------------------- ----- ------------------STATEWIDE:
PASSENGERS 34,693,747 6.0% 32,718,530 4.5% CARGO (U.S. TONS) 454,498 14.7% 396,182 14.5% MAIL (U.S. TONS) 51,606 7.0% 48,243 9.8%
HONOLULU INTERNATIONAL AIRPORT:
PASSENGERS Overseas (enplaned, deplaned, and transits)
14,005,324 3.2% 13,565,768 8.1%
Interisland 8,612,016 7.5% 8,011,773 2.3%TOTAL 22,617,340 4.8% 21,577,541 5.9%
CARGO (U.S. TONS) Overseas 288,479 15.5% 249,798 20.4% Interisland 70,653 11.9% 63,123 6.9%
TOTAL 359,132 14.8% 312,921 17.4%
MAIL (U.S. TONS) 41,036 6.3% 38,588 9.9%
AIRCRAFT OPERATIONS 403,635 6.8% 377,919 -1.9%
HILO INTERNATIONAL AIRPORT:
PASSENGERS Overseas 0 0.0% 0 -100.0% Interisland 1,325,672 9.9% 1,206,550 0.3%
TOTAL 1,325,672 9.9% 1,206,550 0.2%
CARGO (U.S. TONS) Overseas 0 0.0% 0 0.0% Interisland 27,126 8.1% 25,103 18.6%
TOTAL 27,126 8.1% 25,103 18.6%
MAIL (U.S. TONS) 2,655 9.9% 2,415 1.8%
AIRCRAFT OPERATIONS 93,202 9.3% 85,267 6.4%

PAGE 2 OF 3
CALENDAR YEAR 1989 HIGHLIGHTS
% %C.Y. 1989 change C.Y. 1988 change
------------------------------------ ----- -------------------- ----- --------------- --------------- ------------------ ----- ----------------KAHULUI AIRPORT:
PASSENGERS Overseas 1,081,411 11.2% 972,321 12.5% Interisland 3,664,104 6.3% 3,446,912 -5.1%
TOTAL 4,745,515 7.4% 4,419,233 -1.7%
CARGO (U.S. TONS) Overseas 11,842 18.2% 10,019 24.5% Interisland 22,716 12.7% 20,161 -3.0%
TOTAL 34,558 14.5% 30,180 4.7%
MAIL (U.S. TONS) 3,852 10.3% 3,493 5.4%
AIRCRAFT OPERATIONS 177,803 2.7% 173,053 4.3%
LIHUE AIRPORT:
PASSENGERS Overseas 124,769 37.4% 90,835 13.0% Interisland 2,752,300 4.7% 2,629,692 1.4% TOTAL 2,877,069 5.8% 2,720,527 1.8%
CARGO (U.S. TONS) Overseas 1,022 164.1% 387 61.3% Interisland 13,346 16.4% 11,463 -7.4%
TOTAL 14,368 21.2% 11,850 -6.1%
MAIL (U.S. TONS) 1,973 12.2% 1,758 9.7%
AIRCRAFT OPERATIONS 116,742 -4.5% 122,268 -9.1%
KEAHOLE AIRPORT:
PASSENGERS Overseas 214,089 34.0% 159,750 -19.0% Interisland 1,883,842 13.2% 1,663,799 3.6%
TOTAL 2,097,931 15.0% 1,823,549 1.1%
CARGO (U.S. TONS) Overseas 6,195 7.3% 5,775 -25.0% Interisland 10,618 16.2% 9,138 9.5%
TOTAL 16,813 12.7% 14,913 -7.1%
MAIL (U.S. TONS) 2,008 7.8% 1,863 6.3%
AIRCRAFT OPERATIONS 55,674 -1.6% 56,584 -16.2%

PAGE 3 OF 3
CALENDAR YEAR 1989 HIGHLIGHTS
% %C.Y. 1989 change C.Y. 1988 change
------------------------------------ ----- -------------------- ----- ---------------- ------------------ --------------- ----- ----------------
PASSENGERS FOR OTHER AIRPORTS:
Upolu 4 100.0% 0 0.0% Waimea-Kohala 18,637 8.9% 17,114 -5.6% Hana 25,296 9.9% 23,007 4.7% Kaanapali * 0 0.0% 0 0.0% Molokai 338,980 2.1% 332,003 1.6% Kalaupapa 15,251 11.5% 13,678 40.9% Lanai 104,560 9.5% 95,496 66.7% Others * 527,492 7.7% 489,832 59.5%
TOTAL 1,030,220 6.1% 971,130 31.0%
CARGO (U.S. TONS) FOR OTHER AIRPORTS:
Upolu 6 100.0% 0 0.0% Waimea-Kohala 337 100.0% 0 0.0% Hana 8 100.0% 0 0.0% Kaanapali * 0 0.0% 0 0.0% Molokai 766 9.6% 699 43.5% Kalaupapa 69 430.8% 13 1525.0% Lanai 709 486.0% 121 137.3% Others * 606 58.6% 382 119.5%
TOTAL 2,501 105.8% 1,215 70.4%
* Privately-owned airports.

CALENDAR YEAR 1988 HIGHLIGHTS
% %C.Y. 1988 change C.Y. 1987 change
--------------- --------------- -------------------- ----- ---------------- ----- -------------------- --- ----------------STATEWIDE: PASSENGERS 32,718,530 4.5% 31,297,996 5.6% CARGO (TONS) 396,182 14.5% 345,913 12.6% MAIL (TONS) 48,243 9.8% 43,940 9.3%
HONOLULU INTERNATIONAL AIRPORT: PASSENGERS Overseas (enplaned, deplaned, through)
13,565,768 8.1% 12,550,166 7.1% Interisland 8,011,773 2.3% 7,829,876 6.4% TOTAL 21,577,541 5.9% 20,380,042 6.8%
CARGO (TONS) Overseas 249,798 20.4% 207,446 11.6% Interisland 63,123 6.9% 59,075 7.8% TOTAL 312,921 17.4% 266,521 10.8%
MAIL (TONS) 38,588 9.9% 35,111 11.6%
AIRCRAFT OPERATIONS377,919 -1.9% 385,275 4.7%
GENERAL LYMAN FIELD: PASSENGERS Overseas 0 -100.0% 913 -95.6% Interisland 1,206,550 0.3% 1,202,663 8.6% TOTAL 1,206,550 0.2% 1,203,576 6.7%
CARGO (TONS) Overseas 0 0.0% 0 -100.0% Interisland 25,103 18.6% 21,175 0.0% TOTAL 25,103 18.6% 21,175 -3.0%
MAIL (TONS) 2,415 1.8% 2,373 -4.4%
AIRCRAFT OPERATIONS85,267 6.4% 80,123 30.3%

CALENDAR YEAR 1988 HIGHLIGHTS
% %C.Y. 1988 change C.Y. 1987 change
------------------------------------ ----- -------------------- ----- ---------------- ------------------ ------------------ --- ----------------KAHULUI AIRPORT: PASSENGERS Overseas 972,321 12.5% 864,001 -13.6% Interisland 3,446,912 -5.1% 3,632,503 -2.6% TOTAL 4,419,233 -1.7% 4,496,504 -4.9%
CARGO (TONS) Overseas 10,019 24.5% 8,046 56.2% Interisland 20,161 -3.0% 20,787 6.8% TOTAL 30,180 4.7% 28,833 17.1%
MAIL (TONS) 3,482 5.1% 3,313 7.1%
AIRCRAFT OPERATIONS173,053 4.3% 165,920 -4.9%
LIHUE AIRPORT: PASSENGERS Overseas 90,835 13.0% 80,416 15.0% Interisland 2,629,692 1.4% 2,592,733 4.9% TOTAL 2,720,527 1.8% 2,673,149 5.2%
CARGO (TONS) Overseas 387 61.3% 240 150.0% Interisland 11,463 -7.4% 12,385 15.6% TOTAL 11,850 -6.1% 12,625 16.8%
MAIL (TONS) 1,758 9.7% 1,603 3.8%
AIRCRAFT OPERATIONS122,268 -9.1% 134,495 -6.5%
KEAHOLE AIRPORT: PASSENGERS Overseas 159,750 -19.0% 197,312 24.0% Interisland 1,663,799 3.6% 1,606,278 4.8% TOTAL 1,823,549 1.1% 1,803,590 6.6%
CARGO(TONS) Overseas 5,775 -25.0% 7,701 783.1% Interisland 9,138 9.5% 8,346 4.8% TOTAL 14,913 -7.1% 16,047 81.6%
MAIL (TONS) 1,863 6.3% 1,752 13.2%
AIRCRAFT OPERATIONS56,584 -16.2% 67,497 -17.1%

CALENDAR YEAR 1988 HIGHLIGHTS
% %CY 1988 change C.Y. 1987 change
------------------------------------ ----- -------------------- ----- ---------------- ------------------ ------------------ --- ----------------
PASSENGERS FOR OTHER AIRPORTS:
Upolu 0 0.0% 0 -100.0% Waimea-Kohala 17,114 -5.6% 18,125 -5.8% Hana 23,007 4.7% 21,979 27.5% *Kaanapali 0 0.0% 0 -100.0% Molokai 332,003 1.6% 326,891 -1.0% Kalaupapa 13,678 40.9% 9,710 37.4% Lanai 95,496 66.7% 57,283 14.1% *Others 489,832 59.5% 307,067 550.6%
Total 971,130 31.0% 741,055 54.5%
CARGO TONNAGE FOR OTHER AIRPORTS:
Waimea-Kohala 0 0.0% 0 --- Hana 0 0.0% 0 ERR Molokai 699 43.5% 487 3.8% Kalaupapa 14 1650.0% 1 -98.0% Lanai 121 137.3% 51 200.0% *Others 382 119.5% 174 ---
Total 1,216 70.5% 713 30.8%
*privately owned airports.

CALENDAR YEAR 1987 HIGHLIGHTS
% %C.Y. 1987 change C.Y. 1986 change
--------------- --------------- ------------------ --- --------------- --------------- ------------------ --- ----------------STATEWIDE: PASSENGERS 31,297,996 5.6% 29,645,923 8.9% CARGO (TONS) 345,913 12.6% 307,233 15.0% MAIL (TONS) 43,940 9.3% 40,196 5.9%
HONOLULU INTERNATIONAL AIRPORT: PASSENGERS Overseas (enplaned, deplaned, through)
12,550,166 7.1% 11,716,091 11.1% Interisland 7,829,876 6.4% 7,360,304 23.6% TOTAL 20,380,042 6.8% 19,076,395 9.0%
CARGO (TONS) Overseas 207,446 11.6% 185,801 15.9% Interisland 59,075 7.8% 54,800 13.4% TOTAL 266,521 10.8% 240,601 15.3%
MAIL (TONS) 35,111 11.6% 31,465 6.0%
AIRCRAFT OPERATIONS385,275 4.7% 368,049 2.9%
GENERAL LYMAN FIELD: PASSENGERS Overseas 913 -95.6% 20,914 12.0% Interisland 1,202,663 8.6% 1,107,211 4.9% TOTAL 1,203,576 6.7% 1,128,125 5.0%
CARGO (TONS) Overseas 0 -100.0% 654 -1.4% Interisland 21,175 0.0% 21,168 16.8% TOTAL 21,175 -3.0% 21,822 16.2%
MAIL (TONS) 2,373 -4.4% 2,482 -6.9%
AIRCRAFT OPERATIONS80,123 30.3% 61,514 0.5%

CALENDAR YEAR 1987 HIGHLIGHTS
% %C.Y. 1987 change C.Y. 1986 change
--------------- --------------- ------------------ --- --------------- --------------- ------------------ --- ----------------KAHULUI AIRPORT: PASSENGERS Overseas 864,001 -13.6% 999,789 39.0% Interisland 3,632,503 -2.6% 3,729,541 4.0% TOTAL 4,496,504 -4.9% 4,729,330 9.8%
CARGO (TONS) Overseas 8,046 56.2% 5,152 118.3% Interisland 20,787 6.8% 19,469 4.1% TOTAL 28,833 17.1% 24,621 16.9%
MAIL (TONS) 3,313 7.1% 3,094 10.3%
AIRCRAFT OPERATIONS165,920 -4.9% 174,560 11.0%
LIHUE AIRPORT: PASSENGERS Overseas 80,416 15.0% 69,937 15.2% Interisland 2,592,733 4.9% 2,471,152 11.8% TOTAL 2,673,149 5.2% 2,541,089 11.9%
CARGO (TONS) Overseas 240 150.0% 96 60.0% Interisland 12,385 15.6% 10,713 11.2% TOTAL 12,625 16.8% 10,809 11.5%
MAIL (TONS) 1,603 3.8% 1,545 10.2%
AIRCRAFT OPERATIONS134,495 -6.5% 143,905 9.2%
KEAHOLE AIRPORT: PASSENGERS Overseas 197,312 24.0% 159,096 22.4% Interisland 1,606,278 4.8% 1,532,246 13.0% TOTAL 1,803,590 6.6% 1,691,342 13.8%
CARGO(TONS) Overseas 7,701 783.1% 872 -55.0% Interisland 8,346 4.8% 7,963 26.9% TOTAL 16,047 81.6% 8,835 7.6%
MAIL (TONS) 1,752 13.2% 1,548 15.0%
AIRCRAFT OPERATIONS67,497 -17.1% 81,467 -13.2%

CALENDAR YEAR 1987 HIGHLIGHTS
% %C.Y. 1987 change C.Y. 1986 change
--------------- --------------- ------------------ --- --------------- --------------- ------------------ --- ----------------
PASSENGERS FOR OTHER AIRPORTS:
Upolu 0 -100.0% 874 -59.2% Waimea-Kohala 18,125 -5.8% 19,234 21.8% Hana 21,979 27.5% 17,238 -17.8% *Kaanapali 0 -100.0% 7,658 -93.3% Molokai 326,891 -1.0% 330,175 -3.1% Kalaupapa 9,710 37.4% 7,065 -34.9% Lanai 57,283 14.1% 50,203 -5.1% *Others 307,067 550.6% 47,195 29.9%
Total 741,055 54.5% 479,642 -19.2%
CARGO TONNAGE FOR OTHER AIRPORTS:
Waimea-Kohala 0 --- 17 ERR Hana 0 ERR 0 -100.0% Molokai 487 3.8% 469 7.6% Kalaupapa 1 -98.0% 41 -60.6% Lanai 51 200.0% 17 -56.4% *Others 174 --- 1 #DIV/0!
Total 713 30.8% 545 -16.0%
*privately owned airports.

CALENDAR YEAR 1986 HIGHLIGHTS
% %C.Y. 1986 change C.Y. 1985 change
--------------- --------------- ------------------ --- --------------- --------------- -------------------- ----- ----------------STATEWIDE: PASSENGERS 29,645,923 8.9% 27,227,087 2.7% CARGO (TONS) 307,233 15.0% 267,084 -6.7% MAIL (TONS) 40,196 5.9% 37,960 -11.1%
HONOLULU INTERNATIONAL AIRPORT: PASSENGERS Overseas (enplaned, deplaned, through)
11,716,091 11.1% 10,541,119 -0.3% Interisland 7,360,304 5.8% 6,956,085 3.8% TOTAL 19,076,395 9.0% 17,497,204 1.3%
CARGO (TONS) Overseas 185,801 15.9% 160,362 -3.9% Interisland 54,800 13.4% 48,311 -8.3% TOTAL 240,601 15.3% 208,673 -5.0%
MAIL (TONS) 31,465 6.0% 29,676 -13.0%
AIRCRAFT OPERATIONS368,049 2.9% 357,511 4.0%
GENERAL LYMAN FIELD: PASSENGERS Overseas 20,914 12.0% 18,668 -50.0% Interisland 1,107,211 4.9% 1,055,261 3.1% TOTAL 1,128,125 5.0% 1,073,929 1.2%
CARGO (TONS) Overseas 654 -1.4% 663 -88.9% Interisland 21,168 16.8% 18,123 -1.7% TOTAL 21,822 16.2% 18,786 -23.1%
MAIL (TONS) 2,482 -6.9% 2,665 -2.9%
AIRCRAFT OPERATIONS61,514 0.5% 61,225 -2.1%
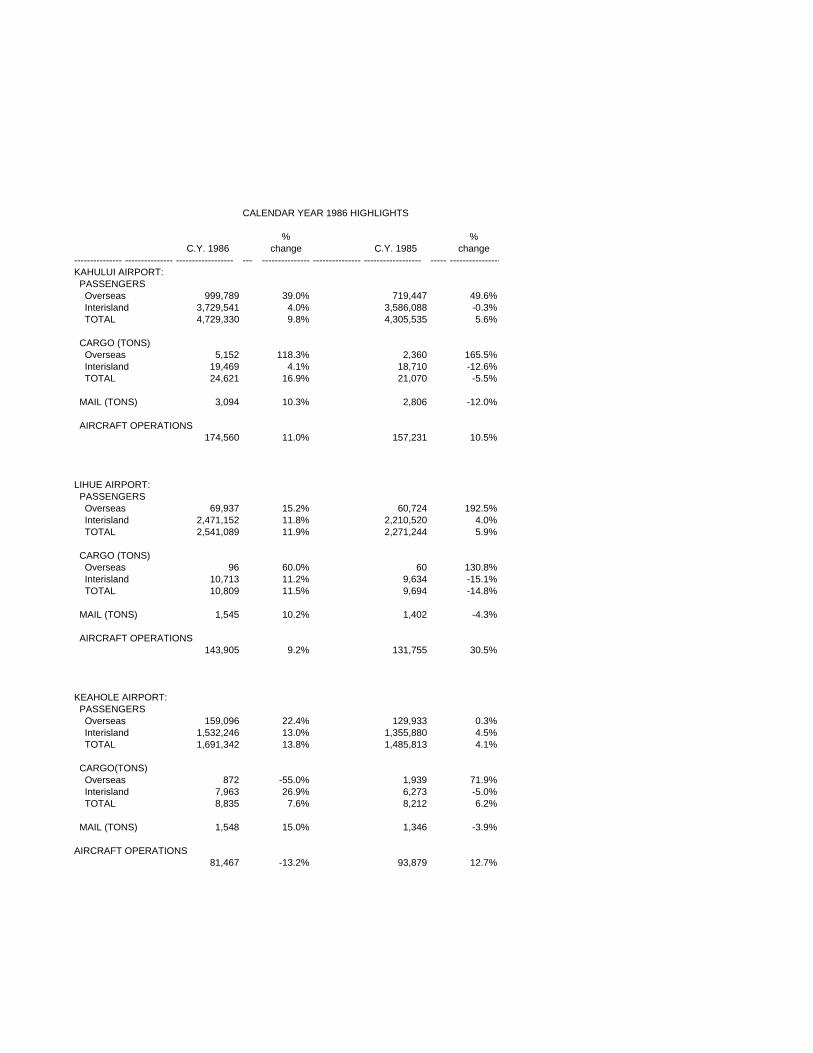
CALENDAR YEAR 1986 HIGHLIGHTS
% %C.Y. 1986 change C.Y. 1985 change
--------------- --------------- ------------------ --- --------------- --------------- ------------------ ----- ----------------KAHULUI AIRPORT: PASSENGERS Overseas 999,789 39.0% 719,447 49.6% Interisland 3,729,541 4.0% 3,586,088 -0.3% TOTAL 4,729,330 9.8% 4,305,535 5.6%
CARGO (TONS) Overseas 5,152 118.3% 2,360 165.5% Interisland 19,469 4.1% 18,710 -12.6% TOTAL 24,621 16.9% 21,070 -5.5%
MAIL (TONS) 3,094 10.3% 2,806 -12.0%
AIRCRAFT OPERATIONS174,560 11.0% 157,231 10.5%
LIHUE AIRPORT: PASSENGERS Overseas 69,937 15.2% 60,724 192.5% Interisland 2,471,152 11.8% 2,210,520 4.0% TOTAL 2,541,089 11.9% 2,271,244 5.9%
CARGO (TONS) Overseas 96 60.0% 60 130.8% Interisland 10,713 11.2% 9,634 -15.1% TOTAL 10,809 11.5% 9,694 -14.8%
MAIL (TONS) 1,545 10.2% 1,402 -4.3%
AIRCRAFT OPERATIONS143,905 9.2% 131,755 30.5%
KEAHOLE AIRPORT: PASSENGERS Overseas 159,096 22.4% 129,933 0.3% Interisland 1,532,246 13.0% 1,355,880 4.5% TOTAL 1,691,342 13.8% 1,485,813 4.1%
CARGO(TONS) Overseas 872 -55.0% 1,939 71.9% Interisland 7,963 26.9% 6,273 -5.0% TOTAL 8,835 7.6% 8,212 6.2%
MAIL (TONS) 1,548 15.0% 1,346 -3.9%
AIRCRAFT OPERATIONS81,467 -13.2% 93,879 12.7%

CALENDAR YEAR 1986 HIGHLIGHTS
% %C.Y. 1986 change C.Y. 1985 change
--------------- --------------- ------------------ --- --------------- --------------- ------------------ --- ----------------
PASSENGERS FOR OTHER AIRPORTS:
Upolu 874 -59.2% 2,144 -11.3% Waimea-Kohala 19,234 21.8% 15,787 68.5% Hana 17,238 -17.8% 20,971 11.0% *Kaanapali 7,658 -93.3% 113,557 -11.1% Molokai 330,175 -3.1% 340,832 25.1% Kalaupapa 7,065 -34.9% 10,846 37.2% Lanai 50,203 -5.1% 52,901 8.5% *Others 47,195 29.9% 36,324 20.3%
Total 479,642 -19.2% 593,362 14.6%
CARGO TONNAGE FOR OTHER AIRPORTS:
Waimea-Kohala 17 --- 0 -100.0% Hana 0 -100.0% 70 536.4% Molokai 469 7.6% 436 -13.8% Kalaupapa 41 -60.6% 104 108.0% Lanai 17 -56.4% 39 -64.5% *Others 1 --- 0 -100.0%
Total 545 -16.0% 649 -32.5%
*privately owned airports.
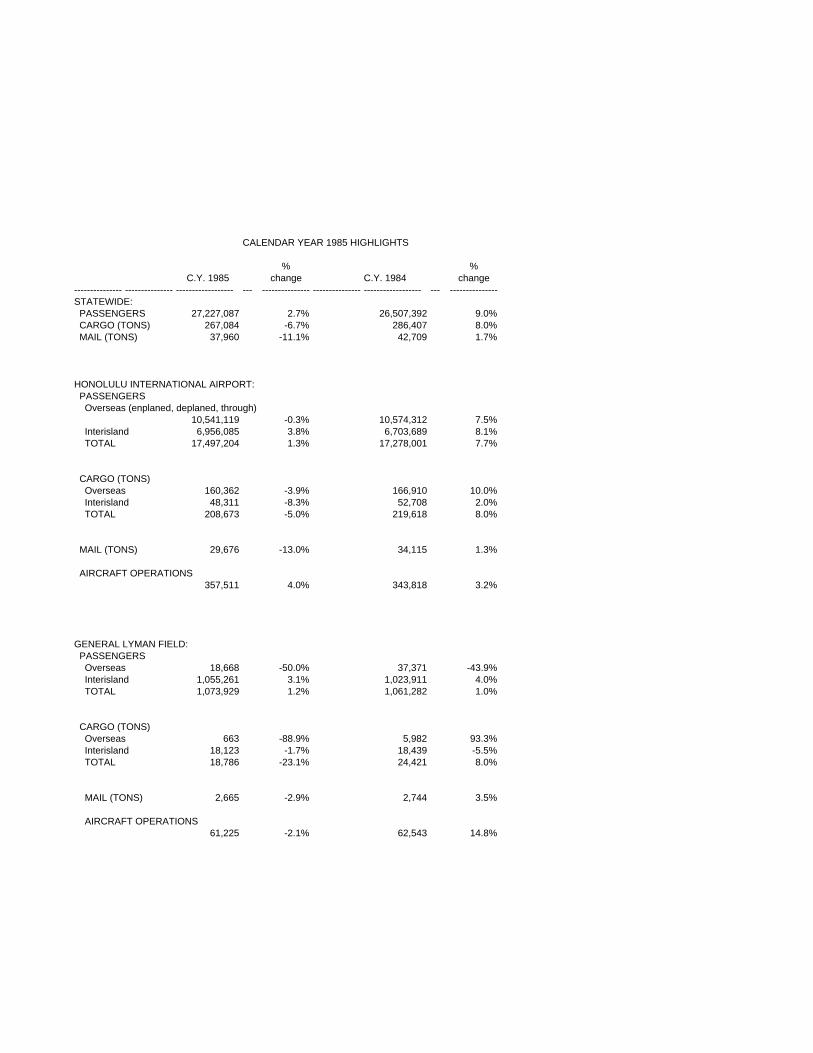
CALENDAR YEAR 1985 HIGHLIGHTS
% %C.Y. 1985 change C.Y. 1984 change
--------------- --------------- ------------------ --- --------------- --------------- ------------------ --- ---------------STATEWIDE: PASSENGERS 27,227,087 2.7% 26,507,392 9.0% CARGO (TONS) 267,084 -6.7% 286,407 8.0% MAIL (TONS) 37,960 -11.1% 42,709 1.7%
HONOLULU INTERNATIONAL AIRPORT: PASSENGERS Overseas (enplaned, deplaned, through)
10,541,119 -0.3% 10,574,312 7.5% Interisland 6,956,085 3.8% 6,703,689 8.1% TOTAL 17,497,204 1.3% 17,278,001 7.7%
CARGO (TONS) Overseas 160,362 -3.9% 166,910 10.0% Interisland 48,311 -8.3% 52,708 2.0% TOTAL 208,673 -5.0% 219,618 8.0%
MAIL (TONS) 29,676 -13.0% 34,115 1.3%
AIRCRAFT OPERATIONS357,511 4.0% 343,818 3.2%
GENERAL LYMAN FIELD: PASSENGERS Overseas 18,668 -50.0% 37,371 -43.9% Interisland 1,055,261 3.1% 1,023,911 4.0% TOTAL 1,073,929 1.2% 1,061,282 1.0%
CARGO (TONS) Overseas 663 -88.9% 5,982 93.3% Interisland 18,123 -1.7% 18,439 -5.5% TOTAL 18,786 -23.1% 24,421 8.0%
MAIL (TONS) 2,665 -2.9% 2,744 3.5%
AIRCRAFT OPERATIONS61,225 -2.1% 62,543 14.8%
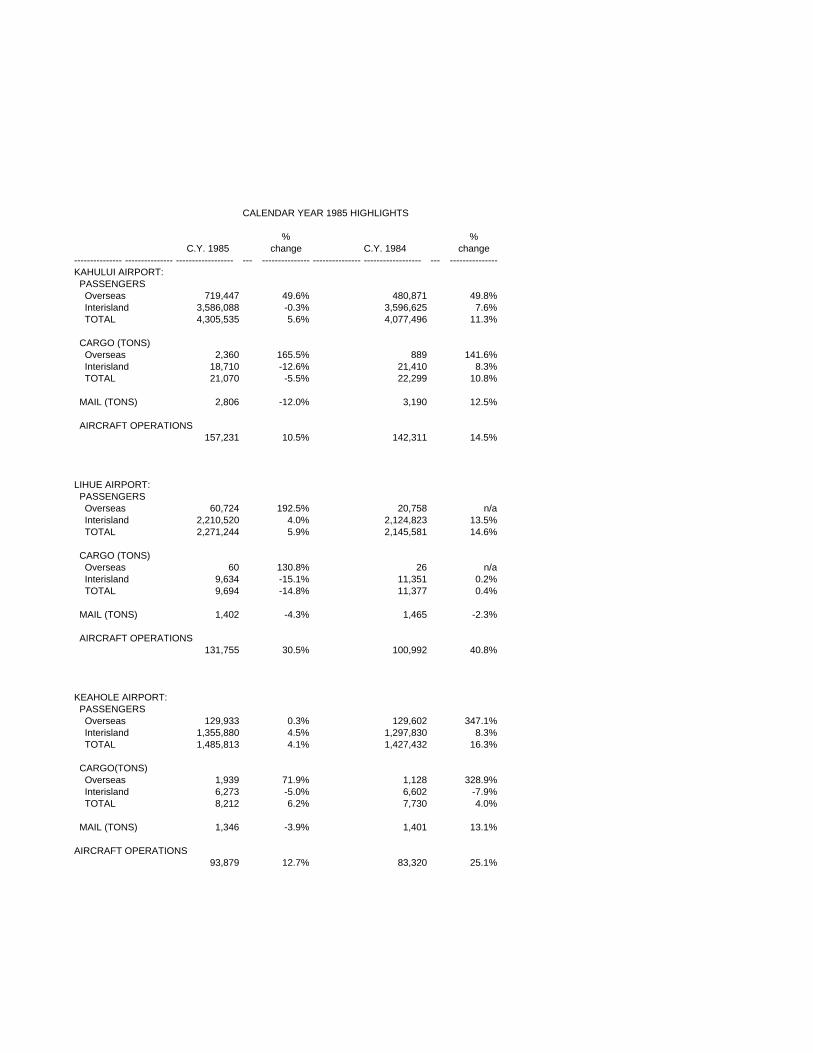
CALENDAR YEAR 1985 HIGHLIGHTS
% %C.Y. 1985 change C.Y. 1984 change
--------------- --------------- ------------------ --- --------------- --------------- ------------------ --- ---------------KAHULUI AIRPORT: PASSENGERS Overseas 719,447 49.6% 480,871 49.8% Interisland 3,586,088 -0.3% 3,596,625 7.6% TOTAL 4,305,535 5.6% 4,077,496 11.3%
CARGO (TONS) Overseas 2,360 165.5% 889 141.6% Interisland 18,710 -12.6% 21,410 8.3% TOTAL 21,070 -5.5% 22,299 10.8%
MAIL (TONS) 2,806 -12.0% 3,190 12.5%
AIRCRAFT OPERATIONS157,231 10.5% 142,311 14.5%
LIHUE AIRPORT: PASSENGERS Overseas 60,724 192.5% 20,758 n/a Interisland 2,210,520 4.0% 2,124,823 13.5% TOTAL 2,271,244 5.9% 2,145,581 14.6%
CARGO (TONS) Overseas 60 130.8% 26 n/a Interisland 9,634 -15.1% 11,351 0.2% TOTAL 9,694 -14.8% 11,377 0.4%
MAIL (TONS) 1,402 -4.3% 1,465 -2.3%
AIRCRAFT OPERATIONS131,755 30.5% 100,992 40.8%
KEAHOLE AIRPORT: PASSENGERS Overseas 129,933 0.3% 129,602 347.1% Interisland 1,355,880 4.5% 1,297,830 8.3% TOTAL 1,485,813 4.1% 1,427,432 16.3%
CARGO(TONS) Overseas 1,939 71.9% 1,128 328.9% Interisland 6,273 -5.0% 6,602 -7.9% TOTAL 8,212 6.2% 7,730 4.0%
MAIL (TONS) 1,346 -3.9% 1,401 13.1%
AIRCRAFT OPERATIONS93,879 12.7% 83,320 25.1%

CALENDAR YEAR 1985 HIGHLIGHTS
% %C.Y. 1985 change C.Y. 1984 change
--------------- --------------- ------------------ --- --------------- --------------- ------------------ --- ---------------
PASSENGERS FOR OTHER AIRPORTS:
Upolu 2,144 -11.3% 2,416 50.9% Waimea-Kohala 15,787 68.5% 9,369 7.3% Hana 20,971 11.0% 18,901 4.8% *Kaanapali 113,557 -11.1% 127,692 -3.2% Molokai 340,832 25.1% 272,343 14.0% Kalaupapa 10,846 37.2% 7,903 -2.0% Lanai 52,901 8.5% 48,774 8.5% *Others 36,324 20.3% 30,202 18.2%
Total 593,362 14.6% 517,600 8.4%
CARGO TONNAGE FOR OTHER AIRPORTS:
Waimea-Kohala 0 -100.0% 273 3312.5% Hana 70 536.4% 11 n/a Molokai 436 -13.8% 506 41.3% Kalaupapa 104 108.0% 50 n/a Lanai 39 -64.5% 110 633.3% *Others 0 -100.0% 12 9.1%
Total 649 -32.5% 962 145.4%
*privately owned airports.

CALENDAR YEAR 1984 HIGHLIGHTS
% %C.Y. 1984 change C.Y. 1983 change
--------------- --------------- ------------------ --- --------------- --------------- -------------------- ----- ---------------STATEWIDE: PASSENGERS 26,507,392 9.0% 24,328,012 -2.1% CARGO (TONS) 286,407 8.0% 265,296 8.6% MAIL (TONS) 42,709 1.7% 41,978 10.0%
HONOLULU INTERNATIONAL AIRPORT: PASSENGERS Overseas (enplaned, deplaned, through)
10,574,312 7.5% 9,835,968 -2.4% Interisland 6,703,689 8.1% 6,199,495 -3.4% TOTAL 17,278,001 7.7% 16,035,463 -2.8%
CARGO (TONS) Overseas 166,910 10.0% 151,743 19.4% Interisland 52,708 2.0% 51,654 -3.5% TOTAL 219,618 8.0% 203,397 12.6%
MAIL (TONS) 34,115 1.3% 33,676 10.4%
AIRCRAFT OPERATIONS343,818 3.2% 333,038 7.9%
GENERAL LYMAN FIELD: PASSENGERS Overseas 37,371 -43.9% 66,597 -31.8% Interisland 1,023,911 4.0% 984,071 -2.4% TOTAL 1,061,282 1.0% 1,050,668 -5.0%
CARGO (TONS) Overseas 5,982 93.3% 3,094 -3.8% Interisland 18,439 -5.5% 19,522 -13.0% TOTAL 24,421 8.0% 22,616 -11.8%
MAIL (TONS) 2,744 3.5% 2,651 6.8%
AIRCRAFT OPERATIONS62,543 14.8% 54,470 13.6%

CALENDAR YEAR 1984 HIGHLIGHTS
% %C.Y. 1984 change C.Y. 1983 change
--------------- --------------- ------------------ --- --------------- --------------- ------------------ --- ---------------KAHULUI AIRPORT: PASSENGERS Overseas 480,871 49.8% 321,085 1388.1% Interisland 3,596,625 7.6% 3,343,653 -5.4% TOTAL 4,077,496 11.3% 3,664,738 3.0%
CARGO (TONS) Overseas 889 141.6% 368 n/a Interisland 21,410 8.3% 19,762 6.0% TOTAL 22,299 10.8% 20,130 8.0%
MAIL (TONS) 3,190 12.5% 2,835 11.2%
AIRCRAFT OPERATIONS142,311 14.5% 124,288 10.5%
LIHUE AIRPORT: PASSENGERS Overseas 20,758 100.0% 0 n/a Interisland 2,124,823 13.5% 1,871,758 -10.2% TOTAL 2,145,581 14.6% 1,871,758 -10.2%
CARGO (TONS) Overseas 26 100.0% 0 n/a Interisland 11,351 0.2% 11,331 2.5% TOTAL 11,377 0.4% 11,331 2.5%
MAIL (TONS) 1,465 -2.3% 1,499 11.4%
AIRCRAFT OPERATIONS100,992 40.8% 71,739 9.9%
KEAHOLE AIRPORT: PASSENGERS Overseas 129,602 347.1% 28,988 n/a Interisland 1,297,830 8.3% 1,198,811 4.2% TOTAL 1,427,432 16.3% 1,227,799 6.7%
CARGO(TONS) Overseas 1,128 328.9% 263 n/a Interisland 6,602 -7.9% 7,167 -2.2% TOTAL 7,730 4.0% 7,430 1.4%
MAIL (TONS) 1,401 13.1% 1,239 16.8%
AIRCRAFT OPERATIONS83,320 25.1% 66,581 28.3%

CALENDAR YEAR 1984 HIGHLIGHTS
% %C.Y. 1984 change C.Y. 1983 change
--------------- --------------- ------------------ --- --------------- --------------- -------------------- ----- ---------------
PASSENGERS FOR OTHER AIRPORTS:
Upolu 2,416 50.9% 1,601 -1.9% Waimea-Kohala 9,369 7.3% 8,730 -1.3% Hana 18,901 4.8% 18,033 -10.7% *Kaanapali 127,692 -3.2% 131,876 19.7% Molokai 272,343 14.0% 238,793 -4.3% Kalaupapa 7,903 -2.0% 8,067 31.2% Lanai 48,774 8.5% 44,944 1.8% *Others 30,202 18.2% 25,542 n/a
Total 517,600 8.4% 477,586 8.3%
CARGO TONNAGE FOR OTHER AIRPORTS:
Waimea-Kohala 273 3312.5% 8 n/a Hana 11 100.0% 0 n/a Molokai 506 41.3% 358 -53.1% Kalaupapa 50 100.0% 0 n/a Lanai 110 633.3% 15 -89.9% *Others 12 9.1% 11 n/a
Total 962 145.4% 392 -57.0%
*privately owned airports.

CALENDAR YEAR 1985 HIGHLIGHTS
% %C.Y. 1985 change C.Y. 1984 change
--------------- --------------- ------------------ --- --------------- --------------- ------------------ --- ---------------STATEWIDE: PASSENGERS 27,227,087 2.7% 26,507,392 9.0% CARGO (TONS) 267,084 -6.7% 286,407 8.0% MAIL (TONS) 37,960 -11.1% 42,709 1.7%
HONOLULU INTERNATIONAL AIRPORT: PASSENGERS Overseas (enplaned, deplaned, through)
10,541,119 -0.3% 10,574,312 7.5% Interisland 6,956,085 3.8% 6,703,689 8.1% TOTAL 17,497,204 1.3% 17,278,001 7.7%
CARGO (TONS) Overseas 160,362 -3.9% 166,910 10.0% Interisland 48,311 -8.3% 52,708 2.0% TOTAL 208,673 -5.0% 219,618 8.0%
MAIL (TONS) 29,676 -13.0% 34,115 1.3%
AIRCRAFT OPERATIONS357,511 4.0% 343,818 3.2%
GENERAL LYMAN FIELD: PASSENGERS Overseas 18,668 -50.0% 37,371 -43.9% Interisland 1,055,261 3.1% 1,023,911 4.0% TOTAL 1,073,929 1.2% 1,061,282 1.0%
CARGO (TONS) Overseas 663 -88.9% 5,982 93.3% Interisland 18,123 -1.7% 18,439 -5.5% TOTAL 18,786 -23.1% 24,421 8.0%
MAIL (TONS) 2,665 -2.9% 2,744 3.5%
AIRCRAFT OPERATIONS61,225 -2.1% 62,543 14.8%

CALENDAR YEAR 1985 HIGHLIGHTS
% %C.Y. 1985 change C.Y. 1984 change
--------------- --------------- ------------------ --- --------------- --------------- ------------------ --- ---------------KAHULUI AIRPORT: PASSENGERS Overseas 719,447 49.6% 480,871 49.8% Interisland 3,586,088 -0.3% 3,596,625 7.6% TOTAL 4,305,535 5.6% 4,077,496 11.3%
CARGO (TONS) Overseas 2,360 165.5% 889 141.6% Interisland 18,710 -12.6% 21,410 8.3% TOTAL 21,070 -5.5% 22,299 10.8%
MAIL (TONS) 2,806 -12.0% 3,190 12.5%
AIRCRAFT OPERATIONS157,231 10.5% 142,311 14.5%
LIHUE AIRPORT: PASSENGERS Overseas 60,724 192.5% 20,758 n/a Interisland 2,210,520 4.0% 2,124,823 13.5% TOTAL 2,271,244 5.9% 2,145,581 14.6%
CARGO (TONS) Overseas 60 130.8% 26 n/a Interisland 9,634 -15.1% 11,351 0.2% TOTAL 9,694 -14.8% 11,377 0.4%
MAIL (TONS) 1,402 -4.3% 1,465 -2.3%
AIRCRAFT OPERATIONS131,755 30.5% 100,992 40.8%
KEAHOLE AIRPORT: PASSENGERS Overseas 129,933 0.3% 129,602 347.1% Interisland 1,355,880 4.5% 1,297,830 8.3% TOTAL 1,485,813 4.1% 1,427,432 16.3%
CARGO(TONS) Overseas 1,939 71.9% 1,128 328.9% Interisland 6,273 -5.0% 6,602 -7.9% TOTAL 8,212 6.2% 7,730 4.0%
MAIL (TONS) 1,346 -3.9% 1,401 13.1%
AIRCRAFT OPERATIONS93,879 12.7% 83,320 25.1%

CALENDAR YEAR 1985 HIGHLIGHTS
% %C.Y. 1985 change C.Y. 1984 change
--------------- --------------- ------------------ --- --------------- --------------- ------------------ --- ---------------
PASSENGERS FOR OTHER AIRPORTS:
Upolu 2,144 -11.3% 2,416 50.9% Waimea-Kohala 15,787 68.5% 9,369 7.3% Hana 20,971 11.0% 18,901 4.8% *Kaanapali 113,557 -11.1% 127,692 -3.2% Molokai 340,832 25.1% 272,343 14.0% Kalaupapa 10,846 37.2% 7,903 -2.0% Lanai 52,901 8.5% 48,774 8.5% *Others 36,324 20.3% 30,202 18.2%
Total 593,362 14.6% 517,600 8.4%
CARGO TONNAGE FOR OTHER AIRPORTS:
Waimea-Kohala 0 -100.0% 273 3312.5% Hana 70 536.4% 11 n/a Molokai 436 -13.8% 506 41.3% Kalaupapa 104 108.0% 50 n/a Lanai 39 -64.5% 110 633.3% *Others 0 -100.0% 12 9.1%
Total 649 -32.5% 962 145.4%
*privately owned airports.

STATEWIDE AIRPORT SYSTEM PASSENGERS
INTERISLAND AND OVERSEAS
TOTAL% change % change INTERISLAND % change
INTERISLAND from the OVERSEAS from the AND OVERSEAS from the previous previous previous
CALENDAR (enplaned year's (enplaned, deplaned, year's (enplaned, deplaned, year'sYEAR and deplaned) total and transits) total and transits) total
--------------- --------------------- ------------ ---------------------------------- ------------ ---------------------------- ---------------
1960 1,911,220 785,589 2,696,8091965 3,076,784 1,794,255 4,871,039
1970 5,985,554 5,243,276 11,228,8301971 6,760,062 12.9% 5,329,926 1.7% 12,089,988 7.7%1972 8,186,676 21.1% 5,824,033 9.3% 14,010,709 15.9%1973 9,618,194 17.5% 6,649,797 14.2% 16,267,991 16.1%1974 10,349,828 7.6% 6,869,796 3.3% 17,219,624 5.8%1975 10,648,170 2.9% 7,272,930 5.9% 17,921,100 4.1%1976 11,746,276 10.3% 7,746,468 6.5% 19,492,744 8.8%1977 12,827,694 9.2% 7,990,044 3.1% 20,817,738 6.8%1978 14,683,630 14.5% 9,040,286 13.1% 23,723,916 14.0%1979 15,157,754 3.2% 9,365,129 3.6% 24,522,883 3.4%
1980 13,475,788 -11.1% 9,564,359 2.1% 23,040,147 -6.0%1981 13,448,226 -0.2% 9,615,175 0.5% 23,063,401 0.1%1982 14,654,894 9.0% 10,194,295 6.0% 24,849,189 7.7%1983 14,075,374 -4.0% 10,252,638 0.6% 24,328,012 -2.1%1984 15,264,478 8.4% 11,242,914 9.7% 26,507,392 9.0%1985 15,757,196 3.2% 11,469,891 2.0% 27,227,087 2.7%1986 16,680,096 5.9% 12,965,827 13.0% 29,645,923 8.9%1987 17,605,188 5.5% 13,692,808 5.6% 31,297,996 5.6%1988 17,929,856 1.8% 14,788,674 8.0% 32,718,530 4.5%1989 19,268,154 7.5% 15,425,593 4.3% 34,693,747 6.0%
1990 19,814,308 2.8% 15,938,199 3.3% 35,752,507 3.1%1991 18,737,152 -5.4% 15,371,382 -3.6% 34,108,534 -4.6%1992 19,136,868 2.1% 15,654,152 1.8% 34,791,020 2.0%1993 18,690,640 -2.3% 15,130,491 -3.3% 33,821,131 -2.8%1994 19,841,418 6.2% 15,744,872 4.1% 35,586,290 5.2%1995 20,776,562 4.7% 15,960,262 1.4% 36,736,824 3.2%1996 21,163,650 1.9% 16,383,682 2.7% 37,547,332 2.2%1997 20,896,198 -1.3% 16,369,195 -0.1% 37,265,393 -0.8%1998 20,150,896 -3.6% 15,772,563 -3.6% 35,923,459 -3.6%1999 20,346,138 1.0% 15,813,406 0.3% 36,159,544 0.7%
2000 20,757,540 2.0% 16,348,324 3.4% 37,105,864 2.6%2001 18,341,282 -11.6% 14,809,800 -9.4% 33,151,082 -10.7%
Sept. 11, 2001 - Terrorist attacks on the United States (U.S.) led to the closing of all U.S. airports.
AIR-PS

STATEWIDE AIRPORT SYSTEM CARGO (U.S. tons)
INTERISLAND AND OVERSEAS
TOTAL% change % change INTERISLAND % change
INTERISLAND from the OVERSEAS from the AND OVERSEAS from theprevious previous previous
CALENDAR (enplaned year's (enplaned year's (enplaned year'sYEAR and deplaned) total and deplaned) total and deplaned) total
--------------- --------------------- ----------- --------------------------- ----------- ---------------------------- ---------------
1960 25,333 9,559 34,8921965 39,565 36,078 75,643
1970 52,139 45,919 98,0581971 51,389 -1.4% 91,861 100.1% 143,250 46.1%1972 59,900 16.6% 82,043 -10.7% 141,943 -0.9%1973 69,710 16.4% 72,664 -11.4% 142,374 0.3%1974 79,576 14.2% 87,723 20.7% 167,299 17.5%1975 81,516 2.4% 103,814 18.3% 185,330 10.8%1976 86,818 6.5% 127,248 22.6% 214,066 15.5%1977 82,676 -4.8% 132,877 4.4% 215,553 0.7%1978 107,378 29.9% 137,176 3.2% 244,554 13.5%1979 118,555 10.4% 121,453 -11.5% 240,008 -1.9%
1980 138,008 16.4% 122,629 1.0% 260,637 8.6%1981 132,559 -3.9% 126,407 3.1% 258,966 -0.6%1982 114,038 -14.0% 130,333 3.1% 244,371 -5.6%1983 109,828 -3.7% 155,468 19.3% 265,296 8.6%1984 111,472 1.5% 175,035 12.6% 286,507 8.0%1985 101,700 -8.8% 165,384 -5.5% 267,084 -6.8%1986 114,658 12.7% 192,575 16.4% 307,233 15.0%1987 122,480 6.8% 223,433 16.0% 345,913 12.6%1988 130,203 6.3% 265,979 19.0% 396,182 14.5%1989 146,960 12.9% 307,538 15.6% 454,498 14.7%
1990 145,418 -1.0% 316,524 2.9% 461,942 1.6%1991 144,104 -0.9% 324,203 2.4% 468,307 1.4%1992 153,912 6.8% 305,441 -5.8% 459,353 -1.9%1993 147,054 -4.5% 281,409 -7.9% 428,463 -6.7%1994 148,904 1.3% 324,023 15.1% 472,927 10.4%1995 149,174 0.2% 306,591 -5.4% 455,765 -3.6%1996 160,784 7.8% 326,161 6.4% 486,945 6.8%1997 173,154 7.7% 394,294 20.9% 567,448 16.5%1998 140,034 -19.1% 340,009 -13.8% 480,043 -15.4%1999 138,368 -1.2% 387,053 13.8% 525,421 9.5%
2000 142,380 2.9% 340,132 -12.1% 482,512 -8.2%2001 150,074 5.4% 223,772 -34.2% 373,846 -22.5%
Sept. 11, 2001 - Terrorist attacks on the United States (U.S.) led to the closing of all U.S. airports.
AIR-PS

STATEWIDE AIRPORT SYSTEM MAIL (U.S. tons) INTERISLAND AND OVERSEAS
TOTAL% change % change INTERISLAND % change
INTERISLAND from the OVERSEAS from the AND OVERSEAS from theprevious previous previous
CALENDAR (enplaned year's (enplaned year's (enplaned year'sYEAR and deplaned) total and deplaned) total and deplaned) total
--------------- ---------------------------- ------------ ---------------------- ------------ ---------------------- ---------------
1960 1,139 9,656 10,7951965 4,897 26,954 31,851
1970 14,131 19,735 33,8661971 14,332 1.4% 21,399 8.4% 35,731 5.5%1972 14,774 3.1% 19,702 -7.9% 34,476 -3.5%1973 16,453 11.4% 18,562 -5.8% 35,015 1.6%1974 16,594 0.9% 18,857 1.6% 35,451 1.2%1975 17,831 7.5% 18,578 -1.5% 36,409 2.7%1976 19,024 6.7% 19,704 6.1% 38,728 6.4%1977 17,065 -10.3% 18,469 -6.3% 35,534 -8.2%1978 15,199 -10.9% 18,531 0.3% 33,730 -5.1%1979 15,364 1.1% 17,537 -5.4% 32,901 -2.5%
1980 13,576 -11.6% 20,343 16.0% 33,919 3.1%1981 14,132 4.1% 21,138 3.9% 35,270 4.0%1982 15,014 6.2% 23,143 9.5% 38,157 8.2%1983 16,024 6.7% 25,954 12.1% 41,978 10.0%1984 16,282 1.6% 26,427 1.8% 42,709 1.7%1985 16,072 -1.3% 21,888 -17.2% 37,960 -11.1%1986 16,912 5.2% 23,284 6.4% 40,196 5.9%1987 17,659 4.4% 26,282 12.9% 43,941 9.3%1988 18,847 6.7% 29,408 11.9% 48,255 9.8%1989 20,706 9.9% 30,900 5.1% 51,606 6.9%
1990 22,849 10.3% 35,110 13.6% 57,959 12.3%1991 23,672 3.6% 38,970 11.0% 62,642 8.1%1992 25,594 8.1% 52,660 35.1% 78,254 24.9%1993 26,406 3.2% 82,647 56.9% 109,053 39.4%1994 27,964 5.9% 84,942 2.8% 112,906 3.5%1995 27,646 -1.1% 83,577 -1.6% 111,223 -1.5%1996 29,572 7.0% 81,531 -2.4% 111,103 -0.1%1997 31,272 5.7% 80,774 -0.9% 112,046 0.8%1998 40,548 29.7% 81,970 1.5% 122,518 9.3%1999 47,786 17.9% 86,193 5.2% 133,979 9.4%
2000 60,768 27.2% 84,938 -1.5% 145,706 8.8%2001 42,866 -29.5% 76,631 -9.8% 119,497 -18.0%
Sept. 11, 2001 - Terrorist attacks on the United States (U.S.) led to the closing of all U.S. airports.
AIR-PS

STATEWIDE AIRPORT SYSTEM CARGO and MAIL (U.S. tons) INTERISLAND AND OVERSEAS
TOTALCARGO MAIL CARGO + MAIL
Interisland + % change Interisland + % change Interisland + % change Overseas from the Overseas from the Overseas from the
previous previous previousCALENDAR (enplaned year's (enplaned year's (enplaned year's
YEAR and deplaned) total and deplaned) total and deplaned) total--------------- ---------------------------- ------------ ---------------------------- ------------ ---------------------- ---------------
1960 34,892 10,795 45,6871965 75,643 31,851 107,494
1970 98,058 33,866 131,9241971 143,250 46.1% 35,731 5.5% 178,981 35.7%1972 141,943 -0.9% 34,476 -3.5% 176,419 -1.4%1973 142,374 0.3% 35,015 1.6% 177,389 0.5%1974 167,299 17.5% 35,451 1.2% 202,750 14.3%1975 185,330 10.8% 36,409 2.7% 221,739 9.4%1976 214,066 15.5% 38,728 6.4% 252,794 14.0%1977 215,553 0.7% 35,534 -8.2% 251,087 -0.7%1978 244,554 13.5% 33,730 -5.1% 278,284 10.8%1979 240,008 -1.9% 32,901 -2.5% 272,909 -1.9%
1980 260,637 8.6% 33,919 3.1% 294,556 7.9%1981 258,966 -0.6% 35,270 4.0% 294,236 -0.1%1982 244,371 -5.6% 38,157 8.2% 282,528 -4.0%1983 265,296 8.6% 41,978 10.0% 307,274 8.8%1984 286,507 8.0% 42,709 1.7% 329,216 7.1%1985 267,084 -6.8% 37,960 -11.1% 305,044 -7.3%1986 307,233 15.0% 40,196 5.9% 347,429 13.9%1987 345,913 12.6% 43,941 9.3% 389,854 12.2%1988 396,182 14.5% 48,255 9.8% 444,437 14.0%1989 454,498 14.7% 51,606 6.9% 506,104 13.9%
1990 461,942 1.6% 57,959 12.3% 519,901 2.7%1991 468,307 1.4% 62,642 8.1% 530,949 2.1%1992 459,353 -1.9% 78,254 24.9% 537,607 1.3%1993 428,463 -6.7% 109,053 39.4% 537,516 0.0%1994 472,927 10.4% 112,906 3.5% 585,833 9.0%1995 455,765 -3.6% 111,223 -1.5% 566,988 -3.2%1996 486,945 6.8% 111,103 -0.1% 598,048 5.5%1997 567,448 16.5% 112,046 0.8% 679,494 13.6%1998 480,043 -15.4% 122,518 9.3% 602,561 -11.3%1999 525,421 9.5% 133,979 9.4% 659,400 9.4%
2000 482,512 -8.2% 145,706 8.8% 628,218 -4.7%2001 373,846 -22.5% 119,497 -18.0% 493,343 -21.5%
Sept. 11, 2001 - Terrorist attacks on the United States (U.S.) led to the closing of all U.S. airports.
AIR-PS
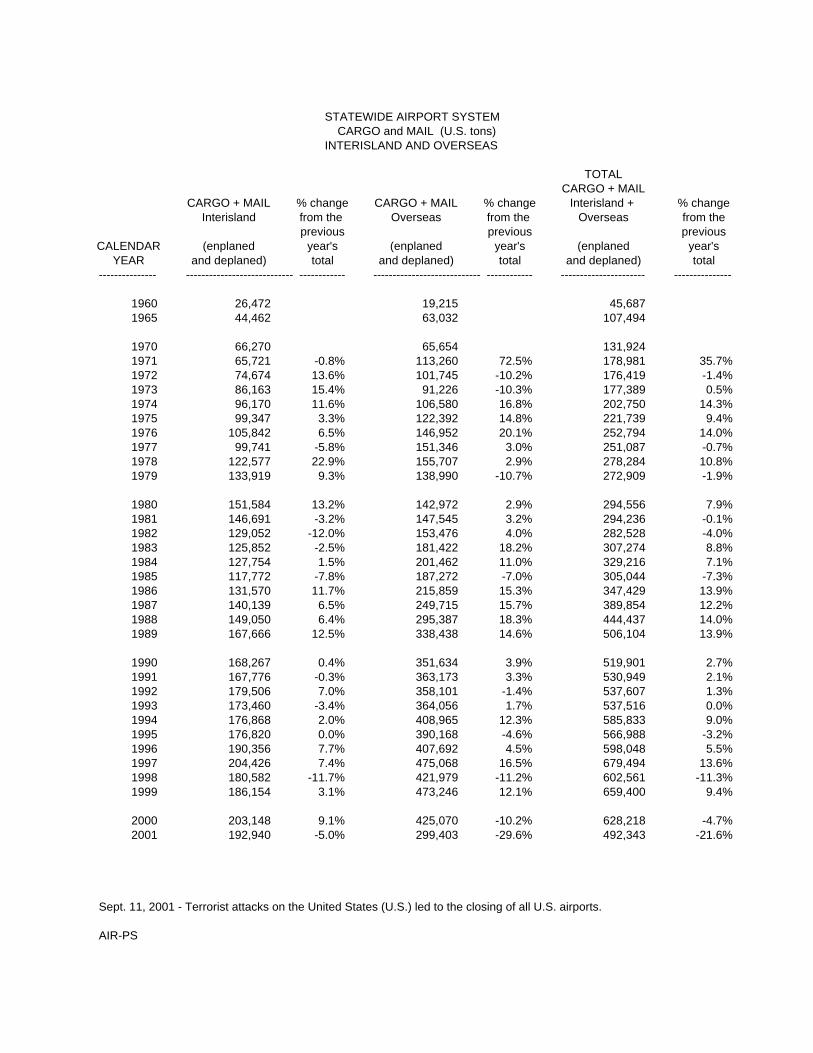
STATEWIDE AIRPORT SYSTEM CARGO and MAIL (U.S. tons) INTERISLAND AND OVERSEAS
TOTALCARGO + MAIL
CARGO + MAIL % change CARGO + MAIL % change Interisland + % changeInterisland from the Overseas from the Overseas from the
previous previous previousCALENDAR (enplaned year's (enplaned year's (enplaned year's
YEAR and deplaned) total and deplaned) total and deplaned) total--------------- ---------------------------- ------------ ---------------------------- ------------ ---------------------- ---------------
1960 26,472 19,215 45,6871965 44,462 63,032 107,494
1970 66,270 65,654 131,9241971 65,721 -0.8% 113,260 72.5% 178,981 35.7%1972 74,674 13.6% 101,745 -10.2% 176,419 -1.4%1973 86,163 15.4% 91,226 -10.3% 177,389 0.5%1974 96,170 11.6% 106,580 16.8% 202,750 14.3%1975 99,347 3.3% 122,392 14.8% 221,739 9.4%1976 105,842 6.5% 146,952 20.1% 252,794 14.0%1977 99,741 -5.8% 151,346 3.0% 251,087 -0.7%1978 122,577 22.9% 155,707 2.9% 278,284 10.8%1979 133,919 9.3% 138,990 -10.7% 272,909 -1.9%
1980 151,584 13.2% 142,972 2.9% 294,556 7.9%1981 146,691 -3.2% 147,545 3.2% 294,236 -0.1%1982 129,052 -12.0% 153,476 4.0% 282,528 -4.0%1983 125,852 -2.5% 181,422 18.2% 307,274 8.8%1984 127,754 1.5% 201,462 11.0% 329,216 7.1%1985 117,772 -7.8% 187,272 -7.0% 305,044 -7.3%1986 131,570 11.7% 215,859 15.3% 347,429 13.9%1987 140,139 6.5% 249,715 15.7% 389,854 12.2%1988 149,050 6.4% 295,387 18.3% 444,437 14.0%1989 167,666 12.5% 338,438 14.6% 506,104 13.9%
1990 168,267 0.4% 351,634 3.9% 519,901 2.7%1991 167,776 -0.3% 363,173 3.3% 530,949 2.1%1992 179,506 7.0% 358,101 -1.4% 537,607 1.3%1993 173,460 -3.4% 364,056 1.7% 537,516 0.0%1994 176,868 2.0% 408,965 12.3% 585,833 9.0%1995 176,820 0.0% 390,168 -4.6% 566,988 -3.2%1996 190,356 7.7% 407,692 4.5% 598,048 5.5%1997 204,426 7.4% 475,068 16.5% 679,494 13.6%1998 180,582 -11.7% 421,979 -11.2% 602,561 -11.3%1999 186,154 3.1% 473,246 12.1% 659,400 9.4%
2000 203,148 9.1% 425,070 -10.2% 628,218 -4.7%2001 192,940 -5.0% 299,403 -29.6% 492,343 -21.6%
Sept. 11, 2001 - Terrorist attacks on the United States (U.S.) led to the closing of all U.S. airports.
AIR-PS

STATEWIDE AIRCRAFT OPERATIONS
% change % change % change % change % change % change % change % change % change % changefrom the from the from the from the from the from the from the from the from the from theprevious previous previous previous previous previous previous previous previous previous
CALENDAR year's year's year's year's year's year's year's year's year's year'sYEAR HONOLULU total KAHULUI total KONA total LIHUE total HILO total MOLOKAI total DILLINGHAM total FORD total KALAELOA total TOTAL total
----------------- --------------- ------------ --------------- ------------ --------------- ------------ --------------- ---------------- ------------------- ------------ --------------- ------------ --------------- ---------------- ---------------- ---------------- ------------------- ---------------- --------------- ---------------
1960 254,750 --- --- --- --- --- --- --- ---
1965 288,288 64,603 --- --- --- --- --- --- ---1966 --- --- --- --- --- --- --- --- ---1967 --- --- --- --- 46,953 --- --- --- ---1968 --- --- --- --- 46,958 0.0% --- --- --- ---1969 --- --- --- --- 46,339 -1.3% --- --- --- ---
1970 300,629 77,451 --- --- 52,183 12.6% --- --- --- ---1971 --- 76,768 -0.9% 27,132 38,869 56,167 7.6% --- --- --- ---1972 --- 75,482 -1.7% 30,007 10.6% 43,316 11.4% 50,333 -10.4% --- --- --- ---1973 --- 74,443 -1.4% 38,246 27.5% 57,649 33.1% 48,138 -4.4% --- --- --- ---1974 --- 74,883 0.6% 40,759 6.6% 50,821 -11.8% 47,715 -0.9% --- --- --- ---1975 319,776 77,062 2.9% 40,622 -0.3% 53,356 5.0% 51,145 7.2% --- 139,764 --- ---1976 320,565 0.2% 90,455 17.4% 58,425 43.8% 58,865 10.3% 52,982 3.6% --- 128,527 -8.0% --- ---1977 329,926 2.9% 100,655 11.3% 83,616 43.1% 65,636 11.5% 60,377 14.0% --- 131,780 2.5% --- ---1978 379,106 14.9% 125,291 24.5% 91,033 8.9% 74,583 13.6% 52,677 -12.8% 32,801 140,630 6.7% 153,504 ---1979 412,739 8.9% 127,477 1.7% 92,235 1.3% 71,033 -4.8% 51,703 -1.8% 72,024 119.6% 145,124 3.2% 177,767 15.8% ---
1980 375,408 -9.0% 111,573 -12.5% 66,944 -27.4% 62,829 -11.5% 49,969 -3.4% 67,761 -5.9% 130,989 -9.7% 142,438 -19.9% ---1981 339,359 -9.6% 102,760 -7.9% 57,488 -14.1% 59,404 -5.5% 53,274 6.6% 61,876 -8.7% 120,917 -7.7% 123,419 -13.4% ---1982 308,728 -9.0% 112,428 9.4% 51,889 -9.7% 65,305 9.9% 47,964 -10.0% 69,142 11.7% 90,725 -25.0% 108,828 -11.8% ---1983 333,038 7.9% 124,288 10.5% 66,581 28.3% 71,739 9.9% 54,470 13.6% 54,882 -20.6% 85,644 -5.6% 84,857 -22.0% ---1984 343,818 3.2% 142,311 14.5% 83,320 25.1% 100,992 40.8% 62,543 14.8% 53,513 -2.5% 89,230 4.2% 71,542 -15.7% ---1985 357,511 4.0% 157,231 10.5% 93,879 12.7% 131,755 30.5% 61,225 -2.1% 56,048 4.7% 95,149 6.6% 85,102 19.0% ---1986 368,049 2.9% 174,560 11.0% 81,467 -13.2% 143,905 9.2% 61,514 0.5% 52,268 -6.7% 99,966 5.1% 75,429 -11.4% ---1987 385,275 4.7% 165,920 -4.9% 67,497 -17.1% 134,495 -6.5% 80,123 30.3% 50,829 -2.8% 104,643 4.7% 62,406 -17.3% ---1988 377,919 -1.9% 173,053 4.3% 56,584 -16.2% 122,268 -9.1% 85,267 6.4% 50,456 -0.7% 115,364 10.2% 77,456 24.1% ---1989 403,635 6.8% 177,803 2.7% 55,674 -1.6% 116,742 -4.5% 93,202 9.3% 47,208 -6.4% 117,136 1.5% 80,193 3.5% ---
1990 407,048 0.8% 182,686 2.7% 60,086 7.9% 113,860 -2.5% 98,755 6.0% 43,509 -7.8% 97,980 -16.4% 69,468 -13.4% ---1991 403,566 -0.9% 180,857 -1.0% 56,140 -6.6% 112,679 -1.0% 88,206 -10.7% 47,898 10.1% 103,353 5.5% 62,184 -10.5% ---1992 403,628 0.0% 178,752 -1.2% 63,939 13.9% 103,686 -8.0% 91,055 3.2% 35,662 -25.5% 97,278 -5.9% 62,744 0.9% ---1993 358,505 -11.2% 172,265 -3.6% 59,904 -6.3% 70,910 -31.6% 92,297 1.4% 39,057 9.5% 92,720 -4.7% 54,277 -13.5% ---1994 359,569 0.3% 179,227 4.0% 66,438 10.9% 91,582 29.2% 86,292 -6.5% 38,369 -1.8% 82,941 -10.5% 51,942 -4.3% ---1995 373,926 4.0% 179,883 0.4% 73,537 10.7% 97,400 6.4% 84,917 -1.6% 45,517 18.6% 77,414 -6.7% 52,731 1.5% ---1996 372,268 -0.4% 178,590 -0.7% 77,025 4.7% 106,332 9.2% 87,862 3.5% 49,221 8.1% 74,800 -3.4% 39,671 -24.8% ---1997 358,784 -3.6% 173,342 -2.9% 87,358 13.4% 111,349 4.7% 101,521 15.5% 44,667 -9.3% 72,643 -2.9% 39,992 0.8% ---1998 334,046 -6.9% 180,890 4.4% 81,285 -7.0% 105,979 -4.8% 112,479 10.8% 49,353 10.5% 67,943 -6.5% 50,441 26.1% ---1999 346,609 3.8% 188,385 4.1% 82,955 2.1% 115,523 9.0% 115,820 3.0% 49,184 -0.3% 71,716 5.6% 29,128 -42.3% 75,293 1,074,613
2000 345,771 -0.2% 174,855 -7.2% 98,052 18.2% 113,850 -1.4% 115,546 -0.2% 44,691 -9.1% 84,791 18.2% 50,441 73.2% 160,157 112.7% 1,137,713 5.9%2001 327,006 -5.4% 160,324 -8.3% 107,793 9.9% 103,655 -9.0% 96,238 -16.7% 43,806 -2.0% 81,023 -4.4% 50,441 0.0% 183,600 14.6% 1,103,445 -3.0%
Air taxi operations were combined with general aviation operationsuntil they were separated in July 1971.
Ford Island, Calendar Year 1998 50,441
6-30-99 Ford Island (USN) closed.7-1-99 Kalaeloa owned by the State of Hawaii.9-11-01 Terrorist attacks on the United States (U.S.) led to the closing of all U.S. airports.
AIR-PS
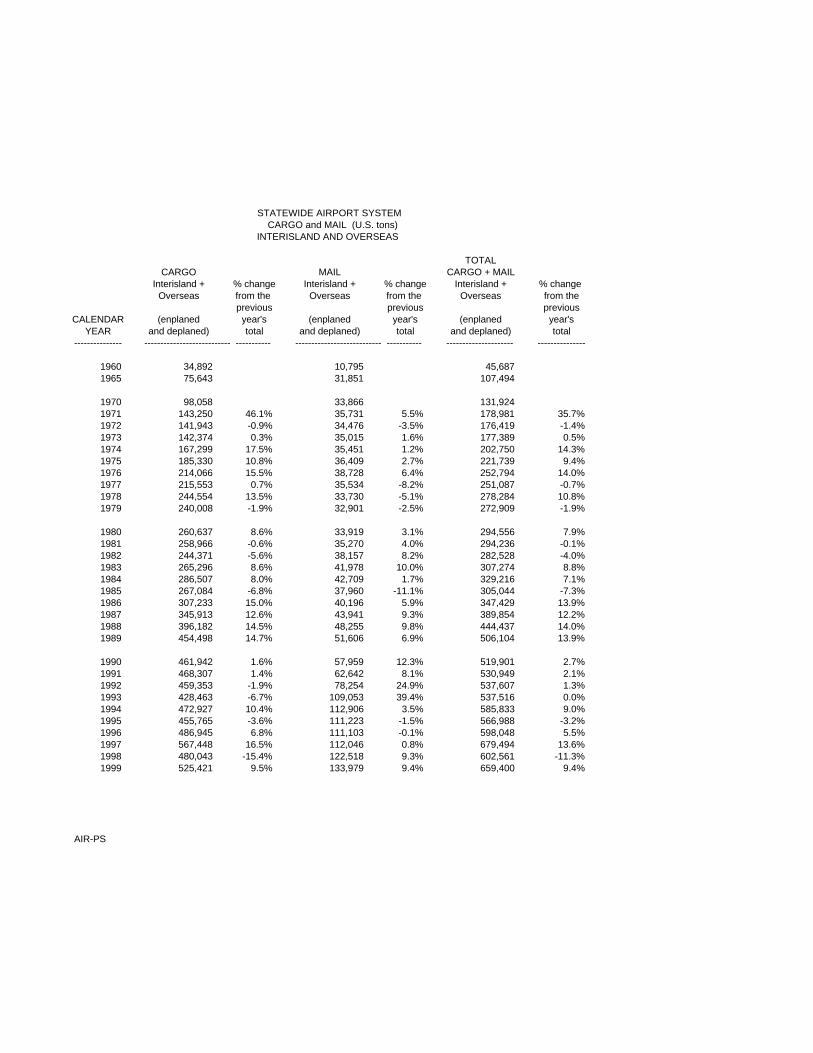
STATEWIDE AIRPORT SYSTEM CARGO and MAIL (U.S. tons) INTERISLAND AND OVERSEAS
TOTALCARGO MAIL CARGO + MAIL
Interisland + % change Interisland + % change Interisland + % change Overseas from the Overseas from the Overseas from the
previous previous previousCALENDAR (enplaned year's (enplaned year's (enplaned year's
YEAR and deplaned) total and deplaned) total and deplaned) total--------------- --------------------------- ----------- --------------------------- ----------- --------------------- ---------------
1960 34,892 10,795 45,6871965 75,643 31,851 107,494
1970 98,058 33,866 131,9241971 143,250 46.1% 35,731 5.5% 178,981 35.7%1972 141,943 -0.9% 34,476 -3.5% 176,419 -1.4%1973 142,374 0.3% 35,015 1.6% 177,389 0.5%1974 167,299 17.5% 35,451 1.2% 202,750 14.3%1975 185,330 10.8% 36,409 2.7% 221,739 9.4%1976 214,066 15.5% 38,728 6.4% 252,794 14.0%1977 215,553 0.7% 35,534 -8.2% 251,087 -0.7%1978 244,554 13.5% 33,730 -5.1% 278,284 10.8%1979 240,008 -1.9% 32,901 -2.5% 272,909 -1.9%
1980 260,637 8.6% 33,919 3.1% 294,556 7.9%1981 258,966 -0.6% 35,270 4.0% 294,236 -0.1%1982 244,371 -5.6% 38,157 8.2% 282,528 -4.0%1983 265,296 8.6% 41,978 10.0% 307,274 8.8%1984 286,507 8.0% 42,709 1.7% 329,216 7.1%1985 267,084 -6.8% 37,960 -11.1% 305,044 -7.3%1986 307,233 15.0% 40,196 5.9% 347,429 13.9%1987 345,913 12.6% 43,941 9.3% 389,854 12.2%1988 396,182 14.5% 48,255 9.8% 444,437 14.0%1989 454,498 14.7% 51,606 6.9% 506,104 13.9%
1990 461,942 1.6% 57,959 12.3% 519,901 2.7%1991 468,307 1.4% 62,642 8.1% 530,949 2.1%1992 459,353 -1.9% 78,254 24.9% 537,607 1.3%1993 428,463 -6.7% 109,053 39.4% 537,516 0.0%1994 472,927 10.4% 112,906 3.5% 585,833 9.0%1995 455,765 -3.6% 111,223 -1.5% 566,988 -3.2%1996 486,945 6.8% 111,103 -0.1% 598,048 5.5%1997 567,448 16.5% 112,046 0.8% 679,494 13.6%1998 480,043 -15.4% 122,518 9.3% 602,561 -11.3%1999 525,421 9.5% 133,979 9.4% 659,400 9.4%
AIR-PS

HONOLULU INTERNATIONAL AIRPORTPASSENGERSINTERISLAND
% change % change % changefrom the from the TOTAL from theprevious previous previous
CALENDAR year's year's (enplaned year'sYEAR ENPLANED total DEPLANED total and deplaned) total
----------------- ---------------------------- ------------ ---------------------------- ------------ ---------------------- ---------------
1960 410,375 413,339 823,7141965 612,207 613,327 1,225,534
1970 1,188,273 1,108,927 2,297,2001971 1,348,128 13.5% 1,246,709 12.4% 2,594,837 13.0%1972 1,608,394 19.3% 1,551,192 24.4% 3,159,586 21.8%1973 1,884,534 17.2% 1,851,877 19.4% 3,736,411 18.3%1974 2,046,021 8.6% 2,013,984 8.8% 4,060,005 8.7%1975 2,140,647 4.6% 2,210,167 9.7% 4,350,814 7.2%1976 2,353,284 9.9% 2,333,640 5.6% 4,686,924 7.7%1977 2,601,860 10.6% 2,586,533 10.8% 5,188,393 10.7%1978 3,039,122 16.8% 2,931,583 13.3% 5,970,705 15.1%1979 3,217,841 5.9% 3,141,669 7.2% 6,359,510 6.5%
1980 2,884,669 -10.4% 2,877,205 -8.4% 5,761,874 -9.4%1981 2,930,792 1.6% 2,929,298 1.8% 5,860,090 1.7%1982 3,207,960 9.5% 3,210,556 9.6% 6,418,516 9.5%1983 3,093,697 -3.6% 3,105,798 -3.3% 6,199,495 -3.4%1984 3,339,498 7.9% 3,364,191 8.3% 6,703,689 8.1%1985 3,458,592 3.6% 3,497,493 4.0% 6,956,085 3.8%1986 3,659,556 5.8% 3,700,748 5.8% 7,360,304 5.8%1987 3,898,325 6.5% 3,931,551 6.2% 7,829,876 6.4%1988 3,993,250 2.4% 4,018,523 2.2% 8,011,773 2.3%1989 4,302,111 7.7% 4,309,905 7.3% 8,612,016 7.5%
1990 4,445,160 3.3% 4,470,017 3.7% 8,915,177 3.5%1991 4,195,036 -5.6% 4,209,871 -5.8% 8,404,907 -5.7%1992 4,298,495 2.5% 4,322,602 2.7% 8,621,097 2.6%1993 4,251,863 -1.1% 4,261,404 -1.4% 8,513,267 -1.3%1994 4,489,460 5.6% 4,540,602 6.6% 9,030,062 6.1%1995 4,700,528 4.7% 4,763,644 4.9% 9,464,172 4.8%1996 4,785,165 1.8% 4,891,139 2.7% 9,676,304 2.2%1997 4,645,878 -2.9% 4,846,369 -0.9% 9,492,247 -1.9%1998 4,429,574 -4.7% 4,670,632 -3.6% 9,100,206 -4.1%1999 4,493,189 1.4% 4,693,657 0.5% 9,186,846 1.0%
2000 4,629,187 3.0% 4,795,326 2.2% 9,424,513 2.6%2001 4,498,754 -2.8% 3,904,023 -18.6% 8,402,777 -10.8%
Sept. 11, 2001 - Terrorist attacks on the United States (U.S.) led to the closing of all U.S. airports.
AIR-PS

HONOLULU INTERNATIONAL AIRPORTPASSENGERS OVERSEAS
% change % change % change TOTAL % changefrom the from the from the from theprevious previous previous (enplaned, previous
CALENDAR year's year's year's deplaned, year'sYEAR ENPLANED total TRANSITS total DEPLANED total and transits) total
--------------- ---------------------------- ------------ ---------------------------- ------------ ---------------------------- ------------ ---------------------- ---------------
1960 373,672 44,404 367,513 785,5891965 828,967 131,873 833,415 1,794,255
1970 1,977,716 876,713 2,082,965 4,937,3941971 2,107,586 6.6% 722,894 -17.5% 2,179,675 4.6% 5,010,155 1.5%1972 2,384,961 13.2% 733,362 1.4% 2,426,094 11.3% 5,544,417 10.7%1973 2,765,115 15.9% 870,348 18.7% 2,737,609 12.8% 6,373,072 14.9%1974 2,816,132 1.8% 885,122 1.7% 2,878,244 5.1% 6,579,498 3.2%1975 3,008,635 6.8% 956,576 8.1% 3,080,418 7.0% 7,045,629 7.1%1976 3,288,657 9.3% 816,915 -14.6% 3,390,023 10.1% 7,495,595 6.4%1977 3,468,806 5.5% 714,150 -12.6% 3,551,546 4.8% 7,734,502 3.2%1978 3,880,091 11.9% 854,276 19.6% 3,998,692 12.6% 8,733,059 12.9%1979 4,022,440 3.7% 971,452 13.7% 4,152,767 3.9% 9,146,659 4.7%
1980 4,084,416 1.5% 1,118,987 15.2% 4,190,060 0.9% 9,393,463 2.7%1981 4,242,474 3.9% 1,032,264 -7.8% 4,241,661 1.2% 9,516,399 1.3%1982 4,585,094 8.1% 882,832 -14.5% 4,607,145 8.6% 10,075,071 5.9%1983 4,517,668 -1.5% 773,470 -12.4% 4,544,830 -1.4% 9,835,968 -2.4%1984 4,939,652 9.3% 727,947 -5.9% 4,916,332 8.2% 10,583,931 7.6%1985 4,849,471 -1.8% 858,501 17.9% 4,833,147 -1.7% 10,541,119 -0.4%1986 5,490,360 13.2% 841,241 -2.0% 5,384,490 11.4% 11,716,091 11.1%1987 5,756,190 4.8% 1,109,850 31.9% 5,684,126 5.6% 12,550,166 7.1%1988 6,125,170 6.4% 1,421,707 28.1% 6,018,891 5.9% 13,565,768 8.1%1989 6,552,927 7.0% 1,167,954 -17.8% 6,284,443 4.4% 14,005,324 3.2%
1990 6,837,726 4.3% 1,065,408 -8.8% 6,549,459 4.2% 14,452,593 3.2%1991 6,457,548 -5.6% 1,020,464 -4.2% 6,341,675 -3.2% 13,819,687 -4.4%1992 6,269,504 -2.9% 1,318,044 29.2% 6,399,543 0.9% 13,987,091 1.2%1993 6,147,034 -2.0% 1,298,684 -1.5% 6,102,968 -4.6% 13,548,686 -3.1%1994 6,621,058 7.7% 956,926 -26.3% 6,387,930 4.7% 13,965,914 3.1%1995 6,842,155 3.3% 750,495 -21.6% 6,616,072 3.6% 14,208,722 1.7%1996 7,186,081 5.0% 690,833 -7.9% 6,773,519 2.4% 14,650,433 3.1%1997 6,941,107 -3.4% 706,030 2.2% 6,740,962 -0.5% 14,388,099 -1.8%1998 6,694,626 -3.6% 466,807 -33.9% 6,374,715 -5.4% 13,536,148 -5.9%1999 6,604,650 -1.3% 376,236 -19.4% 6,392,667 0.3% 13,373,553 -1.2%
2000 6,642,705 0.6% 407,359 8.3% 6,553,097 2.5% 13,603,161 1.7%2001 5,781,553 -13.0% 275,853 -32.3% 5,691,752 -13.1% 11,749,158 -13.6%
Sept. 11, 2001 - Terrorist attacks on the United States (U.S.) led to the closing of all U.S. airports.
AIR-PS

HONOLULU INTERNATIONAL AIRPORT PASSENGERS
INTERISLAND AND OVERSEAS
TOTAL %change %Change INTERISLAND %Change
INTERISLAND from the OVERSEAS from the ANO OVERSEAS from the previous previous previous
CALENDAR (enplaned yea(s (OC1planed, deplaned, year's (enplaned. deplaned, yeafs YEAR and deplaned} total and transits) total and transits) total
------- ------------- --------------- --------- -----1960 823,714 785,589 1,609.303 1965 1.225.534 1,794.255 3.019,789
1970 2,297.200 4,937.394 7,234,594 1971 2.594.837 13.0% 5.010,155 1.5% 7,604,992 5.1% 1972 3,159.586 21.8% 5,544,417 10.7% 8,704,003 14.5% 1973 3.736,411 18.3% 6.373,072 14.9% 10,109,483 16.1 % 1974 4,060.005 8.7% 6.579,498 3.2% 10,639.503 5.2% 1975 4,350,814 7.2% 7,045.629 7.1% 11,396,443 7.1% 1976 4,686,924 7.7% 7,495.595 6.4% 12,182.519 6.9% 1977 5.188.393 10.7% 7,734,502 3.2% 12.922,895 6.1% 1978 5,970,705 15.1% 8.733.059 12.9% 14,703,764 13.8% 1979 6,359,510 6.5% 9,146,659 4.7% 15,506,169 5.5%
1980 5,761,874 -9.4% 9,393,463 2.7% 15,155,337 -2.3% 1981 5,860,090 1.7% 9,516,399 1.3% 15,376,489 1.5% 1982 6.418,516 9.5% 10,075.071 5.9% 16,493,587 7.3% 1983 6,199,495 -3.4% 9.835.968 -2.4% 16,035,463 -2.8% 1964 6,703,689 8.1% 10,583,931 7.6% 17,287,620 7.8% 1985 6,958.085 3.8% 10.541 ,119 -0.4% 17,497.204 1.2% 1986 7,360.304 5.8% 11,716,091 11.1% 19,076.395 9.0% 1987 7,829.876 6.4% 12,550,166 7.1% 20,360,042 6.8% 1988 8,011,773 2.3% 13.565.768 8.1% 21 .577,541 5.9% 1989 8,612,016 7.5% 14,005.324 3.2% 22,617,340 4.8%
1990 8,915,177 3.5% 14.452.593 3.2% 23,367,770 3.3% 1991 8,404,907 -5.7% 13,819,687 -4.4% 22,224,594 -4.9% 1992 8,62 1,097 2.6% 13,987,091 1.2% 22,608,188 1.7% 1993 8,513.267 -1.3% 13.548.686 -3.1% 22.061,953 -2.4% 1994 9.030.062 6.1% 13,965.914 3.1 % 22,995.976 4.2% 1995 9,464,172 4.8% 14.208,722 1.7% 23,672,894 2.9% 1996 9,676.304 2.2% 14,650.433 3.1% 24.326,737 2.8% 1997 9,492.247 -1.9% 14,388.099 -1.8% 23.880,346 -1.8% 1998 9,100,206 -4.1% 13,536,148 -5.9% 22.636,354 -5.2% 1999 9.186.846 1.0% 13.373.553 -1 .2% 22.560,399 -0.3%
2000 9,424,513 2.6% 13,603,161 1.7% 23,027,674 2.1% 2001 8,402.777 -10.9% 11,749,158 -13.4% 20.151.935 -12.4%
Sept. 11, 2001- Terrorist attaCks on tile United States (U.S.) led to tile closing of all u.s. airpor1s.
AIR-PS

Honolulu International Airport International Passenger Arrivals
| % ofTotal % of | Overseas
Asian Overseas Int'l | Domestic% change % change Passenger % change Passenger Passenger | % change Passengerfrom the from the Arrivals from the Arrivals Arrivals | Overseas from the Arrivals
Int'l previous Japan previous previous of the Total | Domestic previous of the TotalCalendar Passenger year's Passenger year's including year's (Domestic + Overseas | Passenger year's Overseas
Year Arrivals total Arrivals total Japan total International) Arrivals | Arrivals total Arrivals--------------- -- ------------------ --------------- ------------------ --------------- --------------------- --------------- --------------------- -------------------- | --------------- --------------- ---------------------
1970 346,912 | 1,535,4151971 456,501 31.6% | 1,595,584 3.9%1972 551,043 20.7% | 1,804,013 13.1%1973 614,293 11.5% | 2,062,625 14.3%1974 654,907 6.6% | 2,171,556 5.3%1975 737,270 12.6% | 2,251,591 3.7%1976 805,830 9.3% | 2,552,161 13.3%1977 795,853 -1.2% | 2,729,039 6.9%1978 847,264 6.5% 697,869 3,977,754 21.3% | 3,130,490 14.7% 78.7%1979 1,000,604 18.1% 815,917 16.9% 4,152,767 24.1% | 3,152,163 0.7% 75.9%
1980 1,041,767 4.1% 802,796 -1.6% 4,190,060 24.9% | 3,148,293 -0.1% 75.1%1981 1,107,259 6.3% 842,747 5.0% 4,241,661 26.1% | 3,134,402 -0.4% 73.9%1982 1,130,926 2.1% 862,837 2.4% 4,607,145 24.5% | 3,476,219 10.9% 75.5%1983 1,087,300 -3.9% 880,714 2.1% 4,544,830 23.9% | 3,457,530 -0.5% 76.1%1984 1,171,585 7.8% 956,775 8.6% 4,916,332 23.8% | 3,744,747 8.3% 76.2%1985 1,212,303 3.5% 1,011,581 5.7% 4,833,147 25.1% | 3,620,844 -3.3% 74.9%1986 1,386,499 14.4% 1,098,773 8.6% 5,384,490 25.7% | 3,997,991 10.4% 74.3%1987 1,721,168 24.1% 1,295,988 17.9% 5,684,126 30.3% | 3,962,958 -0.9% 69.7%1988 1,881,077 9.3% 1,460,852 12.7% 6,017,094 31.3% | 4,136,017 4.4% 68.7%1989 2,254,916 19.9% 1,653,371 13.2% 6,284,443 35.9% | 4,029,527 -2.6% 64.1%
1990 2,473,671 9.7% 1,848,549 11.8% 6,549,459 37.8% | 4,075,788 1.1% 62.2%1991 2,524,642 2.1% 1,908,231 3.2% 6,341,675 39.8% | 3,817,033 -6.3% 60.2%1992 2,781,316 10.2% 2,180,952 14.3% 6,399,543 43.5% | 3,618,227 -5.2% 56.5%1993 2,596,631 -6.6% 1,744,676 1,979,015 -9.3% 6,102,968 42.5% | 3,506,337 -3.1% 57.5%1994 2,684,887 3.4% 1,945,387 11.5% 2,232,143 12.8% 6,387,930 42.0% | 3,703,043 5.6% 58.0%1995 2,945,149 9.7% 2,172,039 11.7% 2,485,268 11.3% 6,616,072 44.5% | 3,670,923 -0.9% 55.5%1996 3,011,087 2.2% 2,252,251 3.7% 2,561,655 3.1% 6,773,519 44.5% | 3,762,432 2.5% 55.5%1997 2,963,278 -1.6% 2,271,227 0.8% 2,557,442 -0.2% 6,740,962 44.0% | 3,777,684 0.4% 56.0%1998 2,601,925 -12.2% 2,015,711 -11.3% 2,173,006 -15.0% 6,374,715 40.8% | 3,772,790 -0.1% 59.2%1999 2,463,182 -5.3% 1,848,599 -8.3% 2,003,127 -7.8% 6,392,667 38.5% | 3,929,485 4.2% 61.5%
2000 2,518,490 2.2% 1,884,498 1.9% 2,058,536 2.8% 6,553,097 38.4% | 4,034,607 2.7% 61.6%2001 2,074,106 -17.6% 1,546,901 -17.9% 1,659,750 -19.4% 5,691,752 36.4% | 3,617,646 -10.3% 63.6%
Sept. 11, 2001 - Terrorist attacks on the United States (U.S.) led to the closing of all U.S. airports.
Excluding transits.
AIR-PS

Honolulu International Airport Honolulu International Airport International Passenger Departures
| % ofTotal % of | Overseas
Overseas Int'l | Domestic% change Passenger Passenger | % change Passengerfrom the Departures Departures | Overseas from the Departures
Int'l previous of the Total | Domestic previous of the TotalCalendar Passenger year's (Domestic + Overseas | Passenger year's Overseas
Year Departures total International) Departures | Departures total Departures--------------- ------------------- --------------- ---------------------- --------------------- | --------------------- --------------- ---------------------
|1978 864,387 3,843,323 22.5% | 2,978,936 77.5%1979 1,030,691 19.2% 4,022,440 25.6% | 2,991,749 0.4% 74.4%1980 1,073,250 4.1% 4,084,416 26.3% | 3,011,166 0.6% 73.7%1981 1,137,361 6.0% 4,242,474 26.8% | 3,105,113 3.1% 73.2%1982 1,151,453 1.2% 4,685,094 24.6% | 3,533,641 13.8% 75.4%1983 1,093,202 -5.1% 4,517,668 24.2% | 3,424,466 -3.1% 75.8%1984 1,200,075 9.8% 4,939,652 24.3% | 3,739,577 9.2% 75.7%1985 1,220,696 1.7% 4,849,471 25.2% | 3,628,775 -3.0% 74.8%1986 1,388,098 13.7% 5,490,360 25.3% | 4,102,262 13.0% 74.7%1987 1,713,320 23.4% 5,756,190 29.8% | 4,042,870 -1.4% 70.2%1988 1,876,592 9.5% 6,124,440 30.6% | 4,247,848 5.1% 69.4%1989 2,325,937 23.9% 6,552,927 35.5% | 4,226,990 -0.5% 64.5%1990 2,528,582 8.7% 6,837,726 37.0% | 4,309,144 1.9% 63.0%1991 2,518,105 -0.4% 6,457,548 39.0% | 3,939,443 -8.6% 61.0%1992 2,673,091 6.2% 6,269,504 42.6% | 3,596,413 -8.7% 57.4%1993 2,576,734 -3.6% 6,147,034 41.9% | 3,570,300 -0.7% 58.1%1994 2,818,994 9.4% 6,621,058 42.6% | 3,802,064 6.5% 57.4%1995 3,069,528 8.9% 6,842,155 44.9% | 3,772,627 -0.8% 55.1%1996 3,253,586 6.0% 7,186,081 45.3% | 3,932,495 4.2% 54.7%1997 3,138,202 -3.5% 6,941,107 45.2% | 3,802,905 -3.3% 54.8%1998 2,819,387 -10.2% 6,694,626 42.1% | 3,875,239 1.9% 57.9%1999 2,609,957 -7.4% 6,604,650 39.5% | 3,994,693 3.1% 60.5%2000 2,567,293 -1.6% 6,642,705 38.6% | 4,075,412 2.0% 61.4%2001 2,147,395 -16.4% 5,781,553 37.1% | 3,634,158 -10.8% 62.9%
Sept. 11, 2001 - Terrorist attacks on the United States (U.S.) led to the closing of all U.S. airports.
Excluding transits.
AIR-PS
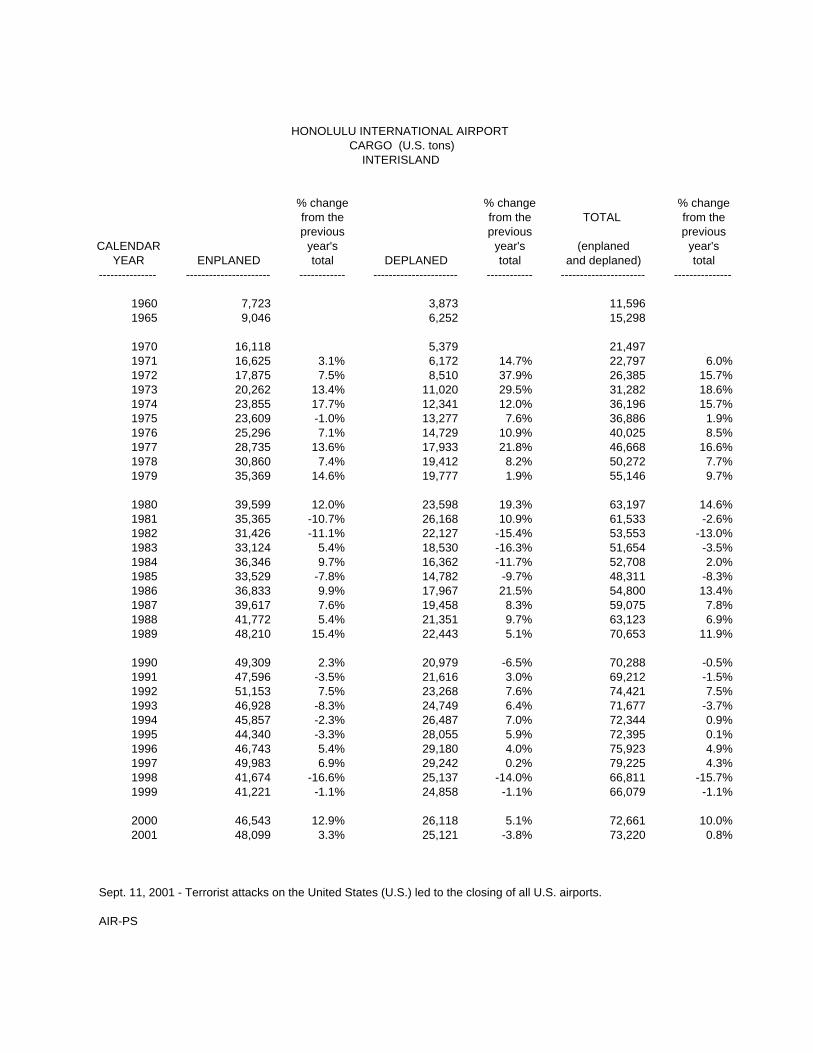
HONOLULU INTERNATIONAL AIRPORTCARGO (U.S. tons) INTERISLAND
% change % change % changefrom the from the TOTAL from theprevious previous previous
CALENDAR year's year's (enplaned year'sYEAR ENPLANED total DEPLANED total and deplaned) total
--------------- ---------------------- ------------ ---------------------- ------------ ---------------------- ---------------
1960 7,723 3,873 11,5961965 9,046 6,252 15,298
1970 16,118 5,379 21,4971971 16,625 3.1% 6,172 14.7% 22,797 6.0%1972 17,875 7.5% 8,510 37.9% 26,385 15.7%1973 20,262 13.4% 11,020 29.5% 31,282 18.6%1974 23,855 17.7% 12,341 12.0% 36,196 15.7%1975 23,609 -1.0% 13,277 7.6% 36,886 1.9%1976 25,296 7.1% 14,729 10.9% 40,025 8.5%1977 28,735 13.6% 17,933 21.8% 46,668 16.6%1978 30,860 7.4% 19,412 8.2% 50,272 7.7%1979 35,369 14.6% 19,777 1.9% 55,146 9.7%
1980 39,599 12.0% 23,598 19.3% 63,197 14.6%1981 35,365 -10.7% 26,168 10.9% 61,533 -2.6%1982 31,426 -11.1% 22,127 -15.4% 53,553 -13.0%1983 33,124 5.4% 18,530 -16.3% 51,654 -3.5%1984 36,346 9.7% 16,362 -11.7% 52,708 2.0%1985 33,529 -7.8% 14,782 -9.7% 48,311 -8.3%1986 36,833 9.9% 17,967 21.5% 54,800 13.4%1987 39,617 7.6% 19,458 8.3% 59,075 7.8%1988 41,772 5.4% 21,351 9.7% 63,123 6.9%1989 48,210 15.4% 22,443 5.1% 70,653 11.9%
1990 49,309 2.3% 20,979 -6.5% 70,288 -0.5%1991 47,596 -3.5% 21,616 3.0% 69,212 -1.5%1992 51,153 7.5% 23,268 7.6% 74,421 7.5%1993 46,928 -8.3% 24,749 6.4% 71,677 -3.7%1994 45,857 -2.3% 26,487 7.0% 72,344 0.9%1995 44,340 -3.3% 28,055 5.9% 72,395 0.1%1996 46,743 5.4% 29,180 4.0% 75,923 4.9%1997 49,983 6.9% 29,242 0.2% 79,225 4.3%1998 41,674 -16.6% 25,137 -14.0% 66,811 -15.7%1999 41,221 -1.1% 24,858 -1.1% 66,079 -1.1%
2000 46,543 12.9% 26,118 5.1% 72,661 10.0%2001 48,099 3.3% 25,121 -3.8% 73,220 0.8%
Sept. 11, 2001 - Terrorist attacks on the United States (U.S.) led to the closing of all U.S. airports.
AIR-PS

HONOLULU INTERNATIONAL AIRPORTCARGO (U.S. tons)
OVERSEAS
% change % change % changefrom the from the TOTAL from theprevious previous previous
CALENDAR year's year's (enplaned year'sYEAR ENPLANED total DEPLANED total and deplaned) total
--------------- ---------------------- ------------ ---------------------- ------------ ---------------------- ---------------
1960 4,120 5,439 9,5591965 15,834 20,244 36,078
1970 12,648 26,653 39,3011971 27,447 117.0% 56,706 112.8% 84,153 114.1%1972 20,877 -23.9% 52,132 -8.1% 73,009 -13.2%1973 18,337 -12.2% 41,866 -19.7% 60,203 -17.5%1974 28,016 52.8% 45,147 7.8% 73,163 21.5%1975 36,489 30.2% 53,187 17.8% 89,676 22.6%1976 47,284 29.6% 64,754 21.7% 112,038 24.9%1977 52,887 11.8% 63,365 -2.1% 116,252 3.8%1978 56,236 6.3% 64,784 2.2% 121,020 4.1%1979 50,313 -10.5% 57,909 -10.6% 108,222 -10.6%
1980 58,533 16.3% 54,609 -5.7% 113,142 4.5%1981 72,868 24.5% 49,050 -10.2% 121,918 7.8%1982 75,446 3.5% 51,670 5.3% 127,116 4.3%1983 84,677 12.2% 67,066 29.8% 151,743 19.4%1984 92,759 9.5% 74,151 10.6% 166,910 10.0%1985 88,500 -4.6% 71,862 -3.1% 160,362 -3.9%1986 98,053 10.8% 87,748 22.1% 185,801 15.9%1987 110,719 12.9% 96,701 10.2% 207,420 11.6%1988 136,648 23.4% 113,150 17.0% 249,798 20.4%1989 148,177 8.4% 140,302 24.0% 288,479 15.5%
1990 138,797 -6.3% 157,376 12.2% 296,173 2.7%1991 142,674 2.8% 158,211 0.5% 300,885 1.6%1992 140,360 -1.6% 139,232 -12.0% 279,592 -7.1%1993 141,643 0.9% 117,274 -15.8% 258,917 -7.4%1994 157,771 11.4% 144,024 22.8% 301,795 16.6%1995 158,817 0.7% 130,825 -9.2% 289,642 -4.0%1996 167,341 5.4% 141,060 7.8% 308,401 6.5%1997 201,757 20.6% 174,411 23.6% 376,168 22.0%1998 171,892 -14.8% 148,778 -14.7% 320,670 -14.8%1999 193,282 12.4% 171,115 15.0% 364,397 13.6%
2000 165,247 -14.5% 151,299 -11.6% 316,546 -13.1%2001 107,781 -34.8% 94,939 -37.3% 202,720 -36.0%
Sept. 11, 2001 - Terrorist attacks on the United States (U.S.) led to the closing of all U.S. airports.
AIR-PS

HONOLULU INTERNATIONAL AIRPORT CARGO (U.S tons) CARGO (U.S. tons) INTERISLAND AND OVERSEAS
TOTAL% change % change INTERISLAND % change
INTERISLAND from the OVERSEAS from the AND OVERSEAS from theprevious previous previous
CALENDAR (enplaned year's (enplaned year's (enplaned year'sYEAR and deplaned) total and deplaned) total and deplaned) total
--------------- ---------------------- ------------ ---------------------- ------------ ---------------------- ---------------
1960 11,596 9,559 21,1551965 15,298 36,078 51,376
1970 21,497 39,301 60,7981971 22,797 6.0% 84,153 114.1% 106,950 75.9%1972 26,385 15.7% 73,009 -13.2% 99,394 -7.1%1973 31,282 18.6% 60,203 -17.5% 91,485 -8.0%1974 36,196 15.7% 73,163 21.5% 109,359 19.5%1975 36,886 1.9% 89,676 22.6% 126,562 15.7%1976 40,025 8.5% 112,038 24.9% 152,063 20.1%1977 46,668 16.6% 116,252 3.8% 162,920 7.1%1978 50,272 7.7% 121,020 4.1% 171,292 5.1%1979 55,146 9.7% 108,222 -10.6% 163,368 -4.6%
1980 63,197 14.6% 113,142 4.5% 176,339 7.9%1981 61,533 -2.6% 121,918 7.8% 183,451 4.0%1982 53,553 -13.0% 127,116 4.3% 180,669 -1.5%1983 51,654 -3.5% 151,743 19.4% 203,397 12.6%1984 52,708 2.0% 166,910 10.0% 219,618 8.0%1985 48,311 -8.3% 160,362 -3.9% 208,673 -5.0%1986 54,800 13.4% 185,801 15.9% 240,601 15.3%1987 59,075 7.8% 207,420 11.6% 266,495 10.8%1988 63,123 6.9% 249,798 20.4% 312,921 17.4%1989 70,653 11.9% 288,479 15.5% 359,132 14.8%
1990 70,288 -0.5% 296,173 2.7% 366,461 2.0%1991 69,212 -1.5% 300,885 1.6% 370,097 1.0%1992 74,421 7.5% 279,592 -7.1% 354,013 -4.3%1993 71,677 -3.7% 258,917 -7.4% 330,594 -6.6%1994 72,344 0.9% 301,795 16.6% 374,139 13.2%1995 72,395 0.1% 289,642 -4.0% 362,037 -3.2%1996 75,923 4.9% 308,401 6.5% 384,324 6.2%1997 79,225 4.3% 376,168 22.0% 455,393 18.5%1998 66,811 -15.7% 320,670 -14.8% 387,481 -14.9%1999 66,079 -1.1% 364,397 13.6% 430,476 11.1%
2000 72,661 10.0% 316,546 -13.1% 389,207 -9.6%2001 73,220 0.8% 202,720 -36.0% 275,940 -29.1%
Sept. 11, 2001 - Terrorist attacks on the United States (U.S.) led to the closing of all U.S. airports.
AIR-PS

HONOLULU INTERNATIONAL AIRPORTMAIL (U.S. tons) INTERISLAND
% change % change % changefrom the from the TOTAL from the previous previous previous
CALENDAR year's year's (enplaned year'sYEAR ENPLANED total DEPLANED total and deplaned) total
--------------- ---------------------- ------------ ---------------------- ------------ ---------------------- ---------------
1960 297 272 5691965 1,525 717 2,242
1970 5,391 1,628 7,0191971 5,490 1.8% 1,466 -10.0% 6,956 -0.9%1972 5,701 3.8% 1,538 4.9% 7,239 4.1%1973 6,313 10.7% 1,662 8.1% 7,975 10.2%1974 6,357 0.7% 1,712 3.0% 8,069 1.2%1975 6,692 5.3% 1,959 14.4% 8,651 7.2%1976 7,311 9.2% 1,996 1.9% 9,307 7.6%1977 6,279 -14.1% 2,100 5.2% 8,379 -10.0%1978 5,148 -18.0% 2,349 11.9% 7,497 -10.5%1979 4,777 -7.2% 2,560 9.0% 7,337 -2.1%
1980 3,969 -16.9% 2,757 7.7% 6,726 -8.3%1981 4,178 5.3% 2,831 2.7% 7,009 4.2%1982 7,462 78.6% 2,985 5.4% 10,447 49.1%1983 4,807 -35.6% 3,136 5.1% 7,943 -24.0%1984 4,861 1.1% 3,243 3.4% 8,104 2.0%1985 4,476 -7.9% 3,521 8.6% 7,997 -1.3%1986 4,842 8.2% 3,513 -0.2% 8,355 4.5%1987 4,982 2.9% 3,520 0.2% 8,502 1.8%1988 5,444 9.3% 3,803 8.0% 9,247 8.8%1989 6,161 13.2% 4,006 5.3% 10,167 9.9%
1990 6,786 10.1% 4,529 13.1% 11,315 11.3%1991 7,143 5.3% 4,685 3.4% 11,828 4.5%1992 8,028 12.4% 4,753 1.5% 12,781 8.1%1993 8,163 1.7% 5,014 5.5% 13,177 3.1%1994 8,800 7.8% 5,162 3.0% 13,962 6.0%1995 8,751 -0.6% 5,069 -1.8% 13,820 -1.0%1996 9,113 4.1% 5,389 6.3% 14,502 4.9%1997 10,317 13.2% 5,284 -1.9% 15,601 7.6%1998 14,950 44.9% 5,282 0.0% 20,232 29.7%1999 18,381 22.9% 5,496 4.1% 23,877 18.0%
2000 20,158 9.7% 3,538 -35.6% 23,696 -0.8%2001 16,306 -19.1% 5,115 44.6% 21,421 -9.6%
Sept. 11, 2001 - Terrorist attacks on the United States (U.S.) led to the closing of all U.S. airports.
AIR-PS

HONOLULU INTERNATIONAL AIRPORT MAIL (U.S. tons) OVERSEAS
% change % change % changefrom the from the TOTAL from theprevious previous previous
CALENDAR year's year's (enplaned year'sYEAR ENPLANED total DEPLANED total and deplaned) total
--------------- ---------------------- ------------ ---------------------- ------------ ---------------------- ---------------
1960 4,556 5,101 9,6571965 13,104 13,850 26,954
1970 8,948 10,677 19,6251971 8,846 -1.1% 12,439 16.5% 21,285 8.5%1972 8,213 -7.2% 11,367 -8.6% 19,580 -8.0%1973 7,955 -3.1% 10,500 -7.6% 18,455 -5.7%1974 7,966 0.1% 10,764 2.5% 18,730 1.5%1975 breakdown of data 18,467 -1.4%1976 not available 19,704 6.7%1977 8,001 10,311 18,312 -7.1%1978 8,394 4.9% 9,943 -3.6% 18,337 0.1%1979 8,574 2.1% 8,788 -11.6% 17,362 -5.3%
1980 10,409 21.4% 9,791 11.4% 20,200 16.3%1981 9,885 -5.0% 11,194 14.3% 21,079 4.4%1982 10,563 6.9% 12,503 11.7% 23,066 9.4%1983 11,586 9.7% 14,144 13.1% 25,730 11.5%1984 11,263 -2.8% 14,748 4.3% 26,011 1.1%1985 10,620 -5.7% 11,059 -25.0% 21,679 -16.7%1986 11,248 5.9% 11,862 7.3% 23,110 6.6%1987 11,780 4.7% 14,502 22.3% 26,282 13.7%1988 13,831 17.4% 15,510 7.0% 29,341 11.6%1989 14,103 2.0% 16,766 8.1% 30,869 5.2%
1990 16,011 13.5% 19,099 13.9% 35,110 13.7%1991 16,829 5.1% 22,135 15.9% 38,964 11.0%1992 19,628 16.6% 33,018 49.2% 52,646 35.1%1993 26,162 33.3% 56,485 71.1% 82,647 57.0%1994 23,961 -8.4% 60,981 8.0% 84,942 2.8%1995 24,503 2.3% 59,049 -3.2% 83,552 -1.6%1996 24,327 -0.7% 57,204 -3.1% 81,531 -2.4%1997 25,437 4.6% 55,144 -3.6% 80,581 -1.2%1998 27,737 9.0% 53,493 -3.0% 81,230 0.8%1999 29,267 5.5% 55,487 3.7% 84,754 4.3%
2000 28,773 -1.7% 55,166 -0.6% 83,939 -1.0%2001 23,331 -18.9% 51,147 -7.3% 74,478 -11.3%
Sept. 11, 2001 - Terrorist attacks on the United States (U.S.) led to the closing of all U.S. airports.
AIR-PS

HONOLULU INTERNATIONAL AIRPORT MAIL (U.S. tons)
INTERISLAND AND OVERSEAS
TOTAL% change % change INTERISLAND % change
INTERISLAND from the OVERSEAS from the AND OVERSEAS from theprevious previous previous
CALENDAR (enplaned year's (enplaned year's (enplaned year'sYEAR and deplaned) total and deplaned) total and deplaned) total
--------------- ---------------------- ------------ ---------------------------- ------------ ---------------------- ---------------
1960 569 9,657 10,2261965 2,242 26,954 29,196
1970 7,019 19,625 26,6441971 6,956 -0.9% 21,285 8.5% 28,241 6.0%1972 7,239 4.1% 19,580 -8.0% 26,819 -5.0%1973 7,975 10.2% 18,455 -5.7% 26,430 -1.5%1974 8,069 1.2% 18,730 1.5% 26,799 1.4%1975 8,651 7.2% 18,467 -1.4% 27,118 1.2%1976 9,307 7.6% 19,704 6.7% 29,011 7.0%1977 8,379 -10.0% 18,312 -7.1% 26,691 -8.0%1978 7,497 -10.5% 18,337 0.1% 25,834 -3.2%1979 7,337 -2.1% 17,362 -5.3% 24,699 -4.4%
1980 6,726 -8.3% 20,200 16.3% 26,926 9.0%1981 7,009 4.2% 21,079 4.4% 28,088 4.3%1982 10,447 49.1% 23,066 9.4% 33,513 19.3%1983 7,943 -24.0% 25,730 11.5% 33,673 0.5%1984 8,104 2.0% 26,011 1.1% 34,115 1.3%1985 7,997 -1.3% 21,679 -16.7% 29,676 -13.0%1986 8,355 4.5% 23,110 6.6% 31,465 6.0%1987 8,502 1.8% 26,282 13.7% 34,784 10.5%1988 9,247 8.8% 29,341 11.6% 38,588 10.9%1989 10,167 9.9% 30,869 5.2% 41,036 6.3%
1990 11,315 11.3% 35,110 13.7% 46,425 13.1%1991 11,828 4.5% 38,964 11.0% 50,792 9.4%1992 12,781 8.1% 52,646 35.1% 65,427 28.8%1993 13,177 3.1% 82,647 57.0% 95,824 46.5%1994 13,962 6.0% 84,942 2.8% 98,904 3.2%1995 13,820 -1.0% 83,552 -1.6% 97,372 -1.5%1996 14,502 4.9% 81,531 -2.4% 96,033 -1.4%1997 15,601 7.6% 80,581 -1.2% 96,182 0.2%1998 20,232 29.7% 81,230 0.8% 101,462 5.5%1999 23,877 18.0% 84,754 4.3% 108,631 7.1%
2000 23,696 -0.8% 83,939 -1.0% 107,635 -0.9%2001 21,421 -9.6% 74,478 -11.3% 95,899 -10.9%
Sept. 11, 2001 - Terrorist attacks on the United States (U.S.) led to the closing of all U.S. airports.
AIR-PS

HONOLULU INTERNATIONAL AIRPORT CARGO and MAIL (U.S. tons) INTERISLAND AND OVERSEAS
TOTALCARGO MAIL CARGO + MAIL
Interisland + % change Interisland + % change Interisland + % changeOverseas from the Overseas from the Overseas from the
previous previous previousCALENDAR (enplaned year's (enplaned year's (enplaned year's
YEAR and deplaned) total and deplaned) total and deplaned) total--------------- ---------------------------- ------------ ---------------------------- ------------ --------------------- ---------------
1960 21,155 10,226 31,3811965 51,376 29,196 80,572
1970 60,798 26,644 87,4421971 106,950 75.9% 28,241 6.0% 135,191 54.6%1972 99,394 -7.1% 26,819 -5.0% 126,213 -6.6%1973 91,485 -8.0% 26,430 -1.5% 117,915 -6.6%1974 109,359 19.5% 26,799 1.4% 136,158 15.5%1975 126,562 15.7% 27,118 1.2% 153,680 12.9%1976 152,063 20.1% 29,011 7.0% 181,074 17.8%1977 162,920 7.1% 26,691 -8.0% 189,611 4.7%1978 171,292 5.1% 25,834 -3.2% 197,126 4.0%1979 163,368 -4.6% 24,699 -4.4% 188,067 -4.6%
1980 176,339 7.9% 26,926 9.0% 203,265 8.1%1981 183,451 4.0% 28,088 4.3% 211,539 4.1%1982 180,669 -1.5% 33,513 19.3% 214,182 1.2%1983 203,397 12.6% 33,673 0.5% 237,070 10.7%1984 219,618 8.0% 34,115 1.3% 253,733 7.0%1985 208,673 -5.0% 29,676 -13.0% 238,349 -6.1%1986 240,601 15.3% 31,465 6.0% 272,066 14.1%1987 266,495 10.8% 34,784 10.5% 301,279 10.7%1988 312,921 17.4% 38,588 10.9% 351,509 16.7%1989 359,132 14.8% 41,036 6.3% 400,168 13.8%
1990 366,461 2.0% 46,425 13.1% 412,886 3.2%1991 370,097 1.0% 50,792 9.4% 420,889 1.9%1992 354,013 -4.3% 65,427 28.8% 419,440 -0.3%1993 330,594 -6.6% 95,824 46.5% 426,418 1.7%1994 374,139 13.2% 98,904 3.2% 473,043 10.9%1995 362,037 -3.2% 97,372 -1.5% 459,409 -2.9%1996 384,324 6.2% 96,033 -1.4% 480,357 4.6%1997 455,393 18.5% 96,182 0.2% 551,575 14.8%1998 387,481 -14.9% 101,462 5.5% 488,943 -11.4%1999 430,476 11.1% 108,631 7.1% 539,107 10.3%
2000 389,207 -9.6% 107,635 -0.9% 496,842 -7.8%2001 275,940 -29.1% 95,899 -10.9% 371,839 -25.2%
Sept. 11, 2001 - Terrorist attacks on the United States (U.S.) led to the closing of all U.S. airports.
AIR-PS

HONOLULU INTERNATIONAL AIRPORT CARGO and MAIL (U.S. tons) INTERISLAND AND OVERSEAS
TOTALCARGO + MAIL
CARGO + MAIL % change CARGO + MAIL % change Interisland + % changeInterisland from the Overseas from the Overseas from the
previous previous previousCALENDAR (enplaned year's (enplaned year's (enplaned year's
YEAR and deplaned) total and deplaned) total and deplaned) total--------------- ---------------------------- ------------ ---------------------------- ------------ ---------------------- ---------------
1960 12,165 19,216 31,3811965 17,540 63,032 80,572
1970 28,516 58,926 87,4421971 29,753 4.3% 105,438 78.9% 135,191 54.6%1972 33,624 13.0% 92,589 -12.2% 126,213 -6.6%1973 39,257 16.8% 78,658 -15.0% 117,915 -6.6%1974 44,265 12.8% 91,893 16.8% 136,158 15.5%1975 45,537 2.9% 108,143 17.7% 153,680 12.9%1976 49,332 8.3% 131,742 21.8% 181,074 17.8%1977 55,047 11.6% 134,564 2.1% 189,611 4.7%1978 57,769 4.9% 139,357 3.6% 197,126 4.0%1979 62,483 8.2% 125,584 -9.9% 188,067 -4.6%
1980 69,923 11.9% 133,342 6.2% 203,265 8.1%1981 68,542 -2.0% 142,997 7.2% 211,539 4.1%1982 64,000 -6.6% 150,182 5.0% 214,182 1.2%1983 59,597 -6.9% 177,473 18.2% 237,070 10.7%1984 60,812 2.0% 192,921 8.7% 253,733 7.0%1985 56,308 -7.4% 182,041 -5.6% 238,349 -6.1%1986 63,155 12.2% 208,911 14.8% 272,066 14.1%1987 67,577 7.0% 233,702 11.9% 301,279 10.7%1988 72,370 7.1% 279,139 19.4% 351,509 16.7%1989 80,820 11.7% 319,348 14.4% 400,168 13.8%
1990 81,603 1.0% 331,283 3.7% 412,886 3.2%1991 81,040 -0.7% 339,849 2.6% 420,889 1.9%1992 87,202 7.6% 332,238 -2.2% 419,440 -0.3%1993 84,854 -2.7% 341,564 2.8% 426,418 1.7%1994 86,306 1.7% 386,737 13.2% 473,043 10.9%1995 86,215 -0.1% 373,194 -3.5% 459,409 -2.9%1996 90,425 4.9% 389,932 4.5% 480,357 4.6%1997 94,826 4.9% 456,749 17.1% 551,575 14.8%1998 87,043 -8.2% 401,900 -12.0% 488,943 -11.4%1999 89,956 3.3% 449,151 11.8% 539,107 10.3%
2000 96,357 7.1% 400,485 -10.8% 496,842 -7.8%2001 94,641 -1.8% 277,198 -30.8% 371,839 -25.2%
Sept. 11, 2001 - Terrorist attacks on the United States (U.S.) led the closing of all U.S. airports.
AIR-PS

HONOLULU INTERNATIONAL AIRPORT AIRCRAFT OPERATIONS BY TYPE
% change % change % change % change % changefrom the from the from the from the from theprevious previous previous previous previous
CALENDAR AIR year's AIR year's GENERAL year's year's year'sYEAR CARRIER total TAXI total AVIATION total MILITARY total TOTAL total
-------------- -------------- ----------- -------------- ----------- -------------- ----------- -------------- ----------- -------------- --------------
1960 85,597 --- 44,326 124,827 #VALUE!
1965 95,385 --- 93,689 99,214 #VALUE!
1970 122,202 --- 111,225 67,202 #VALUE!
1975 108,446 48,260 111,813 51,257 319,7761976 108,404 0.0% 60,614 25.6% 113,952 1.9% 37,595 -26.7% 320,565 0.2%1977 114,174 5.3% 68,234 12.6% 114,484 0.5% 33,034 -12.1% 329,926 2.9%1978 121,056 6.0% 85,552 25.4% 137,593 20.2% 34,905 5.7% 379,106 14.9%1979 133,653 10.4% 85,177 -0.4% 162,055 17.8% 31,854 -8.7% 412,739 8.9%
1980 121,528 -9.1% 76,273 -10.5% 145,215 -10.4% 32,392 1.7% 375,408 -9.0%1981 125,321 3.1% 73,057 -4.2% 110,416 -24.0% 30,565 -5.6% 339,359 -9.6%1982 128,558 2.6% 70,574 -3.4% 80,737 -26.9% 28,859 -5.6% 308,728 -9.0%1983 139,875 8.8% 75,297 6.7% 88,657 9.8% 29,209 1.2% 333,038 7.9%1984 154,121 10.2% 75,445 0.2% 82,961 -6.4% 31,291 7.1% 343,818 3.2%1985 167,154 8.5% 79,329 5.1% 81,103 -2.2% 29,925 -4.4% 357,511 4.0%1986 191,890 14.8% 69,918 -11.9% 78,985 -2.6% 27,256 -8.9% 368,049 2.9%1987 216,044 12.6% 62,172 -11.1% 83,558 5.8% 23,501 -13.8% 385,275 4.7%1988 185,282 -14.2% 60,628 -2.5% 91,971 10.1% 40,038 70.4% 377,919 -1.9%1989 194,347 4.9% 64,348 6.1% 100,287 9.0% 44,653 11.5% 403,635 6.8%
1990 194,357 0.0% 57,506 -10.6% 122,349 22.0% 32,836 -26.5% 407,048 0.8%1991 196,037 0.9% 65,390 13.7% 113,799 -7.0% 28,340 -13.7% 403,566 -0.9%1992 202,559 3.3% 58,782 -10.1% 113,623 -0.2% 28,664 1.1% 403,628 0.0%1993 185,959 -8.2% 53,742 -8.6% 96,504 -15.1% 22,300 -22.2% 358,505 -11.2%1994 193,615 4.1% 56,067 4.3% 87,986 -8.8% 21,901 -1.8% 359,569 0.3%1995 198,248 2.4% 71,703 27.9% 80,522 -8.5% 23,453 7.1% 373,926 4.0%1996 203,671 2.7% 62,516 -12.8% 82,541 2.5% 23,540 0.4% 372,268 -0.4%1997 185,557 -8.9% 61,894 -1.0% 87,584 6.1% 23,749 0.9% 358,784 -3.6%1998 182,795 -1.5% 39,179 -36.7% 90,135 2.9% 21,937 -7.6% 334,046 -6.9%1999 197,839 8.2% 36,985 -5.6% 91,743 1.8% 20,042 -8.6% 346,609 3.8%
2000 206,870 4.6% 31,539 -14.7% 91,484 -0.3% 15,878 -20.8% 345,771 -0.2%2001 186,000 -10.1% 37,676 19.5% 86,283 -5.7% 17,047 7.4% 327,006 -5.4%
Air taxi operations were combined with general aviation operationsuntil they were separated in July 1971.
Sept. 11, 2001 - Terrorist attacks on the United States (U.S.) led to the closing of all U.S. airports.
AIR-PS

HILO INTERNATIONAL AIRPORTPASSENGERSINTERISLAND
% change % change % changefrom the from the TOTAL from theprevious previous previous
CALENDAR year's year's (enplaned year'sYEAR ENPLANED total DEPLANED total and deplaned) total
--------------- ---------------------- ------------ ---------------------- ------------ ---------------------- ---------------
1960 120,034 145,226 265,2601965 178,723 218,308 397,031
1970 280,399 299,042 579,4411971 316,069 12.7% 341,677 14.3% 657,746 13.5%1972 421,844 33.5% 444,106 30.0% 865,950 31.7%1973 537,520 27.4% 549,332 23.7% 1,086,852 25.5%1974 543,301 1.1% 556,607 1.3% 1,099,908 1.2%1975 522,951 -3.7% 536,219 -3.7% 1,059,170 -3.7%1976 518,642 -0.8% 568,601 6.0% 1,087,243 2.7%1977 540,260 4.2% 585,382 3.0% 1,125,642 3.5%1978 538,691 -0.3% 663,235 13.3% 1,201,926 6.8%1979 543,020 0.8% 624,237 -5.9% 1,167,257 -2.9%
1980 464,042 -14.5% 512,022 -18.0% 976,064 -16.4%1981 441,836 -4.8% 488,989 -4.5% 930,825 -4.6%1982 477,813 8.1% 530,506 8.5% 1,008,319 8.3%1983 466,277 -2.4% 517,794 -2.4% 984,071 -2.4%1984 484,769 4.0% 539,142 4.1% 1,023,911 4.0%1985 514,068 6.0% 541,193 0.4% 1,055,261 3.1%1986 541,564 5.3% 565,647 4.5% 1,107,211 4.9%1987 590,793 9.1% 611,870 8.2% 1,202,663 8.6%1988 593,138 0.4% 613,412 0.3% 1,206,550 0.3%1989 651,931 9.9% 673,741 9.8% 1,325,672 9.9%
1990 721,104 10.6% 739,506 9.8% 1,460,610 10.2%1991 709,223 -1.6% 730,588 -1.2% 1,439,811 -1.4%1992 773,327 9.0% 800,320 9.5% 1,573,647 9.3%1993 785,043 1.5% 802,227 0.2% 1,587,270 0.9%1994 790,172 0.7% 813,449 1.4% 1,603,621 1.0%1995 803,417 1.7% 824,298 1.3% 1,627,715 1.5%1996 795,216 -1.0% 827,527 0.4% 1,622,743 -0.3%1997 819,946 3.1% 849,368 2.6% 1,669,314 2.9%1998 770,659 -6.0% 788,835 -7.1% 1,559,494 -6.6%1999 778,771 1.1% 808,154 2.4% 1,586,925 1.8%
2000 783,254 0.6% 805,473 -0.3% 1,588,727 0.1%2001 733,107 -6.4% 747,329 -7.2% 1,480,436 -6.8%
Sept. 11, 2001 - Terrorist attacks on the United States (U.S.) led to the closing of all U.S. airports.
AIR-PS
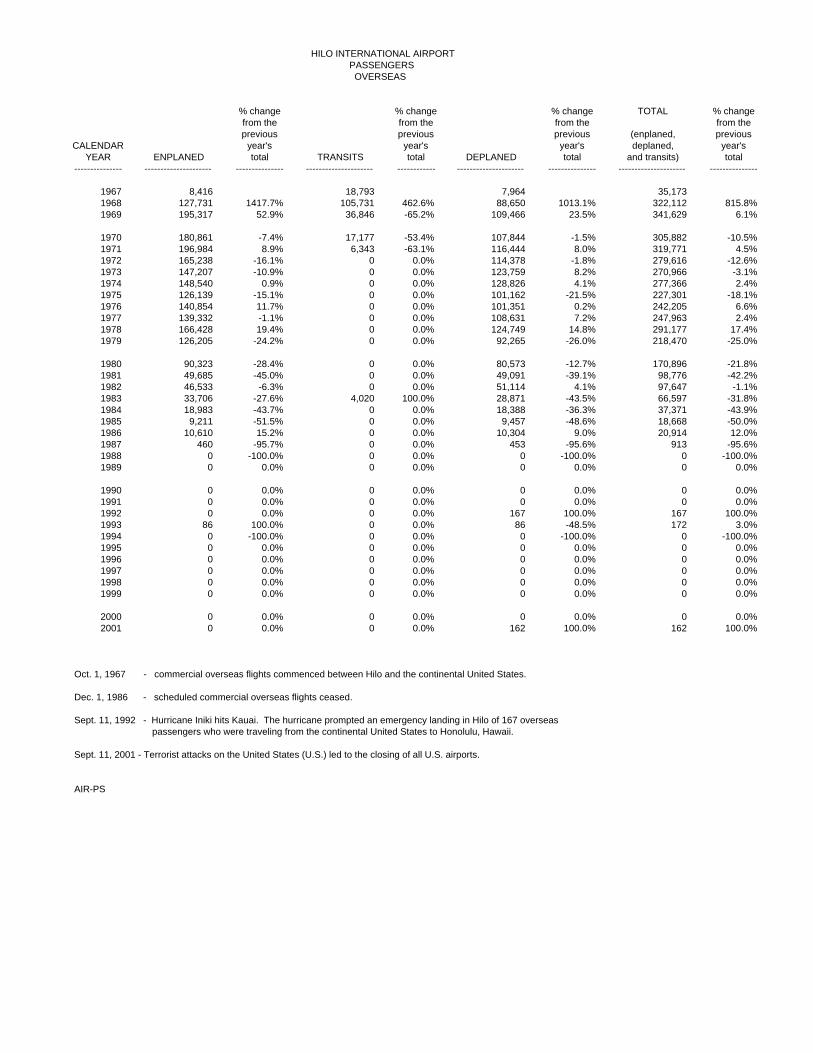
HILO INTERNATIONAL AIRPORT PASSENGERS OVERSEAS
% change % change % change TOTAL % changefrom the from the from the from theprevious previous previous (enplaned, previous
CALENDAR year's year's year's deplaned, year'sYEAR ENPLANED total TRANSITS total DEPLANED total and transits) total
--------------- --------------------- --------------- --------------------- ------------ --------------------- --------------- --------------------- ---------------
1967 8,416 18,793 7,964 35,1731968 127,731 1417.7% 105,731 462.6% 88,650 1013.1% 322,112 815.8%1969 195,317 52.9% 36,846 -65.2% 109,466 23.5% 341,629 6.1%
1970 180,861 -7.4% 17,177 -53.4% 107,844 -1.5% 305,882 -10.5%1971 196,984 8.9% 6,343 -63.1% 116,444 8.0% 319,771 4.5%1972 165,238 -16.1% 0 0.0% 114,378 -1.8% 279,616 -12.6%1973 147,207 -10.9% 0 0.0% 123,759 8.2% 270,966 -3.1%1974 148,540 0.9% 0 0.0% 128,826 4.1% 277,366 2.4%1975 126,139 -15.1% 0 0.0% 101,162 -21.5% 227,301 -18.1%1976 140,854 11.7% 0 0.0% 101,351 0.2% 242,205 6.6%1977 139,332 -1.1% 0 0.0% 108,631 7.2% 247,963 2.4%1978 166,428 19.4% 0 0.0% 124,749 14.8% 291,177 17.4%1979 126,205 -24.2% 0 0.0% 92,265 -26.0% 218,470 -25.0%
1980 90,323 -28.4% 0 0.0% 80,573 -12.7% 170,896 -21.8%1981 49,685 -45.0% 0 0.0% 49,091 -39.1% 98,776 -42.2%1982 46,533 -6.3% 0 0.0% 51,114 4.1% 97,647 -1.1%1983 33,706 -27.6% 4,020 100.0% 28,871 -43.5% 66,597 -31.8%1984 18,983 -43.7% 0 0.0% 18,388 -36.3% 37,371 -43.9%1985 9,211 -51.5% 0 0.0% 9,457 -48.6% 18,668 -50.0%1986 10,610 15.2% 0 0.0% 10,304 9.0% 20,914 12.0%1987 460 -95.7% 0 0.0% 453 -95.6% 913 -95.6%1988 0 -100.0% 0 0.0% 0 -100.0% 0 -100.0%1989 0 0.0% 0 0.0% 0 0.0% 0 0.0%
1990 0 0.0% 0 0.0% 0 0.0% 0 0.0%1991 0 0.0% 0 0.0% 0 0.0% 0 0.0%1992 0 0.0% 0 0.0% 167 100.0% 167 100.0%1993 86 100.0% 0 0.0% 86 -48.5% 172 3.0%1994 0 -100.0% 0 0.0% 0 -100.0% 0 -100.0%1995 0 0.0% 0 0.0% 0 0.0% 0 0.0%1996 0 0.0% 0 0.0% 0 0.0% 0 0.0%1997 0 0.0% 0 0.0% 0 0.0% 0 0.0%1998 0 0.0% 0 0.0% 0 0.0% 0 0.0%1999 0 0.0% 0 0.0% 0 0.0% 0 0.0%
2000 0 0.0% 0 0.0% 0 0.0% 0 0.0%2001 0 0.0% 0 0.0% 162 100.0% 162 100.0%
Oct. 1, 1967 - commercial overseas flights commenced between Hilo and the continental United States.
Dec. 1, 1986 - scheduled commercial overseas flights ceased.
Sept. 11, 1992 - Hurricane Iniki hits Kauai. The hurricane prompted an emergency landing in Hilo of 167 overseas passengers who were traveling from the continental United States to Honolulu, Hawaii.
Sept. 11, 2001 - Terrorist attacks on the United States (U.S.) led to the closing of all U.S. airports.
AIR-PS

HILO INTERNATIONAL AIRPORT PASSENGERS INTERISLAND AND OVERSEAS
TOTAL% change % change INTERISLAND % change
INTERISLAND from the OVERSEAS from the AND OVERSEAS from theprevious previous previous
CALENDAR (enplaned year's (enplaned, deplaned, year's (enplaned, deplaned, year'sYEAR and deplaned) total and transits) total and transits) total
--------------- --------------------- ------------ ---------------------------------- ------------ ---------------------------- ---------------
1960 265,260 0 265,2601965 397,031 0 397,031
1970 579,441 305,882 885,3231971 657,746 13.5% 319,771 4.5% 977,517 10.4%1972 865,950 31.7% 279,616 -12.6% 1,145,566 17.2%1973 1,086,852 25.5% 270,966 -3.1% 1,357,818 18.5%1974 1,099,908 1.2% 277,366 2.4% 1,377,274 1.4%1975 1,059,170 -3.7% 227,301 -18.1% 1,286,471 -6.6%1976 1,087,243 2.7% 242,205 6.6% 1,329,448 3.3%1977 1,125,642 3.5% 247,963 2.4% 1,373,605 3.3%1978 1,201,926 6.8% 291,177 17.4% 1,493,103 8.7%1979 1,167,257 -2.9% 218,470 -25.0% 1,385,727 -7.2%
1980 976,064 -16.4% 170,896 -21.8% 1,146,960 -17.2%1981 930,825 -4.6% 98,776 -42.2% 1,029,601 -10.2%1982 1,008,319 8.3% 97,647 -1.1% 1,105,966 7.4%1983 984,071 -2.4% 66,597 -31.8% 1,050,668 -5.0%1984 1,023,911 4.0% 37,371 -43.9% 1,061,282 1.0%1985 1,055,261 3.1% 18,668 -50.0% 1,073,929 1.2%1986 1,107,211 4.9% 20,914 12.0% 1,128,125 5.0%1987 1,202,663 8.6% 913 -95.6% 1,203,576 6.7%1988 1,206,550 0.3% 0 -100.0% 1,206,550 0.2%1989 1,325,672 9.9% 0 0.0% 1,325,672 9.9%
1990 1,460,610 10.2% 0 0.0% 1,460,610 10.2%1991 1,439,811 -1.4% 0 0.0% 1,439,811 -1.4%1992 1,573,647 9.3% 167 100.0% 1,573,814 9.3%1993 1,587,270 0.9% 172 3.0% 1,587,442 0.9%1994 1,603,621 1.0% 0 -100.0% 1,603,621 1.0%1995 1,627,715 1.5% 0 0.0% 1,627,715 1.5%1996 1,622,743 -0.3% 0 0.0% 1,622,743 -0.3%1997 1,669,314 2.9% 0 0.0% 1,669,314 2.9%1998 1,559,494 -6.6% 0 0.0% 1,559,494 -6.6%1999 1,586,925 1.8% 0 0.0% 1,586,925 1.8%
2000 1,588,727 0.1% 0 0.0% 1,588,727 0.1%2001 1480436 -6.8% 162 0.0% 1,480,598 -6.8%
Oct. 1, 1967 - commercial overseas flights commenced between Hilo and the continental United States.
Dec. 1, 1986 - scheduled commercial overseas flights ceased.
Sept. 11, 1992 - Hurricane Iniki hits Kauai. The hurricane prompted an emergency landing in Hilo of 167 overseas passengers who were traveling from the continental United States to Honolulu, Hawaii.
Sept. 11, 2001 - Terrorist attacks on the United States (U.S.) led to the closing of all U.S. airports.
AIR-PS

HILO INTERNATIONAL AIRPORT CARGO (U.S. tons)
INTERISLAND
% change % change % changefrom the from the TOTAL from theprevious previous previous
CALENDAR year's year's (enplaned year'sYEAR ENPLANED total DEPLANED total and deplaned) total
--------------- ------------------------ ------------ ------------------------ ------------ ---------------------------- ---------------
1960 1,857 2,538 4,3951965 4,226 2,885 7,111
1970 2,793 5,159 7,9521971 4,482 60.5% 5,129 -0.6% 9,611 20.9%1972 7,105 58.5% 5,679 10.7% 12,784 33.0%1973 9,097 28.0% 5,920 4.2% 15,017 17.5%1974 9,563 5.1% 6,049 2.2% 15,612 4.0%1975 10,469 9.5% 5,817 -3.8% 16,286 4.3%1976 11,004 5.1% 6,150 5.7% 17,154 5.3%1977 10,810 -1.8% 5,535 -10.0% 16,345 -4.7%1978 11,233 3.9% 8,553 54.5% 19,786 21.1%1979 11,998 6.8% 9,485 10.9% 21,483 8.6%
1980 15,575 29.8% 12,709 34.0% 28,284 31.7%1981 18,398 18.1% 10,375 -18.4% 28,773 1.7%1982 14,884 -19.1% 7,547 -27.3% 22,431 -22.0%1983 11,829 -20.5% 7,693 1.9% 19,522 -13.0%1984 9,799 -17.2% 8,640 12.3% 18,439 -5.5%1985 9,193 -6.2% 8,930 3.4% 18,123 -1.7%1986 11,966 30.2% 9,202 3.0% 21,168 16.8%1987 12,493 4.4% 8,682 -5.7% 21,175 0.0%1988 15,382 23.1% 9,721 12.0% 25,103 18.6%1989 16,354 6.3% 10,772 10.8% 27,126 8.1%
1990 14,247 -12.9% 10,887 1.1% 25,134 -7.3%1991 14,359 0.8% 10,505 -3.5% 24,864 -1.1%1992 14,228 -0.9% 10,580 0.7% 24,808 -0.2%1993 15,044 5.7% 10,322 -2.4% 25,366 2.2%1994 15,518 3.2% 9,501 -8.0% 25,019 -1.4%1995 15,121 -2.6% 9,206 -3.1% 24,327 -2.8%1996 15,363 1.6% 10,092 9.6% 25,455 4.6%1997 15,774 2.7% 11,966 18.6% 27,740 9.0%1998 11,285 -28.5% 9,357 -21.8% 20,642 -25.6%1999 10,906 -3.4% 8,980 -4.0% 19,886 -3.7%
2000 11,909 9.2% 9,896 10.2% 21,805 9.7%2001 12,187 2.3% 10,907 10.2% 23,094 5.9%
Sept. 11, 2001 - Terrorist attacks on the United States (U.S.) led to the closing of all U.S. airports.
AIR-PS

HILO INTERNATIONAL AIRPORT CARGO (U.S. tons)
OVERSEAS
% change % change % change from the from the TOTAL from theprevious previous previous
CALENDAR year's year's (enplaned year'sYEAR ENPLANED total DEPLANED total and deplaned) total
--------------- ---------------------------- ------------ ---------------------------- ------------ ---------------------- ---------------
1967 761 70 8311968 4,699 517.5% 704 905.7% 5,403 550.2%1969 3,970 -15.5% 968 37.5% 4,938 -8.6%
1970 6,129 54.4% 489 -49.5% 6,618 34.0%1971 6,118 -0.2% 1,590 225.2% 7,708 16.5%1972 7,077 15.7% 1,957 23.1% 9,034 17.2%1973 10,410 47.1% 2,051 4.8% 12,461 37.9%1974 11,511 10.6% 3,049 48.7% 14,560 16.8%1975 11,155 -3.1% 2,983 -2.2% 14,138 -2.9%1976 11,955 7.2% 3,255 9.1% 15,210 7.6%1977 13,314 11.4% 3,311 1.7% 16,625 9.3%1978 13,532 1.6% 2,995 -9.5% 16,527 -0.6%1979 10,538 -22.1% 2,693 -10.1% 13,231 -19.9%
1980 6,760 -35.9% 2,727 1.3% 9,487 -28.3%1981 2,889 -57.3% 1,600 -41.3% 4,489 -52.7%1982 2,193 -24.1% 1,024 -36.0% 3,217 -28.3%1983 2,350 7.2% 744 -27.3% 3,094 -3.8%1984 4,443 89.1% 1,539 106.9% 5,982 93.3%1985 518 -88.3% 145 -90.6% 663 -88.9%1986 517 -0.2% 137 -5.5% 654 -1.4%1987 0 -100.0% 0 -100.0% 0 -100.0%1988 0 0.0% 0 0.0% 0 0.0%1989 0 0.0% 0 0.0% 0 0.0%
1990 177 100.0% 83 100.0% 260 100.0%1991 218 23.2% 117 41.0% 335 28.8%1992 215 -1.4% 33 -71.8% 248 -26.0%1993 0 -100.0% 0 -100.0% 0 -100.0%1994 0 0.0% 0 0.0% 0 0.0%1995 50 100.0% 0 0.0% 50 100.0%1996 158 216.0% 19 100.0% 177 254.0%1997 0 -100.0% 0 -100.0% 0 -100.0%1998 0 0.0% 0 0.0% 0 0.0%1999 42 100.0% 0 0.0% 42 100.0%
2000 0 -100.0% 0 0.0% 0 -100.0%2001 0 0.0% 0 0.0% 0 0.0%
Oct. 1, 1967 - commercial overseas flights commenced between Hilo and the continental United States.
Dec. 1, 1986 - scheduled commercial overseas flights ceased.
Sept. 11, 1992 - Hurricane Iniki hits Kauai. The hurricane prompted an emergency landing in Hilo of 167 overseas passengers who were traveling from the continental United States to Honolulu, Hawaii.
Sept. 11, 2001 - Terrorist attacks on the United States (U.S.) led to the closing of all U.S. airports.
AIR-PS

HILO INTERNATIONAL AIRPORT CARGO (U.S. tons)
INTERISLAND AND OVERSEAS
TOTAL% change % change INTERISLAND % change
INTERISLAND from the OVERSEAS from the AND OVERSEAS from theprevious previous previous
CALENDAR (enplaned year's (enplaned year's (enplaned year'sYEAR and deplaned) total and deplaned) total and deplaned) total
--------------- --------------------------- ------------ --------------------------- ------------ --------------------- ---------------
1960 4,395 0 4,3951965 7,111 0 7,111
1967 --- 831 8311968 --- 0.0% 5,403 550.2% 5,403 550.2%1969 --- 0.0% 4,938 -8.6% 4,938 -8.6%
1970 7,952 100.0% 6,618 34.0% 14,570 195.1%1971 9,611 20.9% 7,708 16.5% 17,319 18.9%1972 12,784 33.0% 9,034 17.2% 21,818 26.0%1973 15,017 17.5% 12,461 37.9% 27,478 25.9%1974 15,612 4.0% 14,560 16.8% 30,172 9.8%1975 16,286 4.3% 14,138 -2.9% 30,424 0.8%1976 17,154 5.3% 15,210 7.6% 32,364 6.4%1977 16,345 -4.7% 16,625 9.3% 32,970 1.9%1978 19,786 21.1% 16,527 -0.6% 36,313 10.1%1979 21,483 8.6% 13,231 -19.9% 34,714 -4.4%
1980 28,284 31.7% 9,487 -28.3% 37,771 8.8%1981 28,773 1.7% 4,489 -52.7% 33,262 -11.9%1982 22,431 -22.0% 3,217 -28.3% 25,648 -22.9%1983 19,522 -13.0% 3,094 -3.8% 22,616 -11.8%1984 18,439 -5.5% 5,982 93.3% 24,421 8.0%1985 18,123 -1.7% 663 -88.9% 18,786 -23.1%1986 21,168 16.8% 654 -1.4% 21,822 16.2%1987 21,175 0.0% 0 -100.0% 21,175 -3.0%1988 25,103 18.6% 0 0.0% 25,103 18.6%1989 27,126 8.1% 0 0.0% 27,126 8.1%
1990 25,134 -7.3% 260 100.0% 25,394 -6.4%1991 24,864 -1.1% 335 28.8% 25,199 -0.8%1992 24,808 -0.2% 248 -26.0% 25,056 -0.6%1993 25,366 2.2% 0 -100.0% 25,366 1.2%1994 25,019 -1.4% 0 0.0% 25,019 -1.4%1995 24,327 -2.8% 50 100.0% 24,377 -2.6%1996 25,455 4.6% 177 254.0% 25,632 5.1%1997 27,740 9.0% 0 -100.0% 27,740 8.2%1998 20,642 -25.6% 0 0.0% 20,642 -25.6%1999 19,886 -3.7% 42 100.0% 19,928 -3.5%
2000 21,805 9.7% 0 -100.0% 21,805 9.4%2001 23,094 5.9% 0 0.0% 23,094 5.9%
Oct. 1, 1967 - commercial overseas flights commenced between Hilo and the continental United States.
Dec. 1, 1986 - scheduled commercial overseas flights ceased.
Sept. 11, 1992 - Hurricane Iniki hits Kauai. The hurricane prompted an emergency landing in Hilo of 167 overseas passengers who were traveling from the continental United States to Honolulu, Hawaii.
Sept. 11, 2001 - Terrorist attacks on the United States (U.S.) led to the closing of all U.S. airports.
AIR-PS
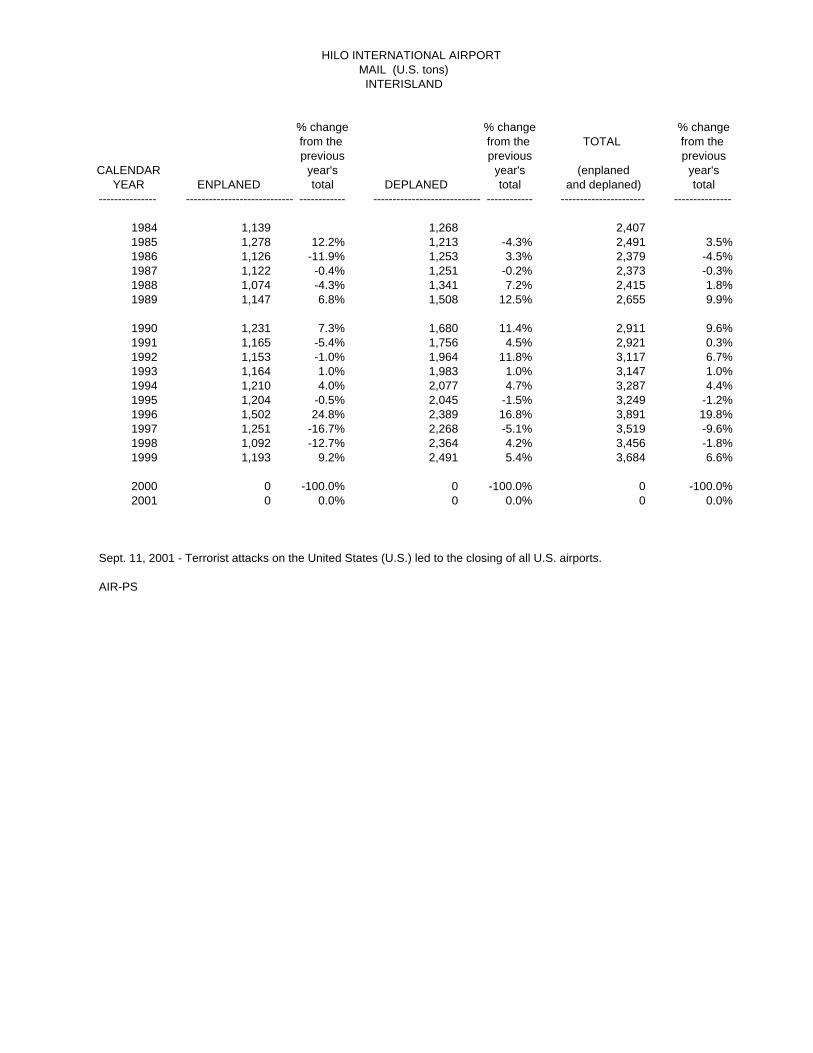
HILO INTERNATIONAL AIRPORT MAIL (U.S. tons)
INTERISLAND
% change % change % changefrom the from the TOTAL from the previous previous previous
CALENDAR year's year's (enplaned year'sYEAR ENPLANED total DEPLANED total and deplaned) total
--------------- ---------------------------- ------------ ---------------------------- ------------ ---------------------- ---------------
1984 1,139 1,268 2,4071985 1,278 12.2% 1,213 -4.3% 2,491 3.5%1986 1,126 -11.9% 1,253 3.3% 2,379 -4.5%1987 1,122 -0.4% 1,251 -0.2% 2,373 -0.3%1988 1,074 -4.3% 1,341 7.2% 2,415 1.8%1989 1,147 6.8% 1,508 12.5% 2,655 9.9%
1990 1,231 7.3% 1,680 11.4% 2,911 9.6%1991 1,165 -5.4% 1,756 4.5% 2,921 0.3%1992 1,153 -1.0% 1,964 11.8% 3,117 6.7%1993 1,164 1.0% 1,983 1.0% 3,147 1.0%1994 1,210 4.0% 2,077 4.7% 3,287 4.4%1995 1,204 -0.5% 2,045 -1.5% 3,249 -1.2%1996 1,502 24.8% 2,389 16.8% 3,891 19.8%1997 1,251 -16.7% 2,268 -5.1% 3,519 -9.6%1998 1,092 -12.7% 2,364 4.2% 3,456 -1.8%1999 1,193 9.2% 2,491 5.4% 3,684 6.6%
2000 0 -100.0% 0 -100.0% 0 -100.0%2001 0 0.0% 0 0.0% 0 0.0%
Sept. 11, 2001 - Terrorist attacks on the United States (U.S.) led to the closing of all U.S. airports.
AIR-PS

HILO INTERNATIONAL AIRPORT MAIL (U.S. tons)
OVERSEAS
% change % change % changefrom the from the TOTAL from theprevious previous previous
CALENDAR year's year's (enplaned year'sYEAR ENPLANED total DEPLANED total and deplaned) total
--------------- ---------------------------- ------------ ---------------------------- ------------ ---------------------- ---------------
1984 337 0 3371985 174 -48.4% 0 0.0% 174 -48.4%1986 103 -40.8% 0 0.0% 103 -40.8%1987 0 -100.0% 0 0.0% 0 -100.0%1988 0 0.0% 0 0.0% 0 0.0%1989 0 0.0% 0 0.0% 0 0.0%
1990 0 0.0% 0 0.0% 0 0.0%1991 0 0.0% 0 0.0% 0 0.0%1992 0 0.0% 2 100.0% 2 100.0%1993 0 0.0% 0 -100.0% 0 -100.0%1994 0 0.0% 0 0.0% 0 0.0%1995 15 100.0% 0 0.0% 15 100.0%1996 0 -100.0% 0 0.0% 0 -100.0%1997 0 0.0% 0 0.0% 0 0.0%1998 0 0.0% 0 0.0% 0 0.0%1999 0 0.0% 0 0.0% 0 0.0%
2000 0 0.0% 0 0.0% 0 0.0%2001 0 0.0% 0 0.0% 0 0.0%
Oct. 1, 1967 - commercial overseas flights commenced between Hilo and the continental United States.
Dec. 1, 1986 - scheduled commercial overseas flights ceased.
Sept. 11, 1992 - Hurricane Iniki hits Kauai. The hurricane prompted an emergency landing in Hilo of 167 overseas passengers who were traveling from the continental United States to Honolulu, Hawaii.
Sept. 11, 2001 - Terrorist attacks on the United States (U.S.) led to the closing of all U.S. airports.
AIR-PS

HILO INTERNATIONAL AIRPORT MAIL (U.S. tons) INTERISLAND AND OVERSEAS
TOTAL% change % change INTERISLAND % change
INTERISLAND from the OVERSEAS from the AND OVERSEAS from theprevious previous previous
CALENDAR (enplaned year's (enplaned year's (enplaned year'sYEAR and deplaned) total and deplaned) total and deplaned) total
--------------- ---------------------------- ------------ ---------------------------- ------------------ ---------------------- ---------------
1960 271 0 2711965 859 0 859
1970 2,312 110 2,4221971 2,319 0.3% 114 3.6% 2,433 0.5%1972 2,347 1.2% 122 7.0% 2,469 1.5%1973 2,703 15.2% 107 -12.3% 2,810 13.8%1974 2,630 -2.7% 127 18.7% 2,757 -1.9%1975 2,823 7.3% 105 -17.3% 2,928 6.2%1976 3,149 11.5% 141 34.3% 3,290 12.4%1977 2,462 -21.8% 157 11.3% 2,619 -20.4%1978 2,166 -12.0% 159 1.3% 2,325 -11.2%1979 2,297 6.0% 175 10.1% 2,472 6.3%
1980 2,053 -10.6% 143 -18.3% 2,196 -11.2%1981 2,190 6.7% 59 -58.7% 2,249 2.4%1982 2,406 9.9% 77 30.5% 2,483 10.4%1983 2,430 1.0% 221 187.0% 2,651 6.8%1984 2,407 -0.9% 337 52.5% 2,744 3.5%1985 2,491 3.5% 174 -48.4% 2,665 -2.9%1986 2,379 -4.5% 103 -40.8% 2,482 -6.9%1987 2,373 -0.3% 0 -100.0% 2,373 -4.4%1988 2,415 1.8% 0 0.0% 2,415 1.8%1989 2,655 9.9% 0 0.0% 2,655 9.9%
1990 2,911 9.6% 0 0.0% 2,911 9.6%1991 2,921 0.3% 0 0.0% 2,921 0.3%1992 3,117 6.7% 2 100.0% 3,119 6.8%1993 3,147 1.0% 0 -100.0% 3,147 0.9%1994 3,287 4.4% 0 0.0% 3,287 4.4%1995 3,249 -1.2% 15 100.0% 3,264 -0.7%1996 3,891 19.8% 0 -100.0% 3,891 19.2%1997 3,519 -9.6% 0 0.0% 3,519 -9.6%1998 3,456 -1.8% 0 0.0% 3,456 -1.8%1999 3,684 6.6% 0 0.0% 3,684 6.6%
2000 3,716 0.9% 0 0.0% 3,716 0.9%2001 3,541 -4.7% 0 0.0% 3,541 -4.7%
Oct. 1, 1967 - commercial overseas flights commenced between Hilo and the continental United States.
Dec. 1, 1986 - scheduled commercial overseas flights ceased.
Sept. 11, 1992 - Hurricane Iniki hits Kauai. The hurricane prompted an emergency landing in Hilo of 167 overseas passengers who were traveling from the continental United States to Honolulu, Hawaii.
Sept. 11, 2001 - Terrorist attacks on the United States (U.S.) led to the closing of all U.S. airports.
AIR-PS

HILO INTERNATIONAL AIRPORT CARGO and MAIL (U.S. tons) INTERISLAND AND OVERSEAS
TOTALCARGO MAIL CARGO + MAIL
Interisland + % change Interisland + % change Interisland + % changeOverseas from the Overseas from the Overseas from the
previous previous previousCALENDAR (enplaned year's (enplaned year's (enplaned year's
YEAR and deplaned) total and deplaned) total and deplaned) total--------------- --------------------------- ------------ --------------------------- ------------ --------------------- ---------------
1960 4,395 271 4,6661965 7,111 859 7,970
1967 831 0 8311968 5,403 550.2% 0 0.0% 5,403 550.2%1969 4,938 -8.6% 0 0.0% 4,938 -8.6%
1970 14,570 195.1% 2,422 100.0% 16,992 244.1%1971 17,319 18.9% 2,433 0.5% 19,752 16.2%1972 21,818 26.0% 2,469 1.5% 24,287 23.0%1973 27,478 25.9% 2,810 13.8% 30,288 24.7%1974 30,172 9.8% 2,757 -1.9% 32,929 8.7%1975 30,424 0.8% 2,928 6.2% 33,352 1.3%1976 32,364 6.4% 3,290 12.4% 35,654 6.9%1977 32,970 1.9% 2,619 -20.4% 35,589 -0.2%1978 36,313 10.1% 2,325 -11.2% 38,638 8.6%1979 34,714 -4.4% 2,472 6.3% 37,186 -3.8%
1980 37,771 8.8% 2,196 -11.2% 39,967 7.5%1981 33,262 -11.9% 2,249 2.4% 35,511 -11.1%1982 25,648 -22.9% 2,483 10.4% 28,131 -20.8%1983 22,616 -11.8% 2,651 6.8% 25,267 -10.2%1984 24,421 8.0% 2,744 3.5% 27,165 7.5%1985 18,786 -23.1% 2,665 -2.9% 21,451 -21.0%1986 21,822 16.2% 2,482 -6.9% 24,304 13.3%1987 21,175 -3.0% 2,373 -4.4% 23,548 -3.1%1988 25,103 18.6% 2,415 1.8% 27,518 16.9%1989 27,126 8.1% 2,655 9.9% 29,781 8.2%
1990 25,394 -6.4% 2,911 9.6% 28,305 -5.0%1991 25,199 -0.8% 2,921 0.3% 28,120 -0.7%1992 25,056 -0.6% 3,119 6.8% 28,175 0.2%1993 25,366 1.2% 3,147 0.9% 28,513 1.2%1994 25,019 -1.4% 3,287 4.4% 28,306 -0.7%1995 24,377 -2.6% 3,264 -0.7% 27,641 -2.3%1996 25,632 5.1% 3,891 19.2% 29,523 6.8%1997 27,740 8.2% 3,519 -9.6% 31,259 5.9%1998 20,642 -25.6% 3,456 -1.8% 24,098 -22.9%1999 19,928 -3.5% 3,684 6.6% 23,612 -2.0%
2000 21,805 9.4% 3,716 0.9% 25,521 8.1%2001 23,094 5.9% 3,541 -4.7% 26,635 4.4%
Oct. 1, 1967 - commercial overseas flights commenced between Hilo and the continental United States.
Dec. 1, 1986 - scheduled commercial overseas flights ceased.
Sept. 11, 1992 - Hurricane Iniki hits Kauai. The hurricane prompted an emergency landing in Hilo of 167 overseas passengers who were traveling from the continental United States to Honolulu, Hawaii.
Sept. 11, 2001 - Terrorist attacks on the United States (U.S.) led to the closing of all U.S. airports.
AIR-PS

HILO INTERNATIONAL AIRPORT CARGO and MAIL (U.S. tons) INTERISLAND AND OVERSEAS
TOTALCARGO + MAIL
CARGO + MAIL % change CARGO + MAIL % change Interisland + % changeInterisland from the Overseas from the Overseas from the
previous previous previousCALENDAR (enplaned year's (enplaned year's (enplaned year's
YEAR and deplaned) total and deplaned) total and deplaned) total--------------- --------------------------- ------------ --------------------------- ------------ --------------------- ---------------
1960 4,666 0 4,6661965 7,970 0 7,970
1967 --- 831 8311968 --- 0.0% 5,403 550.2% 5,403 550.2%1969 --- 0.0% 4,938 -8.6% 4,938 -8.6%
1970 10,264 100.0% 6,728 36.2% 16,992 244.1%1971 11,930 16.2% 7,822 16.3% 19,752 16.2%1972 15,131 26.8% 9,156 17.1% 24,287 23.0%1973 17,720 17.1% 12,568 37.3% 30,288 24.7%1974 18,242 2.9% 14,687 16.9% 32,929 8.7%1975 19,109 4.8% 14,243 -3.0% 33,352 1.3%1976 20,303 6.2% 15,351 7.8% 35,654 6.9%1977 18,807 -7.4% 16,782 9.3% 35,589 -0.2%1978 21,952 16.7% 16,686 -0.6% 38,638 8.6%1979 23,780 8.3% 13,406 -19.7% 37,186 -3.8%
1980 30,337 27.6% 9,630 -28.2% 39,967 7.5%1981 30,963 2.1% 4,548 -52.8% 35,511 -11.1%1982 24,837 -19.8% 3,294 -27.6% 28,131 -20.8%1983 21,952 -11.6% 3,315 0.6% 25,267 -10.2%1984 20,846 -5.0% 6,319 90.6% 27,165 7.5%1985 20,614 -1.1% 837 -86.8% 21,451 -21.0%1986 23,547 14.2% 757 -9.6% 24,304 13.3%1987 23,548 0.0% 0 -100.0% 23,548 -3.1%1988 27,518 16.9% 0 0.0% 27,518 16.9%1989 29,781 8.2% 0 0.0% 29,781 8.2%
1990 28,045 -5.8% 260 100.0% 28,305 -5.0%1991 27,785 -0.9% 335 28.8% 28,120 -0.7%1992 27,925 0.5% 250 -25.4% 28,175 0.2%1993 28,513 2.1% 0 -100.0% 28,513 1.2%1994 28,306 -0.7% 0 0.0% 28,306 -0.7%1995 27,576 -2.6% 65 100.0% 27,641 -2.3%1996 29,346 6.4% 177 172.3% 29,523 6.8%1997 31,259 6.5% 0 -100.0% 31,259 5.9%1998 24,098 -22.9% 0 0.0% 24,098 -22.9%1999 23,570 -2.2% 42 100.0% 23,612 -2.0%
2000 25,521 8.3% 0 -100.0% 25,521 8.1%2001 26,635 4.4% 0 0.0% 26,635 4.4%
Oct. 1, 1967 - commercial overseas flights commenced between Hilo and the continental United States.
Dec. 1, 1986 - scheduled commercial overseas flights ceased.
Sept. 11, 1992 - Hurricane Iniki hits Kauai. The hurricane prompted an emergency landing in Hilo of 167 overseas passengers who were traveling from the continental United States to Honolulu, Hawaii.
Sept. 11, 2001 - Terrorist attacks on the United States (U.S.) led to the closing of all U.S. airports.
AIR-PS

HILO INTERNATIONAL AIRPORTAIRCRAFT OPERATIONS BY TYPE
% change % change % change % change % changefrom the from the from the from the from theprevious previous previous previous previous
CALENDAR AIR year's AIR year's GENERAL year's year's year'sYEAR CARRIER total TAXI total AVIATION total MILITARY total TOTAL total
-------------- -------------- ----------- -------------- ----------- -------------- ----------- -------------------- ----------- -------------- --------------
1967 18,232 0 17,381 11,340 46,9531968 24,195 32.7% 0 0.0% 15,614 -10.2% 7,149 -37.0% 46,958 0.0%1969 23,347 -3.5% 0 0.0% 14,841 -5.0% 8,151 14.0% 46,339 -1.3%
1970 22,843 -2.2% 0 0.0% 21,717 46.3% 7,623 -6.5% 52,183 12.6%1971 20,168 -11.7% 1,560 100.0% 26,468 21.9% 7,971 4.6% 56,167 7.6%1972 22,066 9.4% 3,136 101.0% 15,972 -39.7% 9,159 14.9% 50,333 -10.4%1973 23,367 5.9% 3,085 -1.6% 10,501 -34.3% 11,185 22.1% 48,138 -4.4%1974 21,707 -7.1% 2,383 -22.8% 12,010 14.4% 11,615 3.8% 47,715 -0.9%1975 20,056 -7.6% 2,756 15.7% 14,622 21.7% 13,711 18.0% 51,145 7.2%1976 19,916 -0.7% 2,842 3.1% 19,325 32.2% 10,899 -20.5% 52,982 3.6%1977 20,216 1.5% 3,581 26.0% 26,017 34.6% 10,563 -3.1% 60,377 14.0%1978 20,448 1.1% 6,582 83.8% 16,884 -35.1% 8,763 -17.0% 52,677 -12.8%1979 17,893 -12.5% 7,021 6.7% 18,408 9.0% 8,381 -4.4% 51,703 -1.8%
1980 14,165 -20.8% 8,389 19.5% 16,598 -9.8% 10,817 29.1% 49,969 -3.4%1981 12,501 -11.7% 8,169 -2.6% 22,004 32.6% 10,600 -2.0% 53,274 6.6%1982 13,550 8.4% 4,682 -42.7% 17,793 -19.1% 11,939 12.6% 47,964 -10.0%1983 13,466 -0.6% 6,853 46.4% 21,260 19.5% 12,891 8.0% 54,470 13.6%1984 14,165 5.2% 7,455 8.8% 18,335 -13.8% 22,588 75.2% 62,543 14.8%1985 15,336 8.3% 6,423 -13.8% 20,555 12.1% 18,911 -16.3% 61,225 -2.1%1986 17,965 17.1% 5,587 -13.0% 18,776 -8.7% 19,186 1.5% 61,514 0.5%1987 20,920 16.4% 9,888 77.0% 29,354 56.3% 19,961 4.0% 80,123 30.3%1988 16,882 -19.3% 17,905 81.1% 36,709 25.1% 13,771 -31.0% 85,267 6.4%1989 17,262 2.3% 26,564 48.4% 32,456 -11.6% 16,920 22.9% 93,202 9.3%
1990 19,709 14.2% 42,249 59.0% 23,550 -27.4% 13,247 -21.7% 98,755 6.0%1991 19,596 -0.6% 38,504 -8.9% 20,802 -11.7% 9,304 -29.8% 88,206 -10.7%1992 21,426 9.3% 37,182 -3.4% 21,593 3.8% 10,854 16.7% 91,055 3.2%1993 20,779 -3.0% 34,886 -6.2% 23,999 11.1% 12,633 16.4% 92,297 1.4%1994 21,194 2.0% 36,564 4.8% 20,519 -14.5% 8,015 -36.6% 86,292 -6.5%1995 21,402 1.0% 33,084 -9.5% 22,384 9.1% 8,047 0.4% 84,917 -1.6%1996 21,109 -1.4% 36,228 9.5% 22,845 2.1% 7,680 -4.6% 87,862 3.5%1997 21,616 2.4% 47,229 30.4% 25,020 9.5% 7,656 -0.3% 101,521 15.5%1998 21,537 -0.4% 54,894 16.2% 28,087 12.3% 7,961 4.0% 112,479 10.8%1999 22,189 3.0% 51,875 -5.5% 33,248 18.4% 8,508 6.9% 115,820 3.0%
2000 22,266 0.3% 48,680 -6.2% 32,908 -1.0% 11,692 37.4% 115,546 -0.2%2001 19,450 -12.6% 42,426 -12.8% 25,077 -23.8% 9,285 -20.6% 96,238 -16.7%
Air taxi operations were combined with general aviation operations until they were separated in 1971.
Sept. 11, 2001 - Terrorist attacks on the United States (U.S.) led to the closing of all U.S. airports.
AIR-PS

KONA INTERNATIONAL AIRPORT at KEAHOLEKONA INTERNATIONAL AIRPORT at KEAHOLE PASSENGERS INTERISLAND INTERISLAND
% change % change % changefrom the from the TOTAL from theprevious previous previous
CALENDAR year's year's (enplaned year'sYEAR ENPLANED total DEPLANED total and deplaned) total
--------------- ---------------------------- ------------ ---------------------------- ------------ ---------------------- ---------------
1960 71,168 44,706 115,8741965 138,376 99,218 237,594
* 1970 96,482 121,147 217,629Jan. thru June 1970. Kona Airport closed July 1, 1970.
** 1970 144,478 146,574 291,052July thru December 1970.
1970 240,960 267,721 508,6811971 226,566 -6.0% 288,812 7.9% 515,378 1.3%1972 307,058 35.5% 328,856 13.9% 635,914 23.4%1973 357,743 16.5% 370,457 12.7% 728,200 14.5%1974 404,335 13.0% 404,635 9.2% 808,970 11.1%1975 431,772 6.8% 434,189 7.3% 865,961 7.0%1976 504,793 16.9% 489,763 12.8% 994,556 14.8%1977 560,267 11.0% 545,990 11.5% 1,106,257 11.2%1978 651,556 16.3% 601,823 10.2% 1,253,379 13.3%1979 660,309 1.3% 618,403 2.8% 1,278,712 2.0%
1980 580,910 -12.0% 537,503 -13.1% 1,118,413 -12.5%1981 552,494 -4.9% 505,387 -6.0% 1,057,881 -5.4%1982 601,014 8.8% 549,604 8.7% 1,150,618 8.8%1983 628,839 4.6% 569,972 3.7% 1,198,811 4.2%1984 687,288 9.3% 610,542 7.1% 1,297,830 8.3%1985 693,454 0.9% 662,426 8.5% 1,355,880 4.5%1986 779,328 12.4% 752,918 13.7% 1,532,246 13.0%1987 815,184 4.6% 791,094 5.1% 1,606,278 4.8%1988 845,864 3.8% 817,935 3.4% 1,663,799 3.6%1989 955,391 12.9% 928,451 13.5% 1,883,842 13.2%
1990 987,598 3.4% 961,886 3.6% 1,949,484 3.5%1991 941,346 -4.7% 914,795 -4.9% 1,856,141 -4.8%1992 957,567 1.7% 925,374 1.2% 1,882,941 1.4%1993 952,901 -0.5% 929,385 0.4% 1,882,286 0.0%1994 981,913 3.0% 959,190 3.2% 1,941,103 3.1%1995 1,051,409 7.1% 1,029,959 7.4% 2,081,368 7.2%1996 1,154,761 9.8% 1,093,750 6.2% 2,248,511 8.0%1997 1,175,607 1.8% 1,081,611 -1.1% 2,257,218 0.4%1998 1,184,128 0.7% 1,057,637 -2.2% 2,241,765 -0.7%1999 1,166,265 -1.5% 1,049,688 -0.8% 2,215,953 -1.2%
2000 1,194,754 2.4% 1,076,462 2.6% 2,271,216 2.5%2001 1,054,349 -11.8% 954,789 -11.3% 2,009,138 -11.5%
April 26, 1993 - Keahole Airport was renamed the Keahole-Kona International Airport.June 16, 1997 - Keahole-Kona International Airport was renamed the Kona International Airport at Keahole.Sept. 11, 2001 - Terrorist attacks on the United States (U.S.) led to the closing of all U.S. airports.
AIR-PS

KONA INTERNATIONAL AIRPORT at KEAHOLE PASSENGERSPASSENGERS OVERSEAS OVERSEAS
% change % change % changefrom the from the TOTAL from theprevious previous previous
CALENDAR year's year's (enplaned year'sYEAR ENPLANED total DEPLANED total and deplaned) total
--------------- --------------------------- --------------- --------------------------- --------------- --------------------- ---------------
* 1983 11,191 17,797 28,988 (September thru December)
1984 53,700 379.8% 75,902 326.5% 129,602 347.1%1985 59,740 11.2% 70,193 -7.5% 129,933 0.3%1986 73,410 22.9% 85,686 22.1% 159,096 22.4%1987 98,649 34.4% 98,663 15.1% 197,312 24.0%1988 74,772 -24.2% 84,978 -13.9% 159,750 -19.0%1989 101,238 35.4% 112,851 32.8% 214,089 34.0%
1990 109,947 8.6% 119,265 5.7% 229,212 7.1%1991 128,630 17.0% 134,006 12.4% 262,636 14.6%1992 137,803 7.1% 141,192 5.4% 278,995 6.2%1993 145,980 5.9% 150,796 6.8% 296,776 6.4%1994 146,820 0.6% 150,660 -0.1% 297,480 0.2%1995 113,115 -23.0% 108,972 -27.7% 222,087 -25.3%1996 121,704 7.6% 154,187 41.5% 275,891 24.2%1997 157,671 29.6% 213,268 38.3% 370,939 34.5%1998 159,291 1.0% 251,899 18.1% 411,190 10.9%1999 198,599 24.7% 253,630 0.7% 452,229 10.0%
2000 254,670 28.2% 316,211 24.7% 570,881 26.2%2001 275,062 8.0% 356,118 12.6% 631,180 10.6%
April 26, 1993 - Keahole Airport was renamed the Keahole-Kona International Airport.June 2, 1996 - Japan Airlines's first Tokyo-Kona landing at Keahole-Kona International Airport.June 16, 1997 - Keahole-Kona International Airport was renamed the Kona International Airport at Keahole.Sept. 11, 2001 - Terrorist attacks on the United States (U.S.) led to the closing of all U.S. airports.
AIR-PS
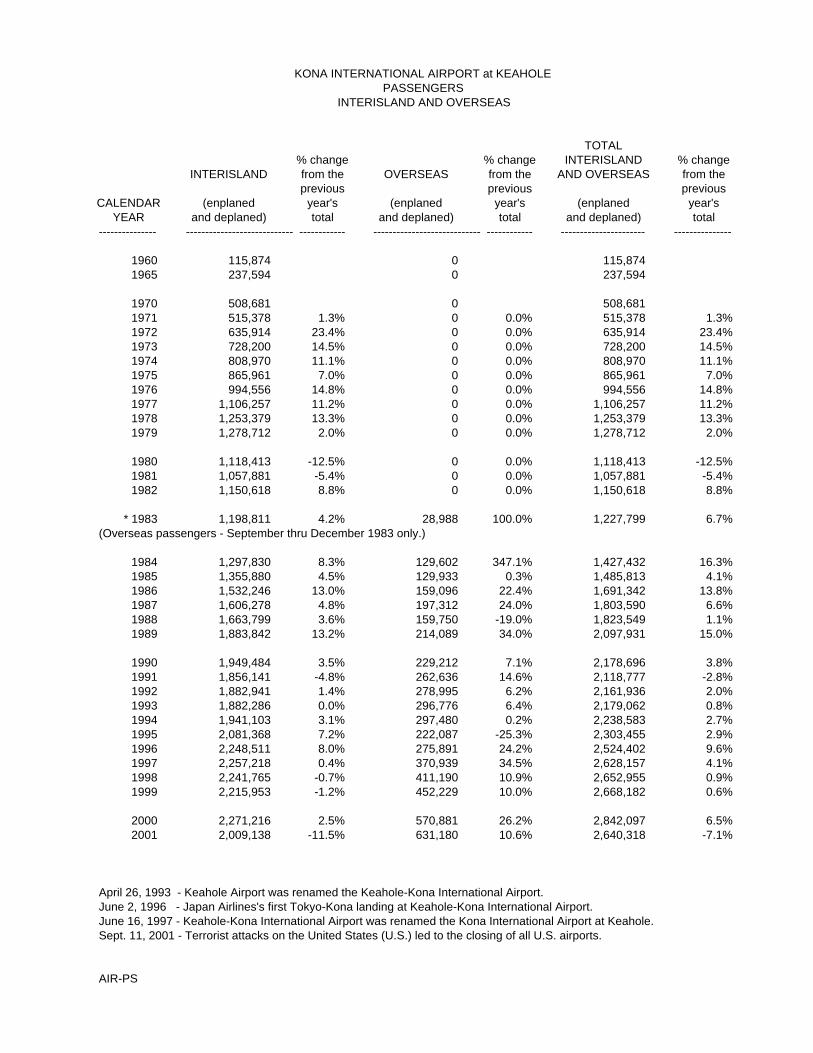
KONA INTERNATIONAL AIRPORT at KEAHOLE PASSENGERS
INTERISLAND AND OVERSEAS
TOTAL% change % change INTERISLAND % change
INTERISLAND from the OVERSEAS from the AND OVERSEAS from theprevious previous previous
CALENDAR (enplaned year's (enplaned year's (enplaned year'sYEAR and deplaned) total and deplaned) total and deplaned) total
--------------- ---------------------------- ------------ ---------------------------- ------------ ---------------------- ---------------
1960 115,874 0 115,8741965 237,594 0 237,594
1970 508,681 0 508,6811971 515,378 1.3% 0 0.0% 515,378 1.3%1972 635,914 23.4% 0 0.0% 635,914 23.4%1973 728,200 14.5% 0 0.0% 728,200 14.5%1974 808,970 11.1% 0 0.0% 808,970 11.1%1975 865,961 7.0% 0 0.0% 865,961 7.0%1976 994,556 14.8% 0 0.0% 994,556 14.8%1977 1,106,257 11.2% 0 0.0% 1,106,257 11.2%1978 1,253,379 13.3% 0 0.0% 1,253,379 13.3%1979 1,278,712 2.0% 0 0.0% 1,278,712 2.0%
1980 1,118,413 -12.5% 0 0.0% 1,118,413 -12.5%1981 1,057,881 -5.4% 0 0.0% 1,057,881 -5.4%1982 1,150,618 8.8% 0 0.0% 1,150,618 8.8%
* 1983 1,198,811 4.2% 28,988 100.0% 1,227,799 6.7%(Overseas passengers - September thru December 1983 only.)
1984 1,297,830 8.3% 129,602 347.1% 1,427,432 16.3%1985 1,355,880 4.5% 129,933 0.3% 1,485,813 4.1%1986 1,532,246 13.0% 159,096 22.4% 1,691,342 13.8%1987 1,606,278 4.8% 197,312 24.0% 1,803,590 6.6%1988 1,663,799 3.6% 159,750 -19.0% 1,823,549 1.1%1989 1,883,842 13.2% 214,089 34.0% 2,097,931 15.0%
1990 1,949,484 3.5% 229,212 7.1% 2,178,696 3.8%1991 1,856,141 -4.8% 262,636 14.6% 2,118,777 -2.8%1992 1,882,941 1.4% 278,995 6.2% 2,161,936 2.0%1993 1,882,286 0.0% 296,776 6.4% 2,179,062 0.8%1994 1,941,103 3.1% 297,480 0.2% 2,238,583 2.7%1995 2,081,368 7.2% 222,087 -25.3% 2,303,455 2.9%1996 2,248,511 8.0% 275,891 24.2% 2,524,402 9.6%1997 2,257,218 0.4% 370,939 34.5% 2,628,157 4.1%1998 2,241,765 -0.7% 411,190 10.9% 2,652,955 0.9%1999 2,215,953 -1.2% 452,229 10.0% 2,668,182 0.6%
2000 2,271,216 2.5% 570,881 26.2% 2,842,097 6.5%2001 2,009,138 -11.5% 631,180 10.6% 2,640,318 -7.1%
April 26, 1993 - Keahole Airport was renamed the Keahole-Kona International Airport.June 2, 1996 - Japan Airlines's first Tokyo-Kona landing at Keahole-Kona International Airport.June 16, 1997 - Keahole-Kona International Airport was renamed the Kona International Airport at Keahole.Sept. 11, 2001 - Terrorist attacks on the United States (U.S.) led to the closing of all U.S. airports.
AIR-PS

KONA INTERNATIONAL AIRPORT at KEAHOLE CARGO (U.S. tons) INTERISLAND
% change % change % changefrom the from the TOTAL from theprevious previous previous
CALENDAR year's year's (enplaned year'sYEAR ENPLANED total DEPLANED total and deplaned) total
--------------- ---------------------------- ------------ ---------------------------- ------------ ---------------------- ---------------
1960 433 231 6641965 374 704 1,078
1970 686 1,881 2,567Kona Airport closed 7/1/70. Keahole Airport opened 7/1/70.
1971 724 5.5% 1,621 -13.8% 2,345 -8.6%1972 949 31.1% 1,806 11.4% 2,755 17.5%1973 939 -1.1% 2,310 27.9% 3,249 17.9%1974 1,149 22.4% 2,565 11.0% 3,714 14.3%1975 1,295 12.7% 2,447 -4.6% 3,742 0.8%1976 1,881 45.3% 2,783 13.7% 4,664 24.6%1977 2,086 10.9% 2,905 4.4% 4,991 7.0%1978 2,042 -2.1% 3,113 7.2% 5,155 3.3%1979 2,282 11.8% 4,348 39.7% 6,630 28.6%
1980 2,860 25.3% 4,966 14.2% 7,826 18.0%1981 3,516 22.9% 4,682 -5.7% 8,198 4.8%1982 3,270 -7.0% 4,056 -13.4% 7,326 -10.6%1983 3,203 -2.0% 3,964 -2.3% 7,167 -2.2%1984 2,825 -11.8% 3,777 -4.7% 6,602 -7.9%1985 2,868 1.5% 3,405 -9.8% 6,273 -5.0%1986 2,859 -0.3% 5,104 49.9% 7,963 26.9%1987 3,162 10.6% 5,184 1.6% 8,346 4.8%1988 2,801 -11.4% 6,337 22.2% 9,138 9.5%1989 2,676 -4.5% 7,942 25.3% 10,618 16.2%
1990 3,159 18.0% 8,683 9.3% 11,842 11.5%1991 3,209 1.6% 8,478 -2.4% 11,687 -1.3%1992 3,657 14.0% 8,234 -2.9% 11,891 1.7%1993 4,062 11.1% 7,934 -3.6% 11,996 0.9%1994 4,329 6.6% 8,474 6.8% 12,803 6.7%1995 5,207 20.3% 9,085 7.2% 14,292 11.6%1996 7,358 41.3% 10,505 15.6% 17,863 25.0%1997 7,284 -1.0% 11,966 13.9% 19,250 7.8%1998 5,323 -26.9% 9,427 -21.2% 14,750 -23.4%1999 5,513 3.6% 8,172 -13.3% 13,685 -7.2%
2000 888 -83.9% 4,911 -39.9% 5,799 -57.6%2001 4,223 375.6% 9,754 98.6% 13,977 141.0%
April 26, 1993 - Keahole Airport was renamed the Keahole-Kona International Airport.June 2, 1996 - Japan Airlines's first Tokyo-Kona landing at Keahole-Kona International Airport.June 16, 1997 - Keahole-Kona International Airport was renamed the Kona International Airport at Keahole.Sept. 11, 2001 - Terrorist attacks on the United States (U.S.) led to the closing of all U.S. airports.
AIR-PS
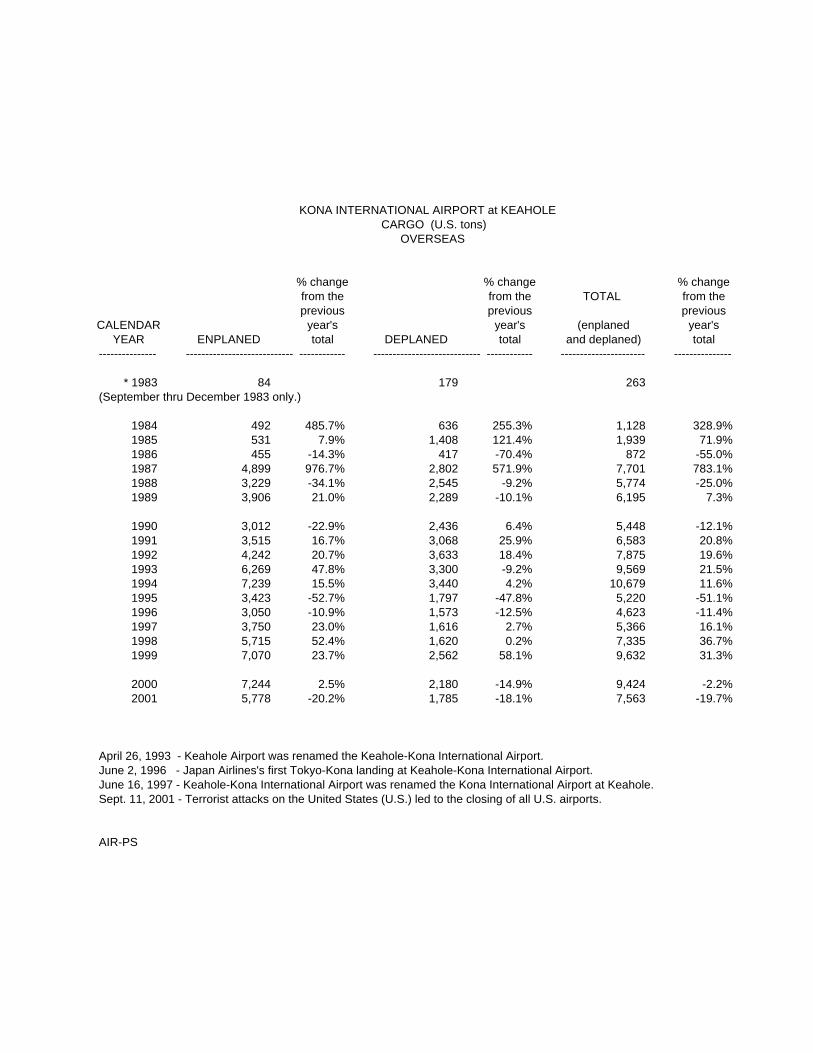
KONA INTERNATIONAL AIRPORT at KEAHOLE CARGO (U.S. tons) OVERSEAS
% change % change % changefrom the from the TOTAL from theprevious previous previous
CALENDAR year's year's (enplaned year'sYEAR ENPLANED total DEPLANED total and deplaned) total
--------------- ---------------------------- ------------ ---------------------------- ------------ ---------------------- ---------------
* 1983 84 179 263(September thru December 1983 only.)
1984 492 485.7% 636 255.3% 1,128 328.9%1985 531 7.9% 1,408 121.4% 1,939 71.9%1986 455 -14.3% 417 -70.4% 872 -55.0%1987 4,899 976.7% 2,802 571.9% 7,701 783.1%1988 3,229 -34.1% 2,545 -9.2% 5,774 -25.0%1989 3,906 21.0% 2,289 -10.1% 6,195 7.3%
1990 3,012 -22.9% 2,436 6.4% 5,448 -12.1%1991 3,515 16.7% 3,068 25.9% 6,583 20.8%1992 4,242 20.7% 3,633 18.4% 7,875 19.6%1993 6,269 47.8% 3,300 -9.2% 9,569 21.5%1994 7,239 15.5% 3,440 4.2% 10,679 11.6%1995 3,423 -52.7% 1,797 -47.8% 5,220 -51.1%1996 3,050 -10.9% 1,573 -12.5% 4,623 -11.4%1997 3,750 23.0% 1,616 2.7% 5,366 16.1%1998 5,715 52.4% 1,620 0.2% 7,335 36.7%1999 7,070 23.7% 2,562 58.1% 9,632 31.3%
2000 7,244 2.5% 2,180 -14.9% 9,424 -2.2%2001 5,778 -20.2% 1,785 -18.1% 7,563 -19.7%
April 26, 1993 - Keahole Airport was renamed the Keahole-Kona International Airport.June 2, 1996 - Japan Airlines's first Tokyo-Kona landing at Keahole-Kona International Airport.June 16, 1997 - Keahole-Kona International Airport was renamed the Kona International Airport at Keahole.Sept. 11, 2001 - Terrorist attacks on the United States (U.S.) led to the closing of all U.S. airports.
AIR-PS

KONA INTERNATIONAL AIRPORT at KEAHOLE CARGO (U.S. tons)
INTERISLAND AND OVERSEAS
TOTAL% change % change INTERISLAND % change
INTERISLAND from the OVERSEAS from the AND OVERSEAS from theprevious previous previous
CALENDAR (enplaned year's (enplaned year's (enplaned year'sYEAR and deplaned) total and deplaned) total and deplaned) total
--------------- ---------------------------- ------------ ---------------------------- ------------ ---------------------- ---------------
1960 664 0 6641965 1,078 0 1,078
1970 2,567 0 2,5671971 2,345 -8.6% 0 0.0% 2,345 -8.6%1972 2,755 17.5% 0 0.0% 2,755 17.5%1973 3,249 17.9% 0 0.0% 3,249 17.9%1974 3,714 14.3% 0 0.0% 3,714 14.3%1975 3,742 0.8% 0 0.0% 3,742 0.8%1976 4,664 24.6% 0 0.0% 4,664 24.6%1977 4,991 7.0% 0 0.0% 4,991 7.0%1978 5,155 3.3% 0 0.0% 5,155 3.3%1979 6,630 28.6% 0 0.0% 6,630 28.6%
1980 7,826 18.0% 0 0.0% 7,826 18.0%1981 8,198 4.8% 0 0.0% 8,198 4.8%1982 7,326 -10.6% 0 0.0% 7,326 -10.6%
* 1983 7,167 -2.2% 263 100.0% 7,430 1.4%(Overseas cargo -- September thru December 1983 only.)
1984 6,602 -7.9% 1,128 328.9% 7,730 4.0%1985 6,273 -5.0% 1,939 71.9% 8,212 6.2%1986 7,963 26.9% 872 -55.0% 8,835 7.6%1987 8,346 4.8% 7,701 783.1% 16,047 81.6%1988 9,138 9.5% 5,775 -25.0% 14,913 -7.1%1989 10,618 16.2% 6,195 7.3% 16,813 12.7%
1990 11,842 11.5% 5,448 -12.1% 17,290 2.8%1991 11,687 -1.3% 6,583 20.8% 18,270 5.7%1992 11,891 1.7% 7,875 19.6% 19,766 8.2%1993 11,996 0.9% 9,569 21.5% 21,565 9.1%1994 12,803 6.7% 10,679 11.6% 23,482 8.9%1995 14,292 11.6% 5,220 -51.1% 19,512 -16.9%1996 17,863 25.0% 4,623 -11.4% 22,486 15.2%1997 19,250 7.8% 5,366 16.1% 24,616 9.5%1998 14,750 -23.4% 7,335 36.7% 22,085 -10.3%1999 13,685 -7.2% 9,632 31.3% 23,317 5.6%
2000 5,799 -57.6% 9,424 -2.2% 15,223 -34.7%2001 13,977 141.0% 7,563 -19.7% 21,540 41.5%
April 26, 1993 - Keahole Airport was renamed the Keahole-Kona International Airport.June 2, 1996 - Japan Airlines's first Tokyo-Kona landing at Keahole-Kona International Airport.June 16, 1997 - Keahole-Kona International Airport was renamed the Kona International Airport at Keahole.Sept. 11, 2001 - Terrorist attacks on the United States (U.S.) led to the closing of all U.S. airports.
AIR-PS

KONA INTERNATIONAL AIRPORT at KEAHOLE MAIL (U.S. tons) INTERISLAND
% change % change % changefrom the from the TOTAL from theprevious previous previous
CALENDAR year's year's (enplaned year'sYEAR ENPLANED total DEPLANED total and deplaned) total
--------------- ---------------------------- ------------ ---------------------------- ------------ ---------------------- ---------------
1960 12 10 221965 39 83 122
1970 137 432 569
KONA AIRPORT CLOSED 7-1-70.KEAHOLE AIRPORT OPENED 7-1-70.
1971 144 5.1% 469 8.6% 613 7.7%1972 146 1.4% 491 4.7% 637 3.9%1973 173 18.5% 570 16.1% 743 16.6%1974 191 10.4% 615 7.9% 806 8.5%1975 226 18.3% 686 11.5% 912 13.2%1976 230 1.8% 756 10.2% 986 8.1%1977 265 15.2% 762 0.8% 1,027 4.2%1978 300 13.2% 795 4.3% 1,095 6.6%1979 356 18.7% 796 0.1% 1,152 5.2%
1980 361 1.4% 625 -21.5% 986 -14.4%1981 360 -0.3% 646 3.4% 1,006 2.0%1982 393 9.2% 668 3.4% 1,061 5.5%1983 444 13.0% 795 19.0% 1,239 16.8%1984 459 3.4% 914 15.0% 1,373 10.8%1985 517 12.6% 829 -9.3% 1,346 -2.0%1986 631 22.1% 917 10.6% 1,548 15.0%1987 726 15.1% 1,025 11.8% 1,751 13.1%1988 737 1.5% 1,126 9.9% 1,863 6.4%1989 787 6.8% 1,221 8.4% 2,008 7.8%
1990 922 17.2% 1,379 12.9% 2,301 14.6%1991 945 2.5% 1,480 7.3% 2,425 5.4%1992 970 2.6% 1,609 8.7% 2,579 6.4%1993 1,009 4.0% 1,659 3.1% 2,668 3.5%1994 1,038 2.9% 1,783 7.5% 2,821 5.7%1995 948 -8.7% 1,762 -1.2% 2,710 -3.9%1996 966 1.9% 1,482 -15.9% 2,448 -9.7%1997 823 -14.8% 1,399 -5.6% 2,222 -9.2%1998 698 -15.2% 2,226 59.1% 2,924 31.6%1999 805 15.3% 4,748 113.3% 5,553 89.9%
2000 1,213 50.7% 4,911 3.4% 6,124 10.3%2001 948 -21.8% 4,077 -17.0% 5,025 -17.9%
April 26, 1993 - Keahole Airport was renamed the Keahole-Kona International Airport.June 2, 1996 - Japan Airlines's first Tokyo-Kona landing at Keahole-Kona International Airport.June 16, 1997 - Keahole-Kona International Airport was renamed the Kona International Airport at Keahole.Sept. 11, 2001 - Terrorist attacks on the United States (U.S.) led to the closing of all U.S. airports.
AIR-PS
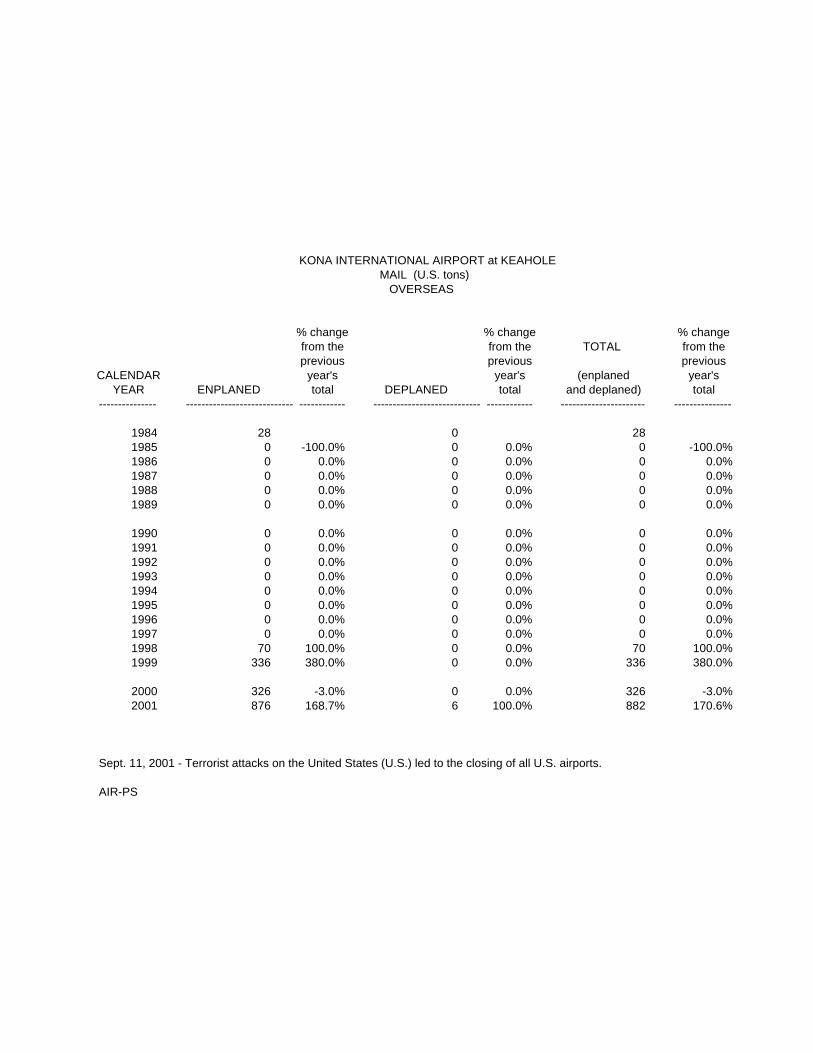
KONA INTERNATIONAL AIRPORT at KEAHOLE MAIL (U.S. tons) OVERSEAS
% change % change % changefrom the from the TOTAL from theprevious previous previous
CALENDAR year's year's (enplaned year'sYEAR ENPLANED total DEPLANED total and deplaned) total
--------------- ---------------------------- ------------ ---------------------------- ------------ ---------------------- ---------------
1984 28 0 281985 0 -100.0% 0 0.0% 0 -100.0%1986 0 0.0% 0 0.0% 0 0.0%1987 0 0.0% 0 0.0% 0 0.0%1988 0 0.0% 0 0.0% 0 0.0%1989 0 0.0% 0 0.0% 0 0.0%
1990 0 0.0% 0 0.0% 0 0.0%1991 0 0.0% 0 0.0% 0 0.0%1992 0 0.0% 0 0.0% 0 0.0%1993 0 0.0% 0 0.0% 0 0.0%1994 0 0.0% 0 0.0% 0 0.0%1995 0 0.0% 0 0.0% 0 0.0%1996 0 0.0% 0 0.0% 0 0.0%1997 0 0.0% 0 0.0% 0 0.0%1998 70 100.0% 0 0.0% 70 100.0%1999 336 380.0% 0 0.0% 336 380.0%
2000 326 -3.0% 0 0.0% 326 -3.0%2001 876 168.7% 6 100.0% 882 170.6%
Sept. 11, 2001 - Terrorist attacks on the United States (U.S.) led to the closing of all U.S. airports.
AIR-PS

KONA INTERNATIONAL AIRPORT at KEAHOLEKONA INTERNATIONAL AIRPORT at KEAHOLE MAIL (U.S. tons)
INTERISLAND AND OVERSEAS INTERISLAND AND OVERSEAS
TOTAL% change % change INTERISLAND % change
INTERISLAND from the OVERSEAS from the AND OVERSEAS from theprevious previous previous
CALENDAR (enplaned year's (enplaned year's (enplaned year'sYEAR and deplaned) total and deplaned) total and deplaned) total
--------------- ---------------------------- ------------ ---------------------------- ------------ ---------------------- ---------------
1960 22 0 221965 122 0 122
1970 569 0 569Kona Airport closed 7/1/70. Keahole Airport opened 7/1/70.
1971 613 7.7% 0 0.0% 613 7.7%1972 637 3.9% 0 0.0% 637 3.9%1973 743 16.6% 0 0.0% 743 16.6%1974 806 8.5% 0 0.0% 806 8.5%1975 912 13.2% 0 0.0% 912 13.2%1976 986 8.1% 0 0.0% 986 8.1%1977 1,027 4.2% 0 0.0% 1,027 4.2%1978 1,095 6.6% 0 0.0% 1,095 6.6%1979 1,152 5.2% 0 0.0% 1,152 5.2%
1980 986 -14.4% 0 0.0% 986 -14.4%1981 1,006 2.0% 0 0.0% 1,006 2.0%1982 1,061 5.5% 0 0.0% 1,061 5.5%1983 1,239 16.8% 0 0.0% 1,239 16.8%1984 1,373 10.8% 28 100.0% 1,401 13.1%1985 1,346 -2.0% 0 -100.0% 1,346 -3.9%1986 1,548 15.0% 0 0.0% 1,548 15.0%1987 1,751 13.1% 0 0.0% 1,751 13.1%1988 1,863 6.4% 0 0.0% 1,863 6.4%1989 2,008 7.8% 0 0.0% 2,008 7.8%
1990 2,301 14.6% 0 0.0% 2,301 14.6%1991 2,425 5.4% 0 0.0% 2,425 5.4%1992 2,579 6.4% 0 0.0% 2,579 6.4%1993 2,668 3.5% 0 0.0% 2,668 3.5%1994 2,821 5.7% 0 0.0% 2,821 5.7%1995 2,710 -3.9% 0 0.0% 2,710 -3.9%1996 2,448 -9.7% 0 0.0% 2,448 -9.7%1997 2,222 -9.2% 0 0.0% 2,222 -9.2%1998 2,924 31.6% 70 100.0% 2,994 34.7%1999 5,553 89.9% 336 380.0% 5,889 96.7%
2000 6,124 10.3% 326 -3.0% 6,450 9.5%2001 5,025 -17.9% 884 171.2% 5,909 -8.4%
April 26, 1993 - Keahole Airport was renamed the Keahole-Kona International Airport.June 2, 1996 - Japan Airlines's first Tokyo-Kona landing at Keahole-Kona International Airport.June 16, 1997 - Keahole-Kona International Airport was renamed the Kona International Airport at Keahole.Sept. 11, 2001 - Terrorist attacks on the United States (U.S.) led to the closing of all U.S. airports.
AIR-PS

KONA INTERNATIONAL AIRPORT at KEAHOLECARGO and MAIL (U.S. tons)
INTERISLAND AND OVERSEAS
TOTALCARGO MAIL CARGO + MAIL
Interisland + % change Interisland + % change Interisland + % changeOverseas from the Overseas from the Overseas from the
previous previous previousCALENDAR (enplaned year's (enplaned year's (enplaned year's
YEAR and deplaned) total and deplaned) total and deplaned) total--------------- ---------------------------- ------------ ---------------------------- ------------ ---------------------- ---------------
1960 664 22 6861965 1,078 122 1,200
1970 2,567 569 3,1361971 2,345 -8.6% 613 7.7% 2,958 -5.7%1972 2,755 17.5% 637 3.9% 3,392 14.7%1973 3,249 17.9% 743 16.6% 3,992 17.7%1974 3,714 14.3% 806 8.5% 4,520 13.2%1975 3,742 0.8% 912 13.2% 4,654 3.0%1976 4,664 24.6% 986 8.1% 5,650 21.4%1977 4,991 7.0% 1,027 4.2% 6,018 6.5%1978 5,155 3.3% 1,095 6.6% 6,250 3.9%1979 6,630 28.6% 1,152 5.2% 7,782 24.5%
1980 7,826 18.0% 986 -14.4% 8,812 13.2%1981 8,198 4.8% 1,006 2.0% 9,204 4.4%1982 7,326 -10.6% 1,061 5.5% 8,387 -8.9%
* 1983 7,430 1.4% 1,239 16.8% 8,669 3.4%(Overseas cargo -- September thru December 1983 only.)
1984 7,730 4.0% 1,401 13.1% 9,131 5.3%1985 8,212 6.2% 1,346 -3.9% 9,558 4.7%1986 8,835 7.6% 1,548 15.0% 10,383 8.6%1987 16,047 81.6% 1,751 13.1% 17,798 71.4%1988 14,913 -7.1% 1,863 6.4% 16,776 -5.7%1989 16,813 12.7% 2,008 7.8% 18,821 12.2%
1990 17,290 2.8% 2,301 14.6% 19,591 4.1%1991 18,270 5.7% 2,425 5.4% 20,695 5.6%1992 19,766 8.2% 2,579 6.4% 22,345 8.0%1993 21,565 9.1% 2,668 3.5% 24,233 8.4%1994 23,482 8.9% 2,821 5.7% 26,303 8.5%1995 19,512 -16.9% 2,710 -3.9% 22,222 -15.5%1996 22,486 15.2% 2,448 -9.7% 24,934 12.2%1997 24,616 9.5% 2,222 -9.2% 26,838 7.6%1998 22,085 -10.3% 2,994 34.7% 25,079 -6.6%1999 23,317 5.6% 5,889 96.7% 29,206 16.5%
2000 15,223 -34.7% 6,450 9.5% 21,673 -25.8%2001 21,540 41.5% 5,909 -8.4% 27,449 26.7%
April 26, 1993 - Keahole Airport was renamed the Keahole-Kona International Airport.June 2, 1996 - Japan Airlines's first Tokyo-Kona landing at Keahole-Kona International Airport.June 16, 1997 - Keahole-Kona International Airport was renamed the Kona International Airport at Keahole.Sept. 11, 2001 - Terrorist attacks on the United States (U.S.) led to the closing of all U.S. airports.
AIR-PS

KONA INTERNATIONAL AIRPORT at KEAHOLECARGO and MAIL (U.S. tons)
INTERISLAND AND OVERSEAS
TOTALCARGO + MAIL
CARGO + MAIL % change CARGO + MAIL % change Interisland + % change Interisland from the Overseas from the Overseas from the
previous previous previousCALENDAR (enplaned year's (enplaned year's (enplaned year's
YEAR and deplaned) total and deplaned) total and deplaned) total--------------- ---------------------------- ------------ ---------------------------- ------------ ---------------------- ---------------
1960 686 0 6861965 1,200 0 1,200
1970 3,136 0 3,1361971 2,958 -5.7% 0 0.0% 2,958 -5.7%1972 3,392 14.7% 0 0.0% 3,392 14.7%1973 3,992 17.7% 0 0.0% 3,992 17.7%1974 4,520 13.2% 0 0.0% 4,520 13.2%1975 4,654 3.0% 0 0.0% 4,654 3.0%1976 5,650 21.4% 0 0.0% 5,650 21.4%1977 6,018 6.5% 0 0.0% 6,018 6.5%1978 6,250 3.9% 0 0.0% 6,250 3.9%1979 7,782 24.5% 0 0.0% 7,782 24.5%
1980 8,812 13.2% 0 0.0% 8,812 13.2%1981 9,204 4.4% 0 0.0% 9,204 4.4%1982 8,387 -8.9% 0 0.0% 8,387 -8.9%
* 1983 8,406 0.2% 263 100.0% 8,669 3.4%(Overseas cargo -- September thru December 1983 only.)
1984 7,975 -5.1% 1,156 339.5% 9,131 5.3%1985 7,619 -4.5% 1,939 67.7% 9,558 4.7%1986 9,511 24.8% 872 -55.0% 10,383 8.6%1987 10,097 6.2% 7,701 783.1% 17,798 71.4%1988 11,001 9.0% 5,775 -25.0% 16,776 -5.7%1989 12,626 14.8% 6,195 7.3% 18,821 12.2%
1990 14,143 12.0% 5,448 -12.1% 19,591 4.1%1991 14,112 -0.2% 6,583 20.8% 20,695 5.6%1992 14,470 2.5% 7,875 19.6% 22,345 8.0%1993 14,664 1.3% 9,569 21.5% 24,233 8.4%1994 15,624 6.5% 10,679 11.6% 26,303 8.5%1995 17,002 8.8% 5,220 -51.1% 22,222 -15.5%1996 20,311 19.5% 4,623 -11.4% 24,934 12.2%1997 21,472 5.7% 5,366 16.1% 26,838 7.6%1998 17,674 -17.7% 7,405 38.0% 25,079 -6.6%1999 19,238 8.8% 9,968 34.6% 29,206 16.5%
2000 11,923 -38.0% 9,750 -2.2% 21,673 -25.8%2001 19,002 59.4% 8,447 -13.4% 27,449 26.7%
April 26, 1993 - Keahole Airport was renamed the Keahole-Kona International Airport.June 2, 1996 - Japan Airlines's first Tokyo-Kona landing at Keahole-Kona International Airport.June 16, 1997 - Keahole-Kona International Airport was renamed the Kona International Airport at Keahole.Sept. 11, 2001 - Terrorist attacks on the United States (U.S.) led to the closing of all U.S. airports.
AIR-PS

KONA INTERNATIONAL AIRPORT at KEAHOLE AIRCRAFT OPERATIONS BY TYPE AIRCRAFT OPERATIONS BY TYPE
% change % change % change % change % changefrom the from the from the from the from theprevious previous previous previous previous
CALENDAR AIR year's AIR year's GENERAL year's year's year'sYEAR CARRIER total TAXI total AVIATION total MILITARY total TOTAL total
-------------- -------------- ----------- -------------- ----------- -------------- ----------- -------------------- ----------- -------------- --------------
* 1971 10,653 5,110 9,734 1,635 27,132
(* Air traffic control tower opened in 1971.)
(** Air taxi operations were combined with general aviation operations until July 1971 when they were separated.)
1972 10,766 1.1% 9,690 89.6% 4,414 -54.7% 5,137 214.2% 30,007 10.6%1973 12,484 16.0% 11,502 18.7% 6,305 42.8% 7,955 54.9% 38,246 27.5%1974 13,529 8.4% 10,570 -8.1% 6,350 0.7% 10,310 29.6% 40,759 6.6%1975 12,554 -7.2% 10,446 -1.2% 7,462 17.5% 10,160 -1.5% 40,622 -0.3%1976 13,937 11.0% 14,090 34.9% 17,867 139.4% 12,531 23.3% 58,425 43.8%1977 15,109 8.4% 15,084 7.1% 40,019 124.0% 13,404 7.0% 83,616 43.1%1978 16,369 8.3% 19,740 30.9% 40,542 1.3% 14,382 7.3% 91,033 8.9%1979 15,602 -4.7% 18,088 -8.4% 46,299 14.2% 12,246 -14.9% 92,235 1.3%
1980 13,895 -10.9% 14,953 -17.3% 28,354 -38.8% 9,742 -20.4% 66,944 -27.4%1981 12,681 -8.7% 14,633 -2.1% 22,416 -20.9% 7,758 -20.4% 57,488 -14.1%1982 13,945 10.0% 15,112 3.3% 14,392 -35.8% 8,440 8.8% 51,889 -9.7%1983 15,621 12.0% 22,731 50.4% 17,732 23.2% 10,497 24.4% 66,581 28.3%1984 17,033 9.0% 29,569 30.1% 19,528 10.1% 17,190 63.8% 83,320 25.1%1985 20,510 20.4% 31,473 6.4% 22,313 14.3% 19,583 13.9% 93,879 12.7%1986 30,265 47.6% 20,679 -34.3% 17,360 -22.2% 13,163 -32.8% 81,467 -13.2%1987 29,171 -3.6% 17,866 -13.6% 10,628 -38.8% 9,832 -25.3% 67,497 -17.1%1988 20,733 -28.9% 17,509 -2.0% 11,710 10.2% 6,632 -32.5% 56,584 -16.2%1989 24,170 16.6% 12,868 -26.5% 12,881 10.0% 5,755 -13.2% 55,674 -1.6%
1990 27,608 14.2% 10,838 -15.8% 17,504 35.9% 4,136 -28.1% 60,086 7.9%1991 26,478 -4.1% 11,069 2.1% 15,265 -12.8% 3,328 -19.5% 56,140 -6.6%1992 29,477 11.3% 9,200 -16.9% 21,066 38.0% 4,196 26.1% 63,939 13.9%1993 25,353 -14.0% 10,697 16.3% 18,326 -13.0% 5,528 31.7% 59,904 -6.3%1994 24,923 -1.7% 14,460 35.2% 21,003 14.6% 6,052 9.5% 66,438 10.9%1995 25,436 2.1% 17,556 21.4% 21,444 2.1% 9,101 50.4% 73,537 10.7%1996 29,195 14.8% 16,556 -5.7% 21,591 0.7% 9,683 6.4% 77,025 4.7%1997 27,462 -5.9% 14,954 -9.7% 37,549 73.9% 7,393 -23.6% 87,358 13.4%1998 27,068 -1.4% 9,346 -37.5% 37,137 -1.1% 7,734 4.6% 81,285 -7.0%1999 27,500 1.6% 8,860 -5.2% 37,588 1.2% 9,007 16.5% 82,955 2.1%
2000 29,561 7.5% 9,547 7.8% 47,021 25.1% 11,923 32.4% 98,052 18.2%2001 27,183 -8.0% 10,926 14.4% 55,094 17.2% 14,590 22.4% 107,793 9.9%
April 26, 1993 - Keahole Airport was renamed the Keahole-Kona International Airport.June 2, 1996 - Japan Airlines's first Tokyo-Kona landing at Keahole-Kona International Airport.June 16, 1997 - Keahole-Kona International Airport was renamed the Kona International Airport at Keahole.Sept. 11, 2001 - Terrorist attacks on the United States (U.S.) led to the closing of all U.S. airports.
AIR-PS

KAHULUI AIRPORT PASSENGERS INTERISLAND
% change % change % changefrom the from the TOTAL from theprevious previous previous
CALENDAR year's year's (enplaned year'sYEAR ENPLANED total DEPLANED total and deplaned) total
--------------- ---------------------------- ------------ ---------------------------- ------------ ---------------------- ---------------
1960 144,787 143,096 287,8831965 272,724 272,998 545,722
1970 581,788 584,706 1,166,4941971 684,339 17.6% 694,558 18.8% 1,378,897 18.2%1972 827,158 20.9% 836,590 20.4% 1,663,748 20.7%1973 928,720 12.3% 935,340 11.8% 1,864,060 12.0%1974 1,031,449 11.1% 1,048,123 12.1% 2,079,572 11.6%1975 1,086,097 5.3% 1,092,287 4.2% 2,178,384 4.8%1976 1,277,190 17.6% 1,261,818 15.5% 2,539,008 16.6%1977 1,420,339 11.2% 1,400,385 11.0% 2,820,724 11.1%1978 1,649,418 16.1% 1,664,373 18.9% 3,313,791 17.5%1979 1,662,395 0.8% 1,684,816 1.2% 3,347,211 1.0%
1980 1,501,269 -9.7% 1,503,763 -10.7% 3,005,032 -10.2%1981 1,550,639 3.3% 1,552,770 3.3% 3,103,409 3.3%1982 1,767,925 14.0% 1,767,876 13.9% 3,535,801 13.9%1983 1,674,588 -5.3% 1,669,065 -5.6% 3,343,653 -5.4%1984 1,796,714 7.3% 1,799,911 7.8% 3,596,625 7.6%1985 1,799,826 0.2% 1,786,262 -0.8% 3,586,088 -0.3%1986 1,876,065 4.2% 1,853,476 3.8% 3,729,541 4.0%1987 1,814,090 -3.3% 1,818,413 -1.9% 3,632,503 -2.6%1988 1,714,848 -5.5% 1,732,064 -4.7% 3,446,912 -5.1%1989 1,832,837 6.9% 1,831,267 5.7% 3,664,104 6.3%
1990 1,920,221 4.8% 1,899,508 3.7% 3,819,729 4.2%1991 1,812,791 -5.6% 1,797,247 -5.4% 3,610,038 -5.5%1992 1,952,964 7.7% 1,947,749 8.4% 3,900,713 8.1%1993 2,044,021 4.7% 2,037,827 4.6% 4,081,848 4.6%1994 2,173,862 6.4% 2,119,178 4.0% 4,293,040 5.2%1995 2,295,009 5.6% 2,231,107 5.3% 4,526,116 5.4%1996 2,270,201 -1.1% 2,187,458 -2.0% 4,457,659 -1.5%1997 2,208,703 -2.7% 2,070,434 -5.3% 4,279,137 -4.0%1998 2,111,692 -4.4% 1,981,652 -4.3% 4,093,344 -4.3%1999 2,129,704 0.9% 2,017,788 1.8% 4,147,492 1.3%
2000 2,146,703 0.8% 2,080,900 3.1% 4,227,603 1.9%2001 1,449,602 -32.5% 2,132,627 2.5% 3,582,229 -15.3%
Sept. 11, 2001 - Terrorist attacks on the United States (U.S.) led to the closing of all U.S. airports.
AIR-PS

KAHULUI AIRPORT PASSENGERS OVERSEAS
% change % change % changefrom the from the TOTAL from theprevious previous previous
CALENDAR year's year's (enplaned year'sYEAR ENPLANED total DEPLANED total and deplaned) total
--------------- --------------------------- --------------- --------------------------- --------------- --------------------- ---------------
1975 (Breakdown of data is not available 13,600 for 1975.)
1976 3,397 5,271 8,668 -36.3%1977 7,579 123.1% 7,579 43.8% 15,158 74.9%1978 8,025 5.9% 8,025 5.9% 16,050 5.9%
1979 (Data is not available for 1979 through 1981.)19801981
(All overseas flights into Kahului prior to 1983 were charters.Regularly scheduled overseas flights between Kahuluiand the continental United States commenced in January 1983.)
1982 10,089 11,488 21,5771983 152,124 1407.8% 168,961 1370.8% 321,085 1388.1%1984 241,232 58.6% 239,639 41.8% 480,871 49.8%1985 349,668 45.0% 369,779 54.3% 719,447 49.6%1986 478,557 36.9% 521,232 41.0% 999,789 39.0%1987 426,384 -10.9% 437,617 -16.0% 864,001 -13.6%1988 473,528 11.1% 498,793 14.0% 972,321 12.5%1989 524,228 10.7% 557,183 11.7% 1,081,411 11.2%
1990 550,169 4.9% 567,073 1.8% 1,117,242 3.3%1991 551,558 0.3% 580,305 2.3% 1,131,863 1.3%1992 627,604 13.8% 654,193 12.7% 1,281,797 13.2%1993 610,124 -2.8% 666,067 1.8% 1,276,191 -0.4%1994 710,174 16.4% 771,304 15.8% 1,481,478 16.1%1995 737,044 3.8% 791,601 2.6% 1,528,645 3.2%1996 680,302 -7.7% 768,174 -3.0% 1,448,476 -5.2%1997 770,110 13.2% 828,364 7.8% 1,598,474 10.4%1998 837,015 8.7% 910,058 9.9% 1,747,073 9.3%1999 854,706 2.1% 969,881 6.6% 1,824,587 4.4%
2000 965,586 13.0% 1,009,205 4.1% 1,974,791 8.2%2001 1,067,849 10.6% 1,079,015 6.9% 2,146,864 8.7%
Sept. 11, 2001 - Terrorist attacks on the United States (U.S.) led to the closing of all U.S. airports.
AIR-PS
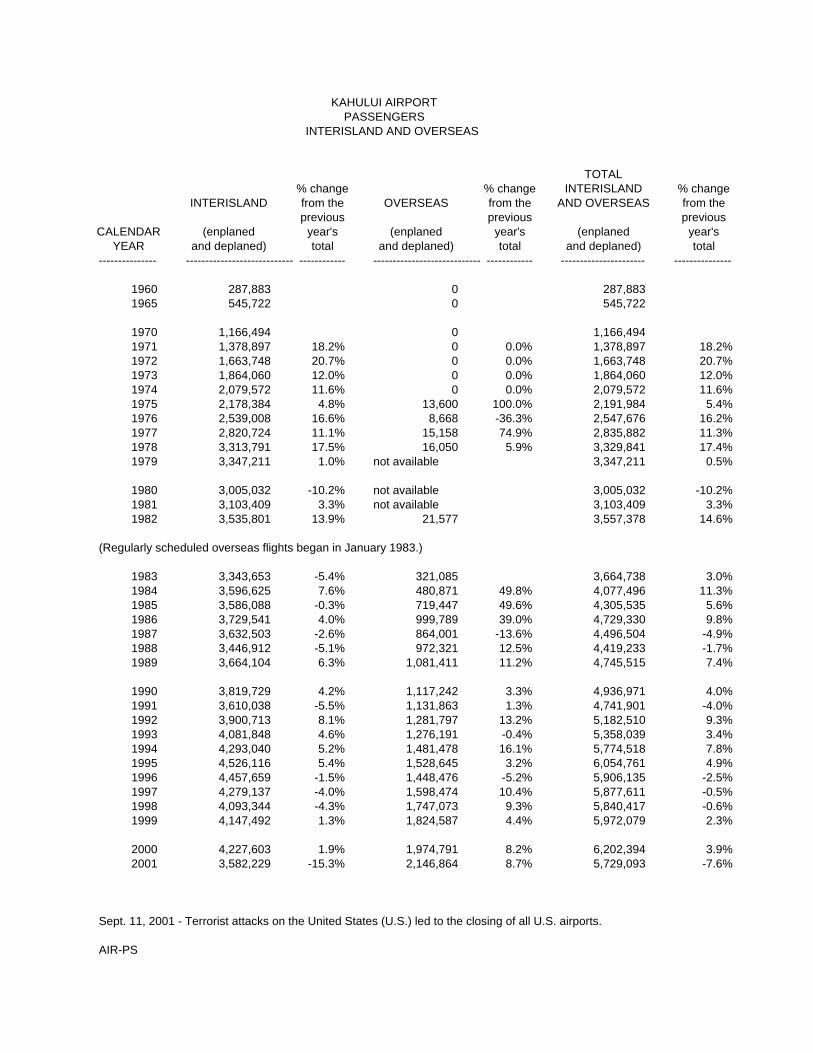
KAHULUI AIRPORT PASSENGERS INTERISLAND AND OVERSEAS
TOTAL% change % change INTERISLAND % change
INTERISLAND from the OVERSEAS from the AND OVERSEAS from theprevious previous previous
CALENDAR (enplaned year's (enplaned year's (enplaned year'sYEAR and deplaned) total and deplaned) total and deplaned) total
--------------- ---------------------------- ------------ ---------------------------- ------------ ---------------------- ---------------
1960 287,883 0 287,8831965 545,722 0 545,722
1970 1,166,494 0 1,166,4941971 1,378,897 18.2% 0 0.0% 1,378,897 18.2%1972 1,663,748 20.7% 0 0.0% 1,663,748 20.7%1973 1,864,060 12.0% 0 0.0% 1,864,060 12.0%1974 2,079,572 11.6% 0 0.0% 2,079,572 11.6%1975 2,178,384 4.8% 13,600 100.0% 2,191,984 5.4%1976 2,539,008 16.6% 8,668 -36.3% 2,547,676 16.2%1977 2,820,724 11.1% 15,158 74.9% 2,835,882 11.3%1978 3,313,791 17.5% 16,050 5.9% 3,329,841 17.4%1979 3,347,211 1.0% not available 3,347,211 0.5%
1980 3,005,032 -10.2% not available 3,005,032 -10.2%1981 3,103,409 3.3% not available 3,103,409 3.3%1982 3,535,801 13.9% 21,577 3,557,378 14.6%
(Regularly scheduled overseas flights began in January 1983.)
1983 3,343,653 -5.4% 321,085 3,664,738 3.0%1984 3,596,625 7.6% 480,871 49.8% 4,077,496 11.3%1985 3,586,088 -0.3% 719,447 49.6% 4,305,535 5.6%1986 3,729,541 4.0% 999,789 39.0% 4,729,330 9.8%1987 3,632,503 -2.6% 864,001 -13.6% 4,496,504 -4.9%1988 3,446,912 -5.1% 972,321 12.5% 4,419,233 -1.7%1989 3,664,104 6.3% 1,081,411 11.2% 4,745,515 7.4%
1990 3,819,729 4.2% 1,117,242 3.3% 4,936,971 4.0%1991 3,610,038 -5.5% 1,131,863 1.3% 4,741,901 -4.0%1992 3,900,713 8.1% 1,281,797 13.2% 5,182,510 9.3%1993 4,081,848 4.6% 1,276,191 -0.4% 5,358,039 3.4%1994 4,293,040 5.2% 1,481,478 16.1% 5,774,518 7.8%1995 4,526,116 5.4% 1,528,645 3.2% 6,054,761 4.9%1996 4,457,659 -1.5% 1,448,476 -5.2% 5,906,135 -2.5%1997 4,279,137 -4.0% 1,598,474 10.4% 5,877,611 -0.5%1998 4,093,344 -4.3% 1,747,073 9.3% 5,840,417 -0.6%1999 4,147,492 1.3% 1,824,587 4.4% 5,972,079 2.3%
2000 4,227,603 1.9% 1,974,791 8.2% 6,202,394 3.9%2001 3,582,229 -15.3% 2,146,864 8.7% 5,729,093 -7.6%
Sept. 11, 2001 - Terrorist attacks on the United States (U.S.) led to the closing of all U.S. airports.
AIR-PS

KAHULUI AIRPORTCARGO (U.S. tons) INTERISLAND
% change % change % changefrom the from the TOTAL from theprevious previous previous
CALENDAR year's year's (enplaned year'sYEAR ENPLANED total DEPLANED total and deplaned) total
--------------- ---------------------------- ------------ ---------------------------- ------------------ ---------------------- ---------------
1960 2,396 1,460 3,8561965 3,816 5,481 9,297
1970 3,364 7,040 10,4041971 1,766 -47.5% 6,783 -3.7% 8,549 -17.8%1972 1,974 11.8% 7,931 16.9% 9,905 15.9%1973 2,181 10.5% 8,756 10.4% 10,937 10.4%1974 2,741 25.7% 10,287 17.5% 13,028 19.1%1975 2,982 8.8% 10,387 1.0% 13,369 2.6%1976 2,845 -4.6% 10,656 2.6% 13,501 1.0%1977 6,227 118.9% 13,452 26.2% 19,679 45.8%1978 6,167 -1.0% 14,525 8.0% 20,692 5.1%1979 5,183 -16.0% 16,694 14.9% 21,877 5.7%
1980 6,336 22.2% 17,884 7.1% 24,220 10.7%1981 4,606 -27.3% 15,637 -12.6% 20,243 -16.4%1982 3,871 -16.0% 14,775 -5.5% 18,646 -7.9%1983 3,778 -2.4% 15,984 8.2% 19,762 6.0%1984 3,736 -1.1% 17,674 10.6% 21,410 8.3%1985 3,311 -11.4% 15,399 -12.9% 18,710 -12.6%1986 3,046 -8.0% 16,423 6.6% 19,469 4.1%1987 3,307 8.6% 17,480 6.4% 20,787 6.8%1988 3,335 0.8% 16,826 -3.7% 20,161 -3.0%1989 3,850 15.4% 18,866 12.1% 22,716 12.7%
1990 3,883 0.9% 18,770 -0.5% 22,653 -0.3%1991 4,890 25.9% 18,088 -3.6% 22,978 1.4%1992 5,360 9.6% 18,738 3.6% 24,098 4.9%1993 4,999 -6.7% 17,738 -5.3% 22,737 -5.6%1994 5,104 2.1% 18,250 2.9% 23,354 2.7%1995 6,020 17.9% 17,294 -5.2% 23,314 -0.2%1996 7,505 24.7% 19,746 14.2% 27,251 16.9%1997 8,984 19.7% 22,122 12.0% 31,106 14.1%1998 5,587 -37.8% 14,517 -34.4% 20,104 -35.4%1999 5,324 -4.7% 14,911 2.7% 20,235 0.7%
2000 6,147 15.5% 17,872 19.9% 24,019 18.7%2001 6,135 -0.2% 17,321 -3.1% 23,456 -2.3%
Sept. 11, 2001 - Terrorist attacks on the United States (U.S.) led to the closing of all U.S. airports.
AIR-PS

KAHULUI AIRPORTCARGO (U.S. tons) OVERSEAS
% change % change % changefrom the from the TOTAL from theprevious previous previous
CALENDAR year's year's (enplaned year'sYEAR ENPLANED total DEPLANED total and deplaned) total
--------------- ---------------------------- ------------ ---------------------------- ------------ ---------------------- ---------------
* 1983 180 188 368
(* Overseas cargo - September through December 1983.)
1984 404 124.4% 485 158.0% 889 141.6%1985 672 66.3% 1,688 248.0% 2,360 165.5%1986 1,070 59.2% 4,082 141.8% 5,152 118.3%1987 1,331 24.4% 6,715 64.5% 8,046 56.2%1988 2,394 79.9% 7,625 13.6% 10,019 24.5%1989 4,356 82.0% 7,486 -1.8% 11,842 18.2%
1990 5,418 24.4% 7,748 3.5% 13,166 11.2%1991 6,511 20.2% 8,351 7.8% 14,862 12.9%1992 7,503 15.2% 8,670 3.8% 16,173 8.8%1993 5,581 -25.6% 7,004 -19.2% 12,585 -22.2%1994 4,533 -18.8% 7,016 0.2% 11,549 -8.2%1995 6,092 34.4% 5,586 -20.4% 11,678 1.1%1996 7,184 17.9% 5,776 3.4% 12,960 11.0%1997 6,988 -2.7% 5,772 -0.1% 12,760 -1.5%1998 6,804 -2.6% 5,179 -10.3% 11,983 -6.1%1999 6,945 2.1% 5,937 14.6% 12,882 7.5%
2000 7,390 6.4% 6,688 12.6% 14,078 9.3%2001 7,919 7.2% 5,511 -17.6% 13,430 -4.6%
Sept. 11, 2001 - Terrorist attacks on the United States (U.S.) led to the closing of all U.S. airports.
AIR-PS

KAHULUI AIRPORT CARGO (U.S. tons) INTERISLAND AND OVERSEAS
TOTAL% change % change INTERISLAND % change
INTERISLAND from the OVERSEAS from the AND OVERSEAS from theprevious previous previous
CALENDAR (enplaned year's (enplaned year's (enplaned year'sYEAR and deplaned) total and deplaned) total and deplaned) total
--------------- ---------------------------- ------------ ---------------------------- ------------ ---------------------- ---------------
1960 3,856 0 3,8561965 9,297 0 9,297
1970 10,404 0 10,4041971 8,549 -17.8% 0 0.0% 8,549 -17.8%1972 9,905 15.9% 0 0.0% 9,905 15.9%1973 10,937 10.4% 0 0.0% 10,937 10.4%1974 13,028 19.1% 0 0.0% 13,028 19.1%1975 13,369 2.6% 0 0.0% 13,369 2.6%1976 13,501 1.0% 0 0.0% 13,501 1.0%1977 19,679 45.8% 0 0.0% 19,679 45.8%1978 20,692 5.1% 0 0.0% 20,692 5.1%1979 21,877 5.7% 0 0.0% 21,877 5.7%
1980 24,220 10.7% 0 0.0% 24,220 10.7%1981 20,243 -16.4% 0 0.0% 20,243 -16.4%1982 18,646 -7.9% 0 0.0% 18,646 -7.9%
* 1983 19,762 6.0% 368 100.0% 20,130 8.0%
(* Overseas cargo - September through December 1983.)
1984 21,410 8.3% 889 141.6% 22,299 10.8%1985 18,710 -12.6% 2,360 165.5% 21,070 -5.5%1986 19,469 4.1% 5,152 118.3% 24,621 16.9%1987 20,787 6.8% 8,046 56.2% 28,833 17.1%1988 20,161 -3.0% 10,019 24.5% 30,180 4.7%1989 22,716 12.7% 11,842 18.2% 34,558 14.5%
1990 22,653 -0.3% 13,166 11.2% 35,819 3.6%1991 22,978 1.4% 14,862 12.9% 37,840 5.6%1992 24,098 4.9% 16,173 8.8% 40,271 6.4%1993 22,737 -5.6% 12,585 -22.2% 35,322 -12.3%1994 23,354 2.7% 11,549 -8.2% 34,903 -1.2%1995 23,314 -0.2% 11,678 1.1% 34,992 0.3%1996 27,251 16.9% 12,960 11.0% 40,211 14.9%1997 31,106 14.1% 12,760 -1.5% 43,866 9.1%1998 20,104 -35.4% 11,983 -6.1% 32,087 -26.9%1999 20,235 0.7% 12,882 7.5% 33,117 3.2%
2000 24,019 18.7% 14,078 9.3% 38,097 15.0%2001 23,456 -2.3% 13,430 -4.6% 36,886 -3.2%
Sept. 11, 2001 - Terrorist attacks on the United States (U.S.) led to the closing of all U.S. airports.
AIR-PS

KAHULUI AIRPORT MAIL (U.S. tons) INTERISLAND
%change %change %change from the from the TOTAL from the previous previous previous
CALENDAR yea(s yea(s (enplaned yea(s YEAR ENPLANED total DEPLANED total and deplaned) total
1960 76 50 126 1965 357 607 964
1970 475 1,533 2,008 1971 508 6.9% 1,729 12.8% 2,237 11.4% 1972 840 65.4% 1,759 1.7% 2,599 16.2% 1973 623 -25.8% 2,074 17.9% 2,697 3.8% 1974 715 14.8% 2,106 1.5% 2,821 4.6% 1975 790 10.5% 2,203 4.6% 2,993 6.1% 1976 765 -3.2% 2.426 10.1% 3,191 6.6% 1977 787 2.9% 2,024 -16.6% 2,811 -11.9% 1978 824 4.7% 1,704 -15.8% 2,528 -10.1% 1979 859 4.2% 1,706 0.1% 2,565 1.5%
1980 921 7.2% 1.417 -16.9% 2,338 -8.8% 1981 941 2.2% 1,505 6.2% 2,446 4.6% 1982 966 2.7% 1,583 5.2% 2,549 4.2% 1983 1,073 11.1% 1,762 11.3% 2,835 11.2% 1984 1,085 1.1% 1,768 0.3% 2,853 0.6% 1985 1,149 5.9% 1,622 -8.3% 2,771 -2.9% 1986 1,187 3.3% 1,836 13.2% 3,023 9.1% 1987 1,272 7.2% 2,041 11.2% 3,313 9.6% 1988 1,358 6.8% 2,068 1.3% 3,426 3.4% 1989 1,446 6.5% 2,375 14.8% 3,821 11.5%
1990 1,616 11.8% 2,501 5.3% 4,117 7.7% 1991 1,690 4.6% 2,527 1.0% 4,217 2.4% 1992 1,740 3.0% 2,800 10.8% 4,540 7.7% 1993 1,937 11.3% 2,878 2.8% 4,815 6.1% 1994 1,991 2.8% 3,182 10.6% 5,173 7.4% 1995 2,021 1.5% 3,145 -1.2% 5,166 -0.1% 1996 2,287 13.2% 3,841 15.8% 5,928 14.8% 1997 2,195 -4.0% 4,843 27.5% 6,838 15.4% 1998 2,199 0.2% 7,643 64.6% 9,842 43.9% 1999 2,263 2.9% 7,592 -0.7% 9,855 0.1%
' 2000 2,730 20.6% 7,607 0.2% 10,337 4.9% 2001 1977 -27.6% 7176 -5.7% 9,153 -11.5%
Sept 11, 2001 -Terrorist attacks on the United States (U.S.) led to the closing of all U.S. airports.
AIR-PS

KAHULUI AIRPORT MAIL (U.S. tons) OVERSEAS
% change % change % changefrom the from the TOTAL from theprevious previous previous
CALENDAR year's year's (enplaned year'sYEAR ENPLANED total DEPLANED total and deplaned) total
--------------- ---------------------------- ------------ ---------------------------- -------------- ---------------------- ---------------
1984 50 1 511985 35 -30.0% 0 -100.0% 35 -31.4%1986 70 100.0% 1 100.0% 71 102.9%1987 0 -100.0% 0 -100.0% 0 -100.0%1988 51 100.0% 4 100.0% 55 100.0%1989 26 -49.0% 5 25.0% 31 -43.6%
1990 0 -100.0% 0 -100.0% 0 -100.0%1991 0 0.0% 6 100.0% 6 100.0%1992 6 100.0% 6 0.0% 12 100.0%1993 0 -100.0% 0 -100.0% 0 -100.0%1994 0 0.0% 0 0.0% 0 0.0%1995 10 100.0% 0 0.0% 10 100.0%1996 0 -100.0% 0 0.0% 0 -100.0%1997 167 100.0% 23 100.0% 190 100.0%1998 642 284.4% 25 8.7% 667 251.1%1999 1,102 71.7% 1 -96.0% 1,103 65.4%
2000 641 -41.8% 32 3100.0% 673 -39.0%2001 1,133 76.8% 136 325.0% 1,269 88.6%
Sept. 11, 2001 - Terrorist attacks on the United States (U.S.) led to the closing of all U.S. airports. AIR-PS

KAHULUI AIRPORT MAIL (U.S. tons)
INTERISLAND AND OVERSEAS
TOTAL% change % change INTERISLAND % change
INTERISLAND from the OVERSEAS from the AND OVERSEAS from theprevious previous previous
CALENDAR (enplaned year's (enplaned year's (enplaned year'sYEAR and deplaned) total and deplaned) total and deplaned) total
--------------- ---------------------------- ------------ ---------------------------- ------------ ---------------------- ---------------
1960 126 0 1261965 964 0 964
1970 2,008 0 2,0081971 2,237 11.4% 0 0.0% 2,237 11.4%1972 2,599 16.2% 0 0.0% 2,599 16.2%1973 2,697 3.8% 0 0.0% 2,697 3.8%1974 2,821 4.6% 0 0.0% 2,821 4.6%1975 2,993 6.1% 0 0.0% 2,993 6.1%1976 3,191 6.6% 0 0.0% 3,191 6.6%1977 2,811 -11.9% 0 0.0% 2,811 -11.9%1978 2,528 -10.1% 0 0.0% 2,528 -10.1%1979 2,565 1.5% 0 0.0% 2,565 1.5%
1980 2,338 -8.8% 0 0.0% 2,338 -8.8%1981 2,446 4.6% 0 0.0% 2,446 4.6%1982 2,549 4.2% 0 0.0% 2,549 4.2%1983 2,835 11.2% 0 0.0% 2,835 11.2%1984 2,853 0.6% 51 100.0% 2,904 2.4%1985 2,771 -2.9% 35 -31.4% 2,806 -3.4%1986 3,023 9.1% 71 102.9% 3,094 10.3%1987 3,313 9.6% 0 -100.0% 3,313 7.1%1988 3,426 3.4% 55 100.0% 3,481 5.1%1989 3,821 11.5% 31 -43.6% 3,852 10.7%
1990 4,117 7.7% 0 -100.0% 4,117 6.9%1991 4,217 2.4% 6 100.0% 4,223 2.6%1992 4,540 7.7% 12 100.0% 4,552 7.8%1993 4,815 6.1% 0 -100.0% 4,815 5.8%1994 5,173 7.4% 0 0.0% 5,173 7.4%1995 5,166 -0.1% 10 100.0% 5,176 0.1%1996 5,928 14.8% 0 -100.0% 5,928 14.5%1997 6,838 15.4% 190 100.0% 7,028 18.6%1998 9,842 43.9% 667 251.1% 10,509 49.5%1999 9,855 0.1% 1,103 65.4% 10,958 4.3%
2000 10,337 4.9% 673 -39.0% 11,010 0.5%2001 9,153 -11.5% 1,269 88.6% 10,422 -5.3%
Sept. 11, 2001 - Terrorist attacks on the United States (U.S.) led to the closing of all U.S. airports.
AIR-PS

KAHULUI AIRPORT CARGO and MAIL (U.S. tons) INTERISLAND AND OVERSEAS
TOTALCARGO MAIL CARGO + MAIL
Interisland + % change Interisland + % change Interisland + % changeOverseas from the Overseas from the Overseas from the
previous previous previousCALENDAR (enplaned year's (enplaned year's (enplaned year's
YEAR and deplaned) total and deplaned) total and deplaned) total--------------- ---------------------------- ------------ ---------------------------- ------------ --------------------- ---------------
1960 3,856 126 3,9821965 9,297 964 10,261
1970 10,404 2,008 12,4121971 8,549 -17.8% 2,237 11.4% 10,786 -13.1%1972 9,905 15.9% 2,599 16.2% 12,504 15.9%1973 10,937 10.4% 2,697 3.8% 13,634 9.0%1974 13,028 19.1% 2,821 4.6% 15,849 16.2%1975 13,369 2.6% 2,993 6.1% 16,362 3.2%1976 13,501 1.0% 3,191 6.6% 16,692 2.0%1977 19,679 45.8% 2,811 -11.9% 22,490 34.7%1978 20,692 5.1% 2,528 -10.1% 23,220 3.2%1979 21,877 5.7% 2,565 1.5% 24,442 5.3%
1980 24,220 10.7% 2,338 -8.8% 26,558 8.7%1981 20,243 -16.4% 2,446 4.6% 22,689 -14.6%1982 18,646 -7.9% 2,549 4.2% 21,195 -6.6%
* 1983 20,130 8.0% 2,835 11.2% 22,965 8.4%
(* Overseas cargo - September through December 1983.)
1984 22,299 10.8% 2,904 2.4% 25,203 9.7%1985 21,070 -5.5% 2,806 -3.4% 23,876 -5.3%1986 24,621 16.9% 3,094 10.3% 27,715 16.1%1987 28,833 17.1% 3,313 7.1% 32,146 16.0%1988 30,180 4.7% 3,481 5.1% 33,661 4.7%1989 34,558 14.5% 3,852 10.7% 38,410 14.1%
1990 35,819 3.6% 4,117 6.9% 39,936 4.0%1991 37,840 5.6% 4,223 2.6% 42,063 5.3%1992 40,271 6.4% 4,552 7.8% 44,823 6.6%1993 35,322 -12.3% 4,815 5.8% 40,137 -10.5%1994 34,903 -1.2% 5,173 7.4% 40,076 -0.2%1995 34,992 0.3% 5,176 0.1% 40,168 0.2%1996 40,211 14.9% 5,928 14.5% 46,139 14.9%1997 43,866 9.1% 7,028 18.6% 50,894 10.3%1998 32,087 -26.9% 10,509 49.5% 42,596 -16.3%1999 33,117 3.2% 10,958 4.3% 44,075 3.5%
2000 38,097 15.0% 11,010 0.5% 49,107 11.4%2001 36,886 -3.2% 10,422 -5.3% 47,308 -3.7%
Sept. 11, 2001 - Terrorist attacks on the United States (U.S.) led to the closing of all U.S. airports.
AIR-PS

KAHULUI AIRPORT CARGO and MAIL (U.S. tons) INTERISLAND AND OVERSEAS
TOTALCARGO + MAIL
CARGO + MAIL % change CARGO + MAIL % change Interisland + % changeInterisland from the Overseas from the Overseas from the
previous previous previousCALENDAR (enplaned year's (enplaned year's (enplaned year's
YEAR and deplaned) total and deplaned) total and deplaned) total--------------- ---------------------------- ------------ ---------------------------- ------------ ---------------------- ---------------
1960 3,982 0 3,9821965 10,261 0 10,261
1970 12,412 0 12,4121971 10,786 -13.1% 0 0.0% 10,786 -13.1%1972 12,504 15.9% 0 0.0% 12,504 15.9%1973 13,634 9.0% 0 0.0% 13,634 9.0%1974 15,849 16.2% 0 0.0% 15,849 16.2%1975 16,362 3.2% 0 0.0% 16,362 3.2%1976 16,692 2.0% 0 0.0% 16,692 2.0%1977 22,490 34.7% 0 0.0% 22,490 34.7%1978 23,220 3.2% 0 0.0% 23,220 3.2%1979 24,442 5.3% 0 0.0% 24,442 5.3%
1980 26,558 8.7% 0 0.0% 26,558 8.7%1981 22,689 -14.6% 0 0.0% 22,689 -14.6%1982 21,195 -6.6% 0 0.0% 21,195 -6.6%
* 1983 22,597 6.6% 368 100.0% 22,965 8.4%
(* Overseas cargo - September through December 1983.)
1984 24,263 7.4% 940 155.4% 25,203 9.7%1985 21,481 -11.5% 2,395 154.8% 23,876 -5.3%1986 22,492 4.7% 5,223 118.1% 27,715 16.1%1987 24,100 7.1% 8,046 54.0% 32,146 16.0%1988 23,587 -2.1% 10,074 25.2% 33,661 4.7%1989 26,537 12.5% 11,873 17.9% 38,410 14.1%
1990 26,770 0.9% 13,166 10.9% 39,936 4.0%1991 27,195 1.6% 14,868 12.9% 42,063 5.3%1992 28,638 5.3% 16,185 8.9% 44,823 6.6%1993 27,552 -3.8% 12,585 -22.2% 40,137 -10.5%1994 28,527 3.5% 11,549 -8.2% 40,076 -0.2%1995 28,480 -0.2% 11,688 1.2% 40,168 0.2%1996 33,179 16.5% 12,960 10.9% 46,139 14.9%1997 37,944 14.4% 12,950 -0.1% 50,894 10.3%1998 29,946 -21.1% 12,650 -2.3% 42,596 -16.3%1999 30,090 0.5% 13,985 10.6% 44,075 3.5%
2000 34,356 14.2% 14,751 5.5% 49,107 11.4%2001 32,609 -5.1% 14,699 -0.4% 47,308 -3.7%
Sept. 11, 2001 - Terrorist attacks on the United States (U.S.) led to the closing of all U.S. airports.
AIR-PS
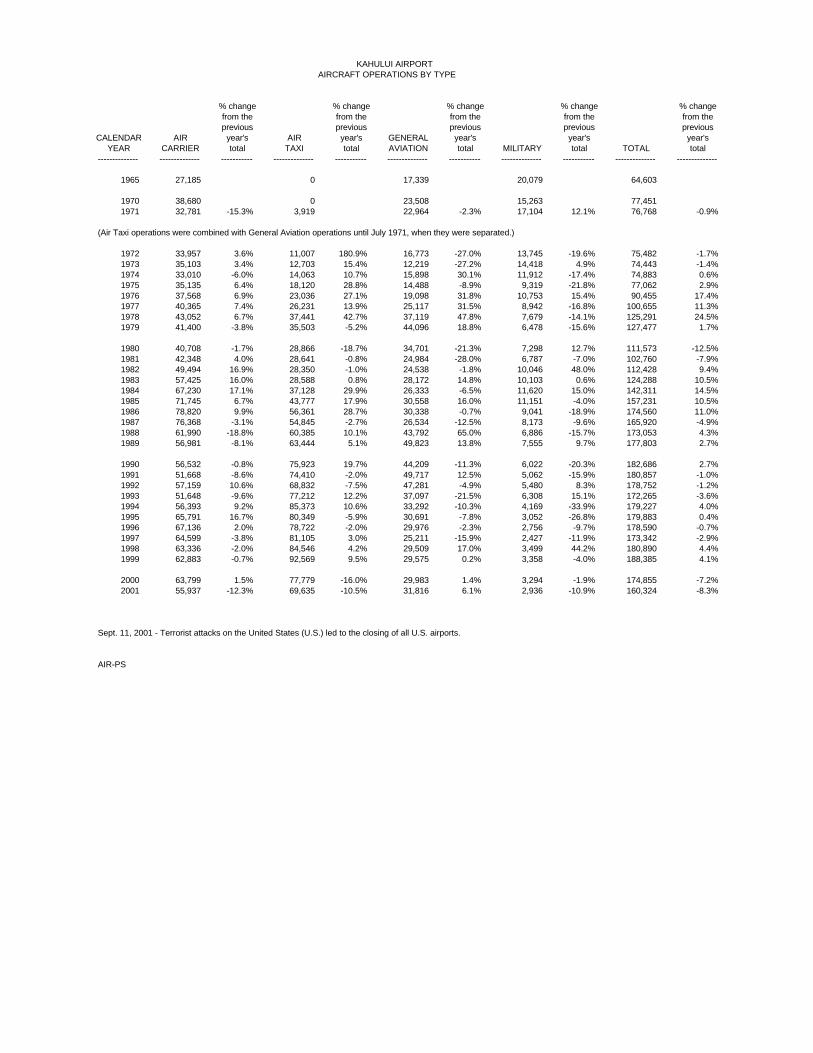
KAHULUI AIRPORT KAHULUI AIRPORTAIRCRAFT OPERATIONS BY TYPE
% change % change % change % change % changefrom the from the from the from the from theprevious previous previous previous previous
CALENDAR AIR year's AIR year's GENERAL year's year's year'sYEAR CARRIER total TAXI total AVIATION total MILITARY total TOTAL total
-------------- -------------- ----------- -------------- ----------- -------------- ----------- -------------- ----------- -------------- --------------
1965 27,185 0 17,339 20,079 64,603
1970 38,680 0 23,508 15,263 77,4511971 32,781 -15.3% 3,919 22,964 -2.3% 17,104 12.1% 76,768 -0.9%
(Air Taxi operations were combined with General Aviation operations until July 1971, when they were separated.)
1972 33,957 3.6% 11,007 180.9% 16,773 -27.0% 13,745 -19.6% 75,482 -1.7%1973 35,103 3.4% 12,703 15.4% 12,219 -27.2% 14,418 4.9% 74,443 -1.4%1974 33,010 -6.0% 14,063 10.7% 15,898 30.1% 11,912 -17.4% 74,883 0.6%1975 35,135 6.4% 18,120 28.8% 14,488 -8.9% 9,319 -21.8% 77,062 2.9%1976 37,568 6.9% 23,036 27.1% 19,098 31.8% 10,753 15.4% 90,455 17.4%1977 40,365 7.4% 26,231 13.9% 25,117 31.5% 8,942 -16.8% 100,655 11.3%1978 43,052 6.7% 37,441 42.7% 37,119 47.8% 7,679 -14.1% 125,291 24.5%1979 41,400 -3.8% 35,503 -5.2% 44,096 18.8% 6,478 -15.6% 127,477 1.7%
1980 40,708 -1.7% 28,866 -18.7% 34,701 -21.3% 7,298 12.7% 111,573 -12.5%1981 42,348 4.0% 28,641 -0.8% 24,984 -28.0% 6,787 -7.0% 102,760 -7.9%1982 49,494 16.9% 28,350 -1.0% 24,538 -1.8% 10,046 48.0% 112,428 9.4%1983 57,425 16.0% 28,588 0.8% 28,172 14.8% 10,103 0.6% 124,288 10.5%1984 67,230 17.1% 37,128 29.9% 26,333 -6.5% 11,620 15.0% 142,311 14.5%1985 71,745 6.7% 43,777 17.9% 30,558 16.0% 11,151 -4.0% 157,231 10.5%1986 78,820 9.9% 56,361 28.7% 30,338 -0.7% 9,041 -18.9% 174,560 11.0%1987 76,368 -3.1% 54,845 -2.7% 26,534 -12.5% 8,173 -9.6% 165,920 -4.9%1988 61,990 -18.8% 60,385 10.1% 43,792 65.0% 6,886 -15.7% 173,053 4.3%1989 56,981 -8.1% 63,444 5.1% 49,823 13.8% 7,555 9.7% 177,803 2.7%
1990 56,532 -0.8% 75,923 19.7% 44,209 -11.3% 6,022 -20.3% 182,686 2.7%1991 51,668 -8.6% 74,410 -2.0% 49,717 12.5% 5,062 -15.9% 180,857 -1.0%1992 57,159 10.6% 68,832 -7.5% 47,281 -4.9% 5,480 8.3% 178,752 -1.2%1993 51,648 -9.6% 77,212 12.2% 37,097 -21.5% 6,308 15.1% 172,265 -3.6%1994 56,393 9.2% 85,373 10.6% 33,292 -10.3% 4,169 -33.9% 179,227 4.0%1995 65,791 16.7% 80,349 -5.9% 30,691 -7.8% 3,052 -26.8% 179,883 0.4%1996 67,136 2.0% 78,722 -2.0% 29,976 -2.3% 2,756 -9.7% 178,590 -0.7%1997 64,599 -3.8% 81,105 3.0% 25,211 -15.9% 2,427 -11.9% 173,342 -2.9%1998 63,336 -2.0% 84,546 4.2% 29,509 17.0% 3,499 44.2% 180,890 4.4%1999 62,883 -0.7% 92,569 9.5% 29,575 0.2% 3,358 -4.0% 188,385 4.1%
2000 63,799 1.5% 77,779 -16.0% 29,983 1.4% 3,294 -1.9% 174,855 -7.2%2001 55,937 -12.3% 69,635 -10.5% 31,816 6.1% 2,936 -10.9% 160,324 -8.3%
Sept. 11, 2001 - Terrorist attacks on the United States (U.S.) led to the closing of all U.S. airports.
AIR-PS

LIHUE AIRPORT PASSENGERS INTERISLAND
% change % change % changefrom the from the TOTAL from theprevious previous previous
CALENDAR year's year's (enplaned year'sYEAR ENPLANED total DEPLANED total and deplaned) total
--------------- ---------------------------- ------------ ---------------------------- ------------ ---------------------- ---------------
1960 154,335 153,956 308,2911965 263,216 261,296 524,512
1970 556,288 556,677 1,112,9651971 630,225 13.3% 627,685 12.8% 1,257,910 13.0%1972 658,655 4.5% 755,968 20.4% 1,414,623 12.5%1973 922,847 40.1% 922,386 22.0% 1,845,233 30.4%1974 969,964 5.1% 968,894 5.0% 1,938,858 5.1%1975 961,618 -0.9% 956,447 -1.3% 1,918,065 -1.1%1976 1,041,763 8.3% 1,036,678 8.4% 2,078,441 8.4%1977 1,093,606 5.0% 1,095,060 5.6% 2,188,666 5.3%1978 1,211,240 10.8% 1,212,717 10.7% 2,423,957 10.8%1979 1,247,285 3.0% 1,249,221 3.0% 2,496,506 3.0%
1980 1,105,775 -11.3% 1,105,838 -11.5% 2,211,613 -11.4%1981 1,075,642 -2.7% 1,074,425 -2.8% 2,150,067 -2.8%1982 1,044,519 -2.9% 1,040,537 -3.2% 2,085,056 -3.0%1983 935,016 -10.5% 936,742 -10.0% 1,871,758 -10.2%1984 1,065,139 13.9% 1,059,684 13.1% 2,124,823 13.5%1985 1,115,728 4.7% 1,094,792 3.3% 2,210,520 4.0%1986 1,244,608 11.6% 1,226,544 12.0% 2,471,152 11.8%1987 1,304,441 4.8% 1,288,292 5.0% 2,592,733 4.9%1988 1,318,869 1.1% 1,310,823 1.7% 2,629,692 1.4%1989 1,382,304 4.8% 1,369,996 4.5% 2,752,300 4.7%
1990 1,358,837 -1.7% 1,350,334 -1.4% 2,709,171 -1.6%1991 1,270,073 -6.5% 1,269,480 -6.0% 2,539,553 -6.3%1992 1,145,729 -9.8% 1,130,436 -11.0% 2,276,165 -10.4%1993 911,993 -20.4% 918,968 -18.7% 1,830,961 -19.6%1994 1,149,319 26.0% 1,151,971 25.4% 2,301,290 25.7%1995 1,235,203 7.5% 1,234,476 7.2% 2,469,679 7.3%1996 1,276,454 3.3% 1,276,471 3.4% 2,552,925 3.4%1997 1,284,323 0.6% 1,284,337 0.6% 2,568,660 0.6%1998 1,283,603 -0.1% 1,278,245 -0.5% 2,561,848 -0.3%1999 1,306,322 1.8% 1,303,694 2.0% 2,610,016 1.9%
2000 1,345,787 3.0% 1,338,243 2.7% 2,684,030 2.8%2001 1,200,676 -10.8% 1,195,805 -10.6% 2,396,481 -10.7%
Nov. 23, 1982 - Hurricane Iwa hits Kauai.Sept. 11, 1992 - Hurricane Iniki hits Kauai.Sept. 11, 2001 - Terrorist attacks on the United States (U.S.) led to the closing of all U.S. airports.
AIR-PS

LIHUE AIRPORT PASSENGERS OVERSEAS
% change % change % changefrom the from the TOTAL from theprevious previous previous
CALENDAR year's year's (enplaned year'sYEAR ENPLANED total DEPLANED total and deplaned) total
---------------- --------------------------- --------------- --------------------------- ----------- --------------------- ---------------
* 1984 7,806 12,952 20,758
(* Direct overseas service to Lihue commenced in August 1984.)
1985 25,438 225.9% 35,286 172.4% 60,724 192.5%1986 30,571 20.2% 39,366 11.6% 69,937 15.2%1987 36,064 18.0% 44,352 12.7% 80,416 15.0%1988 40,151 11.3% 50,684 14.3% 90,835 13.0%1989 56,260 40.1% 68,509 35.2% 124,769 37.4%
1990 64,314 14.3% 74,838 9.2% 139,152 11.5%1991 77,587 20.6% 79,609 6.4% 157,196 13.0%1992 52,552 -32.3% 53,550 -32.7% 106,102 -32.5%1993 4,012 -92.4% 4,654 -91.3% 8,666 -91.8%1994 0 -100.0% 0 -100.0% 0 -100.0%1995 180 100.0% 628 100.0% 808 100.0%1996 4,533 2418.3% 4,349 592.5% 8,882 999.3%1997 5,910 30.4% 5,773 32.7% 11,683 31.5%1998 37,836 540.2% 40,316 598.4% 78,152 568.9%1999 79,539 110.2% 83,498 107.1% 163,037 108.6%
2000 96,364 21.2% 103,127 23.5% 199,491 22.4%2001 138,951 44.2% 143,485 39.1% 282,436 41.6%
Nov. 23, 1982 - Hurricane Iwa hits Kauai.Sept. 11, 1992 - Hurricane Iniki hits Kauai.April 1993 - United Airlines's last report filed with the State DOT Airports Division's Statistician before
suspending its Continental U.S. -- Lihue route.Dec. 1995 - Canada 3000 commenced flying the Canada -- Lihue route.Aug. 18, 1996 - Phoenix Air commenced flying the Midway -- Lihue route.June 10, 1998 - United Airlines resumed flying the Continental U.S. -- Lihue route.Sept. 11, 2001 - Terrorist attacks on the United States (U.S.) led to the closing of all U.S. airports.
AIR-PS

LIHUE AIRPORT PASSENGERS
INTERISLAND AND OVERSEAS
%change %change INTERISLAND from the OVERSEAS from the
previous previous CALENDAR (enplaned yea~s (enplaned yea~s
YEAR and deplaned) total and deplaned) total
1960 30B,291 0 1965 524,512 0
1970 1,112,965 0 1971 1,257,910 13.0% 0 0.0% 1972 1,414,623 12.5% 0 0.0% 1973 1,845,233 30.4% 0 0.0% 1974 1,93B,B5B 5.1% 0 0.0% 1975 1,91B,065 -1.1% 0 0.0% 1976 2,07B,441 B.4% 0 0.0% 1977 2,188,666 5.3% 0 0.0% 1978 2,423,957 10.8% 0 0.0% 1979 2,496,506 3.0% 0 0.0%
19BO 2,211,613 -11.4% 0 0.0% 19B1 2,150,067 -2.B% 0 0.0% 19B2 2,085,056 -3.0% 0 0.0% 19B3 1,B71,758 -10.2% 0 0.0%
• 1984 2,124,B23 13.5% 20,75B 100.0%
(• Overseas passengers from August through December 1984.)
19B5 2,210,520 4.0% 1988 2,471,152 11.B% 19B7 2,592,733 4.9% 19BB 2,629,692 1.4% 19B9 2,752,300 4.7%
1990 2,709,171 -1.6% 1991 2,539,553 -6.3% 1992 2,276,165 -10.4% 1993 1,B30,961 -19.6% 1994 2,301,290 25.7% 1995 2,469,679 7.3% 1996 2,552,925 3.4% 1997 2,56B,660 0.6% 199B 2,561,84B -0.3% 1999 2,610,016 1.9%
2000 2,684,030 2.B% 2001 2,396,461 -10.7%
Nov. 23, 19B2 -Hurricane lwa hits Kauai. Sept.11, 1992- Hurricane lniki hits Kauai.
60,724 192.5% 69,937 15.2% B0,416 15.0% 90,B35 13.0%
124,769 37.4%
139,152 11.5% 157,196 13.0% 106,102 -32.5%
B,666 -91.B% 0 -100.0%
BOB 100.0% B,BB2 999.3%
11,6B3 31.5% 7B,152 56B.9%
163,037 10B.6%
199,491 22.4% 2B2,436 41.6%
TOTAL INTERISLAND
AND OVERSEAS
(enplaned and deplaned)
30B,291 524,512
1,112,965 1,257,910 1,414,623 1,845,233 1,93B,B5B 1,91B,065 2,07B,441 2,188,666 2,423,957 2,496,506
2,211,613 2,150,067 2,0B5,056 1,B71,75B
2,145,5B1
2,271,244 2,541,089 2,673,149 2,720,527 2,Bn.069
2,84B,323 2,696,749 2,382,267 1,B39,627 2,301,290 2,470,487 2,561,807 2,5B0,343 2,840,000 2,773,053
2,BB3,521 2,67B,917
April1993 - Un~ed Airlines's last report filed with the State DOT Airports Division's Statistician before suspending its Continental U.S. - Lihue route.
Dec. 1995 -Canada 3000 commenced flying the Canada- Lihue route. Aug. 1B, 1996 -Phoenix Air commenced flying the Midway- Lihue route. June 10, 199B -United Airlines resumed flying the Continental U.S.- Lihue route. Sept. 11, 2001 -Terrorist attacks on the United States (U.S.) led to the closing of all U.S. airports.
AIR-PS
%change from the previous yea~s
total
13.0% 12.5% 30.4%
5.1% -1.1% B.4% 5.3%
10.B% 3.0%
-11.4% -2.8% -3.0%
-10.2%
14.6%
5.9% 11.9% 5.2% 1.B% 5.B%
-1.0% -5.3%
-11.7% -22.B% 25.1% 7.4% 3.7% 0.7% 2.3% 5.0",4,
4.0% -7.1%

LIHUE AIRPORTCARGO (U.S. tons) INTERISLAND
% change % change % changefrom the from the TOTAL from theprevious previous previous
CALENDAR year's year's (enplaned year'sYEAR ENPLANED total DEPLANED total and deplaned) total
--------------- ---------------------------- ------------ ---------------------------- ------------ ---------------------- ---------------
1960 378 1,940 2,3181965 456 2,337 2,793
1970 663 4,095 4,7581971 634 -4.4% 4,166 1.7% 4,800 0.9%1972 582 -8.2% 4,430 6.3% 5,012 4.4%1973 785 34.9% 5,170 16.7% 5,955 18.8%1974 921 17.3% 6,354 22.9% 7,275 22.2%1975 712 -22.7% 6,357 0.0% 7,069 -2.8%1976 1,371 92.6% 6,895 8.5% 8,266 16.9%1977 1,217 -11.2% 6,395 -7.3% 7,612 -7.9%1978 2,510 106.2% 6,908 8.0% 9,418 23.7%1979 3,495 39.2% 7,634 10.5% 11,129 18.2%
1980 4,178 19.5% 8,682 13.7% 12,860 15.6%1981 3,820 -8.6% 8,321 -4.2% 12,141 -5.6%1982 3,193 -16.4% 7,864 -5.5% 11,057 -8.9%1983 2,837 -11.1% 8,494 8.0% 11,331 2.5%1984 2,767 -2.5% 8,584 1.1% 11,351 0.2%1985 1,782 -35.6% 7,852 -8.5% 9,634 -15.1%1986 2,398 34.6% 8,315 5.9% 10,713 11.2%1987 2,374 -1.0% 10,011 20.4% 12,385 15.6%1988 1,404 -40.9% 10,059 0.5% 11,463 -7.4%1989 1,640 16.8% 11,706 16.4% 13,346 16.4%
1990 1,487 -9.3% 11,774 0.6% 13,261 -0.6%1991 1,411 -5.1% 10,699 -9.1% 12,110 -8.7%1992 2,035 44.2% 13,187 23.3% 15,222 25.7%1993 2,121 4.2% 11,416 -13.4% 13,537 -11.1%1994 3,195 50.6% 10,272 -10.0% 13,467 -0.5%1995 3,474 8.7% 9,413 -8.4% 12,887 -4.3%1996 3,034 -12.7% 9,279 -1.4% 12,313 -4.5%1997 3,843 26.7% 9,341 0.7% 13,184 7.1%1998 5,439 41.5% 9,321 -0.2% 14,760 12.0%1999 5,328 -2.0% 10,066 8.0% 15,394 4.3%
2000 4,827 -9.4% 10,373 3.0% 15,200 -1.3%2001 3,490 -27.7% 9,995 -3.6% 13,485 -11.3%
Nov. 23, 1982 - Hurricane Iwa hits Kauai.Sept. 11, 1992 - Hurricane Iniki hits Kauai.April 1993 - United Airlines's last report filed with the State DOT Airports Division's Statistician before
suspending its Continental U.S. -- Lihue route.Dec. 1995 - Canada 3000 commenced flying the Canada -- Lihue route.Aug. 18, 1996 - Phoenix Air commenced flying the Midway -- Lihue route.June 10, 1998 - United Airlines resumed flying the Continental U.S. -- Lihue route.Sept. 11, 2001 - Terrorist attacks on the United States (U.S.) led to the closing of all U.S. airports.
AIR-PS

LIHUE AIRPORT CARGO (U.S. tons) OVERSEAS
% change % change % changefrom the from the TOTAL from theprevious previous previous
CALENDAR year's year's (enplaned year'sYEAR ENPLANED total DEPLANED total and deplaned) total
--------------- ---------------------------- ------------ ---------------------------- ------------ ---------------------- ---------------
* 1984 9 17 26
(* Only overseas cargo from August through December 1984.)
1985 15 66.7% 45 164.7% 60 130.8%1986 33 120.0% 63 40.0% 96 60.0%1987 100 203.0% 140 122.2% 240 150.0%1988 120 20.0% 267 90.7% 387 61.3%1989 262 118.3% 760 184.6% 1,022 164.1%
1990 259 -1.1% 1,219 60.4% 1,478 44.6%1991 270 4.2% 1,268 4.0% 1,538 4.1%1992 292 8.1% 1,261 -0.6% 1,553 1.0%1993 158 -45.9% 180 -85.7% 338 -78.2%1994 0 -100.0% 0 -100.0% 0 -100.0%1995 0 0.0% 0 0.0% 0 0.0%1996 0 0.0% 0 0.0% 0 0.0%1997 0 0.0% 0 0.0% 0 0.0%1998 0 0.0% 21 100.0% 21 100.0%1999 0 0.0% 100 376.2% 100 376.2%
2000 0 0.0% 84 -16.0% 84 -16.0%2001 0 0.0% 59 -29.8% 59 -29.8%
Nov. 23, 1982 - Hurricane Iwa hits Kauai.Sept. 11, 1992 - Hurricane Iniki hits Kauai.April 1993 - United Airlines's last report filed with the State DOT Airports Division's Statistician before
suspending its Continental U.S. -- Lihue route.Dec. 1995 - Canada 3000 commenced flying the Canada -- Lihue route.Aug. 18, 1996 - Phoenix Air commenced flying the Midway -- Lihue route.June 10, 1998 - United Airlines resumed flying the Continental U.S. -- Lihue route.Sept. 11, 2001 - Terrorist attacks on the United States (U.S.) led to the closing of all U.S. airports.
AIR-PS

LIHUE AIRPORT CARGO (U.S. tons)
INTERISLAND AND OVERSEAS
TOTAL% change % change INTERISLAND % change
INTERISLAND from the OVERSEAS from the AND OVERSEAS from theprevious previous previous
CALENDAR (enplaned year's (enplaned year's (enplaned year'sYEAR and deplaned) total and deplaned) total and deplaned) total
--------------- --------------------------- ----------- --------------------------- ----------- --------------------- ---------------
1960 2,318 --- 2,3181965 2,793 --- 2,793
1970 4,758 --- 4,7581971 4,800 0.9% --- 0.0% 4,800 0.9%1972 5,012 4.4% --- 0.0% 5,012 4.4%1973 5,955 18.8% --- 0.0% 5,955 18.8%1974 7,275 22.2% --- 0.0% 7,275 22.2%1975 7,069 -2.8% --- 0.0% 7,069 -2.8%1976 8,266 16.9% --- 0.0% 8,266 16.9%1977 7,612 -7.9% --- 0.0% 7,612 -7.9%1978 9,418 23.7% --- 0.0% 9,418 23.7%1979 11,129 18.2% --- 0.0% 11,129 18.2%
1980 12,860 15.6% --- 0.0% 12,860 15.6%1981 12,141 -5.6% --- 0.0% 12,141 -5.6%1982 11,057 -8.9% --- 0.0% 11,057 -8.9%1983 11,331 2.5% --- 0.0% 11,331 2.5%
1984 11,351 0.2% 26 100.0% 11,377 0.4%(Direct overseas flights to Lihue started in August 1984.)
1985 9,634 -15.1% 60 130.8% 9,694 -14.8%1986 10,713 11.2% 96 60.0% 10,809 11.5%1987 12,385 15.6% 240 150.0% 12,625 16.8%1988 11,463 -7.4% 387 61.3% 11,850 -6.1%1989 13,346 16.4% 1,022 164.1% 14,368 21.2%
1990 13,261 -0.6% 1,478 44.6% 14,739 2.6%1991 12,110 -8.7% 1,538 4.1% 13,648 -7.4%1992 15,222 25.7% 1,553 1.0% 16,775 22.9%1993 13,537 -11.1% 338 -78.2% 13,875 -17.3%1994 13,467 -0.5% 0 -100.0% 13,467 -2.9%1995 12,887 -4.3% 0 0.0% 12,887 -4.3%1996 12,313 -4.5% 0 0.0% 12,313 -4.5%1997 13,184 7.1% 0 0.0% 13,184 7.1%1998 14,760 12.0% 21 100.0% 14,781 12.1%1999 15,394 4.3% 100 376.2% 15,494 4.8%
2000 15,200 -1.3% 84 -16.0% 15,284 -1.4%2001 13,485 -11.3% 59 -29.8% 13,544 -11.4%
Nov. 23, 1982 - Hurricane Iwa hits Kauai.Sept. 11, 1992 - Hurricane Iniki hits Kauai.April 1993 - United Airlines's last report filed with the State DOT Airports Division's Statistician before
suspending its Continental U.S. -- Lihue route.Dec. 1995 - Canada 3000 commenced flying the Canada -- Lihue route.Aug. 18, 1996 - Phoenix Air commenced flying the Midway -- Lihue route.June 10, 1998 - United Airlines resumed flying the Continental U.S. -- Lihue route.Sept. 11, 2001 - Terrorist attacks on the United States (U.S.) led to the closing of all U.S. airports.
AIR-PS

LIHUE AIRPORT MAIL (U.S. tons) INTERISLAND
% change % change % changefrom the from the TOTAL from theprevious previous previous
CALENDAR year's year's (enplaned year'sYEAR ENPLANED total DEPLANED total and deplaned) total
--------------- ---------------------------- ------------ ---------------------------- ------------ ---------------------- ---------------
1960 41 61 1021965 137 337 474
1970 363 1,214 1,5771971 329 -9.4% 1,215 0.1% 1,544 -2.1%1972 336 2.1% 1,279 5.3% 1,615 4.6%1973 361 7.4% 1,399 9.4% 1,760 9.0%1974 364 0.8% 1,413 1.0% 1,777 1.0%1975 434 19.2% 1,570 11.1% 2,004 12.8%1976 428 -1.4% 1,591 1.3% 2,019 0.7%1977 430 0.5% 1,511 -5.0% 1,941 -3.9%1978 434 0.9% 1,117 -26.1% 1,551 -20.1%1979 691 59.2% 1,018 -8.9% 1,709 10.2%
1980 490 -29.1% 735 -27.8% 1,225 -28.3%1981 471 -3.9% 751 2.2% 1,222 -0.2%1982 451 -4.2% 894 19.0% 1,345 10.1%1983 486 7.8% 1,013 13.3% 1,499 11.4%1984 541 11.3% 924 -8.8% 1,465 -2.3%1985 562 3.9% 840 -9.1% 1,402 -4.3%1986 616 9.6% 929 10.6% 1,545 10.2%1987 625 1.5% 978 5.3% 1,603 3.8%1988 683 9.3% 1,075 9.9% 1,758 9.7%1989 748 9.5% 1,225 14.0% 1,973 12.2%
1990 798 6.7% 1,309 6.9% 2,107 6.8%1991 809 1.4% 1,355 3.5% 2,164 2.7%1992 802 -0.9% 1,644 21.3% 2,446 13.0%1993 821 2.4% 1,651 0.4% 2,472 1.1%1994 852 3.8% 1,698 2.8% 2,550 3.2%1995 846 -0.7% 1,707 0.5% 2,553 0.1%1996 903 6.7% 1,720 0.8% 2,623 2.7%1997 934 3.4% 1,855 7.8% 2,789 6.3%1998 1,041 11.5% 2,116 14.1% 3,157 13.2%1999 1,053 1.2% 2,373 12.1% 3,426 8.5%
2000 4,827 358.4% 10,457 340.7% 15,284 346.1%2001 975 -79.8% 2,270 -78.3% 3,245 -78.8%
Nov. 23, 1982 - Hurricane Iwa hits Kauai.Sept. 11, 1992 - Hurricane Iniki hits Kauai.April 1993 - United Airlines's last report filed with the State DOT Airports Division's Statistician before
suspending its Continental U.S. -- Lihue route.Dec. 1995 - Canada 3000 commenced flying the Canada -- Lihue route.Aug. 18, 1996 - Phoenix Air commenced flying the Midway -- Lihue route.June 10, 1998 - United Airlines resumed flying the Continental U.S. -- Lihue route.Sept. 11, 2001 - Terrorist attacks on the United States (U.S.) led to the closing of all U.S. airports.
AIR-PS

LIHUE AIRPORT MAIL (U.S. tons) OVERSEAS
% change % change % changefrom the from the TOTAL from theprevious previous previous
CALENDAR year's year's (enplaned year'sYEAR ENPLANED total DEPLANED total and deplaned) total
--------------- ---------------------------- ------------ ---------------------------- ------------ ---------------------- ---------------
(No overseas mail were reported in the years prior to Calendar Year 1997.)
1996 0 0.0% 0 0.0% 0 0.0%1997 2 100.0% 1 100.0% 3 100.0%1998 2 0.0% 1 0.0% 3 0.0%1999 0 -100.0% 0 -100.0% 0 -100.0%
2000 0 0.0% 0 0.0% 0 0.0%2001 0 0.0% 0 0.0% 0 0.0%
Nov. 23, 1982 - Hurricane Iwa hits Kauai.Sept. 11, 1992 - Hurricane Iniki hits Kauai.April 1993 - United Airlines's last report filed with the State DOT Airports Division's Statistician before
suspending its Continental U.S. -- Lihue route.Dec. 1995 - Canada 3000 commenced flying the Canada -- Lihue route.Aug. 18, 1996 - Phoenix Air commenced flying the Midway -- Lihue route.June 10, 1998 - United Airlines resumed flying the Continental U.S. -- Lihue route.Sept. 11, 2001 - Terrorist attacks on the United States (U.S.) led to the closing of all U.S. airports.
AIR-PS

LIHUE AIRPORT MAIL (U.S. tons)
INTERISLAND AND OVERSEAS
TOTAL% change % change INTERISLAND % change
INTERISLAND from the OVERSEAS from the AND OVERSEAS from theprevious previous previous
CALENDAR (enplaned year's (enplaned year's (enplaned year'sYEAR and deplaned) total and deplaned) total and deplaned) total
--------------- ---------------------------- ------------ ---------------------------- ------------ ---------------------- ---------------
1960 102 0 1021965 474 0 474
1970 1,577 0 1,5771971 1,544 -2.1% 0 0.0% 1,544 -2.1%1972 1,615 4.6% 0 0.0% 1,615 4.6%1973 1,760 9.0% 0 0.0% 1,760 9.0%1974 1,777 1.0% 0 0.0% 1,777 1.0%1975 2,004 12.8% 0 0.0% 2,004 12.8%1976 2,019 0.7% 0 0.0% 2,019 0.7%1977 1,941 -3.9% 0 0.0% 1,941 -3.9%1978 1,551 -20.1% 0 0.0% 1,551 -20.1%1979 1,709 10.2% 0 0.0% 1,709 10.2%
1980 1,225 -28.3% 0 0.0% 1,225 -28.3%1981 1,222 -0.2% 0 0.0% 1,222 -0.2%1982 1,345 10.1% 0 0.0% 1,345 10.1%1983 1,499 11.4% 0 0.0% 1,499 11.4%1984 1,465 -2.3% 0 0.0% 1,465 -2.3%1985 1,402 -4.3% 0 0.0% 1,402 -4.3%1986 1,545 10.2% 0 0.0% 1,545 10.2%1987 1,603 3.8% 0 0.0% 1,603 3.8%1988 1,758 9.7% 0 0.0% 1,758 9.7%1989 1,973 12.2% 0 0.0% 1,973 12.2%
1990 2,107 6.8% 0 0.0% 2,107 6.8%1991 2,164 2.7% 0 0.0% 2,164 2.7%1992 2,446 13.0% 0 0.0% 2,446 13.0%1993 2,472 1.1% 0 0.0% 2,472 1.1%1994 2,550 3.2% 0 0.0% 2,550 3.2%1995 2,553 0.1% 0 0.0% 2,553 0.1%1996 2,623 2.7% 0 0.0% 2,623 2.7%1997 2,789 6.3% 3 100.0% 2,792 6.4%1998 3,157 13.2% 3 0.0% 3,160 13.2%1999 3,426 8.5% 0 -100.0% 3,426 8.4%
2000 15,284 346.1% 0 0.0% 15,284 346.1%2001 3,245 -78.8% 0 0.0% 3,245 -78.8%
Nov. 23, 1982 - Hurricane Iwa hits Kauai.Sept. 11, 1992 - Hurricane Iniki hits Kauai.April 1993 - United Airlines's last report filed with the State DOT Airports Division's Statistician before
suspending its Continental U.S. -- Lihue route.Dec. 1995 - Canada 3000 commenced flying the Canada -- Lihue route.Aug. 18, 1996 - Phoenix Air commenced flying the Midway -- Lihue route.June 10, 1998 - United Airlines resumed flying the Continental U.S. -- Lihue route.Sept. 11, 2001 - Terrorist attacks on the United States (U.S.) led to the closing of all U.S. airports.
AIR-PS

LIHUE AIRPORT CARGO and MAIL (U.S. tons)INTERISLAND AND OVERSEAS
TOTALCARGO MAIL CARGO + MAIL
Interisland + % change Interisland + % change Interisland + % changeOverseas from the Overseas from the Overseas from the
previous previous previousCALENDAR (enplaned year's (enplaned year's (enplaned year's
YEAR and deplaned) total and deplaned) total and deplaned) total--------------- ---------------------- ------------ ---------------------------- ------------ ---------------------- ---------------
1960 2,318 102 2,4201965 2,793 474 3,267
1970 4,758 1,577 6,3351971 4,800 0.9% 1,544 -2.1% 6,344 0.1%1972 5,012 4.4% 1,615 4.6% 6,627 4.5%1973 5,955 18.8% 1,760 9.0% 7,715 16.4%1974 7,275 22.2% 1,777 1.0% 9,052 17.3%1975 7,069 -2.8% 2,004 12.8% 9,073 0.2%1976 8,266 16.9% 2,019 0.7% 10,285 13.4%1977 7,612 -7.9% 1,941 -3.9% 9,553 -7.1%1978 9,418 23.7% 1,551 -20.1% 10,969 14.8%1979 11,129 18.2% 1,709 10.2% 12,838 17.0%
1980 12,860 15.6% 1,225 -28.3% 14,085 9.7%1981 12,141 -5.6% 1,222 -0.2% 13,363 -5.1%1982 11,057 -8.9% 1,345 10.1% 12,402 -7.2%1983 11,331 2.5% 1,499 11.4% 12,830 3.5%
1984 11,377 0.4% 1,465 -2.3% 12,842 0.1%(Direct overseas flights to Lihue started in August 1984.)ihue commenced in August 1984.)
1985 9,694 -14.8% 1,402 -4.3% 11,096 -13.6%1986 10,809 11.5% 1,545 10.2% 12,354 11.3%1987 12,625 16.8% 1,603 3.8% 14,228 15.2%1988 11,850 -6.1% 1,758 9.7% 13,608 -4.4%1989 14,368 21.2% 1,973 12.2% 16,341 20.1%
1990 14,739 2.6% 2,107 6.8% 16,846 3.1%1991 13,648 -7.4% 2,164 2.7% 15,812 -6.1%1992 16,775 22.9% 2,446 13.0% 19,221 21.6%1993 13,875 -17.3% 2,472 1.1% 16,347 -15.0%1994 13,467 -2.9% 2,550 3.2% 16,017 -2.0%1995 12,887 -4.3% 2,553 0.1% 15,440 -3.6%1996 12,313 -4.5% 2,623 2.7% 14,936 -3.3%1997 13,184 7.1% 2,792 6.4% 15,976 7.0%1998 14,781 12.1% 3,160 13.2% 17,941 12.3%1999 15,494 4.8% 3,426 8.4% 18,920 5.5%
2000 15,284 -1.4% 15,284 346.1% 30,568 61.6%2001 13,544 -11.4% 3,245 -78.8% 16,789 -45.1%
Nov. 23, 1982 - Hurricane Iwa hits Kauai.Sept. 11, 1992 - Hurricane Iniki hits Kauai.April 1993 - United Airlines's last report filed with the State DOT Airports Division's Statistician before
suspending its Continental U.S. -- Lihue route.Dec. 1995 - Canada 3000 commenced flying the Canada -- Lihue route.Aug. 18, 1996 - Phoenix Air commenced flying the Midway -- Lihue route.June 10, 1998 - United Airlines resumed flying the Continental U.S. -- Lihue route.Sept. 11, 2001 - Terrorist attacks on the United States (U.S.) led to the closing of all U.S. airports.
AIR-PS

LIHUE AIRPORT CARGO and MAIL (U.S. tons) INTERISLAND AND OVERSEAS
TOTALCARGO + MAIL
CARGO + MAIL % change CARGO + MAIL % change Interisland + % changeInterisland from the Overseas from the Overseas from the
previous previous previousCALENDAR (enplaned year's (enplaned year's (enplaned year's
YEAR and deplaned) total and deplaned) total and deplaned) total--------------- ---------------------------- ------------ ---------------------------- ------------ ---------------------- ---------------
1960 2,420 --- 2,4201965 3,267 --- 3,267
1970 6,335 --- 6,3351971 6,344 0.1% --- 0.0% 6,344 0.1%1972 6,627 4.5% --- 0.0% 6,627 4.5%1973 7,715 16.4% --- 0.0% 7,715 16.4%1974 9,052 17.3% --- 0.0% 9,052 17.3%1975 9,073 0.2% --- 0.0% 9,073 0.2%1976 10,285 13.4% --- 0.0% 10,285 13.4%1977 9,553 -7.1% --- 0.0% 9,553 -7.1%1978 10,969 14.8% --- 0.0% 10,969 14.8%1979 12,838 17.0% --- 0.0% 12,838 17.0%
1980 14,085 9.7% --- 0.0% 14,085 9.7%1981 13,363 -5.1% --- 0.0% 13,363 -5.1%1982 12,402 -7.2% --- 0.0% 12,402 -7.2%1983 12,830 3.5% --- 0.0% 12,830 3.5%
1984 12,816 -0.1% 26 100.0% 12,842 0.1%(Direct overseas flights to Lihue started in August 1984.)
1985 11,036 -13.9% 60 130.8% 11,096 -13.6%1986 12,258 11.1% 96 60.0% 12,354 11.3%1987 13,988 14.1% 240 150.0% 14,228 15.2%1988 13,221 -5.5% 387 61.3% 13,608 -4.4%1989 15,319 15.9% 1,022 164.1% 16,341 20.1%
1990 15,368 0.3% 1,478 44.6% 16,846 3.1%1991 14,274 -7.1% 1,538 4.1% 15,812 -6.1%1992 17,668 23.8% 1,553 1.0% 19,221 21.6%1993 16,009 -9.4% 338 -78.2% 16,347 -15.0%1994 16,017 0.0% 0 -100.0% 16,017 -2.0%1995 15,440 -3.6% 0 0.0% 15,440 -3.6%1996 14,936 -3.3% 0 0.0% 14,936 -3.3%1997 15,973 6.9% 3 100.0% 15,976 7.0%1998 17,917 12.2% 24 700.0% 17,941 12.3%1999 18,820 5.0% 100 316.7% 18,920 5.5%
2000 30,484 62.0% 84 -16.0% 30,568 61.6%2001 16,730 -45.1% 59 -29.8% 16,789 -45.1%
Nov. 23, 1982 - Hurricane Iwa hits Kauai.Sept. 11, 1992 - Hurricane Iniki hits Kauai.April 1993 - United Airlines's last report filed with the State DOT Airports Division's Statistician before
suspending its Continental U.S. -- Lihue route.Dec. 1995 - Canada 3000 commenced flying the Canada -- Lihue route.Aug. 18, 1996 - Phoenix Air commenced flying the Midway -- Lihue route.June 10, 1998 - United Airlines resumed flying the Continental U.S. -- Lihue route.Sept. 11, 2001 - Terrorist attacks on the United States (U.S.) led to the closing of all U.S. airports.
AIR-PS

LIHUE AIRPORT AIRCRAFT OPERATIONS BY TYPE
% change % change % change % change % changefrom the from the from the from the from theprevious previous previous previous previous
CALENDAR AIR year's AIR year's GENERAL year's year's year'sYEAR CARRIER total TAXI total AVIATION total MILITARY total TOTAL total
-------------- -------------- ----------- -------------- ----------- -------------- ----------- -------------- ----------- -------------- --------------
* 1971 19,090 3,111 13,436 3,232 38,869
(Air Traffic Control Tower opened in 1971. Air taxi operations were combined with general aviation operationsuntil July 1971, when they were separated.)
1972 20,993 10.0% 8,058 159.0% 9,932 -26.1% 4,333 34.1% 43,316 11.4%1973 24,136 15.0% 9,221 14.4% 17,843 79.7% 6,449 48.8% 57,649 33.1%1974 21,994 -8.9% 10,003 8.5% 12,901 -27.7% 5,923 -8.2% 50,821 -11.8%1975 23,629 7.4% 14,137 41.3% 11,085 -14.1% 4,505 -23.9% 53,356 5.0%1976 24,346 3.0% 20,094 42.1% 10,692 -3.5% 3,733 -17.1% 58,865 10.3%1977 25,190 3.5% 22,544 12.2% 14,840 38.8% 3,062 -18.0% 65,636 11.5%1978 26,841 6.6% 27,583 22.4% 17,449 17.6% 2,710 -11.5% 74,583 13.6%1979 27,123 1.1% 25,609 -7.2% 16,371 -6.2% 1,930 -28.8% 71,033 -4.8%
1980 23,999 -11.5% 24,308 -5.1% 13,037 -20.4% 1,485 -23.1% 62,829 -11.5%1981 20,856 -13.1% 28,063 15.4% 9,091 -30.3% 1,394 -6.1% 59,404 -5.5%1982 16,214 -22.3% 35,559 26.7% 12,082 32.9% 1,450 4.0% 65,305 9.9%1983 17,190 6.0% 44,838 26.1% 8,272 -31.5% 1,439 -0.8% 71,739 9.9%1984 21,848 27.1% 67,403 50.3% 9,692 17.2% 2,049 42.4% 100,992 40.8%1985 27,224 24.6% 80,665 19.7% 13,006 34.2% 10,860 430.0% 131,755 30.5%1986 41,750 53.4% 82,244 2.0% 11,622 -10.6% 8,289 -23.7% 143,905 9.2%1987 44,599 6.8% 70,813 -13.9% 10,730 -7.7% 8,353 0.8% 134,495 -6.5%1988 34,169 -23.4% 71,133 0.5% 8,468 -21.1% 8,498 1.7% 122,268 -9.1%1989 32,433 -5.1% 70,526 -0.9% 7,599 -10.3% 6,184 -27.2% 116,742 -4.5%
1990 34,656 6.9% 63,754 -9.6% 8,230 8.3% 7,220 16.8% 113,860 -2.5%1991 30,825 -11.1% 64,341 0.9% 11,027 34.0% 6,486 -10.2% 112,679 -1.0%1992 29,564 -4.1% 48,387 -24.8% 16,172 46.7% 9,563 47.4% 103,686 -8.0%1993 20,139 -31.9% 33,751 -30.2% 7,053 -56.4% 9,967 4.2% 70,910 -31.6%1994 24,133 19.8% 54,199 60.6% 7,674 8.8% 5,576 -44.1% 91,582 29.2%1995 27,788 15.1% 56,024 3.4% 9,597 25.1% 3,991 -28.4% 97,400 6.4%1996 29,246 5.2% 60,489 8.0% 12,705 32.4% 3,892 -2.5% 106,332 9.2%1997 29,996 2.6% 60,267 -0.4% 17,259 35.8% 3,827 -1.7% 111,349 4.7%1998 30,691 2.3% 55,953 -7.2% 15,951 -7.6% 3,384 -11.6% 105,979 -4.8%1999 33,173 8.1% 58,778 5.0% 18,995 19.1% 4,577 35.3% 115,523 9.0%
2000 33,645 1.4% 57,883 -1.5% 17,800 -6.3% 4,522 -1.2% 113,850 -1.4%2001 30,593 -9.1% 55,586 -4.0% 12,230 -31.3% 5,246 16.0% 103,655 -9.0%
Nov. 23, 1982 - Hurricane Iwa hits Kauai.Sept. 11, 1992 - Hurricane Iniki hits Kauai.April 1993 - United Airlines's last report filed with the State DOT Airports Division's Statistician before
suspending its Continental U.S. -- Lihue route.Dec. 1995 - Canada 3000 commenced flying the Canada -- Lihue route.Aug. 18, 1996 - Phoenix Air commenced flying the Midway -- Lihue route.June 10, 1998 - United Airlines resumed flying the Continental U.S. -- Lihue route.Sept. 11, 2001 - Terrorist attacks on the United States (U.S.) led to the closing of all U.S. airports.
AIR-PS

MOLOKAI AIRPORT PASSENGERS INTERISLAND
% change % change % changefrom the from the TOTAL from theprevious previous previous
CALENDAR year's year's (enplaned year'sYEAR ENPLANED total DEPLANED total and deplaned) total
--------------- ---------------------------- ------------ ---------------------------- ------------ ---------------------- ---------------
1960 27,949 28,149 56,0981965 35,729 35,885 71,614
1970 77,542 77,940 155,4821971 82,372 6.2% 83,538 7.2% 165,910 6.7%1972 74,076 -10.1% 75,206 -10.0% 149,282 -10.0%1973 71,894 -2.9% 73,480 -2.3% 145,374 -2.6%1974 68,514 -4.7% 69,453 -5.5% 137,967 -5.1%1975 76,384 11.5% 77,186 11.1% 153,570 11.3%1976 79,181 3.7% 80,413 4.2% 159,594 3.9%1977 96,268 21.6% 99,016 23.1% 195,284 22.4%1978 132,438 37.6% 144,234 45.7% 276,672 41.7%1979 124,204 -6.2% 134,925 -6.5% 259,129 -6.3%
1980 94,658 -23.8% 94,865 -29.7% 189,523 -26.9%1981 84,598 -10.6% 86,025 -9.3% 170,623 -10.0%1982 123,230 45.7% 126,403 46.9% 249,633 46.3%1983 118,654 -3.7% 120,139 -5.0% 238,793 -4.3%1984 135,665 14.3% 136,678 13.8% 272,343 14.0%1985 170,300 25.5% 170,532 24.8% 340,832 25.1%1986 164,262 -3.5% 165,913 -2.7% 330,175 -3.1%1987 162,300 -1.2% 164,591 -0.8% 326,891 -1.0%1988 165,038 1.7% 166,965 1.4% 332,003 1.6%1989 168,112 1.9% 170,868 2.3% 338,980 2.1%
1990 164,472 -2.2% 166,777 -2.4% 331,249 -2.3%1991 156,890 -4.6% 159,686 -4.3% 316,576 -4.4%1992 156,041 -0.5% 158,448 -0.8% 314,489 -0.7%1993 139,012 -10.9% 141,032 -11.0% 280,044 -11.0%1994 128,466 -7.6% 125,054 -11.3% 253,520 -9.5%1995 121,371 -5.5% 121,760 -2.6% 243,131 -4.1%1996 121,872 0.4% 125,605 3.2% 247,477 1.8%1997 125,471 3.0% 126,766 0.9% 252,237 1.9%1998 124,917 -0.4% 127,675 0.7% 252,592 0.1%1999 132,540 6.1% 137,212 7.5% 269,752 6.8%
2000 126,810 -4.3% 131,165 -4.4% 257,975 -4.4%2001 106,898 -15.7% 108,740 -17.1% 215,638 -16.4%
Sept. 11, 2001 - Terrorist attacks on the United States (U.S.) led to the closing of all U.S. airports.
AIR-PS

MOLOKAI AIRPORT CARGO (U.S. tons) INTERISLAND
% change % change % changefrom the from the TOTAL from theprevious previous previous
CALENDAR year's year's (enplaned year'sYEAR ENPLANED total DEPLANED total and deplaned) total
--------------- ---------------------------- ------------ ---------------------------- ------------ ---------------------- ---------------
1960 169 450 6191965 381 658 1,039
1970 574 910 1,4841971 300 -47.7% 527 -42.1% 827 -44.3%1972 254 -15.3% 556 5.5% 810 -2.1%1973 259 2.0% 591 6.3% 850 4.9%1974 312 20.5% 709 20.0% 1,021 20.1%1975 522 67.3% 726 2.4% 1,248 22.2%1976 405 -22.4% 637 -12.3% 1,042 -16.5%1977 330 -18.5% 547 -14.1% 877 -15.8%1978 374 13.3% 481 -12.1% 855 -2.5%1979 383 2.4% 613 27.4% 996 16.5%
1980 349 -8.9% 597 -2.6% 946 -5.0%1981 481 37.8% 693 16.1% 1,174 24.1%1982 319 -33.7% 444 -35.9% 763 -35.0%1983 138 -56.7% 220 -50.5% 358 -53.1%1984 157 13.8% 349 58.6% 506 41.3%1985 160 1.9% 276 -20.9% 436 -13.8%1986 219 36.9% 250 -9.4% 469 7.6%1987 233 6.4% 254 1.6% 487 3.8%1988 319 36.9% 380 49.6% 699 43.5%1989 314 -1.6% 452 18.9% 766 9.6%
1990 328 4.5% 455 0.7% 783 2.2%1991 367 11.9% 587 29.0% 954 21.8%1992 272 -25.9% 792 34.9% 1,064 11.5%1993 149 -45.2% 382 -51.8% 531 -50.1%1994 168 12.8% 381 -0.3% 549 3.4%1995 162 -3.6% 397 4.2% 559 1.8%1996 126 -22.2% 555 39.8% 681 21.8%1997 263 108.7% 710 27.9% 973 42.9%1998 319 21.3% 888 25.1% 1,207 24.0%1999 441 38.2% 967 8.9% 1,408 16.7%
2000 485 10.0% 847 -12.4% 1,332 -5.4%2001 486 0.2% 836 -1.3% 1,322 -0.8%
Sept. 11, 2001 - Terrorist attacks on the United States (U.S.) led to the closing of all U.S. airports.
AIR-PS
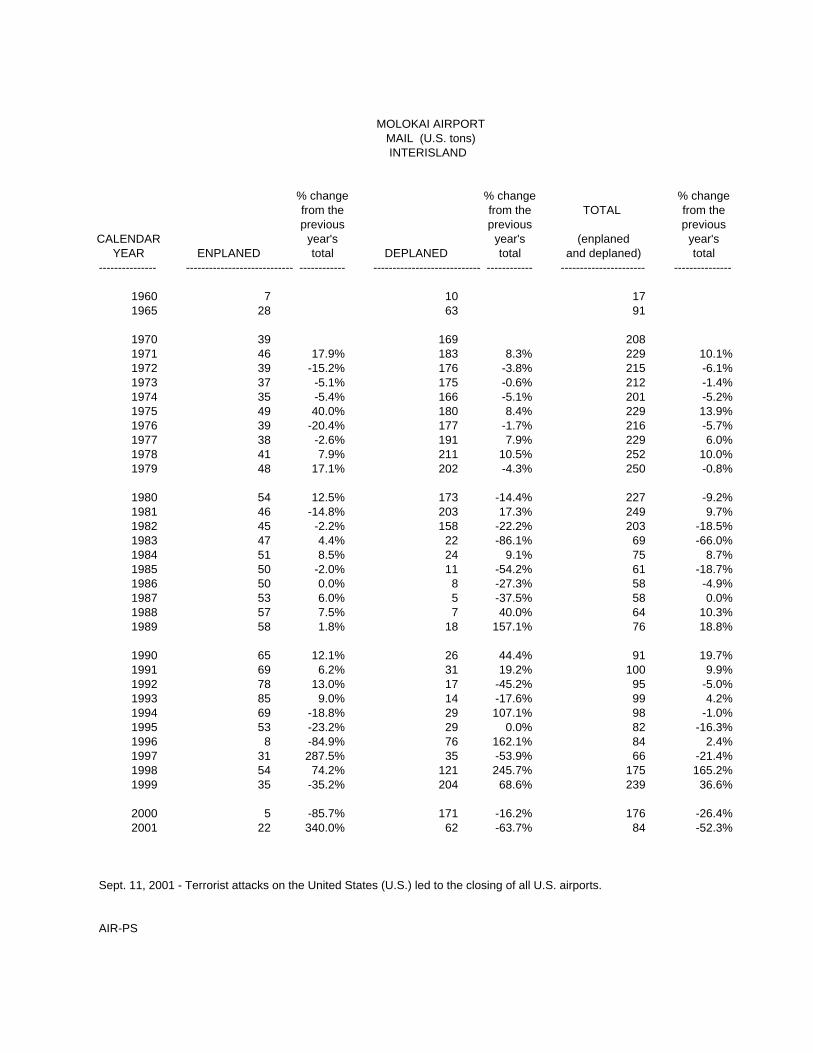
MOLOKAI AIRPORT MAIL (U.S. tons) INTERISLAND
% change % change % changefrom the from the TOTAL from theprevious previous previous
CALENDAR year's year's (enplaned year'sYEAR ENPLANED total DEPLANED total and deplaned) total
--------------- ---------------------------- ------------ ---------------------------- ------------ ---------------------- ---------------
1960 7 10 171965 28 63 91
1970 39 169 2081971 46 17.9% 183 8.3% 229 10.1%1972 39 -15.2% 176 -3.8% 215 -6.1%1973 37 -5.1% 175 -0.6% 212 -1.4%1974 35 -5.4% 166 -5.1% 201 -5.2%1975 49 40.0% 180 8.4% 229 13.9%1976 39 -20.4% 177 -1.7% 216 -5.7%1977 38 -2.6% 191 7.9% 229 6.0%1978 41 7.9% 211 10.5% 252 10.0%1979 48 17.1% 202 -4.3% 250 -0.8%
1980 54 12.5% 173 -14.4% 227 -9.2%1981 46 -14.8% 203 17.3% 249 9.7%1982 45 -2.2% 158 -22.2% 203 -18.5%1983 47 4.4% 22 -86.1% 69 -66.0%1984 51 8.5% 24 9.1% 75 8.7%1985 50 -2.0% 11 -54.2% 61 -18.7%1986 50 0.0% 8 -27.3% 58 -4.9%1987 53 6.0% 5 -37.5% 58 0.0%1988 57 7.5% 7 40.0% 64 10.3%1989 58 1.8% 18 157.1% 76 18.8%
1990 65 12.1% 26 44.4% 91 19.7%1991 69 6.2% 31 19.2% 100 9.9%1992 78 13.0% 17 -45.2% 95 -5.0%1993 85 9.0% 14 -17.6% 99 4.2%1994 69 -18.8% 29 107.1% 98 -1.0%1995 53 -23.2% 29 0.0% 82 -16.3%1996 8 -84.9% 76 162.1% 84 2.4%1997 31 287.5% 35 -53.9% 66 -21.4%1998 54 74.2% 121 245.7% 175 165.2%1999 35 -35.2% 204 68.6% 239 36.6%
2000 5 -85.7% 171 -16.2% 176 -26.4%2001 22 340.0% 62 -63.7% 84 -52.3%
Sept. 11, 2001 - Terrorist attacks on the United States (U.S.) led to the closing of all U.S. airports.
AIR-PS

MOLOKAI AIRPORT CARGO and MAIL (U.S. tons) CARGO and MAIL (U.S. tons)
INTERISLAND INTERISLAND
TOTALCARGO % change MAIL % change CARGO + MAIL % change
Interisland from the Interisland from the Interisland from theprevious previous previous
CALENDAR (enplaned year's (enplaned year's (enplaned year'sYEAR and deplaned) total and deplaned) total and deplaned) total
--------------- ---------------------------- ------------ ---------------------------- ------------ ---------------------- ---------------
1960 619 17 6361965 1,039 91 1,130
1970 1,484 208 1,6921971 827 -44.3% 229 10.1% 1,056 -37.6%1972 810 -2.1% 215 -6.1% 1,025 -2.9%1973 850 4.9% 212 -1.4% 1,062 3.6%1974 1,021 20.1% 201 -5.2% 1,222 15.1%1975 1,248 22.2% 229 13.9% 1,477 20.9%1976 1,042 -16.5% 216 -5.7% 1,258 -14.8%1977 877 -15.8% 229 6.0% 1,106 -12.1%1978 855 -2.5% 252 10.0% 1,107 0.1%1979 996 16.5% 250 -0.8% 1,246 12.6%
1980 946 -5.0% 227 -9.2% 1,173 -5.9%1981 1,174 24.1% 249 9.7% 1,423 21.3%1982 763 -35.0% 203 -18.5% 966 -32.1%1983 358 -53.1% 69 -66.0% 427 -55.8%1984 506 41.3% 75 8.7% 581 36.1%1985 436 -13.8% 61 -18.7% 497 -14.5%1986 469 7.6% 58 -4.9% 527 6.0%1987 487 3.8% 58 0.0% 545 3.4%1988 699 43.5% 64 10.3% 763 40.0%1989 766 9.6% 76 18.8% 842 10.4%
1990 783 2.2% 91 19.7% 874 3.8%1991 954 21.8% 100 9.9% 1,054 20.6%1992 1,064 11.5% 95 -5.0% 1,159 10.0%1993 531 -50.1% 99 4.2% 630 -45.6%1994 549 3.4% 98 -1.0% 647 2.7%1995 559 1.8% 82 -16.3% 641 -0.9%1996 681 21.8% 84 2.4% 765 19.3%1997 973 42.9% 66 -21.4% 1,039 35.8%1998 1,207 24.0% 175 165.2% 1,382 33.0%1999 1,408 16.7% 239 36.6% 1,647 19.2%
2000 1332 -5.4% 176 -26.4% 1508 -8.4%2001 1322 -0.8% 84 -52.3% 1406 -6.8%
Sept. 11, 2001 - Terrorist attacks on the United States (U.S.) led to the closing of all U.S. airports.
AIR-PS

MOLOKAI AIRPORTAIRCRAFT OPERATIONS BY TYPE
% change % change % change % change % changefrom the from the from the from the from theprevious previous previous previous previous
CALENDAR AIR year's AIR year's GENERAL year's year's year'sYEAR CARRIER total TAXI total AVIATION total MILITARY total TOTAL total
--------------- ---------------------- --------------- --------------- ------------ --------------- ------------ --------------- ------------ --------------- ---------------
(Air Traffic Control Tower opened on July 13, 1978)
1978 1,982 22,864 6,543 1,412 32,801
1979 5,137 159.2% 49,146 114.9% 14,779 125.9% 2,962 109.8% 72,024 119.6%
1980 4,264 -17.0% 45,338 -7.7% 13,063 -11.6% 5,096 72.0% 67,761 -5.9%1981 3,860 -9.5% 44,497 -1.9% 11,013 -15.7% 2,506 -50.8% 61,876 -8.7%1982 6,563 70.0% 43,963 -1.2% 14,203 29.0% 4,413 76.1% 69,142 11.7%1983 4,407 -32.9% 37,034 -15.8% 11,114 -21.7% 2,327 -47.3% 54,882 -20.6%1984 5,000 13.5% 34,533 -6.8% 10,429 -6.2% 3,551 52.6% 53,513 -2.5%1985 4,884 -2.3% 38,669 12.0% 8,693 -16.6% 3,802 7.1% 56,048 4.7%1986 5,471 12.0% 35,913 -7.1% 8,267 -4.9% 2,617 -31.2% 52,268 -6.7%
1987 5,916 8.1% 34,473 -4.0% 8,334 0.8% 2,106 -19.5% 50,829 -2.8%
(* 12/08/87 - FAA Directive: An aircraft with 60 seats or less is to be designated an air taxi even if the aircraft is operated by a designated air carrier.)
1988 * 7 -99.9% 39,962 15.9% 8,473 1.7% 2,014 -4.4% 50,456 -0.7%1989 14 100.0% 35,743 -10.6% 9,295 9.7% 2,156 7.1% 47,208 -6.4%
1990 12 -14.3% 33,145 -7.3% 9,121 -1.9% 1,231 -42.9% 43,509 -7.8%1991 124 933.3% 35,304 6.5% 10,367 13.7% 2,103 70.8% 47,898 10.1%1992 148 19.4% 23,644 -33.0% 9,553 -7.9% 2,317 10.2% 35,662 -25.5%1993 100 -32.4% 26,512 12.1% 9,465 -0.9% 2,980 28.6% 39,057 9.5%1994 1,445 1345.0% 25,637 -3.3% 8,452 -10.7% 2,835 -4.9% 38,369 -1.8%1995 1,194 -17.4% 30,365 18.4% 9,460 11.9% 4,498 58.7% 45,517 18.6%1996 1,003 -16.0% 34,753 14.5% 10,744 13.6% 2,721 -39.5% 49,221 8.1%1997 1,017 1.4% 31,290 -10.0% 10,844 0.9% 1,516 -44.3% 44,667 -9.3%1998 1,163 14.4% 30,080 -3.9% 15,425 42.2% 2,685 77.1% 49,353 10.5%1999 1,469 26.3% 30,286 0.7% 14,169 -8.1% 3,260 21.4% 49,184 -0.3%
2000 1,484 1.0% 27,385 -9.6% 11,869 -16.2% 3,953 21.3% 44,691 -9.1%2001 1,138 -23.3% 26,890 -1.8% 12,532 5.6% 3,246 -17.9% 43,806 -2.0%
Sept. 11, 2001 - Terrorist attacks on the United States (U.S.) led to the closing of all U.S. airports.
AIR-PS

LANAI AIRPORT PASSENGERS INTERISLAND
% change % change % changefrom the from the TOTAL from theprevious previous previous
CALENDAR year's year's (enplaned year'sYEAR ENPLANED total DEPLANED total and deplaned) total
--------------- ---------------------------- ------------ ---------------------------- ------------ ---------------------- ---------------
1983 22,401 22,543 44,9441984 24,430 9.1% 24,344 8.0% 48,774 8.5%1985 26,459 8.3% 26,442 8.6% 52,901 8.5%1986 24,917 -5.8% 25,286 -4.4% 50,203 -5.1%1987 28,152 13.0% 29,131 15.2% 57,283 14.1%1988 48,085 70.8% 47,411 62.8% 95,496 66.7%1989 51,852 7.8% 52,708 11.2% 104,560 9.5%
1990 56,240 8.5% 56,599 7.4% 112,839 7.9%1991 63,125 12.2% 64,332 13.7% 127,457 13.0%1992 69,171 9.6% 69,501 8.0% 138,672 8.8%1993 71,220 3.0% 71,375 2.7% 142,595 2.8%1994 81,990 15.1% 89,252 25.0% 171,242 20.1%1995 83,138 1.4% 86,544 -3.0% 169,682 -0.9%1996 82,882 -0.3% 85,037 -1.7% 167,919 -1.0%1997 88,777 7.1% 89,626 5.4% 178,403 6.2%1998 88,035 -0.8% 88,584 -1.2% 176,619 -1.0%1999 88,598 0.6% 87,043 -1.7% 175,641 -0.6%
2000 81,409 -8.1% 81,383 -6.5% 162,792 -7.3%2001 72,714 -10.7% 72,822 -10.5% 145,536 -10.6%
Sept. 11, 2001 - Terrorist attacks on the United States (U.S.) led to the closing of all U.S. airports.
AIR-PS

LANAI AIRPORTCARGO (U.S. tons) INTERISLAND
% change % change % changefrom the from the TOTAL from theprevious previous previous
CALENDAR year's year's (enplaned year'sYEAR ENPLANED total DEPLANED total and deplaned) total
--------------- ---------------------------- ------------ ---------------------------- ------------ ---------------------- ---------------
1984 4 106 1101985 3 -25.0% 36 -66.0% 39 -64.5%1986 3 0.0% 14 -61.1% 17 -56.4%1987 11 266.7% 40 185.7% 51 200.0%1988 15 36.4% 106 165.0% 121 137.3%1989 28 86.7% 681 542.5% 709 486.0%
1990 31 10.7% 579 -15.0% 610 -14.0%1991 63 103.2% 1,542 166.3% 1,605 163.1%1992 66 4.8% 1,612 4.5% 1,678 4.5%1993 33 -50.0% 468 -71.0% 501 -70.1%1994 24 -27.3% 668 42.7% 692 38.1%1995 6 -75.0% 589 -11.8% 595 -14.0%1996 19 216.7% 509 -13.6% 528 -11.3%1997 154 710.5% 721 41.7% 875 65.7%1998 136 -11.7% 717 -0.6% 853 -2.5%1999 112 -17.6% 665 -7.3% 777 -8.9%
2000 76 -32.1% 642 -3.5% 718 -7.6%2001 73 -3.9% 612 -4.7% 685 -4.6%
Sept. 11, 2001 - Terrorist attacks on the United States (U.S.) led to the closing of all U.S. airports.
AIR-PS

LANAI AIRPORT MAIL (U.S. tons) INTERISLAND
% change % change % changefrom the from the TOTAL from theprevious previous previous
CALENDAR year's year's (enplaned year'sYEAR ENPLANED total DEPLANED total and deplaned) total
--------------- ---------------------------- ------------ ---------------------------- ------------ ---------------------- ---------------
1984 4 0 41985 4 0.0% 0 0.0% 4 0.0%1986 4 0.0% 0 0.0% 4 0.0%1987 7 75.0% 0 0.0% 7 75.0%1988 8 14.3% 1 100.0% 9 28.6%1989 4 -50.0% 0 -100.0% 4 -55.6%
1990 6 50.0% 0 0.0% 6 50.0%1991 15 150.0% 2 100.0% 17 183.3%1992 26 73.3% 10 400.0% 36 111.8%1993 23 -11.5% 3 -70.0% 26 -27.8%1994 21 -8.7% 16 433.3% 37 42.3%1995 0 -100.0% 66 312.5% 66 78.4%1996 6 100.0% 83 25.8% 89 34.8%1997 37 516.7% 31 -62.7% 68 -23.6%1998 38 2.7% 74 138.7% 112 64.7%1999 15 -60.5% 113 52.7% 128 14.3%
2000 1 -93.3% 99 -12.4% 100 -21.9%2001 9 800.0% 37 -62.6% 46 -54.0%
Sept. 11, 2001 - Terrorist attacks on the United States (U.S.) led to the closing of all U.S. airports.
AIR-PS

LANAI AIRPORT CARGO and MAIL (U.S. tons)
INTERISLAND
TOTALCARGO % change MAIL % change CARGO + MAIL % change
Interisland from the Interisland from the Interisland from theprevious previous previous
CALENDAR (enplaned year's (enplaned year's (enplaned year'sYEAR and deplaned) total and deplaned) total and deplaned) total
--------------- ---------------------------- ------------ ---------------------------- ------------ ---------------------- ---------------
1984 110 4 1141985 39 -64.5% 4 0.0% 43 -62.3%1986 17 -56.4% 4 0.0% 21 -51.2%1987 51 200.0% 7 75.0% 58 176.2%1988 121 137.3% 9 28.6% 130 124.1%1989 709 486.0% 4 -55.6% 713 448.5%
1990 610 -14.0% 6 50.0% 616 -13.6%1991 1,605 163.1% 17 183.3% 1,622 163.3%1992 1,678 4.5% 36 111.8% 1,714 5.7%1993 501 -70.1% 26 -27.8% 527 -69.3%1994 692 38.1% 37 42.3% 729 38.3%1995 595 -14.0% 66 78.4% 661 -9.3%1996 528 -11.3% 89 34.8% 617 -6.7%1997 875 65.7% 68 -23.6% 943 52.8%1998 853 -2.5% 112 64.7% 965 2.3%1999 777 -8.9% 128 14.3% 905 -6.2%
2000 718 -7.6% 100 -21.9% 818 -9.6%2001 685 -4.6% 46 -54.0% 731 -10.6%
Sept. 11, 2001 - Terrorist attacks on the United States (U.S.) led to the closing of all U.S. airports.
AIR-PS