Embed Size (px)
Citation preview

The State of B2BAccount ExperienceTM
B2B NPS® & CX Benchmarks Report

The State of B2B Account ExperienceB2B NPS® & CX Benchmarks Report
Account Experience is a trademark of CustomerGauge. Net Promoter, NPS, and Net Promoter Score are trademarks of Satmetrix Systems, Inc., Bain & Company, and Fred Reichheld.
TM
Copyright CustomerGauge © 2021. All rights reserved. First edition. Originally published for digital in the United States on August 2021.

3 | The State of B2B Account Experience
INTROINTROAbout The B2B NPS & CX Report a Note From Our Founders...

Welcome to our B2B Account ExperienceTM Benchmarks Report. While we’re not necessarily in the business of benchmarking, we’ve decided to take on the admittedly large task for B2B. Why? In our talks with our customers and analyst firms like Gartner over the years, we have realized there is a massive need (and appetite) in the market for reliable and comprehensive B2B benchmarks.
I’m proud to announce CustomerGauge now offers the most comprehensive B2B Experience Benchmarks on the planet.
So what makes these benchmarks so comprehensive? We painstakingly conducted B2B experience program assessments with over 776 companies across the globe of varying sizes and industries. In these assessments, we asked companies over 30+ specific questions about their experience program. We wanted to know how they collected feedback, what methodologies they used, how quickly they closed the loop, and if they produced an ROI as a result of their program—and the results will certainly change the way B2B companies approach experience for years to come.
But we didn’t stop there.
We decided to take our extensive anonymous B2B customer benchmark data and combine it with this already rich benchmarks database to form the most comprehensive and high-quality depository of B2B experience benchmarks ever created. We won’t give all the revelations away, but one stat that really jumped out at us was that
62% of all B2B companies still can’t produce an ROI as a result of their experience programs.
While this may seem disheartening for some, we’ve used it as motivation to accelerate our transformation of the B2B experience landscape. We’ve crafted a new path forward for B2B companies to not only produce an ROI from their programs, but transform their culture based on account feedback and it’s called Account Experience (AX). But you’ll hear more about this later.
Thanks again to all of the companies who participated in the assessment and spotlight phases of this B2B benchmark research. We hope the insights will help you push for necessary changes in your B2B organization so we all can lead with an experience-first mindset in 2021 and beyond.
Adam DorrellCEO & Co Founder COO & Co Founder
Camilla Scholten
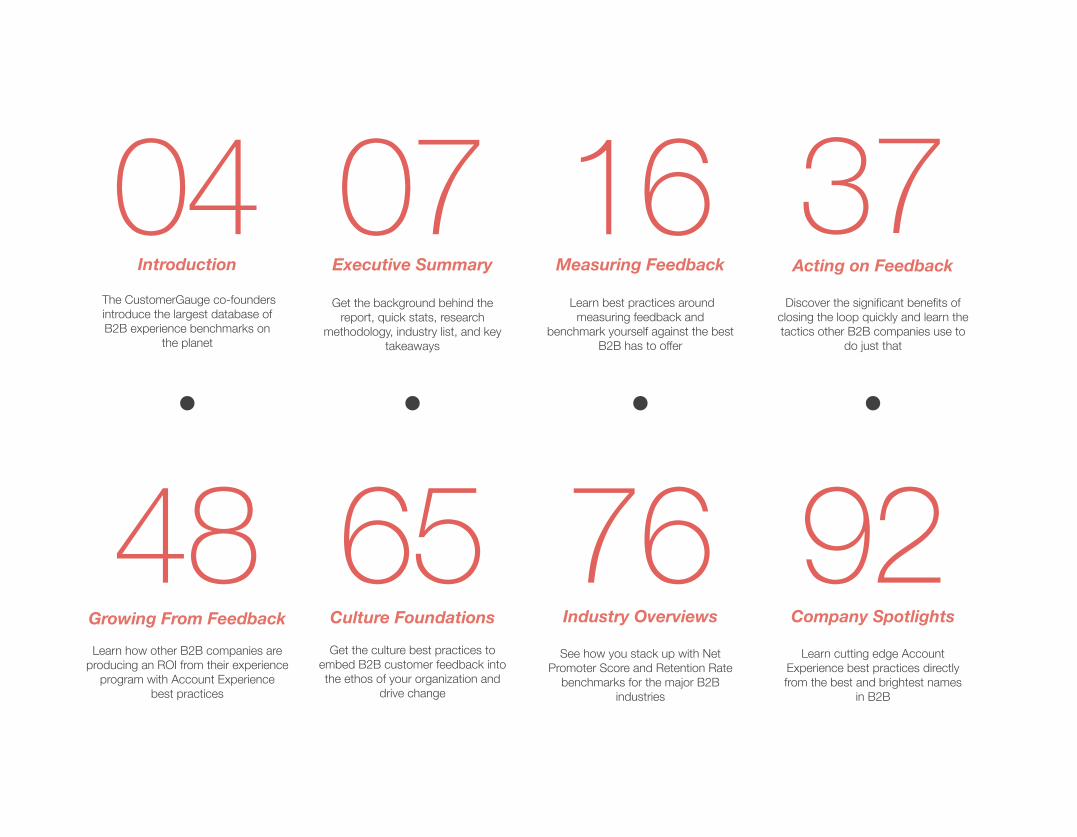
The Most Comprehensive B2B Experience Benchmarks on the PlanetIntroduction

TABLE OFCONTENTSTABLE OFCONTENTS
16
76
37
92
Acting on Feedback
Industry OverviewsGrowing From Feedback Company Spotlights
04
48
07
65
Introduction Executive Summary Measuring Feedback
Culture Foundations
The CustomerGauge co-founders introduce the largest database of B2B experience benchmarks on
the planet
Learn how other B2B companies are producing an ROI from their experience
program with Account Experience best practices
Get the background behind the report, quick stats, research
methodology, industry list, and key takeaways
Get the culture best practices to embed B2B customer feedback into the ethos of your organization and
drive change
Learn best practices around measuring feedback and
benchmark yourself against the best B2B has to offer
See how you stack up with Net Promoter Score and Retention Rate
benchmarks for the major B2B industries
Discover the significant benefits of closing the loop quickly and learn the tactics other B2B companies use to
do just that
Learn cutting edge Account Experience best practices directly from the best and brightest names
in B2B

7 | The State of B2B Account Experience
07 EXECUTIVESUMMARYEXECUTIVESUMMARYB2B Benchmarks Report

8 | The State of B2B Account Experience
Which got us thinking:
About The State of Account Experience ReportExecutive Summary
In early 2019, we came to a very clear conclusion—B2B is underserved in the experience world, and frankly, a bit lost.
However, there were glimpses of hope within our own account basethat showed experience programs, when done properly with a specific B2B system focused on revenue outcomes, can produce industry-leading retention gains and growth.
We knew what we had to do— collect and publish the most comprehensive B2B experience benchmarks database on the planet. So we started collecting data immediately. Based on decades of running B2B experience programs with the likes of DHL, Anheuser Busch, Vestas, SugarCRM, Super Office and other B2B Goliaths, we knew how to start, support, and run a world-class B2B Account Experience program successfully.
We worked to distill down the essence of these high-performing B2B Account Experience programs into four separate categories of performance: measuring feedback, acting on feedback, growing from feedback, and culture foundations. Then we painstakingly crafted over 30 detailed questions to assess a program’s maturity in each bucket. Each company assessed received a detailed PDF with program maturity scores by section and benchmarks based on previously assessed companies’ responses (anonymously of course). We continued down this path for longer than two years until we felt the database was diverse enough to extract meaningful, but more importantly, reliable B2B experience benchmarks.
We set out to create the most comprehensive B2B Account Experience benchmarks on the planet and we’re happy to say, we have accomplished exactly that.
Spoiler alert—the data in this report often paints a bleak picture for B2B companies across the globe. But there is hope...
?
We were determined to get answers—the obvious starting point was finding the most recent B2B experience benchmarks available. After an exhaustive search, we determined that no reliable B2B experience benchmarks existed. We were shocked, to say the least.
What is the state of the overall B2B experience market?

9 | The State of B2B Account Experience
Quick StatsExecutive Summary
Flying Blind
Silo Culture Not Embedded in Company DNA
Missed Opportunities
Worth The Money?
of companies assessed say they do not calculate the ROI of their experience program
of companies do not have their experience program linked to financial data
of companies do not track referrals as a result of their B2B experience program
62%
70% 63%$ $ $
of B2B experience programs are isolated to one division or department
of companies are sure their entire organization understands how the experience program supports their strategy
61% 20%

10 | The State of B2B Account Experience
As the initial data came in, many programs were under performing, to put it lightly. The B2B industry seemed collectively lost and focused on the wrong outputs and outcomes. In short, the B2B industry needed help.
It was clear—B2B companies were and still are at a crossroads—they’re falling behind their B2C counterparts and worse, it doesn’t seem like many have a plan to tackle the incoming wave of macroeconomic transformation that is currently happening around them.
Recently ranked #1 for B2B VoC by Gartner, we feel CustomerGauge (CG) is uniquely positioned to help add clarity to a confused market.
So we asked ourselves...
We decided to take the fully-anonymous data from our Account Experience customers and directly integrated it with the assessment data.
At certain points of this report, we’ll make comparisons between the two data-sets to highlight certain actions or approaches that we feel are essential to high-performing programs.
We hope these benchmarks not only prove useful to your organization but serve as a call to action.
But you’re not alone.
There’s a path to success in every scenario— this report gives you the data-backed playbook to move from a simple insights-based B2B experience program to a full-blown revenue generating asset fueled by account feedback. The question is...what do you plan to do with it?
“How can we provide clarity of purpose to such a confused market?”
Enter the CustomerGauge Account Experience (AX) customer benchmarks data set. It’s true, our assessment data painted a bleak picture of the current state of B2B experience programs.
While these benchmarks may be useful for determining the overall state of the B2B experience market, we wanted to take it a step further. Like our Custom PDF assessment readout, we set out to provide a prescriptive playbook for B2B companies to maximize the financial impact of their experience programs.
The Report
Industry Assessment Benchmarks
CG AX Customer Benchmarks

11 | The State of B2B Account Experience
CustomerGauge invited several thousand companies to assess their programs to get a better sense for the overall B2B experience market. 776 B2B companies across the globe agreed to take this journey with us and assess their programs in the period from January 2019 to July 2021. Our assessment consists of 31 total questions across 4 different categories...
It’s not too late, you can still see how your program stacks up...
1. What B2B CX satisfaction metrics do you utilize in your surveys?
2. What is your current Net Promoter Score?
3. Do you set targets for your B2B CX program?
4. Is your B2B CX program aligned with the company strategy and vision?
5. Has your company developed a thorough customer journey map(s)?
6. Is CX deployed throughout the enterprise?
7. Do you have a core B2B CX team?
8. Do you currently send relationship surveys and if so, how often?
9. Do you send transactional surveys?
10. Do you track response rates and account coverage?
11. Are the results of your B2B CX program shared with the entire organization?
12. Do you know how many key contacts you should have per account?
13. Do you know the financial impact that improving drivers will have on your business?
14. Do you close the loop for respondents or accounts?
15. Do you close the loop at every level of your organization?
16. How quickly do you close the loop?
17. Do you set targets for closing the loop (CLP)?
18. Have you linked your B2B CX program with financial data?
19. Do you measure your retention rate?
20. What was your yearly retention rate at the end of the previous calendar year?
21. Do you measure up-/cross sales as a result of your B2B CX program?
22. Do you track referrals as a result of your B2B CX program?
23. Have you calculated the total ROI of your B2B CX program?
Research Method
Take The B2B Program AssessmentGet Started
Measuring FeedbackFeedback collection methodologies
Acting on FeedbackFeedback follow-up methodologies or closing the loop
Growing From FeedbackRevenue integration methodologies
Culture FoundationsCultural and structural makeup of the program
Questions From B2B Experience Program Assessment:

12 | The State of B2B Account Experience
In addition, we asked a handful of other firmographic and demographic questions to round out the dataset.
It’s worth noting that these results are self-reported by the companies. Once a company submits their answers, CustomerGauge sent them a fully customized PDF with a program maturity assessment and benchmarks based on the
and then combined this AX customer data with our assessment data bringing you the most comprehensive B2B experience benchmarks database on the planet. While the data paints a somewhat immature landscape overall in B2B experience, the data also shows B2B companies utilizing proper Account Experience strategies and tactics can far surpass current industry benchmarks.
The results are remarkable, as they demonstrate how Account Experience can be used to improve several customer loyalty behaviors that increase growth in three key areas:
Example Maturity Assessment Results
CX Fundamentals
12
4
18
10
Measure Act Grow
previous submissions. The second half of our B2B experience benchmarks database is anonymous CustomerGauge Account Experience customer benchmark data. We’ve pulled over thousands of fully anonymous data points like email open and click rates, response rates, NPS, and much more.
By MaturityBy Industry
Retention
Up-Sales & Cross-Sales
Referral Business
These behaviors lead, in turn, to higher revenue growth by several percentage points.
We sorted the data...

13 | The State of B2B Account Experience
Here Are The Industries This Report Covers:
Computer Software IT Services
Industry Services
Healthcare
Manufacturing
Professional Services
Telecommunications
Consumer Packaged Goods Wholesale
Energy/Utilities
Financial Services
Logistics

14 | The State of B2B Account Experience
Demographics
31%
12%
NORTH AMERICA
AFRICA
SOUTH AMERICA
14%ASIA
36%
EUROPE
5%
2%
AUSTRALIA
24,000+
100%
Data Points Collected
Of Companies Were B2B

15 | The State of B2B Account Experience
Key TakeawaysMost B2B Experience Programs are in their early stages. The programs are immature and not aligned with company strategies and vision.
The majority are:
In contrast, CustomerGauge Account Experience customer benchmarks show:
Account Experience isn’t just a buzzword anymore— it’s howthe top B2B companies are leveraging account-based experience to growtheir bottom-lines faster.
Not setting targets
Faster rates of growth
Higher NPS on average across multiple industries
Higher retention rates
Higher response rates
and the list goes on...
Not closing the loop quickly enough
Not tying their experience data to revenue
Cannot produce an ROI from their program
What Is Account Experience?Watch Video
Account Experience isn’t just a buzzword anymore...““

16 | The State of B2B Account Experience
16 MEASURINGFEEDBACKB2B Benchmarks Report
MEASURINGFEEDBACK
17 | The State of B2B Account Experience
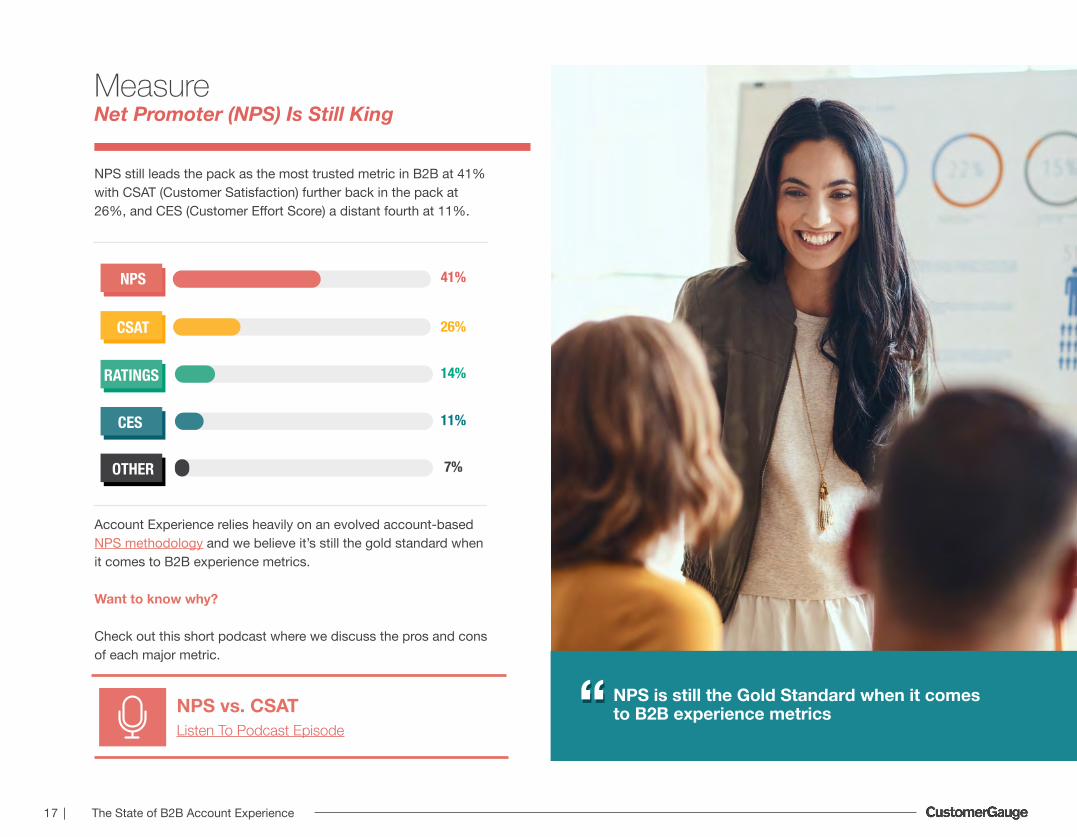
MeasureNet Promoter (NPS) Is Still King
41%
26%
11%
7%
14%
NPS still leads the pack as the most trusted metric in B2B at 41% with CSAT (Customer Satisfaction) further back in the pack at 26%, and CES (Customer Effort Score) a distant fourth at 11%.
Account Experience relies heavily on an evolved account-based NPS methodology and we believe it’s still the gold standard when it comes to B2B experience metrics.
Want to know why?
Check out this short podcast where we discuss the pros and cons of each major metric.
NPS
CSAT
CES
OTHER
RATINGS
NPS vs. CSATListen To Podcast Episode
NPS is still the Gold Standard when it comes to B2B experience metrics““

18 | The State of B2B Account Experience
B2B Experience Metric Adoption by Industry
The story is much the same across industries—
NPS still rules the roost. That being said, financial services, wholesale, energy/utilities and CPG are still utilizing CSAT in some way, shape, or form.
Telecommunications
NPS
48% 28% 13% 11%
37% 32% 14% 17%
46% 32% 9% 14%
41% 32% 12% 15%
43% 27% 16% 14%
48% 28% 10% 14%
42% 32% 11% 14%
44% 25% 13% 18%
33% 22% 22% 22%
44% 41% 11% 4%
36% 28% 18% 18%
CSAT CES RATINGS
Financial Services
IT Services
Logistics
Manufacturing
Industry Services
Computer Software
Professional Services
Wholesale
Energy/ Utilities
Consumer Packaged Goods

19 | The State of B2B Account Experience
Speaking of CSAT— CustomerGauge would challenge everyone to examine the type of actions being driven from your CSAT survey. CSAT often increases survey times which can increase abandonment rates and reduce the amount of feedback entering your business. In addition, shorter CSATs are not effective in diagnosing root cause or providing any real actionable insights.
Consider removing CSAT and adding transactional NPS survey with quick-select root-cause drivers to speed up your surveys and get to the root cause 98% of the time.
Effectively collecting feedback and diagnosing root-cause quickly is essential to increasing account retention.This may seem like the ‘simple’ step, but there are a few tricks of the trade CustomerGauge Account Experience customers have picked up over the decades we’re now sharing with the general public.
98% Survey Drivers Get You Root-Cause 98% of The Time
Thank you for your score. What would you particularly recommend about the experience?
Service
Product
Ease of use
Speed
Integration options
Account Executive
My Support Experience

20 | The State of B2B Account Experience
0101
02020303
040405050606
Maximize Your Email Survey Open Rates
Maximize Your Email Survey Click Rates
Make Response Rate A Major Metric
Send From Company Name to Increase Response Rates
Reduce Survey Abandonment Rate to Increase Response
Ruthlessly Attack Absence of Signal
Don’t Forget Account CoverageTIP 01
TIP 02
TIP 03
TIP 04
TIP 05
TIP 06
TIP 07
Measuring Feedback —Top 11 Tips
Survey the Same Accounts Multiple Times Per Year to Drive Engagement
Track Multiple Stakeholders at the Account-Level and Survey Them For B2B Account Sentiment
Frequent Surveying to Multiple Contacts Can Double Your Retention Rate
Combine Relationship Surveys With Transactional NPS to Provide “Always on Feedback”
TIP 08
TIP 09
TIP 10
TIP 11
07070808090910101111Get Started:Maximize Your Email Survey Open Rates

21 | The State of B2B Account Experience
Maximize Your Email Survey Open Rates
One tip we picked up from our previous benchmarks reports was this:
In fact, 73% of companies chose to collect feedback via email. This year, we explored how email impacts feedback collection.
Collecting feedback via email all starts with the open rate. It’s a simple math problem—the more customers you get to open your email, the more will click on the survey, and the more people click on the survey, the more will complete the survey, etc.
CustomerGauge Account Experience customers average 34% open rates when sending surveys via email with 21.4% on the lower end and a shocking 60.3% open rate on the high end!
MEASURE TIP
Email is king when it comes to collecting feedback
21% 25% 27% 31% 34%38%
41%49%
60%
10
20
020
Percentile (%)
Ope
n R
ate
(%)
30 40
40
50 60
60
70 80
80
90
Median AX Email Open Rates
01
Want to Improve Your Open Rates? Here’s a Few Tips:
Let your customers know when you’ll be sending the survey
Send it from your domain (more on this later)
Use short, catchy subject lines like “<first name>, how did we do?”
Send reminder emails to non-openers with a different subject line
Have your CSM/Support teams forward the survey email to non-openers
Try sending from different people—CEOs and account managers work well
22 | The State of B2B Account Experience
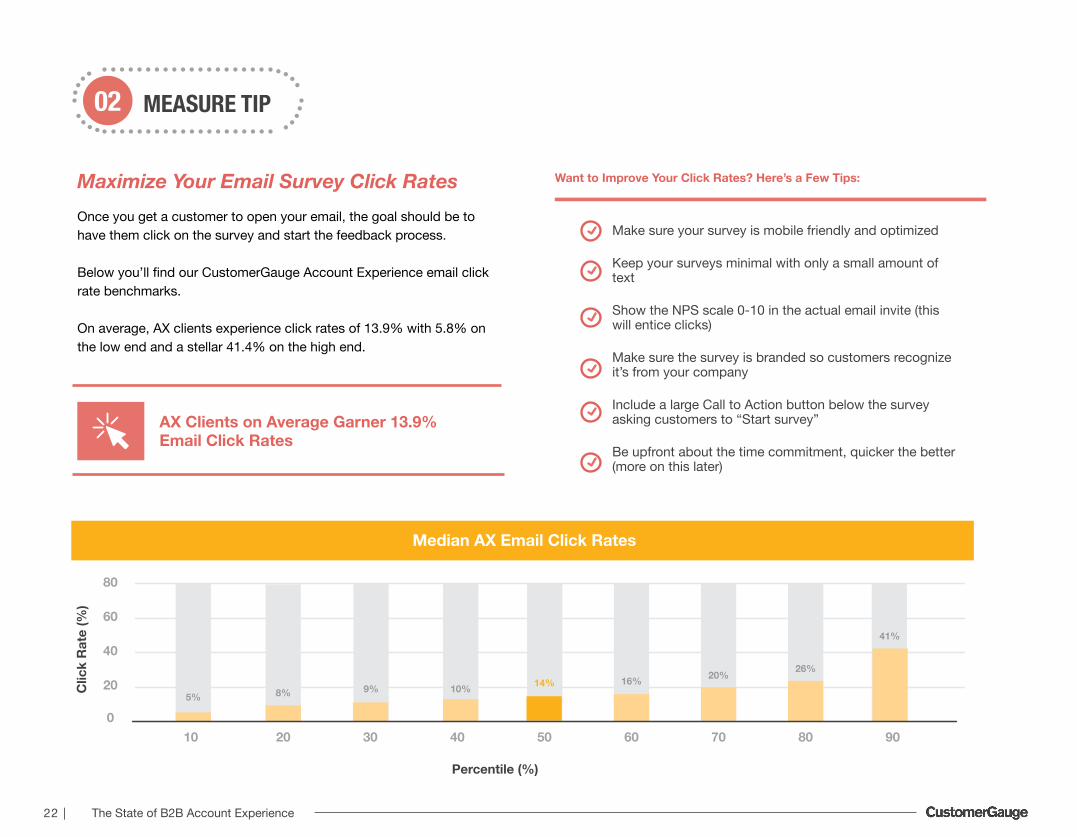
Maximize Your Email Survey Click Rates
MEASURE TIP02
Once you get a customer to open your email, the goal should be to have them click on the survey and start the feedback process.
Below you’ll find our CustomerGauge Account Experience email click rate benchmarks.
On average, AX clients experience click rates of 13.9% with 5.8% on the low end and a stellar 41.4% on the high end.
Want to Improve Your Click Rates? Here’s a Few Tips:
Make sure your survey is mobile friendly and optimized
Keep your surveys minimal with only a small amount of text
Show the NPS scale 0-10 in the actual email invite (this will entice clicks)
Make sure the survey is branded so customers recognize it’s from your company
Include a large Call to Action button below the survey asking customers to “Start survey”
Be upfront about the time commitment, quicker the better (more on this later)
AX Clients on Average Garner 13.9% Email Click Rates
5% 8% 9% 10% 14% 16% 20% 26%
41%
10
20
020
Percentile (%)
Clic
k R
ate
(%)
30 40
40
50 60
60
70 80
80
90
Median AX Email Click Rates

23 | The State of B2B Account Experience
Make Response Rate A Major Metric
MEASURE TIP03
CustomerGauge has rolled out what we’re calling our 100 / 100 goals for all our Account Experience clients. What is this exactly? It’s a customer wide goal to hit 100% account response rate and 100% close the loop rate.
Seems impossible? It’s not, we promise! But it begs the question, why such a focus on response rate?
It’s pretty simple: we’ve found a healthy response rate impacts all metrics positively from NPS to retention. Not only that, it helps you avoid what we have termed “absence of signal.” One of the main indicators an account will churn is lack of engagement or ‘absence of signal.’ Account Experience helps mitigate this churn risk by maximizing response rates.
AX clients on average, generate a 12.4% response rate with 4.5% on the low end and 39.3% on the high end.
But more interestingly, CustomerGauge Account Experience customers show that higher response rates are directly correlated to a higher NPS. And it’s not that hard to make the jump from high NPS to higher revenue growth from there (more on this later).
Response Rate is Calculated “Total Completed Surveys / Total # Surveys Sent”
5% 6% 8% 9%12% 14% 18% 25%
39%
10
20
020
Percentile (%)
Net
Res
pons
e R
ate
(%)
30 40
40
50 60
60
70 80
80
90
Median AX Survey Contact Response Rates

24 | The State of B2B Account Experience
CustomerGauge Account Experience customers show their higher response rates are directly correlated to higher NPS
30 32
57 55 50 53
0-10%
10
0
11-20%
Aver
age
NPS
Contact Response Rate
21-30% 31-40%
20
41-50% 51%+
30
40
50
60
Higher Contact Response Rates, Higher Net Promoter Scores

25 | The State of B2B Account Experience
MEASURE TIP04
Send From Your Domain Name to Increase Response Rates
This may seem obvious, but not every B2B company has figured this out. If you want a higher response rate send from your company domain.
The Account Experience data is clear:
Companies that send email surveys through their own domain vs. a third party experience a 14% higher response rate than those who do not. NPS is all about loyalty, and customers are loyal to the company in which the relationships are established.
They are more likely to give feedback if it is the company that asks, not a third party. Using a third party experience provider software is still smart, simply make sure the survey is set up to be sent from your company name.
0
2
4
6
8
10
12
14
Med
ian
Res
pons
e R
ate
Third-Party Domain Sender
Company Domain Sender
Median AX Response Rates By Sender
Use of Domain Name = Higher Response
14%
11%
+3%Response Rate Increase By
Sending From Your Company Domain

26 | The State of B2B Account Experience
10
6
78
1214 15
23
39
50
4 68
9
11 13 16
20
32
0
10 20 30 40 50 60 70 80 90
20
30
40
50
60
Con
tact
Res
pons
e R
ate
(%)
Percentile
Own Domain Sender CG Domain Sender
Median AX Contact Response Rates by Sender

27 | The State of B2B Account Experience
MEASURE TIP05
Reduce Survey Abandonment Rate to Increase Response RatesAnother shockingly simple conclusion backed by our Account Experience data is to make your surveys short. The shorter the survey, the lower your survey abandonment rates are, the higher your response rates will be. We advise all of our Account Experience clients to keep surveys to under a minute if they can.
Want to shorten the time it takes to complete your survey? Follow the Account Experience survey methodology of simple NPS + self-select drivers + comments + follow-up question (if necessary). Follow this framework and you will see your survey time to completion drop significantly!
On average, our AX survey time across all clients and industries is a quick 80 seconds!
0.010 20 30 40 50 60 70 80 90
0.5
1.0
1.5
2.0
2.52.4
1.8
1.6 1.5
1.3 1.2 1.1
0.9 0.8
3.0
Surv
ey C
ompl
etio
n Sp
eed
(Min
)
Percentile
CG AX Customer Survey Completion Speed (Minutes)
Median Abandonment Rate Increase (%)
+0.9%
MIN
ABANDONMENT ABANDONMENT ABANDONMENT
MIN MIN
2 2-3 3+
+1.9% +2.9%
28 | The State of B2B Account Experience
MEASURE TIP06
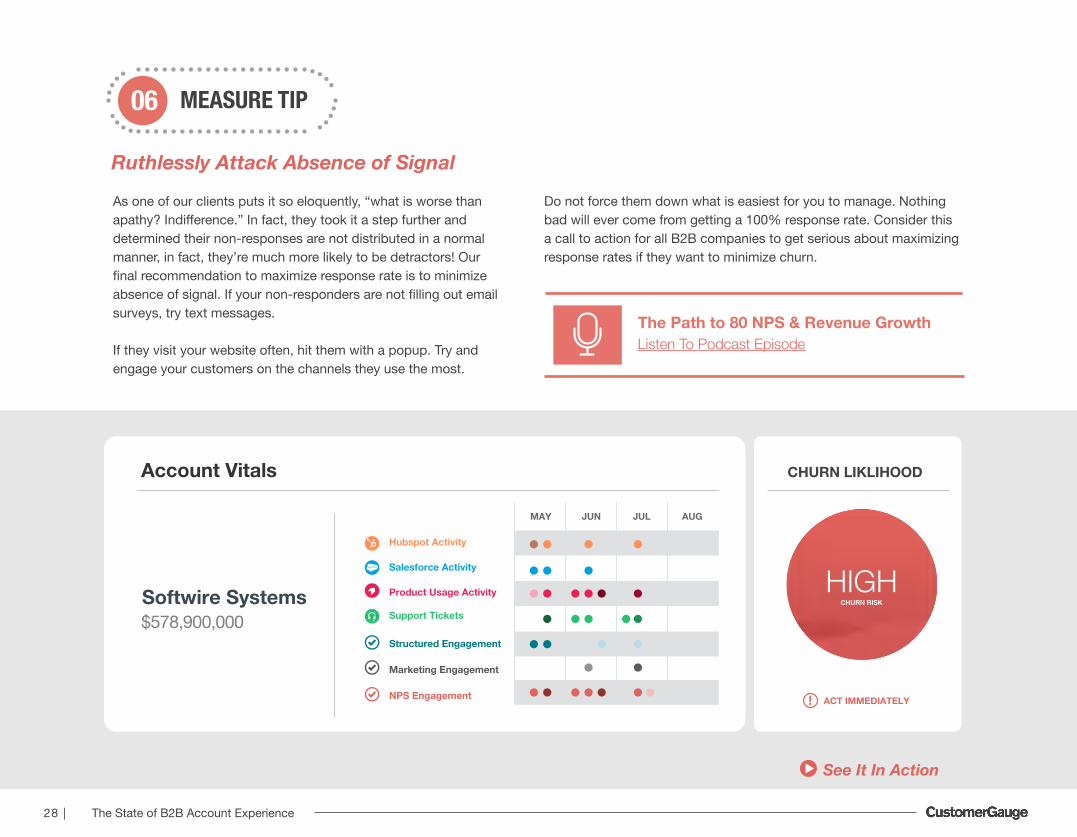
Ruthlessly Attack Absence of Signal
See It In Action
As one of our clients puts it so eloquently, “what is worse than apathy? Indifference.” In fact, they took it a step further and determined their non-responses are not distributed in a normal manner, in fact, they’re much more likely to be detractors! Our final recommendation to maximize response rate is to minimize absence of signal. If your non-responders are not filling out email surveys, try text messages.
If they visit your website often, hit them with a popup. Try and engage your customers on the channels they use the most.
The Path to 80 NPS & Revenue GrowthListen To Podcast Episode
Do not force them down what is easiest for you to manage. Nothing bad will ever come from getting a 100% response rate. Consider this a call to action for all B2B companies to get serious about maximizing response rates if they want to minimize churn.
Structured Engagement
MAY JUN JUL AUG
Marketing Engagement
NPS Engagement
Hubspot Activity
Salesforce Activity
Product Usage Activity
Support Tickets
Account Vitals
Softwire Systems$578,900,000
HIGHCHURN RISK
CHURN LIKLIHOOD
ACT IMMEDIATELY
29 | The State of B2B Account Experience
MEASURE TIP07
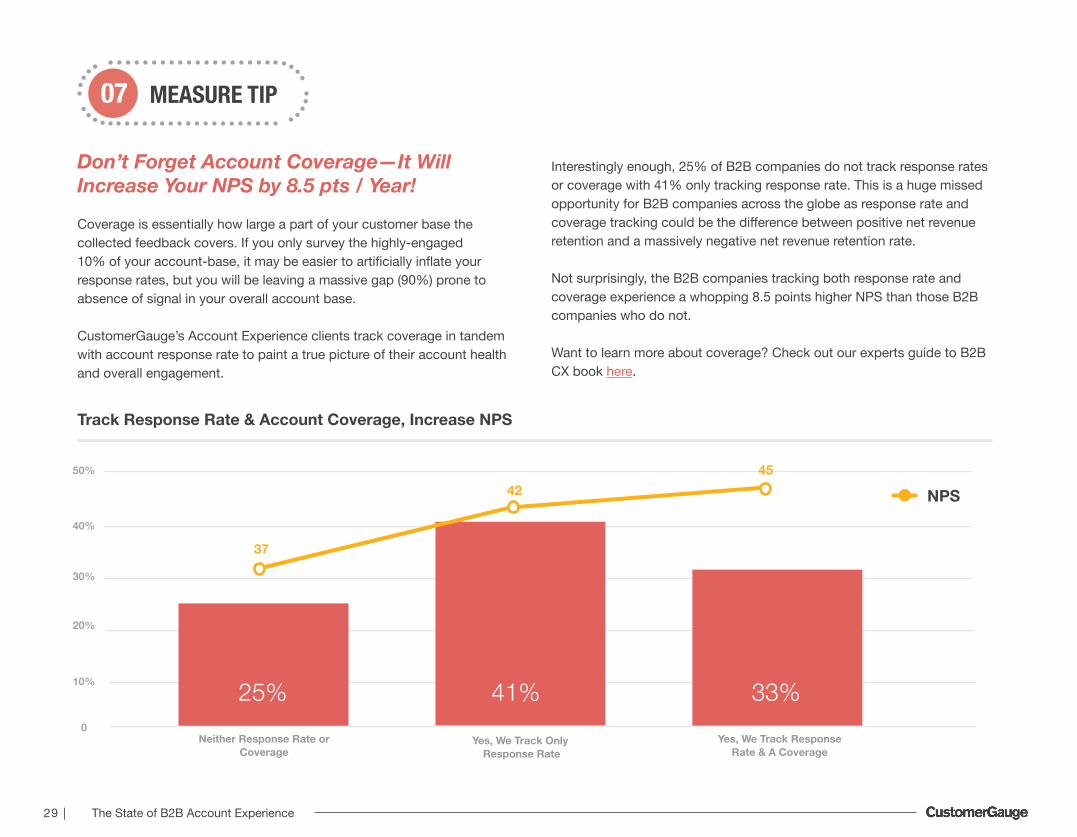
Don’t Forget Account Coverage—It Will Increase Your NPS by 8.5 pts / Year!
Track Response Rate & Account Coverage, Increase NPS
NPS
Coverage is essentially how large a part of your customer base the collected feedback covers. If you only survey the highly-engaged10% of your account-base, it may be easier to artificially inflate your response rates, but you will be leaving a massive gap (90%) prone to absence of signal in your overall account base. CustomerGauge’s Account Experience clients track coverage in tandem with account response rate to paint a true picture of their account health and overall engagement.
Interestingly enough, 25% of B2B companies do not track response rates or coverage with 41% only tracking response rate. This is a huge missed opportunity for B2B companies across the globe as response rate and coverage tracking could be the difference between positive net revenue retention and a massively negative net revenue retention rate.
Not surprisingly, the B2B companies tracking both response rate and coverage experience a whopping 8.5 points higher NPS than those B2B companies who do not.
Want to learn more about coverage? Check out our experts guide to B2B CX book here.
Neither Response Rate or Coverage
33%41%25%Yes, We Track Response
Rate & A CoverageYes, We Track Only
Response Rate
0
10%
20%
30%
40%
50% 4542
37

30 | The State of B2B Account Experience
Survey the Same Accounts Multiple Times Per Year to Drive Engagement
The majority of B2B companies (56%) admit they do not send surveys, send once a year, or less than once a year.
Our hypothesis is that many of these B2B companies that participated in our assessment process have a built-in fear of over-surveying. One of the companies we interacted with flat out stated...
And this is simply single-contact surveying per account, an important distinction from multi-contact surveying (more on this in the next section). If we can leave you with one tip from this section it would be this—take this data and use it to adjust your relational survey strategy to send a minimum of 4 times a year.
This sentiment is actually more common than you’d think. But here’s the thing—the data actually paints the exact opposite picture.
When looking at the CustomerGauge Account Experience customer benchmarks, surveying single contacts in accounts more than once a year actually increases logo retention rates, roughly 7 additional percentage points in retention.
08
No, don’t survey at all 25%
8%
23%
19%
25%
Yes, but less than once a year
Yes, once a year
Yes, twice a year
Yes, at least a quarter
Relational Survey Frequency
“We don’t want to be a nuisance and overstay our welcome with multiple surveys.”
MEASURE TIP
44% 51%
Increased Retention Increased Retention
If You’re Surveying One Time Per Year
If You’re Surveying Multiple Times Per Year

31 | The State of B2B Account Experience
Track Multiple Stakeholders at the Account-Level and Survey Them For B2B Account Sentiment
09
A true Account Experience program does not simply focus on a single piece of feedback from a single stakeholder in an account. Account Sentiment achieved by collecting feedback across the three different levels of an organization—front-line, middle management, and C-Suite. Then and only then can you calculate your true account NPS.
This survey strategy is unique to B2B but extremely impactful on the overall calibration of your experience program.
And surprisingly, 64% of B2B companies do not have a structured approach to manage how many contacts they should have per account.
Do You Know How Many Contacts You Should Have Per Account?
MEASURE TIP
Account Sentiment
Front-line
Middle Management
C-Suite
No Structured Approach
Yes, It’s an Internal Metric Determined By Senior Management
Yes, Based on the total revenue of the client
64%17%
20%

32 | The State of B2B Account Experience
Clearly some nice NPS gains to be had if account contacts are managed based on revenue.
A general rule we advise our Account Experience clients to follow is this: 10 contacts across all three levels of an organization (c-level, middle management, and front-line) per $1M in revenue.
Once you have the proper structure, we recommend that you survey them all. Why? Let’s take a look at an example demonstrating the impact account coverage can have on account churn:
Do You Have a Structured Approach to Contacts?
But the B2B companies who do have a structured system for managing contacts at the account level experience a 9 point increase in NPS vs. those B2B companies who do not.
No, Structured Approach:
Yes, It’s an Internal Metric Determined By Senior
Yes, Based on The Total Revenue of The Client:
Companies who do have a structured system for managing contacts at the account level experience a 9 point increase in NPS vs. those companies who do not.““
41%
45%
50%
33 | The State of B2B Account Experience
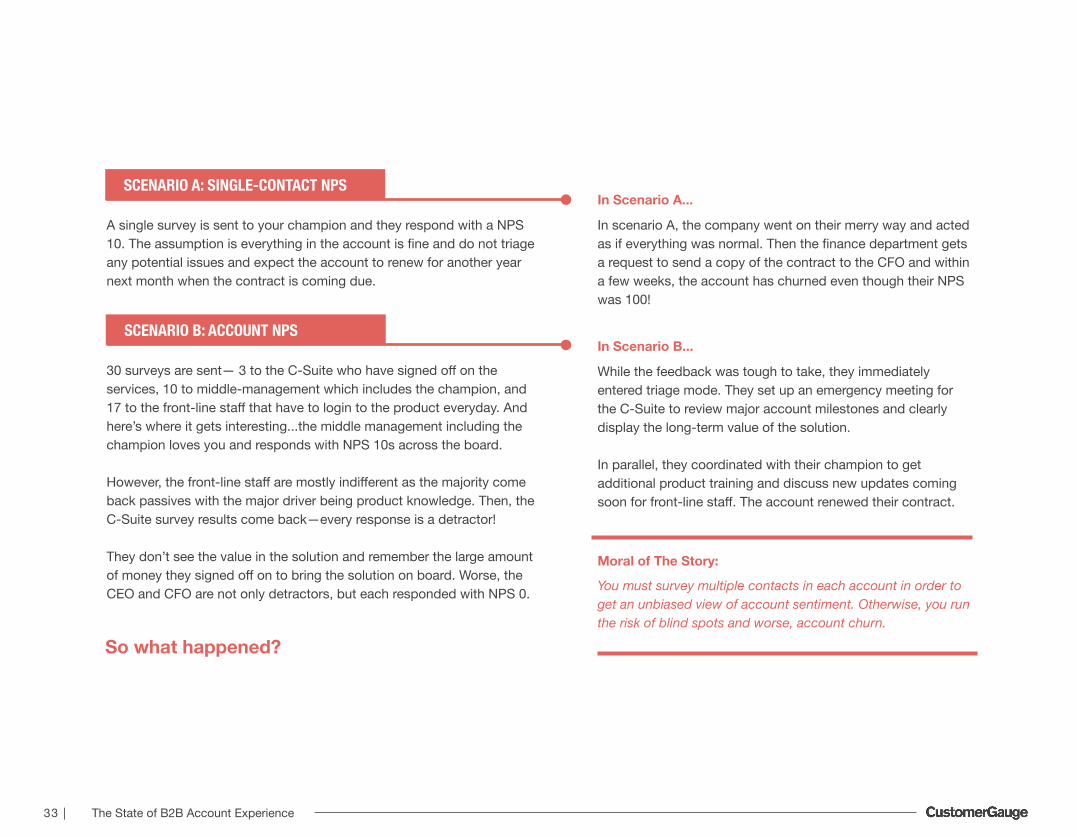
A single survey is sent to your champion and they respond with a NPS 10. The assumption is everything in the account is fine and do not triage any potential issues and expect the account to renew for another year next month when the contract is coming due.
In scenario A, the company went on their merry way and acted as if everything was normal. Then the finance department gets a request to send a copy of the contract to the CFO and within a few weeks, the account has churned even though their NPS was 100!
While the feedback was tough to take, they immediately entered triage mode. They set up an emergency meeting for the C-Suite to review major account milestones and clearly display the long-term value of the solution.
In parallel, they coordinated with their champion to get additional product training and discuss new updates coming soon for front-line staff. The account renewed their contract.
Moral of The Story:
You must survey multiple contacts in each account in order to get an unbiased view of account sentiment. Otherwise, you run the risk of blind spots and worse, account churn.
In Scenario A...
In Scenario B...
So what happened?
30 surveys are sent— 3 to the C-Suite who have signed off on the services, 10 to middle-management which includes the champion, and 17 to the front-line staff that have to login to the product everyday. And here’s where it gets interesting...the middle management including the champion loves you and responds with NPS 10s across the board.
However, the front-line staff are mostly indifferent as the majority come back passives with the major driver being product knowledge. Then, the C-Suite survey results come back—every response is a detractor!
They don’t see the value in the solution and remember the large amount of money they signed off on to bring the solution on board. Worse, the CEO and CFO are not only detractors, but each responded with NPS 0.
SCENARIO A: SINGLE-CONTACT NPS
SCENARIO B: ACCOUNT NPS

34 | The State of B2B Account Experience
And here’s the good news—in B2B, it pays to survey multiple contacts in an account multiple times a year.
According to the CustomerGauge Account Experience customer benchmarks, the retention gains for surveying multiple contacts per account in B2B are substantially higher.
In fact, B2B CustomerGauge customers who surveyed multiple contacts in an account experienced a shocking 18% higher retention rates than those who only surveyed single contacts in accounts.
10%
20%
30%
40%
50%
60%
70%
80%
Med
ian
Ret
entio
n R
ate
(%)
Single Contact Per Account Multiple Contact Per Account
Median AX Retention Rates By Contact Structure
50%
68%
18% Higher retention rates than those who only surveyed single contacts in accounts.

35 | The State of B2B Account Experience
Frequent Surveying to Multiple Contacts Can Double Your Retention Rate
MEASURE TIP10
In case you missed it, in Tip 8 we showed data that supported surveying multiple times per year increases retention. In Tip 9, we showed data that supported surveying multiple contacts in a single account to achieve Account Sentiment and increase retention.
B2B companies who survey a single contact once a year experience a median retention rate of 44%. In stark contrast, B2B companies surveying multiple times a year to multiple contacts experience retention rates in the 82% — nearly 2x their counterparts not implementing a proper B2B relational survey strategy.
QUESTION:
So what happens when we combine these tips into a B2B-specific survey strategy?
ANSWER:
~2x retention rates!
08
09
TIP 08:
TIP 09:
Surveying multiple times per year increases retention
Surveying multiple contacts in a single account to achieve Account Sentiment & increase retention
1x Per Year 1x Per YearMultiple Times Per Year
Multiple Times Per Year
0%
20%
40%
60%
80%
Med
ian
Ret
entio
n R
ate
Single Contact Per Account Multiple Contacts Per Account
44%51%
65%
82%
Q
A
Median AX Retention Rates By Frequency & Structure

36 | The State of B2B Account Experience
33%36%
15% 15%
Combine Relationship Surveys With Transactional NPS
MEASURE TIP11
Transactional surveys are widely used in B2C. For example at the end of an e-commerce purchase, service visit or support call.
They are still very much a gray area for B2B companies across the globe. 33% of B2B companies do not run transactional surveys and 36% run transactional surveys for only some relevant touch-points.
Why are these numbers significant?
of B2B companies lack a robust transactional survey strategy tackling every touch-point. 70%
There are a few main benefits of running transactional NPS in conjunction with a regular cadence of relationship surveys:
You get a full view of the customer journey by touch point which allows for more granular and relevant process improvement
Standardized reporting and commitment to one single metric everyone can rally around
In the moment feedback on a direct interaction and their overall sentiment with a steady cadence of relational surveys
Faster close loop rates
Do You Send Transactional Surveys?
No, We Don’t Yes, For Some Relevant Touch-points
Yes, For All Relevant Touch-points
Yes, Without Over-Surveying
10
0
20
30
40

37 | The State of B2B Account Experience
37 ACTING ON FEEDBACKB2B Benchmarks Report
ACTING ON FEEDBACK

38 | The State of B2B Account Experience
Acting on Feedback
Crossing the chasm from simply measuring feedback to acting on feedback, or closing the loop, oftentimes can prove challenging, especially in B2B.
However, the goal for any B2B Account Experience program using NPS as a backbone should be to act on account feedback as quickly as humanly possible—not simply measure and track the score.
No
Yes, but only extreme cases
Yes, but only for some customers
Yes, for all customers
Why? The growth potential in terms of NPS, revenue, and retention, are significantly higher when you combine measurement with a robust system to follow-up on the feedback quickly.
How significant? More on that later in this section! But first, how many B2B companies are actually closing the loop on all customers and accounts?
Do You Close the Loop for Respondents or Accounts?
20%
19%
34%
26%
26%B2B Companies
Close the Loop with all Customers

39 | The State of B2B Account Experience
A surprisingly low 26% across all B2B companies assessed close the loop with all customers. This was a shocking number even to us.
CustomerGauge Account Experience customers have a target to close the loop on 100% of B2B clients every year.
Sounds crazy right? Well we’re proud to say DHL Supply Chain and many other of our enterprise B2B clients have achieved this milestone. Hopefully, the insights in the section below will give you the guidance needed to hit triple-digit close loop rates as well.
26% B2B Companies Close the Loop with all Customers““
0101
0202
0303
0404
Close The Loop On All Customer Feedback
Close the Loop at All Three Levels
Act Quickly
Set Targets, You’ll Grow (Everything) Faster!
TIP 01
TIP 02
TIP 03
TIP 04
Acting on Feedback —Top 4 Tips

40 | The State of B2B Account Experience
Close The Loop On All Customer Feedback to Increase Your NPS & Retention
ACT TIP01
0
10
20
30
40
50
No Yes, Only In Extreme Cases
Net
Pro
mot
er S
core
(NPS
)
Yes, Only In Some Cases
Yes, For All Customers
Median NPS For Closing The Loop Industry Assessment Benchmarks CG AX Customer Benchmarks
36
4143
47 47
51

41 | The State of B2B Account Experience
KEY
We wanted to see if there was a correlation between NPS increases and closing the loop.
CustomerGauge AX customers experienced an industry-leading 15 point NPS increase!
Moral of the story: aim to close the loop with every customer.
Why? Not only will you increase your NPS, but your retention rates will increase as well. In fact, B2B companies who closed the loop on all customer feedback increased their retention rates by a whopping 8.5%!
But before we get ahead of ourselves, let’s first examine the structure of an effective closed-loop strategy.
Point increase in NPS if B2B companies close the loop for all customers11 8.5%
Median Retention Rates For Closing The Loop
85%
80%
77%
Yes, All Customers Yes, But Only Some No
Increase in Retention If You Close The Loop With All
Customers
Surprise, surprise, the data showed a substantial 11 point increase in NPS if B2B companies close the loop on all customers.
? Is there a correlation between NPS increases and closing the loop?
42 | The State of B2B Account Experience
Close the Loop at All Three Levels, Especially in B2B
ACT TIP02
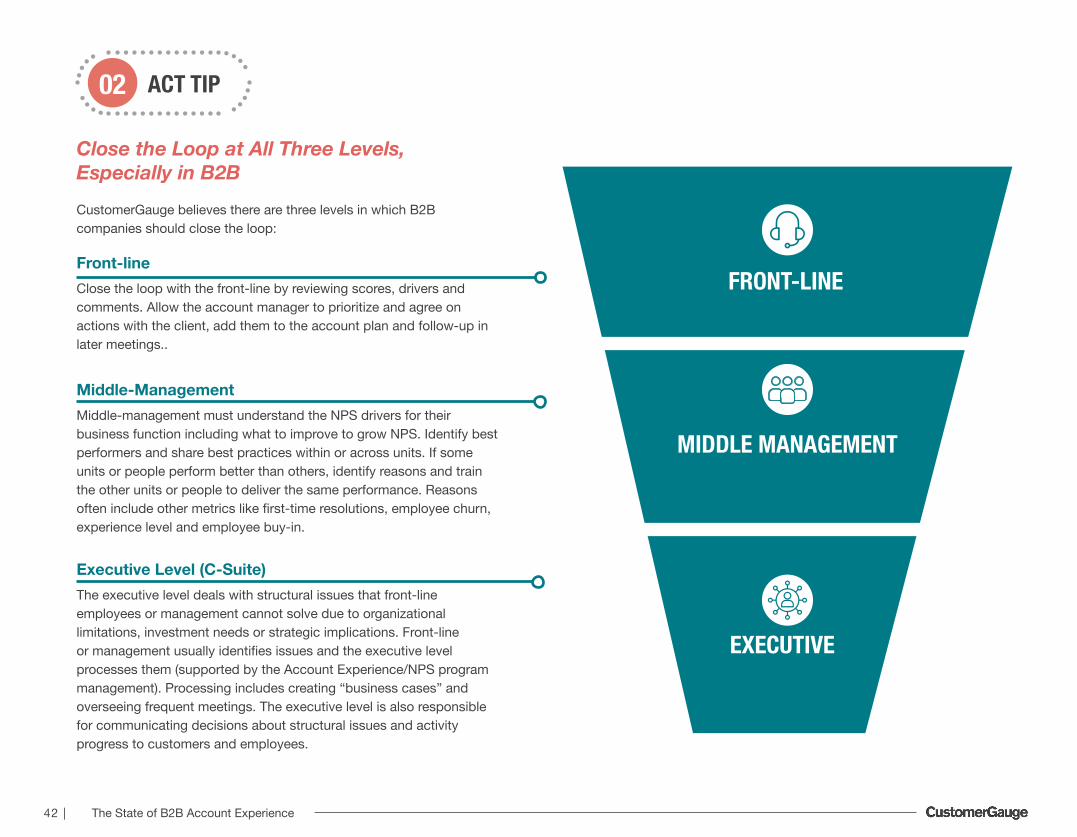
CustomerGauge believes there are three levels in which B2B companies should close the loop:
Front-lineClose the loop with the front-line by reviewing scores, drivers and comments. Allow the account manager to prioritize and agree on actions with the client, add them to the account plan and follow-up in later meetings..
Middle-ManagementMiddle-management must understand the NPS drivers for their business function including what to improve to grow NPS. Identify best performers and share best practices within or across units. If some units or people perform better than others, identify reasons and train the other units or people to deliver the same performance. Reasons often include other metrics like first-time resolutions, employee churn, experience level and employee buy-in.
Executive Level (C-Suite)The executive level deals with structural issues that front-line employees or management cannot solve due to organizational limitations, investment needs or strategic implications. Front-line or management usually identifies issues and the executive level processes them (supported by the Account Experience/NPS program management). Processing includes creating “business cases” and overseeing frequent meetings. The executive level is also responsible for communicating decisions about structural issues and activity progress to customers and employees.
EXECUTIVE
MIDDLE MANAGEMENT
FRONT-LINE
43 | The State of B2B Account Experience
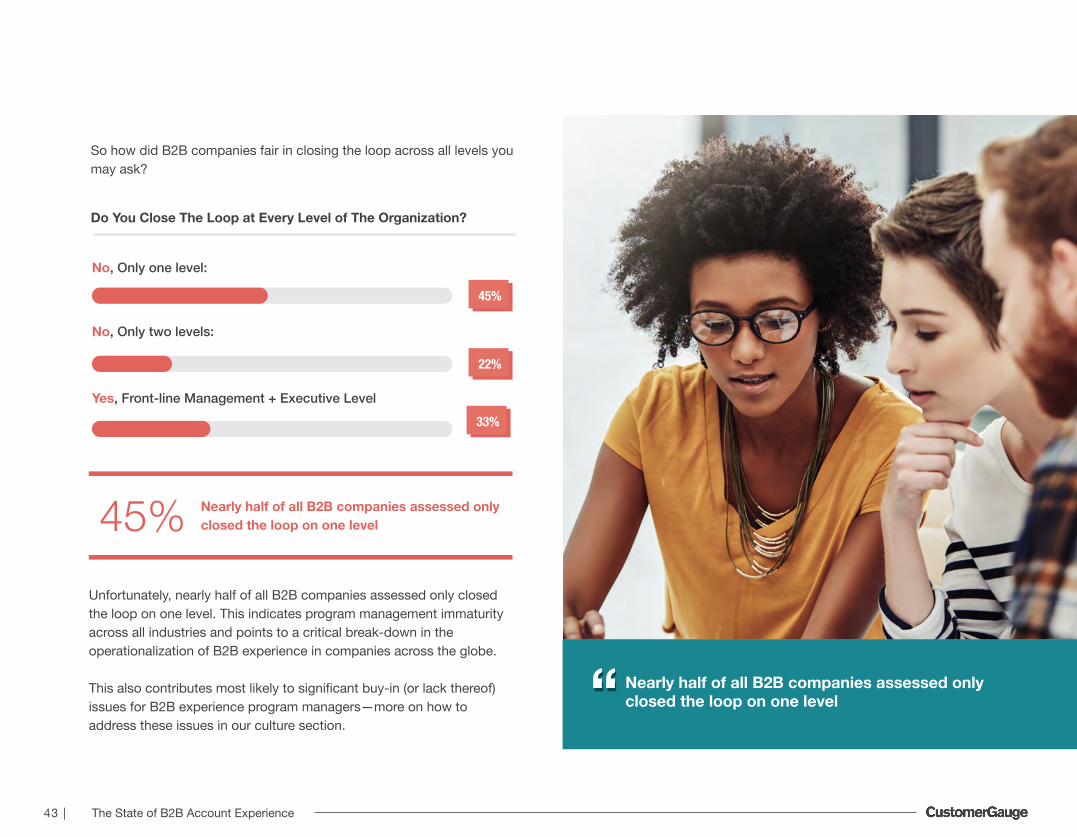
So how did B2B companies fair in closing the loop across all levels you may ask?
Do You Close The Loop at Every Level of The Organization?
Unfortunately, nearly half of all B2B companies assessed only closed the loop on one level. This indicates program management immaturity across all industries and points to a critical break-down in the operationalization of B2B experience in companies across the globe.
This also contributes most likely to significant buy-in (or lack thereof) issues for B2B experience program managers—more on how to address these issues in our culture section.
Nearly half of all B2B companies assessed only closed the loop on one level““
No, Only one level:
No, Only two levels:
Yes, Front-line Management + Executive Level
Nearly half of all B2B companies assessed only closed the loop on one level45%
45%
22%
33%

44 | The State of B2B Account Experience
Act Quickly—It Has a Significant Impact on NPS & Retention
ACT TIP03
The majority (46%) of B2B companies that do close the loop, close it in 72+ hours which seems great on the surface when compared to the roughly 39% of B2B companies that do little to no close the loop activities at all.
To start, B2B companies who close the loop in under 48hrs experienced a +6 NPS gain while those who closed the loop in 2+ weeks only experienced a +3 NPS gain.
72+ Hours48-72 Hours24-48 Hours
46%28%
But as we dove deeper into the data, there were some stark differences and major benefits to the minority of B2B companies who closed the loop in 24-48hrs.
B2B companies who close the loop in under 48hrs experienced a +6 NPS gain 6+
1
0
2
3
4
5
6
Impact of Closing the Loop on NPS IncreaseHow Quickly Do You Close The Loop?
Under 48 Hours 2 Days- 2 Weeks 2 Weeks +
+6
+5
+3N
PS P
oint
Cha
nge
27%

45 | The State of B2B Account Experience
41 4139
4548
51
Do these NPS increases seem insignificant? Perhaps, but over the long-term, these NPS increases will net you an industry-leading NPS. In fact, when we looked at the median NPS in the different bands of close the loop speed and not surprisingly, the B2B companies who close the loop in under 48hrs show a higher median NPS of 48 while those closing the loop in 72+ hours only experienced an NPS of 41.
More interesting, when we looked at our CustomerGauge Account Experience customer benchmarks, they experienced an even higher median NPS of 51 if they closed the loop within 24-48hrs—a 3 point NPS edge if B2B companies adopted Account Experience best-practices.
0
10
20
30
40
50
72 Hours +
Med
ian
NPS
48-72 Hours 24-48 Hours
Industry Assessment Benchmarks CG AX Customer BenchmarksMedian Close The Loop Speed
46 | The State of B2B Account Experience
Set Targets, You’ll Grow (Everything) Faster
ACT TIP04
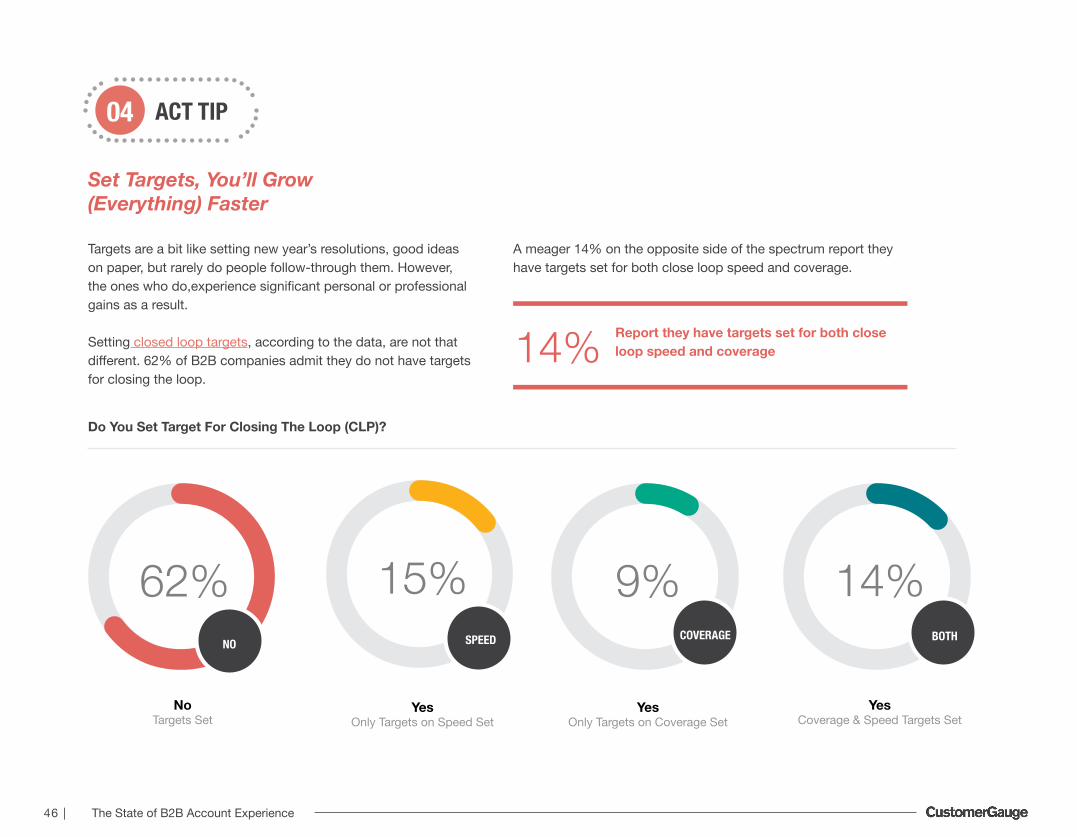
Targets are a bit like setting new year’s resolutions, good ideas on paper, but rarely do people follow-through them. However, the ones who do,experience significant personal or professional gains as a result.
Setting closed loop targets, according to the data, are not that different. 62% of B2B companies admit they do not have targets for closing the loop.
A meager 14% on the opposite side of the spectrum report they have targets set for both close loop speed and coverage.
Do You Set Target For Closing The Loop (CLP)?
62% 15% 9% 14%
NoTargets Set
YesOnly Targets on Speed Set
YesOnly Targets on Coverage Set
YesCoverage & Speed Targets Set
NO SPEED COVERAGE BOTH
Report they have targets set for both close loop speed and coverage14%
47 | The State of B2B Account Experience
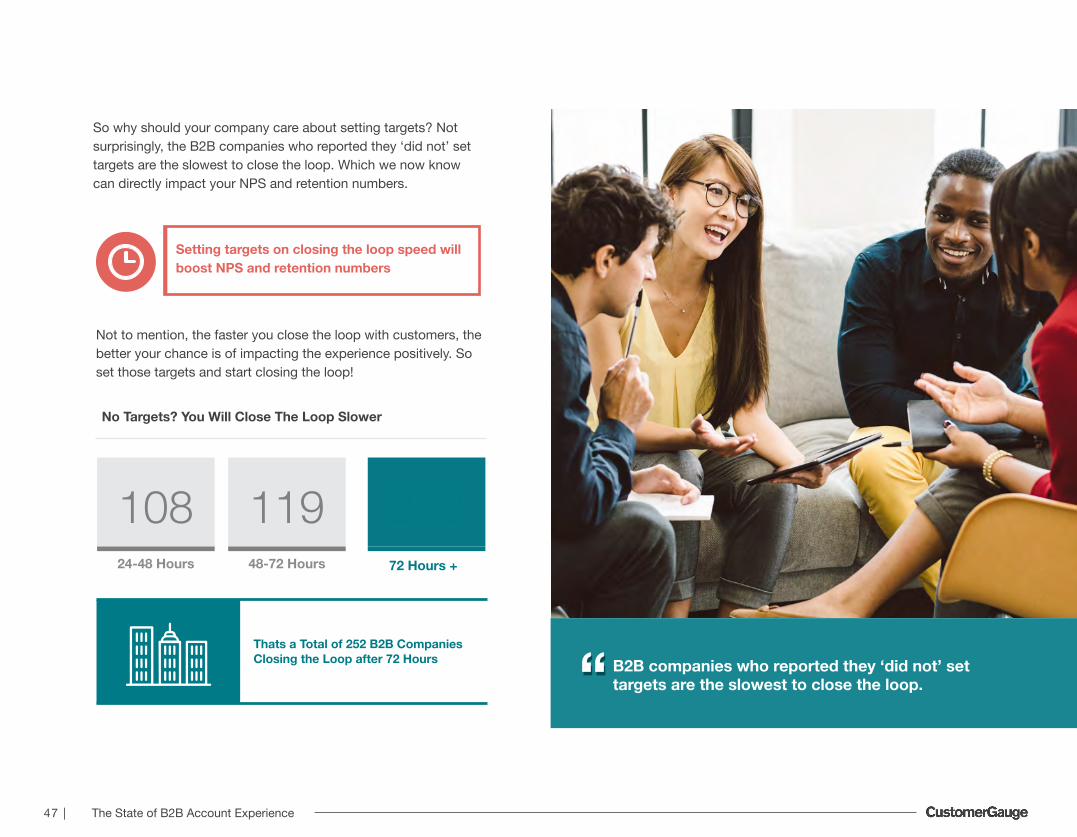
So why should your company care about setting targets? Not surprisingly, the B2B companies who reported they ‘did not’ set targets are the slowest to close the loop. Which we now know can directly impact your NPS and retention numbers.
No Targets? You Will Close The Loop Slower
Setting targets on closing the loop speed will boost NPS and retention numbers
72 Hours +
Thats a Total of 252 B2B Companies Closing the Loop after 72 Hours
24-48 Hours 48-72 Hours
Not to mention, the faster you close the loop with customers, the better your chance is of impacting the experience positively. So set those targets and start closing the loop!
B2B companies who reported they ‘did not’ set targets are the slowest to close the loop.““
108 119 252

48 | The State of B2B Account Experience
48 GROWING FROM FEEDBACKBenchmarks Report
GROWING FROM FEEDBACK
49 | The State of B2B Account Experience
Growing From Feedback
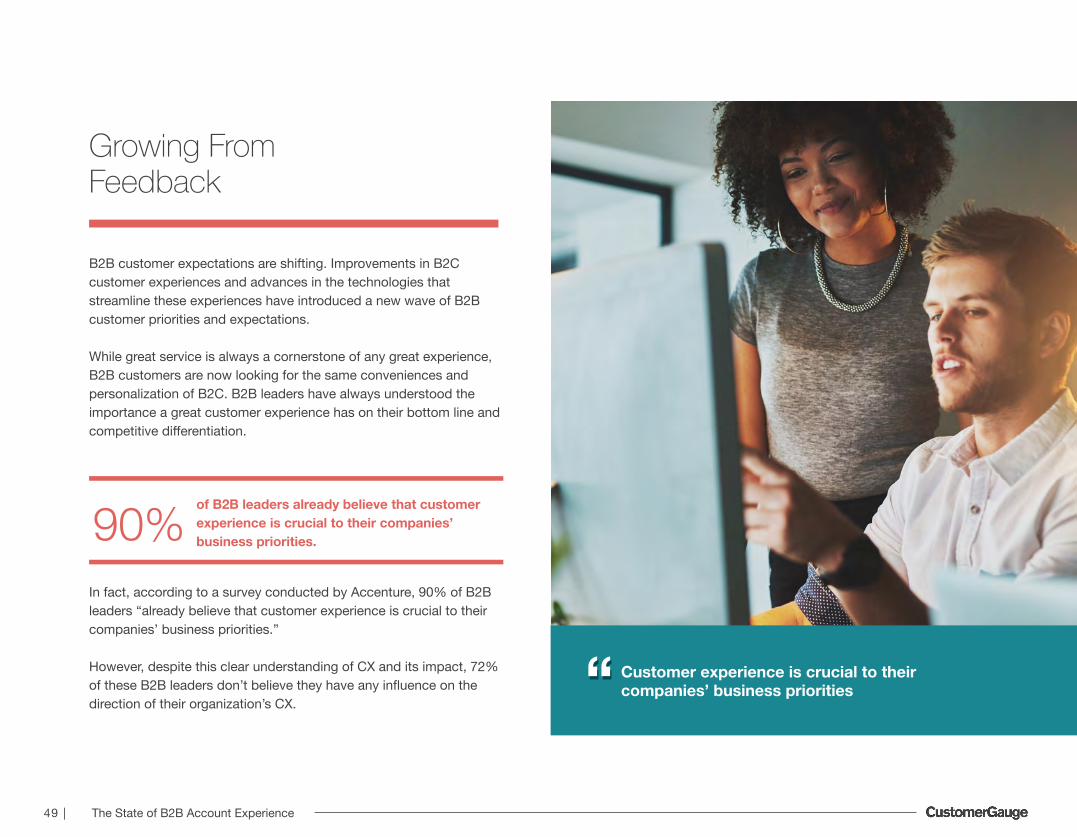
B2B customer expectations are shifting. Improvements in B2C customer experiences and advances in the technologies that streamline these experiences have introduced a new wave of B2B customer priorities and expectations.
While great service is always a cornerstone of any great experience, B2B customers are now looking for the same conveniences and personalization of B2C. B2B leaders have always understood the importance a great customer experience has on their bottom line and competitive differentiation.
of B2B leaders already believe that customer experience is crucial to their companies’ business priorities.90%
In fact, according to a survey conducted by Accenture, 90% of B2B leaders “already believe that customer experience is crucial to their companies’ business priorities.”
However, despite this clear understanding of CX and its impact, 72% of these B2B leaders don’t believe they have any influence on the direction of their organization’s CX.
Customer experience is crucial to their companies’ business priorities““

50 | The State of B2B Account Experience
Think about that for a second. Despite a unanimous agreement on the importance of a streamlined CX program to their bottom line, only 28% of B2B leaders today can say they have any real control over the direction of that critical business driver.
This is what we call the B2B CX Gap.
If CustomerGauge could narrow down one area where the majority of B2B companies could be most improved, it’s in what we call the “grow” stage of Account Experience—and it contains the most critical program elements to bridging the B2B CX Gap.
In short, our “Grow” section will demonstrate and show you why tying revenue directly to your B2B experience program is no longer an option, but a necessity.
Why?
Because the companies that are actively tying revenue to B2B experience data in real-time and distributing this information acrossthe entire organization are not only growing faster than their toughest competition, but have greater control over the direction of criticalbusiness drivers and are actively closing the B2B CX gap.
Lack of Internal Alignment
Stunted Digital Transformation
Missing The Human Element
Can’t Track Business Outcomes
of B2B leaders believe that CX is a crucial business
priority
90%
PRIORITY
of B2B leaders have influence on the direction
of CX
ONLY
28%REALITY
Reasons For a Gap

51 | The State of B2B Account Experience
Yet, our data shows that 70%, or the majority of B2B companies, are still running B2C style insights-based customer experience programs and failing to make the financial connection that is commonplace in B2B Account Experience programs. No, we do not link our program to financial data
Yes, We know the value of promoters, passives and detractors
Yes, We analyze the financial data to understand the loyalty of our most valuable customers
Yes, Our workflows are based on satisfaction levels and financial data
A mere 6% report they are optimizing the B2B Account Experience by structuring workflows around sentiment and financial data. This small of a number should serve as a wake-up call to all B2B companies across the globe—if you want a seat at the table, if you want your C-Suite to stay involved and interested, if you want influence in your company across every department and even the board level, do this one thing:
Are optimizing the B2B Account Experience by structuring workflows around sentiment and financial data6%
Have You Linked Your B2B CX Program With Financial Data?
70% of B2B CX programs are not linked to financial data
70%
13%
11%
6%When done properly, the impact this can have on not only protecting existing revenue, but growing your bottom line through up-sell, cross-sell and referrals are immense.
In this section we’ll cover the state of B2B revenue experience and make direct recommendations based on the industry benchmark data and our high-performing Account Experience customer data benchmarks.
Tie your B2B experience program directly to revenue and Return on Investment.

52 | The State of B2B Account Experience
0101 Harness The Power of Account Experience
To Improve Retention, Start Measuring Your Retention Rate
Prioritize Change by Understanding The Financial Impact of Satisfaction Drivers
Leverage a Referral Program to Hyper-Charge Net New Revenue
Measure Up-sell and Cross-Sell Revenue and Tie It To Your Program to Prove ROI
Calculate Your Experience ROI
TIP 01
TIP 02
TIP 03
TIP 04
TIP 05
TIP 06
02020303040405050606
Growing From Feedback —Top 6 Tips
53 | The State of B2B Account Experience
Harness The Power of Account Experience
GROW TIP01
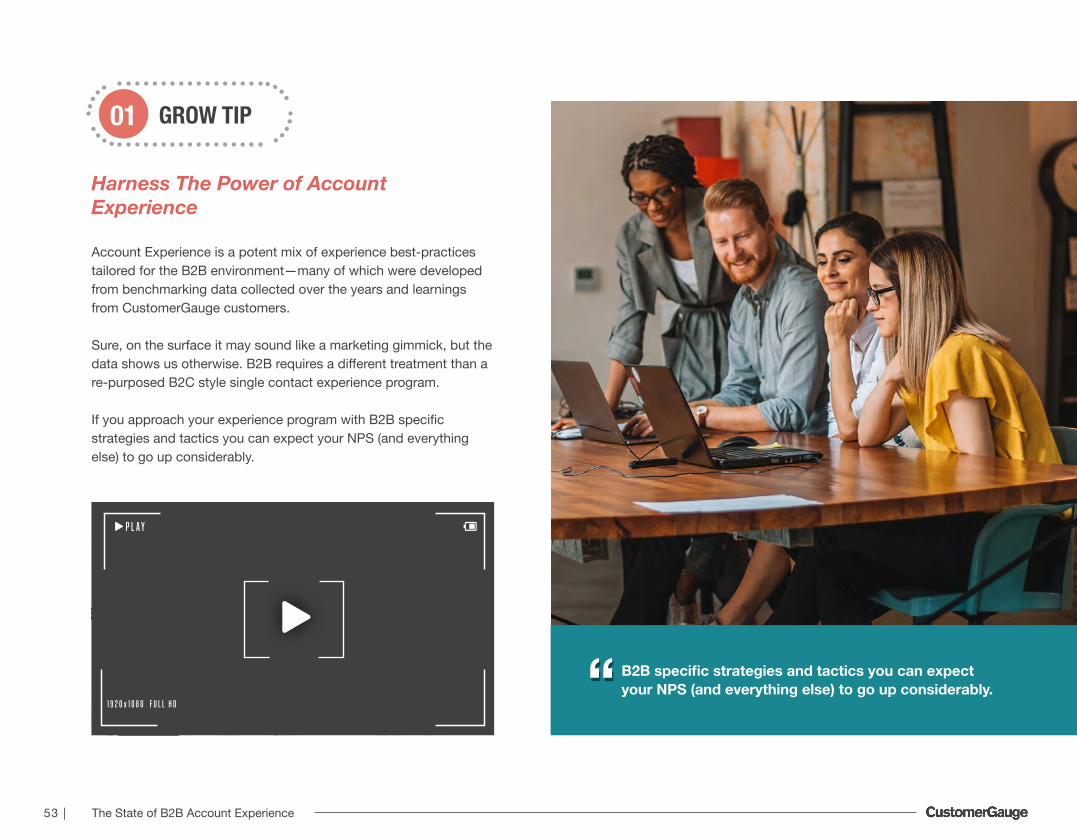
Account Experience is a potent mix of experience best-practices tailored for the B2B environment—many of which were developed from benchmarking data collected over the years and learnings from CustomerGauge customers.
Sure, on the surface it may sound like a marketing gimmick, but the data shows us otherwise. B2B requires a different treatment than a re-purposed B2C style single contact experience program.
If you approach your experience program with B2B specific strategies and tactics you can expect your NPS (and everything else) to go up considerably.
B2B specific strategies and tactics you can expect your NPS (and everything else) to go up considerably.““
P L A Y
1 9 2 0 x 1 0 8 0 F U L L H D

54 | The State of B2B Account Experience
B2B companies who utilize proper Account Experience best-practices experience a median increase of +4 NPS. Even more impressive at the high end, Account Experience could provide you with nearly a 2x (+9) point NPS advantage over the B2B companies using non-Account Experience tactics and strategies.
The data clearly shows a better path forward for B2B—it’s no longer good enough to hack together a program with B2C style strategies and tactics.
B2B is more complex and relationship heavy than B2C. Your experience strategy and technical framework to manage these complexities should adapt and offer scale across different locations and divisions.
If you continue to run things the ‘old’ way, the data is clear, you will be leaving NPS and revenue gains on the table.
-15
10 20 30 40 50 60 70 80 90
-12.7
0 0.2
2.3
5.47
8.6
13
16.419.8
-9.6
-1.2
13
5.46.2
9.4
11
-10
-5
0
5
10
15
20
25
NPS
Poi
nt In
crea
se
Percentile
Non AXAXAverage Account Experience NPS Point Increases vs. Non Account Experience
55 | The State of B2B Account Experience
GROW TIP02
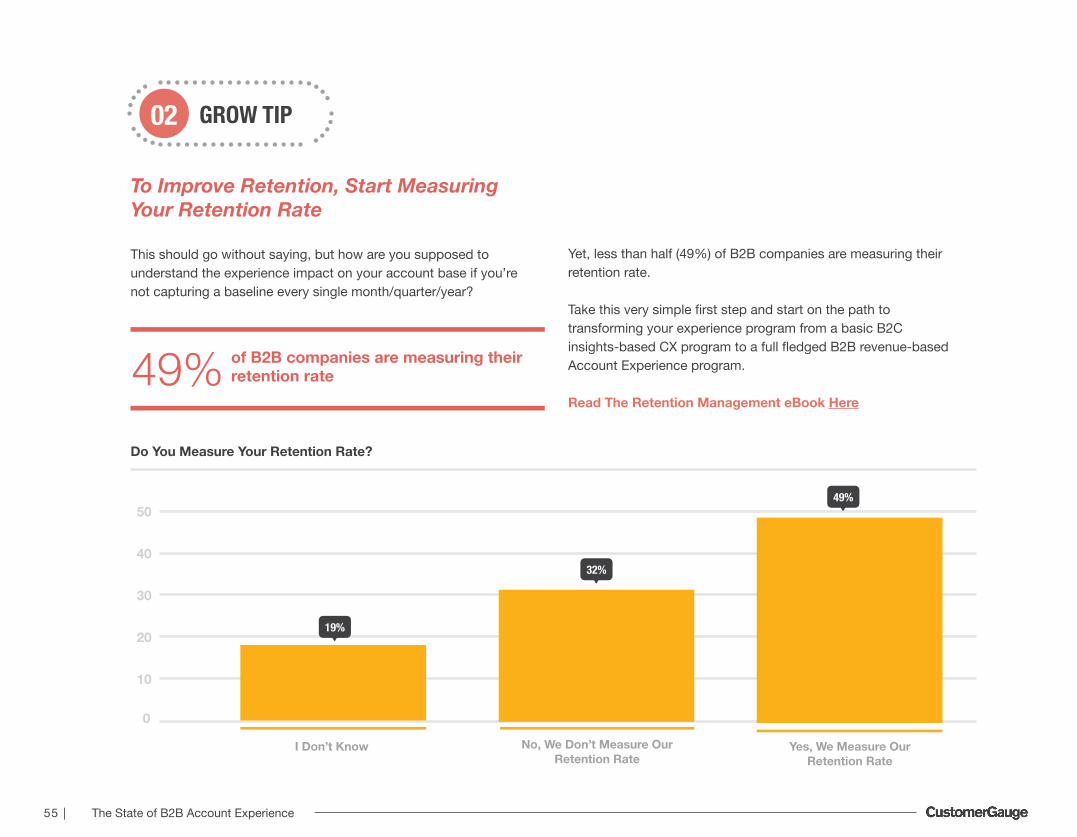
To Improve Retention, Start Measuring Your Retention Rate
This should go without saying, but how are you supposed to understand the experience impact on your account base if you’re not capturing a baseline every single month/quarter/year?
Yet, less than half (49%) of B2B companies are measuring their retention rate.
Take this very simple first step and start on the path to transforming your experience program from a basic B2C insights-based CX program to a full fledged B2B revenue-based Account Experience program.
Read The Retention Management eBook Here
Do You Measure Your Retention Rate?
I Don’t Know No, We Don’t Measure Our Retention Rate
Yes, We Measure Our Retention Rate
19%
32%
49%
of B2B companies are measuring their retention rate49%
10
0
20
30
40
50
56 | The State of B2B Account Experience
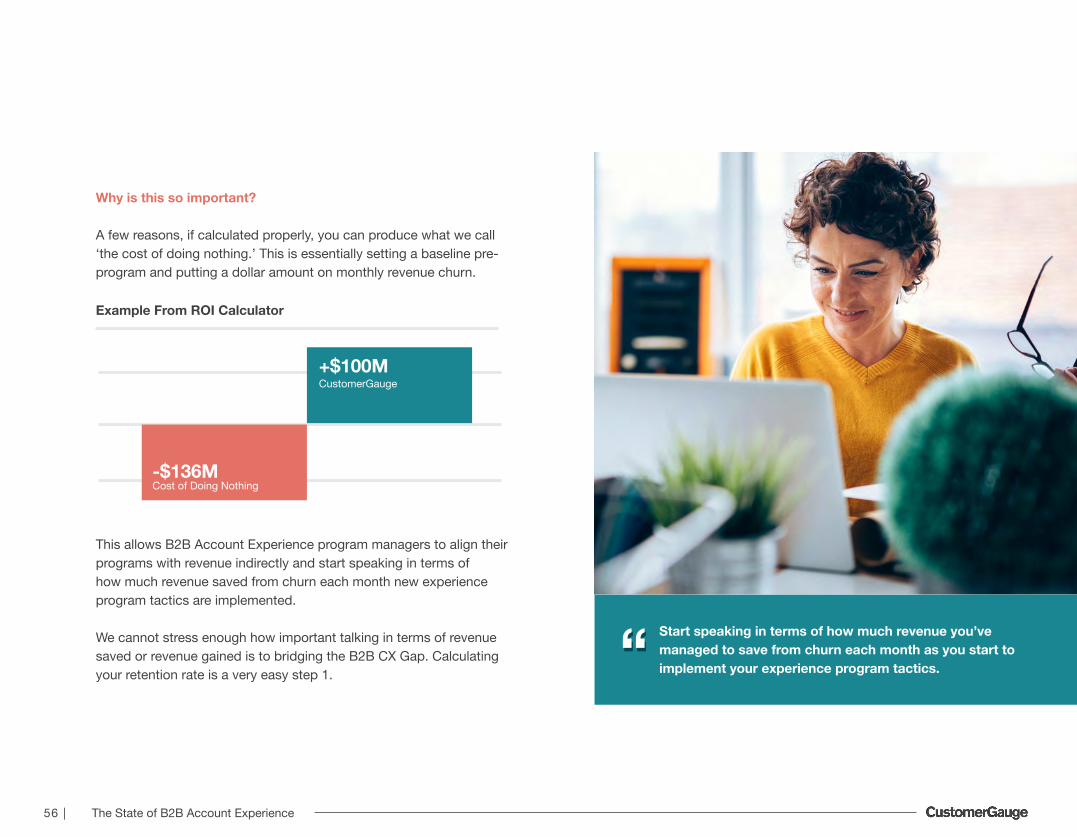
Why is this so important?
A few reasons, if calculated properly, you can produce what we call ‘the cost of doing nothing.’ This is essentially setting a baseline pre-program and putting a dollar amount on monthly revenue churn.
Example From ROI Calculator
This allows B2B Account Experience program managers to align their programs with revenue indirectly and start speaking in terms ofhow much revenue saved from churn each month new experience program tactics are implemented.
We cannot stress enough how important talking in terms of revenue saved or revenue gained is to bridging the B2B CX Gap. Calculating your retention rate is a very easy step 1.
Start speaking in terms of how much revenue you’ve managed to save from churn each month as you start to implement your experience program tactics.““
-$136M
+$100M
Cost of Doing Nothing
CustomerGauge
57 | The State of B2B Account Experience
GROW TIP03
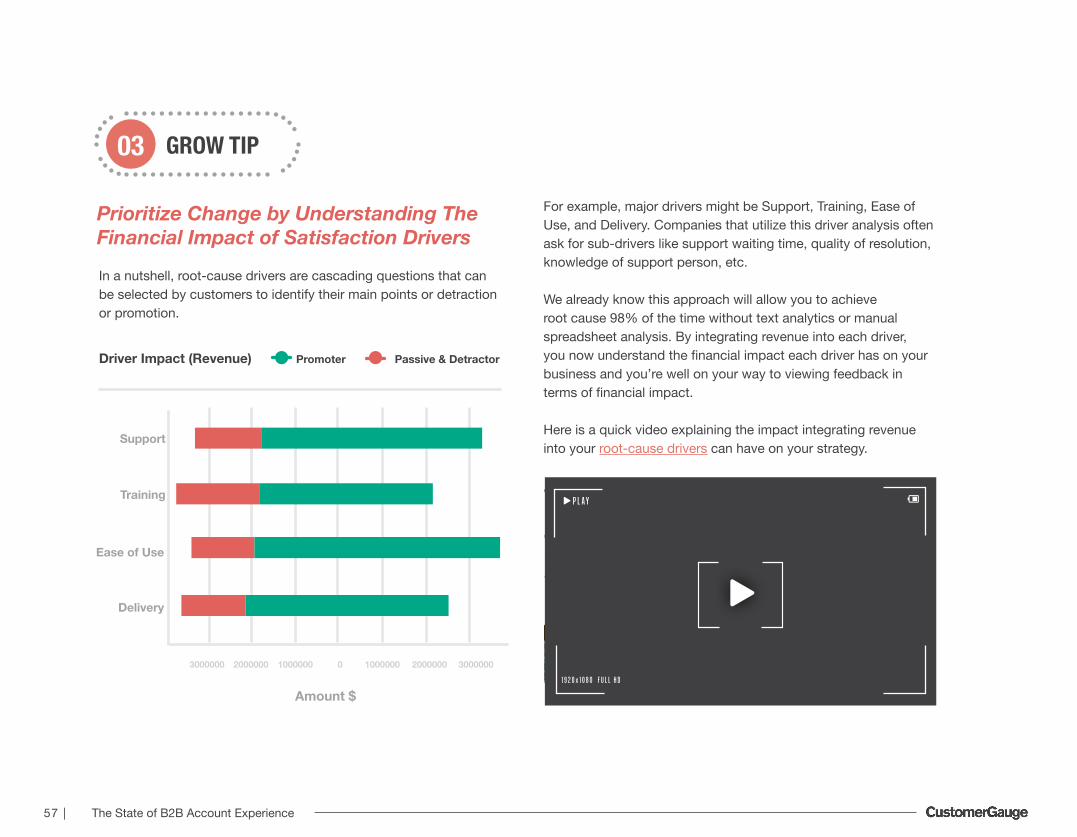
Prioritize Change by Understanding The Financial Impact of Satisfaction Drivers
In a nutshell, root-cause drivers are cascading questions that can be selected by customers to identify their main points or detractionor promotion.
For example, major drivers might be Support, Training, Ease of Use, and Delivery. Companies that utilize this driver analysis often ask for sub-drivers like support waiting time, quality of resolution, knowledge of support person, etc.
We already know this approach will allow you to achieve root cause 98% of the time without text analytics or manual spreadsheet analysis. By integrating revenue into each driver, you now understand the financial impact each driver has on your business and you’re well on your way to viewing feedback in terms of financial impact.
Here is a quick video explaining the impact integrating revenue into your root-cause drivers can have on your strategy.
P L A Y
1 9 2 0 x 1 0 8 0 F U L L H D
Support
Driver Impact (Revenue)
Training
Ease of Use
Delivery
Passive & DetractorPromoter
Amount $
3000000 30000002000000 20000001000000 10000000
58 | The State of B2B Account Experience
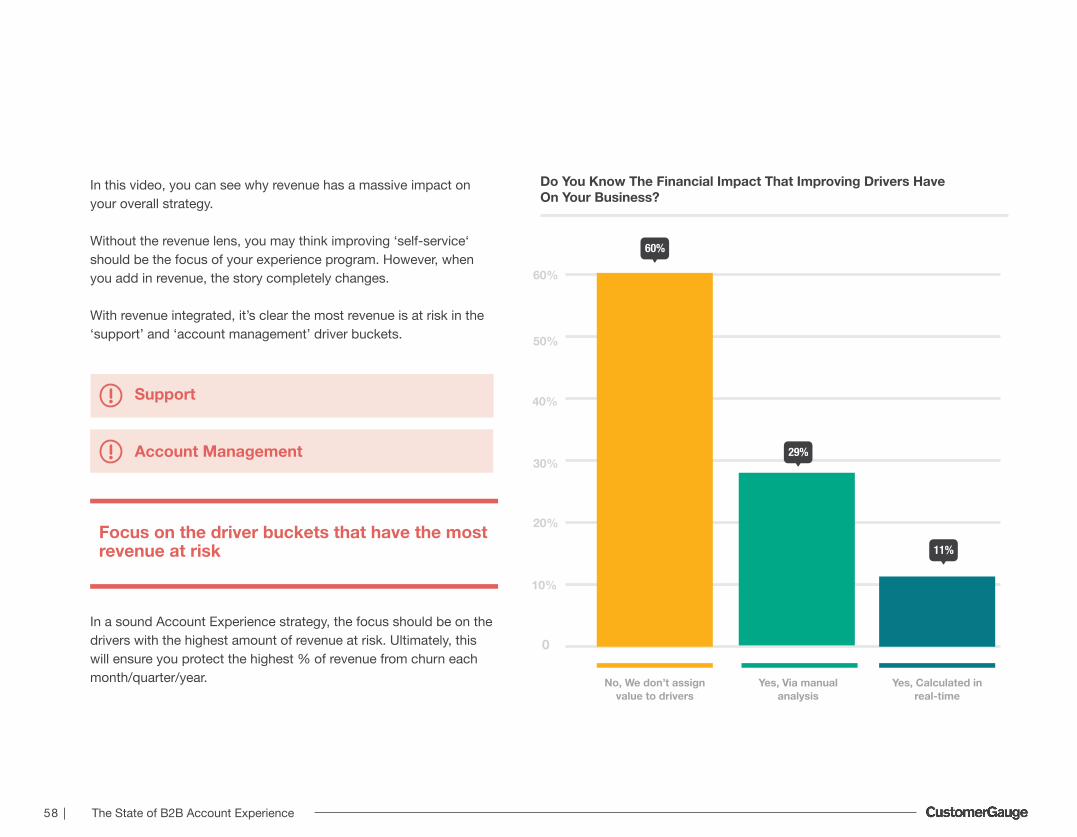
In this video, you can see why revenue has a massive impact on your overall strategy.
Without the revenue lens, you may think improving ‘self-service‘ should be the focus of your experience program. However, when you add in revenue, the story completely changes.
With revenue integrated, it’s clear the most revenue is at risk in the ‘support’ and ‘account management’ driver buckets.
In a sound Account Experience strategy, the focus should be on the drivers with the highest amount of revenue at risk. Ultimately, this will ensure you protect the highest % of revenue from churn each month/quarter/year.
Do You Know The Financial Impact That Improving Drivers Have On Your Business?
No, We don’t assign value to drivers
Yes, Via manual analysis
Yes, Calculated in real-time
10%
0
20%
30%
40%
50%
60%
Support
Account Management
Focus on the driver buckets that have the most revenue at risk
60%
29%
11%
59 | The State of B2B Account Experience
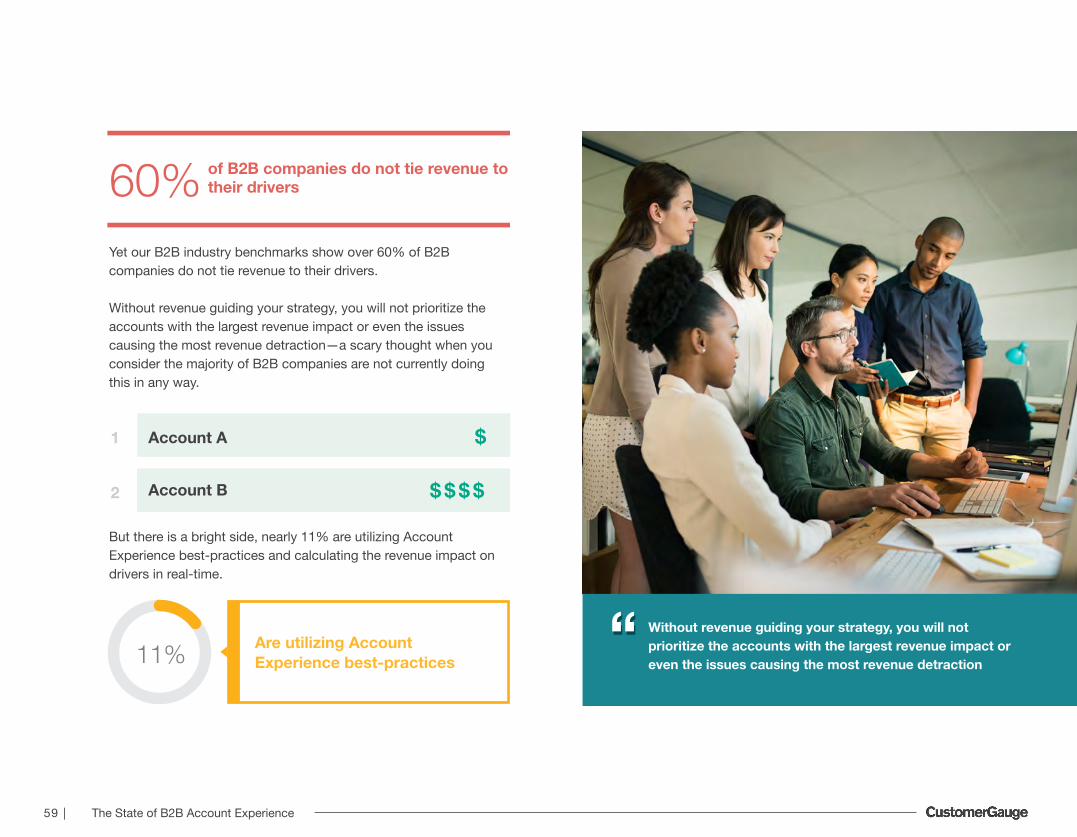
Yet our B2B industry benchmarks show over 60% of B2B companies do not tie revenue to their drivers.
Without revenue guiding your strategy, you will not prioritize the accounts with the largest revenue impact or even the issues causing the most revenue detraction—a scary thought when you consider the majority of B2B companies are not currently doing this in any way.
of B2B companies do not tie revenue to their drivers60%
Without revenue guiding your strategy, you will not prioritize the accounts with the largest revenue impact or even the issues causing the most revenue detraction
““11% Are utilizing Account Experience best-practices
But there is a bright side, nearly 11% are utilizing Account Experience best-practices and calculating the revenue impact on drivers in real-time.
Account A1
2 Account B

60 | The State of B2B Account Experience
GROW TIP04
Leverage a Referral Program to Hyper-Charge Net New Revenue
Referrals are the lifeblood of any healthy net-new sales machine. If your accounts love you, they will recommend you to their friends and colleagues.
It is the original premise Net Promoter was founded on in the seminal article “The One Number You Need to Grow” by Fred Reichheld. Yet 63% of B2B experience practitioners say they do not track referrals at all. Furthermore, only 5% track and link referrals to their programs can tie them to root-cause drivers.
Do You Track Referrals as a Result of Your B2B CX Program?
No
Yes, as part of sales and marketing activities
Yes, we track and link to our B2B CX Program
Yes, we track and link to our B2B CX Program & root cause
CustomerGauge alone sources up to 28% of new sales each month from referrals. That may sound too good to be true, but it’s a fact. And not only that, they close faster, for more money, and stay with us longer.
B2B companies are leaving large portions of potential revenue on the table by not tracking and linking referrals directly to their experience programs.
So it begs the question—why doesn’t everyone have a system to ask for and tie referrals back to their B2B experience program? We’re not entirely sure, but it’s relatively simple to construct with or without software. If you send out a survey, ask your promoters ifthey ‘have anyone in mind that would benefit from our product or service?’ The simple act of asking for the referral as opposed to trusting the referral will come in, can be the difference between hitting your revenue target for the quarter and missing it.
of new sales each month from referrals
Tie Referrals to Experience-Based Growth With Our B2B CX Referral Marketing GuideRead eBook
28%
63%
19%
13%
5%

61 | The State of B2B Account Experience
GROW TIP05
Measure Up-sell and Cross-Sell Revenue and Tie It To Your Program to Prove ROI
A shocking 65% of B2B companies either do not know or are not tying their up-sell/cross-sell efforts to their B2B experience program. Again, we consider this a massive miss for B2B companies across the globe.
This is low-hanging fruit—set up workflows based on promoter feedback who give kudos or feedback on a specific product and notify the appropriate account executive to start a conversation
Do You Measure Up-/Cross Sales as a Result of Your B2B CX Program?
with the customer. Use a simple attribution model that will track the initial conversation back to the survey feedback and associate the resulting up/cross-sell revenue to the experience program.
This can be fully-automated and hands-off if set up properly. But why go through all of this effort?
Again, the goal is to direct the conversations around your experience program to revenue contribution first. This ensures the long-term success of your program and will be a sure-fire way to get and maintain C-Suite buy-in.
I Don’t Know
No, We don’t measure up-sell/cross sales
Yes, We measure up-sell/ cross-sales, but not the drivers
Yes, We measure up-sell/ cross-sales, & analyze what drives sales
Yes, We measure everything above & link to our CX program
18%
47%
20%
10%
5%

62 | The State of B2B Account Experience
GROW TIP06
Calculate Your Experience ROI
Return on Investment is one of the most basic calculations a business can make. B2B companies of all shapes and sizes measure ROI constantly in sales, marketing, finance—nearly every department measures the ROI of their activities in some way. So the question becomes...
Why not the experience team or program?
Here is a rude awakening—the C-Suite will not consider simply collecting customer feedback as justification to account for the resource drain of time, money, and effort in the long run and your program will most certainly be at risk.
Calculate Your Experience ROIGet Started
If you don’t know how to calculate your ROI try out our free ROI Calculator above.
An astounding 86% of B2B experience practitioners have not calculated the ROI of their program. This stat even shocked us—it seems too many B2B companies are relying on goodwill, not ROI or revenue growth, to fuel their programs longevity and vitality.
Have You Calculated the Total ROI of Your B2B CX Program?
No, we don’t know the ROI
No, we haven’t calculated the ROI but seen positive financial implications
Yes, we have achieved significant financial results to justify our B2B CX Program
Yes, we have calculated an ROI that justifies our program
62%
24%
7%
7%

63 | The State of B2B Account Experience
SCENARIO A
SCENARIO B
Let’s walk through a few scenarios:
The C-Suite is bought in but you are only conducting basic ‘measure’ type activities like collecting feedback and reporting on the score. Quarter after quarter you’re improving the NPS and quarter after quarter, revenue is stagnant or decreasing. At some point, the C-Suite will lose faith in the NPS metric and dispute the correlation between NPS and growth. You’ve officially lost your ‘seat at the table’, the C-Suite has lost confidence in the metric and potentially your role. Within the next year, the program dies a slow death until the C-Suite pushes down a budget cut that essentially eliminates the program altogether and maybe even your job.
The C-Suite is not initially bought in, but you start reporting on referral sales, up-sells/cross-sells as a result of the experience program. Instead of reporting on NPS gains first, you give the C-Suite a hard revenue production number from the quarter. Then you walk them through the NPS score and a few customer comments. Then walk them through which drivers of their business are contributing to the most churn each month, but also which drivers are driving the most growth for the business. You advise the C-Suite on strategies to integrate this customer feedback into the business and grow as a result of it. You finish your presentation with a big bold triple digit ROI number you have tracked since the program’s inception and ask for more resources to continue chasing the additional revenue opportunities ‘left on the table.’
An astounding 86% of B2B experience practitioners have not calculated the ROI of their program““

64 | The State of B2B Account Experience
Which of these program scenarios would you say is a standard B2B experience practitioner vs. an advanced Account Experience operator?
It should be obvious at this point, but yes, scenario B is the AX operator and the program setup that is most likely to last the long-term and drive real revenue growth as a result.
Question:
Answer:
If you want your program to succeed and you want to increase your influence, tying to revenue and calculating your ROI should be done in real-time or at the very least, an exercise every month.
Q
A
86%of B2B Experience Practitioners Have Not
Calculated The ROI of Their ProgramTying to revenue and calculating your ROI should be done in real-time““

65 | The State of B2B Account Experience
65 B2B Benchmarks Report
CULTURE:B2B EXPERIENCE FOUNDATIONS CULTURE:B2B EXPERIENCE FOUNDATIONS

66 | The State of B2B Account Experience
Account Experience Foundations & Culture Framework
Even the most effective experience strategies and tactics can not overcome a cultural barrier in B2B.
This was a hard lesson learned from over 15+ years of implementing B2B experience programs for mid to enterprise-level clients.
It doesn’t matter how well thought out the strategy or how effective the processes are, if the cultural fit and buy-in does not exist across the different levels and departments of an organization, your program is almost certain to fail. This is a sobering thought for many B2B experience practitioners.
Many practitioners do not ‘belong’ to a specific department, can not tell other departments what to do, and have minimal interaction with the C-Suite. In short, they lack power in organizations.
That being said, it’s not a hopeless task. In fact, over the years while in the trenches with some of the most well-known B2B brands in the world, CustomerGauge started to formulate a playbook.
When it was time to conduct our benchmarks report data collection, we knew it would be the perfect opportunity to not only test our playbook methodology, but get a sense of how well B2B experience practitioners are managing the culture and buy-in elements of their programs.
Because here’s the universal truth:
If B2B companies do not embed account feedback into their operational processes, lead from the top down, and continuously engage the rest of their colleagues, the experience program will not only be ineffective, but eventually, cease to exist.
Thus, it is critical to set a strong foundation of B2B CX fundamentals and nail the cultural element regardless of industry or company size.
So how did B2B companies fare? Well, there is still work to be done.
Even the most effective experience strategies and tactics can not overcome a cultural barrier in B2B.

67 | The State of B2B Account Experience
0101 Set Overall B2B Experience Program Targets
Align Your Program With The Company Strategy and Your NPS Will Increase
Share Results With Your Entire Organization
Establish a Core Team and Get Them Certified
Tear Down These B2B Silos
Journey Map Your Way to Higher NPS
TIP 01
TIP 02
TIP 03
TIP 04
TIP 05
TIP 06
02020303040405050606
Culture Framework —Top 6 Tips

68 | The State of B2B Account Experience
CULTURE TIP01
Set Overall B2B Experience Program Targets
As we have seen in previous sections of this report, setting aggressive targets can have a positive impact on overall NPS and retention numbers. For our culture and foundations portion of the assessment, we wanted to get a sense of whether or not B2B companies are setting high-level CX targets and making these targets known throughout the organization to drive meaningful change in their business.
Unfortunately, nearly 42% of B2B companies are failing to even tackle this fundamental element that drives additional growth. However, we’re happy to report that 44% are setting targets with another 14% setting targets with integrated ‘what if’ scenarios. This essentially allows companies to remain agile with their CX strategy and adjust targets based on scenario planning.
We decided to dig a little deeper into setting targets and look at the distribution across industries. Interestingly, some industries fared better than others when it comes to setting targets. Consumer Packaged Goods and Wholesale take the top spots for setting agile targets with integrated ‘what if’ scenarios.
In contrast, Computer Software and Logistics are the industries least likely to set targets.
Do You Set Targets For Your B2B CX Program?
No, CX Targets Set
Yes, CX Targets Set
Yes, CX Targets Based on What If Scenarios
42%
44%
14%

69 | The State of B2B Account Experience
Telecommunications 38% 50% 12%
40% 47% 13%Financial Services
38% 45% 17%IT Services
45% 50% 5%Logistics
42% 46% 12%Manufacturing
36% 50% 14%Industry Services
56% 33% 11%Computer Software
44% 41% 15%Professional Services
40% 40% 20%Wholesale
42% 50% 8%Energy/ Utilities
25% 50% 25%Consumer Packaged Goods
No, CX Targets Not Set
Yes, CX Targets Set
Yes, CX Targets Based on
What-if Scenarios
Setting Targets By Industry

70 | The State of B2B Account Experience
CULTURE TIP02
Align Your Program With The Company Strategy and Your NPS Will Increase
It is quite common for potential clients to come ask CustomerGauge for guidance on increasing the visibility of theirprogram. Based on these conversations, anecdotally we know B2B practitioners are struggling to get and keep or even get a ‘seat at the table.’ After compiling our benchmarks data, it becomes clear why these practitioners are struggling—only 20% have effectively influenced their entire organization to understand how their experience programs support their overall company strategy.
That is a low percentage of practitioners and it is obvious why these practitioners are struggling to gain influence in an organization— They are not effectively communicating how these programs support the overall strategy. More than 42% of programs are not aligned, Let us hope we can increase this number in 2022.
B2B practitioners are struggling to get and keep a ‘seat at the table.’
Is Your B2B CX Program Aligned with Company Strategy?
No, We are not entirely aligned
Yes, Our B2B CX Program Supports Our Strategy
Yes, The Entire Organization Understands How CX Supports The Strategy
20%
38% 42%

71 | The State of B2B Account Experience
So why do we insist all Account Experience customers align their programs with the overall company strategy and mission? It’s proven to not only increase buy-in, but NPS scores.
In fact, our benchmarks data shows a 12+ point increase in NPS between those who are ‘not entirely aligned’ and ‘yes, the entire organization understands how CX supports the strategy.’
The data is clear, B2B companies must continue to focus on aligning their programs with larger-scale organizational strategies— internal employees will then drive higher satisfaction rates from your accounts as a result.
Points increase in NPS for organizations who know and support the CX strategy12+
Program Alignments Impact on NPS
No, We Are Not Entirely Aligned
Yes, The Organization Knows CX Supports Strategy
Yes, Our B2B CX Program Supports Our Strategy
50
43
38
72 | The State of B2B Account Experience
CULTURE TIP03
Share Results With Your Entire Organization
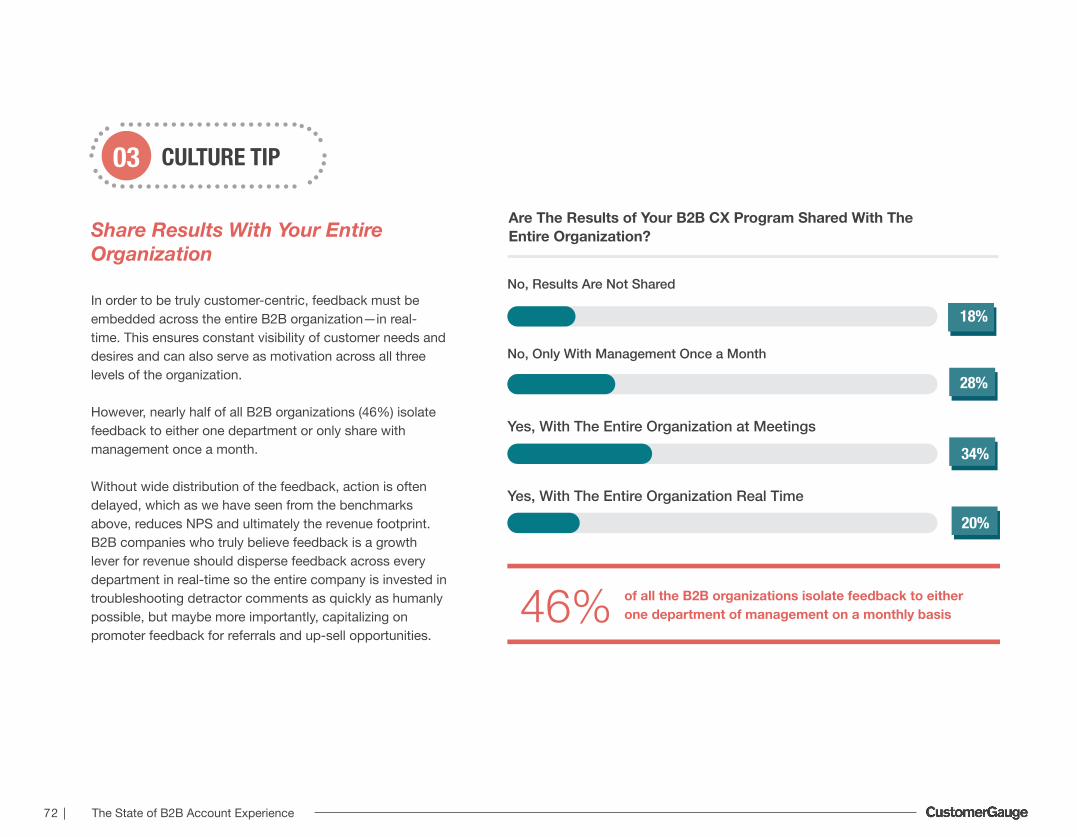
In order to be truly customer-centric, feedback must be embedded across the entire B2B organization—in real-time. This ensures constant visibility of customer needs and desires and can also serve as motivation across all three levels of the organization.
However, nearly half of all B2B organizations (46%) isolate feedback to either one department or only share with management once a month.
Without wide distribution of the feedback, action is often delayed, which as we have seen from the benchmarks above, reduces NPS and ultimately the revenue footprint. B2B companies who truly believe feedback is a growth lever for revenue should disperse feedback across every department in real-time so the entire company is invested in troubleshooting detractor comments as quickly as humanly possible, but maybe more importantly, capitalizing on promoter feedback for referrals and up-sell opportunities.
Are The Results of Your B2B CX Program Shared With The Entire Organization?
No, Results Are Not Shared
No, Only With Management Once a Month
Yes, With The Entire Organization at Meetings
Yes, With The Entire Organization Real Time
of all the B2B organizations isolate feedback to either one department of management on a monthly basis46%
18%
28%
34%
20%

73 | The State of B2B Account Experience
CULTURE TIP04
Establish a Core Team and Get Them Certified
A surprising 32% of companies do not have a core team operating their experience program. Additionally, another 24% of companies operate their programs with a single person.
The takeaway?
B2B Experience programs are severely understaffed and under-resourced. But there is hope—B2B practitioners who focus on ROI and revenue as a result of their experience program are much more likely to garner additional resources and headcount.
By aligning the experience program with revenue and ROI, it will shift it from a cost-center to a revenue generating asset.
Additionally, companies must start operating an experience program like any other revenue-generating department and demand a certain level of skill and training.
Experience certifications ensure your talent pool is staying current with experience trends and best-practices.
Do You Have a Core B2B CX Team?
No Core Team Exists
KEY
Yes, CX is Administered by 1 PersonYes, CX is Administered by a Team
Yes, CX is Administered by a CX Certified Team
37%
32%
24%8%
32%Companies Don’t Have a
Core Team Operating Their Experience Program
Take The B2B Account Experience CertificationGet Certified

74 | The State of B2B Account Experience
CULTURE TIP05
Tear Down These B2B Silos
Siloing experience data in B2B is pervasive. In fact, over 61% of B2B companies report their experience data is only deployed on a departmental or divisional level. This is troublesome knowing now how important aligning CX programs with the overall company strategy is to achieve organizational level support.
It seems the majority of B2B experience practitioners are not concerned with deploying their data and processes across departments. We suspect this is as a result of either a lack of political influence or company-specific inertia related to deploying new initiatives.
In addition, the advent of ‘Customer Success’ and its prevalence in B2B SaaS has organically created a large silo of experience data isolated to one single department.
The core strength of a robust Account Experience program is the ability to distribute experience data integrated with revenue across departmental, divisional, and geographical boundaries leading to a standardized approach to account feedback and growth. Ultimately, the goal is to tie the program strategy to the overall company strategy then align to revenue.
This will ensure company-wide adoption of the program from the C-Suite to the front-line.
Is CX Deployed Throughout The Enterprise?
No, Only on a Department/Division Level
Yes, Across the entire Organization
39%
61%
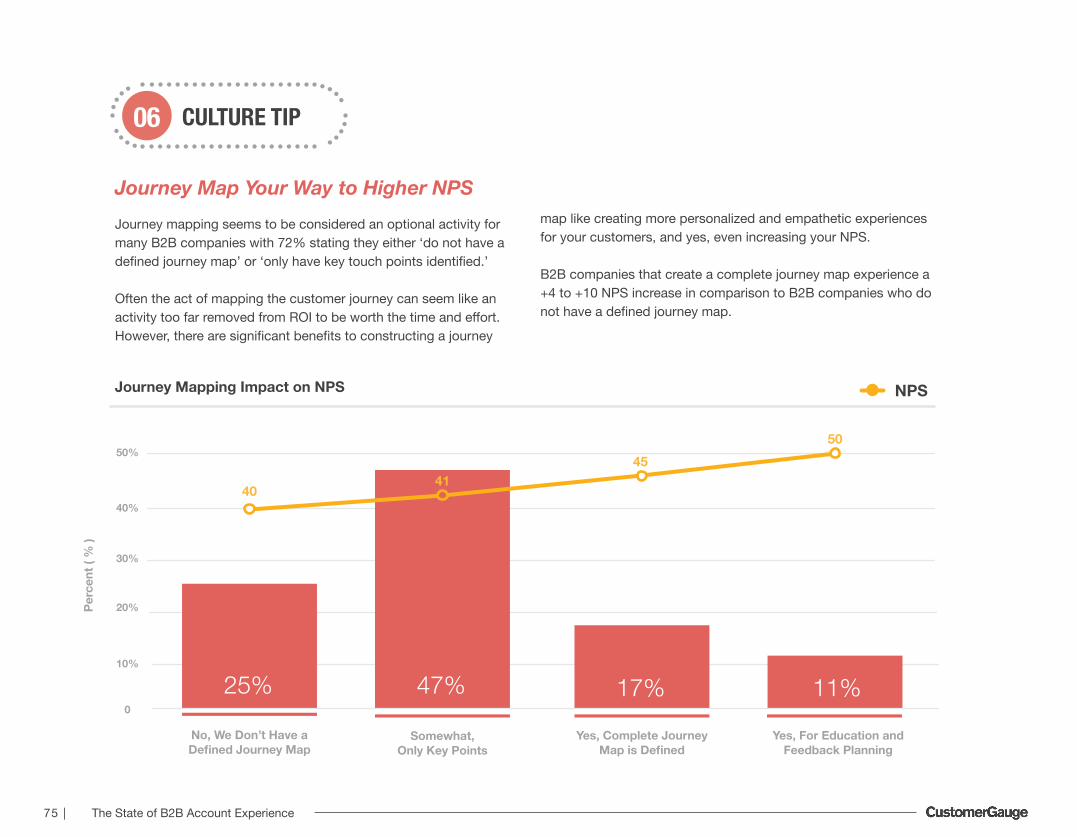
75 | The State of B2B Account Experience
CULTURE TIP06
Journey Map Your Way to Higher NPSJourney mapping seems to be considered an optional activity for many B2B companies with 72% stating they either ‘do not have a defined journey map’ or ‘only have key touch points identified.’
Often the act of mapping the customer journey can seem like an activity too far removed from ROI to be worth the time and effort. However, there are significant benefits to constructing a journey
map like creating more personalized and empathetic experiences for your customers, and yes, even increasing your NPS.
B2B companies that create a complete journey map experience a +4 to +10 NPS increase in comparison to B2B companies who do not have a defined journey map.
Journey Mapping Impact on NPS NPS
40
No, We Don’t Have a Defined Journey Map
Perc
ent (
% )
47% 17% 11%25%
Yes, Complete Journey Map is Defined
Yes, For Education and Feedback Planning
Somewhat, Only Key Points
0
10%
20%
30%
40%
50%
4145
50
76 | The State of B2B Account Experience
76 B2B Benchmarks Report
INDUSTRY BENCHMARKS INDUSTRY BENCHMARKS

77 | The State of B2B Account Experience
Industry Benchmarks
This year we examine the trends and metrics of major B2B focused industries from Consumer Packaged Goods to Telecommunications.
To get a state of the Account Experience and Net Promoter landscape, CustomerGauge looked at cross-industry averages in NPS and Retention Rates.
Something To Note
The Net Promoter and retention numbers are based on statistically significant data provided by surveyed customers. The Net PromoterScores captured from our assessment are self-reported.
The CustomerGauge Account Experience customer data was pulled from our platform and anonymized.
For both NPS and retention, we provide the median of all collected data. The following section provides additional context andinformation on the average net promoter scores and industry experience trends to look out for in the years to come.
To get a state of the Account Experience and Net Promoter landscape, CustomerGauge looked at cross-industry averages in NPS and Retention Rates.““

78 | The State of B2B Account Experience
Wholesale
Health Care
Professional Services
IT Services
Telecommunications
Consumer Packaged Goods
Financial Services
Logistics
Computer Software
Industry Services
Energy/Utilities
Manufacturing
Industry Median Net Promoter Scores
38
58
44
36
44
34
31
58
41
40
44
49

79 | The State of B2B Account Experience
Industry Median Retention Rate (%)
Logistics
IT Services
Professional Services
Consumer Packaged Goods
Financial Services
Wholesale
Energy/Utilities
Telecommunications
Manufacturing
Industry Services
Computer Software
60
88
73
60
81
44
89
69
65
83
86

80 | The State of B2B Account Experience
Telecommunications NPS
31
Throughout the COVID-19 pandemic, telecom companies enabled the technologies that helped us stay remote–and stay sane. This included an increased need for customer touch-points and support in an industry that’s notoriously marked by poor customer service. That being said, telecom achieved an NPS score of 31 this year, marking a 7 point increase.
Even as the pandemic winds down, the world will continue to operate remotely in many cases. 5G network speeds, artificial intelligence, and the Internet of Things (IoT) will enable new business models and forms of customer service. As a result, telecommunications will continue to play a vital role for consumers and businesses. According to a report from Deloitte, more than 90% of networking executives believe that the success of their business largely depends on “advanced networking technologies.”
In light of telecom’s vital role to the future of business, providers can focus on providing a more focused customer experience. The advent of 5G has created opportunities for new kinds of businesses and in turn, an increase in enterprise-level customers. To respond to the needs and behaviors of these customers, telecom companies can use a proactive, data-driven approach to customer experience. CustomerGauge’s Account Experience program can help telecommunications companies respond to problematic areas before they cause churn….and transform telecom’s reputation from poor service into responsive, customer-centered CX.
Telecommunications played a more important role than ever in 2020, throughout the COVID-19 pandemic.
10
1318
30 36
4350
45
5654
62 60 63 6365
3125
212320
020
Percentile (%)
CustomerGauge AX Customer NPSIndustry NPS
30 40
40
50 60
60
70 80
80
90
“Working together with CustomerGauge ,we were able to analyze reliable customer feedback data. The strategy was aimed at maintaining high and middle-end customer’s satisfaction level, while increasing the engagement on the standard segment customers.” (Colt, Carla Haines)

81 | The State of B2B Account Experience
Financial Services NPS
44
A remote workforce, reduced retail traffic, financial instability, and the rise of fin-tech changed the way financial institutions operate and connect with customers, and changed what customers expect from their financial partners.
In 2020, NPS for financial services and banking fell at 44 and 30, respectively–a decrease from previous NPS scores of 46 and 37. The lesson? Financial services and banking need to up their game through more personalized experiences.
As customers become more educated about security risks and privacy, they expect their partners to offer them a transparent, tailored experience. 60% of customers don’t feel comfortable sharing personal information with their bank without an additional layer of privacy or reassurance (EY). Not only that, but the increased use of fin-tech has changed what consumers expect from a bank and how they interact with their primary financial service.
In response to change, financial services and banks are wisely concentrating on a better customer experience. In fact, 75% of banks are investing in a business model that places the customer at the center. This can’t just apply to consumers, however. Financial services and banks will also benefit from focusing on creating a more tailored B2B customer experience that proactively responds to behavior. USAA bank is an outstanding example of putting customers at the center of everything they do, with excellent customer support, a “customers before profits” approach, and early adoption of online banking. The result? A stellar NPS of 75.
The global pandemic only accelerated the digital transformation of financial services and banking.
10
14
57
69
4441
20
020
Percentile (%)
CustomerGauge AX Customer NPSIndustry NPS
30 40
40
50 60
60
70 80
80
90
30
22
3833
4245 46
51
71
61
73 70 73

82 | The State of B2B Account Experience
HealthcareNPS
58
According to the American Hospital Association, hospitals lost $323.1 billion in 2020. Private healthcare providers suffered as well, with a significant decrease in patient appointments. Unfortunately, the industry is not expected to quickly bounce back. In 2021, 39% of hospitals are expected to be in the red (Kaufman Hall).
The silver lining is that the pandemic accelerated the digitalization of healthcare and changed the way many consumers take ownership of their health. Trends that were slowly taking root–such as tele-health appointments–quickly became critical pieces of healthcare in a remote world. Faced with the threat of the coronavirus, many consumers shifted towards a more active role in caring for their own health. Looking to the future, healthcare providers should expect to adopt valuable new technologies and continue finding ways to meet and exceed patient expectations. Patients are also more selective and research-savvy than ever. According to Google, patients are 3X more likely to use search than non-search methods to find a hospital. To set themselves apart from the competition, providers can create more personalized patient experiences through collecting and acting on feedback such as with the Net Promoter System.
Intuitive Health is an excellent example of this approach. Using CustomerGauge, they created a system for follow-up and feedback that helped them improve their patient experience, even through a global pandemic.
In 2020, healthcare providers not only suffered the burden of caring for COVID-19 patients and preventing spread; they also took an enormous financial hit.
“Knowing how important promoters are to our business, we implemented improvements as issues arise,” said CMO of Intuitive Health, David Apple. “For example, if we see any consistent issues in billing, co-pay, or other procedures, we make changes in our operational process to improve based on that patient feedback.”
10
26
73
5855
20
020
Percentile (%)
CustomerGauge AX Customer NPSIndustry NPS
30 40
40
50 60
60
70 80
80
39
34
5045
60
7163 68
77
71
7876
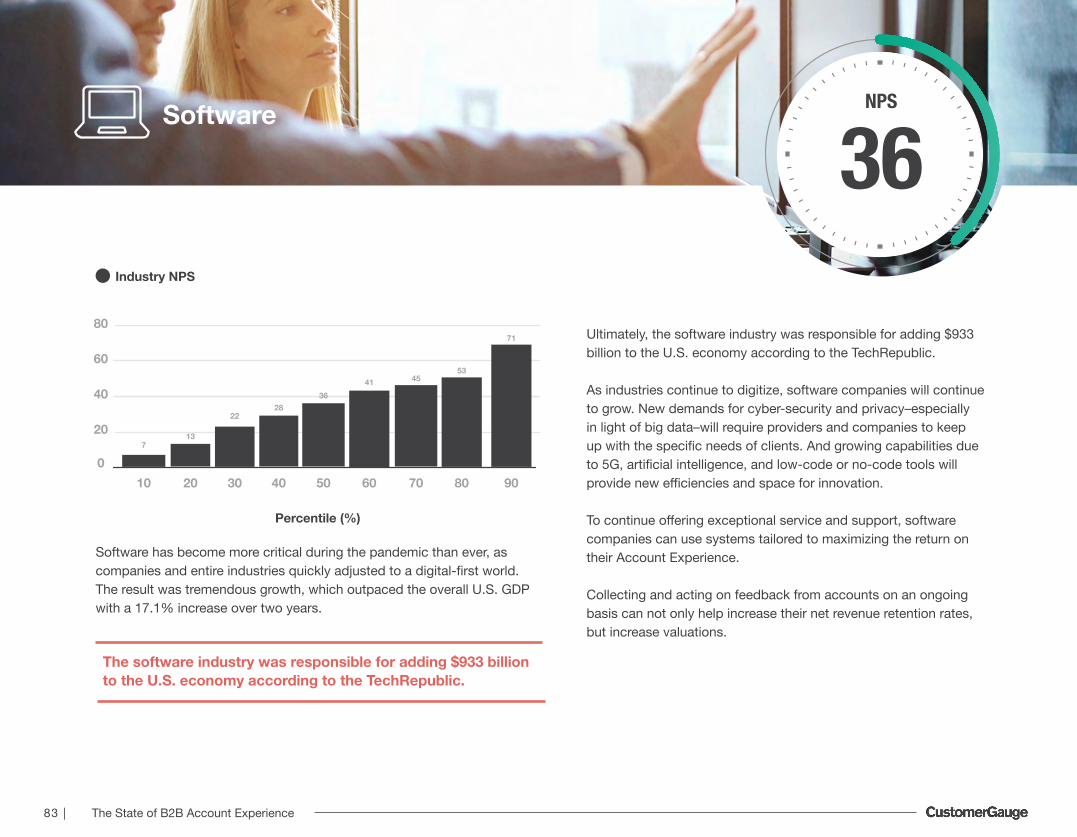
83 | The State of B2B Account Experience
Software NPS
36
Software has become more critical during the pandemic than ever, as companies and entire industries quickly adjusted to a digital-first world. The result was tremendous growth, which outpaced the overall U.S. GDP with a 17.1% increase over two years.
Ultimately, the software industry was responsible for adding $933 billion to the U.S. economy according to the TechRepublic.
As industries continue to digitize, software companies will continue to grow. New demands for cyber-security and privacy–especially in light of big data–will require providers and companies to keep up with the specific needs of clients. And growing capabilities due to 5G, artificial intelligence, and low-code or no-code tools will provide new efficiencies and space for innovation.
To continue offering exceptional service and support, software companies can use systems tailored to maximizing the return on their Account Experience.
Collecting and acting on feedback from accounts on an ongoing basis can not only help increase their net revenue retention rates, but increase valuations.
The software industry was responsible for adding $933 billion to the U.S. economy according to the TechRepublic.
10
7
3628
20
020
Percentile (%)
Industry NPS
30 40
40
50 60
60
70 80 90
80
13
22
41 4553
71

84 | The State of B2B Account Experience
Logistics NPS
38
According to the International Finance Corporation, more than 200 of the Fortune 500 companies are present in the Wuhan province, where the outbreak began. Ultimately, disruption in China and elsewhere affected industries ranging from the pharmaceutical to automotive to consumer goods.
If anything, the global pandemic highlighted a greater need for resilience in logistics. New trends in technology are making the flow and movement of goods easier and more efficient than ever. Robots can be used to manage freight and replace manual labor. Driver-less trucks can analyze traffic to operate at maximum efficiency. And specialized software tools can make logistics more efficient in every sense of the word.
While logistics providers can rely on AI, robots, and software to automate workflows and save time and labor, they can’t rely on technology alone to create a great customer experience. Logistics companies will still need personalized tools to manage their account relationships.
CustomerGauge’s Account Experience can help logistics companies take a proactive approach to account management through the Net Promoter System, a proven, data-backed system for tracking customer loyalty.
2020 was a significant year for the logistics sector. The COVID-19 pandemic disrupted supply chains all over the world, perhaps most critically in China.
10
3
14
45 45 47 5141
55
47
5851
60 5963
3834
23
45
20
020
Percentile (%)
CustomerGauge AX Customer NPSIndustry NPS
30 40
40
50 60
60
70 80
80
90

85 | The State of B2B Account Experience
Manufacturing NPS
49
Or Industry 4.0. Industry 4.0 is marked by technologies such as the Internet of Things (IoT), artificial intelligence, 3-D printing, 5G, and augmented/virtual reality to create new insight, efficiency, and insight within conventional industries. 2020 highlighted the need for these technologies more than ever before. According to a report from McKinsey,
94% of global manufacturing companies surveyed said that Industry 4.0 helped them stay afloat during the crisis. Other trends in manufacturing include local manufacturing and predictive analytics. Local manufacturing, or shoring, brings manufacturing closer to home in response to international trade tensions and other challenging circumstances. And predictive analytics helps manufacturers prevent expensive outages and repair issues with machinery.
The bottom line? The manufacturing industry is responding to changing environments and improving efficiency.To perform well, however, manufacturers need more than Industry 4.0, local manufacturing, and predictive analytics for their machinery. They need tools and strategies to help them support and maintain account relationships. Companies that focus on customer relationships ultimately come out on top. Computer manufacturer IBM, for example, consistently ranks at the top of B2B companies, partially through their stellar customer service. CustomerGauge’s SWOT analysis can likewise help manufacturers stay on top of account relationships by giving them the insight and data they need to identify problematic areas, resolve problems proactively, and create better service.
Manufacturing is experiencing transformation in the form of the so-called “Fourth Industrial Revolution,”
10
25
51 514947
20
020
Percentile (%)
CustomerGauge AX Customer NPSIndustry NPS
30 40
40
50 60
60
70 80
80
90
2938
44 44 47 48
6165
52
75
55
77
63

86 | The State of B2B Account Experience
IT Services NPS
40
As technology evolves and the industry shifts, IT will continue to be indispensable. IT will help businesses to build infrastructure for security and storage, manage potential problems, and integrate new technologies to keep them competitive.
As more and more companies look to outsource IT, managed service providers, or MSP’s, will continue to be an important trend.
Over half of all IT services have transitioned to a managed service model, taking a more proactive approach to maintaining technology infrastructures.
To grow customer loyalty, IT providers can build ongoing feedback loops to ensure they continue to provide tailored support. Unlike CSAT, NPS can help tell the full story of a company’s performance and give accounts a voice.
The end result? A higher NPS….and accounts that don’t churn.
Though the global IT sector took a slight step back in 2020, the overall industry is anticipated to reach $5 trillion in 2021, according to the research consultancy IDC.
10
3.5
51 55
39.533
20
020
Percentile (%)
CustomerGauge AX Customer NPSIndustry NPS
30 40
40
50 60
60
70 80
80
90
4
19.4
25 28
4147
43.250
59 60 61
7364
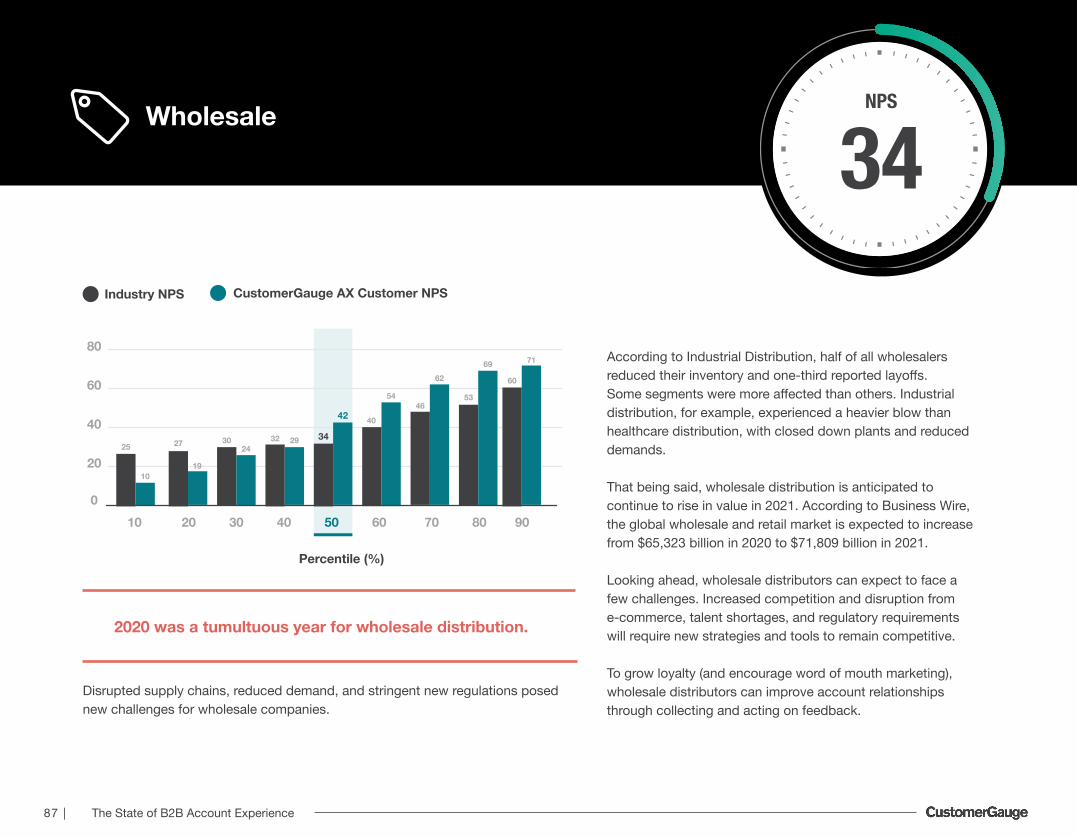
87 | The State of B2B Account Experience
Wholesale NPS
34
According to Industrial Distribution, half of all wholesalers reduced their inventory and one-third reported layoffs. Some segments were more affected than others. Industrial distribution, for example, experienced a heavier blow than healthcare distribution, with closed down plants and reduced demands.
That being said, wholesale distribution is anticipated to continue to rise in value in 2021. According to Business Wire, the global wholesale and retail market is expected to increase from $65,323 billion in 2020 to $71,809 billion in 2021.
Looking ahead, wholesale distributors can expect to face a few challenges. Increased competition and disruption from e-commerce, talent shortages, and regulatory requirements will require new strategies and tools to remain competitive.
To grow loyalty (and encourage word of mouth marketing), wholesale distributors can improve account relationships through collecting and acting on feedback.
2020 was a tumultuous year for wholesale distribution.
10
25
42
54
3432
20
020
Percentile (%)
CustomerGauge AX Customer NPSIndustry NPS
30 40
40
50 60
60
70 80
80
90
10
27
19
3024
29
40
46
62
53
69
60
71
Disrupted supply chains, reduced demand, and stringent new regulations posed new challenges for wholesale companies.
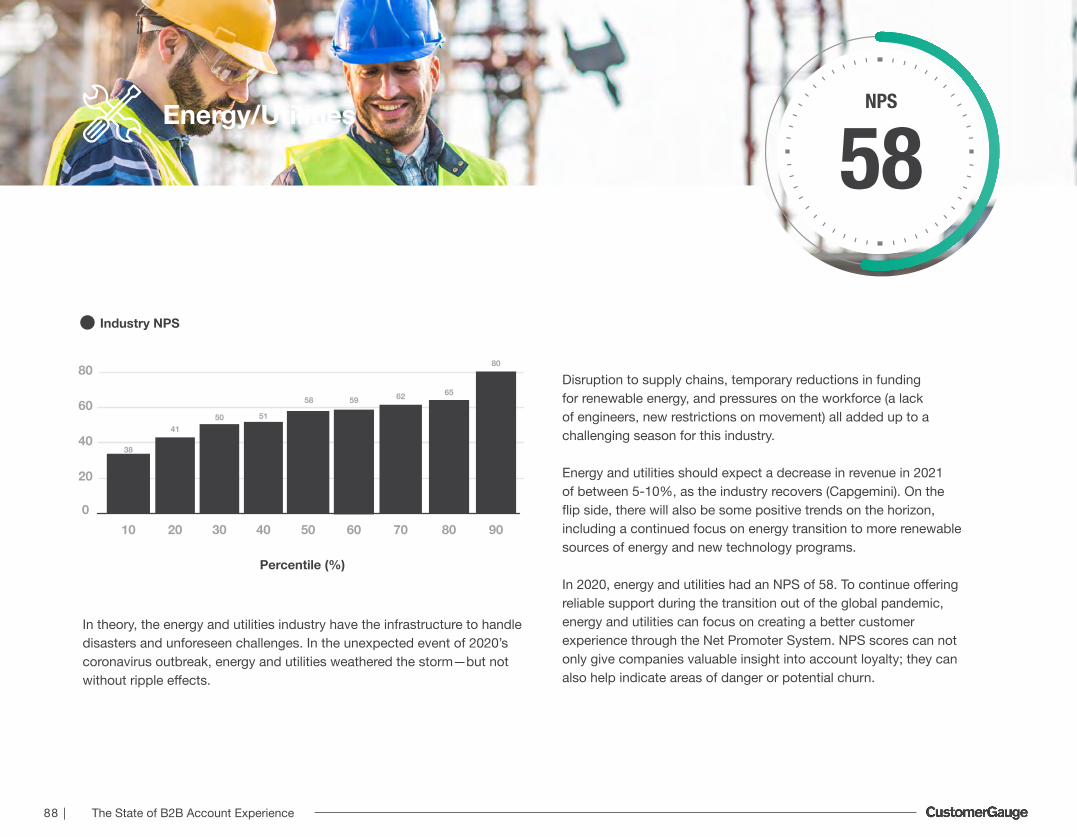
88 | The State of B2B Account Experience
Energy/Utilities NPS
58
In theory, the energy and utilities industry have the infrastructure to handle disasters and unforeseen challenges. In the unexpected event of 2020’s coronavirus outbreak, energy and utilities weathered the storm —but not without ripple effects.
Disruption to supply chains, temporary reductions in funding for renewable energy, and pressures on the workforce (a lack of engineers, new restrictions on movement) all added up to a challenging season for this industry.
Energy and utilities should expect a decrease in revenue in 2021 of between 5-10%, as the industry recovers (Capgemini). On the flip side, there will also be some positive trends on the horizon, including a continued focus on energy transition to more renewable sources of energy and new technology programs.
In 2020, energy and utilities had an NPS of 58. To continue offering reliable support during the transition out of the global pandemic, energy and utilities can focus on creating a better customer experience through the Net Promoter System. NPS scores can not only give companies valuable insight into account loyalty; they can also help indicate areas of danger or potential churn.
10
38
58 59
51
20
020
Percentile (%)
Industry NPS
30 40
40
50 60
60
70 80 90
80
4150
62 65
80

89 | The State of B2B Account Experience
Consumer Packaged Goods NPS
41All jokes aside, CPG was also adversely affected by COVID-19. Manufacturing costs increased, with around a 50% increase in supply chain costs for many companies (McKinsey & Company).
In 2021, costs are likely to remain high. And though there were spikes in demand, it’s difficult to predict consumer behaviors for the future.
According to Mckinsey & Company, 76% of consumers experimented with new shopping behaviors in 2020. Only time will tell if those behaviors stick.
To navigate this tumultuous time, CPG companies will benefit from higher frequency touch-points with their accounts. Likewise, building a continuous loop cycle of feedback and action can help CPG companies remain proactive–and profitable–into 2021 and beyond.
Not unsurprisingly, there was an increase in demand across the board for consumer packaged goods (CPG), as people all over the world received indefinite stay-at-home orders. But the sharpest spikes were seen in packaged meals, packed produce, plastics, and paper goods (How could we forget March’s run on toilet paper?)
2020 was a year of tremendous impact and volatility on consumer packaged goods.
10-4
4452
41
34
20
020
Percentile (%)
CustomerGauge AX Customer NPSIndustry NPS
30 40
40
50 60
60
70 80
80
90
22
11
26 2529 35
4855 58
65 61
75
65

90 | The State of B2B Account Experience
Professional Services NPS
44
In 2020, the consulting industry remained essential. Though consulting was expected to lose $30 billion a year during the coronavirus pandemic, experts also anticipated a quick bounce-back from temporary job freezes and hiring cuts. Not only that, but the pandemic had an adverse effect on top consulting firms–reduced competition meant that well-established consulting firms fared well.
According to Business Wire, the global consulting industry is anticipated to reach $179.9 billion by 2027. The future of consulting will be marked by greater personalization, as a “one size fits all” approach no longer meets the needs of companies. Instead, consulting firms will need to focus on meeting the unique, industry-specific needs of their clients. To address this growing need for personalization, consultants can turn to The Net Promoter System.
This strategy can help consultants build relationship with their clients, focus on retainment, and even encourage word-of-mouth marketing. Most importantly, it can help consultants remain competitive and relevant in a quickly shifting market.
10
8
4448
37
20
020
Percentile (%)
Industry NPS
30 40
40
50 60
60
70 80 90
80
17
29
5562
69
According to Business Wire, the global consulting industry is anticipated to reach $179.9 billion by 2027

91 | The State of B2B Account Experience
Industry Services NPS
44
Many industry services thrived during the global pandemic; others took a temporary dip. As businesses shifted gears to respond to new safety measures and needs, services in B2B technology and online marketing became more important than ever.
Other services–involving retail or operations, for example–became limited in scale or even obsolete.
The World Bank has reported that the world economy is anticipated to grow at 5.6% in 2021, a far more optimistic forecast than previous estimations. That being the case, the majority of industry services can expect to benefit from growth. B2B services, for example, have become critical players for businesses operating remotely. Content marketing has become key for companies transitioning online.
And technologies in food and beverage are now essential for restaurants to operate efficiently and safely. B2B companies have not traditionally been successful at delivering a great customer experience.
According to Forbes, B2B brands have an average CX score of less than 50%, compared to 65-85% for B2C brands. In this new era of opportunity, industry services have a chance to up their game and change account experience.
By collecting feedback from accounts and making data-driven decisions to prevent churn, industry services can ultimately build stronger relationships with customers.
10
18
4853
44
36
20
020
Percentile (%)
CustomerGauge AX Customer NPSIndustry NPS
30 40
40
50 60
60
70 80
80
90
27 24
3228
38 4347
5458 60 62
68 68

92 | The State of B2B Account Experience
92 B2B Benchmarks Report
COMPANYSPOTLIGHTSCOMPANYSPOTLIGHTS
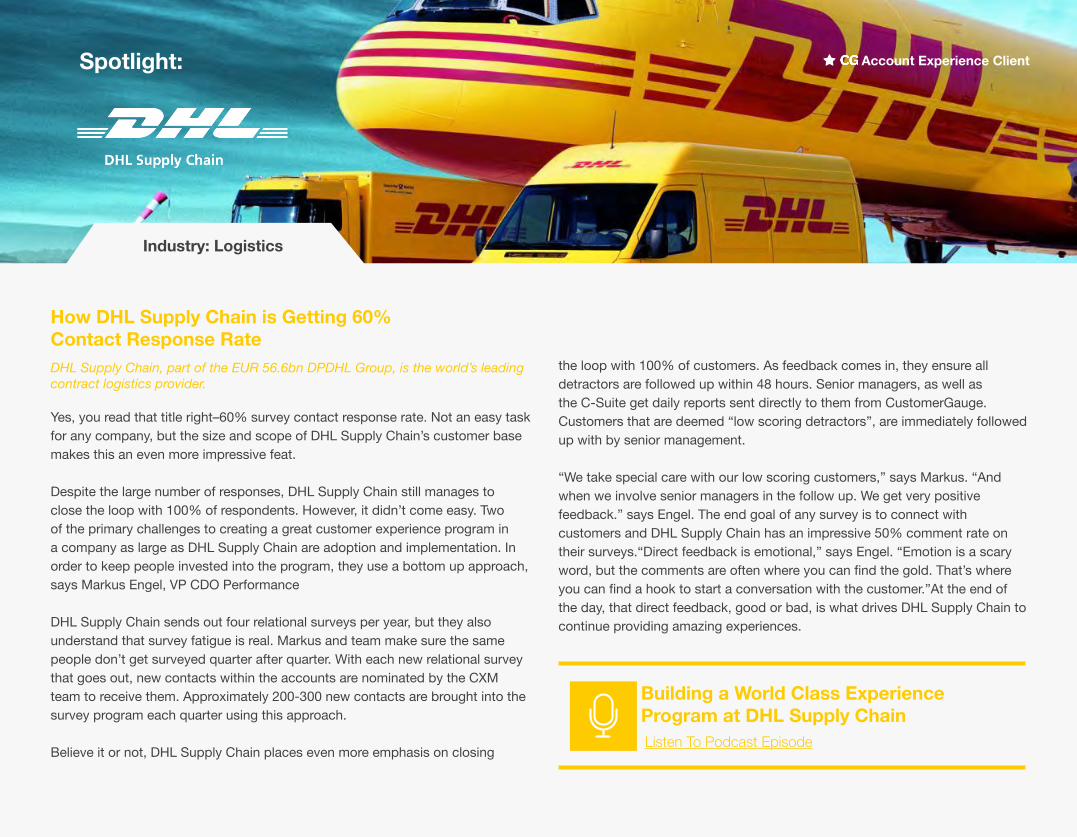
Industry: Logistics
Spotlight:
How DHL Supply Chain is Getting 60% Contact Response RateDHL Supply Chain, part of the EUR 56.6bn DPDHL Group, is the world’s leading contract logistics provider.
Yes, you read that title right–60% survey contact response rate. Not an easy task for any company, but the size and scope of DHL Supply Chain’s customer base makes this an even more impressive feat.
Despite the large number of responses, DHL Supply Chain still manages to close the loop with 100% of respondents. However, it didn’t come easy. Two of the primary challenges to creating a great customer experience program in a company as large as DHL Supply Chain are adoption and implementation. In order to keep people invested into the program, they use a bottom up approach, says Markus Engel, VP CDO Performance
DHL Supply Chain sends out four relational surveys per year, but they also understand that survey fatigue is real. Markus and team make sure the same people don’t get surveyed quarter after quarter. With each new relational survey that goes out, new contacts within the accounts are nominated by the CXM team to receive them. Approximately 200-300 new contacts are brought into the survey program each quarter using this approach. Believe it or not, DHL Supply Chain places even more emphasis on closing
the loop with 100% of customers. As feedback comes in, they ensure all detractors are followed up within 48 hours. Senior managers, as well as the C-Suite get daily reports sent directly to them from CustomerGauge. Customers that are deemed “low scoring detractors”, are immediately followed up with by senior management.
“We take special care with our low scoring customers,” says Markus. “And when we involve senior managers in the follow up. We get very positive feedback.” says Engel. The end goal of any survey is to connect with customers and DHL Supply Chain has an impressive 50% comment rate on their surveys.“Direct feedback is emotional,” says Engel. “Emotion is a scary word, but the comments are often where you can find the gold. That’s where you can find a hook to start a conversation with the customer.”At the end of the day, that direct feedback, good or bad, is what drives DHL Supply Chain to continue providing amazing experiences.
Building a World Class Experience Program at DHL Supply ChainListen To Podcast Episode
Account Experience Client

94 | The State of B2B Account Experience
Industry: Software
Spotlight:
Continuous Experience Improvement with SuperOffice
SuperOffice is a cloud-based CRM platform designed to help you build strong business relationships with your customers at scale.
Oftentimes when starting a new program, experience practitioners are trying to get management buy-in and completely forget about the front line–who ultimately will determine the success or failure of the program based on their execution. Hans Chr. Grønsleth, the Director of Digital Customer Experience at SuperOffice, recognized this immediately and decided to ensure that the front line was ready for the experience program and it didn’t overwhelm them.
“Implementing NPS was a real exercise in planning...Spread everything out, take it day by day, little by little… When we get responses to our daily surveys through CustomerGauge, that response is immediately dispatched to the account manager and the CX manager” says Grønsleth.
Once the program is in place, the secret to Super Office’s long-term success is built on constant communication.
As the program lead, Hans knows he can’t be present in every region to champion the Account Experience way, that’s why he is always recruiting new champions. And Hans doesn’t only focus on managers as his champions. He actively recruits front line employees to champion the experience program as well. He regularly visits different regions and presents experience insights to
the front line. He shows them the impact they are having on the overall business through their involvement in the AX program.
Today, SuperOffice has 6,000 customers across Europe–with an account manager and customer experience expert attached to every customer. SuperOffice values customer experience...and they’re strategic about making sure to meet (and exceed) customer expectations. To help them succeed, they use CustomerGauge’s Account Experience program to help them build a strategic, data-driven program actions account feedback in real-time.
“You need somebody in the organization that will be an internal promoter,” says Hans. “They should talk about it all the time, follow up, and be present in different meetings.”
How SuperOffice CRM is Continuously Improving Their Experience ProgramListen To Podcast Episode
Account Experience Client

95 | The State of B2B Account Experience
Industry: Financial Services
Spotlight:
Creating Remarkable Experiences Across Every Level at H&R Block CanadaH&R Block leads the consumer tax preparation services industry as the only company to offer choices for consumers to get tax help on their terms, whether in person or online. H&R Block has over 11,000 retail offices and digital tax solutions and serves taxpayers with 80,000 highly trained tax professionals worldwide.
With such a large network of customers across the United States & Canada, this equates to a mountain of feedback to be processed every year. So how does H&R Block ensure the feedback is taken seriously and integrated into their business for improvement?
The answer is an elegant one: empower every employee across every level of H&R Block Canada with CustomerGauge to positively impact the experience whenever possible.
The program starts with the marketing department as they need to ensure the experience being portrayed is consistent regardless of what retail store you walk into. Additionally, using real-time experience data, the product and services team determine which products should be up-sold or cross-sold in different customer scenarios.
So how does the internal H&R Block experience team manage such a large pool of experience data spread across multiple different departments?
H&R Block has what they call the “Experience Council”. The council is made up of individuals from every touch-point in the customer journey, including everyone from front line workers, to team leaders, to regional managers, and all the way up to senior management.
The council gets together regularly to discuss best practices and what needs to be changed to provide the best possible experience to the end user. After each meeting an email goes out to everyone reporting on their findings and any changes that need to be made to protocols moving forward.
Committing to CX at All Levels of the Organization with H&R BlockListen To Podcast Episode
Account Experience Client
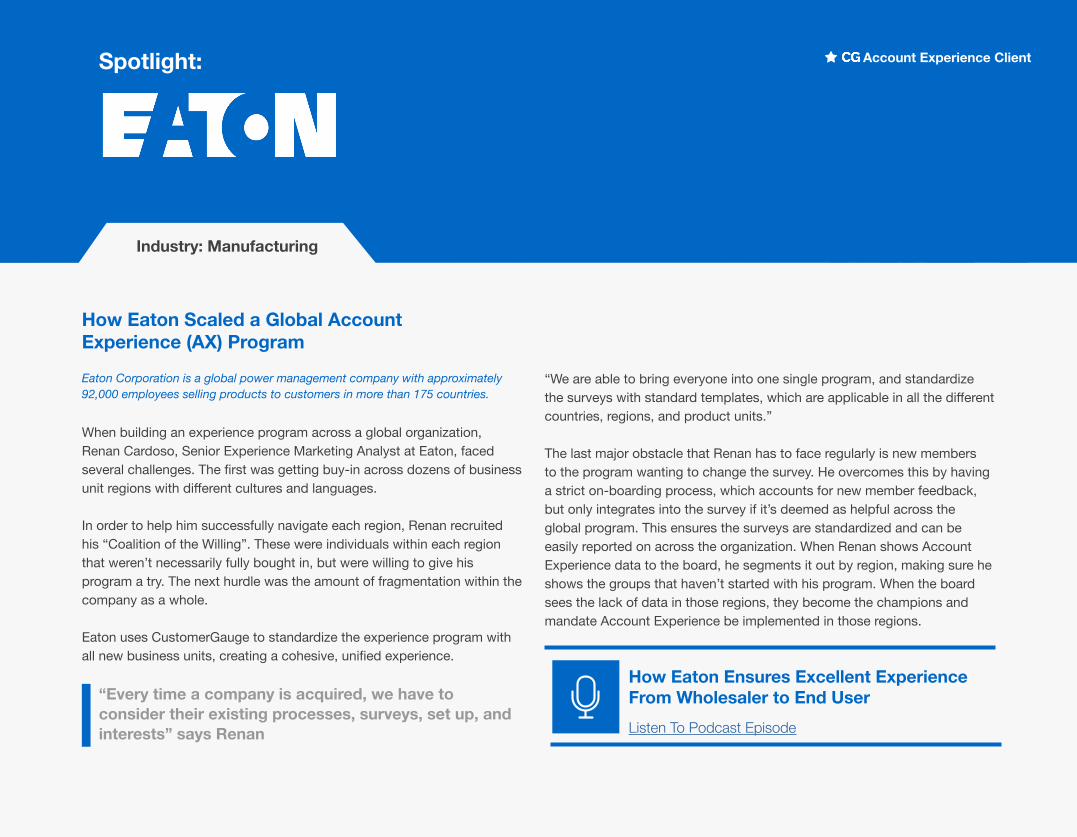
96 | The State of B2B Account Experience
Spotlight:
Industry: Manufacturing
How Eaton Scaled a Global Account Experience (AX) Program
Eaton Corporation is a global power management company with approximately 92,000 employees selling products to customers in more than 175 countries.
When building an experience program across a global organization, Renan Cardoso, Senior Experience Marketing Analyst at Eaton, faced several challenges. The first was getting buy-in across dozens of business unit regions with different cultures and languages.
In order to help him successfully navigate each region, Renan recruited his “Coalition of the Willing”. These were individuals within each region that weren’t necessarily fully bought in, but were willing to give his program a try. The next hurdle was the amount of fragmentation within the company as a whole.
Eaton uses CustomerGauge to standardize the experience program with all new business units, creating a cohesive, unified experience.
“We are able to bring everyone into one single program, and standardize the surveys with standard templates, which are applicable in all the different countries, regions, and product units.”
The last major obstacle that Renan has to face regularly is new members to the program wanting to change the survey. He overcomes this by having a strict on-boarding process, which accounts for new member feedback, but only integrates into the survey if it’s deemed as helpful across the global program. This ensures the surveys are standardized and can be easily reported on across the organization. When Renan shows Account Experience data to the board, he segments it out by region, making sure he shows the groups that haven’t started with his program. When the board sees the lack of data in those regions, they become the champions and mandate Account Experience be implemented in those regions.
“Every time a company is acquired, we have to consider their existing processes, surveys, set up, and interests” says Renan
How Eaton Ensures Excellent Experience From Wholesaler to End UserListen To Podcast Episode
Account Experience Client

97 | The State of B2B Account Experience
Industry: Industry Services
Spotlight:
Reduced Monthly Churn from 15% to 3% in less than 12 months
Sweet Fish Media is a B2B podcasting agency that specializes in fostering relationships between companies and their prospects through a strategy called Content-Based Networking.
In Q2 of 2020, Logan Lyles, then Director of Sales, & the rest of the Sweet Fish leadership team noticed they were losing a significant amount of business out the back door due to churn. “We were growing due to a large amount of net-new business, but we had a big hole in the bottom of our bucket,” said Lyles.
At the time they didn’t have any system in place to measure churn, but when they did the manual calculation, they found they were losing 15% of monthly recurring revenue (MRR) each month due to churn. The leadership team at Sweet Fish realized they needed to develop a rallying cry for the remainder of the year: Churn Sucks!
The Sweet Fish team decided that to create an experience that would truly make a difference, they needed to create a clear goal, a defined timeline & consistent performance visibility. A shared team incentive added even greater sense of ownership & teamwork as the team worked on the goal together.
To kick off the initiative, the team announced the goal for the company: Reduce churn from 15% to <5% by the end of the year. If hit, the team would be rewarded with a prize that the entire team voted on.
During this sprint, Lyles took on a new role as VP of Customer Experience & implemented Quarterly Podcast Reviews (QPRs). Prior to the initiative there was no set schedule where Sweet Fish account managers (podcast producers) could consult customers on best practices and review client success.
On these planned meetings account managers would discuss 3 primary topics: where we’ve been, where we are, and where we are going.
“During one of our QPR’s the customer told me how wonderful the process was and that he would have paid for it on top of the current monthly retainer. That’s when you know you’re creating an amazing experience”, said Lyles.
The Sweet Fish team is happy to report that within 6 months the team reduced churn by more than 10%, and in less than 12 months the team continued driving impressive results, reducing monthly churn from 15% to 3%!
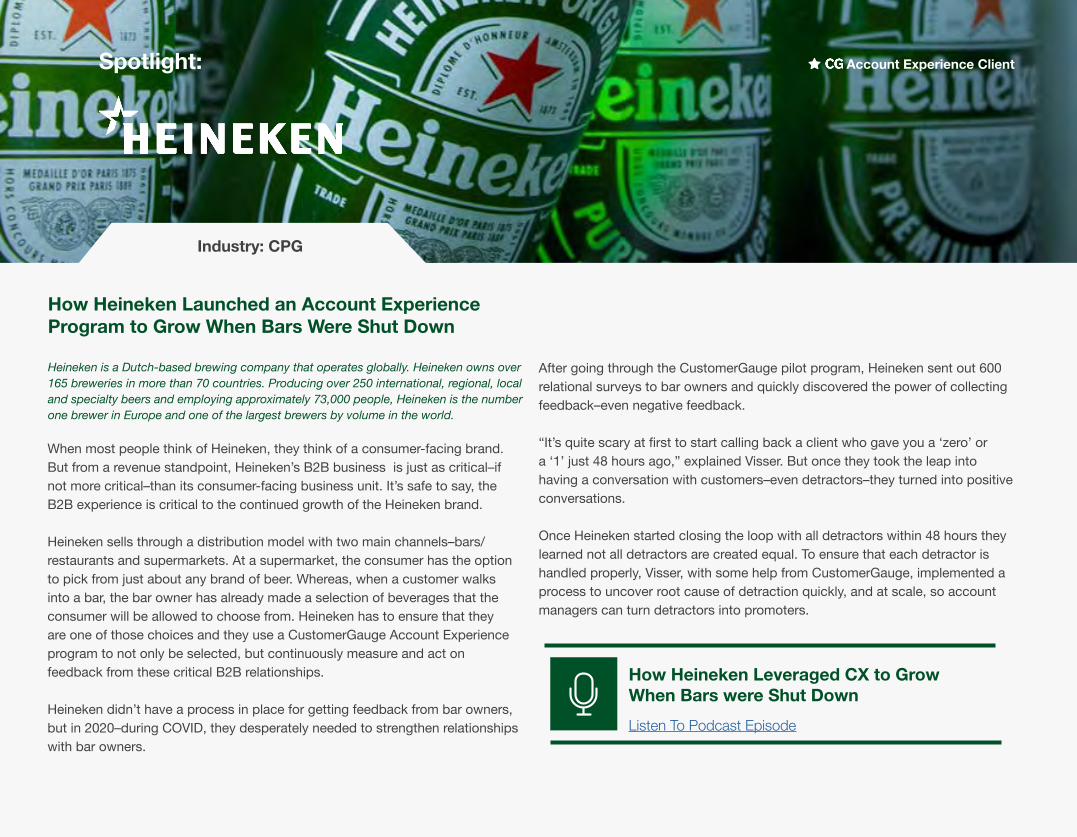
98 | The State of B2B Account Experience
Spotlight:
Industry: CPG
How Heineken Launched an Account Experience Program to Grow When Bars Were Shut Down
Heineken is a Dutch-based brewing company that operates globally. Heineken owns over 165 breweries in more than 70 countries. Producing over 250 international, regional, local and specialty beers and employing approximately 73,000 people, Heineken is the number one brewer in Europe and one of the largest brewers by volume in the world.
When most people think of Heineken, they think of a consumer-facing brand. But from a revenue standpoint, Heineken’s B2B business is just as critical–if not more critical–than its consumer-facing business unit. It’s safe to say, the B2B experience is critical to the continued growth of the Heineken brand. Heineken sells through a distribution model with two main channels–bars/restaurants and supermarkets. At a supermarket, the consumer has the option to pick from just about any brand of beer. Whereas, when a customer walks into a bar, the bar owner has already made a selection of beverages that the consumer will be allowed to choose from. Heineken has to ensure that they are one of those choices and they use a CustomerGauge Account Experience program to not only be selected, but continuously measure and act on feedback from these critical B2B relationships.
Heineken didn’t have a process in place for getting feedback from bar owners, but in 2020–during COVID, they desperately needed to strengthen relationships with bar owners.
After going through the CustomerGauge pilot program, Heineken sent out 600 relational surveys to bar owners and quickly discovered the power of collecting feedback–even negative feedback.
“It’s quite scary at first to start calling back a client who gave you a ‘zero’ or a ‘1’ just 48 hours ago,” explained Visser. But once they took the leap into having a conversation with customers–even detractors–they turned into positive conversations.
Once Heineken started closing the loop with all detractors within 48 hours they learned not all detractors are created equal. To ensure that each detractor is handled properly, Visser, with some help from CustomerGauge, implemented a process to uncover root cause of detraction quickly, and at scale, so account managers can turn detractors into promoters.
How Heineken Leveraged CX to Grow When Bars were Shut DownListen To Podcast Episode
Account Experience Client

99 | The State of B2B Account Experience
Industry: Telecommunications
Spotlight:
How Sure is Changing the Stereotype for Telecommunications ExperienceSure is a 100+ year old telecommunications company that covers the Isle of Man, Jersey, Guernsey, the Falkland Islands, St. Helena, Hungary, France, Ascension Island, and British Indian Ocean Territory.
Sure offers a wide range of services from broadband internet to retail phone sales. With such a large portfolio of products and in an industry infamous for its poor experience, Sure is changing the game with their Account Experience Program.
Over the last year, Sure has excelled while their UK counterparts averaged an NPS of 12. They’ve done this by going all in on their Account Experience program; collecting feedback, closing the loop and responding to challenges.
One way Sure measures the success of their AX program is by churn rate.
“When I worked at Orange, the churn level for mobile was running at something like 25%,” says Charlotte Dunsterville, Chief Consumer Officer at Sure. “What you found were a lot of ‘value seekers’ just flipping all the time to get the best deal...Our customer churn [at Sure] is quite low. We do see a correlation between NPS and churn. For example, churn increases when NPS dips.”
But Charlotte equates the success of the NPS and Account Experience Program to integrating feedback into the culture of the business. Getting buy-in at every level of the business, from the C-Suite on down to the front line is no easy feat, but Charlotte will attest that it can be done.
When it comes to getting buy-in from the C-Suite, Charlotte makes a simple connection between the experience data and revenue in her CustomerGauge dashboard. “I sit on the executive committee and I have got the support of every single person...we talk about customer experience all the time. We will talk about NPS and financial KPIs hand in hand,” says Dunsterville. “This is the revenue, this is the profit, this is where we are with our customer experience metrics, and particularly our NPS and our position against competitors.”
When you can easily show the connection between referral revenue and decreased churn, it becomes very easy to get but-in from the C-Suite.
Thanks in large part to the AX program implemented by Charlotte, Sure’s churn is significantly lower than the industry average. Fueled by listening and acting on feedback, Charlotte has been able to turn the tables in an industry plagued by “value over service”.
How Sure is Changing the Game in Telecom ExperienceListen To Podcast Episode
Account Experience Client

100 | The State of B2B Account Experience
Industry: Software
Spotlight:
How Transforming NPS from a Score to a Culture Led to Massive GrowthBisnode (recently becoming a Dun and Bradstreet Company) is Europe’s leading data and analytics firm. Bisnode has more than 2,100 passionate employees working together in 19 countries
Prior to implementing CustomerGauge into their experience program, Bisnode was running a yearly relational survey. They were sending the survey to thousands of contacts in a single blast. Without an effective distribution strategy, they not only received less response rate, but also consistently overwhelmed the team analyzing the data (often weeks of analysis with delayed action, if at all). In addition, instead of a simple NPS survey, they were sending a typical CSAT survey with dozens of questions which led to high abandonment rates.
In theory, surveying every single contact sounds like a good strategy–you would be on your way to 100% revenue coverage, right? Well, Maryann Mølgaard Christensen, Group Customer Engagement Manager at Bisnode/Dun & Bradstreet, quickly realized that wasn’t the best strategy when response rates were floating between 2% and 5%. Furthermore, when asked by the C-Suite for the financial impact of the program, the data was unclear.
Maryann reached out to CustomerGauge for help getting their experience program on track. The first action the team took was stack ranking their
accounts by revenue. This allowed them to look at feedback through a revenue lens, making it easy to identify large accounts at risk of churn and save them in real-time. After the accounts were organized, Bisnode began sending out transactional NPS surveys along key customer journey points. This gave them a constant flow of actionable feedback for improvement.
After the transactional surveys were set up, the next step was changing their yearly CSAT survey to quarterly relational NPS surveys. Instead of sending to the entire contact list, they strategically chose contacts at every level of each account and staggered the sends to give account managers adequate time to respond in a timely manner–48 hours or less.
At this point the data became very clear. Bisnode was able to look at both transactional and relational data together and tie it directly to revenue. They could see which account revenue was at risk of churn and which accounts were safe. Maryann now had the data she needed to go back to the C-Suite and advise where investment was needed in order to address the concerns of the largest portion of revenue to ensure the highest net revenue retention possible.
How to Operate a World-Class Experience Program Globally w/ BisnodeListen To Podcast Episode
Account Experience Client

101 | The State of B2B Account Experience
Spotlight:
Industry: Industry Services
Why Effortless Office Moved from CSAT to NPS
Effortless Office is a Hybrid Managed Services Provider that delivers and fully supports secure cloud products and services giving customers a single solution provider for entire IT environments.
Effortless Office had been running transactional CSAT surveys for several years when they reached out to CustomerGauge in early December, 2020. In fact, according to their CSAT scores they were doing exceptionally well at 98% satisfaction rate. But after a large and unexpected account churn, they realized their stellar CSAT score was lulling them into a false sense of security.
Leif sums it up beautifully, because the only thing that the CSAT survey was measuring was the interaction the customer had with the service agent—not their overall sentiment and experience with the brand. Ultimately, this blind spot led to churn at the Effortless Office. In the post-mortem with simple CSAT data, it was difficult to identify the true root cause of the churn. All Effortless Office had was a record of fantastic customer support—or so they thought.
Leif gave CustomerGauge a call and after on-boarding CustomerGauge, Effortless Office is now running a quarterly relational survey with plans to launch a transactional survey soon. This new approach allows them to identify negative feedback from customers in real-time and escalate to the proper employees in the organization to address any root-cause dissatisfaction that would potentially lead to churn.
“Every time a customer opens a ticket they get a survey asking if we did good...We were doing really good from a numbers perspective with a customer satisfaction score of 98.2% for 2020. That’s a great number to be able to put out there, but in terms of actually improving what we’re doing, it wasn’t really helping all that much.” said Leif Cederblom, Director of CX at Effortless Office
How Effortless Office Unlocked Their Customers Voice with NPSListen To Podcast Episode
Account Experience Client

102 | The State of B2B Account Experience
Spotlight:
Industry: Software
How SugarCRM is using their VoC Program to Build Customers for Life
SugarCRM is a Customer Relationship Management System and the only CRM platform that offers”high-definition” customer experience. Sugar’s high-definition gives customers a clear, complete, unfragmented picture of the customer journey—past, present and future, using AI to predict habits.
SugarCRM takes retention very seriously. In fact, one question sits at the core of almost every strategic decision at the company–will this help create a customer for life?
That mentality starts at the top with the CEO and goes down into every aspect of the organization, including the voice of customer program. And they have some key objectives they set in order to make that happen.
Generate and acquire customer advocates:
Creating raving fans starts with getting feedback from their transactional and relational surveys, but it doesn’t end there. Sugar not only closes the
loop with the customer that gave the feedback, but they recognize that if one user is voicing a problem, there’s probably 10 more who aren’t. And in order to spread transparency to their entire customer base, they created SugarClub, a community of their users where they can have open dialogue and let everyone know the actions being taken based on their feedback. This level of transparency not only builds customer trust, another one of their objectives, but it helps them gain important insights and an understanding of what their customers want. It also allows the entire company to have access to the customer base to build a relationship, which brings us to the next objective.
Empowering employees to think through a customer centric viewpoint:
SugarCRM has created a team of individuals from all areas of the organization for what they call their feedback ambassador team. Depending on what department the feedback relates to, ambassadors from those departments will jump in and close the loop with customers. This not only takes load off the CSMs, but it makes the entire company more customer centric.
Account Experience Client

103 | The State of B2B Account Experience
Spotlight:
Industry: Industry Services
Soccer Shots’ Road to 80 NPS and How They Tied Higher NPS to GrowthSoccer Shots is a franchise-based soccer training program for children between the ages of 2 and 8 years old. The company operates in over 200 territories across 37 states and Canada with over 440,000 enrollments as of 2018.
Soccer Shots sets high NPS targets for their franchisees, 80 to be exact. And they didn’t just come up with that number because it sounded good. Brian Hodge, Director of Franchise Operations saw something happening in a small subset of franchisees with 80+ NPS—they were growing at a significantly faster rate than their sub-80 counterparts. But the question was how were they getting such high scores and what were the drivers that were leading to such quick growth?
To figure out how these franchisees were getting 80+ NPS, and how he could duplicate it across all franchisees, Brian analyzed over 1.3 million data points taken from a multi-year snapshot. Soccer Shots has two revenue streams. The first is through school programs. The second is through after-school programs where parents take their kids to a park on weekends or evenings to participate. The park programs were the minority of the gross revenue at Soccer Shots, but Brian found the franchisees that were able to get past the 80 NPS milestone all had established parks programs.
More analysis with the CustomerGauge platform led to the discovery of two drivers that were creating the high willingness to recommend–coaching and communication. These fresh insights allowed the team to put measures in place to replicate the 80 NPS across the entire organization.
They started by creating a training program for coaches that was not only centered around teaching children the game of soccer, but also how to communicate and keep their parents engaged.
The second action was to put systems in place to communicate quickly with all customers. Whether that be responding to a parent inquiry or communicating schedule changes due to weather, rapidly closing the loop was key to the customers willingness to recommend.
After putting these programs in palace and tracking franchisees progress, they found that when franchisees scored 80+ NPS with coaching and communication as the drivers, they were generating, on average, 50% more recurring revenue per customer driven by insights from the CustomerGauge platform.
The Path to 80 NPS & Revenue Growth w/ Brian HodgeListen To Podcast Episode
Account Experience Client

104 | The State of B2B Account Experience
Industry: Software
Spotlight:
How Education Leads to Higher Retention at ZoomInfo
ZoomInfo is a publicly traded SaaS company that sells access to its database of millions of contacts to recruiting, sales, and marketing teams.
ZoomInfo has a retention rate of 98.5%. That’s not a typo and yes, you read that correctly–98.5%! And they’ve done it through building relationships with their user base through education and training.
ZoomInfo is unique in their education strategy in that they’ve mapped it out to line up with the touch-points in their experience program. From on-boarding to renewal and beyond, ZoomInfo is providing ongoing training through the entire customer life-cycle.
When they first created the program, Zoominfo looked at usage data for its customers from on-boarding to renewal and they found some very interesting correlations. The first commonality they noticed was at the 90 day mark.
After talking with customers, Tom Studdert, VP of Customer On-boarding and Implementation, realized that around 90 days after implementing your solution is no longer the “shiny new piece of tech” in the stack. Wanting Zoominfo to always be at the forefront, Tom and team decided this was a perfect opportunity for a second round of training. Shortly after
implementing this, they saw immediate increases in usage among the clients they tested.
The next dips they typically saw were at months 7 and 10. At these points the team built in what they call “education interventions”. These interventions include live webinars, on-demand training, private training and the ZoomInfo certification program. Each is placed in front of customers between the seven to ten month mark to ensure that they are getting time in front of customers to make sure ZoomInfo is at the top of the tech stack.
The final piece of the puzzle that they uncovered was when they moved live, in-person training from the on-boarding process to 3 months prior to renewal. Initially an on-boarding specialist would travel to a customer to help them set up and on-board the software. They quickly learned that it was much more advantageous for both the customer and Zoominfo if they came out 3 months prior to renewal. The on-site helped customers because they were able to ask informed questions and streamline processes that they already had in place. And it helped ZoomInfo by driving a 98.5% retention rate between customers that completed in-person training three months prior to renewal.
Training to Retaining w/ Tom Studdert of ZoominfoListen To Podcast Episode

105 | The State of B2B Account Experience
Spotlight:
Industry: Software
Four Questions to Ask Before Launching an Account Experience Program
Sean Macpherson has been the driving force behind launching the Account Experience program at Alyce. But this wasn’t his first soiree into NPS. Sean has headed up the implementation of experience programs at several large SaaS companies. Some have been very successful and others fell flat. Implementing a successful experience program requires many things to go right. Some companies are too focused on the NPS score and forget about the real program value—bringing customer feedback into the business. If you want to implement a successful program, you should ask these questions:
What does your customer feedback look like–are you getting actionable feedback?The beauty of an Account Experience program is your customers give you the road-map to retain them, all you have to do is listen and act on their feedback.
Are you closing the loop? Again, it’s not enough to just take the feedback and put plans in place
to act on it. You need to act on that feedback quickly and then close the loop with the customer letting them know what you did with the feedback. This lets them know their feedback is important to you and it was worth their time.
With negative feedback, what actions are you taking to fix it?Feedback without action can be more detrimental than not asking in the first place. If you plan to ask your customers to take time out of their day and help you, make sure you are doing something with the feedback or else your response rates will plummet.
Are you tying feedback revenue?It’s very common for the loudest customers to get the most attention. But the loudest customers aren’t always the most valuable customers. Instead, prioritize actions in the highest-value accounts first to ensure the highest net revenue retention rates possible.
When you let revenue drive your experience program, this also leads to more meaningful conversations at the C level.
Alyce is a fast-growing B2B gifting software company based out of Boston, MA. Alyce uses AI to automate personal outreach and recommend gifts that appeal to prospect’s life outside of work.
Avoiding the Pitfalls of Implementing a B2B Experience ProgramListen To Podcast Episode
Account Experience Client

106 | The State of B2B Account Experience
Spotlight:
Industry: Industry Services
How Just Eat Takeaway.com is Redefining At Home Dining With Account ExperienceJust Eat Takeaway.com is a global online food delivery company that operates in 24 countries. On a daily basis, they connect millions of consumers with over 580,000 local restaurants through their websites and apps. They have recently moved into the North American market with the acquisition of food order service, Grubhub.
When most people think of Just Eat Takeaway.com, they think B2C. You order food on the app and 30 minutes later the food from your favorite restaurant is at your doorstep. And while that is true, they have also significantly ramped up their B2B Account Experience Program since the start of the pandemic in March, 2020. The program is very unique in that the feedback from the B2B experience is often driven by the B2C customer experience. Knowing this, Just Eat Takeaway.com called on CustomerGauge to help them create a better experience from on-boarding to growth for the restaurants they partner with.
You may have noticed many restaurants who have never offered delivery service before, such as fine dining establishments, are now bringing food right to your door. At face value, it may seem just like any other food delivery, but there is a lot that goes on behind the scenes. After all, if you spend $40 on a steak, your expectations are certainly going
to be higher than if you ordered a $15 pizza. And if it’s not right the first time, most customers won’t likely give it another chance. The Account Management team works directly with restaurants in the on-boarding process to help make sure they are providing the best B2C experience possible. That includes everything from menu item selection, to logistics options, and even packaging. After all, you just spent $40 on a steak–if it’s arriving in a soggy package it doesn’t scream “fine dining.”
But where their program really shines is after the on-boarding process. Just Eat Takeaway.com is able to close the loop on 97% of all detractors within 48 hours. They do this by having an “Improvement Special Project Manager” that is dedicated to following up with Account Managers to make sure they are closing the loop quickly with all accounts.
Just Eat Takeaway.com also trains account managers on how to deal with bad feedback. Educating them on how to handle detractors and then having open conversations about how negative feedback is okay which makes closing the loop easier for the team members.
How Just Eat Takeaway.com is Bringing the Restaurant Experience to Home Delivery
Listen To Podcast Episode
Account Experience Client

107 | The State of B2B Account Experience
Spotlight:
Industry: Industry Services
How ICON Achieves 98.8% Retention Rate & is Growing on the Back of 80% Referral RevenueICON creates tailor-made outsourcing solutions that use a combination of cutting-edge technology and A-player human resource to deliver leading inside sales and account management solutions for B2B brands. Based in Central Europe, ICON’s brand evangelists provide complex interactions in 30 languages. Clients benefit from a mature and experienced workforce, competitive price point, and accessible geographical location.
Customer experience is the lifeblood of ICON’s growth strategy. With over 80% of new business coming from either referrals, cross sells, or upsells, there is no doubt tailored experiences are at the heart of ICON. And these impressive numbers didn’t just happen by accident—they have a four part process in place to drive new referrals, every day in real-time and ultimately, deliver a great experience.
It may sound simple, but ICON has done an incredible job at not only acting on feedback, but making the customer part of the process.
Let’s start with the survey process— ICON sends a relational survey out twice per year. They are very conscious of the amount of surveys which their clients receive, which is why they have shortened their surveys with the goal of being completed in one to two minutes.
Combine these quick surveys with a stellar close loop procedure and you have a recipe for their mind-blowing 100% response rate!
You may think that 100% response rate is impossible, but ICON credits their customer-centric action plans for achieving such a high number. When ICON receives feedback which requires an action to be taken, they have a straightforward and transparent plan.
First, while closing the loop, they invite the customer to join their 90 day action plan to correct the problem. That’s right, not only do they close the loop, but they include the customer in the action plan to correct it. Having the customer’s involvement drives deeper loyalty and higher willingness to recommend, hence ICON’s astonishingly high referral revenue. It’s also a major factor ICON boasts in an even more impressive 98.8% customer retention rate and a 70 overall NPS.
But they don’t just follow up with detractors—passives and promoters get follow up as well.
“We want to hear both positive and negative so we can double down on what’s working,” says Helen Hickin, CEO at ICON.
Now that’s how you create an iconic Account Experience!
Account Experience Partner

108 | The State of B2B Account Experience
Spotlight:
Industry: Healthcare
How Intuitive Health is Bringing Account Experience to the Healthcare IndustryIntuitive Health is a chain of retail-based medical facilities that combine urgent care and emergency room facilities in the same location.
When Intuitive Health was formed in 2008, they created a mantra stating patients and their experience would be at the center of all decisions they make. Everything from check-in, to the waiting room, to the interaction with nurses and physicians would be measured–and they would NPS to do it. Intuitive Health is located in the same proximity of other retail chains known for incredible experience like Target and Trader Joe’s, so they use these companies as their experience benchmark.
But in reality, Intuitive Health is not the same as a typical retail location. When “customers” come into their facilities, it’s not for pleasure. It’s normally because they, or a loved one, is having a pretty bad day. That’s why the experience they create is so important and impactful. Every single patient gets a survey, not when they’re at the facility, but 18-24 hours after they’ve gone home and had some time to digest the experience. Intuitive Health receives an impressive 24% response rate from the thousands of surveys sent out a day. They attribute their impressive response rate to the culture they’ve built. In a typical B2C experience program, closing the loop isn’t typically addressed. But Intuitive Health isn’t your typical healthcare provider. All feedback that
comes in goes directly to the corresponding group leader at the facility, whether it be a nurse, physician, administrator or facility leader. For every piece of feedback that comes in, one of those managers responds within 30 days to make sure the issue is addressed. By leading with accountability in closing the loop with patients, all members within the organization become champions for the experience program.
“One of the things that our team works on very closely is talking to promoters...and making sure we know how appreciated they are.” Says David Apple, CMO at Intuitive Health. “It’s really important to concentrate on those promoters just as much as you concentrate on the escalation cases and the detractors and the passives. We make sure in addition to not only reaching out to those promoters, we are constantly inundating our clinical staff with these promoters and the feedback.“
And it works. With one of the highest NPS scores in the industry, Intuitive Health is not just creating a remarkable patient experience, but revolutionizing the way patients receive care.
How Intuitive Health Used NPS to Grow During a Global Pandemic
Listen To Podcast Episode
Account Experience Client

109 | The State of B2B Account Experience
Spotlight:
Industry: Industry Services
Insights Rentokil Has Learned Switching From CX to AXRentokil is the world’s largest pest control company, offering the broadest, most advanced range of pest control solutions and services in the industry. They send over 85,000 surveys per quarter across dozens of countries.
Rentokil has always been very conscious of customer experience. In fact, they started measuring NPS as early as 2007. At the time they were conducting surveys via telephone call after a technician would finish a job. Response was low and they found oftentimes people wouldn’t give honest feedback in a face-to-face (or voice-to-voice) setting. More recently within the past two years, Rentokil transitioned to an Account Experience program, automating their surveying through email with the help of CustomerGauge.
They’ve found several benefits implementing AX over a typical CX program. First, they amount of data they are able to collect and aggregate quickly to steer the strategic direction of the company has been game changing.
In the past where they had to dedicate teams of people to physically call customers and perform an interview was now being done, more effectively, in an email that could be completed in less than two minutes.Second, the speed in which they could act on the data after it is
collected has Significantly faster speed to output in the data. In previous years the data would be aggregated and sent out quarterly to view the data. Now, with the automated software, the entire organization can view the data and respond to feedback in real time.
But using CustomerGauge’s Account Experience Software has done more than just allow Rentokill to streamline their survey and follow up processes. It has given them insights that have enabled them to refine what the customer journey looks like and also determine where they are weak and need to improve to drive a more customer-centric experience. For instance, through collecting and closing the loop on feedback they realized that customers were not happy with how difficult it was to get in touch with account managers. These are the details that lead to increased retention and willingness to recommend.
How do we improve account management to better the experience? Getting actionable insight to improve retention.
Rentokil Podcast Goes Here
Listen To Podcast Episode
Account Experience Client

110 | The State of B2B Account Experience
Spotlight:
Industry: Manufacturing
How Domino Printing Sciences (Domino) is Bringing New School Experience to an Old School IndustryDomino is a pioneer in the aligned markets of Coding & Marking and Digital Printing and uses its industrial and commercial printing expertise to find solutions for customers.
A key objective in Domino’s business is Customer Experience and they use NPS as the metric to gauge their success and they have achieved an impressive score of 77. Over the past 3 - 4 years, under the guidance of Marianne Wright, Group Customer Experience Director, their Customer Experience program has accelerated.
Marianne kick started the growth by expanding the transactional NPS surveys to include more touch-points across the customer journey.
Domino’s transactional surveys are automated and integrated directly into the company CRM. Surveys are sent out immediately after a customer interaction has taken place, resulting in an average response rate of 28% across the globe, with some regions as high as 44%.
Response Rate is one of the drivers Marianne is focusing on improving even further as the program matures, and customer facing employees
are trained to position the survey with the customer to encourage participation. Domino has a well defined and embedded ‘close-the-loop’ process and promptly contacts all Detractors to discuss the feedback given and resolve any issues. CustomerGauge recommends all detractors should be followed up within 48 hours.
The secret sauce in Domino Customer Experience success is that, while they have a very impressive NPS score of 77, that isn’t their main focus. “Don’t obsess about the score, obsess about the customer. If you focus on getting and acting on customer feedback your NPS score with naturally grow, but what’s really important is that you become more customer-centric in the process” says Wright.
“When a customer makes the effort to give us feedback we act on it and it’s the basis for our NPS continuous improvement program and success” says Marianne.

111 | The State of B2B Account Experience
Spotlight:
Industry: Software
B2B Voice of the Customer – How to Listen,Act and Gain
Amdocs specializes in software and services for communications and media, serving more than 350 service providers in over 85 countries. Amdocs is listed inNASDAQ and had revenue of $4.2 billion in 2020. Amdocs’ key accounts make up the vast majority of its business, so each aspect of Amdocs’ engagements with these accounts is vitally important
Because these accounts are so large, diverse and complex, each account has a dedicated Customer Business Executive (CBE). The CBE is responsible for the longevity and health of the relationship, rather than only P&L. Part of CBEs’ goal sheet is tied directly not just to the Voice of the Customer (VoC) results, but also closing the loop with the customer and working on an Improvement plan, based on VoC feedback.
The VoC survey is conducted once a year for each account separately.Instead of sending out only web surveys – they also supplement the feedback channel with one-on-one in-depth interviews conducted by a dedicated, independent corporate VoC team. Listening is the first part, but definitely not the last. Senior management personally review the feedback. There is a designated time-frame which CBEs need to close the loop with their customer. It’s not just about “what’s our score” but about creating actionable insights and collaborating with the customer, so that improvements are done in collaboration and buy-in.
If there is a gap between what customers expect and what they experience it will be measured and monitored closely via workflow tools. Thanks to this unique approach, response rates are at an impressive 58%.
The first stage of the process in making sure feedback is obtained from all stakeholders. This means everyone in the customers’ organizations that is touched by Amdocs. Each and every interaction is evaluated, so it’s not a “tick in the box” type of survey, but more of an open conversation. In the past year, Amdocs obtained feedback from 1,669 respondents, including hundreds of CxOs from it’s large and strategic customers. This feedback resulted in over 90 account Improvement plans shared with customers and followed up upon quarterly – with the customer as well as internally.
Loyalty is a key metric for Amdocs, because it not only gives them insight to customers willingness to recommend, but they have been able to directly tie it to their financial success. Being able to help predict customer growth, learn about possible opportunities and measure referral business are just some of the ways that Amdocs tie loyalty to revenue. This is key for obtaining the C-suite buy-in. Amdocs is continuously building customer experience into its day-to-day operations. It is part of the culture and embedded into how everything is done. While the VoC team is a small team within Amdocs’ 26,000+ worldwide employees, the whole company is responsible for the customers experience.

112 | The State of B2B Account Experience
Spotlight:
Industry: Software
How PandaDoc Invests in Customer Feedback & Transparency For Long-Term Success
PandaDoc is an electronic document creation and e-signature tool. The company has 600+ employees serving over 30,000 customers.
Customer Experience is baked into the ethos of PandaDoc and all its business units. Whether it be providing company-wide transparency or creating a customer advisory board to drive the strategic direction of the company; PandaDocs is obsessed with their customers.
Feedback Transparency:
PandaDoc understands that a siloed experience program is a recipe for disaster. Ensuring the team consistently provides an amazing experience for their clients requires the whole company to be constantly immersed in customer feedback. As a result, the CX team has all feedback integrated directly into their company-wide slack channel. This allows everyone to see it, celebrate the promoters, troubleshoot detractors, and ultimately, keeps the experience program top of mind.
Benchmarking Customers for Success:
One of the unique ways that Pandadoc CSMs are creating exceptionally customized experiences for their customers is by utilizing what they call “success KPIs.” Success KPIs are data points that are tracked on the
customer level inside the PandaDoc application. During quarterly business reviews, account managers can benchmark each customer against this data to determine where they need to improve.
Some of the success KPIs include:
• How long does it take for customers to build templates• Document expiration rates• Close rates• Rejection rates • And more
Customer Advisory Board:
PandaDoc even puts customer feedback at the center of their strategic planning sessions. Every six months they meet with 10-20 of their customers for a ‘customer advisory board’ meet-up. The goal of these meetings are to discuss the product road map, CX strategy, and allow customers to share their experiences with the product. “The Customer Advisory Board (CAB) has been an integral part of our experience team. Having the customer at the center of strategic decision making has given us valuable insights that we wouldn’t have had otherwise,” says Nick Szenberg, Customer Marketing Manager at PandaDoc. The customer advisory board meetings have not only led to better strategic planning centered around their customers, but allowed the team to actively promote even further in marketing activities to drive net-new business for the company.

113 | The State of B2B Account Experience
Spotlight:
Industry: Telecom
Account Experience + Customer Success = A Winning Combo for Vonage
Vonage is the Global Cloud communications leader. They are committed to accelerating the world’s ability to connect through a fully integrated communications platform.
Vonage has a very large customer base that spans the globe, but that has not stopped them from running a very personal experience program. It’s not uncommon for technology companies to review usage data to gauge the health of an account.
What’s unusual about Vonage’s program is the level of care they take to proactively reach out for customer feedback and work it into the roadmap to retain customers. So many companies that we talk to will collect feedback in various methods ranging from Surveys to Quarterly Business Reviews and never close the loop or take action. What makes the Vonage program so special is how they focus on the risk of churn before it happens and how they eliminate it.
More often than not when companies address churn it’s at the bottom of the funnel—they’ve either left or have one foot out the door. Vonage flips that funnel and starts identifying risk factors at the top of the funnel. They do this through various interactions including quarterly business reviews and support tickets. They look for customers saying “I wish the product could do this” or “Wouldn’t it be great if we could
accomplish that”. They take those risk identifiers before they ever become a larger problem and either (1) train the customer if the functionality already exists or (2) try to pluck them out of the funnel by adding them to the product roadmap.
“We celebrate the risk. When we say, ‘we’ve got 10 risk on this account’ we don’t say ‘Oh gosh, what are we going to do,’ we say, ‘we’ve got 10 early risk on the account we need to get ahead of these…” says Senior Director of Customer Success, Ethan Douglas.
The company also sends out NPS surveys in order to solidify any risks they’ve already collected and find any that have been missed.
“We can say that there is no risk on an account, but if we get back an NPS score of 3, there’s probably something we’re missing in those situations and that will spark another conversation,” according to Douglas.
This allows Vonage to retain a very high retention rate and build customer loyalty in a highly competitive market.
Vonage Podcast Goes Here
Listen To Podcast Episode

114 | The State of B2B Account Experience
Spotlight:
Industry: Technology
BombBomb is Rehumanizing The Customer Experience One Interaction at a Time
BombBomb is a video software that lets you record and send videos directly from your computer or smartphone. They are a bootstrapped company that was formed in 2006 that now serves over 65,000 customers and has become synonymous with video email.
From the very beginning, BombBomb knew two things to be true—digital pollution is the antithesis of connection, and through video, human-centered communication can change the world. From unwanted LinkedIn requests, to phishing emails, and unsolicited messages, inauthentic ways of communication are the status quo and it’s taking a toll on all of us.
BombBomb invites its users to combat unwelcomed digital distractions by evaluating their own contributions to digital pollution.
A feedback driven culture.
BombBomb uses a variety of tactics to collect experience data that lead to strategic shifts in the company and product. NPS surveys, face-to-face interviews, and usage metrics are among the experience data points they collect. BombBomb’s approach to collecting feedback then making it transparent and visible to the whole organization is what’s most impressive. The company is spearheading the fight against
digital pollution. They, like CustomerGauge, think that low response rates are unacceptable—and the way to combat low response rates is through, what they call, humanizing the business. In other words, lack of genuine relationships and the over-spamming of inboxes leads to a lack of participation in surveys that would, in the end, go to making changes that will benefit both parties.
Putting people at the center of their business.
In order to humanize your business, you have to start with being extremely intentional with your outreach. This is BombBombs main approach. A survey won’t go out unless it can be assured that the customer will get a one-on-one response via phone call or recorded video. “Our closed-loop process may not be the most scalable, but it’s incredibly effective in building relationships and increasing customer engagement,” says Jonathan Boltan, Chief Customer Officer at BombBomb.They also make use of their platform to humanize various survey touchpoints across the customer journey. Instead of simply having in-app surveys popup asking for feedback, they incorporate video to let the customer know just how important the feedback is and how it will be used.
To make sure that all of this feedback is not being siloed in one department, there is a weekly “Customer Feedback Standup” where the customer-facing staff have the opportunity to present feedback to managers. The findings are reported up to the CEO to ensure that the C-Suite has a constant stream of feedback from the customer base.

115 | The State of B2B Account Experience
Spotlight:
Industry: Technology
How BMC is Improving Experience Across Their Entire Customer Journey
BMC provides software and services to the modern enterprise. The company offers a wide-range of products across cloud computing, IT service management, IT operations management, automation and orchestration, and mainframe.
BMC’s customers are at the heart of their company culture—so it comes as no surprise they have an impressive experience program. What is surprising however, is the way that they conduct their quarterly relationship surveys.
“Instead of blasting a general survey to our customer base, we have designed the process to be customer-centric by using an ‘outside-in’ methodology”, says Helen Krizek-Yost, Director, Customer Experience at BMC Software.
Every customer receives a survey twice per year, but BMC allows their customers to choose the product and journey stage that their feedback corresponds to. After they select the product and journey stage that they believe needs the most improvement , they can go one step deeper and give feedback on what exactly it is about that journey stage that was good or bad and how they would like to see the process or touchpoint adjusted.
By allowing the customer to choose their feedback area, BMC can uncover the top pain points in various products and journey stages. In addition to the quarterly relationship survey, BMC has enacted various transactional-style surveys, that they call “Moment of Truth” surveys. The surveys vary from in-app, to the company website, to a renewal pulse check, to post-support.
Transactional Surveys To Capture In-Moment Sentiment
There are two reasons that BMC continues to implement more transactional-style surveys: The first, BMC recognizes getting customers to open emails is becoming more and more difficult. The second, so they can capture feedback while it’s still fresh in the mind of the customer. Whether it’s good or bad, they get a full picture of the customer’s sentiment in the moment.
But collecting feedback and acting on it is only the beginning when it comes to the CX program at BMC. As stated earlier, the program is at the heart of the culture, so it’s imperative that the team makes the information accessible to the entire organization.
“We put our NPS scores, pain points, and action plans on the company intranet. The company makes it very easy for employees to find information that is relevant to them,” says Miles Escow, Director, Customer Experience at BMC Software. “In that way, we’re affecting the company culture...It’s not buried in some powerpoint where only three people can see it.”

116 | The State of B2B Account Experience
Spotlight:
Industry: Manufacturing
How HeidelbergCement is Increasing Retention With a 70% Response Rate
HeidelbergCement is one of the largest building materials manufacturers in the world. They are a global leader in aggregates, ready-mix concrete and cement, headquartered in Germany. Heidelberg supplies their products to over 50 countries, from emerging to developed markets and with varying languages and cultures, which poses a challenge for most companies, but their local experience management operations have made it a success.
Because of the complexity and geographic breadth of Heidelberg’s business they had to come up with a way to create an experience program that adapts to the unique problems in varying regions of the world.
The program was initially developed with the goal to address potential customer frustrations and save accounts before they churn, and is gradually morphing into a strategic program delivering business results. For the rollout of the program, HeidelbergCement followed a pilot approach, followed by a global rollout to the first 25 countries from various levels of maturity, which learnings continue to evolve the program and enhance its strategic impact as it rolls out further. Each local business unit has a designated experience champion that reports back to the global program lead, Judith van Herwaarden. Because each country has its own champion, they have the flexibility to run the program to suit the local customers
giving the feedback and the business strategy, capabilities and priorities.
Judith stresses the importance of experimenting to keep evolving a B2B CX program. “Just experiment. Take a trusted market and try to throw some numbers around and see what comes out… But the local success of the program may never hinge on the outcomes. Find some people that are believing in this anyway and then do the experiments. If they’re successful you can start scaling.” says Van Herwaarden.
One of the core components of their program across all countries is customer follow-up. In an internal study, the team found that 100% of detractors left if they weren’t turned into passives or promoters. For this reason alone, following up with detractors and passives is essential to the success of this program.
After surveys are filled out, amongst others, all passives and detractors are followed up via a personalized phone call to discuss their pains and problems and find out how to recover their satisfaction. Due to this hands-on approach, HeidelbergCement has been able to further strengthen relationships with customers and receive over 70% response rates on their surveys on average. Another reason they get such high marks on their response rate metric is they “don’t just survey to survey” according to Van Herwaarden. Every survey is part of a closed loop process to improve and innovate customer experiences, with the ultimate goal of creating unique customer value and unbreakable loyalty.

117 | The State of B2B Account Experience
Spotlight:
Industry: IT Services
How Macronet Services Maximizes Their Retention Rate With Technical & Business SupportMacronet Services is a Solution Design firm for network infrastructure, Cloud and UCaaS and FinOps supporting clients globally.
Macronet Services retention rates are impressive, however, what’s more impressive is their cross-sell and up-sell numbers. 90% of their existing customers will partner with Macronet for a new technology solution. This is a massive testament to their ability to not only serve their customers well, but build an enduring trust.
Macronet attributes these connections to thoughtful implementation of best-practice customer success tactic spread across the entire customer journey.
How many companies wish their Solution Architect or Customer Success Manager (CSM) could support all of their technology vendors? This is what Macronet specializes in which helps better shape customer outcomes more broadly. But with such a complex network of technology and vendors, it often takes tenacity to deliver an end-to-end solution.
“Technical Chops to work with customer outcomes derails the
traditional mindset of a typical CSM contributor. As Orgs need to add multiple vendors into a solution, you better know your stuff and how to deliver on a maniacal customer experience,” explains Co-Founder Gary Sloper. “If we had 1-5 SaaS SKUs, that would be a different motion, but we support 80+.”Macronet’s NPS provides great insight and finds their service review cadence provides a wealth of information on the health of their accounts. Implementing regular account check-ins based off the NPS feedback is critical to maintaining and industry-leading retention rate.
Sloper spent years as both a VP of Sales Engineering and Customer Success owning the life cycle for companies at places such as Lumen & Oracle. “We saw a need when a customer needs both technical and business support and many vendors can’t connect the dots. Clients lose and that’s not acceptable. ”
What’s unique is Macronet not only provides their Customer Success model for their responsibility of services, they advise vendors on how to build CS culture. It also allows them to stay current & relevant by learning what customers need. “Customer Success starts with leadership; if the CEO of a SaaS company believes CS/CX is just a team, they already lost,” Sloper says.
Macronet takes the learnings from their own experience program and offer an innovative ‘Customer Success as a Service’ solution that helps their clients maximize account retention rates.
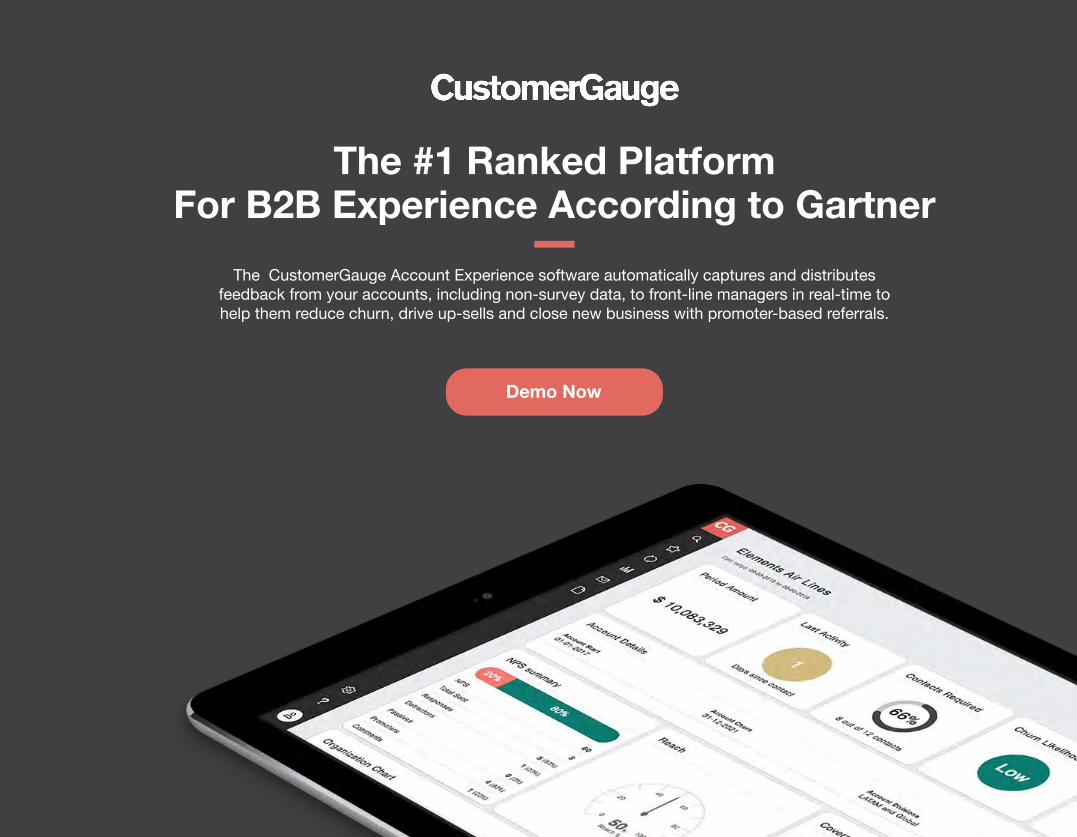
118 | The State of B2B Account Experience
Demo Now
The #1 Ranked PlatformFor B2B Experience According to Gartner
The CustomerGauge Account Experience software automatically captures and distributes feedback from your accounts, including non-survey data, to front-line managers in real-time to help them reduce churn, drive up-sells and close new business with promoter-based referrals.

119 | The State of B2B Account Experience
Struggling to Get Buy-in For Your B2B Experience Program?Start a FREE CustomerGauge Account Experience Software Pilot and get results into your business before spending a dime.
Heres How It Works:
Send a relationship survey to 1,000 contacts
Custom business review with integrated B2B benchmarks
Integrate revenue directly with your experience data in real-time
No obligation, no risk
Get Started
“You guys made it really easy…you said, ‘we’ll get you results before you even put any money into our bank account.’ And the truth is, once those results came in, no question on the value of this program.”
Leif CederblomDirector of CX

120 | The State of B2B Account Experience
About CustomerGaugeBuilt from the ground up to cater to the more complex B2B business environment, the CustomerGauge Account Experience™ solution excels at collecting feedback and signals at the account-level, and distributing this information in real-time to front-line employees so businesses can proactively retain and grow accounts faster. Account Experience also takes the guesswork out of the experience ROI equation by linking all account metrics and sentiment directly to revenue maximizing buy-in from the C-Suite ensuring long-term program success and cultural transformation.
CustomerGauge EMEAVan Diemenstraat 182Amsterdam 1013CPThe Netherlands+31 208 20 21 60
CustomerGauge US3 Burlington Woods Drive,Burlington, MA01803, USA+1-844-211-393
Account Experience is a trademark of CustomerGauge. Net Promoter, NPS, and Net Promoter Score are trademarks of Satmetrix Systems, Inc., Bain & Company, and Fred Reichheld.
Copyright CustomerGauge © 2021. All rights reserved. First edition. Originally published for digital in the United States on August 2021.
Stay Connected
Contact Us: