Embed Size (px)
Citation preview
THE STATE EDUCATION DEPARTMENT / THE UNIVERSITY OF THE STATE OF NEW YORK / ALBANY, NY 12234
TO: P-12 Education Committee FROM: Cosimo Tangorra, Jr. SUBJECT: Charter Schools: Charter Renewal Recommendations for
Charters Authorized by the Chancellor of the New York City Department of Education (NYCDOE)
DATE: April 13, 2015 AUTHORIZATION(S):
SUMMARY Issue for Decision
Should the Regents approve the proposed renewal charters for the following charter schools authorized by the Chancellor of the New York City Department of Education (NYCDOE):
KIPP Academy Charter School
Manhattan Charter School
Mott Haven Academy Charter School
Reason(s) for Consideration
Required by New York State Law. Proposed Handling
This issue will be before the Regents P-12 Education Committee and the Full
Board for action at the April 2015 Regents meeting.
2
Procedural History The Chancellor of the NYCDOE approved the renewal of the charter schools set
forth below and submitted recommendations to the Regents for approval and issuance of the renewal charters as required by Article 56 of the Education Law, the New York Charter Schools Act.
Background Information
I forward the recommendations for the renewal charters of the following charter
schools, as proposed by the Chancellor of the New York City Department of Education (NYCDOE) in her capacity as a charter school authorizer under Article 56 of the Education Law. The Chancellor asks that the charters be extended for the terms indicated. The summary of the NYCDOE’s 2014 Renewal Recommendation Report for each school are attached to this item. The full Renewal Reports for each school are available at the links below:
KIPP Academy Charter School (short term with revised enrollment, 4 years through June 2019) http://schools.nyc.gov/NR/rdonlyres/DC459309-498E-4B7E-80E0-3753BE6B6D8E/0/KIPP_Academy_Renewal_Report_FINAL_SEND.pdf
Manhattan Charter School (short term, 4 years through June 2019) http://schools.nyc.gov/NR/rdonlyres/5D251D15-14A7-4D53-AF13-6FC4F20C3EB3/0/ManhattanCharterSchoolRenewalReport201415_vFinalSend.pdf
Mott Haven Academy Charter School (full term with revised enrollment, through June 2020) http://schools.nyc.gov/NR/rdonlyres/55E744BC-1BED-4E54-A899-144ED6BE3795/0/Mott_Haven_Renewal_Report_FINAL.pdf
Recommendation
VOTED: That the Board of Regents finds that, KIPP Academy Charter School: (1) meets the requirements set out in Article 56 of the Education Law, and all other applicable laws, rules and regulations; (2) the applicant can demonstrate the ability to operate the school in an educationally and fiscally sound manner; (3) granting the application is likely to improve student learning and achievement and materially further the purposes set out in subdivision two of section twenty-eight hundred fifty of this article; and (4) granting the application would have a significant educational benefit to the students expected to attend the charter school, and the Board of Regents therefore approves and issues the renewal charter of KIPP Academy Charter School as proposed by the Chancellor of the New York City Department of Education, and extends its provisional charter for a term up through and including June 30, 2019.

3
VOTED: That the Board of Regents finds that, Manhattan Charter School: (1) meets the requirements set out in Article 56 of the Education Law, and all other applicable laws, rules and regulations; (2) the applicant can demonstrate the ability to operate the school in an educationally and fiscally sound manner; (3) granting the application is likely to improve student learning and achievement and materially further the purposes set out in subdivision two of section twenty-eight hundred fifty of this article; and (4) granting the application would have a significant educational benefit to the students expected to attend the charter school, and the Board of Regents therefore approves and issues the renewal charter of Manhattan Charter School as proposed by the Chancellor of the New York City Department of Education, and extends its provisional charter for a term up through and including June 30, 2019.
VOTED: That the Board of Regents finds that, Mott Haven Academy Charter School: (1) meets the requirements set out in Article 56 of the Education Law, and all other applicable laws, rules and regulations; (2) the applicant can demonstrate the ability to operate the school in an educationally and fiscally sound manner; (3) granting the application is likely to improve student learning and achievement and materially further the purposes set out in subdivision two of section twenty-eight hundred fifty of this article; and (4) granting the application would have a significant educational benefit to the students expected to attend the charter school, and the Board of Regents therefore approves and issues the renewal charter of Mott Haven Charter School as proposed by the Chancellor of the New York City Department of Education, and extends its provisional charter for a term up through and including June 30, 2020.
Timetable for Implementation
The Regents action for the above named charter schools will become effective
immediately.
Attachments

Part 1: Summary of Renewal Recommendation
I. Charter School Overview:
Background Information
KIPP Academy Charter School
Board Chair(s) David Massey
School Leader(s) Carolyn Petruzziello (ES), Frank Corcoran (MS), Natalie Webb (HS), Josh Zoia (KIPP NYC Superintendent)
Charter Management Organization (if applicable)
KIPP NYC LLC
Other Partner(s) N/A
District(s) of Location NYC Community School District 7
Physical Address(es)
730 Concourse Village West, Bronx (Grades K-4)
250 East 156 Street, Bronx (Grades 5-8)
201 East 144th Street, Bronx (Grades 9-12)
Facility Owner(s) DOE (the elementary and high school sites are Charter Partnership buildings)
School Opened For Instruction 2000-2001
Current Charter Term Expiration Date 5/16/2015
Current Authorized Grade Span K-12
Current Authorized Enrollment 855

Overview of School-Specific Data
School Evaluation of Academic Goals as stated in Annual Report to NYSED and Renewal Application to NYC DOE
Academic Goal Analysis
2010-2011
2011-2012
2012-2013
2013-2014
Cumulative Charter Term
Total
Total Achievable Goals 29 29 29 29 116
# Met 11 9 16 12 48
# Partially Met 1 2 0 0 3
# Not Met 4 5 8 12 29
# Not Applicable * 13 13 5 5 36
% Met 38% 31% 55% 41% 41%
% Partially Met 3% 7% 0% 0% 3%
% Not Met 14% 17% 28% 41% 25%
% Not Applicable * 45% 45% 17% 17% 31%
% Met of All Applicable Goals 69% 56% 67% 50% 60%
* Some goals may not be applicable in all years. For example, goals related to the NYC Progress Report are not applicable for the 2013-2014 school year as Progress Reports were not issued that year.
ES/MS students scoring at or above Level 3 on NYS assessments, compared to CSD, NYC and State averages
% Proficient in English Language Arts
2010-2011
2011-2012
2012-2013
2013-2014
KIPP Academy Charter School 51.7% 63.3% 26.8% 20.8%
CSD 7 20.3% 23.5% 9.1% 9.2%
Difference from CSD 7 * 31.4 39.8 17.7 11.6
NYC 41.0% 45.0% 26.2% 28.4%
Difference from NYC * 10.7 18.3 0.6 -7.6
New York State ** 52.8% 55.1% 31.1% 30.6%
Difference from New York State -1.1 8.2 -4.3 -9.8
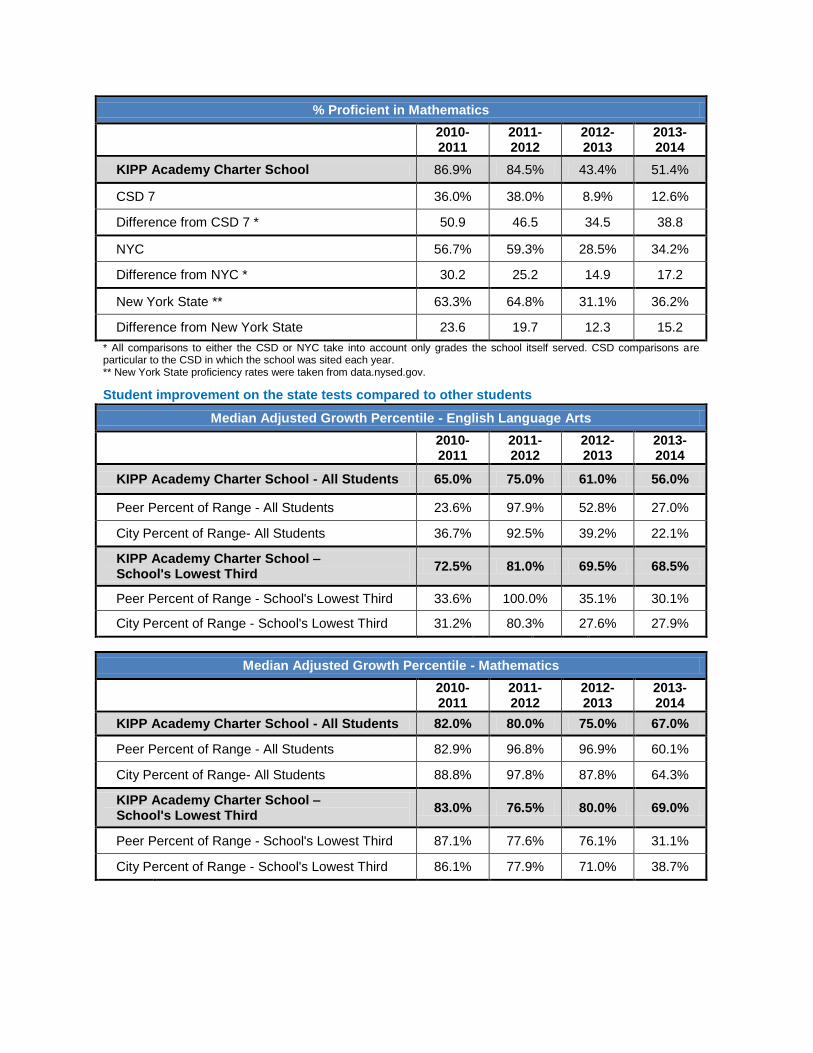
% Proficient in Mathematics
2010-2011
2011-2012
2012-2013
2013-2014
KIPP Academy Charter School 86.9% 84.5% 43.4% 51.4%
CSD 7 36.0% 38.0% 8.9% 12.6%
Difference from CSD 7 * 50.9 46.5 34.5 38.8
NYC 56.7% 59.3% 28.5% 34.2%
Difference from NYC * 30.2 25.2 14.9 17.2
New York State ** 63.3% 64.8% 31.1% 36.2%
Difference from New York State 23.6 19.7 12.3 15.2
* All comparisons to either the CSD or NYC take into account only grades the school itself served. CSD comparisons are particular to the CSD in which the school was sited each year. ** New York State proficiency rates were taken from data.nysed.gov.
Student improvement on the state tests compared to other students
Median Adjusted Growth Percentile - English Language Arts
2010-2011
2011-2012
2012-2013
2013-2014
KIPP Academy Charter School - All Students 65.0% 75.0% 61.0% 56.0%
Peer Percent of Range - All Students 23.6% 97.9% 52.8% 27.0%
City Percent of Range- All Students 36.7% 92.5% 39.2% 22.1%
KIPP Academy Charter School – School's Lowest Third
72.5% 81.0% 69.5% 68.5%
Peer Percent of Range - School's Lowest Third 33.6% 100.0% 35.1% 30.1%
City Percent of Range - School's Lowest Third 31.2% 80.3% 27.6% 27.9%
Median Adjusted Growth Percentile - Mathematics
2010-2011
2011-2012
2012-2013
2013-2014
KIPP Academy Charter School - All Students 82.0% 80.0% 75.0% 67.0%
Peer Percent of Range - All Students 82.9% 96.8% 96.9% 60.1%
City Percent of Range- All Students 88.8% 97.8% 87.8% 64.3%
KIPP Academy Charter School – School's Lowest Third
83.0% 76.5% 80.0% 69.0%
Peer Percent of Range - School's Lowest Third 87.1% 77.6% 76.1% 31.1%
City Percent of Range - School's Lowest Third 86.1% 77.9% 71.0% 38.7%

Closing the Achievement Gap
Percent in the 75th Growth Percentile - English Language Arts
2010-2011
2011-2012
2012-2013
2013-2014
Students with Disabilities * 50.0% 60.0% 51.5% 44.9%
English Language Learner Students 35.1% 45.9% 47.2% 31.6%
Students in the Lowest Third Citywide 39.3% 55.9% 50.9% 44.3%
Percent in the 75th Growth Percentile - Mathematics
2010-2011
2011-2012
2012-2013
2013-2014
Students with Disabilities * 68.2% 44.0% 66.7% 49.0%
English Language Learner Students 54.1% 59.5% 58.3% 37.5%
Students in the Lowest Third Citywide 62.5% 53.3% 77.1% 51.4%
* Defined as students with a placement in Self-Contained, ICT, or SETSS.
KIPP Academy Charter School is one of four charter schools supported by the KIPP NYC LLC (KIPP NYC) Charter Management Organization (CMO) that share high school resources, staff, and space at 201 East 144
th Street, Bronx. The KIPP NYC CMO refers to this building, and the four schools sharing
staff and resources within it, as KIPP NYC College Prep Charter School.1 KIPP NYC College Prep
Charter School is not a legal charter school, but rather the collection of the high school grades of four unique charter schools: KIPP Academy Charter School, KIPP AMP Charter School, KIPP STAR College Prep Charter School, and KIPP Infinity Charter School. Only three of these schools are authorized by the New York City Department of Education (NYC DOE) Chancellor. Beginning in the 2010-2011 school year, the NYC DOE began grouping the high school grades of the four KIPP CMO schools together for public reporting and accountability purposes, including the NYC School Survey, NYC DOE Progress Reports, and the 2013-2014 NYC School Quality Reports.
The high school graduation rates presented below reflect high school students from KIPP Academy Charter School only. For high school performance data reflecting all students at KIPP NYC College Prep Charter School (i.e. high school students enrolled in the four KIPP NYC CMO schools serving high school students), including data on weighted Regents pass rates, credit accumulation, and closing the achievement gap metrics, please see Appendix B.
1 The four KIPP CMO schools whose high school grades together make up KIPP NYC College Prep Charter School are KIPP
Academy Charter School, KIPP AMP Charter School, KIPP STAR College Prep Charter School and KIPP Infinity Charter School. KIPP STAR College Prep Charter School is not authorized by the NYC DOE Chancellor.
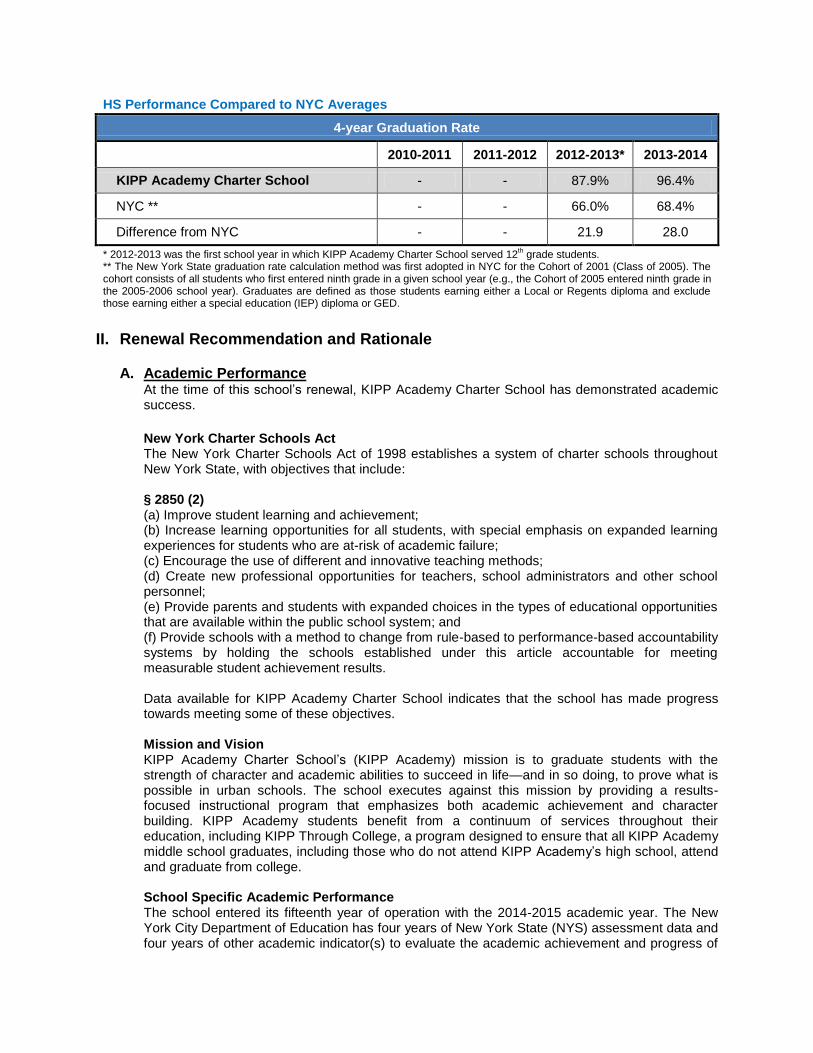
HS Performance Compared to NYC Averages
4-year Graduation Rate
2010-2011 2011-2012 2012-2013* 2013-2014
KIPP Academy Charter School - - 87.9% 96.4%
NYC ** - - 66.0% 68.4%
Difference from NYC - - 21.9 28.0
* 2012-2013 was the first school year in which KIPP Academy Charter School served 12th grade students.
** The New York State graduation rate calculation method was first adopted in NYC for the Cohort of 2001 (Class of 2005). The cohort consists of all students who first entered ninth grade in a given school year (e.g., the Cohort of 2005 entered ninth grade in the 2005-2006 school year). Graduates are defined as those students earning either a Local or Regents diploma and exclude those earning either a special education (IEP) diploma or GED.
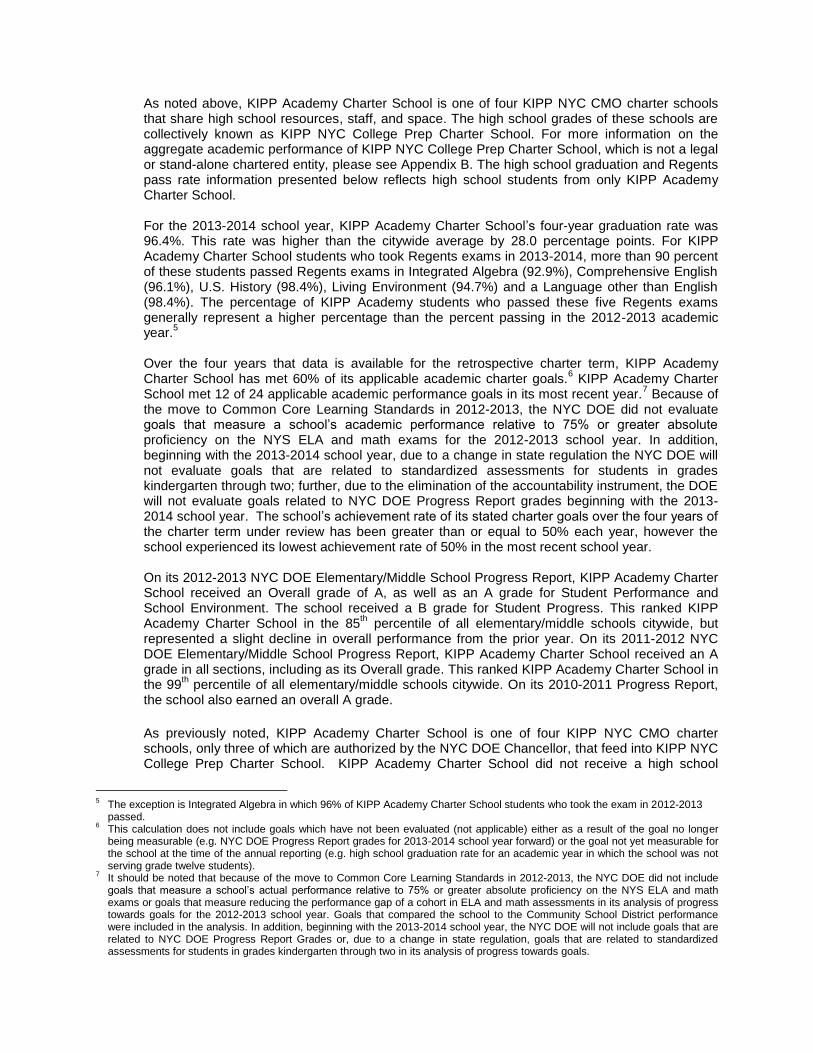
II. Renewal Recommendation and Rationale
A. Academic Performance
At the time of this school’s renewal, KIPP Academy Charter School has demonstrated academic success.
New York Charter Schools Act The New York Charter Schools Act of 1998 establishes a system of charter schools throughout New York State, with objectives that include: § 2850 (2) (a) Improve student learning and achievement; (b) Increase learning opportunities for all students, with special emphasis on expanded learning experiences for students who are at-risk of academic failure; (c) Encourage the use of different and innovative teaching methods; (d) Create new professional opportunities for teachers, school administrators and other school personnel; (e) Provide parents and students with expanded choices in the types of educational opportunities that are available within the public school system; and (f) Provide schools with a method to change from rule-based to performance-based accountability systems by holding the schools established under this article accountable for meeting measurable student achievement results. Data available for KIPP Academy Charter School indicates that the school has made progress towards meeting some of these objectives. Mission and Vision KIPP Academy Charter School’s (KIPP Academy) mission is to graduate students with the strength of character and academic abilities to succeed in life—and in so doing, to prove what is possible in urban schools. The school executes against this mission by providing a results-focused instructional program that emphasizes both academic achievement and character building. KIPP Academy students benefit from a continuum of services throughout their education, including KIPP Through College, a program designed to ensure that all KIPP Academy middle school graduates, including those who do not attend KIPP Academy’s high school, attend and graduate from college. School Specific Academic Performance The school entered its fifteenth year of operation with the 2014-2015 academic year. The New York City Department of Education has four years of New York State (NYS) assessment data and four years of other academic indicator(s) to evaluate the academic achievement and progress of

the students at KIPP Academy Charter School over the course of the retrospective charter term. Annual aggregate English Language Arts (ELA) and math proficiency rates on the NYS assessments for KIPP Academy Charter School have generally exceeded those of both Community School District (CSD) 7 and New York City during the current charter term.
2
Beginning with the 2012-2013 school year, NYS assessments were aligned to the Common Core Learning Standards (CCLS). As such, proficiency rates for school years prior to the 2012-2013 year are not directly comparable. In 2012-2013, 43.4% of KIPP Academy Charter School’s students were proficient in math on the NYS assessments. KIPP Academy Charter School’s math proficiency was greater than or equal to that of 75% of all elementary/middle schools citywide and 100% of elementary/middle schools in CSD 7. When compared to elementary/middle schools with student populations most like its own (i.e. peer schools) KIPP Academy Charter School outperformed 90% of similar schools. In 2012-2013, 26.8% of KIPP Academy Charter School’s students demonstrated proficiency on state assessments in ELA. With this level of proficiency, KIPP Academy Charter School outperformed 62% of all elementary/middle schools citywide and 100% of elementary/middle schools in CSD 7. KIPP Academy Charter School also outperformed 87% of its peer schools. The following year, in 2013-2014, the percent of students at KIPP Academy Charter School who were proficient in math on the NYS assessments rose to 51.4%. KIPP Academy Charter School’s math proficiency was higher than 76% of all elementary/middle schools citywide. When compared to peer schools, KIPP Academy Charter School again outperformed 90% of similar schools and outperformed 100% of CSD 7 elementary/middle schools. Alternately in 2013-2014, the percent of students at KIPP Academy Charter School who demonstrated proficiency on the NYS assessments in ELA fell to 20.8%. With this level of proficiency, KIPP Academy Charter School outperformed only 42% of all elementary/middle schools citywide and 53% of elementary/middle schools in its peer group. However, the school still outperformed 100% of elementary/middle schools in CSD 7.
3
In 2013-2014, KIPP Academy Charter School’s ELA median adjusted growth percentile on the NYS assessments was 56.0% with a City Percent of Range of only 22.1%, placing the school in the bottom 10% of all elementary/middle schools citywide.
4 Similarly, the school’s peer and CSD
percentiles were 17% and 0%, respectively. This means that all other elementary/middle schools in CSD 7 and more than four-fifths of the all other elementary/middle schools in KIPP Academy Charter School’s peer group had an ELA median adjusted growth percentile greater than KIPP Academy Charter School’s ELA median adjusted growth percentile in 2013-2014. In 2013-2014, KIPP Academy Charter School’s math median adjusted growth percentile on the NYS assessments was 67.0% with a City Percent of Range of 64.3%, placing it in the 70
th
percentile of all elementary/middle schools citywide. The school’s peer group and CSD percentiles were 57% and 100%, respectively. This means all other elementary/middle schools in CSD 7 and more than half of other elementary/middle schools in KIPP Academy Charter School’s peer group had math median adjusted growth percentiles lower than KIPP Academy Charter School’s math median adjusted growth percentile in 2013-2014.
2 The only exception is for ELA proficiency in 2013-2014, when KIPP Academy Charter School’s aggregate ELA proficiency was
7.6 percentage points below the overall NYC proficiency for the comparable grade span. 3 Please note that there were only four elementary/middle schools in CSD 7 in the 2013-2014 school year.
4 A comparison range consists of all possible results within two standard deviations of the average. A percentile rank provides the
percentage of schools that score the same or lower than the school under consideration. A City Percent of Range of 22.1% indicates that the school’s ELA median adjusted growth percentile was below the average and more than one standard deviation below the average (that only 22.1% of the range around the average represented scores lower than that of KIPP Academy Charter School), while a citywide percentile of 10% indicates that KIPP Academy Charter School’s ELA median adjusted growth percentile was higher than only 10% of all elementary/middle schools citywide.
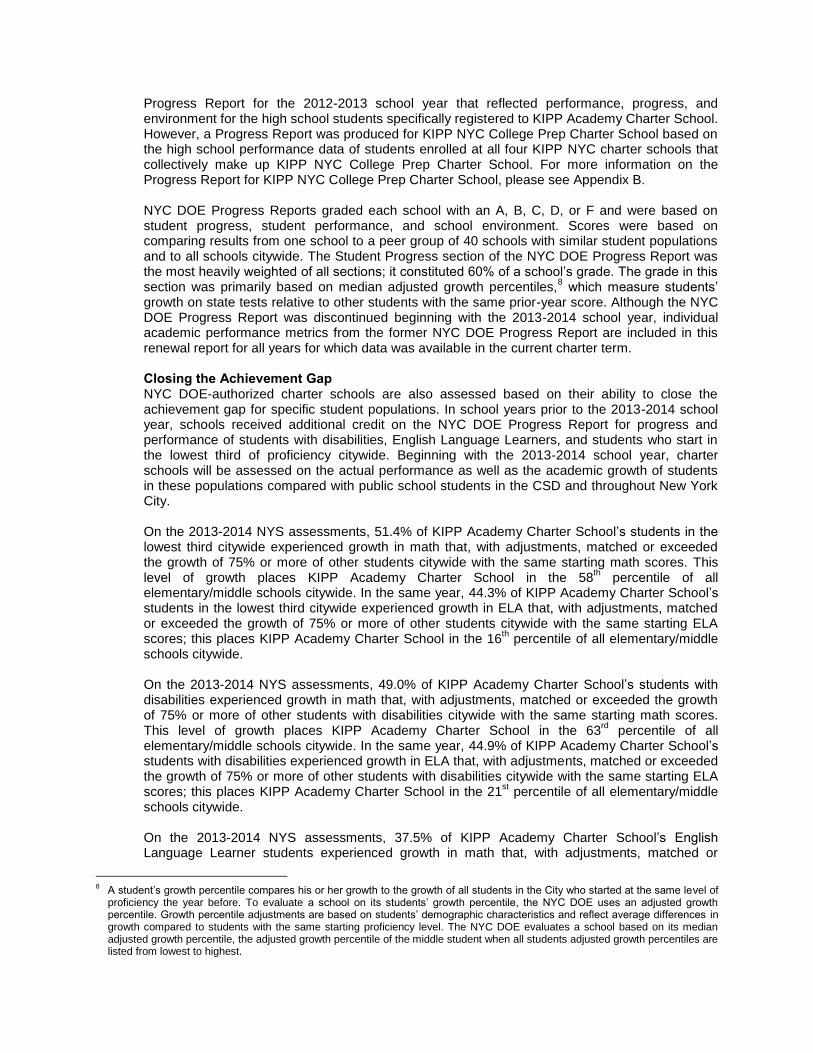
As noted above, KIPP Academy Charter School is one of four KIPP NYC CMO charter schools that share high school resources, staff, and space. The high school grades of these schools are collectively known as KIPP NYC College Prep Charter School. For more information on the aggregate academic performance of KIPP NYC College Prep Charter School, which is not a legal or stand-alone chartered entity, please see Appendix B. The high school graduation and Regents pass rate information presented below reflects high school students from only KIPP Academy Charter School. For the 2013-2014 school year, KIPP Academy Charter School’s four-year graduation rate was 96.4%. This rate was higher than the citywide average by 28.0 percentage points. For KIPP Academy Charter School students who took Regents exams in 2013-2014, more than 90 percent of these students passed Regents exams in Integrated Algebra (92.9%), Comprehensive English (96.1%), U.S. History (98.4%), Living Environment (94.7%) and a Language other than English (98.4%). The percentage of KIPP Academy students who passed these five Regents exams generally represent a higher percentage than the percent passing in the 2012-2013 academic year.
5
Over the four years that data is available for the retrospective charter term, KIPP Academy Charter School has met 60% of its applicable academic charter goals.
6 KIPP Academy Charter
School met 12 of 24 applicable academic performance goals in its most recent year.7 Because of
the move to Common Core Learning Standards in 2012-2013, the NYC DOE did not evaluate goals that measure a school’s academic performance relative to 75% or greater absolute proficiency on the NYS ELA and math exams for the 2012-2013 school year. In addition, beginning with the 2013-2014 school year, due to a change in state regulation the NYC DOE will not evaluate goals that are related to standardized assessments for students in grades kindergarten through two; further, due to the elimination of the accountability instrument, the DOE will not evaluate goals related to NYC DOE Progress Report grades beginning with the 2013-2014 school year. The school’s achievement rate of its stated charter goals over the four years of the charter term under review has been greater than or equal to 50% each year, however the school experienced its lowest achievement rate of 50% in the most recent school year.
On its 2012-2013 NYC DOE Elementary/Middle School Progress Report, KIPP Academy Charter School received an Overall grade of A, as well as an A grade for Student Performance and School Environment. The school received a B grade for Student Progress. This ranked KIPP Academy Charter School in the 85
th percentile of all elementary/middle schools citywide, but
represented a slight decline in overall performance from the prior year. On its 2011-2012 NYC DOE Elementary/Middle School Progress Report, KIPP Academy Charter School received an A grade in all sections, including as its Overall grade. This ranked KIPP Academy Charter School in the 99
th percentile of all elementary/middle schools citywide. On its 2010-2011 Progress Report,
the school also earned an overall A grade.
As previously noted, KIPP Academy Charter School is one of four KIPP NYC CMO charter schools, only three of which are authorized by the NYC DOE Chancellor, that feed into KIPP NYC College Prep Charter School. KIPP Academy Charter School did not receive a high school
5 The exception is Integrated Algebra in which 96% of KIPP Academy Charter School students who took the exam in 2012-2013
passed. 6 This calculation does not include goals which have not been evaluated (not applicable) either as a result of the goal no longer
being measurable (e.g. NYC DOE Progress Report grades for 2013-2014 school year forward) or the goal not yet measurable for the school at the time of the annual reporting (e.g. high school graduation rate for an academic year in which the school was not serving grade twelve students).
7 It should be noted that because of the move to Common Core Learning Standards in 2012-2013, the NYC DOE did not include
goals that measure a school’s actual performance relative to 75% or greater absolute proficiency on the NYS ELA and math exams or goals that measure reducing the performance gap of a cohort in ELA and math assessments in its analysis of progress towards goals for the 2012-2013 school year. Goals that compared the school to the Community School District performance were included in the analysis. In addition, beginning with the 2013-2014 school year, the NYC DOE will not include goals that are related to NYC DOE Progress Report Grades or, due to a change in state regulation, goals that are related to standardized assessments for students in grades kindergarten through two in its analysis of progress towards goals.
Progress Report for the 2012-2013 school year that reflected performance, progress, and environment for the high school students specifically registered to KIPP Academy Charter School. However, a Progress Report was produced for KIPP NYC College Prep Charter School based on the high school performance data of students enrolled at all four KIPP NYC charter schools that collectively make up KIPP NYC College Prep Charter School. For more information on the Progress Report for KIPP NYC College Prep Charter School, please see Appendix B. NYC DOE Progress Reports graded each school with an A, B, C, D, or F and were based on student progress, student performance, and school environment. Scores were based on comparing results from one school to a peer group of 40 schools with similar student populations and to all schools citywide. The Student Progress section of the NYC DOE Progress Report was the most heavily weighted of all sections; it constituted 60% of a school’s grade. The grade in this section was primarily based on median adjusted growth percentiles,
8 which measure students’
growth on state tests relative to other students with the same prior-year score. Although the NYC DOE Progress Report was discontinued beginning with the 2013-2014 school year, individual academic performance metrics from the former NYC DOE Progress Report are included in this renewal report for all years for which data was available in the current charter term. Closing the Achievement Gap NYC DOE-authorized charter schools are also assessed based on their ability to close the achievement gap for specific student populations. In school years prior to the 2013-2014 school year, schools received additional credit on the NYC DOE Progress Report for progress and performance of students with disabilities, English Language Learners, and students who start in the lowest third of proficiency citywide. Beginning with the 2013-2014 school year, charter schools will be assessed on the actual performance as well as the academic growth of students in these populations compared with public school students in the CSD and throughout New York City. On the 2013-2014 NYS assessments, 51.4% of KIPP Academy Charter School’s students in the lowest third citywide experienced growth in math that, with adjustments, matched or exceeded the growth of 75% or more of other students citywide with the same starting math scores. This level of growth places KIPP Academy Charter School in the 58
th percentile of all
elementary/middle schools citywide. In the same year, 44.3% of KIPP Academy Charter School’s students in the lowest third citywide experienced growth in ELA that, with adjustments, matched or exceeded the growth of 75% or more of other students citywide with the same starting ELA scores; this places KIPP Academy Charter School in the 16
th percentile of all elementary/middle
schools citywide. On the 2013-2014 NYS assessments, 49.0% of KIPP Academy Charter School’s students with disabilities experienced growth in math that, with adjustments, matched or exceeded the growth of 75% or more of other students with disabilities citywide with the same starting math scores. This level of growth places KIPP Academy Charter School in the 63
rd percentile of all
elementary/middle schools citywide. In the same year, 44.9% of KIPP Academy Charter School’s students with disabilities experienced growth in ELA that, with adjustments, matched or exceeded the growth of 75% or more of other students with disabilities citywide with the same starting ELA scores; this places KIPP Academy Charter School in the 21
st percentile of all elementary/middle
schools citywide. On the 2013-2014 NYS assessments, 37.5% of KIPP Academy Charter School’s English Language Learner students experienced growth in math that, with adjustments, matched or
8 A student’s growth percentile compares his or her growth to the growth of all students in the City who started at the same level of
proficiency the year before. To evaluate a school on its students’ growth percentile, the NYC DOE uses an adjusted growth percentile. Growth percentile adjustments are based on students’ demographic characteristics and reflect average differences in growth compared to students with the same starting proficiency level. The NYC DOE evaluates a school based on its median adjusted growth percentile, the adjusted growth percentile of the middle student when all students adjusted growth percentiles are listed from lowest to highest.

exceeded the growth of 75% or more of other English Language Learner students citywide with the same starting math scores. This level places KIPP Academy Charter School in 44
th percentile
of all elementary/middle schools citywide. Similarly, 31.6% of the school’s English Language Learner students experienced growth in ELA that, with adjustments, matched or exceeded the growth of 75% or more of other English Language Learner students citywide with the same starting ELA scores; this places KIPP Academy Charter School in only the 23
rd percentile of all
elementary/middle schools citywide. Please see Appendix B for high school closing the achievement gap data, which reflects high school students from all KIPP NYC CMO schools that collectively make up KIPP NYC College Prep Charter School and is not limited to those enrolled at KIPP Academy Charter School.
B. Governance, Operations & Finances
KIPP Academy Charter School is an operationally sound and fiscally viable organization. This assessment was made based on a review of the following indicators of operational and fiscal viability:
KIPP Academy Charter School’s FY10, FY11, FY12, FY13, and FY14 independent financial audits;
KIPP Academy Charter School’s FY15 budget and five-year projected budget;
KIPP Academy Charter School’s 2014-2015 staff handbook;
KIPP Academy Charter School’s 2014-2015 student/family handbook;
On-site review of KIPP Academy Charter School’s financial and operational records;
KIPP Academy Charter School’s self-reported staffing data;
KIPP Academy Charter School’s Board of Trustees meeting minutes;
KIPP Academy Charter School’s Board of Trustees bylaws; and
KIPP Academy Charter School’s financial disclosure forms. Over the course of the school’s charter term, the Board of Trustees has maintained a developed governance structure and organizational design. Board Chair David Massey has been on the Board since January 2004. The Board’s level of membership has stayed consistently within the minimum of five members and maximum of 25 members established in the Board’s bylaws; the Board currently has seven members. Over the course of the school’s retrospective charter term, the Board’s bylaws did not require a specified number of regular Board meetings. In the past four academic years including the current year, 2011-2012 through 2014-2015, the Board held between three and four meetings which meet quorum during the academic year, including its annual meeting. The NYC DOE reviewed 12 sets of Board minutes from the retrospective charter term all of which met quorum. The KIPP Academy Charter School Board of Trustees holds its meeting concurrently with the meetings of the other four KIPP NYC affiliated charter schools and the KIPP NYC College Prep Charter School advisory Board. The Superintendent, an employee of the collective KIPP NYC charter schools’ Boards of Trustees, regularly updates the Board on academic progress at the school, as recorded in meeting minutes, and regular operational and financial updates are provided by the KIPP NYC operations and finance staff. However, these non-academic updates are provided by members of the KIPP NYC support team and not the KIPP Academy school leadership team. Over the course of the school’s current charter term, the school has developed a stable school culture. The core school leadership team has held their positions since 2011. The school’s leadership team includes: Carolyn Petruzziello, Elementary School Principal, who has held this position since 2009; Frank Corcoran, Middle School Principal, who has held this position since 2011 and Natalie Webb, High School Principal, who has held this position since July 2009. Ms. Petruzziello will end her tenure in June 2015; current Assistant Principal Tyritia Groves will take over the role of Elementary School Principal at that time. The school is also overseen by KIPP
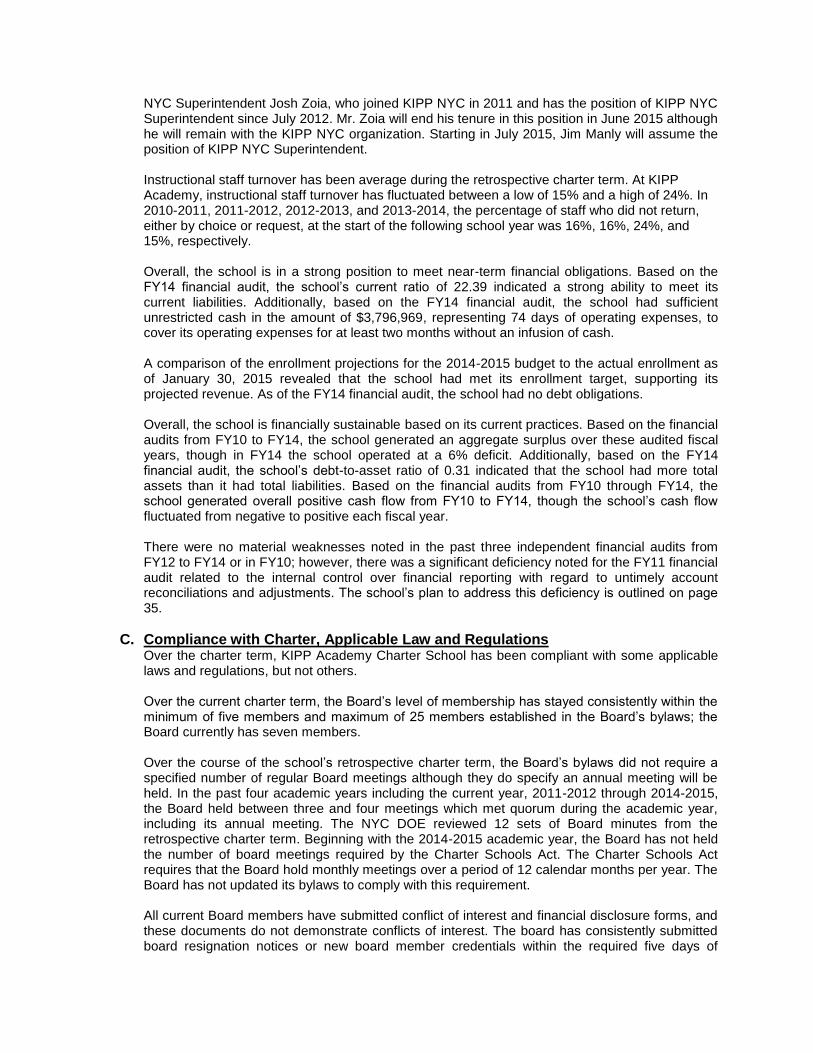
NYC Superintendent Josh Zoia, who joined KIPP NYC in 2011 and has the position of KIPP NYC Superintendent since July 2012. Mr. Zoia will end his tenure in this position in June 2015 although he will remain with the KIPP NYC organization. Starting in July 2015, Jim Manly will assume the position of KIPP NYC Superintendent. Instructional staff turnover has been average during the retrospective charter term. At KIPP Academy, instructional staff turnover has fluctuated between a low of 15% and a high of 24%. In 2010-2011, 2011-2012, 2012-2013, and 2013-2014, the percentage of staff who did not return, either by choice or request, at the start of the following school year was 16%, 16%, 24%, and 15%, respectively. Overall, the school is in a strong position to meet near-term financial obligations. Based on the FY14 financial audit, the school’s current ratio of 22.39 indicated a strong ability to meet its current liabilities. Additionally, based on the FY14 financial audit, the school had sufficient unrestricted cash in the amount of $3,796,969, representing 74 days of operating expenses, to cover its operating expenses for at least two months without an infusion of cash. A comparison of the enrollment projections for the 2014-2015 budget to the actual enrollment as of January 30, 2015 revealed that the school had met its enrollment target, supporting its projected revenue. As of the FY14 financial audit, the school had no debt obligations. Overall, the school is financially sustainable based on its current practices. Based on the financial audits from FY10 to FY14, the school generated an aggregate surplus over these audited fiscal years, though in FY14 the school operated at a 6% deficit. Additionally, based on the FY14 financial audit, the school’s debt-to-asset ratio of 0.31 indicated that the school had more total assets than it had total liabilities. Based on the financial audits from FY10 through FY14, the school generated overall positive cash flow from FY10 to FY14, though the school’s cash flow fluctuated from negative to positive each fiscal year. There were no material weaknesses noted in the past three independent financial audits from FY12 to FY14 or in FY10; however, there was a significant deficiency noted for the FY11 financial audit related to the internal control over financial reporting with regard to untimely account reconciliations and adjustments. The school’s plan to address this deficiency is outlined on page 35.
C. Compliance with Charter, Applicable Law and Regulations Over the charter term, KIPP Academy Charter School has been compliant with some applicable laws and regulations, but not others. Over the current charter term, the Board’s level of membership has stayed consistently within the minimum of five members and maximum of 25 members established in the Board’s bylaws; the Board currently has seven members. Over the course of the school’s retrospective charter term, the Board’s bylaws did not require a specified number of regular Board meetings although they do specify an annual meeting will be held. In the past four academic years including the current year, 2011-2012 through 2014-2015, the Board held between three and four meetings which met quorum during the academic year, including its annual meeting. The NYC DOE reviewed 12 sets of Board minutes from the retrospective charter term. Beginning with the 2014-2015 academic year, the Board has not held the number of board meetings required by the Charter Schools Act. The Charter Schools Act requires that the Board hold monthly meetings over a period of 12 calendar months per year. The Board has not updated its bylaws to comply with this requirement. All current Board members have submitted conflict of interest and financial disclosure forms, and these documents do not demonstrate conflicts of interest. The board has consistently submitted board resignation notices or new board member credentials within the required five days of
change to the Office of School Design and Charter Partnerships (OSDCP) for review, and if necessary, approval. Although the Board has not consistently made all Board minutes and agendas available upon request to the public prior to or at Board meetings by posting on the school’s website, it does consistently post its most recent Board minutes and agendas online. Similarly, although the school has not posted to its website its annual audit for each year of the charter term, as required in charter law, it has posted the audit pertaining to FY13. The school’s annual report is posted for the three most recent academic years, 2011-2012, 2012-2013 and 2013-2014. The Board did consistently submit its Annual Report to the New York State Education Department (NYSED) by the deadline of August 1 (or by the NYSED granted extension date) for each year of the current charter term. All staff members have appropriate fingerprint clearance. The school has submitted the required safety plan. The school has the required number of staff with AED/CPR certification. One or more of the school leaders were trained in General Response Protocols/Fire Emergency Drill Conductor for NYC, as mandated by the NYC Fire Department. The school has submitted its required immunization documentation and is in compliance with Department of Health standards of 99% for immunization. The school has submitted appropriate insurance documents to the NYC DOE. Over the course of the charter term, the school did consistently submit complete invoicing and reconciliation documents by the associated deadlines. The school has submitted required documentation for teacher certification and is not compliant with state requirements for certification. The Charter Schools Act prohibits more than five staff members or more than 30 percent of the teaching staff from not being certified in accordance with requirements applicable to other public schools. As of the review in March 2015, the school has 26 uncertified instructional staff members. The school’s plan to address this area of non-compliance is outlined on page 37.
D. Plans for Next Charter Term
Although the school does not plan to serve any additional grades beyond its currently authorized grades of kindergarten through twelve, it is requesting to increase its maximum authorized enrollment.

Renewal Report KIPP Academy Charter School | 1
Regents Addendum This Regents Addendum has been prepared at the request of the Board of Regents. The information presented in this addendum regarding Mobility and Enrollment of Special Populations is not factored into the DOE’s renewal recommendation. Complete data regarding Mobility and Enrollment of Special Populations is presented in Part 4 of the Renewal Recommendation Report which is available on the DOE website. Mobility
Student Mobility out of KIPP Academy Charter School *
2009-2010
2010-2011
2011-2012
2012-2013
2013-2014
Number of Students who Left the School1 35 31 34 35 127
Percent of Students who Left the School2 8.9% 5.8% 4.7% 4.3% 13.3%
* Figures are based on student enrollment as of October 31 for each respective school year with the exception of the 2012-2013 school year, which is as of October 26, 2012. Students in terminal grades are not included.
Enrollment of Special Populations3
Special Population 2009-2010
2010-2011
2011-2012
2012-2013
2013-2014
2013-2014 State
Enrollment Target
(Current)
Free and Reduced
Price Lunch (FRPL)
KIPP Academy Charter School
85.1% 85.4% 87.7% 89.7% 93.1%
94.5% CSD 7 95.5% 91.4% 93.2% 96.3% 94.0%
CSD 5 - - - 78.3% -
NYC 84.2% 79.0% 81.1% 80.4% 80.4%
Students with
Disabilities (SWD)
KIPP Academy Charter School
9.6% 10.3% 11.4% 13.8% 16.3%
18.8% CSD 7 22.8% 21.7% 20.7% 22.8% 23.0%
CSD 5 - - - 13.1% -
NYC 18.2% 17.5% 17.2% 17.8% 19.2%
1 The Number of Students who Left the School for a given school year is the total number of students who were enrolled in the
school on October 31 in the given school year that were not enrolled in the school on October 31 of the following school year. The figure includes students who left the school for any reason (i.e. all discharge and transfer codes are included); the only exception made to this rule was for students in terminal, non-phase-in grades.
2 The Percent of Students who Left the School for a given school year is the percentage of students who were enrolled in the
school on October 31 in the given school year that were not enrolled in the school on October 31 of the following school year. The percentage figure includes students who left the school for any reason (i.e. all discharge and transfer codes are included); the only exception made to this rule was for students in terminal, non-phase-in grades.
3 Comparisons of a charter school’s special populations to the CSD and City are made relative only to the grades served by the
school. For example, if a charter school serves grades kindergarten through five, comparisons of that school’s special populations will only be made relative to grades kindergarten through five in the CSD and citywide. CSD comparisons are particular to the grades served in each CSD each year. Enrollment rates reflect demographic characteristics as of June 1 and enrollment as of October 31 for each given school year, with the exception of enrollment in the 2012-2013 school year, which is as of October 26, 2012. State enrollment targets were generated by a calculator developed by the State Education Department (SED). Once a school's CSD, total enrollment and grade span are entered, the calculator generates a school-specific enrollment target. The CSD for a multi-district school is the primary CSD as determined by each school. The enrollment is determined by the total number of students enrolled as of October 31, 2013. Any school with an unusual grade configuration (i.e. K, 6-9) should use an available grade configuration provided by SED that is most aligned as determined by the DOE, otherwise a school's actual grade span is used. For more information regarding SED’s methodology behind the calculation of charter school enrollment and retention targets, please refer to the memo at http://www.regents.nysed.gov/meetings/2012Meetings/July2012/712brca11.pdf.

Renewal Report KIPP Academy Charter School | 2
Special Population 2009-2010
2010-2011
2011-2012
2012-2013
2013-2014
2013-2014 State
Enrollment Target
(Current)
English Language Learners
(ELL)
KIPP Academy Charter School
4.3% 3.8% 5.6% 8.1% 7.9%
21.2% CSD 7 19.3% 19.7% 19.5% 21.4% 18.3%
CSD 5 - - - 6.6% -
NYC 14.0% 15.2% 14.8% 14.4% 14.0%

Part 1: Summary of Renewal Recommendation
I. Charter School Overview:
Background Information
Manhattan Charter School
Board Chair(s) Manuel Romero
School Leader(s) Genie DePolo (Chief Academic Officer/ Principal); Sonia Park (Executive Director)
Charter Management Organization (if applicable)
N/A
Other Partner(s) N/A
District(s) of Location NYC Community School District 1
Physical Address(es) 100 Attorney Street, Manhattan
Facility Owner(s) DOE
School Opened For Instruction 2005-2006
Current Charter Term Expiration Date 6/30/2015
Current Authorized Grade Span K-5
Current Authorized Enrollment 274

Overview of School-Specific Data
School Evaluation of Academic Goals as stated in Annual Report to NYSED and Renewal Application to NYC DOE
Academic Goal Analysis
2010-2011
2011-2012
2012-2013
2013-2014
Cumulative Charter Term
Total
Total Achievable Goals 22 22 22 22 88
# Met 13 10 5 5 33
# Partially Met 1 0 3 2 6
# Not Met 7 11 9 11 38
# Not Applicable * 1 1 5 4 11
% Met 59% 45% 23% 23% 38%
% Partially Met 5% 0% 14% 9% 7%
% Not Met 32% 50% 41% 50% 43%
% Not Applicable * 5% 5% 23% 18% 13%
% Met of All Applicable Goals 62% 48% 29% 28% 43%
* Some goals may not be applicable in all years. For example, goals related to the NYC Progress Report are not applicable for the 2013-2014 school year as Progress Reports were not issued that year.
ES/MS students scoring at or above Level 3 on NYS assessments, compared to CSD, NYC and State averages
% Proficient in English Language Arts
2010-2011
2011-2012
2012-2013
2013-2014
Manhattan Charter School 67.2% 67.5% 28.4% 25.6%
CSD 1 53.7% 53.7% 33.2% 36.4%
Difference from CSD 1 * 13.5 13.8 -4.8 -10.8
NYC 49.4% 51.2% 28.0% 29.8%
Difference from NYC * 17.8 16.3 0.4 -4.2
New York State ** 52.8% 55.1% 31.1% 30.6%
Difference from New York State 14.4 12.4 -2.7 -5.0

% Proficient in Mathematics
2010-2011
2011-2012
2012-2013
2013-2014
Manhattan Charter School 78.2% 79.4% 35.9% 57.5%
CSD 1 63.8% 65.0% 38.7% 45.8%
Difference from CSD 1 * 14.4 14.4 -2.8 11.7
NYC 60.0% 62.6% 32.7% 39.1%
Difference from NYC * 18.2 16.8 3.2 18.4
New York State ** 63.3% 64.8% 31.1% 36.2%
Difference from New York State 14.9 14.6 4.8 21.3
* All comparisons to either the CSD or NYC take into account only grades the school itself served. CSD comparisons are particular to the CSD in which the school was sited each year. ** New York State proficiency rates were taken from data.nysed.gov.
Student improvement on the state tests compared to other students
Median Adjusted Growth Percentile - English Language Arts
2010-2011
2011-2012
2012-2013
2013-2014
Manhattan Charter School - All Students 66.5% 52.0% 53.5% 54.5%
Peer Percent of Range - All Students 57.9% 25.9% 32.3% 26.1%
City Percent of Range- All Students 43.2% 19.7% 18.5% 21.4%
Manhattan Charter School – School's Lowest Third
71.0% 58.0% 54.0% 71.0%
Peer Percent of Range - School's Lowest Third 57.2% 20.8% 8.5% 41.6%
City Percent of Range - School's Lowest Third 41.7% 16.9% 0.0% 40.9%

Median Adjusted Growth Percentile - Mathematics
2010-2011
2011-2012
2012-2013
2013-2014
Manhattan Charter School - All Students 71.0% 46.0% 51.0% 80.0%
Peer Percent of Range - All Students 67.8% 19.1% 25.1% 93.2%
City Percent of Range- All Students 58.4% 19.4% 22.4% 90.8%
Manhattan Charter School – School's Lowest Third
67.0% 40.0% 52.0% 80.5%
Peer Percent of Range - School's Lowest Third 55.0% 0.0% 0.0% 70.0%
City Percent of Range - School's Lowest Third 45.7% 0.0% 0.0% 72.7%
A comparison range consists of all possible results within two standard deviations of the average. A peer/city percent of range of 50% represents the position of the average and can be interpreted as a school outperforming 50% of their peer group/city.
Closing the Achievement Gap
Percent in the 75th Growth Percentile - English Language Arts
2010-2011
2011-2012
2012-2013
2013-2014
Students with Disabilities * - 57.1% 25.0% 54.5%
English Language Learner Students - - - -
Students in the Lowest Third Citywide - 40.0% 23.1% 42.1%
Percent in the 75th Growth Percentile - Mathematics
2010-2011
2011-2012
2012-2013
2013-2014
Students with Disabilities * - 28.6% 25.0% 81.8%
English Language Learner Students - - - -
Students in the Lowest Third Citywide - 28.6% 28.6% 73.7%
* Defined as students with a placement in Self-Contained, ICT, or SETSS.

II. Renewal Recommendation and Rationale
A. Academic Performance At the time of this school’s renewal, Manhattan Charter School (MCS) has partially demonstrated academic success.
New York Charter Schools Act The New York Charter Schools Act of 1998 establishes a system of charter schools throughout New York State, with objectives that include: § 2850 (2) (a) Improve student learning and achievement; (b) Increase learning opportunities for all students, with special emphasis on expanded learning experiences for students who are at-risk of academic failure; (c) Encourage the use of different and innovative teaching methods; (d) Create new professional opportunities for teachers, school administrators and other school personnel; (e) Provide parents and students with expanded choices in the types of educational opportunities that are available within the public school system; and (f) Provide schools with a method to change from rule-based to performance-based accountability systems by holding the schools established under this article accountable for meeting measurable student achievement results. Data available for MCS indicates that the school has made progress towards meeting most of these objectives. Mission and Vision Manhattan Charter School’s mission is “to teach our students how to learn and love doing it, how to cultivate their curious minds for the rest of their lives, and how to develop a solid foundation on which to base wise choices and build meaningful futures.” The school executes against this mission by offering a dual focus of a rigorous, standards-based core subject education, and an education in the arts, including daily music. The foreign language, music, and arts instruction helps students to build communication and collaboration skills, as well as self-discipline and develop the ability to take risks. School Specific Academic Performance The school entered its tenth year of operation with the 2014-2015 academic year. The New York City Department of Education (NYC DOE) has four years of New York State (NYS) assessment data and four years of other academic indicator(s) to evaluate the academic achievement and progress of the students at Manhattan Charter School over the retrospective charter term. Annual aggregate English Language Arts (ELA) and math proficiency rates for Manhattan Charter School exceeded those of Community School District (CSD) 1, New York City, and New York State during the first two years of the current charter term. However, in the last two years of the retrospective charter term, the school’s proficiency rates were mixed compared with the rates for CSD 1, New York City, and New York State - most notably, the school underperformed the CSD and NYS in ELA in both 2012-2013 and 2013-2014.
1 While the school’s math proficiency rate was
below that of CSD 1 in 2012-2013, the school achieved a high level of growth in math following the 2012-2013 test examination and achieved a higher proficiency rate in math than the comparable CSD 1 rate the following year, in 2013-2014.
1 Manhattan Charter School’s ELA proficiency rate fell below the New York City proficiency rate for the same grade span in 2013-
2014 and fell below the New York State ELA proficiency rate in both school years 2012-2013 and 2013-2014. However, the school’s math proficiency rate exceeded that of both New York City and New York State in 2012-2013 and 2013-2014.
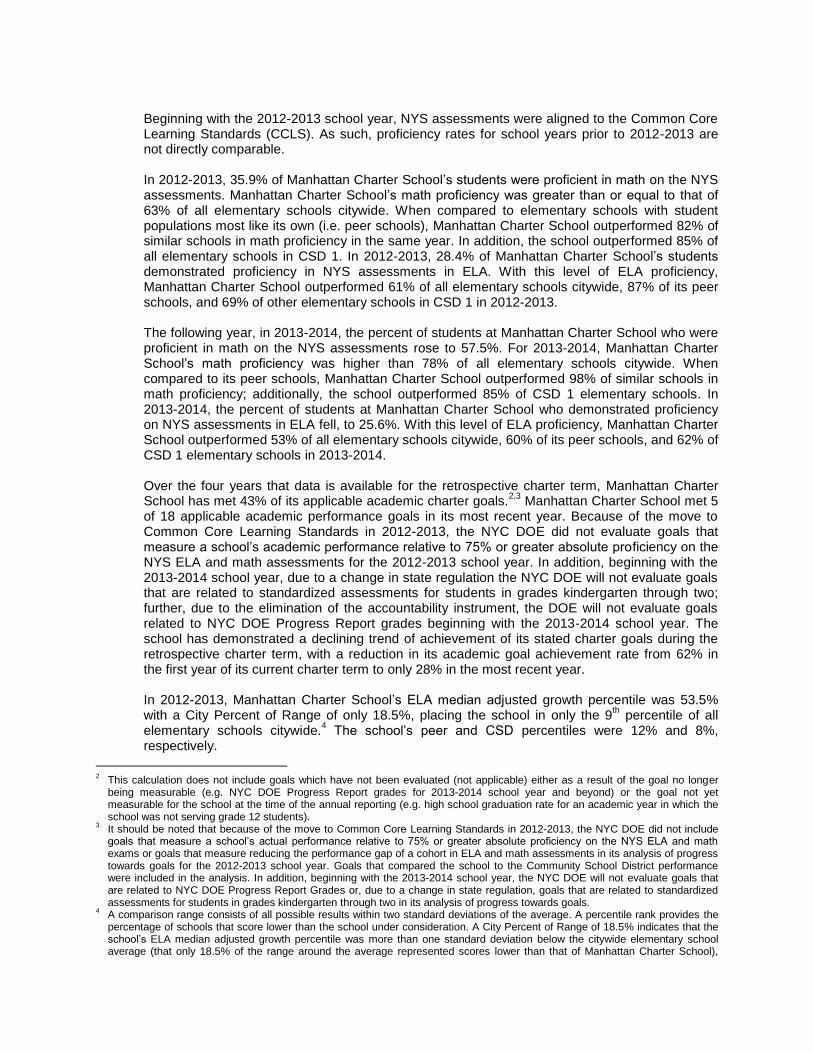
Beginning with the 2012-2013 school year, NYS assessments were aligned to the Common Core Learning Standards (CCLS). As such, proficiency rates for school years prior to 2012-2013 are not directly comparable. In 2012-2013, 35.9% of Manhattan Charter School’s students were proficient in math on the NYS assessments. Manhattan Charter School’s math proficiency was greater than or equal to that of 63% of all elementary schools citywide. When compared to elementary schools with student populations most like its own (i.e. peer schools), Manhattan Charter School outperformed 82% of similar schools in math proficiency in the same year. In addition, the school outperformed 85% of all elementary schools in CSD 1. In 2012-2013, 28.4% of Manhattan Charter School’s students demonstrated proficiency in NYS assessments in ELA. With this level of ELA proficiency, Manhattan Charter School outperformed 61% of all elementary schools citywide, 87% of its peer schools, and 69% of other elementary schools in CSD 1 in 2012-2013. The following year, in 2013-2014, the percent of students at Manhattan Charter School who were proficient in math on the NYS assessments rose to 57.5%. For 2013-2014, Manhattan Charter School’s math proficiency was higher than 78% of all elementary schools citywide. When compared to its peer schools, Manhattan Charter School outperformed 98% of similar schools in math proficiency; additionally, the school outperformed 85% of CSD 1 elementary schools. In 2013-2014, the percent of students at Manhattan Charter School who demonstrated proficiency on NYS assessments in ELA fell, to 25.6%. With this level of ELA proficiency, Manhattan Charter School outperformed 53% of all elementary schools citywide, 60% of its peer schools, and 62% of CSD 1 elementary schools in 2013-2014. Over the four years that data is available for the retrospective charter term, Manhattan Charter School has met 43% of its applicable academic charter goals.
2,3 Manhattan Charter School met 5
of 18 applicable academic performance goals in its most recent year. Because of the move to Common Core Learning Standards in 2012-2013, the NYC DOE did not evaluate goals that measure a school’s academic performance relative to 75% or greater absolute proficiency on the NYS ELA and math assessments for the 2012-2013 school year. In addition, beginning with the 2013-2014 school year, due to a change in state regulation the NYC DOE will not evaluate goals that are related to standardized assessments for students in grades kindergarten through two; further, due to the elimination of the accountability instrument, the DOE will not evaluate goals related to NYC DOE Progress Report grades beginning with the 2013-2014 school year. The school has demonstrated a declining trend of achievement of its stated charter goals during the retrospective charter term, with a reduction in its academic goal achievement rate from 62% in the first year of its current charter term to only 28% in the most recent year. In 2012-2013, Manhattan Charter School’s ELA median adjusted growth percentile was 53.5% with a City Percent of Range of only 18.5%, placing the school in only the 9
th percentile of all
elementary schools citywide.4 The school’s peer and CSD percentiles were 12% and 8%,
respectively.
2 This calculation does not include goals which have not been evaluated (not applicable) either as a result of the goal no longer
being measurable (e.g. NYC DOE Progress Report grades for 2013-2014 school year and beyond) or the goal not yet measurable for the school at the time of the annual reporting (e.g. high school graduation rate for an academic year in which the school was not serving grade 12 students).
3 It should be noted that because of the move to Common Core Learning Standards in 2012-2013, the NYC DOE did not include
goals that measure a school’s actual performance relative to 75% or greater absolute proficiency on the NYS ELA and math exams or goals that measure reducing the performance gap of a cohort in ELA and math assessments in its analysis of progress towards goals for the 2012-2013 school year. Goals that compared the school to the Community School District performance were included in the analysis. In addition, beginning with the 2013-2014 school year, the NYC DOE will not evaluate goals that are related to NYC DOE Progress Report Grades or, due to a change in state regulation, goals that are related to standardized assessments for students in grades kindergarten through two in its analysis of progress towards goals.
4 A comparison range consists of all possible results within two standard deviations of the average. A percentile rank provides the
percentage of schools that score lower than the school under consideration. A City Percent of Range of 18.5% indicates that the school’s ELA median adjusted growth percentile was more than one standard deviation below the citywide elementary school average (that only 18.5% of the range around the average represented scores lower than that of Manhattan Charter School),

In 2012-2013, Manhattan Charter School’s math median adjusted growth percentile was 51.0% with a City Percent of Range of 22.4%, which placed it in only the 13
th percentile of all elementary
schools citywide. Similarly, the school’s peer and CSD percentiles were 3% and 0%, respectively. The following year, in 2013-2014, Manhattan Charter School’s median adjusted growth percentile increased in both ELA and math. In 2013-2014, Manhattan Charter School’s ELA median adjusted growth percentile was 54.5% with a City Percent of Range of 21.4%, placing the school in the 12
th percentile of all elementary schools citywide. The school’s peer and CSD percentiles
also rose slightly to 13% and 23%, respectively. However, these percentile rankings mean that more than 75% of other elementary schools in Manhattan Charter School’s peer group, in CSD 1, and across New York City had ELA median adjusted growth percentiles greater than Manhattan Charter School’s ELA median adjusted growth percentile in 2013-2014. Alternatively, in 2013-2014, Manhattan Charter School’s math median adjusted growth percentile was 80.0% with a City Percent of Range of 90.8%, placing the school in the top 95% of all elementary schools citywide.
5 The school’s peer and CSD percentiles also rose to 98% and 85%,
respectively. This means that fewer than 5% of other elementary schools across the city and in Manhattan Charter School’s peer group had math median adjusted growth percentiles greater than Manhattan Charter School’s math median adjusted growth percentile in 2013-2014. Although no annual school visit was conducted by the NYC DOE during the school’s current charter term, in the school’s Annual Comprehensive Review (ACR) for 2012-2013, it was noted that the school had demonstrated a responsive education program by identifying the students in the lowest third of their cohort in both ELA and math (as identified in the NYC DOE Progress Report) and had them partake in small group and individual tutoring by coaches and literacy specialists.
6 In 2013-2014, continuing its focus on providing targeted instruction to individual
students who may be struggling with certain skills, the school reported its development of Academic Intervention Services.
7 In both the 2012-2013 and 2013-2014 ACR Reports for
Manhattan Charter School, the school’s efforts around extended learning time, with an extended year program for kindergarten students getting an additional six weeks in the summer prior to the first day of school, and a longer school day for third through fifth grades to support differentiated, small group work and provide more time for math instruction were noted.
8,9 The school also
showed a shift to a stronger data-driven culture in the 2013-2014 school year, by implementing a Student Dashboard that reported “each student’s interim and summative ELA and math assessment results for all available years, since the student was enrolled at MCS,” along with implementing Achievement Network (ANet) ELA and math assessments and BMAS reading level assessments.
10
On its 2012-2013 NYC DOE Progress Report, Manhattan Charter School received an overall grade of C with a grade of F for Student Progress, a grade of A for Student Performance, and a grade of B for School Environment. This ranked Manhattan Charter School in the 13
th percentile
of all elementary schools citywide and represented a deterioration in performance from the prior year. For the 2011-2012 NYC DOE Progress Report, the school earned an overall grade of B, as well as a B grade for School Environment, an A grade for Student Performance, and a C grade for Student Progress, placing the school in the 51
st percentile of all elementary schools citywide.
In school year 2010-2011 the school earned an overall grade of A.
while a citywide percentile of 9% indicates that Manhattan Charter School’s ELA median adjusted growth percentile was higher than only 9% of all elementary schools citywide.
5 A City Percent of Range of 90.8% indicates that the school’s math median adjusted growth percentile was greater than one
standard deviation above the average. A citywide percentile of 95% indicates that Manhattan Charter School’s math median adjusted growth percentile was higher than 95% of all elementary schools citywide.
6 Manhattan Charter School Annual Comprehensive Review Report 2012-2013
7 Manhattan Charter School Annual Comprehensive Review Report 2013-2014
8 Manhattan Charter School Annual Comprehensive Review Report 2012-2013
9 Manhattan Charter School Annual Comprehensive Review Report 2013-2014
10 Manhattan Charter School Annual Comprehensive Review Report 2013-2014
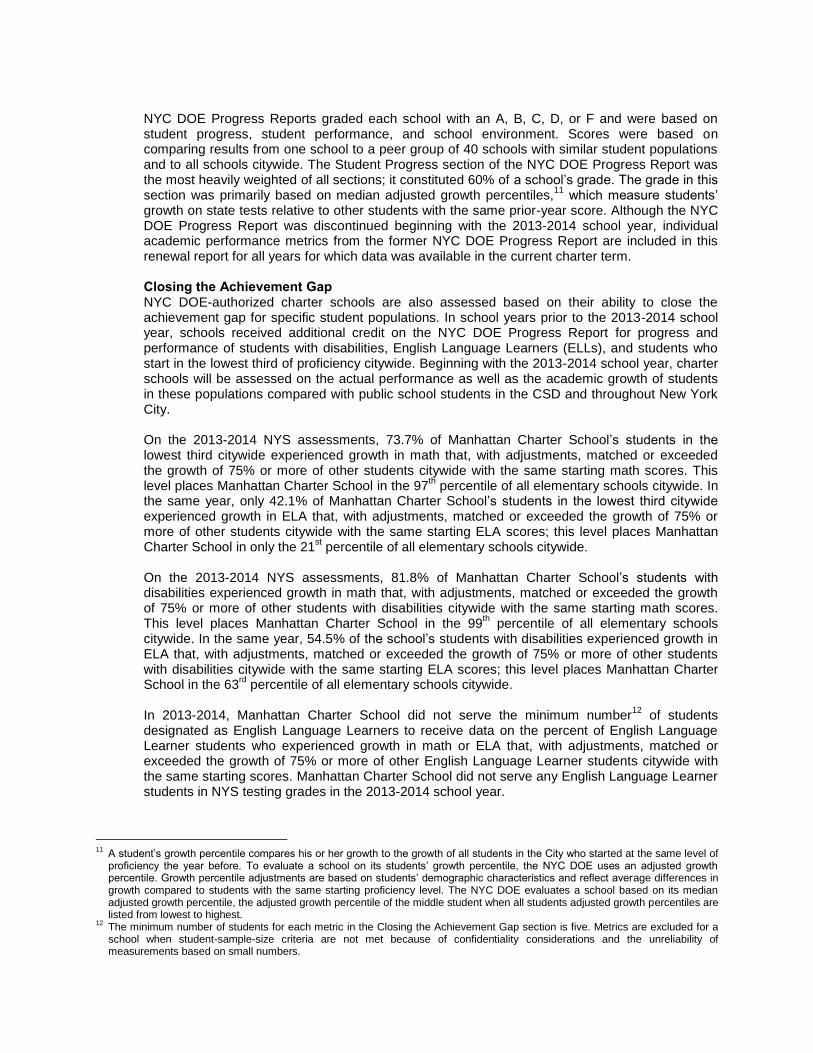
NYC DOE Progress Reports graded each school with an A, B, C, D, or F and were based on student progress, student performance, and school environment. Scores were based on comparing results from one school to a peer group of 40 schools with similar student populations and to all schools citywide. The Student Progress section of the NYC DOE Progress Report was the most heavily weighted of all sections; it constituted 60% of a school’s grade. The grade in this section was primarily based on median adjusted growth percentiles,
11 which measure students’
growth on state tests relative to other students with the same prior-year score. Although the NYC DOE Progress Report was discontinued beginning with the 2013-2014 school year, individual academic performance metrics from the former NYC DOE Progress Report are included in this renewal report for all years for which data was available in the current charter term. Closing the Achievement Gap NYC DOE-authorized charter schools are also assessed based on their ability to close the achievement gap for specific student populations. In school years prior to the 2013-2014 school year, schools received additional credit on the NYC DOE Progress Report for progress and performance of students with disabilities, English Language Learners (ELLs), and students who start in the lowest third of proficiency citywide. Beginning with the 2013-2014 school year, charter schools will be assessed on the actual performance as well as the academic growth of students in these populations compared with public school students in the CSD and throughout New York City. On the 2013-2014 NYS assessments, 73.7% of Manhattan Charter School’s students in the lowest third citywide experienced growth in math that, with adjustments, matched or exceeded the growth of 75% or more of other students citywide with the same starting math scores. This level places Manhattan Charter School in the 97
th percentile of all elementary schools citywide. In
the same year, only 42.1% of Manhattan Charter School’s students in the lowest third citywide experienced growth in ELA that, with adjustments, matched or exceeded the growth of 75% or more of other students citywide with the same starting ELA scores; this level places Manhattan Charter School in only the 21
st percentile of all elementary schools citywide.
On the 2013-2014 NYS assessments, 81.8% of Manhattan Charter School’s students with disabilities experienced growth in math that, with adjustments, matched or exceeded the growth of 75% or more of other students with disabilities citywide with the same starting math scores. This level places Manhattan Charter School in the 99
th percentile of all elementary schools
citywide. In the same year, 54.5% of the school’s students with disabilities experienced growth in ELA that, with adjustments, matched or exceeded the growth of 75% or more of other students with disabilities citywide with the same starting ELA scores; this level places Manhattan Charter School in the 63
rd percentile of all elementary schools citywide.
In 2013-2014, Manhattan Charter School did not serve the minimum number
12 of students
designated as English Language Learners to receive data on the percent of English Language Learner students who experienced growth in math or ELA that, with adjustments, matched or exceeded the growth of 75% or more of other English Language Learner students citywide with the same starting scores. Manhattan Charter School did not serve any English Language Learner students in NYS testing grades in the 2013-2014 school year.
11
A student’s growth percentile compares his or her growth to the growth of all students in the City who started at the same level of proficiency the year before. To evaluate a school on its students’ growth percentile, the NYC DOE uses an adjusted growth percentile. Growth percentile adjustments are based on students’ demographic characteristics and reflect average differences in growth compared to students with the same starting proficiency level. The NYC DOE evaluates a school based on its median adjusted growth percentile, the adjusted growth percentile of the middle student when all students adjusted growth percentiles are listed from lowest to highest.
12 The minimum number of students for each metric in the Closing the Achievement Gap section is five. Metrics are excluded for a school when student-sample-size criteria are not met because of confidentiality considerations and the unreliability of measurements based on small numbers.

B. Governance, Operations & Finances Manhattan Charter School is an operationally sound and fiscally viable organization. This assessment was made based on a review of the following indicators of operational and fiscal viability:
Manhattan Charter School’s Board of Trustee bylaws;
Manhattan Charter School’s Board of Trustee meeting minutes;
Manhattan Charter School’s self-reported staffing data;
Manhattan Charter School’s financial disclosure forms;
Manhattan Charter School’s FY11, FY12, FY13, and FY14 independent financial audits;
Manhattan Charter School’s 2014-2015 staff handbook;
Manhattan Charter School’s 2014-2015 student and family handbook; and
Manhattan Charter School’s FY15 budget. Over the course of the school’s charter term, the Board of Trustees has maintained a developed governance structure and organizational design. The school’s current Board Chair, Manuel Romero, took over in May 2014. The previous Chair, Paul O’Neill, who remains an active member, has served on the Board since 2006. One other member has remained on the Board since the prior charter term. All other current members joined over the course of the current charter term, with three specifically joining in 2014. The current level of membership is consistent with the minimum of five and maximum of 13 members, established in the Board’s bylaws. There are clear lines of accountability between the Board and school leadership as evidenced by the school’s organizational chart and school leadership team’s monthly reports to the Board, as recorded in Board meeting minutes. The bylaws indicate that the Board shall have a President, Vice President, Secretary, Treasurer, and such other Officers, as elected. Current positions that are filled include a Chair, Vice Chair, Secretary, and Treasurer. According to the Board’s roster, active committees include Executive, Education, and Finance. Additionally, the roster indicates that there is a Facilities Committee and a Nominating Committee. Over the course of the school’s charter term, the school has developed a stable school culture. Genie DePolo has served as the Principal of the school since July 2007, and also took on the role of Chief Academic Officer when MCS replicated to have a second school - Manhattan Charter School II (MCS II), which opened in August 2012. Over the course of the current charter term, operational leadership shifted with the departure of the Chief Operations Officer in October 2013. The operations work was then divided between a Director of Finance and Human Resources and an Operations Manager role. The operations personnel changed again prior to the start of the 2014-2015 school year, with the lead operations role being a Director of Operations, staffed by Kashani Stokley. In addition, in 2013, the Board of Trustees voted to return to an organizational structure that included an Executive Director, who oversees both the operations and academics of Manhattan Charter School and MCS II. Sonia Park joined as the Executive Director in February 2014. Staff turnover has been moderate during the current charter term, ranging between a high of 32% in 2010-2011 to a low of 26% in 2013-2014. The school offers an enriched arts curriculum, which includes music, art, health and physical education, as well as French. The enrichment teachers incorporate academic vocabulary into their lessons, along with opportunities for students to think and speak critically about the enrichment content in relation to and parallel with the CCLS.
Average daily attendance for students during the retrospective charter term (2010-2011) through 2013-2014) was 93.1%;
13 the school did not meet its attendance goal of 95% in all years of the
current charter term. Across the charter term, the school has achieved average results on the NYC school survey compared to the citywide averages, with higher rates of teacher and parent satisfaction noted in the most recent year.
13
Reflects attendance data taken from the NYC DOE’s Automate the Schools (ATS) system

Overall, the school is in a strong position to meet near-term financial obligations. The school has at least $1,899,553 of unrestricted cash on hand to meet current liabilities totaling $645,773. Cash on hand represents 183 days of operating expenses. Overall, however, there are some concerns about the financial sustainability of the school based on its current practices. There was no material weakness noted in the four independent financial audits from FY11 to FY14.
C. Compliance with Charter, Applicable Law and Regulations Over the charter term, Manhattan Charter School has been compliant with some applicable laws and regulations but not others. Over the charter term, the Board has consistently had a membership size that falls within the range outlined in the school’s charter and in the Board’s bylaws, a minimum of five and maximum of 13 members. For the entirety of the current charter term, the Board’s bylaws indicated that the Board shall be subject to requirements of the New York State Open Meetings Law, as applicable and as amended from time to time. In school year 2011-2012, the Board held six meetings, all of which met quorum. In school year 2012-2013, the Board held seven meetings, six of which met quorum. In school year 2013-2014, the Board held eight meetings, six of which met quorum. No minutes were available for review for the 2010-2011 school year. The current Charter Schools Act requires that the Board hold monthly meetings over a period of 12 calendar months, per year. The Board bylaws comply with this law. Three out of the nine Board members, who served on the Board 2013-2014, did not submit the conflict of interest and financial disclosure forms in the 2013-2014 New York State Education Department (NYSED) Annual Report. The Board consistently submitted the Annual Report to the NYSED by the deadline of August 1 (or by the NYSED granted extension date) for each year of the current charter term. However, the NYS Charter Schools Act requires schools to post to the website the annual audit for each year of the charter term; Manhattan Charter School has only posted its annual audit for three years, FY 12, FY13, and FY14. The Board has inconsistently made board minutes and agendas available to the public. Agendas are available at meetings for review; however, minutes are not publically available following a meeting. As of the March 2015 review, the only minutes available for review were those submitted directly to the NYC DOE by the school which are not readily available to the public. The school has submitted appropriate insurance documents to the NYC DOE. The school has provided the NYC DOE with a current and complete copy of its Student Discipline Policy that is in use for the 2014-2015 academic year. This policy was determined to be compliant with federal law.
D. Plans for Next Charter Term
The school does not plan to increase its maximum authorized enrollment, and has decided to delay its plan to expand into middle school grades. The school plans on merging with its replicated school, Manhattan Charter School II. The school recognizes that it is falling below its ELL population targets, and has made efforts such as targeted outreach in media outlets such as El Diario and World Journal, recruitment at

community Head Start programs, and an increased lottery preference set-aside for applicants who indicate that they primarily speak a language other than English at home.

Renewal Report Manhattan Charter School | 1
Regents Addendum This Regents Addendum has been prepared at the request of the Board of Regents. The information presented in this addendum regarding Mobility and Enrollment of Special Populations is not factored into the DOE’s renewal recommendation. Complete data regarding Mobility and Enrollment of Special Populations is presented in Part 4 of the Renewal Recommendation Report which is available on the DOE website. Mobility
Student Mobility out of Manhattan Charter School *
2010-2011 2011-2012 2012-2013 2013-2014
Number of Students who Left the School1 20 26 8 30
Percent of Students who Left the School2 8.6% 11.3% 3.6% 12.7%
* Figures are based on student enrollment as of October 31 for each respective school year with the exception of the 2012-2013 school year, which is as of October 26, 2012. Students in terminal grades are not included.
Enrollment of Special Populations3
Special Population 2010-2011
2011-2012
2012-2013
2013-2014
2013-2014 State
Enrollment Target
(Current)
Free and Reduced
Price Lunch (FRPL)
Manhattan Charter School 78.8% 83.7% 84.2% 81.8%
72.2% CSD 1 76.0% 74.8% 70.2% 70.0%
NYC 81.8% 84.1% 83.0% 82.5%
Students with
Disabilities (SWD)
Manhattan Charter School 14.4% 14.1% 13.5% 18.2%
17.0% CSD 1 19.8% 20.2% 22.2% 25.2%
NYC 17.4% 17.3% 17.9% 19.7%
English Language Learners
(ELL)
Manhattan Charter School 0.0% 0.0% 1.2% 1.8%
10.0% CSD 1 10.8% 10.6% 10.2% 9.2%
NYC 17.6% 17.0% 16.6% 16.0%
1 The Number of Students who Left the School for a given school year is the total number of students who were enrolled in the
school on October 31 in the given school year that were not enrolled in the school on October 31 of the following school year. The figure includes students who left the school for any reason (i.e. all discharge and transfer codes are included); the only exception made to this rule was for students in terminal, non-phase-in grades.
2 The Percent of Students who Left the School for a given school year is the percentage of students who were enrolled in the
school on October 31 in the given school year that were not enrolled in the school on October 31 of the following school year. The percentage figure includes students who left the school for any reason (i.e. all discharge and transfer codes are included); the only exception made to this rule was for students in terminal, non-phase-in grades.
3 Comparisons of a charter school’s special populations to the CSD and City are made relative only to the grades served by the
school. For example, if a charter school serves grades kindergarten through five, comparisons of that school’s special populations will only be made relative to grades kindergarten through five in the CSD and citywide. CSD comparisons are particular to the grades served in each CSD each year. Enrollment rates reflect demographic characteristics as of June 1 and enrollment as of October 31 for each given school year, with the exception of enrollment in the 2012-2013 school year, which is as of October 26, 2012. State enrollment targets were generated by a calculator developed by the NYSED. Once a school's CSD, total enrollment and grade span are entered, the calculator generates a school-specific enrollment target. The CSD for a multi-district school is the primary CSD as determined by each school. The enrollment is determined by the total number of students enrolled as of October 31, 2013. Any school with an unusual grade configuration (i.e. K, 6-9) should use an available grade configuration provided by SED that is most aligned as determined by the DOE, otherwise a school's actual grade span is used. For more information regarding SED’s methodology behind the calculation of charter school enrollment and retention targets, please refer to the memo at http://www.regents.nysed.gov/meetings/2012Meetings/July2012/712brca11.pdf.
Part 1: Summary of Renewal Recommendation
I. Charter School Overview:
Background Information
Mott Haven Academy Charter School
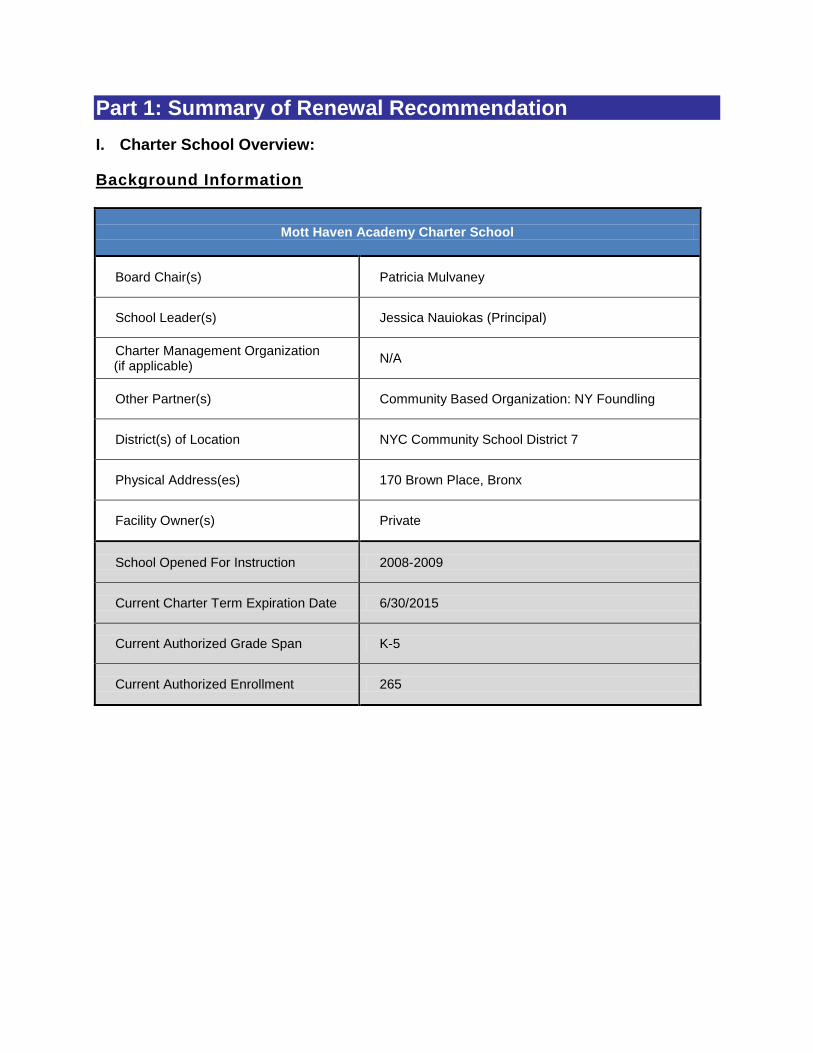
Board Chair(s) Patricia Mulvaney
School Leader(s) Jessica Nauiokas (Principal)
Charter Management Organization (if applicable)
N/A
Other Partner(s) Community Based Organization: NY Foundling
District(s) of Location NYC Community School District 7
Physical Address(es) 170 Brown Place, Bronx
Facility Owner(s) Private
School Opened For Instruction 2008-2009
Current Charter Term Expiration Date 6/30/2015
Current Authorized Grade Span K-5
Current Authorized Enrollment 265

Overview of School-Specific Data
School Evaluation of Academic Goals as stated in Annual Report to NYSED and Renewal Application to NYC DOE
Academic Goal Analysis
2013-2014 Cumulative Charter
Term Total
Total Achievable Goals 13 13
# Met 5 5
# Partially Met 1 1
# Not Met 5 5
# Not Applicable * 2 2
% Met 38% 38%
% Partially Met 8% 8%
% Not Met 38% 38%
% Not Applicable * 15% 15%
% Met of All Applicable Goals 45% 45%
* Some goals may not be applicable in all years. For example, goals related to the NYC Progress Report are not applicable for the 2013-2014 school year as Progress Reports were not issued that year.
ES/MS students scoring at or above Level 3 on NYS assessments, compared to CSD, NYC and State averages
% Proficient in English Language Arts
2013-2014
Mott Haven Academy Charter School 23.4%
CSD 7 9.7%
Difference from CSD 7 * 13.7
NYC 28.7%
Difference from NYC * -5.3
New York State ** 30.6%
Difference from New York State -7.2

% Proficient in Mathematics
2013-2014
Mott Haven Academy Charter School 49.6%
CSD 7 14.6%
Difference from CSD 7 * 35.0
NYC 37.8%
Difference from NYC * 11.8
New York State ** 36.2%
Difference from New York State 13.4
* All comparisons to either the CSD or NYC take into account only grades the school itself served. CSD comparisons are particular to the CSD in which the school was sited each year.
** New York State proficiency rates were taken from data.nysed.gov.
Student improvement on the state tests compared to other students
Median Adjusted Growth Percentile - English Language Arts
2013-2014
Mott Haven Academy Charter School - All Students 54.0%
Peer Percent of Range - All Students 21.2%
City Percent of Range- All Students 19.9%
Mott Haven Academy Charter School - School's Lowest Third 63.0%
Peer Percent of Range - School's Lowest Third 1.3%
City Percent of Range - School's Lowest Third 17.5%
Median Adjusted Growth Percentile - Mathematics
2013-2014
Mott Haven Academy Charter School - All Students 77.0%
Peer Percent of Range - All Students 86.7%
City Percent of Range- All Students 84.2%
Mott Haven Academy Charter School - School's Lowest Third 78.0%
Peer Percent of Range - School's Lowest Third 58.1%
City Percent of Range - School's Lowest Third 66.3%
A comparison range consists of all possible results within two standard deviations of the average. A peer/city percent of

range of 50% represents the position of the average and can be interpreted as a school outperforming 50% of their peer group/city.
Closing the Achievement Gap
Percent in the 75th Growth Percentile - English Language Arts
2013-2014
Students with Disabilities * 18.2%
English Language Learner Students 11.1%
Students in the Lowest Third Citywide 10.0%
Percent in the 75th Growth Percentile - Mathematics
2013-2014
Students with Disabilities * 58.3%
English Language Learner Students 77.8%
Students in the Lowest Third Citywide 60.0%
* Defined as students with a placement in Self-Contained, ICT, or SETSS.
II. Renewal Recommendation and Rationale
As part of the school’s 2012-2013 charter renewal, the following conditions were placed on the school as requirements for future renewal:
Academic Conditions: 1 of 1 applicable conditions met

Achievement of Renewal Conditions
Academic Conditions 2013-2014
1. The school must score C or better in each of the years of the new charter on the Overall Progress Report grade, Student Progress and Student Performance grades on the NYC DOE Progress Report.
N/A
2. The school must meet school-wide and cohort proficiency goals as outlined in the accountability plan as of April 22, 2013.
Met
• The school will achieve a C or greater on the Overall and Progress sections of the NYC DOE Progress Report in all years of the charter term.
N/A
• In at least one of the two years of the charter term, the school will achieve a B or greater on the Environment Section of the NYC DOE Progress Report.
N/A
•
Each year the percent of students proficient on the New York State assessments of the school’s general community/non-child welfare involved students, who are enrolled in at least their second year at the school, will be greater than that of all students in the same tested grades in the district of location.
Met
•
Each year the percent of the school’s child welfare involved students, who are enrolled in at least their second year at the school, will reduce by one-half the gap in overall proficiency in the same tested grades compared to students in the school’s district of location until they equal or exceed proficiency of students in the district of location.
Met
• Each year 75% of students enrolled for three or more full years of instruction will perform at or above a level 3 on the New York State ELA exam.
Not Met
• Each year 75% of students enrolled for three or more full years of instruction will perform at or above a level 3 on the New York State math exam.
Not Met
• Each year 75% of students enrolled for three or more full years of instruction will perform at or above a level 3 on the New York State science exam.
Met
• Each year 85% of students enrolled for three or more years of instruction will perform at or above level 2 on the New York State ELA exam.
Not Met
• Each year 85% of students enrolled for three or more years of instruction will perform at or above level 2 on the New York State math exam.
Met
3. If the above goals are met during the term, the school can apply to move forward with middle school expansion.
N/A
A. Academic Performance
At the time of this school’s renewal, Mott Haven Academy Charter School has demonstrated academic success.
New York Charter Schools Act The New York Charter Schools Act of 1998 establishes a system of charter schools throughout New York State, with objectives that include: § 2850 (2) (a) Improve student learning and achievement; (b) Increase learning opportunities for all students, with special emphasis on expanded learning experiences for students who are at-risk of academic failure; (c) Encourage the use of different and innovative teaching methods; (d) Create new professional opportunities for teachers, school administrators and other school personnel;
(e) Provide parents and students with expanded choices in the types of educational opportunities that are available within the public school system; and (f) Provide schools with a method to change from rule-based to performance-based accountability systems by holding the schools established under this article accountable for meeting measurable student achievement results. Data available for Mott Haven Academy Charter School indicates that the school has made progress towards meeting most of these objectives. Mission and Vision Mott Haven Academy Charter School’s (Haven Academy) mission is to empower “children in an educational environment that addresses and reduces the barriers to academic success through the integration of family support services with a rigorous, college-preparatory academic program. [Haven Academy’s] graduates will be resilient, resourceful, independent scholars who have the skills necessary to reach their full potential and to build a better future.” Mott Haven Academy Charter School was founded in partnership with The New York Foundling to fill a gap left by traditional public schools – responding to the specific needs of child-welfare involved youth. Haven Academy serves a unique student population with one-third of its students in foster care, one-third at risk of being placed in foster care, and one-third from the general community. In 2013-2014, 21% of students enrolled at Haven Academy were identified as residing in temporary housing;
1 the citywide average in the same year was 9%. By design and in
consideration of its distinctive student population, students arrive at Haven Academy with a greater number and more challenging deficits than children in the general population. The school design strives to overcome the realities for Haven Academy students, who like other foster children in the United States, are at greater risk for poor attendance rates, are less likely to perform at grade level, are more likely to have behavioral and discipline problems, and have traditionally been more likely to be assigned to special education classes. To meet the needs of its students, the school offers a rigorous academic program with a fully integrated system of social and family support services. The school’s education program includes two teachers in every classroom, a class schedule that allows for small group instruction, and a school-wide positive behavioral support system. School-Specific Academic Performance The school entered its seventh year of operation with the 2014-2015 academic year. The school was last renewed in April 2013 with the current renewal charter term of two years beginning on July 1, 2013. As a result, the New York City Department of Education (NYC DOE) has one year of New York State (NYS) assessment data and one year of other academic data, such as data obtained through internal assessments and attendance information, to evaluate the academic achievement and progress of the students at Mott Haven Academy Charter School over the retrospective charter term. Mott Haven Academy Charter School’s aggregate English Language Arts (ELA) and math proficiency rates exceeded those of Community School District (CSD) 7 for the one-year charter term under review as well as demonstrated significant growth in absolute aggregate proficiency in both ELA and math from the prior academic year. However, while the school’s aggregate math proficiency rate also exceeded the citywide proficiency rate, the school’s ELA proficiency was below that of the comparable New York City (NYC) proficiency rate. For NYS assessments administered beginning with the 2012-2013 school year, NYS exams were aligned to the Common Core Learning Standards (CCLS). As such, proficiency rates for school years prior to 2012-2013 are not directly comparable. However, as this school’s current charter term covers only the 2013-2014 school year and the current 2014-2015 school year, all proficiency results provided in this renewal report are aligned to the CCLS.
1 ATS data as of October 31, 2014
In 2013-2014, 49.6% of Mott Haven Academy Charter School’s students were proficient in math on the NYS assessments. This level of proficiency represents an increase of 28.5 percentage points over the prior year. For 2013-2014, Mott Haven Academy Charter School’s math proficiency on the NYS assessments was greater than 70% of all elementary schools citywide. In addition, when compared to elementary schools with student populations most like its own (i.e. peer schools) Mott Haven Academy Charter School outperformed 100% of its peer schools. The school also outperformed 90% of CSD 7 elementary schools. In 2013-2014, 23.4% of Mott Haven Academy Charter School’s students demonstrated proficiency on state assessments in ELA. Although this level of proficiency represented an increase of 10.4 percentage points from the prior year, Mott Haven Academy Charter School outperformed only 49% of all elementary schools citywide. However, the school did outperform 93% of its peer schools and 80% of other elementary schools in CSD 7 when comparing aggregate ELA proficiency on the NYS assessments in 2013-2014.
Over the one year that data is available for the retrospective charter term, Mott Haven Academy Charter School has met 45% of its applicable academic charter goals.
2 Mott Haven Academy
Charter School met five of 11 applicable academic performance goals in its most recent year. Beginning with the 2013-2014 school year, due to a change in state regulation, the NYC DOE will not evaluate goals that are related to standardized assessments for students in grades kindergarten through two; further, due to the elimination of the accountability instrument, the DOE will not evaluate goals related to NYC DOE Progress Report grades beginning with the 2013-2014 school year. In 2013-2014, Mott Haven Academy Charter School’s ELA median adjusted growth percentile on the NYS assessments was 54.0% with a City Percent of Range of 19.9%, placing the school in the bottom 10% of all elementary schools citywide.
3 Similarly, the school’s peer and CSD
percentiles were each 15%. This means that 85 percent of all other elementary schools in Mott Haven Academy Charter School’s peer group and CSD 7 had ELA median adjusted growth percentiles greater than Mott Haven Academy Charter School’s ELA median adjusted growth percentile in 2013-2014. In comparison, in 2013-2014, Mott Haven Academy Charter School’s math median adjusted growth percentile on the NYS assessments was 77.0% with a City Percent of Range of 84.2%, placing the school in the 92
nd percentile of all elementary schools citywide. Similarly, the school’s
peer and CSD percentiles were 98% and 90%, respectively. This means that nearly all other elementary schools in Mott Haven Academy Charter School’s peer group and CSD 7 had math median adjusted growth percentiles less than Mott Haven Academy Charter School’s math median adjusted growth percentile in 2013-2014. Haven Academy has a developed responsive education program and supportive learning environment intentionally designed to meet the needs of all learners and fully engage at-risk students. The school’s instructionally sound and responsive educational program includes: two highly qualified teachers in each classroom, a dedicated behavioral and special education support staff, a school schedule that allows for constant small group, data-driven instruction, continuous teacher feedback, and targeted professional development. Additionally, Haven Academy’s learning environment includes a research-based social skills curriculum and a fully
2 This calculation does not include goals which have not been evaluated (not applicable) either as a result of the goal no longer
being measurable (e.g. NYC DOE Progress Report grades for the 2013-2014 school year forward) or the goal not yet measurable for the school at the time of the annual reporting (e.g. high school graduation rate for an academic year in which the school was not serving grade twelve students).
3 A comparison range consists of all possible results within two standard deviations of the average. A percentile rank provides the
percentage of schools that score the same or lower than the school under consideration. A City Percent of Range of 19.9% indicates that the school’s ELA median adjusted growth percentile was more than one standard deviation below the average (that only 19.9% of the range around the average represented scores lower than that of Mott Haven Academy Charter School), while a citywide percentile of 10% indicates that Mott Haven Academy Charter School’s ELA median adjusted growth percentile was higher than only 10% of all elementary schools citywide.
integrated system of social and family support services. Demonstrating the school’s improvements in instructional practice and academic rigor, in a report from a visit to the school during the current charter term in June 2014, NYC DOE reviewers noted that “the school began extensive unit writing to better align with the rigor of the Common Core Learning Standards…added a 30-minute math or Math Strings routine to every class…began implementing Data Action Planning days…and the school added two instructional coaches to work with the teachers on curriculum planning, lesson planning, and test prep.”
4 Additionally, the visit team
learned from school leadership during the June 2014 visit that the “school changed its hiring priorities to focus more on prospective teacher’s depth of experience” and was increasing targeted professional development for staff, including sessions that focused on Response to Intervention and visual thinking strategies.
5
Closing the Achievement Gap NYC DOE-authorized charter schools are also assessed based on their ability to close the achievement gap for specific student populations. In school years prior to the 2013-2014 school year, schools received additional credit on the NYC DOE Progress Report for progress and performance of students with disabilities, English Language Learners, and students who start in the lowest third of proficiency citywide. Beginning with the 2013-2014 school year, charter schools will be assessed on the actual performance as well as the academic growth of students in these populations compared with public school students in the CSD and throughout New York City. On the 2013-2014 NYS assessments, 60.0% of Mott Haven Academy Charter School’s students in the lowest third citywide experienced growth in math that, with adjustments, matched or exceeded the growth of 75% or more of other students citywide with the same starting math scores. This level places Mott Haven Academy Charter School in the 87
th percentile of all
elementary schools citywide. In the same year, however, only 10.0% of the school’s students in the lowest third citywide experienced growth on the NYS assessments in ELA that, with adjustments, matched or exceeded the growth of 75% or more of other students citywide with the same starting ELA scores; this level of growth places Mott Haven Academy Charter School at the zero percentile of all elementary schools citywide. On the 2013-2014 NYS assessments, 58.3% of Mott Haven Academy Charter School’s students with disabilities experienced growth in math that, with adjustments, matched or exceeded the growth of 75% or more of other students with disabilities citywide with the same starting math scores. This level places Mott Haven Academy Charter School in the 84
th percentile of all
elementary schools citywide. In the same year, however, only 18.2% of the school’s students with disabilities experienced growth on the NYS assessments in ELA that, with adjustments, matched or exceeded the growth of 75% or more of other students with disabilities citywide with the same starting ELA scores; this level of growth places Mott Haven Academy Charter School in only the 2
nd percentile of all elementary schools citywide.
On the 2013-2014 NYS assessments, 77.8% of Mott Haven Academy Charter School’s English Language Learner (ELL) students experienced growth in math that, with adjustments, matched or exceeded the growth of 75% or more of other ELL students citywide with the same starting math scores. This level places Mott Haven Academy Charter School in the 99
th percentile of all
elementary schools citywide. However, in the same year only 11.1% of ELL students experienced growth on the NYS assessments in ELA that, with adjustments, matched or exceeded the growth of 75% or more of other ELL students citywide with the same starting ELA scores; this places Mott Haven Academy Charter School in the bottom 3% of all elementary schools citywide.
4 Mott Haven Academy Charter School Annual Comprehensive Review Report 2013-2014
5 Mott Haven Academy Charter School Annual Comprehensive Review Report 2013-2014
B. Governance, Operations & Finances Mott Haven Academy Charter School is a partially operationally sound and fiscally viable organization. This assessment was made based on a review of the following indicators of operational and fiscal viability:
Mott Haven Academy Charter School’s FY14 independent financial audit;
Mott Haven Academy Charter School’s FY15 budget and five-year projected budget;
Mott Haven Academy Charter School’s 2014-2015 student/family and staff handbooks;
Mott Haven Academy Charter School’s self-reported staffing data;
On-site review of Mott Haven Academy Charter School’s financial and operational records;
Mott Haven Academy Charter School’s Board of Trustees meeting minutes;
Mott Haven Academy Charter School’s Board of Trustees bylaws; and
Mott Haven Academy Charter School’s Board of Trustees financial disclosure forms. Over the course of the school’s charter term, the Board of Trustees has maintained a developed governance structure and organizational design. The level of Board membership is consistent with the minimum of five and maximum of 13 members established in the Board’s bylaws. The Board currently has seven voting members all of whom were elected to the Board prior to the start of the current charter term. There are clear lines of accountability between the Board and school leadership team as evidenced by the school’s organizational chart and by regular updates at the Board meetings, as recorded in Board meeting minutes, by the school principal and other instructional leadership. The Board’s bylaws require the following committees: Executive, Finance, and Education/ Accountability. Per the Board’s roster, Board members serve on Finance, Education, Fundraising, and Human Resources committees, however, as per the reviewed Board meeting minutes, these committees do not appear to be active. The Board’s bylaws indicate the Board will hold the number of meetings consistent with the requirements of the charter entity and in no case fewer than six meetings per year. In the only complete academic year of the charter term, the Board held 10 meetings, all of which met quorum. The Board has 10 meetings scheduled also for the 2014-2015 academic year. The Charter Schools Act requires that the Board hold monthly meetings over a period of 12 calendar months per year. Over the course of the school’s charter term, the school has developed a stable school culture. The school is led by Jessica Nauiokas who is the school’s founder and has been the school leader at Haven Academy since the school’s opening in 2008. Over the course of the one-year retrospective charter term, the school has not had any changes in school leadership and instructional turnover was relatively low. For the most recent period, instructional staff turnover was 12% of instructional staff not returning, either by choice or request, at the start of the 2014-2015 school year.
6 The Board Chair, Patricia Mulvaney, has served on the Board throughout the
school’s operation, since 2008. Average daily attendance for students during the retrospective charter term was 92.8%
7; the
school met its attendance goal of 92% for overall attendance8 in the retrospective one-year
charter term. During the 2013-2014 school year, the school had generally positive results on the NYC School Survey.
6 Self-reported information from the school-submitted data collection form in January 2015
7 Reflects attendance data taken from the NYC DOE Automate the Schools (ATS) system
8 The school’s attendance goal states, “Each year, the school’s General Community and Foster Care populations will have a daily
student attendance rate of at least 95 percent. The school’s overall attendance (including Prevention students) will be minimally 92 percent. The school self-reported that it met both components of this goal in its 2014 Annual Report to NYSED.
Overall, the school is in a weak position to meet near-term financial obligations. The school has only 16 days of unrestricted cash on hand, based on operating expenses, to meet obligations totaling $271,016. Overall, there are concerns about the financial sustainability of the school based on its current practices; however, the school receives ongoing financial support from The NY Foundling. The NY Foundling has confirmed its financial support of Haven Academy annually in a letter that is reviewed as part of the school’s financial audit. There was no material weakness noted in the FY14 independent financial audit
C. Compliance with Charter, Applicable Law and Regulations
Over the charter term, Mott Haven Academy Charter School has been compliant with some applicable laws and regulations, but not others. During the current charter term, the Board of Trustees has maintained a level of Board membership consistent with the minimum of five and maximum of 13 members established in the Board’s bylaws; there are currently seven voting Board members. All Board members have submitted conflict of interest and financial disclosure forms. The documents submitted do not demonstrate conflicts of interest. The Board did consistently submit the Annual Report to the New York State Education Department (NYSED) by the deadline of August 1 (or by the NYSED granted extension date) for each year of the current charter term. The school has posted to its website its annual audit for each year of the charter term, as required in charter law. All staff members have appropriate fingerprint clearance. The school has submitted required documentation for teacher certification and is compliant with state requirements for teacher certification. The Charter Schools Act prohibits more than five staff members or more than 30% of the teaching staff from not being certified in accordance with requirements applicable to other public schools. The school has submitted the required safety plan. The school has the required number of staff with AED/CPR certification. The school has submitted its required immunization documentation and is in compliance with Department of Health standards of 99% for immunization. The school has submitted appropriate insurance documents to the NYC DOE. One or more of the school leaders were trained in General Response Protocols/Fire Emergency Drill Conductor for NYC, as mandated by the NYC Fire Department. Over the course of the charter term, the school did consistently submit complete invoicing and reconciliation documents by the associated deadlines. The school has provided the NYC DOE with a current and complete copy of their Student Discipline Policy for the 2014-2015 academic year. This policy was determined to not be compliant with federal law as it does not expressly indicate provisions for students with disabilities or alternative education.
D. Plans for Next Charter Term
As part of its renewal application, the school submitted a material revision to increase the maximum authorized enrollment to 300 students across grades kindergarten through five. This

increase is intended to reflect that the school has experienced less attrition than originally planned.
Haven Academy launched a Universal Pre-K program along with its community partner, The NY Foundling, in the 2014-2015 school year. Currently, the Pre-K program is approved by the NYC DOE as a “Community Based Program”. However, the school and The NY Foundling submitted an application to instead operate the program as a charter school beginning with the 2015-2016 school year. This application has been approved and the school will begin offering a charter school-based Universal Pre-K program for 36 students in the fall of 2015.

Renewal Report Mott Haven Academy Charter School | 1
Regents Addendum This Regents Addendum has been prepared at the request of the Board of Regents. The information presented in this addendum regarding Mobility and Enrollment of Special Populations is not factored into the DOE’s renewal recommendation. Complete data regarding Mobility and Enrollment of Special Populations is presented in Part 4 of the Renewal Recommendation Report which is available on the DOE website. Mobility
Student Mobility out of Mott Haven Academy Charter School *
2013-2014
Number of Students who Left the School1 28
Percent of Students who Left the School2 11.6%
* Figures are based on student enrollment as of October 31 for each respective school year with the exception of the 2012-2013 school year, which is as of October 26, 2012. Students in terminal grades are not included.
Enrollment of Special Populations3
Special Population 2013-2014
2013-2014 State Enrollment
Target (Current)
Free and Reduced
Price Lunch (FRPL)
Mott Haven Academy Charter School 92.7%
95.8% CSD 7 96.8%
NYC 82.5%
Students with Disabilities
(SWD)
Mott Haven Academy Charter School 21.9%
17.7% CSD 7 24.1%
NYC 19.7%
English Language Learners
(ELL)
Mott Haven Academy Charter School 13.5%
21.0% CSD 7 20.4%
NYC 16.0%
1 The Number of Students who Left the School for a given school year is the total number of students who were enrolled in the
school on October 31 in the given school year that were not enrolled in the school on October 31 of the following school year. The figure includes students who left the school for any reason (i.e. all discharge and transfer codes are included); the only exception made to this rule was for students in terminal, non-phase-in grades.
2 The Percent of Students who Left the School for a given school year is the percentage of students who were enrolled in the
school on October 31 in the given school year that were not enrolled in the school on October 31 of the following school year. The percentage figure includes students who left the school for any reason (i.e. all discharge and transfer codes are included); the only exception made to this rule was for students in terminal, non-phase-in grades.
3 Comparisons of a charter school’s special populations to the CSD and City are made relative only to the grades served by the
school. For example, if a charter school serves grades kindergarten through five, comparisons of that school’s special populations will only be made relative to grades kindergarten through five in the CSD and citywide. CSD comparisons are particular to the grades served in each CSD each year. Enrollment rates reflect demographic characteristics as of June 1 and enrollment as of October 31 for each given school year, with the exception of enrollment in the 2012-2013 school year, which is as of October 26, 2012.
State enrollment targets were generated by a calculator developed by the State Education Department (SED). Once a school's CSD, total enrollment and grade span are entered, the calculator generates a school-specific enrollment target. The CSD for a multi-district school is the primary CSD as determined by each school. The enrollment is determined by the total number of students enrolled as of October 31, 2013. Any school with an unusual grade configuration (i.e. K, 6-9) should use an available grade configuration provided by SED that is most aligned as determined by the DOE, otherwise a school's actual grade span is used. For more information regarding SED’s methodology behind the calculation of charter school enrollment and retention targets, please refer to the memo at http://www.regents.nysed.gov/meetings/2012Meetings/July2012/712brca11.pdf.