Embed Size (px)
Citation preview

Executive Summary i
TheStanford University
Budget Plan2000/01
Submitted for Action to the
Board of Trustees
June 8-9, 2000
This publication can also be found on the World Wide Web at:http://www.stanford.edu/dept/pres-provost/budget/plans/plan01.html

ii Executive Summary

Executive Summary iii
Executive Summary
To the Board of Trustees:
I am pleased to submit the 2000/01 Stanford University Budget Plan for your approval.
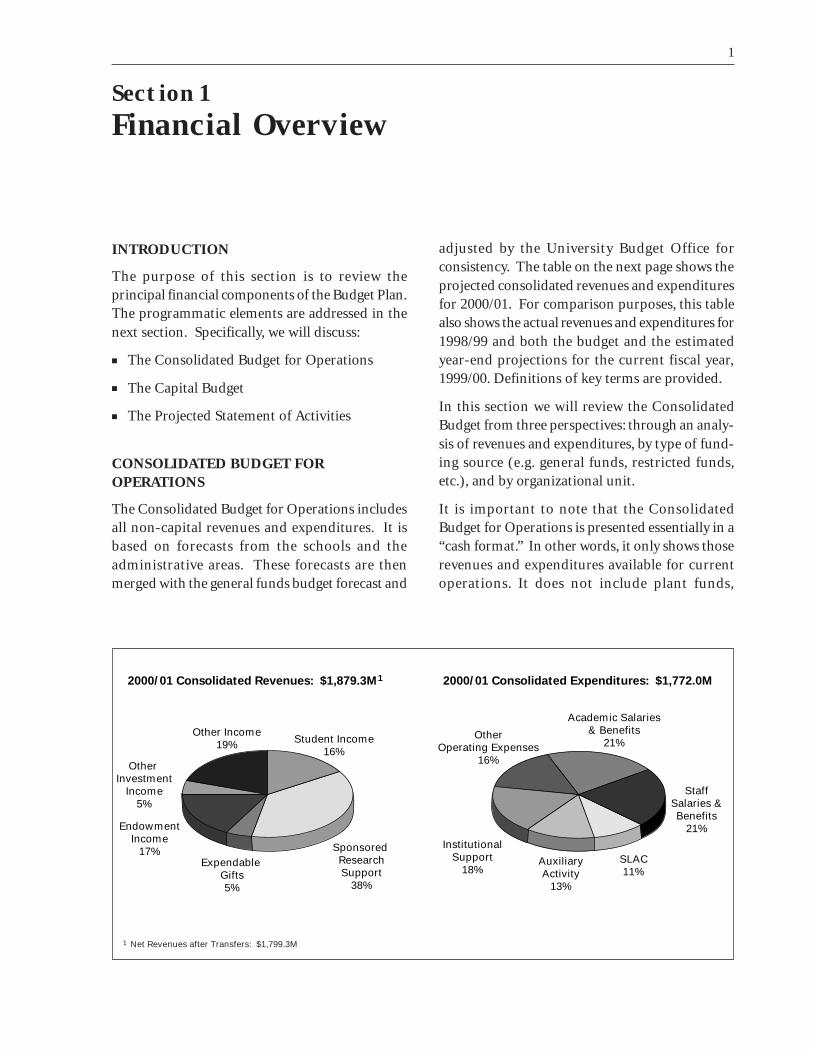
This Budget Plan is presented in two parts. The first is the Consolidated Budget forOperations, which reflects all of Stanford’s anticipated non-capital revenue and expense.The Consolidated Budget for Operations projects a surplus of $27.3 million on netrevenues after transfers of $1,799.3 million and expenditures of $1,772.0 million. Thisvery modest surplus (1.5% of expenditures) results primarily from an excess of restrictedrevenue over expense.
The second part of the Plan is the Capital Budget. The budget calls for $273.9 millionin capital expenditures next year supporting a range of initiatives, including new gradu-ate housing, renovations to several Medical School buildings, initial work on the ClarkCenter, and the strengthening of the last of the unreinforced masonry buildings. TheCapital Budget is set in the context of a three-year plan, running through 2002/03.
Stanford Hospital and Clinics (SHC), a separate corporation, is not included in theBudget Plan. However, SHC financial results will be consolidated into Stanford’sfinancial statements.
KEY CHALLENGES ADDRESSED IN THE 2000/01 BUDGET PLAN
We have made great progress on many fronts under President Casper’s leadership. Ourinitiatives in undergraduate education have become the envy of many. The campus hasbeen substantially renovated and rebuilt during the last eight years. Many impressivenew facilities support one of the premier research programs in the world, and researchvolume, particularly in the biomedical sciences, continues to grow. We are investingheavily in faculty, both at the junior and senior levels. We are providing more financialaid than ever to ensure Stanford’s affordability to the best students. These successeshave been achieved in large part through the generosity of our friends, strong invest-ment performance, and prudent management.
While there have been considerable achievements, we face many challenges. Thefollowing discussion identifies several of our most critical issues and how they affectnext year’s budget.
1. Cost Pressures Driven by the Local Economy – Perhaps our most pressing chal-lenge is to address the escalating expenditures brought upon us by the success ofSilicon Valley. While Stanford has been a contributor to and a beneficiary of theValley’s growth, the local economy is driving wages and housing costs to the highestlevels in the country. Consequently, in building the budget for next year our toppriority has been to address the compensation and housing issues through thefollowing actions:

iv Executive Summary
■ After several years of below market staff compensation programs, our meritbased program for 2000/01 will be stronger and will focus on providing fundsfor market adjustments and retention. This increase will help considerablyin addressing the compensation problem. However, it will absorb asignificant share of the flexibility in the budget for 2000/01. In the generalfunds portion of the Consolidated Budget for Operations, for example,we anticipate that almost 42% of the growth will be dedicated to staff andfaculty compensation increases.
■ We will be strengthening our support for faculty and graduate studenthousing in several respects. On the faculty side the Committee on FacultyHousing Policy, chaired by Dean Orr, has proposed enhancements to ourhousing assistance programs and an expanded zero interest loan program.Over the next several years we will support these programs through incomefrom the research park, which the Trustees have already dedicated tohousing costs, and through school and departmental funds. In the longerrun, however, there may be additional cost implications. In the graduatehousing area we are increasing the University’s subsidy program from $3.2million to approximately $5.0 million. These funds will cover subsidies forboth on-campus housing in the new Escondido Village studio apartmentsand off-campus facilities, increasing the number of students receivingsubsidies from 600 to almost 1,000.
■ In an effort to provide more funding for graduate students we are increas-ing stipends by 6.0%. Further, in the 2001/02 budget we plan to reduce thetime to achieve TGR status from 10.5 quarters of residency to 9. This willreduce by about 15% the total tuition paid by a PhD student during the termof his or her graduate career.
2. Undergraduate Education and Financial Aid – Although we have implementedmany enhancements to the undergraduate education program, the full realizationof our plans is not yet complete. The budget for the programs directed by the ViceProvost for Undergraduate Education will grow by 10% next year from $15.7million to $17.3 million. Much of the growth is for independent study andresearch that will expand opportunities for advanced undergraduate students towork with faculty. We will also continue to increase support for Stanford Intro-ductory Studies with the new Speaking Across the Curriculum program and withadditional support for Sophomore Seminars and Dialogues. The 2000/01 budgetfor undergraduate education will receive $1.0 million in incremental base generalfunds, the third of five years of incremental $1.0 million commitments. Theseprograms are currently funded 60% with unrestricted general funds and 40% withrestricted funds. However, with the expectation of strong fund raising supportover the next several years, we anticipate that by 2004/05 the programs will befunded 60% with restricted funds and 40% by general unrestricted funds.
Next year’s budget also includes major enhancements to Stanford’s financial aidprogram, particularly for middle income families. In February, the Trusteesapproved $3.8 million in incremental financial aid to reduce the amount studentswill be expected to borrow and to increase support for middle income students.

Executive Summary v
3. Academic and Administrative Infrastructure – Supporting the operations ofa major research university requires that we not only maintain our existinginfrastructure but that we invest incremental funds in it. Next year’s budget doesso in several respects:
■ The School of Humanities and Sciences (H&S) has a structural deficit ofapproximately $4.0 million in its core unrestricted budget due to expansionof faculty positions without funding. So, while H&S is expected to continueto show a surplus in its overall consolidated budget, the excess revenue andresulting growth in fund balances are restricted at the department and fac-ulty level. We will allocate $1.0 million in incremental base budget fundingto assist H&S as it works to eliminate the deficit in its unrestricted budget.
■ For the past six years we have been systematically replacing and expandingour administrative computing systems. The first phase of the Core Finan-cials system, comprised principally of a new general ledger, was completedearlier this year. Over the next several years we will be replacing the studentinformation system, the human resources system, and implementing addi-tional modules of the financial system. We are adding $2.5 million in basebudget general funds in 2000/01 as part of the overall funding strategy foradministrative systems. Next year’s capital budget includes $31.3 million forthese projects.
4. Research Support – The Budget Plan provides incremental support to Stanford’sresearch programs in several respects. On the operating side there is additionalfunding for the Jasper Ridge Biological Preserve, startup funds for the Institutefor Biomedical Engineering, and planning funds for the programs of the ClarkCenter. In addition, the budget will fund increases in staffing in the researchcompliance areas. In the Capital Budget the Center for Clinical Sciences Researchwill experience its first full year of operation, and the first phase of the renovationof the Grant/Lane/Alway/Edwards complex at the Medical School will beundertaken.
5. Contingency Reserve – The Budget Plan provides a $10.0 million unrestrictedgeneral funds reserve to provide a buffer against future income shortfalls and asa source of funds for one-time expense. This has been an important budgetingpriority since the mid-90s, and I am pleased to continue it.
CONSOLIDATED BUDGET FOR OPERATIONS
The table on page vii shows the principal income and expenditure line items for2000/01 and compares those numbers to the projected actuals for the current year. Thesefigures include the incremental costs for the programs and initiatives noted above. Somehighlights on both income and expense follow.
Income
Student Income – This figure is the sum of all tuition, room and board income lessstudent aid. The modest growth of 2.7% over the projected 1999/00 actuals is theresult of three factors:

vi Executive Summary
1. There is a 5.3% growth in tuition revenues resulting from the tuition increasesapproved in February and a slight reduction in the number of entering under-graduates.
2. Room and board income will grow by 6.4%, the result of a 1.9% increase instandard room and board rates, an increase in on-campus graduate housing, andgrowth in off-campus graduate student subsidized housing.
3. Student aid expense, which is netted against income, will grow by 16.9% dueprincipally to changes in policy approved by the Board in February 2000.
Sponsored Research – The 5.0% growth in sponsored research will occur principallyin the Medical School, which is expecting an 8.5% increase. Non-medical researchvolume is budgeted to grow by 2.5%.
Expendable Gifts – The figure of $87.0 million includes only those non-capitalgifts available for current expenditure. We expect this amount to remain flat in theupcoming year.
Investment Income – This category consists primarily of endowment income andincome from the expendable funds pool (EFP). Endowment income is expected to growby 9.7% based on our estimate of market returns and a target payout rate of 5.2%.Income from the EFP is anticipated to be lower than in 1999/00. This is because weexpect to earn 6.0% in the current year, the maximum return allowed to flow to thebudget under Trustee guidelines. For 2000/01 we are budgeting 5.5%.
Expense
Academic and Staff Salaries – For the past several years Stanford’s salary program,particularly on the staff side, has fallen behind the Silicon Valley market where we mustcompete for many staff. As noted above, this Budget Plan includes a concerted effort toaddress that problem by increasing our cost base by 3.5%, by adding a broad basedmarket/equity/retention component, and by including a targeted allocation for jobgroups lagging the market significantly. On the faculty side we compete in nationaland international markets and anticipate maintaining a strong salary position with a3.5% basic program and with some additional funding to address equity and retentionissues.
Auxiliary Activity – The majority of these expenses are incurred by Medical SchoolProfessional Services, Student Housing and Dining Services, the Alumni Association,the Department of Athletics, and the Stanford University Press.
Other Expenses – This line item is comprised principally of maintenance costs,materials and supplies, travel, utilities, library materials, and subcontracted professionalservices.
CAPITAL BUDGET
The Capital Budget anticipates $273.9 million for capital construction expenditures in2000/01. The following are the principal elements of the Capital Budget:
■ Projects in Design and Construction – This category totals $194.1 millionand includes major work on the Clark Center ($68.1 million), initial work on the

Executive Summary vii
new Chemistry/Biology building ($12.0 million), half of the work on the newMechanical Engineering building ($15.7 million), completion of the first phaseof new Graduate Student Housing ($17.5 million), and the commencement ofwork on the Grant/Alway/Lane/Edwards project in the Medical School ($25.0million).
■ Forecasted Projects – There are $47.2 million of projects anticipated tobe presented to the Board during 2000/01, primarily renovation and studenthousing.
■ Infrastructure – The Capital Budget contains $53.4 million in infrastructureprojects, approximately two-thirds is for replacement of administrative systems.The rest is split between the renovation and expansion of utility systems and theStanford Infrastructure Program, which includes landscaping, transportation, andparking projects.
The Capital Budget affects the Consolidated Budget for Operations by adding debtservice costs and the costs of operating and maintaining the facilities. Incremental debtservice resulting from the Capital Budget totals $3.6 million for academic, auxiliaries,and service center projects coming on line in 2000/01. By Trustee policy, internal debtservice repayment on capital projects (exclusive of SLAC, auxiliaries, and servicecenters) may not exceed 5.0% of unrestricted funds. For 2000/01 this figure is projectedto be 3.0%. Operations and maintenance costs on new facilities will add $2.9 millionto next year’s budget.
PROJECTED CONSOLIDATED BUDGET FOR OPERATIONS, 2000/01
(in millions of dollars)
2000/01 2000/011999/00 Forecast vs
1998/99 Projected Current 1999/00Actuals Actuals Funds Projected
Revenues and Other Additions
278.3 294.2 Total Student Income 302.2 2.7%
633.6 677.2 Total Sponsored Research Support 710.7 5.0%
97.4 87.0 Expendable Gifts 87.0
365.2 390.3 Total Investment Income 414.4 6.2%
324.4 355.5 Total Other Income 365.1 2.7%
1,698.9 1,804.2 Total Revenues 1,879.3 4.2%
(78.5) (80.8) Transfers and Adjustments (80.0) (1.0%)
1,620.4 1,723.4 Net Revenues after Transfers 1,799.3 4.4%
Expenditures
647.9 708.0 Academic & Staff Salaries and Benefits 753.7 6.5%
170.7 186.8 SLAC 197.7 5.8%
209.2 219.5 Auxiliary Activity 229.7 4.7%
553.8 570.7 Other Expenses 590.9 3.5%
1,581.6 1,685.0 Total Expenditures 1,772.0 5.2%
38.8 38.4 Surplus/Deficit 27.3 (28.8%)

viii Executive Summary
REQUESTED APPROVAL AND ORGANIZATION OF THIS DOCUMENT
This Budget Plan provides a university-level perspective on Stanford’s programmaticand financial plans for 2000/01. We seek approval of the planning directions, theprincipal assumptions, and the high level supporting budgets contained here. As theyear progresses, we will make periodic reports, as necessary, on the progress of actualexpenditures against the budget. In addition, we will bring forward individual capitalprojects for approval under normal Trustee guidelines.
This document is divided into three sections and two appendices. Section 1 describesthe financial elements of the Plan, including detail on the Consolidated Budget forOperations and the projected Statement of Activities for 2000/01. Section 2 addressesprogram issues in the academic areas of the University. Section 3 contains details onthe Capital Budget for 2000/01 and the three year capital plan. The appendices includebudgets for the major academic units and supplementary financial information.
CONCLUSION
I want to thank the Provost’s staff, especially Vice Provost Tim Warner and his staff, fortheir skill in explaining the complexities of the Stanford budget and patience with mewhen I tried to do the impossible. I also want to thank the Deans, Associate Deans, theUnit Directors, and their staff for helping me understand the challenges that the Schoolsand units are facing. While I certainly wish we could have responded more fully to thevisions and requests of the units, I do feel that given the resources available, we havedeployed them all. I know that the next Provost will benefit from the outstandingsupport of the Provost’s staff as she or he tackles the many ongoing budgetarychallenges.
Looking forward, we face several major challenges. We expect that salaries for bothfaculty and staff will continue to be under significant pressure due to cost-of-livingincreases in the region. Housing and the cost of housing programs are expected to growconsiderably. The necessity for an undergraduate campaign is critical to partiallyrelieve the shortfall in general funds, to provide permanent support for StanfordIntroductory Studies, and to increase the endowment support in the university budget.With the help of the Trustees, our alumni, and many friends, we will complete acampaign that will help ensure that Stanford’s excellence in teaching and researchwill continue.
John L. HennessyProvostJune, 2000

Executive Summary ix
Table of Contents
Executive Summary ........................................................................................................................................ iii
Section 1: Financial Overview ..................................................................................................................... 1
Introduction ................................................................................................................................................. 1
The Consolidated Budget for Operations .................................................................................................. 1
The Consolidated Budget by Principal Income and Expenditure Categories ................................... 3
The Consolidated Budget by Fund Type ........................................................................................... 11
The Consolidated Budget by Organizational Unit ............................................................................ 15
Impact of the Capital Budget on the Consolidated Budget for Operations ........................................... 18
Projected Statement of Activities .............................................................................................................. 18
Section 2: Academic Initiatives and Plans ............................................................................................. 21
School of Earth Sciences ............................................................................................................................ 21
School of Education .................................................................................................................................. 21
School of Engineering ............................................................................................................................... 22
School of Humanities and Sciences .......................................................................................................... 23
School of Law ............................................................................................................................................. 24
Graduate School of Business ..................................................................................................................... 24
School of Medicine .................................................................................................................................... 25
Hoover Institution ..................................................................................................................................... 26
Vice Provost and Dean of Research and Graduate Policy ........................................................................ 27
Vice Provost for Undergraduate Education ............................................................................................. 27
Stanford University Libraries and Academic Information Resources ..................................................... 29
Learning Technology & Extended Education ........................................................................................... 29
Stanford Linear Accelerator Center .......................................................................................................... 30
Section 3: Capital Plan and Budget......................................................................................................... 33
Capital Plan ................................................................................................................................................ 33
Capital Plan Funding Sources .................................................................................................................. 39
The 2000/01 Capital Budget ...................................................................................................................... 41
Appendix A: Consolidated Budgets for Schools, Academic Support Areas, and Auxiliaries ..... 45
Appendix B: Supplementary Information ................................................................................................ 63

x Executive Summary
Financial Overview 1
Section 1
Financial Overview
INTRODUCTION
The purpose of this section is to review theprincipal financial components of the Budget Plan.The programmatic elements are addressed in thenext section. Specifically, we will discuss:
■ The Consolidated Budget for Operations
■ The Capital Budget
■ The Projected Statement of Activities
CONSOLIDATED BUDGET FOROPERATIONS
The Consolidated Budget for Operations includesall non-capital revenues and expenditures. It isbased on forecasts from the schools and theadministrative areas. These forecasts are thenmerged with the general funds budget forecast and
adjusted by the University Budget Office forconsistency. The table on the next page shows theprojected consolidated revenues and expendituresfor 2000/01. For comparison purposes, this tablealso shows the actual revenues and expenditures for1998/99 and both the budget and the estimatedyear-end projections for the current fiscal year,1999/00. Definitions of key terms are provided.
In this section we will review the ConsolidatedBudget from three perspectives: through an analy-sis of revenues and expenditures, by type of fund-ing source (e.g. general funds, restricted funds,etc.), and by organizational unit.
It is important to note that the ConsolidatedBudget for Operations is presented essentially in a“cash format.” In other words, it only shows thoserevenues and expenditures available for currentoperations. It does not include plant funds,
2000/01 Consolidated Revenues: $1,879.3M1
Other Income19%
Sponsored ResearchSupport
38%
Expendable Gifts5%
EndowmentIncome
17%
Other Investment
Income5%
Student Income16%
AuxiliaryActivity
13%
InstitutionalSupport
18%
OtherOperating Expenses
16%
Academic Salaries& Benefits
21%
StaffSalaries &Benefits
21%
SLAC11%
2000/01 Consolidated Expenditures: $1,772.0M
1 Net Revenues after Transfers: $1,799.3M

2 Financial OverviewP
RO
JE
CT
ED
CO
NS
OLID
AT
ED
BU
DG
ET
FO
R O
PE
RA
TIO
NS
, 2
000/0
1
(in
mill
ion
s o
f d
olla
rs)
1999
/00
1999
/00
Tota
l Cur
rent
1998
/99
Budg
etPr
ojec
ted
Gene
ral
Gran
ts a
ndAu
xilia
ries/
Fu
nds
Actu
als
June
, 199
9Yr
-End
Act
uals
Fund
sDe
sign
ated
Rest
ricte
dCo
ntra
cts
Othe
r
2
000/
01
Re
ve
nu
es a
nd
Oth
er
Ad
dit
ion
s
Stud
ent I
ncom
e:14
7.4
153.
015
3.0
Und
ergr
adua
te P
rogr
ams
1
62.0
162.
014
1.9
149
.814
9.7
Gra
duat
e Pr
ogra
ms
1
56.7
156.
761
.359
.563
.0R
oom
and
Boa
rd
6
7.1
67.1
(72.
3)(7
5.3)
(71.
5)S
tude
nt F
inan
cial
Aid
(14.
3)
(
2.7)
(61.
0)
(
5.6)
(83.
6)
278.
328
7.0
294.
2To
tal S
tude
nt In
com
e30
4.4
(2.
7)
(6
1.0)
(5.
6) 6
7.1
302.
2
Spon
sore
d Re
sear
ch S
uppo
rt:
357.
5 3
88.3
376.
4D
irec
t C
osts
—U
nive
rsity
392.
439
2.4
170.
719
3.0
186.
8D
irec
t C
osts
—S
LAC
197.
719
7.7
105.
511
1.2
113.
9In
dire
ct C
osts
120.
612
0.6
633.
6 6
92.5
677.
2To
tal S
pons
ored
Res
earc
h S
uppo
rt12
0.6
590.
171
0.7
97.4
80.0
87.0
Expe
ndab
le G
ifts
In S
uppo
rt o
f Ope
ratio
ns2.
085
.087
.0
Inve
stm
ent I
ncom
e:26
1.6
270.
528
7.3
Endo
wm
ent I
ncom
e87
.822
7.3
315.
110
3.6
65.2
103.
0O
ther
Inve
stm
ent I
ncom
e25
.035
.538
.00.
899
.3
365.
233
5.7
390.
3To
tal I
nves
tmen
t Inc
ome
112.
835
.526
5.3
0.8
414.
4
Oth
er In
com
e:13
6.7
122.
014
0.0
Spe
cial
Pro
gram
s Fe
es14
3.5
143.
514
3.1
153.
315
9.5
Aux
iliar
ies
(exc
l. R
oom
& B
oard
)16
3.8
163.
844
.640
.356
.0O
ther
Inco
me
33.7
28.9
(4.5
)(0
.3)
57.8
324.
4 3
15.6
355.
5To
tal O
ther
Inco
me
33.7
172.
4(4
.5)
(0.3
)16
3.8
365.
1
1,6
98
.91
,71
0.8
18
04
.2To
tal
Re
ve
nu
es
57
3.6
20
5.2
28
4.8
58
5.0
23
0.9
1,8
79
.3
Tra
nsfe
rs a
nd
Oth
er
Ad
justm
en
ts
32.1
25.5
25.0
Net
Ass
ets
Rel
ease
d fr
om R
estr
ictio
ns25
.025
.0Tr
ansf
ers
to U
nres
tric
ted
Uni
v R
eser
ves
(10.
0)10
.0Tr
ansf
ers
to D
esig
nate
d Fu
nds
(12.
7)12
.7(3
7.6)
(11.
8)(3
3.4)
Tran
sfer
s to
Fun
ds F
unct
ioni
ng a
s En
dow
men
t(1
5.0)
(9.4
)(2
4.4)
(72.
9)(7
7.5)
(72.
4)Tr
ansf
er to
Pla
nt/S
tude
nt L
oan
(11.
9)(3
2.0)
(33.
6)(3
.1)
(80.
6)
1,6
20
.41
,64
7.0
17
23
.4N
et
Re
ve
nu
es a
fte
r Tra
nsfe
rs5
39
.01
80
.82
66
.85
85
.02
27
.71
,79
9.3
Ex
pe
nd
itu
res
318.
1 3
10.1
348.
5A
cade
mic
Sal
arie
s an
d B
enef
its12
6.1
48.
1
9
0.9
1
02.7
367.
732
9.8
374
.535
9.5
Sta
ff S
alar
ies
and
Ben
efits
187.
8
6
3.5
42.
2
9
2.5
386.
017
0.7
193.
018
6.8
SLA
C19
7.7
197.
720
9.2
213.
321
9.5
Aux
iliar
y A
ctiv
ity 2
29.7
229.
729
2.3
291.
530
2.8
Inst
itutio
nal S
uppo
rt12
9.6
41.
6
2
7.9
1
14.2
313.
426
1.6
257.
626
8.0
Oth
er O
pera
ting
Expe
nses
95.4
48.
0
5
6.3
77.
827
7.5
1,5
81
.6 1
,64
0.0
1,6
85
.0To
tal
Ex
pe
nd
itu
res
53
9.0
20
1.2
21
7.2
58
5.0
22
9.7
1,7
72
.0
38
.87
.03
8.4
Su
rplu
s/(
De
ficit
)0
.0(2
0.3
)4
9.6
0.0
(2.0
)2
7.3

Financial Overview 3
KEY TERMS
General Funds: Funds which can be used for anyUniversity purpose, the largest sources of whichare tuition, unrestricted endowment income, andindirect cost recovery.
Designated Funds: Funds which come to the Univer-sity as unrestricted but are directed to specificpurposes by the Trustees or the administration.
Restricted Funds: Includes expendable and endowedfunds which can only be spent in accordance withdonor restrictions.
Grants and Contracts: The direct cost of sponsoredresearch, both federal and non-federal.
Auxiliaries/Other: Self-contained entities, such asHousing and Dining Services and the AthleticsDepartment, that charge directly for their servicesand pay the University for any central servicesprovided.
Net Assets Released from Restrictions: Under Finan-cial Accounting Standards Board reportingstandards, gifts and pledges that contain specificdonor restrictions preventing their spending inthe current fiscal year are classified as “tempo-rarily restricted” and are not included in the
Consolidated Budget for Operations. When therestrictions are satisfied, these funds do becomeavailable to cover expenses. At that time they are“released from restrictions” and are included inthe Consolidated Budget in the line Net AssetsReleased from Restrictions.
Financial Aid: Includes expenses for undergraduateand graduate student aid. In accordance with theUniversity financial statements format, theseexpenses are shown as an offset to studentincome. Student stipends and tuition allowanceare not considered to be financial aid and areincluded in the expense side of the budget.
Formula Unit: Budget units whose unrestrictedrevenues are determined by a formula agreed toby the Provost and the unit. In most cases, theformula is tied to tuition and indirect cost recov-ery generated by the unit. The formula unitsinclude the Graduate School of Business, theSchool of Medicine, the research program ofthe Hoover Institution, and Continuing Studies/Summer Session.
student loan funds, or endowment principal funds,although endowment income is reflected in thisbudget. Later in this section, we make a series ofadjustments to the Consolidated Budget to convertit from a cash basis to an accrual basis in order toproduce a Projected Statement of Activities. ThisStatement of Activities is consistent with howStanford’s audited financial statements aredeveloped and displayed in the Annual FinancialReport.
The 2000/01 Consolidated Budget for Operationsshows net revenues after transfers of $1,799.3 mil-lion and expenditures of $1,772.0 million, result-ing in a bottom line surplus of $27.3 million, or1.5% of total expenditures.
Net revenues after transfers in 2000/01 are pro-jected to increase 4.4% over the expected 1999/00levels. Adjusting for SLAC, revenues and transfersare expected to grow 4.2% over projected actuals.
This growth results from continued strengthin endowment income and continued strongsponsored research support. Total expenditures areexpected to grow by 5.2% over the estimatedyear-end results for 1999/00; adjusting for SLAC,expenditures are expected to grow at 5.1%. Thegrowth in expense is driven largely by the proposedenhanced salary program.
The Consolidated Budget by Principal Incomeand Expenditure Categories
INCOME (REFER TO TABLE ON PAGE 2)
Student Income
Increases in student charges are guided by anumber of considerations. The most important areour programmatic needs, the affordability of aStanford education, the effectiveness of ourfinancial aid program, our market position, andprice inflation in the local and national economies.

4 Financial Overview
Tuition – The general tuition increase for 2000/01,which was approved by the Trustees in February,is 6.0%. This increase is somewhat higher than inprevious years and helps generate the revenuenecessary to address some of the expense pressurespresented by the Bay Area’s booming economy. Atthe same time, the University is making significantinvestments in the student financial aid program.The approved tuition increase, together withanother low increase in the room and board rate,will yield a total increase in student charges of5.0%.
Room and Board – In February the Trustees ap-proved a combined room and board rate increaseof 1.9%. This increase is below the projected rateof inflation for the third straight year and holds theboard rate to zero growth for the second year in arow. Housing and Dining Services will continuethe Capital Improvements Program in 2000/01,representing the ninth year of a sixteen-year effortto renovate student residences. In addition, theoverall Housing and Dining Services budgetincludes an incremental 508 units for graduatestudent housing in the new Escondido Villagestudio apartments.
Student Financial Aid – Stanford expects tospend a total of $83.6 million in student financial
aid for undergraduate and graduate students, $14.3million of which will come from general funds.Designated and restricted funds ($63.7 million)and grants and contracts ($5.6 million) willsupport the remainder. The total financial aidnumbers are 16.9% above the projected total forthe current year, due to the larger increase intuition and major enhancements to the under-graduate financial aid program as well as a pro-jected increase in the number of students on aid.
Undergraduate Aid – This Budget Plan reflectsStanford’s long-held commitment to need-blindadmissions supported by a financial aid programthat meets the demonstrated financial need of alladmitted undergraduate students. Moreover, thisPlan includes funds for important enhancementsto our undergraduate scholarship program. Weestimate that in 2000/01, Stanford students willreceive $53.7 million in need-based scholarships,of which $44.5 million will be from Stanfordresources. Of the $44.5 million, $13.0 million willcome from general funds. An additional $10.8million in athletic scholarships, which are notneed-based, will be awarded to undergraduatestudents.
In February, the Trustees approved two new policyenhancements to our undergraduate scholarship
2000/01 Student Financial Aid and Other Graduate Student Support from Stanford Resources
(in millions of dollars)
FY00 Projected General Designated GrantsYear-End Actuals Funds and Restricted and Contracts Total
Student Financial Aid
36.8 Undergraduate 13.0 31.4 0.1 44.5
10.0 Undergraduate Athletic 10.8 10.8
24.7 Graduate 1.3 21.5 5.5 28.3
71.5 Total 14.3 63.7 5.6 83.6
Other Graduate Student Support
50.6 Stipends 8.8 20.1 24.7 53.6
44.8 Tuition Allowance 26.6 8.2 12.7 47.4
67.3 RA and TA Salaries 12.6 16.6 42.3 71.4
162.7 Total 48.0 44.9 79.6 172.4
234.2 Total Student Support 62.2 108.6 85.2 256.0

Financial Overview 5
program. The first reduces the standard “self-help”portion of financial aid packages by $1,000, from$6,500 to $5,500. Self-help is the amount studentsare expected to contribute to their education coststhrough loans and part-time work. The secondchange caps parental contribution in the financialaid calculations at 20% of income for families withannual household incomes between $50,000 and$100,000. In addition, Stanford is implementingchanges recently adopted by the College Scholar-ship Service in the Institutional Methodology forfinancial aid calculations. These changes willfurther assist middle-income families by reducingthe parental contribution. Together these enhance-ments in the undergraduate aid program will addapproximately $3.8 million to the budget forundergraduate scholarship aid.
The table above shows the detail of undergradu-ate need-based student aid. We anticipate anincrease in the number of students receiving schol-arship aid next year after recording a drop in thatnumber in both 1998/99 and 1999/00. The increasein the number of students on aid, enhancementsto the scholarship program, and a 6.0% increase intuition combine to push up the expected cost ofour need-based scholarship program by 17.0%.Most of this increase will be paid for by general
funds. It is our expectation that incrementalrestricted funds will be able to offset the generalfunds burden as the Undergraduate Campaign getsfully underway. Appendix B (Schedules 5 and 6)includes additional information on undergraduatefinancial aid.
Graduate Aid – Stanford provides several kinds offinancial support to graduate students totaling$200.7 million. As the table on page 4 indicates,this includes fellowships of $28.3 million, which arereflected in the student financial aid line of thebudget. It also includes funding, not shown in thestudent financial aid line of the budget, forstipends, tuition allowance, and research andteaching assistant salaries of $172.4 million.Consistent with the presentation of Stanford’sfinancial statements, the tuition allowance and RAand TA salaries expenses are in the AcademicSalaries and Benefits line, and the stipend amountis in the Other Operating Expense line of theConsolidated Budget for Operations on page 2.
For the third year in a row, the minimum rate forRA and TA salaries and stipends will increase abovethe nominal salary increase for faculty and staff. In2000/01, this increase will be 6.0% and is intendedto help mitigate the impact of the higher tuitionrate increase.
Financial Aid Awarded to Undergraduates Who Receive Need-Based Scholarship Aid
(in millions of dollars)1995/96 1996/97 1997/98 1998/99 1999/00 2000/01
Source of Aid Actual Actual Actual Actual Projected Budget
Restricted 13.3 15.9 18.5 19.0 20.3 22.6
Stanford Fund/Presidential Funds 3.3 4.5 4.3 5.6 8.8 8.9
General Funds 17.5 13.6 12.2 12.4 7.7 13.0
Subtotal Stanford Funded Financial Aid 34.1 34.0 35.0 37.0 36.8 44.5
Govt. and Outside Awards 8.3 8.0 8.9 9.0 9.1 9.2
Total Undergraduate Financial Aid 42.4 42.0 43.9 46.0 45.9 53.7
Number of Students 2,705 2,584 2,610 2,573 2,530 2,575
General Funds as a Share of Total Aid 41% 33% 28% 27% 17% 24%
General Funds and Stanford Fund
as a Share of Total Aid 49% 43% 38% 39% 36% 41%

6 Financial Overview
Sponsored Research Support and IndirectCost Recovery
The total budget for Sponsored Research Supportis expected to be $710.7 million in 2000/01, or37.8% of the total revenues projected in theConsolidated Budget for Operations. Included inthis figure are the total direct costs of externallysupported grants and contracts ($392.4 million forUniversity research and $197.7 million for SLAC)as well as reimbursement for the indirect costs($120.6 million) incurred by the University insupport of sponsored activities.
Direct research volume in the Medical School,which makes up about half of the University’stotal volume, has experienced double digit growthin each of the last three years, including thecurrent year’s expected growth rate of 16.7%.Medical School research volume is expected togrow 8.5% in 2000/01, a strong but slightly slowerpace than in recent years. Continued expansion ofthe research program is constrained by limitedavailable research space. Research volume in thenon-medical area increased at an inflationary rateof 3.0% in 1998/99 but is on pace for a slightdecline in the current year. We are budgeting a2.5% growth in non-medical research volume nextyear.
Total direct costs for SLAC are expected to increaseby 5.8% in 2000/01. The total budget for the highenergy physics program of SLAC is expected to berelatively flat. However, significant growth is ex-pected at the Stanford Synchrotron RadiationLaboratory (SSRL). The budget increase for SSRLis primarily associated with the SPEAR3 project,which upgrades the synchrotron radiation facility,SPEAR. In 1999, the DOE and the NIH agreedjointly to provide the funding for SPEAR3.The Department of Energy (DOE) has historicallyprovided almost all of the funding for SLAC.Beginning in 1998/99, however, a significantamount of funding will be coming from theNational Institutes of Health (NIH). The NIH hasentered into an agreement with the DOE forenhancing the capabilities at the SSRL to providebetter support to the structural molecular biologycommunity.
Investment Income
ENDOWMENT INCOME – The lion’s share of invest-ment income is endowment income. The estimateof endowment income is a product of a forecast ofthe endowment market value at the beginning ofthe coming budget year and the approvedsmoothed payout rate. Stanford uses a smoothingrule to dampen the impact on the budget of largeannual fluctuations in the market value, therebyproviding stability to budget planning. Thesmoothing rule sets the coming year’s payout rateto be a weighted average of the target rate and theactual rate in the current year. The target payoutrate is 5.2%, and the smoothed payout rateprojected for 2000/01 is 4.67%. The projection ofthe coming year’s market value is based on thelong-term assumption that total return on theendowment will be 6.25% above inflation.
Endowment income in 2000/01 is expected tototal $315.1 million, an increase of 9.7% over1999/00. This includes income from the mergedendowment pools, specifically invested endow-ment, and rental income from the StanfordResearch Park and other endowed lands. Of thetotal endowment income, $87.8 million, or 28.0%,is projected to support the unrestricted budget.The unrestricted amount includes all of the incomegenerated from Stanford endowed lands. Over thepast several years, the Stanford Management Com-pany has put considerable effort into generatingincome from the Research Park, and this budgetreflects the results of that continued effort. Thetotal net rental income from Stanford lands hasincreased from $7.7 million in 1996/97 to $18.4million in 1998/99 to an expected $24.7 million in1999/00. Income from this activity is projected tobe $25.4 million in 2000/01. In February, theTrustees authorized the University, indefinitely, toallocate 100% of the rental income to currentoperating income, compared to the previous policyof reinvesting half of the income back to theendowment land principal funds. The policychange was made with the understanding that halfof the income now will be used to alleviate thehousing crisis for faculty and graduate studentsresulting from the dramatic increase in Bay Arealand values.

Financial Overview 7
Other Investment Income – Other investmentincome consists primarily of earnings on theExpendable Funds Pool (EFP), the investment poolfor non-endowment funds. The Expendable FundsPool consists of the University’s general operatingfunds, non-governmental grants, expendable giftsbelonging to various schools and departments, andother short term funds. The investments of theEFP are allocated approximately 40% to theendowment and 60% to fixed income and moneymarket instruments. By Trustee policy, the Univer-sity guarantees the value of deposits in the EFP anda minimum payout of 4.0% annually. If actualearnings on the pool exceed 4.0%, an additionalamount up to 2.0% may be used to support theunrestricted budget. If total return on the EFP isless than 4.0%, then a buffer reserve, whichconsists of unrestricted funds functioning asendowment, will be used to supplement the actualearnings of the EFP so that the 4.0% can be paidout. The 2000/01 Consolidated Budget assumes a5.5% return will be achieved. Total income fromthis source is expected to be $99.3 million.
Expendable Gifts
Non-capital gift income is expected to total $87.0million in 2000/01. This amount does not includegifts to endowment principal, gifts for capitalprojects, or gifts that are temporarily restricted.Gift receipts in support of current operations haveaveraged $90.0 million over the past five years, buthave varied from a high of $100.3 million to a lowof $77.6 million during this period. We haveassumed that gift income will be flat at $87.0million in both the current year and in 2000/01.
Other Income
Other Income includes three components:(1) Special Program Fees; (2) Auxiliary Income,excluding Room and Board income which is shownseparately in the Student Income section; and(3) Other Income.
Special Program Fees – These fees consist mainlyof patent and royalty income, fees from the execu-tive education programs in the Graduate School ofBusiness, the Stanford Center for ProfessionalDevelopment, and from summer camps sponsored
by Athletics. Special program fees also includenearly $20.0 million from corporate affiliates,mostly in the schools of Earth Sciences andEngineering. Overall, special program fees areprojected to be $143.5 million in 2000/01, aninflationary increase over the expected amount forthe current year.
Auxiliary Income – Auxiliary income, excludingroom and board fees, is projected to be $163.8million. It includes $97.9 million for purchasedservices of Medical School physicians and staff byStanford Hospital and Clinics, including Pediatricsand other Children’s Services. It also includes otherauxiliary receipts such as conference fees, athleticevent ticket sales and television income, the activi-ties of the Stanford Alumni Association, and theStanford Press.
Other Income – Other income is projected to be$57.8 million in 2000/01. This category includesreimbursements for central support services pro-vided to auxiliary organizations ($13.7 million)and income generated by the infrastructure charge($4.5 million). A large portion of Other Incomecomes in to the Medical School as designated funds($20.0 million). These are payments from affiliatedinstitutions such as Santa Clara Valley MedicalCenter, Lucile Packard Children’s Hospital, or Stan-ford Hospital and Clinics for strategic support orphysician services from the faculty of theMedical School.
TRANSFERS AND OTHER ADJUSTMENTS
Several adjustments and transfers need to be madeto reflect accurately the net income available foroperations.
■ Transfers to University Reserves: This is ageneral funds reserve of $10.0 million set asideto cushion Stanford against potential incomeshortfalls, particularly research and investmentincome.
■ Transfers to Designated Funds: $12.7 million ofunrestricted funds generated from the annualrental income form Stanford endowed lands willbe transferred to designated where it will be usedto fund faculty and graduate student housingexpenses.

8 Financial Overview
■ Additions to Funds Functioning as Endowment:This line reflects our assumption that individualbudget units will continue the practice of trans-ferring some excess of revenue over expense inrestricted gift funds to Funds Functioning asEndowment (FFE). We expect a total of $24.4million will be transferred to FFE.
■ Transfer to Plant: These funds will move to theplant division to be used for capital projects.The total amount projected for next year, $80.6million, is substantially larger than in previousyears in keeping with the overall level of thecapital program. In particular, we are budget-ing $8.6 million in unrestricted funds foracademic facilities renovation; the MedicalSchool is projecting a transfer to plant of $43.3million; and the School of Engineering and theGraduate School of Business are anticipatingtransfers totalling $4.6 million to plant funds.
■ Net Assets Released from Restrictions: Univer-sity gifts and pledges that contain specificdonor-imposed restrictions preventing theirspending in the current fiscal year are classifiedas temporarily restricted, and are not includedin the Projected Consolidated Budget for Opera-tions. Each year, a portion of funds previouslyclassified as temporarily restricted will becomeavailable for spending as specific restrictions aresatisfied. In 2000/01, we anticipate that schoolsand departments will be able to use approxi-mately $25.0 million of gifts received inprevious years that had been classified astemporarily restricted.
EXPENDITURES (REFER TO TABLE ON PAGE 2)
Academic Salaries
The recommendation for faculty salary increasesis based on a review of data supporting particularrecommendations from each school, internalcomparisons, comparisons with peer universitiesusing data that are publicly available, and consid-eration of available resources. The goal is toset faculty salaries at a level that will maintainStanford’s competitive position both nationallyand internationally for the very best faculty.
The salary program increase in 2000/01 for facultysalaries is 3.5%. We believe that this increase, whenapplied appropriately by deans, will be sufficient tomaintain Stanford’s current competitive position.In addition to the broad-based salary program,additional general funds of approximately 1.0%will be available to address specific retention andcompetitive compensation issues. Furthermore,specific allocations for faculty salary incrementshave been made in the schools of Engineering,H&S, and Law.
While the nominal faculty salary program is plan-ned to be 3.5%, total expenses for academicsalaries and benefits are expected to increase 5.5%in 1999/00. Total expenses for this categoryare driven up by the incremental allocationsmentioned above, some increases in the number offaculty billets, and the slight increase in thebenefits rate. Moreover, tuition allowance forresearch and teaching assistants is included in thisexpense category and is expected to rise with the6.0% growth of tuition. Also included in this lineof the budget are supplemental payments to fac-ulty participating in various housing assistanceprograms.
Staff Salaries
For the past several years Stanford’s aggregate staffsalary program has lagged salary growth in theSilicon Valley employment market where we mustcompete for staff employees. We have barely main-tained our historical mid-market position, and ourcompetitive position has deteriorated. In many jobgroups, and particularly in information technol-ogy, finance, and administrative support positions,we have lost considerable ground to the localmarket. In this Budget Plan we are making aneffort to improve our market position.
The staff salary program for 2000/01 includesgrowth of 3.5% in our cost base, an additionalbroad-based market/equity/retention component,and a restricted, targeted allocation for specificjob groups that lag the market significantly. Weexpect these allocations to prevent the loss offurther ground against the local market. In addi-tion to these salary allocations, there will be an
Financial Overview 9
authorization for units to reallocate budget savingsor other resources to fund additional base increasesup to 2.0% of the continuing salary base and/orone-time, non-base performance bonuses up to2.0% of the continuing salary base of the unit.
Last year we introduced a different approach tosalary management, and we are re-emphasizing theapproach this year. Managers are given salaryallocation guidelines that are flexible in timing andamount, that recognize market forces, but that arealways based on performance.
We have implemented a comprehensive newprogram that provides greater managementflexibility for allocating salary dollars and recog-nizes and rewards quality of performance versusyears of service. The new staff salary program, StaffCompensation @ Stanford, includes broad market-based salary bands and streamlined processes andwill ultimately be supported by a standardizedperformance evaluation system.
Benefits
There are no major programmatic changes oradditions planned for benefits in 2000/01, and theaverage blended fringe rate is expected to increaseby only 0.1%. However, this modest increase in therate belies the fact that the costs of some of ourmajor programs are increasing substantially. Thesecost increases are offset by a corresponding increasein the salary and wage base. Schedule 11 of Appen-dix B highlights the changes by program from1997/98 through 2000/01. Notable changes inspecific benefits costs and the salary and wage baseare described below.
Total pension programs, including retirement,Social Security, and faculty early retirementprograms, are expected to increase by 10.6% in2000/01. These costs represent nearly two-thirdsof the total costs in the benefits pool and are drivenby changes in the regular salary program andemployee headcount throughout the University.The expected increase in the salary and wage basemitigates the impact of these costs on the rate.
Insurance programs are projected to increase13.0% in 2000/01. In particular, medical insurance
costs are expected to rise by 14.5%, reflecting theassumption of a 10.0% increase in premiums forcalendar 2001. Once again, the expected increasein the salary and wage base mitigates the impact ofthese costs on the rate. The cost of Stanford’scontribution to retiree medical insurance isexpected to increase by more than 50.0%, due tothe University’s increased liability for retiree healthcare. These costs comprise only 8.0% of total in-surance costs and therefore do not have a materialeffect on the overall benefits rate.
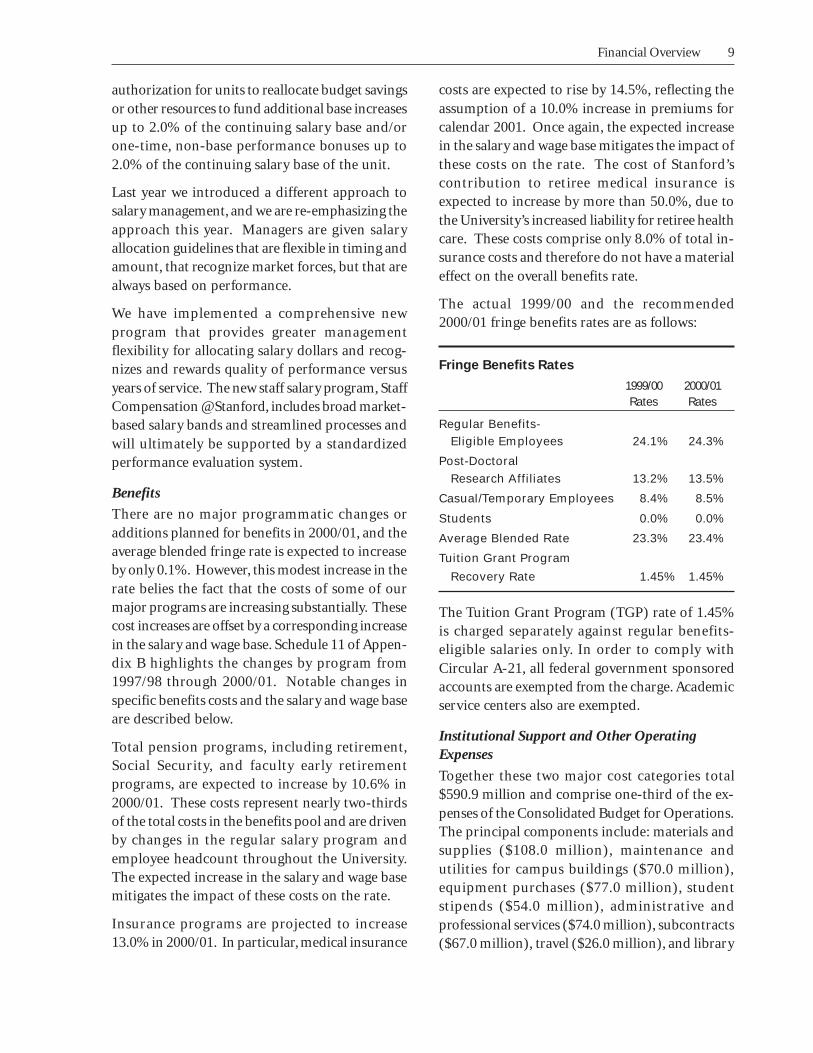
The actual 1999/00 and the recommended2000/01 fringe benefits rates are as follows:
Fringe Benefits Rates
1999/00 2000/01Rates Rates
Regular Benefits-Eligible Employees 24.1% 24.3%
Post-DoctoralResearch Affiliates 13.2% 13.5%
Casual/Temporary Employees 8.4% 8.5%
Students 0.0% 0.0%
Average Blended Rate 23.3% 23.4%
Tuition Grant Program
Recovery Rate 1.45% 1.45%
The Tuition Grant Program (TGP) rate of 1.45%is charged separately against regular benefits-eligible salaries only. In order to comply withCircular A-21, all federal government sponsoredaccounts are exempted from the charge. Academicservice centers also are exempted.
Institutional Support and Other OperatingExpenses
Together these two major cost categories total$590.9 million and comprise one-third of the ex-penses of the Consolidated Budget for Operations.The principal components include: materials andsupplies ($108.0 million), maintenance andutilities for campus buildings ($70.0 million),equipment purchases ($77.0 million), studentstipends ($54.0 million), administrative andprofessional services ($74.0 million), subcontracts($67.0 million), travel ($26.0 million), and library

10 Financial Overview
materials ($17.0 million). A few of these areaswarrant comment here.
Maintenance and Utilities for CampusStructures – The operations and maintenancefor the Stanford campus is a significant expendi-ture at $70.0 million. This amount is impacted notonly by the ongoing costs of these services but bythe renewal and development of the campus. Anincremental $2.9 million is budgeted for the O&Mand utilities associated with the completion of theAlumni Center, CCSR in the Medical School, anda variety of small projects including Jasper Ridge,the library collections storage facility, and variousgrounds infrastructure projects.
Debt Service – The 2000/01 debt service is pro-jected to be $105.2 million. This number reflectsthe total external principal and interest paymentson notes and bonds, exclusive of commercial pa-per. For internal purposes, however, the Univer-sity charges its units for the use of debt accordingto the Debt Policy approved by the Board of Trust-ees in December 1997. Projects are now fundedfrom a central pool of available debt and makepayments amortized over the useful life of theproject based on a single, blended interest rate. The
table below details the different components ofdebt service.
The $105.2 million for total debt service isincluded in the Consolidated Budget for Opera-tions in several categories, depending on thespecific uses of debt and consistent with theUniversity annual financial statements format.Principal payments for academic projects arebudgeted in the Transfer to Plant line and interestpayments are budgeted in the other OperatingExpenses line. Debt service for Auxiliary projectsis budgeted in the Auxiliary Activity line. Debtservice for projects associated with Service Centers,such as utilities and networking, is included in theInstitutional Support line.
Administrative Systems – This Budget Planincludes $31.3 million for administrative systemsreplacement and infrastructure, which is a signifi-cant increase over the expected $19.3 million forsystems replacement in the current year. Theincrease reflects a management decision to accel-erate the timeframe in which these systemsare replaced at Stanford while, at the same time,requiring that implementations allow littlecustomization from standard packages. This
Sources of Funds for Debt Service
(in millions of dollars)
1998/99 1999/00 2000/01Actuals Forecast Budget
Academic Projects (Completed) 17.0 19.1 21.7
Auxiliaries 18.3 20.8 22.1
Service Centers (Utilities/ITSS) 12.6 11.8 11.5
Subtotal Capital Budget 47.9 51.7 55.3
Sand Hill Road Projects 0.4 7.2
Refinancing of Existing Tax Exempt Debt1 17.8 18.4 15.7
Other2 12.4 19.9 27.0
Annual Debt Service Cost
Excluding Commercial Paper 78.1 90.4 105.2
1 The University issues variable rate demand notes to refinance current California Education FacilitiesAuthority (CEFA) principal payments.
2 Includes investment earnings on unused debt, reimbursements by miscellaneous small projects andpayments made through wholly owned real estate investments.

Financial Overview 11
strategy will cost more in each of the next few years,but will reduce the total cost of replacing and up-grading old systems and eliminating our relianceon the mainframe and proprietary software.During 2000/01 we expect to make significantprogress on the implementation of Peoplesoft’sstudent information system (Axess 2000) andhuman resources system. We will complete theextension of the development system to allow forintegration of the Alumni Association and to final-ize arrangements for outsourcing much of ourstudent loan portfolio. Next year’s budget includes$4.0 million for the next several modules of ourOracle financial system. While the funding forthese projects comes from a variety of sources inthe consolidated budget, the expenses are recordedin the Plant Division and are reflected in theinfrastructure section of the Capital Budget.
The Consolidated Budget by Fund Type
GENERAL FUNDS BUDGET
The general funds budget is an important subsetof the Consolidated Budget, because these fundscan be used for any university purpose. The mainsources of general funds are Tuition and Fees,Indirect Cost Recovery, Unrestricted EndowmentIncome, Other Investment Income, and Unre-stricted Gifts. Total general funds revenue isprojected to be $573.6 million in 2000/01. Asshown on page 2 in the Consolidated Budget for
Operations, the general funds budget includes aUniversity Reserve of $10.0 million in 2000/01.This base reserve is a continuation of the reservewe established in the 1996/97 budget. The reserveis the first guard against potential shortfalls in in-direct cost recovery and investment income and isused on a one-time basis to fund a variety of short-term commitments.
2000/01 General Funds Allocations – Theprocess of allocating general funds to non-formulabudget units begins with a forecast of available rev-enue. Then an estimate is made of the 2000/01continuing base budget for each unit, assuminggrowth factors for salaries, student aid, library ac-quisitions, operations and maintenance, and otherexpenses. For the last several years, no growth fac-tor has been applied to general non-salary expense.The estimated 2000/01 continuing base budgetreflects the cost of conducting this year’s businessat next year’s cost. It does not include additionalfunds for innovation. However, the general fundsforecast for 2000/01 allowed for an allocation of$24.7 million in incremental general funds to thenon-formula units above and beyond the fundsneeded for normal inflation of expenses.
After several years of below market staff compen-sation programs, our merit-based program for2000/01 will be stronger and will focus on provid-ing funds for market adjustments and retention.Of the $24.7 million incremental general funds,48.5% was directed to enhance the salary programfor staff, faculty, and teaching and researchassistants. The remaining 51.5% of incrementalgeneral funds were allocated to specific units,after careful consideration of budget proposals, andto cover obligations such as incremental debt ser-vice, operations and maintenance and utilities onnew structures, and investments in technology.The general funds allocations for each unit aredetailed in the table on the next page, and some ofthe incremental allocations are highlighted in thedescription that follows.
■ $1.5 million has been allocated for facultysalary supplements in the schools of Education,Engineering, Humanities and Sciences, and Law.Nearly $1.0 million of this amount is in the
GeneralFunds30%
Designated11%
Restricted12%
Grants &Contracts
34%
Auxiliaries13%
2000/01 Consolidated Expenditures by Fund Type

12 Financial Overview
School of Humanities and Sciences and willaddress a lack of funding associated with billetgrowth in the School.
■ An additional $2.2 million was allocated tothe School of Humanities and Sciences. Of this$1.0 million is earmarked specifically to helpreduce the deficit in unrestricted funds in theschool. The remainder covers a variety ofprograms including the Cantor Center for Visual
Arts, Stanford-in-Washington, Economicsfellowships, and Jasper Ridge.
■ $1.0 million has been allocated to the ViceProvost for Undergraduate Education as part ofthe planned build-up of this area’s base budget.
■ The Law School will receive $500,000 forgeneral support of academic programs, studentservices, and faculty salaries.
Summary of 2000/01 General Funds Allocations (excluding Formula units)
(in thousands of dollars)Incremental Total
Fully Funded Programmatic General FundsAllocation1 Additions2 Allocation
School of Earth Sciences 1,983 1,983
School of Education 7,886 184 8,070
School of Engineering 31,830 133 31,963
School of Humanities and Sciences 80,967 3,240 84,207
School of Law 9,948 504 10,452
Undergraduate Education 6,916 1,000 7,916
Dean of Research 14,328 175 14,503
Hoover Institution 4,128 4,128
Academic Subtotal 157,986 5,236 163,222
Stanford University Libraries 30,422 340 30,762
Student Affairs 32,792 290 33,082
Academic Support Subtotal 63,214 630 63,844
President/Provost 11,395 218 11,613
Development 12,159 803 12,962
Business Affairs 40,756 419 41,175
ITSS 34,381 500 34,881
Land & Buildings 51,907 687 52,594
Debt Service 16,167 900 17,067
Other Administrative Units3 4,804 844 5,648
Central Obligations4 39,033 2,500 41,533
Administrative Subtotal 210,602 6,871 217,473
Total 431,802 12,737 444,539
1 Base general funds allocations support the continuation of ongoing academic and administrative programs and do notinclude any incremental allocations.
2 Incremental Programmatic Additions are funds allocated for implementation of new academic or administrativeprograms which are anticipated to be ongoing, starting in 2000/01
3 Other Administrative Units includes General Counsel, and general funds allocations to SLAC and the Alumni Association.
4 Central Obligations include tuition allowance, the housing allowance program, systems reserve, research supportmitigation, and the university reserve.

Financial Overview 13
■ Over $700,000 has been allocated for technol-ogy across several administrative units. Thisincludes support for the academic technologyspecialist program in the libraries, generaltechnical support in ITSS, and classroom tech-nology in the Vice Provost for Student Affairs.
■ Incremental general funds of $175,000 havebeen allocated to the Office of the Dean ofResearch for administrative support in theIndependent Labs, Centers, and Institutes.
■ Significant general funds have been added to theOffice of Development to augment the budgetfor the Stanford Fund and the President’s Fund,and for increased non-salary expenses due tolarger numbers of donors, gifts, and trusts.
■ Additional allocations to administrative areasinclude $225,000 for the Controller’s office,$744,000 for the Alumni Association for alumnirelations, and a combined $256,000 to theOffices of the President and Provost andGeneral Counsel.
■ New and renovated buildings expected to comeon-line in 2000/01 require incremental generalfunds allocations of $653,000 for utilities andmaintenance and $900,000 for debt service.These amounts are only a subset of the totalcharge resulting from Capital Budget projects assome of the expenses were pre-funded in the2000/01 budget and a portion is paid fromauxiliary, service center, and formula schoolbudgets.
■ $2.5 million has been added to the administra-tive systems reserve, bringing it to a total of $4.7million. This reserve is used to fund the cost ofadministrative systems replacement.
DESIGNATED AND RESTRICTED FUNDS BUDGET
Funds in these budgets are controlled for manage-ment purposes primarily by the schools, depart-ments and programs, and individual facultymembers. Of the total combined revenue of $490.0million, $227.3 million is endowment income and$143.5 million is special program fees, such aspatent and royalty income, corporate affiliates, and
executive education programs. The budgetedexpenses reflect the combined forecasts of theschools. These budgets support faculty salaries andresearch programs, equipment purchases, and avariety of other costs. In addition, designatedfunds will be used in several schools to supportcapital projects.
GRANTS AND CONTRACTS BUDGET
The grants and contracts budget of $585.0 millionrepresents the sum of the direct sponsored activ-ity under the direction of individual faculty prin-cipal investigators ($387.3 million, net of studentaid) and the direct costs for SLAC ($197.7 million).The total for University direct costs builds uponthe projected actuals for the current year. TotalUniversity research volume is expected to grow by4.3% in 2000/01.
AUXILIARIES/OTHER BUDGETS
The principal Auxiliary Operations are Housingand Dining Services (H&DS), Stanford UniversityPress, and Athletics. In addition, the professionalservices arrangements of the Medical School areincluded in this group of budgets, as is the Stan-ford Alumni Association. Each of these operationsis essentially a self-contained financial entitysupporting the broader purposes of the University.As such, these organizations charge both internaland external clients/customers for their servicesand programs. They also pay the University forcentral services provided. Together these activitiesare projecting a deficit of $2.0 million in 2000/01.
Housing and Dining Services – Student Hous-ing and Dining is budgeted for an operatingdeficit of $1.5 million for 2000/01 on revenues inexcess of $81.1 million. Included in this budget areincome and expenses for the 508 graduate studentapartments which will open during the year.
The operating loss will be funded from Housingand Dining Services reserves. It is part of anapproved long term strategy to finance the debtassociated with the Capital Improvement Program(CIP) for renovations of Stanford’s studentresidences. 2000/01 is the 9th year of the 16 yearCIP program. Projects to be initiated and/or

14 Financial Overview
completed during this year include renovations toToyon and Branner Halls and completion of theremodeling of the Stern and Wilbur kitchensand food serveries. In addition, renovations toMirrielees apartments and the renovation andseismic strengthening of the Hoskins Midrise willbe undertaken during this year.
University Dining Services will continue its ValueEnhancement Program which includes improve-ments to facilities, menu, and special events whilemaintaining strong controls on the cost of food andlabor. For the second straight year board rates willnot increase. This effort was critical to the Trusteedecision in February to hold the overall growth rateof room and board to 1.9%.
Athletics – Athletics is projecting a balancedconsolidated budget after a transfer of $636,000 toreduce principal on its outstanding university debt.The budget includes a decrease in football gatereceipts due to a less favorable home schedule.This is offset by an anticipated increase in men’sbasketball ticket income. An incremental contri-bution of $1.3 million from the DAPER Investment
Fund drives an increase in 2000/01 unrestrictedfunds.
Athletics continues to benefit from additionalfinancial aid endowment funds that have beencreated in recent years. This income is necessaryto keep pace with increases in tuition, room, andboard, and the new scholarships that have beenadded in recent years. The total number of fullscholarships increases from 284 in 1999/00 to 297in 2000/01.
Stanford University Press – The Press isprojecting a loss of $306,000 for 2000/01. This lossreflects further erosion of the sale of clothboundmonographic books, which have been the bulk ofthe Press’ publications in past years. The loss alsoreflects the investment in editorial and marketingprograms that will be focused on new subjectareas having greater sales potential, in particularthe continued investment in business, organizationtheory and economics. It is expected that thereturn on these investments will begin to berealized in 2001/02.
Alumni Association – The Alumni Associationwill extend its regional program to engage thealumni more fully in support of undergraduateeducation. To accomplish this goal, the AlumniAssociation plans to enlist leaders in each of themajor regions to serve as ambassadors for Stanford,refine and communicate the levels of serviceprovided to each of the regions as well as thecommitment expected from them, and to developthe tools and training needed for the regional rep-resentatives to succeed. The Alumni Associationalso plans to invest in alumni volunteer relations.The Association plans to increase staff and developan online interactive database that will enablealumni to match their skills and interests withavailable volunteer opportunities. The expansionin these programs in 2000/01 will result in an an-ticipated shortfall of $250,000, which will be cov-ered from operating reserves.
Medical School Professional Services – Thiscategory includes the cost of purchased servicesof physicians and staff by Stanford Hospital and
Total Auxiliary Activity, 2000/01
(in millions of dollars)Excess of
Revenues and Revenues OverTransfers Expenditures Expenditures
Medical SchoolProfessionalServices 97.9 97.9
Housing & DiningServices 82.1 83.6 (1.5)
Athletics1 33.0 33.0
Press 3.6 3.9 (0.3)
Alumni Association 30.3 30.5 (0.2)
Other 12.8 12.8
Total2 259.7 261.7 (2.0)
NOTES:1 Financial Aid activity is not included.
2 This table represents gross revenues and expenditures.When incorporated into the Consolidated Budget on page2, interdepartmental transactions of $32.0 million have beennetted out.
Financial Overview 15
Clinics of $97.9 million. These services includePediatrics, other Children’s Services, and the BloodCenter. Faculty who provide clinical services areat the same time involved in both research andeducation. All academic plans and initiatives areintertwined with the finances of this and otherbudget categories within the School. Nearly 73%of the income and expenses are for faculty orphysician salaries and benefits; another 21% is forstaff support. With the continuation of the newfunds flow approach introduced in 1998/99 and thedissolution of the merger with UCSF part of theway through the current fiscal year, this source offunds to pay faculty compensation continues to beat greater risk than in prior years. The School istaking steps to establish departmental, as well asSchool, contingency reserves that will be necessaryto cover the losses likely to occur in some of thedepartments that have been unable to cover theircosts without subsidies. As Stanford Hospital andClinics is reestablished it will also be necessary toreach agreements on approaches to supportingfaculty or physician compensation throughout thedevelopment of new clinical programs.
The Consolidated Budget by OrganizationalUnit
The table on page 16 shows the ConsolidatedBudget for Operations displayed by organizationalunit. Detailed budgets by unit may be found inAppendix A. A brief discussion of selected budgetsfollows.
Earth Sciences – Earth Sciences maintains ahealthy financial position, despite a continueddecline in general funds support and a decline inaffiliate income. Financial support comes from abroad spectrum of sources: federal grantsand contracts (28%); school endowment (29%);industrial affiliate programs (20%); gifts and othergrants (11%); and university general funds (12%).Expenditures on new faculty, including housingassistance and lab set-up costs, have been high andwill continue to be for the next several years, ascommitments made during recruitment are real-ized. Laboratory renovations continue, and theSchool is able to accommodate the increased need
within existing facilities. Funding for theseexpenses has been earmarked out of existingreserves, and has not impacted the school’s abilityto meet its base budget needs.
School of Education – The School of Educationcontinues to enjoy a sound financial position. Asit has in the past several years, the School expectsto generate a small surplus of $700,000. It willbe combined with existing reserves to support newfaculty, particularly housing assistance, andfunding of new initiatives such as the LearningTechnology Center that the School is currentlyplanning.
Engineering – The financial outlook for theSchool of Engineering continues to be strong. TheSchool is projecting a consolidated budget surplusof $11.7 million, which will result in sizableincreases in faculty reserves and restricted endow-ment. School-controlled reserve funds will alsogrow significantly over the coming year. Thisreserve growth has been planned in anticipation ofseveral new academic programs and pendingmajor capital projects. It is likely that spendingfrom these reserves will be significant in the twoyears following 2000/01.
Humanities and Sciences – H&S consolidatedprojections continue to reflect many of the samefinancial challenges reported last year. Althoughfaculty recruitment activity will decrease from1999/00 levels, there remains a need to recruit arelatively large number of faculty at both seniorand junior levels to maintain departmentalstrength and quality. Recruitment costs remainhigh, particularly in lab sciences. The School willpartner with the Provost and President to coverthese costs. Continued analysis of the School’sfinances has identified structural funding problemsin on-going operational costs. The School plans tocover these costs in the short term through betteruse of its funds and in the long term through de-velopment initiatives.
Consolidated fund balances are projected to growby $6.4 million. It should be noted that thisincrease is the net of continued decreases in fund

16 Financial Overview
Projected Consolidated Budget for Operations by Unit, 2000/01
(in millions of dollars)Total Revenues and Excess of Revenue Over
All Transfers Total Expenditures Expenditures
Academic Units:
School of Earth Sciences 25.3 24.7 0.6School of Education 24.7 24.0 0.7School of Engineering 181.8 170.1 11.7School of Humanities & Sciences1 204.2 197.8 6.4School of Law 32.2 32.0 0.2Undergraduate Education 16.7 17.3 (0.6)Dean of Research 109.7 109.1 0.6Graduate School of Business1 72.7 79.1 (6.4)School of Medicine1 465.2 472.3 (7.1)Hoover Institution 28.4 27.6 0.8
Total Academic Units 1,160.9 1,154.0 6.9
Academic Support Units:
Stanford University Libraries 51.5 51.5Student Affairs 35.8 38.8 (3.0)Learning Technology & Extended Education 18.5 19.3 (0.8)
Total Academic Support Units 105.8 109.6 (3.8)
Total Administrative2 281.6 285.2 (3.6)
Auxiliaries 227.7 229.7 (2.0)SLAC 197.7 197.7Indirect Cost Adjustment3 (120.6) (120.6)Student Financial Aid Adjustment4 (83.6) (83.6)
Grand Total from Units 1,769.5 1,772.0 (2.5)
Other Anticipated Income5 29.8 29.8
Total Consolidated Budget 1,799.3 1,772.0 27.3
NOTES:This budget does not reflect a direct allocation of tuition revenue in those units notoperating under a formula funding arrangement.
1 The budget lines for the School of Medicine, Graduate School of Business, andH&S do not include auxiliary income and expenses. These items are shown inthe Auxiliaries line. These auxiliary operations include Medical SchoolProfessional Services, the Schwab Center of the GSB, and Stanford inWashington and Bing in H&S. These auxiliary revenues and expenses can beseen in more detail in the Schools’ Consolidated Forecasts in Appendix A.
2 The deficit of $3.6 million in the Administrative areas is the net of a transfer tothe plant division for administrative systems replacement and the $10.0 millionuniversity reserve.
3 The academic unit budgets include both direct and indirect sponsored incomeand expenditures. Indirect cost funding passes through the schools and istransferred to the University as expenditures occur. At that point, indirect costrecovery becomes part of unrestricted income for the University. In order not todouble count, indirect cost recovery of $120.6 million received by the Schools istaken out in the “Indirect Cost Adjustment” line.
4 In accordance with the University financial statement format, certain types ofstudent financial aid are shown as negative income against student income inthe Consolidated Budget. Because it appears in the revenue and expense of theacademic units, $83.6 million is removed in the “Student Financial AidAdjustment” line.
5 The $29.8 million shown in Other Anticipated Income is based on historicalexperience and reflects our belief that the University will receive additionalunrestricted and/or restricted income that we cannot specifically identify by unitat this time.
Academic Units 58%
AcademicSupport Units
6%
Auxiliaries12%
SLAC10%
2000/01 Consolidated Expenditures by Unit
Administrative Units14%

Financial Overview 17
balances controlled at the Dean’s Office andsubstantial growth in department and faculty-con-trolled fund balances. Detailed analysis of Schoolfunds and accumulated fund balances continuesin conjunction with University development andlegal staff. Thus far, $4 million in fund balanceshave been identified and used to support the1999/00 operating budget. This project willcontinue through the remainder of the year toidentify additional fund flows and accumulatedbalances that will be used in support of the School.
Law School –The Law School consolidated fore-cast projects additional success in acquiringexpendable gifts to support academic programs,even after the recent end of the Campaign. Esti-mated income closely matches projected expenses.
Dean of Research – The Dean of Research con-solidated budget projects an increase in fund bal-ances of almost $640,000. The strong performanceof the endowment and patent income generated inthe Office of Technology and Licensing (OTL) haveprovided an opportunity to increase reserves. Inaddition, several Stanford Graduate Fellows will beon leave next year, reducing fellowship expenses.
Graduate School of Business – Excluding pro-posed capital/plant projects (“transfers to plant”),the proposed budget for the GSB results in adeficit of about $5.0 million. Critical factors arethe estimated net increase in the number of faculty,new research and course development initiatives,and ongoing investment in technology infrastruc-ture and support. With the conclusion of the verysuccessful 75th anniversary campaign in 1999/00,expendable gifts are assumed to return to histori-cal levels in 2000/01.
When the proposed capital projects and housingloans funded by the school to recruit and retainfaculty are added, the deficit is projected toincrease to $6.4 million. The deficit will be fundedby budget savings and other accumulatedfunds raised recently to provide the Dean withsupport for critical innovative and competitiveinvestments.
School of Medicine – The Consolidated Plan forthe School shows significant growth in expensesand revenue and substantial use of reserves,particularly in support of transfers to plant. TheConsolidated Plan projects revenues and transfersof $465.2 million (excluding professional services),use of reserves of $7.1 million, and total expensesof $472.3 million.
Revenue Growth: The increase in revenues, beforetransfers, over the 1999/00 Consolidated Plan is12.6%. It is related to continuing refinement ofdesignated and restricted income forecasting,anticipated stabilization of funds flows from clini-cal sources, increased investments in programs andnew faculty, and strong growth in sponsoredprojects. Year-end projections for 1999/00 showsponsored activities almost 3.0% higher than the1999/00 Plan and the School’s 2000/01 Consoli-dated Plan anticipates an additional increase ofmore than 8.9%.
Expense Growth: The School expects to recruitapproximately 24 incremental tenure-line facultyand 29 incremental medical center line facultyduring 2000/01. The increase in medical centerline faculty is a direct result of the need to developnew clinical programs in order to revitalize theclinical enterprise. This anticipated increase infaculty and supporting staff, when added to annualsalary increases and changes in benefits rates,accounts for more than 66% of the anticipatedincrease in expenses in the 2000/01 ConsolidatedPlan. Incremental investments in programsinclude approximately $12.6 million to satisfycommitments made to recently appointed depart-ment leaders, approximately $1.6 million foradditional information technology initiatives, and$1.0 million to support the activities of the VicePresident for Medical Affairs.
Use of Reserves: The School plans to use some of itsaccumulated reserves for program developmentand facilities revitalization during 2000/01. Thisis reflected in the transfers from endowmentof approximately $29.5 million as well as thereduction in ending operating equity. During the

18 Financial Overview
current year the facilities master plan to improvecritical education and research space and revital-ize the E.D. Stone buildings (now known as theGALE project) has been more fully developed andthe approach to funding defined. While the major-ity of the project will be funded by gifts, a portionof the support will come from sources held byseveral of the academic departments. In order tomeet this support obligation the departments willneed to liquidate approximately $29.5 million offunds functioning as endowment during the nextyear in addition to using reserves they currentlyhold in the expendable funds pool. In 2000/01,funding the capital budget, planned maintenance,and departmentally initiated and funded projectswill also require debt of approximately $8.3 mil-lion and gifts yet to be raised of approximately$37.3 million.
Vice Provost for Student Affairs – The2000/01 Consolidated Budget for the Vice Provostfor Student Affairs shows an overall decrease infund balances of nearly $3.0 million. This resultsfrom the planned use of $4.3 million of accumu-lated reserves for the replacement of the currentCowell Student Health Center building with a newstructure. Other fund balances will show modestincreases similar to the results of the past severalyears.
IMPACT OF THE CAPITAL BUDGET ONTHE CONSOLIDATED BUDGET FOROPERATIONS
Next year’s Capital Budget calls for $273.9 millionin expenditures on capital projects. The impact ofthese expenditures on the Consolidated Budgetfor Operations is shown in two places. The first is$3.6 million in incremental debt service for thoseprojects that will be coming on-line in 2000/01 orwhich had less than a full year of debt service in1999/00. The second is $2.9 million for the incre-mental operations, maintenance, and utilities costsrequired to run those facilities.
The details of the Capital Budget for 2000/01 areincluded in Section Three of this document.
PROJECTED STATEMENT OF ACTIVITIES
In order to provide a consistent and clear linkagebetween the Consolidated Budget for Operationsand the various annual financial documentspresented to the Stanford Community, we areincluding a projected 2000/01 Statement ofActivities, shown on page 19, that highlights theUniversity’s operations within the total unre-stricted net assets. The Statement of Activities(analogous to a corporate profit/loss statement)is found in the audited annual financial report.In 1996, the University adopted Statement ofFinancial Accounting Standards (SFAS) 116 and117. Under the provisions of SFAS 116 and117, net assets, revenues, expenses, gains, and lossesare classified into one of three categories: Unre-stricted, Temporarily Restricted, and PermanentlyRestricted.
■ Unrestricted Net Assets are expendableresources used to support the University’s coreactivities of teaching and research. Althoughthese net assets are classified as “Unrestricted”under the new accounting standards, they maybe designated by the University for specific pur-poses or be subject to contractual agreementswith external parties or to donors’ restrictions.
■ Temporarily Restricted Net Assets containdonor-imposed restrictions that cannot be metduring the fiscal year in which they are received.
■ Permanently Restricted Net Assets aresubject to donor-imposed restrictions requiringthat the principal be invested in perpetuity. Notethat funds invested in the endowment becauseof a University decision, which are often referredto as funds functioning as endowment, areincluded in Unrestricted Net Assets, and not inPermanently Restricted Net Assets like the pureendowment funds.
Temporarily and Permanently Restricted NetAssets are not reflected in the budget, since theycannot be used for the current year operations.Therefore, the table on page 19 only representsthe operating revenues and expenses in the State-ment of Activities for Unrestricted Net Assets.
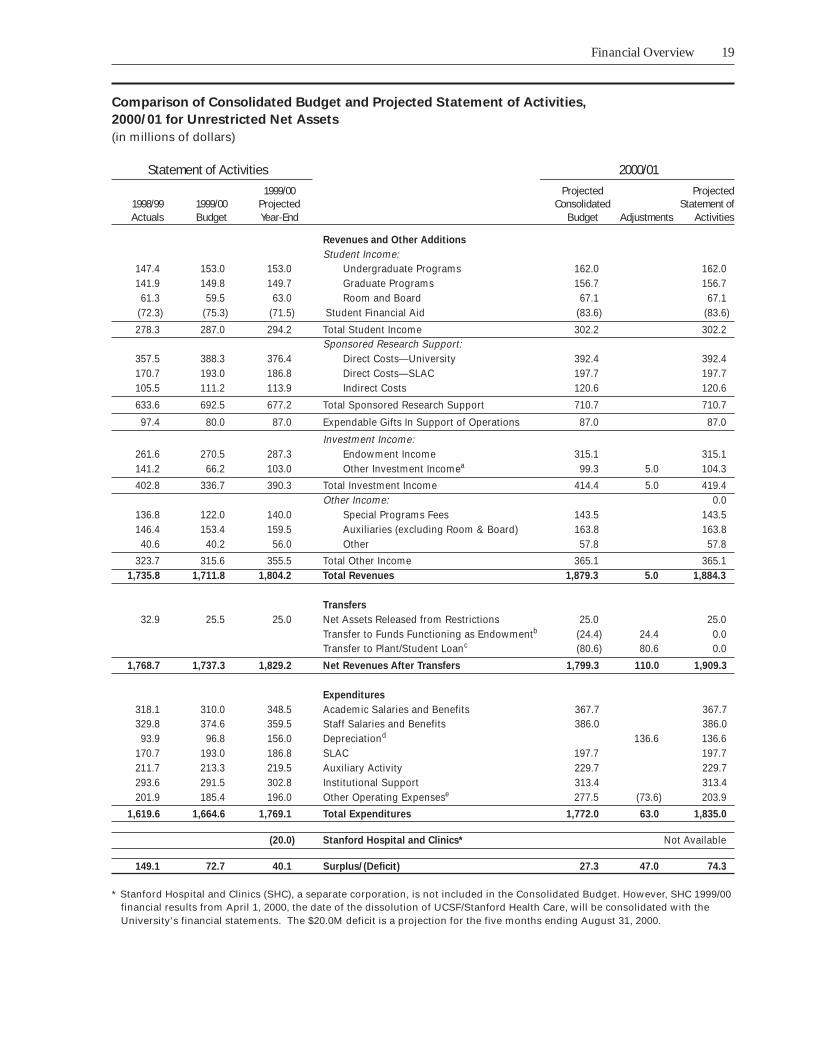
Financial Overview 19
Comparison of Consolidated Budget and Projected Statement of Activities,
2000/01 for Unrestricted Net Assets
(in millions of dollars)
Statement of Activities 2000/011999/00 Projected Projected
1998/99 1999/00 Projected Consolidated Statement ofActuals Budget Year-End Budget Adjustments Activities
Revenues and Other Additions
Student Income:147.4 153.0 153.0 Undergraduate Programs 162.0 162.0141.9 149.8 149.7 Graduate Programs 156.7 156.7
61.3 59.5 63.0 Room and Board 67.1 67.1(72.3) (75.3) (71.5) Student Financial Aid (83.6) (83.6)
278.3 287.0 294.2 Total Student Income 302.2 302.2Sponsored Research Support:
357.5 388.3 376.4 Direct Costs—University 392.4 392.4170.7 193.0 186.8 Direct Costs—SLAC 197.7 197.7105.5 111.2 113.9 Indirect Costs 120.6 120.6
633.6 692.5 677.2 Total Sponsored Research Support 710.7 710.7
97.4 80.0 87.0 Expendable Gifts In Support of Operations 87.0 87.0
Investment Income:261.6 270.5 287.3 Endowment Income 315.1 315.1141.2 66.2 103.0 Other Investment Incomea 99.3 5.0 104.3
402.8 336.7 390.3 Total Investment Income 414.4 5.0 419.4Other Income: 0.0
136.8 122.0 140.0 Special Programs Fees 143.5 143.5146.4 153.4 159.5 Auxiliaries (excluding Room & Board) 163.8 163.8
40.6 40.2 56.0 Other 57.8 57.8
323.7 315.6 355.5 Total Other Income 365.1 365.11,735.8 1,711.8 1,804.2 Total Revenues 1,879.3 5.0 1,884.3
Transfers
32.9 25.5 25.0 Net Assets Released from Restrictions 25.0 25.0Transfer to Funds Functioning as Endowmentb (24.4) 24.4 0.0Transfer to Plant/Student Loanc (80.6) 80.6 0.0
1,768.7 1,737.3 1,829.2 Net Revenues After Transfers 1,799.3 110.0 1,909.3
Expenditures
318.1 310.0 348.5 Academic Salaries and Benefits 367.7 367.7329.8 374.6 359.5 Staff Salaries and Benefits 386.0 386.0
93.9 96.8 156.0 Depreciationd 136.6 136.6170.7 193.0 186.8 SLAC 197.7 197.7211.7 213.3 219.5 Auxiliary Activity 229.7 229.7293.6 291.5 302.8 Institutional Support 313.4 313.4201.9 185.4 196.0 Other Operating Expensese 277.5 (73.6) 203.9
1,619.6 1,664.6 1,769.1 Total Expenditures 1,772.0 63.0 1,835.0
(20.0) Stanford Hospital and Clinics* Not Available
149.1 72.7 40.1 Surplus/(Deficit) 27.3 47.0 74.3
* Stanford Hospital and Clinics (SHC), a separate corporation, is not included in the Consolidated Budget. However, SHC 1999/00financial results from April 1, 2000, the date of the dissolution of UCSF/Stanford Health Care, will be consolidated with theUniversity's financial statements. The $20.0M deficit is a projection for the five months ending August 31, 2000.

20 Financial Overview
Converting the Consolidated Budget into theStatement of Activities
The following key points explain the connectionsbetween the Consolidated Budget for Operationsand the operations component of the Statementof Activities for Unrestricted Net Assets1 . Thereare two main differences between the Statementof Activities and the Consolidated Budget forOperations. First, the Consolidated Budget forOperations reflects only funds used for currentoperations while the Statement of Activities is asummary of all unrestricted net assets, includingcurrent, plant, student loans, and funds function-ing as endowment. Therefore, in the Statement ofActivities, a transfer from current funds to FundsFunctioning as Endowment (FFE) or the plantdivision has a net effect of zero. Second, theConsolidated Budget for Operations is essentiallybuilt on a cash basis, while the Statement of Activi-ties is built on an accrual basis. Therefore, mov-ing from one to the other requires the followingadjustments:
1. Adjustments to Move from Only CurrentFunds2 to All Types of Funds (LetteringBelow, a-e, Refers to Line Items on Page 19):
a) Other Investment Income: This $5.0 millionadjustment represents interest earned by thePlant and Student Loan funds and is added tothe Consolidated Budget investment income toequate to the Statement of Activities.
b) Additions to Funds Functioning as Endowment:The Consolidated Budget for Operationsprojects that the schools will transfer $24.4million to the endowment division, as FFE to beinvested in the merged endowment pool. Asexplained above, endowment division is part oftotal Unrestricted Net Assets, therefore transfersfrom current funds to FFE have a net effect ofzero in the Statement of Activities. To create the
Statement of Activities, these transfers are addedback in.
c) Transfer to Plant/Student Loan: $80.6 million ofcurrent funds are expected to be used to fundcapital expenditures. These amounts are addedback to the Consolidated Budget for the samereason as in b), above.
2. Adjustments To Move From A Cash Basis ToAn Accrual Basis:
d) Depreciation: Depreciation on all non -auxiliarycapital assets is projected at $136.6 million.Because it is a non-cash charge, depreciationexpense is not included in the ConsolidatedBudget for Operations. Therefore, an adjust-ment is made to reflect $136.6 million of depre-ciation in the Statement of Activities. (Auxiliaryasset depreciation is included in the auxiliaryactivity line.)
The significant increase in depreciation expensein the 1999/00 projected year end actual com-pared to budget is due primarily to the adoptionduring 1999/00 of a revised set of estimateduseful lives for the University’s assets. Govern-ment regulations now require that useful livesand methods used for indirect cost recoverypurposes conform to those used in financialstatements.
e) Equipment Expenditures: Of the total capitalasset additions, approximately $73.6 million ofequipment expenditures will be funded fromcurrent operating funds. These expenditures areincluded in other operating expenses in theConsolidated Budget for Operations. For finan-cial statement purposes, these expenditures arecapitalized and are not reflected as expenses inthe Statement of Activities. An adjustment ismade to remove the $73.6 million for equipmentexpenditures from the other operating expensesline.
In summary, the impact of capitalization and theflow of funds for plant purposes described aboveresult in a change in the bottom line of $47.0million, from a $27.3 million surplus in the Con-solidated Budget projection to a $74.3 millionsurplus in the Statement of Activities projection.
1 Certain non-operating components of Unrestricted Net Assets orgains in funds functioning as endowment, are not included in theStatement of Activities on page 19.2 Current funds are resources that are expendable for the primaryinstruction and research mission of the University, within account-ing and donor restrictions, if any. Endowment principal, student loanfunds, and plant funds are not considered Current funds, as they areheld for other specific purposes.
Academic Initiatives and Plans 21
SECTION 2
ACADEMIC INITIATIVES AND PLANS
In this section we focus on the programmaticelements of the Budget Plan by describing theprincipal planning issues in the schools, major labsand institutes, and the academic support areas.
SCHOOL OF EARTH SCIENCES
One of the most significant challenges facing theSchool of Earth Sciences is to develop a new modelfor industry partnerships. For some time, a largeportion of the School’s activities has been fundedout of industrial affiliate income. With theconsolidation of the oil industry the old model ofcooperation no longer seems viable in manyinstances. In these cases, the school is workingwith companies to tailor alliances and researchprojects that capitalize on our research interestsand their specific needs. This will be an evolvingprocess as both the industry and our researchgroups test out these new relationships. TheSchool’s intention is to continue vigorous researchprograms while regaining an income streamthrough these new alliances.
Earth Sciences is completing its first year with afull complement of faculty recruited under theSchool’s Ocean Margins program. Curriculum de-velopment is continuing in this area, with the firstoceans track classes having already been taughtthis year. Much of the curriculum developmentis taking place in cooperation with Stanford’sLearning Lab. The design of several classes iscontingent on a close relationship with HopkinsMarine Station and the Monterey Bay AquariumResearch Institute for both content and presenta-tion. The course sequence will utilize technologyto develop a live video link between these institu-tions, allowing for an innovative delivery of coursematerial and lab exercises. The School has allowed
the Learning Lab to use space in Green EarthSciences as a curriculum development laboratoryfor this particular project. Once the developmentphase has ended, the School plans to convert theserooms into unique classroom space to support theocean margins curriculum.
The Earth Systems Program continues to grow andserve as the School’s major draw of undergradu-ates. With its burgeoning co-terminal masters’program, Earth Systems shows no signs ofslowing. In fact, discussions are well under way todevelop a PhD program within Earth Systems. Ifapproved, we anticipate the first students beingenrolled in the fall of 2002.
SCHOOL OF EDUCATION
The School of Education remains in an intensiveperiod of faculty recruitment that will lead to areplacement of over 50% of the faculty during theperiod 1994/95-2000/01. Six new faculty joinedthe School in 1999/00, and there could be five morenew faculty in 2000/01 if open searches are filled.Faculty searches during 1999/00 include positionsin sociology of education, social studies/civiceducation, child development, and technology andeducation.
Recruitment of faculty in technology andeducation will augment research and developmentin technology-based educational interventionsgrounded in contemporary theories of learning,cognition, and social practice. Once the searchesin technology and education are completed,the School will expand its current program inLearning, Design, and Technology to include adoctoral program. A major task will be to create aLearning Technology Center that incorporates

22 Academic Initiatives and Plans
design components and supports softwaredevelopment and product-oriented research. Thiswill be a multi-year project.
Under the direction of Professor Linda Darling-Hammond, the School continues the redesign ofthe Stanford Teacher Education Program (STEP).Professional Development Schools (PDSs) havebeen established, allowing the School of Educationto make a stronger impact on the teaching andlearning in those schools, but also in many otherBay Area schools linked to them. These PDSspresent an opportunity for local schools andSchool of Education faculty to work collabora-tively on a school reform agenda, to prepare newteachers, and to enhance the capacity of practic-ing teachers. Another part of the “redesign”includes infusing technology into the curriculumof the courses in the teacher education program.With the support of a federal grant, STEP leads aconsortium of schools, colleges and non-profiteducation organizations that will infuse powerfuluses of technology into both the university-basedand school-based curriculum of pre-service teach-ers. Finally, by the end of 2000/01, STEP hopes tohave made some structural changes to encouragemore Stanford undergraduates to enter the teachereducation program.
As an extension of the “Children and Communi-ties” initiative begun in 1998/99, the JohnGardner Center for Youth and Their Communitieswill become a reality in the fall of 2000. This Cen-ter will be a university-community partnership tobuild new practices, knowledge and capacity foryouth development and learning within Bay Areacommunities and Stanford. It will supportcommunity-based efforts to join school reform,youth development, and community developmentinto a cohesive set of arrangements that enhancefuture prospects of youth. The School foreseesmeaningful, long-term engagement by Stanford’sfaculty and students in reconsidering the role ofresearch and professional practices in supportingcommunity collaboration for youth developmentand learning. The Gardner Center will serve asfacilitator, convener, resource, and evaluator,generating reflection, knowledge, documentation,
and analysis for those communities and forStanford.
SCHOOL OF ENGINEERING
There are three areas where new initiatives arebeing explored in the School of Engineering.
■ Biomedical Engineering – The Institute forBiomedical Engineering was launched thisyear with faculty and staff working on pro-gram planning, curriculum development,fundraising, and finance. The immediate chal-lenges are to define the graduate curriculumand to clarify the organizational structure ofthe Institute.
■ Materials – Across the University, there are anumber of related efforts that may representopportunities for Stanford to affect researchand teaching in the materials area. A facultycommittee has been organized to look at theseissues over the coming months and to proposepossible actions.
■ Computational Mathematical Engineering –The School has great strength in computation,and the field has become quite pervasive acrossall of the School’s teaching and researchprograms. Because of the growing importanceof this area, the School is exploring optionsfor formalizing the teaching and researchactivities of this discipline.
The School also continues to develop programsthat encourage undergraduates to consider engi-neering as a field of study. Engineering’s summerprograms, one for entering Stanford students andone for continuing students interested in anundergraduate research experience, have been metwith enthusiasm. Over the past year we have hadtwo pilot programs in the school: one in Civil andEnvironmental Engineering for students seeking towork on research during the academic year and anintensive summer program in Electrical Engineer-ing. The programs have been successful, and theSchool intends to sponsor these programs againand to increase the number of available under-graduate research options.

Academic Initiatives and Plans 23
To support these efforts, the School must haveappropriate teaching and research facilities. Overthe past decade, the School of Engineering com-pleted the first part of an ambitious plan for theconstruction of new facilities and the renewal ofexisting space. Over the next ten years there willbe a second set of construction and renewalprojects designed to build upon what has beenaccomplished.
Over the next several years, Electrical Engineering,Computer Science, Chemical Engineering andBiomedical Engineering will be fully housed in thesame general area, forming one end of the Scienceand Engineering region. These departments andtheir areas of inquiry involve a large number ofEngineering’s faculty and students and representimportant frontiers of new knowledge.
For this reason, the School plans to devote substan-tial resources to the further enhancement of thisregion and its facilities. Most of this developmentwill occur along the western side of the Science andEngineering Quadrangle, along Via Ortega.
SCHOOL OF HUMANITIES AND SCIENCES
Academic planning efforts next year in Humani-ties and Sciences will be focused on several depart-ments that were reviewed by external visitingcommittees this year. These were: the Depart-ments of Applied Physics and Physics, Art andArt History, Economics and the Division of Litera-tures, Cultures and Languages. The latter includedthe review of the Departments of Asian Languages,Comparative Literature, French and Italian,German Studies, Slavic Languages and Literatures,and Spanish and Portuguese. The Language Cen-ter and the Divisional structure were also reviewed.Concurrently, the Dean’s Office will develop along-range School-wide strategic plan that mergesits academic, budget and space planning andprovides a context in which resource allocationdecisions can be made more effectively.
There are a number of significant undergraduateeducation issues that are part of the School’s
overall agenda. In January, an ad hoc AdvisoryCommittee on Interdepartmental Programs (IDPs)was convened to provide guidance to the Deans onthe status of IDPs. The Committee was chargedwith addressing a host of issues, including the ad-vantages and disadvantages of teaching programsoutside of departmental structures, the extentof resources made available to programs, thestrength of ongoing faculty support, and organi-zational structures. The Committee’s report willbe delivered by the end of spring quarter, andthe consideration and implementation of itsrecommendations will be a centerpiece of theSchool’s agenda in 2000/01.
Also new this year is a process that will lead to afull-scale review of all undergraduate and gradu-ate curricula and degree requirements in themajor and minor. Departments are selected fromamong those scheduled for external review by theSchool, and the H&S Curriculum Committeeserves as the reviewing body. Focal points of thereviews are program coherence and rigor, thequality of teaching and advising, and the effective-ness of the learning environment. Because of thesize of the School, H&S plans to complete itsreview of the approximately 55 degree programsover a period of five years.
As in previous years, the President’s Fund and theStanford Fund have provided important seedfunding for pilot projects across the School.Activities that will be launched next year includethe Center for the Study of the Novel, a new inter-disciplinary effort in Asian Religions and Cultures,a study of and mitigation funds for laboratoriesand lab curriculum in the sciences, course devel-opment that will strengthen the global characterof the undergraduate curriculum, and expandedinternship opportunities for the Overseas StudiesProgram. Another new initiative, the StanfordHumanities Lab, will fund pilot projects that arecollaborative in nature, drawing together teamsof senior faculty, advanced undergraduates andpostdocs, as well as museum curators and indi-viduals from area cultural centers and industries.

24 Academic Initiatives and Plans
SCHOOL OF LAW
The Campaign for Stanford Law School closed thisyear, having raised $115 million—$65 millionbeyond the original goal. The Campaign enabledthe School to bring its faculty salaries more in linewith most of our peer institutions, to help fund theestablishment or expansion of several academicprograms, and to increase student aid by 40%.
Despite the success of the Campaign, Stanford LawSchool faces several key challenges. Peer schoolswith greater resources are increasing their effortsto recruit faculty by offering dramatic pay pack-ages. The skyrocketing cost of housing in the BayArea only magnifies this differential. Facultyrecruitment and retention remain the single mostcritical issue facing the School.
The inadequacy of the Law School’s physical plantis also an issue of growing concern. In the 25 yearssince Crown Quadrangle was built, no significanteffort has been made to renovate the facility. Thebuildings are in need of repair and are becomingtechnologically obsolete. The creation and expan-sion of programs such as Law & Economics,Law & Business, Law, Science & Technology,Transnational Business, Environmental Law, andNegotiation and Conflict Resolution have placedgreater demands on space.
Space is likewise an issue for Law students. Thosefortunate enough to be offered campus accommo-dations are housed either in Crothers or scatteredthroughout dorms a considerable distance fromthe School. This situation not only puts the Schoolat a disadvantage with our peer schools, but itdetracts from the lively intense academic environ-ment. The School is optimistic that external fund-ing can be secured for facilities enhancements.
Last spring the Law School created a Dean’sStrategic Council (DSC) to assist planning for itsfuture. This 30 member team represents theSchool’s most trusted and influential advisors. Aparallel faculty, staff and student committee isbeing formed and will work in tandem with theDSC, exploring the most pressing issues facing theSchool and helping to develop plans to addressthose needs.
GRADUATE SCHOOL OF BUSINESS
The School’s single most important goal, and thesingle most critical budget assumption, is recruit-ing and retaining faculty. The proposed budgetassumes a net increase of twelve faculty, withrelated increases in faculty support staff, researchassistants, and housing support. It also assumesretention of key faculty, despite the intense com-petition for outstanding scholars that continuesunabated. Closely related are new faculty-drivenresearch and course development initiatives insocial innovation, e-business/e-commerce, andglobal organizations, as well as increased researchand course development in entrepreneurship,supply chain management, and casewriting.
Over the past year, most of the original GSB-SouthBuilding was renovated and refurbished, improv-ing the look and comfort of student areas and thelocation and workspace of staff. Most of the capi-tal investment proposed for 2000/01 is for ongo-ing upgrades in classroom technology, includingthe first phase of infrastructure and equipmentfor remote videotaping and videoconferencing.Technology investment continues at a high level tosupport teaching, research, and business processes,including creating a web presence.
Earlier this year, Dean Joss commissioned a stra-tegic review of competitors and developments inthe “markets” for management research andeducation to serve as the starting point for explo-ration and then implementation of strategicoptions. With this project still in process, the2000/01 budget does not provide for specificinvestment in initiatives or directions that mightresult from that review; although the significantinvestments in faculty and technology included inthe budget are essential building blocks for thefuture.
In addition, the School will continue to:
■ Pursue alternatives for “globalizing”, includingexperiments with delivering Executive Educa-tion programs in other countries, ongoingstudent study trips, and exploration ofinternational “alliances” in coordination withthe strategic plan.

Academic Initiatives and Plans 25
■ Work closely with UNEXT (and other vendors,as appropriate) to develop course modulesand teaching materials for web-based andother technology-enhanced delivery. Developfaculty workload and compensation policiesthat support participation in GSB-sponsoredactivities, and develop linkages with localcorporate management development needs.
■ Increase the percentage of alumni participa-tion in fundraising from the current approxi-mately 30%, and consider “public relations”strategies for making the GSB look “bigger” inimpact than it is in numbers, including indissemination of faculty research.
The School will also undertake a number of inter-nal initiatives to improve communication andmanagement with and among faculty, staff andstudents. These include improving the admissionsselection processes; improving the annual reviewprocess for senior faculty in particular (to includedevelopment plans and peer review); improvingoverall management of staff, including “userevaluation” in each area that provides service;and improving the diversity of faculty, staff andstudents.
SCHOOL OF MEDICINE
Recruiting and retaining faculty and faculty lead-ers has been and will continue to be a criticalissue facing the Medical School. In 1999/00, theSchool completed the appointment of a new chairin the Department of Anesthesia and expects toappoint a new Dean before the end of the fiscalyear. Investments in programs in Anesthesia, aswell as in Surgery, Pathology, Medicine, Molecu-lar Pharmacology, Neurology and NeurologicalSciences, and Ophthalmology, will continue asrecently appointed chairs realize their facultyrecruitment and program plans.
The completion of the Center for Clinical SciencesResearch (CCSR) has allowed for the recruitmentof some faculty positions that previously remainedvacant due to lack of available research space.However, the cost of housing in the local arearemains a serious problem in recruiting high
quality faculty from other parts of the country andin retaining some of the younger faculty withgrowing families. The relocation and zero-inter-est loan programs have been key elements ofsuccessful recruitment packages.
Research activities in the School continued to growat a substantial rate of more than 9% in direct re-search expenditures during 1998/99. Cumulativegrowth in direct research expenditures in theSchool has exceeded 50% in the five year periodfrom 1994/95 through 1998/99. The School hasaccomplished this remarkable growth whileincreasing research space only 10 percent. Directresearch expenditures during the current year areexpected to exceed those of 1998/99 by approxi-mately 12% and to remain strong in 2000/01.While the opening of CCSR provides almost134,000 square feet of state-of-the-art researchfacilities, it will not provide enough additionalspace to allow the School to vacate research spaceleased off-campus or to house all of the newfaculty and programs currently in planning.
One of the initiatives begun in 1998/99 andgathering momentum in the current year is theredefinition of an appropriate curriculum forstudents in the biomedical sciences to preparethem to be leaders in academic medicine. Facultytask forces are presenting plans regarding theeducational facilities needs and proposed changesto the medical student curriculum for implemen-tation in the fall of 2001. The School anticipatessubstantial progress in this area and in reform ofthe curriculum for graduate students during theupcoming year.
Plans for the necessary revitalization of the E. D.Stone buildings are well underway and specificprograms are being developed. These includemajor changes to the library and teaching space,through replacement of the Edwards Building,which will help position the School to explore theopportunities for educational outreach anddistance learning. The resources to complete thisrevitalization plan have not yet been fully identi-fied and will depend, in large part, on gifts for thispurpose.

26 Academic Initiatives and Plans
During the current year the clinical activities of theSchool are transitioning from the merged enter-prise, UCSF Stanford Health Care, to a new clini-cal enterprise, Stanford Hospital and Clinics(SHC), which includes Lucile Salter PackardChildren’s Hospital. The new entity will be moreclosely linked to the School of Medicine with thecreation of the position of the University’s VicePresident for Medical Affairs who will oversee theactivities of both the Hospitals and the FacultyPractice of the School. This new structure providesfor more physician participation in the manage-ment of the clinical activities and is expected tosupport the growth of new and innovativeprograms that will benefit both the Hospitals andthe School.
The challenges of the current health care marketwill continue to impact the profitability of manyclinical programs, which will make investments innew programs more difficult, and require thatcurrent programs be critically evaluated in termsof their role in the threefold mission of the School.In addition, the resources that will return to SHCwith the dissolution of the merger are less thanthose available before the merger. This will limitSHC’s flexibility and opportunities to invest in newprograms and challenge their ability to continueto provide the support to the academic programsthat has been available in the past.
The School is fortunate to have developed reserves,both centrally and in the departments, but willcontinue to have pressing needs to develop andenhance existing programs and to satisfy commit-ments to department chairs and departmentsaround program support and space. The develop-ment campaign, as well as ongoing income andresponsible use of reserves, should provide theneeded support.
HOOVER INSTITUTION
The Hoover Institution will close its $75 millionfund-raising campaign—Ideas Defining a FreeSociety—successfully this year, raising well inexcess of its stated goal, doubling the donor base,and securing increased, sustained expendable
giving. With the campaign’s completion, theInstitution is financially stable and poised tolaunch new initiatives.
After a number of years of modest growth Hooverplans expansion in a number of areas. The HooverLibrary and Archives will expand their collectingactivities; the Institution will embark on newresearch initiatives and expand the depth andbreadth of existing programs; and disseminationof the Institution’s ideas will be emphasized inthe coming years. Current planning has theInstitution growing by 30 percent between1998/99 and 2003/04.
Library and Archives – The Hoover Library andArchives will continue to acquire material on so-cial, political, and economic change for its six areacollections (Africa, Americas, East Asia,Europe, Middle East, and Russia and the CIS). Inaddition, projects to collect archival and otherspecial materials are under way in three keysubject areas: transition to democracy andeconomic freedom, history of communism in theSoviet Union, and the Islamic movement and itsconflict with the West.
Research – The research program will grow byincreasing the number of resident fellows and byincorporating more affiliated (part-time) fellowsinto the research program. Ongoing institutionalresearch projects, such as the K-12 EducationInitiative, the National Security Initiative, theProperty Rights Initiative, and the Initiative on theEnd of Communism, will be a focus of increasedsupport.
Communications – In addition to its twooutreach vehicles, the Hoover Digest, a quarterlyjournal on research and public policy, andUncommon Knowledge™, a weekly public affairstelevision series, the Institution inaugurateda weekly essays series featuring Hoover fellowswriting short articles for national weekly andmonthly periodicals.
The Hoover Institution Press will increase itspublication output in 2000/01. After publishing sixto eight books a year in the 1990s, the publicationrate will soon increase to twenty-five books a year.

Academic Initiatives and Plans 27
Facilities – A capital project is in progress thatwill recast the bells of the Hoover Tower carillon,add a fourth octave, repair the automatic playmechanism, and build a carillonneur’s playingcabin. This project will be completed by the endof 1999/00.
Securing additional storage for library and archivesmaterial remains a focus of the Institution. By1999/00, storage in the library and archives will bevirtually at full capacity and well in excess of“working” capacity. In addition, ongoing needsinclude a state-of-the art preservation facility,a media reading room to provide access to a grow-ing collection of archival audiovisual holdings, andspace in which additional archival technicalservices staff can catalog the growing collections.
VICE PROVOST AND DEAN OF RESEARCHAND GRADUATE POLICY
The Office of the Vice Provost and Dean ofResearch and Graduate Policy has several impor-tant functions: the development and oversightof research policy, management of the Office ofTechnology Licensing and the EnvironmentalSafety office, oversight of the IndependentLaboratories, Centers, and Institutes, and policydevelopment for Stanford’s graduate educationprogram.
This year Stanford Graduate Fellowship Programreached its goal of awarding 330 fellowships tooutstanding graduate students in science,engineering and the social sciences. In addition,the program supplements the stipend of studentswho come to Stanford with three-year NationalScience Foundation or similar grants. Of thestudents chosen as Stanford Graduate Fellows, 92also earned nationally competitive fellowships andare honored as joint fellows.
The eight Independent Laboratories, Centers, andInstitutes reporting to the Dean of Researchencourage and support Stanford’s openness tointerdisciplinary research and scholarship, andcurrently account for about 40% of the totalnon-Medical School research volume. Of particu-lar note is the new Laboratory for Advanced
Materials, which incorporates the Center forMaterials Research and establishes a home forthe broader materials research on campus. Inaddition, there will be work with the School ofEngineering in development of a new facility forthe Ginzton Laboratory.
Two administrative units now report to the Deanof Research: the Office of Technology Licensing(OTL) and the Environmental Health and SafetyOffice (EH&S). The mission of OTL is to transferStanford technology for public use and benefit andto generate royalty income for research andeducation. OTL’s success in technology transferhas allowed the establishment of 25 StanfordGraduate Fellowships. EH&S has established astable program which devotes its resources to thecontinued support and welfare of the Stanfordcommunity and, especially, its research activities.
VICE PROVOST FOR UNDERGRADUATEEDUCATION
In 1999/00, the Stanford Introductory Studies(SIS) programs of the Office of the Vice Provostfor Undergraduate Education (VPUE) reached fullcapacity after the recent period of rapid growthand expansion.
■ Introduction to the Humanities (IHUM)provided all 1,750 freshmen with the funda-mental challenge of developing their powers oftextual interpretation in response to multiplefaculty perspectives and different disciplinarymethods.
■ Freshman Seminars brought 120 groups of 16or fewer students into close intellectual con-nections with faculty through inquiry-basedclasses that ranged across the spectrum ofknowledge.
■ Over 145 Sophomore Seminars and Sopho-more College classes (maximum enrollment of12) inspired second-year students towarddecisions about their major field of concentra-tion and established important faculty mentorrelationships for potential research experi-ences in subsequent years.

28 Academic Initiatives and Plans
■ Freshman-Sophomore College added a resi-dential dimension to the opportunities forbuilding relationships between faculty andfirst- and second- year students, with over40 faculty meetings over dinner on a regularbasis at the Dean’s House in small groupsselected from the 180 resident students.
■ The Writing and Critical Thinking Programwelcomed its new faculty director to overseeimplementation of reforms in required first-year writing courses and improved coordina-tion with other university writing programs.
■ The Science, Mathematics and EngineeringCore redesigned its program to match facultyresources to student interest.
■ The Large Introductory Course projectenhanced delivery of instruction in calculusand continued support for enhancements ineconomics and chemistry.
Taken together, these SIS programs reached allfreshmen and almost all sophomores, and involvedmore than 300 faculty in teaching first- andsecond-year students, the vast majority in smallclasses.
In 1999/00 Departmental Grants for IndependentStudy and Research expanded from a limitedpilot initiative to become an established feature ofthe VPUE. Over 200 upperclass students are servedby these new initiatives, and many of them willacquire the research skills necessary for undertak-ing an honors project. Some of the fellowshiprecipients will be housed on campus over thesummer in a Summer Research College, buildingon the success of the Honors College in Septem-ber. Together with the residential Honors Collegeserving about 130 students and about 450 studentgrants from Undergraduate Research Opportuni-ties, the Departmental Grants for IndependentStudy and Research have added an importantdimension to the undergraduate experience.
The Budget Plan for 2000/01 aims to sustain thehigh standards of excellence that these vibrantundergraduate programs have achieved andto continue to foster selective innovation. The
budget anticipates a slower rate of growth asappropriate to a steady-state rather thanrapid-growth environment. Priority for VPUEinvestments goes to effective quality control andto new initiatives sparked by the success of pastinnovations.
New for 1999/00 is a comprehensive plan for build-ing a technology infrastructure that promotes twogoals – faculty development and assessment ofundergraduate programs. In response to facultyfeedback, the VPUE will offer technology servicesto professors in support of their SIS courses.Academic Technology Specialists with expertise inpedagogy will help faculty design tools that willallow the best use of valuable in-class time.
Besides support for classroom teaching, additionaltechnology services will enable VPUE programdirectors and managers to assess program qualityand effectiveness. The VPUE will use the findingsto guide the development of new initiatives, toensure the continuous adjustments of the programin response to faculty and student needs.
An example of such a new initiative is the Sopho-more Mentoring program, jointly administered bythe Freshman and Sophomore Programs office andthe Undergraduate Advising Center. In 2000/01,the program will expand from a small pilot to animportant component of sophomore advising.Professors who have taught Freshman Seminars orSophomore College are invited to serve as formalacademic advisors for students who took theircourse. Students are offered the possibility ofswitching from their assigned Freshman Advisorto the new Sophomore Mentor. This program isexpected to match over 200 sophomores to facultyadvisors, many of whom have never previouslyparticipated in pre-major advising. The outcomeis expanded capacity for advising in general andan infusion of senior faculty into mentoring rela-tionships with students in the crucial year of themajor declaration.
For 2000/01 the VPUE budget also supports thealignment of several programs for independentstudy, honors and research into a coherent,progressive set of programs in Stanford Advanced

Academic Initiatives and Plans 29
Studies, following the model of IntroductoryStudies. Closer coordination between the depart-mental grant and the student grant programs isexpected to provide better service to both facultyand students seeking to work together on scholarlyprojects. This organization will also manageStanford’s internal processes for nominatingstudents for national fellowship competitions. TheVPUE has as its goal increasing the number ofsuccessful applications for these prestigious awardsas the undergraduate reforms of the past few yearscreate the conditions for faculty/student relation-ships that lead to more compelling letters ofrecommendation.
Two initiatives in oral communication round outthe new VPUE programs for 2000/01. The first ofthese extends the instruction in oral presentationskills that has been successful for the SophomoreCollege to the residents of the Freshman-Sopho-more College. The second oral communicationinitiative is Speaking Across the Curriculum. Forthis effort, specialists in rhetoric and oral commu-nication will work with faculty on adding an oralcomponent to their course requirements and withstudents on preparation for the formal presenta-tion. The Center for Teaching and Learning directsthese initiatives, working in close collaborationwith Freshman and Sophomore Programs andwith the required Writing in the Major program.
STANFORD UNIVERSITY LIBRARIES ANDACADEMIC INFORMATION RESOURCES
During 2000/01 Stanford University Libraries andAcademic Information Resources (SUL/AIR) willattempt to scale up dramatically its digital libraryprograms adding to the current distributed arrayof services capacities for: overall coordination andstrategic planning; meta-data creation, enhance-ment, and management; digital asset managementand preservation; and continuing developmentand/or acquisition of web-based user interfacesand manipulation tools. In addition, SUL/AIR willbe acquiring more information and knowledgesources in digital form through its collectiondevelopment programs.
Substantial progress will be made in 2000/01 on aremote storage facility. We expect that a site willbe chosen before the end of the current fiscal yearand construction substantially underway next yearwith occupancy in 2001/02.
During 2000/01 SUL/AIR and its advisory groupsand constituencies will complete and bringforward for Provostial and Presidential review amaster plan for the library facilities it operates oncampus. While reconstruction and activation ofthe Bing Wing of the Green Library has absorbedour attention for a decade, the remaining 12on-campus facilities operated by SUL/AIR haveaged and, in most cases, adapted inadequately tothe new technologies.
Recruitment and retention of specialized staff havebecome a major challenge. Local housing priceshave made it difficult to recruit librarians andinformation specialists. Silicon Valley firms arehiring away information technology staff, espe-cially key middle managers. Even without thesechallenges it is simply difficult to find high-level,accomplished subject and technical specialiststo continue to serve the varied Stanford researchprograms.
SUL/AIR is expanding the 24 hour reading roomin Meyer Library by incorporating more space andinstalling desktop computers (Macintosh, Wintel,and Unix). One-time funding for this was awardedby the Provost in the 2000/01 budget; continuingthis funding as base presumably will be based onoccupancy rates during the year.
LEARNING TECHNOLOGY & EXTENDEDEDUCATION
The Internet and other new forms of technologyare bringing about significant changes in almostevery aspect of society. Stanford, like manyuniversities and colleges, is working to anticipatethese changes and to take advantage of new oppor-tunities to improve and expand programs throughthe use of technology. During the past year wehave created a new organization, Learning Tech-nologies and Extended Education (LT/EE), to

30 Academic Initiatives and Plans
focus greater attention on the uses of technologyin both traditional and new educational programs.
Stanford has a long history of leadership in usingtechnology for teaching and learning. For overthirty years, the School of Engineering has beenmaking regular Stanford courses available tostudents in remote locations using television,videotapes and other media. Today, the StanfordCenter for Professional Development (SCPD)offers more than 250 courses per year over televi-sion and the Internet, including courses that leadto a fully online master’s degree in ElectricalEngineering.
The Educational Program for Gifted Youth(EPGY) is another long-standing example ofusing technology to expand Stanford’s program-matic reach. EPGY provides instruction in math,science and language skills to advanced students inprimary and secondary schools as a supplement totheir regular studies. Courses are delivered byCD-ROM, with access to Stanford-based tutors viatelephone and the internet.
These pioneering programs have allowed us tobegin to adapt quickly to the rise of “distancelearning” as a major force on the educational land-scape. Stanford has a large base of people andresources on which to build new programs usingmore advanced technologies.
LT/EE brings together both campus-basedcontinuing education (The Continuing StudiesProgram, Continuing Medical Education, Profes-sional Education programs) and technology-baseddistance learning programs such as SCPD and theStanford Channel. On a combined basis, theseprograms serve more than 15,000 registrants peryear and produce gross revenues of more than $35million. We will expand from that base by creat-ing a more effective infrastructure to produce anddistribute programs. For example, we are presentlyworking with the School of Medicine on a seriesof internet-based continuing medical educationprograms. We are also developing distancelearning programs in areas ranging from Classicsto International Studies.
Part of the strategy for distance learning willinclude partnerships with outside entities that canadd to our production and distribution resources.We have concluded one such partnership withUnext.com, a start-up company that will developbusiness and management courses in conjunctionwith leading universities such as Stanford, Colum-bia and the University of Chicago. We have alsoannounced plans for a new alliance with Princetonand Yale universities to develop and distribute dis-tance learning programs for our collective alumni.
Technology provides opportunities not only toexpand, but also to improve our traditionaleducational programs. The Stanford Learning Lab,now in its third year of operation, is a center forexperimenting with technology in traditionalStanford courses. We have worked extensively inareas such as Human Biology, Earth Systems andOverseas Studies to develop new approaches toteaching which maximize the value of technologyin the classroom. The goal is both to deploy andto carefully assess the impact of technology as partof the learning process. The Learning Lab is thecenter of a growing local and international com-munity of scholars interested in these issues.Fifteen Stanford faculty members are formalmembers of the Lab, representing disciplinesranging from Chemistry to Education. In addi-tion, through a grant from the WallenbergFoundation in Sweden, the Lab is at the center ofthe Wallenberg Global Learning Network, aconsortium of learning labs at universities inSweden, Norway, Germany and Japan.
To be successful, LT/EE must adopt many of thecharacteristics of the new internet economy:flexibility, speed, and an openness to collaborationand innovation. Stanford begins from a positionof leadership in this area, and we are well posi-tioned to continue to set standards for the qualityand scope of technology-based education.
STANFORD LINEAR ACCELERATORCENTER (SLAC)
The total budget for the high energy physicsprogram at SLAC is expected to be relatively flat
Academic Initiatives and Plans 31
in the current year, but growing program needs callfor an increase in the future. Significant growth isexpected at the Stanford Synchrotron RadiationLaboratory (SSRL). The SSRL budgetary increaseis primarily associated with the project SPEAR3which upgrades the synchrotron radiation facility,SPEAR. In parallel to the SPEAR3 upgrade, thereis a multi-year program to upgrade the SPEARbeam lines in order to benefit from the increasedbeam power available with SPEAR3. Joint fund-ing for this project is being provided by NIH andDOE.
The other major initiative of SSRL is the R&Dprogram for an x-ray free-electron laser called theLinac Coherent Light Source (LCLS), which uti-lizes the last third of the linear accelerator. It is amulti-institution collaboration which includesfour other DOE national laboratories and UCLA.We hope to have DOE approval to proceed to theconceptual design phase this fall and to submit aproposal for construction starting in 2002/03.
Several interesting projects are underway in thehigh energy physics program. The National Aero-nautics and Space Administration (NASA) hasrecently approved the Stanford proposal for theLarge Area Telescope (LAT) investigation on theGamma-Ray Large Area Space Telescope (GLAST)mission, planned for launch in 2005. The LATproject is an international collaborative effort of
the Stanford team (SLAC, Physics Department andHEPL) with several other institutions. The fund-ing for the U.S. effort comes from NASA and DOE.
The PEP-II B Factory turn-on has been a greattechnical success. With the B Factory producingdata at a very substantial rate, a critical increase incomputing resources is needed to accommodatethe anticipated data rates. Accelerator improve-ments are required to further increase operatingefficiency and luminosity.
Another key element in the high energy physicsprogram is an extensive R&D effort aimed at theeventual construction of a large electron-positronlinear collider (NLC) which will make possibleunique experimental investigations at the TeVenergy scale. The NLC R&D program is beingcarried out in close collaboration with SLAC’ssister lab KEK (Japan’s National Laboratory forHigh Energy Physics) and three other DOENational Laboratories.
For many years SLAC has requested increasedfunding from DOE for infrastructure support.Aside from addressing the routine programmaticor ES&H infrastructure requirements, SLAC needsto complete the replacement of 35 year-old equip-ment and utility systems, and to finish a seismicupgrade program for the many buildings andstructures on site.

32 Academic Initiatives and Plans

Capital Budget 35
SECTION 3
1999/00 CAPITAL BUDGET
INTRODUCTION
The 1999/00 Capital Budget is produced in thecontext of a three-year Capital Plan. TheCapital Plan represents the ongoing efforts ofthe University to restore, maintain, and improvecampus facilities for teaching, research, andrelated activities. It encompasses projects thatwill begin between 1999/00 and 2001/02. TheStanford campus is a unique resource thathelps shape and define much of University life.Our principal goals in capital planning are toprotect and extend the useful life of existingfacilities; create appropriate new facilities, wherenecessary, to support the work of faculty,students, and staff; and integrate facilities andsupport systems into a coherent, effective, andattractive campus.
As Stanford’s academic programs evolve,demands for new and improved facilitiescontinually arise. Proposals for new capitalprojects come into the planning process in avariety of ways. Many are developed as part ofon-going maintenance and enhancementprograms. Other projects arise because of issuesrelating to new building codes or changes of use.Still other projects develop out of new program-matic initiatives of the faculty and, occasionally,the interest of donors.
Institutional Needs
Among the issues that dominate capitalplanning in the coming years are the needfor new and improved technical facilities forscientific and medical research, the requirementby Santa Clara County to complete seismiccompliance of unreinforced masonry (URM)buildings by 1999/00, and the high demand for
graduate student housing. These academic andinstitutional needs must be met for Stanford toremain at the forefront of teaching and research,as detailed below.
NEW AND IMPROVED SCIENCE RESEARCH AND TEACH-ING FACILITIES – Stanford’s academic excellencestems, in part, from the new and improvedtechnical research and teaching facilities that arebuilt in response to evolving faculty initiatives.The three-year Capital Plan includes severalcapital projects related to changing and growingprograms, as well as innovations in scientificand medical research methods.
The Bio-X Project will foster the integration ofleading-edge research in basic, applied, andclinical sciences, while enhancing collaborationamong researchers from the schools of Humani-ties and Sciences, Engineering, and Medicine.Additionally, the Mechanical EngineeringDepartment Project and the Chem/Bio Projectwill provide facilities for intensive research tobe conducted in class H-8 level environments.Both of these projects will be financedprimarily by University debt and gifts andwill provide additional program space for theMechanical Engineering, Chemistry, andBiology Departments.
As a result of changes in curriculum andeducational models, several teaching facilitiesand laboratories in the School of Medicinehave become outdated for their principalfunction or have reached the end of theircurrent life. The Grant, Alway, Lane andEdwards (GALE) projects propose to renovateseveral laboratories, provide enhanced teachingand student library facilities, and improveadministrative space in the School of Medicine.

36 Capital Budget
These renovations will extend the useful livesof the oldest buildings in the Medical Centercomplex.
SEISMIC COMPLIANCE – In accordance with ouragreement with Santa Clara County followingthe 1989 Loma Prieta earthquake, Stanfordplans to retrofit or vacate all unreinforcedmasonry (URM) buildings by 1999/00. TheCapital Plan includes several seismic renova-tions, including the Art Gallery, Building 360,Building 160, and the Bakewell Building.
DEMAND FOR HOUSING – The high cost of housingin the Bay Area has created substantial problemsfor the University’s graduate students, post-doctoral students, medical residents, and facultymembers. In the Capital Plan, the EscondidoVillage Housing Project will provide 508 addi-tional graduate student housing units on whichconstruction will begin this year. With anadditional 231,776 square feet of housing units,this project utilizes a major portion of theremaining development capacity permitted bySanta Clara County.
Constraints
The Capital Plan reflects careful balancing ofthese needs within the constraining factorsof limited entitlements, debt capacity, andaffordability.
ENTITLEMENTS – Limitations on new developmenton Stanford’s campus were established by SantaClara County in 1989 under the General UsePermit (GUP). The GUP governs the extent towhich Stanford is entitled to build on campus(measured by additional gross square footage)and to add to its daily population (students,faculty, staff, visitors, etc.). The three-yearCapital Plan fully allocates the remaining474,000 permitted additional gross square feet.Negotiations with Santa Clara County and theCity of Palo Alto are currently underway toallow for the construction of future facilitiesafter the present GUP expires.
DEBT CAPACITY – The Board of Trustees limits theUniversity’s overall annual debt level. The Debt
Policy limits the debt to an amount which is thelesser of: 1) a total debt level up to 20% of theUnrestricted and Temporarily Restricted NetAssets, or 2) a total debt level on which interestpayments are less than 5% of Total Revenue.Because the bond markets are in a period ofhistorically low interest rates and because of theeconomies of scale of large bond offerings,management has anticipated the need for debtby issuing bonds for academic capital projectsand the Sand Hill Road project. Managementestimates that the first Debt Policy limitdescribed above could be a constraint in1999/00 and is monitoring the limit closely.
In addition to the overall debt limits, the DebtPolicy imposes an internal constraint, formanagement purposes, on the level of internaldebt service repayments on academic capitalprojects (exclusive of SLAC, auxiliaries andservice centers) to 5.0% of unrestricted revenues(i.e., general funds revenues plus designatedrevenues). For 1999/00, these internal repay-ments for debt service on academic projectswill be $21.7 million, including debt serviceon commercial paper. This equals 3.1% ofunrestricted revenues. The proposed three-yearplan includes $134.0 million of debt to pay foracademic projects. At the substantial completionof the proposed three-year plan, these internalrepayments of debt service will be $33.2 million,or 4.2% of unrestricted funds. The impact ofthis internal constraint is that the University willhave approximately $77 million in remainingdebt capacity for projects supported by centralfunds after funding the three-year Capital Plan.Over time, additional capacity will be developedas debt is paid down and unrestricted fundsincrease. The three-year Capital Plan is theresult of management’s efforts to balance theneed for new facilities with available debtcapacity.
AFFORDABILITY – The debt service on projectsfinanced by debt and the operations, mainte-nance and utility costs (O&M) on capitalprojects are expenditures partially paid for bythe general funds of the University. Capital-

Capital Budget 37
related costs compete directly for this limitedresource against academic program initiatives.The additional debt service costs expected foracademic projects in 1999/00 are $3.2 million,and the additional continuing debt service costsexpected at the completion of the three-yearplan are $10.7 million. These costs are borneby the unrestricted budget. (Total debt service,including auxiliaries and service centers,will increase $5.9 million in 1999/00.) Theadditional O&M costs expected for 1999/00 are$2.7 million, and the additional continuingO&M costs expected for the three-year plan are$13.2 million. An assessment of the financialimpact of all capital projects is performedto ensure affordability in relation to theavailable general funds of the University.
CAPITAL PROGRAM FINANCING
The 1999/00 Capital Budget totals $300.6million. The tables on pages 38-40 detail allcapital projects and infrastructure programsalong with their total project costs, projectschedule, and projected 1999/00 expenditures.
The first table, “1999/00 Capital Budget Pro-jected Expenditures and Sources of Funds,”details the sources of funds for the 1999/00expenditures for these projects and programsand the amount of University debt financing
($42.0 million) needed to fund the balance.Construction financing is used to cover the debtportion until the project is complete. At comple-tion, the project is financed with long-term debt.
The tables on pages 41-42 refer to the Three-year Capital Plan. They show those capitalprojects anticipated over the next several yearsalong with anticipated funding sources. Thetables also include the budget impact of thislong-range plan on both University debt serviceand O&M costs. The projects are divided intothree major categories: Projects in Design &Construction ($341.3 million), capital projectsrelated to the University’s InfrastructurePrograms ($104.9 million), and PlannedConstruction Projects ($393.8 million), for atotal three-year Capital Plan of $840 million.
Total Investment in Plant (refer to graph below)
We are often asked how much we are investingin the plant relative to how much would berequired on a replacement cost basis. Deprecia-tion charges in our financial statements arebased on the historical cost of the asset and usethe average life of a broad class of assets. Wehave developed a proxy for the annual replace-ment charge based on a combination of marketvalues for each asset, and depreciation scheduleswhich reflect the useful life of each type offacility.
350
300
250
200
150
100
50
01999/00
(mill
ion
s o
f d
olla
rs)
2000/01
Fiscal Year
2001/02
Added Space
Renovations
Annual ReplacementCost Charge
Three-Year Capital PlanAnnual Investment in Plant Assets vs. Annual Replacement Cost Charge

38 Capital Budget
1999/00 Capital Budget Projected Expenditures and Sources of Funds
(in millions)
Estimated ProjectedProject Project 1999/00
Expenditures Schedule Cost Expenditures
Projects in Design and Construction
Aquatics Complex - Phase I 1999-00 $12.5 $10.0
Art Gallery Seismic Renovation 1999-01 7.5 5.0
Building 360 Seismic & West Gate Renovation 1998-00 4.0 4.0
Center for Clinical Science Research (CCSR) 1996-00 108.7 40.7
CIP Program Year 7 under $3 million 1999 1.7 1.7
Encina Central/IIS Consolidation 1999-00 6.0 0.3
Escondido Village Graduate Housing - Phase I 1999-00 67.5 40.0
Escondido Village Renovations - CIP Program Year 7 1999 5.7 5.0
Graduate School of Business - Main (Bldg. 350) 1999-00 16.5 0.1
Lake Houses Renovations - CIP Program Year 7 1999 10.5 1.0
McCullough Annex 1996-00 27.0 4.0
Mechanical Engineering Dept. Laboratory 1999-03 33.5 4.0
Mudd Chemistry Interim Upgrade 1999 2.2
Athletics Boathouse 1999-00 5.0 3.0
Stanford Alumni Center/Office of Development 1998-01 33.0 20.0
Subtotal-Projects in Design and Construction 341.3 138.8
Infrastructure Programs 2000-02 104.9 39.7
(See Table on page 39)
Planned Construction Projects 1998-03 393.8 122.1
(See Table on page 40)
Total Capital Budget $ 840.0 $ 300.6
Sources of Funds
Current Funds and Reserves $ 130.0
Gifts 56.0
Debt
Auxiliaries/Service Centers 72.6
University 42.0
Total Sources of Funds $ 300.6
In 1999/00, the estimated annual replacementcost is $119 million compared to an annualinvestment in facilities of $300 million. Thisinvestment in plant includes the work funded
through the Capital Budget, as well as theongoing and planned maintenance costs in theConsolidated Budget for Operations.

Capital Budget 39
1999/00 Capital Budget Projected Expenditures - Infrastructure Program Detail
(in millions)
Estimated ProjectedProject Project 1999/00
Infrastructure Programs Schedule Cost Expenditures
Capital Utilities Program (CUP)
Wear-Out 2000-02 $ 11.2 $ 2.9
Controls 2000-02 2.9 1.3
System Expansion 2000-02 12.6 8.3
Regulatory 2000-02 1.7 0.7
Subtotal-CUP 28.4 13.2
Systems
Applications 2000-02 15.0 8.1
Infrastructure 2000-02 4.5 1.5
Communications Facilities 2000-02 10.9 3.5
Subtotal-Systems 30.4 13.1
Compliance and Other
ADA Upgrades 2000-02 6.0 2.0
Emergency Generators 1999-02 2.8 0.7
Stores Renovation 2000 2.2 2.2
Storm Drains 1999-00 1.5 0.5
Subtotal-Compliance and Other 12.5 5.4
Stanford Infrastructure Program (SIP)
Campus Landscaping and Planning Projects
Circulation Projects 2000-02 8.0 3.9
Landscape Projects 2000-02 5.2 2.1
Outdoor Lighting Systems 2000-02 0.2 0.2
Outdoor Art Program 2000-02 0.1 0.1
Subtotal-Campus Landscaping and Planning Projects 13.5 6.3
Parking and Transportation Services
Parking System 2000-02 18.1 1.7
Transit Related 2000-02 2.0 0.0
Subtotal-Parking and Transportation Services 20.1 1.7
Subtotal-SIP 33.6 8.0
Total Infrastructure Programs $ 104.9 $ 39.7

40 Capital Budget
1999/00 Capital Budget Projected Expenditures - Planned Construction Projects Detail
(in millions)
Estimated ProjectedProject Project 1999/00
Expenditures Schedule Cost Expenditures
Planned Construction Projects1
Aquatics Complex - Phase II 2000-01 $ 3.3
Bakewell Seismic Renovation and CPPC Demolition 2001-03 5.0
Bio-X - Phase I 1999-02 110.0 0.3
Branner Seismic Renovation - CIP Program Year 9 2001 8.0
Bridge Demolition 2001 1.0
Building 160 Seismic Upgrade & TI’s (Learning Lab) 1999-03 25.0 5.0
CCSR Core Labs Buildout 2000 3.0 2.8
Chem/Bio - Phase I 1999-01 30.0 5.0
CIP Program Year 8 under $3 million 2000 2.1
CIP Program Year 9 under $3 million 2001 1.7
Cowell Health Center Seismic Renovation 2000-02 7.0 1.0
Encina Gymnasium Renovation 2000-02 12.0 3.0
Encina West - Poli Sci Renovations 1999-00 5.0 5.0
Escondido Village Renovations - CIP Program Year 8 2000 6.0
Escondido Village Renovations - CIP Program Year 9 2001 6.0
Grant/Alway/Lane/Edwards Renovations 2001-03 135.0 79.0
High Wire Press Relocation (off-site) 2000-02 9.0 4.0
HRP Anatomy Wings Demolition 2001 2.0
Jasper Ridge 2000-01 5.0 1.0
Knoll Seismic Renovation 2000-02 8.0 1.5
Lab Renovations 2000-01 5.0 5.0
Library Collections Storage 1999-00 9.3 7.0
Old Chem Building Demolition 2000 3.0 0.5
Stern Kitchen Consolidation - CIP Program Year 9 2001 4.0
Tower House Renovation and Bing Nursery School 2000-02 2.0 2.0
Toyon/Branner Dining Halls Upgrade-CIP Program Year 9 2001 2.5
Toyon Eating Clubs Demolition 2001 1.0
Toyon Eating Clubs Replacement - CIP Program Year 9 2001 2.5
Toyon Seismic Renovation - CIP Program Year 8 2000 9.0 4.0
Wilbur Kitchen Consolidation - CIP Program Year 8 2000 4.0 4.0
Wilbur Modulars Removal 2001 1.0
Less: Stanford Infrastructure Surcharge2 (33.6) (8.0)
Total Planned Construction Projects $ 393.8 $ 122.1
1 These projects are in various stages of planning. Scope, schedule, and estimates may be revised. These projects areall subject to funding approval.
2 Represents 9% surcharge on capital projects. See Infrastructure Programs for project expenditures.

Capital Budget 41
Three-Year Capital Plan Detail, 1999/00 - 2001/02
(dollars in millions)
Project Funding Source Annual Continuing CostsProject Estimated Current Serv Ctr/Aux University University Operations &
Construction Plan Schedule Project Cost Funds1 Gifts2 Debt Debt Debt Service MaintenanceProjects in Design and ConstructionAquatics Complex - Phase I 1999-00 12.5 3.5 9.0 0.5Art Gallery Seismic Renovation 1999-01 7.5 1.5 6.0 0.5Building 360 Seismic & West Gate Renovation 1998-00 4.0 4.0 0.4Center for Clinical Science Research (CCSR) 1996-00 108.7 22.6 76.1 10.0 0.8 3.4CIP Program Year 7 under $3 million 1999 1.7 1.7Encina Central/IIS Consolidation 1999-00 6.0 5.0 1.0Escondido Village Graduate Housing - Phase I 1999-00 67.5 67.5 0.3Escondido Village Renovations - CIP Program Year 7 1999 5.7 5.7Graduate School of Business - Main (Bldg. 350) 1999-00 16.5 16.5Lake Houses Renovations - CIP Program Year 7 1999 10.5 10.5McCullough Annex 1996-00 27.0 20.8 6.2 1.2Mechanical Engineering Dept. Laboratory 1999-03 33.5 0.5 15.0 18.0 1.4 0.6Mudd Chemistry Interim Upgrade 1999 2.2 2.2 0.2Athletics Boathouse 1999-00 5.0 5.0 0.2Stanford Alumni Center/Office of Development 1998-01 33.0 3.0 30.0 0.9
Subtotal 341.3 52.6 151.9 90.4 46.4 3.3 7.1
Planned Construction Projects
Aquatics Complex - Phase II 2000-01 3.3 1.5 1.8Bakewell Seismic Renovation and CPPC Demolition 2001-03 5.0 5.0 0.4Bio-X - Phase I 1999-02 110.0 110.0 3.6Branner Seismic Renovation - CIP Program Year 9 2001 8.0 8.0Bridge Demolition 2001 1.0 1.0Building 160 Seismic Upgrade & TI’s (Learning Lab) 1999-03 25.0 15.0 10.0 0.9CCSR Core Labs Buildout 2000 3.0 3.0 0.1Chem/Bio - Phase I 1999-01 30.0 10.0 20.0 1.5 1.4CIP Program Year 8 under $3 million 2000 2.1 2.1CIP Program Year 9 under $3 million 2001 1.7 1.7Cowell Health Center Seismic Renovation 2000-02 7.0 4.0 3.0Encina Gymnasium Renovation 2000-02 12.0 12.0Encina West - Poli Sci Renovations 1999-00 5.0 5.0Escondido Village Renovations - CIP Program Year 8 2000 6.0 6.0Escondido Village Renovations - CIP Program Year 9 2001 6.0 6.0Grant/Alway/Lane/Edwards Renovations 2001-03 135.0 95.0 40.0 3.6 0.3High Wire Press Relocation (off-site) 2000-02 9.0 9.0HRP Anatomy Wings Demolition 2001 2.0 2.0Jasper Ridge 2000-01 5.0 5.0 0.1Knoll Seismic Renovation 2000-02 8.0 8.0Lab Renovations 2000-01 5.0 5.0Library Collections Storage 1999-00 9.3 9.3 0.2Old Chem Building Demolition 2000 3.0 3.0Stern Kitchen Consolidation - CIP Program Year 9 2001 4.0 4.0Tower House Renovation and Bing Nursery School 2000-02 2.0 2.0Toyon/Branner Dining Halls Upgrade-CIP Program Yr 9 2001 2.5 2.5Toyon Eating Clubs Demolition 2001 1.0 1.0Toyon Eating Clubs Replacement-CIP Program Yr 9 2001 2.5 2.5Toyon Seismic Renovation - CIP Program Year 8 2000 9.0 9.0Wilbur Kitchen Consolidation - CIP Program Year 8 2000 4.0 4.0Wilbur Modulars Removal 2001 1.0 1.0Less: Stanford Infrastructure Surcharge3 (33.6) (33.6)Subtotal 393.8 106.2 163.8 48.8 75.0 6.4 5.7
Total Construction Plan 735.1 158.8 315.7 139.2 121.4 9.7 12.8
Infrastructure Programs (See Table on page 42) 2000-02 104.9 55.3 6.0 31.0 12.6 1.0 0.4
Total Three-Year Capital Plan 840.0 214.1 321.7 170.2 134.0 10.7 13.2
1 Includes funds from University and school reserves, and the Stanford Infrastructure Program.2 Includes gifts that have been identified, pledged and those gifts to be raised.3 Represents 9% surcharge on capital projects. See Infrastructure Programs for project expenditures.

42 Capital Budget
Three-Year Capital Plan Detail for Infrastructure Programs, 1999/00 – 2001/02
(in millions)
Estimated Funding Source Budget ImpacProject Project Current Serv Ctr/ University University Operations &
Infrastructure Programs Schedule Cost Funds Gifts Auxiliary Debt Debt Service Maintenance
Capital Utilities Program (CUP)
Wear-Out 2000-02 $11.2 $11.2
Controls 2000-02 2.9 2.9
System Expansion 2000-02 12.6 12.6
Regulatory 2000-02 1.7 1.7
Subtotal-CUP 28.4 28.4
Systems
Applications 2000-02 15.0 $15.0
Infrastructure 2000-02 4.5 4.5
Communications Facilities 2000-02 10.9 $6.0 2.6 $2.3 $0.2
Subtotal-Systems 30.4 19.5 6.0 2.6 2.3 0.2
Compliance and Other
ADA Upgrades 2000-02 6.0 6.0 0.5
Emergency Generators 1999-02 2.8 2.8 0.2
Stores Renovation 2000 2.2 2.2
Storm Drains 1999-00 1.5 1.5 0.1
Subtotal-Compliance and Other 12.5 2.2 10.3 0.8
Stanford Infrastructure Program (SIP)
Campus Landscaping and Planning Projects
Circulation Projects 2000-02 8.0 8.0 $0.1
Landscape Projects 2000-02 5.2 5.2 0.2
Outdoor Lighting Systems 2000-02 0.2 0.2
Outdoor Art Program 2000-02 0.1 0.1
Subtotal-Campus Landscaping 13.5 13.5 0.3
Parking and Transportation Services
Parking System 2000-02 18.1 18.1 0.1
Transit Related 2000-02 2.0 2.0
Subtotal-Parking and Transportation Services 20.1 20.1 0.1
Subtotal-SIP 33.6 33.6 0.4
Total Infrastructure Programs $104.9 $55.3 $6.0 $31.0 $12.6 $1.0 $0.4

Capital Budget 43
LATH
ROP
DR CEDR
O W
Y
ALVARADOCT
SAN
JUAN
ST
COOKSEY LN
CONS
TANZ
O S
T
MAY
FIEL
D A
VE
GERO
NA
CABR
ILLO
ST
SANT
A YN
EZ S
T
SAN
FRAN
CISC
OTE
RR
SAN
FRAN
CISC
OCT
PL
EL E
SCAR
PADO
WY
+
BOW
DOIN
ST
SANTA YNEZ ST
E
East
Res
iden
ces
Science &Engineering
Quad
Athl
etic
s
Wes
tRe
side
nces
Sout
hRe
side
nces
Esco
ndid
o Vi
llage
Jord
an Q
uad
QU
GALVEZ ST
Vars
ityTe
nnis
Cour
ts
Tenn
isCo
urts
Hoov
erTo
wer
Lou
Henr
yHo
over
Bld
g
Enci
na C
omm
ons
Mem
oria
l Hal
l
Enci
na H
all
Laur
ence
Fro
stAm
phith
eate
r
Brow
n
655
Serr
a
Map
les
Pavi
lion
DeGu
erre
Poo
ls &
Cou
rts
Chuc
kTa
ylor
Fiel
d
Euca
lypt
usGr
ove
Mas
ter's
Grov
e
Trac
kHo
use
Burn
ham
Pavi
lion
Ford
Cent
er
Bake
wel
l
Tenn
isSt
adiu
m
Toyo
n Ea
ting
Club
s
Cob
bTr
ack
Stad
ium
NELS
ON
RD
MEM
ORIA
L W
AY
ESCO
NDID
O RD
NATHAN A
BBOTT W
Y
LANE
B
ALVA
RADO
ROW
VALP
ARAI
SOST
SALV
ATIE
RRA
ST
SAN
JUAN
ST
DOLORESST
MIR
ADA
AVE
PPL
ESTU
DILL
ORD
FRENCHMAN'SRD
SAN RAFAEL PL
MAY
FIEL
D A
VE
CORONADO AVE
SONO
MA
TERR
SANTA
FEAV
EES
PLAN
ADA
WAY
PINE
HILL
RD
LATH
ROPDR
MAY
FIEL
DAV
E
NGPL
WAY
PETE
RCO
UTTS
RD
MEARSCT
RYANCT
ESCO
NDID
O R
D
ESCO
NDID
O R
D
COM
STO
CKCI
R
OLMSTEDRD
McF
ARLA
ND
CT
HOSK
INS
CT
PAM
PAS
LN
HULM
ECT
BARNESCT
OLM
STED
RD
ABRA
MS
C
OLMSTEDRD
DUDL
EYLN
ANGE
LLCT
COWELLLN
EVAPL
LAGU
NITA
DR
MAY
FIEL
D AV
E
LANE
L
ROBLE DR
MORRIS WY
SEQUOIA LN
VIA PALOU
VIA CRESPI
VIA ORTEGA
SANT
A TE
RESA
ST
JORDAN WAY
PANAMA ST
SEAR
SVIL
LE R
D
LOS ARBOLES AVE
CAMPUS DRIVE WEST
GOVERNOR’S AVE
SANT
A TE
RESA
LN
WEL
CH R
D
CAM
PUS
DRI
VE
PALM DR
LOMITA DR
LASUEN ST
MUS
EUM
WAY
GALVEZ ST
ROTH
WAY
ARGUELLO WY
SAM McDONALD LANE
SAM McDONALD LANE
BONAIR SIDING
CAM
PUS
DRI
VE
SERR
A S
T
SERRA ST
QU
ILLE
NCT
JEN
KIN
SCT
Bing
Nurs
ery
Scho
ol
Stan
ford
Elem
enta
rySc
hool
Rain
sHo
uses
To F
ooth
ill E
xpre
ssw
ayTo
Inte
rsta
te 2
80 v
ia P
age
Mill
Rd
RUNNING FARM LN
AYRS
HIRE
FAR
M L
N
BLAC
KWEL
DER
CT
Nixo
nEl
emen
tary
Scho
ol
STANFORD AVE
CAMPUS DRIVE EAST
THO
BURN
CT
Med
ical
Cent
er
CAMPUS DRIVE EAST
Fire
Stat
ion
Faci
litie
sOp
erat
ions
Cent
ral
Stor
es
Man
zani
taPa
rk
Quill
en
Blac
kwel
der
Mirr
iele
esHo
use
Wilb
urM
odul
esA B C
Polic
eSe
rvic
es
Hann
aHo
use
Kim
ball
Dini
ng
Cow
ell
Clus
ter
Hous
esEl
liott
Prog
ram
Cent
er
Golf
Driv
ing
Rang
e
Gove
rnor
’s
Corn
er
Ster
ling
Quad
r Adv
ance
d St
udy
avio
ral S
cien
ces
(not
sho
wn)
Park
ing
Stru
ctur
e
Mai
n Qu
ad
as er
Cypr
ess
Spru
ceHa
llGi
nzto
n La
b
Ceda
rPi
ne
Vent
ura
Hall
Cord
ura
Hall
Beck
man
Cent
erFa
irchi
ldCe
nter
RAF
1 &
2M
ayer
Can
cer
Biol
ogy
HRP-
Redw
ood
Bldg
.
Med
Sch
ool
Offic
e Bl
dg
Carn
egie
Inst
itutio
n
Godz
illa
Bam
bi
New
Gui
nea
Scul
ptur
eGa
rden
Lab
Surg
eBl
dg
Clin
ic Appl
ied
Phys
ics
Redw
ood
Poly
aCoge
n Fa
cilit
y
Fors
ythe
Hall
Scho
ol o
fM
edic
ine
Park
ing
Stru
ctur
e
Robl
e Fi
eld
Acac
ia
Birc
h
Juni
per
Popl
arLa
urel
LOMITADR
LOM
ITA
DR
LOMITACT
SAN
TATE
RESA
ST
The
Oval
Old
Chem Bldg
Orga
nic
Chem
Keck
Sci
ence
Mud
dCh
emis
tryBl
dg
Heal
thRe
s &
Polic
yBl
dg
Anat
omy
Mau
sole
um
Rodi
nSc
ulpt
ure
Gard
en
Stan
ford
Mus
eum
Dura
nd
Robl
e Gy
m
Robl
ePo
ol
Lagu
nita
Cour
t
Robl
eHa
ll
VIA
PUEB
LO
PAN
AMA
ST
RAIM
UNDO
WAY
Ster
n Ha
ll
Crot
hers
Hall
The
Brid
ge
Pear
ceM
itche
llHo
uses
Lou
Henr
yHo
over
Hou
se
Bran
ner H
all
Wilb
ur H
all
Hust
onHo
use
Boliv
arHo
use
SHC
Anne
x
Row
Offic
e
Kim
ball
Hall
Flor
ence
Moo
re H
all
Row
Hsg
Off
The
Knol
l
Bech
tel I
nt’l
Cent
er
Cow
ell S
tude
ntHe
alth
Cen
ter
Univ
ersi
tyDi
ning
Serv
ices
Cred
itUn
ion
Sunk
enDi
amon
d
Foot
ball
Prac
tice
Fiel
d
Athl
etic
Grou
nds
Dept
Lom
ans
Softb
all
Fiel
d
Child
ren’
sCe
nter
of t
heSt
anfo
rdCo
mm
unity
Stan
ford
Auxi
liary
Libr
ary
McF
arla
nd
Abra
ms
Barn
esHu
lme
Villa
geOf
fice
50
5
10
15
20
25
30
35
40
45
55
60
65
70
75
80
85
90
9510
0
105
115
110
120
125 13
0
135
127
140
142
144
Hosk
ins
Kres
ge Aud
Facu
lty C
lub
590
Care
erPl
anni
ngCt
r
Mem
oria
l Chu
rch
Cent
er fo
rEd
ucat
iona
lRe
sear
ch(C
ERAS
)
Gree
nLi
brar
y Swee
t Hal
l
Scho
ol o
f Law
Bow
man
Alum
ni
Roge
rs Owen
Mar
ipos
a Serr
a
310
300
Galv
ezM
odul
e
260
320
4050
6070
250
3080
360
240
2090
370
101
110
100
200
380
160
341
33322
731
5
170
120
460
420 Fi
reTr
uck
Hous
e
Tres
idde
rUn
ion
Dink
el-
spie
l Aud
Harm
ony
Hous
e
610
540
Blac
kCm
tySv
cs Ctr
Old
Unio
n
Club
hous
e
CTR
BLAKE WILBUR DR
770
730
703
Falk
Cent
er
750
Stan
ford
Barn
700
701
800
Bloo
d Ba
nk
780
777
801
851
900
Hosp
ital
Helip
ort
Luci
le P
acka
rdCh
ildre
n's
Hosp
ital
Emer
genc
y
Recy
clin
gCe
nter
Haas
651
Serr
a
Oak
Sigm
aAl
pha
Epsi
lon
Ench
ante
dBr
occo
liFo
rest
Na
rnia
Lam
bda
Nu
Kapp
a Al
pha
680
Lom
ita
Kapp
aSi
gma
Thet
a De
ltaCh
i
La C
asa
Italia
na
Xana
du
Phi
Sig
Grov
eM
ayfie
ld
Grov
e La
suen
La M
aiso
n Fr
anca
ise
Delta
Kap
pa E
psilo
n
Haus
Mitt
eleu
ropa Du
rand
Chap
elHo
use
Gard
iner
Slav
ians
kii D
om
717
Dolo
res
Roth
Syne
rgy
Ham
mar
skjö
ld
Chi
The
ta Chi
Terr
a
Stud
ent
Hous
ing
Serv
ices
ZAP
Kapp
aAl
pha
Thet
a
Delta
Delta
Delta
Whi
tman
557
May
field
553
May
field
Sigm
a Ch
i
Stor
ey
Yost
Griff
enJe
nkin
s
Mar
xAn
ders
on
Kairo
s
Amer
ican
Stud
ies
Hous
e
EAST
Donn
er
Serr
aCa
saZa
pata
Cedr
o
Arro
yoTr
anco
s
Soto
Rinc
onad
a
Okad
aJuni
pero
Suite
sEa
ting
Club
sRick
erDi
ning
Cent
er
Adam
s Potte
rRo
bins
on
Schi
ff
Suite
s
Adel
fa
Euca
lypt
o
Gran
ada
Nara
nja
Loro
Mirl
o
Ujam
aa
Palo
ma
Alon
dra
Card
enal
Fais
anGa
vila
n
Bob
Psyc
hiat
ry
HRP
Mod
ules
Park
ing
Stru
ctur
e
Arril
laga
Sp
orts
Ctr
Cast
año
Lant
ana
Stan
ford
Clin
icFa
cilit
y (F
PP)
Bike
Sho
p
Alle
nCI
S
Oter
oBu
rban
k
Herb
ert H
oove
rM
emor
ial B
ldg
PA
NA
MA
MA
LL
L O M I T A M A L L
ARGUELLO MALL
GALVEZ MALL
LASUEN MALL
VIA PALOU MALL
LOMITAMALL
SA
NTA
TER
ESA
MA
LL
ESC
ON
DID
O M
ALL
SALVATIERRA M
ALL
Post
Offi
ce
Colu
mba
e
Muw
ekm
a-Ta
h-Ru
k
Brau
nM
usic
Ctr
Whi
tePl
aza
Mey
erLi
brar
y
Crot
hers
Mem
oria
lHa
llToyo
nHa
ll
Grad
uate
Scho
ol o
fBu
sine
ss
Littl
efie
ldCe
nter
Mitc
hell
Skill
ing
Scho
ol o
fEd
ucat
ion
Cloc
kTo
wer
500
520
530
550
Herr
in H
all
and
Labs
Lark
in
Art G
alle
ry
Thor
nton
Ctr
Term
anGr
ove
Twai
n
SE
RR
A
MA
LL
CROT
HERS
WAY
BOO
KSTO
RE
Kenn
edy
Grov
e
LAK
E L
AGUN
ITA
Term
anEn
gine
erin
g56
057
0
Cum
min
gsAr
t Bld
g
L CA
MIN
O RE
AL \
HWY
82
CenaL
Schw
abRe
side
ntia
l Cen
ter
A–E
LYM
ANGR
ADUA
TERE
SIDE
NCE
GP-B
HEPL
Gree
n Ea
rthSc
ienc
esSO
UTH
SERV
ICE
RD
RD
JUNI
PERO
SER
RA B
LVD
Natio
nal B
urea
u of
Econ
omic
Res
earc
h(n
ot s
how
n)
McC
ullo
ugh
Gate
s Co
mpu
ter
Scie
nce
NORT
H SE
RVIC
E RO
AD N/S MALL
RTF
Sequ
oia
Elec
trica
lEn
gine
erin
g
Varia
n La
b
HEPL
Anne
x
Land
auEc
onom
ics
Stau
ffer I
Stau
ffer I
I
Stau
ffer I
IINORTH/SOUTH SERVICE ROADGi
lber
tBi
oSci
Bldg
Hous
ing
Assi
gnm
ent
Serv
ices
Hous
ing
and
Din
ing
Serv
ices
Brea
kers
Fres
hmen
/Sop
hom
ore
Resi
dent
ial C
olle
ge
Pres
s Bl
dg ❼
❻ ❸
❶
❷
❺ ❺
❺❺
❹
1. A
lum
ni C
ente
r/O
ffic
e of
Dev
elop
men
t2.
Aqu
atic
s C
ompl
ex P
hase
13.
Art
Gal
lery
Sei
smic
Ren
ovat
ion
4. C
ente
r fo
r C
linic
al S
cien
ces
Res
earc
h5.
Esc
ondi
do V
illag
e G
radu
ate
Hou
sing
6. G
radu
ate
Sch
ool o
f Bus
ines
s– M
ain,
(Bld
g. 3
50)
7. M
echa
nica
l Eng
inee
ring
Lab
orat
ory
1999/0
0 S
tan
ford
Un
ivers
ity B
ud
get
Pla
n
Majo
r P
roje
cts
Un
derw
ay

44 Capital Budget
PROJECTS IN DESIGN ANDCONSTRUCTION
A number of significant capital projects,currently in the design or construction phases,are described below. Projects are reported atvarious stages of completion. The scope andfinal cost of a project are not fully defined untilthe Santa Clara County agencies have approvedall plans and a general contractor has submitteda guaranteed maximum price for the project.Projects reported to the Board of Trustees forconstruction approval have the necessarycontrols in place to report a dependable price orbudget. Projects in all other phases of deliveryare reported with the best information availableat the time and are subject to change. Pleaserefer to the map on the previous page for sitelocations.
AQUATICS COMPLEX – PHASE I
This project will provide for a new 50-metertraining pool with moveable bulkhead, a newdiving pool with two one-meter diving boards,two three-meter diving boards, and a divingtower with platforms at the one, three, five,seven and one-half, and 10 meter levels. Thenew diving tower design provides for widenedplatforms to allow for future competition use bysynchronized divers. Phase I of this project,totaling $12.5 million, has been made possibleby gifts to the Department of Athletics and isscheduled to be completed in December of 2000.The second phase of the Aquatics Complex isscheduled for completion in 2001 and willinclude the replacement of the existing short-course competition pool, decking, and filter andchemical control systems.
ART GALLERY SEISMIC RENOVATION
The Art Gallery was constructed in 1916 and hasalways housed the Art Department, includingstudios and classrooms, photography labs, andgallery space. It is a one-story unreinforcedmasonry (URM) building with a partial base-ment, totaling approximately 13,000 grosssquare feet. The County of Santa Clara requires
that the Art Gallery be upgraded seismically orvacated by the year 2000. In addition to theseismic upgrade, the gallery space will berenovated, the HVAC system will be upgraded tomeet the ventilation needs of the photographylabs, and ADA (Americans with Disabilities Act)access to the Gallery will be constructed. Thehistorical arcades will be restored. This project,currently estimated at $7.5 million, will belargely financed by University debt.
CENTER FOR CLINICAL SCIENCES RESEARCH
(CCSR)
The Center for Clinical Sciences Research willprovide critically needed academic space for theSchool of Medicine’s teaching and researchprograms in Cancer, Immunology, Human GeneTherapy, and Human Anatomy. In this facility,the faculty will be uniquely positioned tofunction at the boundaries between basicscientific research and clinical research, and toprovide fundamental new insights into thenature of disease and develop new techniques oftreatment. Construction began in the summerof 1997 and will be completed in Spring 2000.We are currently in negotiations with a newgeneral contractor which may have financialimplications on the forecasted project costs.
ESCONDIDO VILLAGE GRADUATE HOUSING –PHASE I
The availability of affordable housing oncampus is essential to the University’s ability torecruit graduate students and researchers.In response to the immediate demand foron-campus housing, the Provost made theprovision of additional graduate student hous-ing a high priority this year. The EscondidoVillage Graduate Housing project will add 508housing units within the existing EscondidoVillage. This additional 231,776 square feet iscurrently estimated at a project cost of $67.5million and will be completed in 2000. In thefuture, Phase II will add another 508 units ofin-fill graduate student housing to EscondidoVillage.

Capital Budget 45
GRADUATE SCHOOL OF BUSINESS – MAIN
(BUILDING 350)
This project involves the renovation of theexisting Graduate School of Business mainstructure, including the expansion of thecomputer lab, addition of an internal serviceelevator and hall, and upgrade of the ArbuckleCafeteria Lounge. Additionally, plans includeimprovements to the student and facultyservices offices, expansion of the entry lobby,renovation of the student lounge, and provisionof acoustical attenuation of the primary corri-dors and Bishop Auditorium lobby. The firstfloor will be updated to accommodate relocatedNews & Publications, Human Resources, andaccounting departments. The second floorrequires minor remodeling and general low-level renovations at selected locations. Therenovated areas will also be brought up tocurrent ADA and building code standards whererequired. Construction work will be completedduring the summer of 1999.
MECHANICAL ENGINEERING DEPARTMENT
LABORATORY
The proposed new Mechanical EngineeringDepartment Laboratory is intended primarily tohouse research programs that will position thedepartment for leadership in critical emergingfields of mechanical engineering. The researchareas that have been targeted are AdvancedManufacturing and Design, Bio-MechanicalEngineering, Combustion Science and Engineer-ing, Microscale Engineering, Project-BasedInstruction and Undergraduate Research andCollaborative Research. The two-story buildingwill be built on a portion of the existing PressBuilding site, totaling 48,000 gross square feetand will be completed by 2002. The newbuilding resolves the existing code complianceproblems in Building 570 by providing H2/H7space for research, which requires large invento-ries of toxic and/or flammable gases, andcompletes seismic and mechanical codeupgrades. Building 500 shop and engine laband Building 510 back lab will be vacated by
Mechanical Engineering and returned to theProvost. The seismic strengthening of Building570 has been staged to allow continuedoccupancy of the space. This entire projectis expected to be completed in 2003.
STANFORD ALUMNI CENTER/OFFICE OF
DEVELOPMENT
The new Alumni Center will provide contiguousoffices for the Alumni Association and theOffice of Development (OOD), enhancingcollaboration between the organizations andproviding major public space for alumni. TheAlumni/OOD Building complex is composed ofthree connected building elements of threestories each, with hospitality, administrative,and office space. The main building will serveas the welcoming entrance for Universityalumni. Inside, alumni will find hospitalityareas, including a great hall (which can accom-modate 400-450 people for reunion dinners,donor events, wedding receptions, etc.), areading room, history room, cafe, and a busi-ness/conference center. This project has beenmade possible by gifts raised by the Office ofDevelopment. The building is scheduled forcompletion in the fall of 2000.
CAPITAL IMPROVEMENT PLAN IN HOUSING AND
DINING SERVICES
In 1999/00, year eight of the 15-year CapitalImprovements Plan (CIP), Toyon Hall willundergo seismic retrofit, and Wilbur DiningHall will be remodeled. Additionally, as inprevious CIP years, 170 Escondido Villageapartments are planned for seismic retrofits andrenovation. These projects are anticipated tototal $19.2 million.
The CIP renovation program is intended toreduce the differences in quality between olderresidences and those built in the past eight toten years. This is accomplished by replacingfinishes and furnishings, attending to criticalcode compliance and deferred maintenanceissues, providing aesthetic and landscape im-provements where possible, and providing

46 Capital Budget
functional improvements such as in-room accessto SUNet and dining services upgrades asapplicable.
Infrastructure Programs
Stanford’s on-going effort to renew its infra-structure is managed through the programsdescribed below.
CAPITAL UTILITY PROGRAM
The Capital Utility Program (CUP) containsprojects that will improve and enhance electri-cal, chilled water, steam, water, and sewagesystems. Projects meet one of four criteria:system wear-out, regulatory issues and codecompliance, system expansion, and systemcontrols. The budget for the CUP program in1999/00 is $13.2 million. The largest portion ofthis, approximately $8.3 million, will be used forsystem expansion to accommodate growth inthe campus and increased demand for utilities.
SYSTEMS
As new buildings and major renovations comeonline, new utilities are needed to servicethose buildings. In addition to traditionalutilities such as electricity and chilled water, anincreasingly important utility is the Infrastruc-ture and Communications Facilities, whichsupply voice, data, and video communicationsto the buildings. This portion of the 1999/00Capital Budget includes $3.5 million to coverthe costs for conduit, inter-building andintra-building cabling for all communications.
The budget for systems infrastructure programsalso includes $9.6 million for informationsystems applications and infrastructuredevelopment.
STANFORD INFRASTRUCTURE PROGRAMS
The Stanford Infrastructure Program (SIP)consists of projects and programs proposed anddeveloped for the improvement and generalsupport of the University’s academic commu-nity and physical plant. The campus infrastruc-ture is in direct support of the academicmissions of teaching and research and theoverall vitality of the institution. SIP is sup-ported by a 9% charge on most buildingprojects, and is subdivided into 5% for the SIP-Campus Program and 4% for SIP-Transporta-tion programs.
The SIP-Campus Program proposes to spend upto $6.3 million in 1999/00, which will be spenton improvements to roads, paths, storm drains,outdoor art, outdoor landscaping and signs, aswell as advance planning efforts that supporteach of these.
The SIP-Parking and Transportation Programproposes to spend up to $1.7 million in 1999/00for the implementation of a revised transporta-tion plan which provides for the construction ofadditional parking, including planning for atleast one parking structure, campus transitimprovements, parking lot infrastructureimprovements, and enhancements to supportbicycle use.

Appendix A: Consolidated Budgets for Schools, Academic Support Areas, and Auxiliaries 45
Appendix A
Consolidated Budgets for Schools,Academic Support Areas, and Auxiliaries
Schedules are shown for:
Academic Units
• School of Earth Sciences
• School of Education
• School of Engineering
• School of Humanities & Sciences
• School of Law
• Vice Provost for Undergraduate Education
• Vice Provost and Dean of Research andGraduate Policy
• Graduate School of Business
• School of Medicine
• Hoover Institution
Academic Support Units
• Stanford University Libraries andAcademic Information Resources
• Vice Provost for Student Affairs
• Learning Technology andExtended Education
Auxiliary Enterprises
• Alumni Association
• Athletics
• Housing and Dining Services
• Stanford University Press

46 Appendix A: Consolidated Budgets for Schools, Academic Support Areas, and Auxiliaries

Appendix A: Consolidated Budgets for Schools, Academic Support Areas, and Auxiliaries 47
Sch
oo
l o
f E
art
h S
cie
nce
s
20
00
/0
1 C
on
so
lid
ate
d F
ore
ca
st
(in
th
ou
san
ds
of
do
llar
s)
Op
erat
ing
Des
ign
ated
Res
tric
ted
Res
tric
ted
Gra
nts
&B
ud
get
Fun
ds
Exp
end
able
En
do
wm
ent
Co
ntr
acts
Tota
l
Rev
enu
es a
nd
Tra
nsf
ers
Gen
eral
Fu
nd
s A
llo
cati
on
2,37
42,
374
Res
tric
ted
Rev
enu
es3,
332
757
10,6
227,
749
22,4
60
Tran
sfer
s w
ith
in C
urr
ent
Fun
ds
6,64
930
0(6
,519
)43
0
Tran
sfer
s (t
o)/
fro
m E
nd
ow
men
t P
rin
cip
al
Tran
sfer
s (t
o)/
fro
m P
lan
t/S
tud
ent
Loan
Tota
l R
even
ues
an
d T
ran
sfer
s9,
023
3,33
21,
057
4,10
37,
749
25,2
64
Exp
end
itu
res
Aca
dem
ic S
alar
ies
4,10
91,
414
119
512,
285
7,97
8
Sta
ff S
alar
ies
1,60
368
583
7774
83,
196
Tota
l B
enef
its
1,25
636
633
3341
22,
100
Tota
l N
on
-Sal
ary
Exp
end
itu
res
2,05
51,
254
794
2,99
44,
304
11,4
01
Tota
l E
xpen
dit
ure
s9,
023
3,71
91,
029
3,15
57,
749
24,6
75
Exc
ess
of
Rev
enu
e o
ver
Exp
end
itu
res
(387
)28
948
589
Beg
inn
ing
Op
erat
ing
Eq
uit
y4,
128
2,60
77,
385
14,1
20
En
din
g O
per
atin
g E
qu
ity
3,74
12,
635
8,33
314
,709
No
tes:
•O
per
atin
g e
qu
ity
rep
rese
nts
res
erve
s av
aila
ble
fo
r fu
ture
use
s, a
lon
g w
ith
pro
ject
s an
d f
un
d b
alan
ces
rest
rict
ed f
or
spec
ial p
urp
ose
s.O
per
atin
g e
qu
ity
may
incl
ud
e fu
nd
s th
at a
re s
pec
ific
ally
inve
sted
an
d t
her
efo
re n
ot
avai
lab
le f
or
exp
end
itu
re in
th
e cu
rren
t p
erio
d.
•T
his
bu
dg
et d
oes
no
t re
flec
t an
allo
cati
on
of
tuit
ion
rev
enu
e o
r o
f ce
ntr
al a
dm
inis
trat
ive
cost
s. T
his
is c
on
sist
ent
wit
h S
tanf
ord
’s p
olic
yfo
r th
ose
un
its
no
t o
per
atin
g u
nd
er a
fo
rmu
la a
rran
gem
ent.
•C
urr
ent
fun
ds
are
reso
urc
es t
hat
are
exp
end
able
fo
r th
e p
rim
ary
inst
ruct
ion
an
d r
esea
rch
mis
sio
n o
f th
e U
niv
ersi
ty, w
ith
in a
cco
un
tin
gan
d d
on
or
rest
rict
ion
s, if
an
y. E
nd
ow
men
t p
rin
cip
al, s
tud
ent
loan
fu
nd
s, a
nd
pla
nt
fun
ds
are
no
t co
nsi
der
ed c
urr
ent
fun
ds,
as
they
are
hel
d f
or
oth
er s
pec
ific
pu
rpo
ses.

48 Appendix A: Consolidated Budgets for Schools, Academic Support Areas, and Auxiliaries
Sch
oo
l o
f E
du
ca
tio
n
20
00
/0
1 C
on
so
lid
ate
d F
ore
ca
st
(in
th
ou
san
ds
of
do
llar
s)
Op
erat
ing
Des
ign
ated
Res
tric
ted
Res
tric
tG
ran
ts &
Bu
dg
et F
un
ds
Exp
end
able
En
do
wm
ent
Co
ntr
acts
Tota
l
Rev
enu
es a
nd
Tra
nsf
ers
Gen
eral
Fu
nd
s A
llo
cati
on
8,86
08,
860
Res
tric
ted
Rev
enu
es20
01,
075
2,47
511
,822
15,5
72
Tran
sfer
s w
ith
in C
urr
ent
Fun
ds
2,22
547
0(9
0)(2
,330
)27
5
Tran
sfer
s (t
o)/
fro
m E
nd
ow
men
t P
rin
cip
al
Tran
sfer
s (t
o)/
fro
m P
lan
t/S
tud
ent
Loan
Tota
l R
even
ues
an
d T
ran
sfer
s11
,085
670
985
145
11,8
2224
,707
Exp
end
itu
res
Aca
dem
ic S
alar
ies
5,13
765
300
2,34
97,
851
Sta
ff S
alar
ies
1,71
364
472,
371
4,19
5
Tota
l B
enef
its
1,52
833
8887
52,
525
Tota
l N
on
-Sal
ary
Exp
end
itu
res
2,70
710
730
489
6,22
79,
434
Tota
l E
xpen
dit
ure
s11
,085
270
739
8911
,822
24,0
06
Exc
ess
of
Rev
enu
e o
ver
Exp
end
itu
res
400
246
5670
2
Beg
inn
ing
Op
erat
ing
Eq
uit
y3,
793
3,66
639
87,
857
En
din
g O
per
atin
g E
qu
ity
4,19
33,
912
454
8,55
9
No
tes:
•O
per
atin
g e
qu
ity
rep
rese
nts
res
erve
s av
aila
ble
fo
r fu
ture
use
s, a
lon
g w
ith
pro
ject
s an
d f
un
d b
alan
ces
rest
rict
ed f
or
spec
ial p
urp
ose
s.O
per
atin
g e
qu
ity
may
incl
ud
e fu
nd
s th
at a
re s
pec
ific
ally
inve
sted
an
d t
her
efo
re n
ot
avai
lab
le f
or
exp
end
itu
re in
th
e cu
rren
t p
erio
d.
•T
his
bu
dg
et d
oes
no
t re
flec
t an
allo
cati
on
of
tuit
ion
rev
enu
e o
r o
f ce
ntr
al a
dm
inis
trat
ive
cost
s. T
his
is c
on
sist
ent
wit
h S
tanf
ord
’s p
olic
yfo
r th
ose
un
its
no
t o
per
atin
g u
nd
er a
fo
rmu
la a
rran
gem
ent.
•C
urr
ent
fun
ds
are
reso
urc
es t
hat
are
exp
end
able
fo
r th
e p
rim
ary
inst
ruct
ion
an
d r
esea
rch
mis
sio
n o
f th
e U
niv
ersi
ty, w
ith
in a
cco
un
tin
gan
d d
on
or
rest
rict
ion
s, if
an
y. E
nd
ow
men
t p
rin
cip
al, s
tud
ent
loan
fu
nd
s, a
nd
pla
nt
fun
ds
are
no
t co
nsi
der
ed c
urr
ent
fun
ds,
as
they
are
hel
d f
or
oth
er s
pec
ific
pu
rpo
ses.

Appendix A: Consolidated Budgets for Schools, Academic Support Areas, and Auxiliaries 49
Sch
oo
l o
f E
ng
ine
eri
ng
20
00
/0
1 C
on
so
lid
ate
d F
ore
ca
st
(in
th
ou
san
ds
of
do
llar
s)
Op
erat
ing
Des
ign
ated
Res
tric
ted
Res
tric
ted
Gra
nts
&B
ud
get
Fun
ds
Exp
end
able
En
do
wm
ent
Co
ntr
acts
Tota
l
Rev
enu
es a
nd
Tra
nsf
ers
Gen
eral
Fu
nd
s A
llo
cati
on
35,8
4535
,845
Res
tric
ted
Rev
enu
es22
,689
20,0
0015
,330
86,9
1714
4,93
6
Tran
sfer
s w
ith
in C
urr
ent
Fun
ds
12,1
82(1
,517
)65
0(6
,815
)4,
500
Tran
sfer
s (t
o)/
fro
m E
nd
ow
men
t P
rin
cip
al(1
25)
(250
)(3
75)
Tran
sfer
s (t
o)/
fro
m P
lan
t/S
tud
ent
Loan
(2,0
00)
(1,0
00)
(140
)(3
,140
)
Tota
l R
even
ues
an
d T
ran
sfer
s48
,027
19,0
4719
,400
8,37
586
,917
181,
766
Exp
end
itu
res
Aca
dem
ic S
alar
ies
23,6
492,
201
3,47
742
321
,019
50,7
69
Sta
ff S
alar
ies
8,59
85,
000
1,18
619
28,
907
23,8
83
Tota
l B
enef
its
6,78
51,
400
530
935,
571
14,3
79
Tota
l N
on
-Sal
ary
Exp
end
itu
res
8,99
56,
624
10,5
773,
453
51,4
2081
,069
Tota
l E
xpen
dit
ure
s48
,027
15,2
2515
,770
4,16
186
,917
170,
100
Exc
ess
of
Rev
enu
e o
ver
Exp
end
itu
res
3,82
23,
630
4,21
411
,666
Beg
inn
ing
Op
erat
ing
Eq
uit
y58
,764
40,2
1216
,102
115,
078
En
din
g O
per
atin
g E
qu
ity
62,5
8643
,842
20,3
1612
6,74
4
No
tes:
•O
per
atin
g e
qu
ity
rep
rese
nts
res
erve
s av
aila
ble
fo
r fu
ture
use
s, a
lon
g w
ith
pro
ject
s an
d f
un
d b
alan
ces
rest
rict
ed f
or
spec
ial p
urp
ose
s.O
per
atin
g e
qu
ity
may
incl
ud
e fu
nd
s th
at a
re s
pec
ific
ally
inve
sted
an
d t
her
efo
re n
ot
avai
lab
le f
or
exp
end
itu
re in
th
e cu
rren
t p
erio
d.
•T
his
bu
dg
et d
oes
no
t re
flec
t an
allo
cati
on
of
tuit
ion
rev
enu
e o
r o
f ce
ntr
al a
dm
inis
trat
ive
cost
s. T
his
is c
on
sist
ent
wit
h S
tanf
ord
’s p
olic
yfo
r th
ose
un
its
no
t o
per
atin
g u
nd
er a
fo
rmu
la a
rran
gem
ent.
•C
urr
ent
fun
ds
are
reso
urc
es t
hat
are
exp
end
able
fo
r th
e p
rim
ary
inst
ruct
ion
an
d r
esea
rch
mis
sio
n o
f th
e U
niv
ersi
ty, w
ith
in a
cco
un
tin
gan
d d
on
or
rest
rict
ion
s, if
an
y. E
nd
ow
men
t p
rin
cip
al, s
tud
ent
loan
fu
nd
s, a
nd
pla
nt
fun
ds
are
no
t co
nsi
der
ed c
urr
ent
fun
ds,
as
they
are
hel
d f
or
oth
er s
pec
ific
pu
rpo
ses.

50 Appendix A: Consolidated Budgets for Schools, Academic Support Areas, and Auxiliaries
Sch
oo
l o
f H
um
an
itie
s &
Scie
nce
s
(In
clu
de
s O
ve
rse
as S
tud
ies P
rog
ram
)
20
00
/0
1 C
on
so
lid
ate
d F
ore
ca
st
(in
th
ou
san
ds
of
do
llar
s)
Op
erat
ing
Des
ign
ated
Res
tric
ted
Res
tric
ted
Gra
nts
&A
uxi
liar
yB
ud
get
Fun
ds
Exp
end
able
En
do
wm
ent
Co
ntr
acts
Inco
me/
Exp
Tota
l
Rev
enu
es a
nd
Tra
nsf
ers
Gen
eral
Fu
nd
s A
llo
cati
on
85,6
8985
,689
Res
tric
ted
Rev
enu
es3,
045
9,49
844
,761
50,3
353,
481
111,
120
Tran
sfer
s w
ith
in C
urr
ent
Fun
ds
39,8
634,
925
(805
)(2
9,58
9)14
,394
Tran
sfer
s (t
o)/
fro
m E
nd
ow
men
t P
rin
cip
al(3
,000
)(3
,000
)
Tran
sfer
s (t
o)/
fro
m P
lan
t/S
tud
ent
Loan
(500
)(5
00)
Tota
l R
even
ues
an
d T
ran
sfer
s12
5,05
27,
970
8,69
312
,172
50,3
353,
481
207,
703
Exp
end
itu
res
Aca
dem
ic S
alar
ies
58,9
121,
739
1,27
91,
545
10,6
462
74,1
22
Sta
ff S
alar
ies
14,3
1021
194
365
76,
897
1,23
524
,254
Tota
l B
enef
its
15,8
6742
833
539
42,
401
296
19,7
21
Tota
l N
on
-Sal
ary
Exp
end
itu
res
35,9
634,
301
5,29
85,
300
30,3
911,
948
83,2
01
Tota
l E
xpen
dit
ure
s12
5,05
26,
679
7,85
57,
896
50,3
353,
481
201,
298
Exc
ess
of
Rev
enu
e o
ver
Exp
end
itu
res
1,29
183
84,
276
6,40
5
Beg
inn
ing
Op
erat
ing
Eq
uit
y15
,886
33,5
5535
,683
85,1
24
En
din
g O
per
atin
g E
qu
ity
17,1
7734
,393
39,9
5991
,529
No
tes:
•O
per
atin
g e
qu
ity
rep
rese
nts
res
erve
s av
aila
ble
fo
r fu
ture
use
s, a
lon
g w
ith
pro
ject
s an
d f
un
d b
alan
ces
rest
rict
ed f
or
spec
ial p
urp
ose
s.O
per
atin
g e
qu
ity
may
incl
ud
e fu
nd
s th
at a
re s
pec
ific
ally
inve
sted
an
d t
her
efo
re n
ot
avai
lab
le f
or
exp
end
itu
re in
th
e cu
rren
t p
erio
d.
•T
his
bu
dg
et d
oes
no
t re
flec
t an
allo
cati
on
of
tuit
ion
rev
enu
e o
r o
f ce
ntr
al a
dm
inis
trat
ive
cost
s. T
his
is c
on
sist
ent
wit
h S
tanf
ord
’s p
olic
yfo
r th
ose
un
its
no
t o
per
atin
g u
nd
er a
fo
rmu
la a
rran
gem
ent.
•C
urr
ent
fun
ds
are
reso
urc
es t
hat
are
exp
end
able
fo
r th
e p
rim
ary
inst
ruct
ion
an
d r
esea
rch
mis
sio
n o
f th
e U
niv
ersi
ty, w
ith
in a
cco
un
tin
gan
d d
on
or
rest
rict
ion
s, if
an
y. E
nd
ow
men
t p
rin
cip
al, s
tud
ent
loan
fu
nd
s, a
nd
pla
nt
fun
ds
are
no
t co
nsi
der
ed c
urr
ent
fun
ds,
as
they
are
hel
d f
or
oth
er s
pec
ific
pu
rpo
ses.

Appendix A: Consolidated Budgets for Schools, Academic Support Areas, and Auxiliaries 51
Sch
oo
l o
f L
aw
20
00
/0
1 C
on
so
lid
ate
d F
ore
ca
st
(in
th
ou
san
ds
of
do
llar
s)
Op
erat
ing
Des
ign
ated
Res
tric
ted
Res
tric
ted
Gra
nts
&B
ud
get
Fun
ds
Exp
end
able
En
do
wm
ent
Co
ntr
acts
Tota
l
Rev
enu
es a
nd
Tra
nsf
ers
Gen
eral
Fu
nd
s A
llo
cati
on
10,8
5010
,850
Res
tric
ted
Rev
enu
es1,
250
6,30
013
,200
750
21,5
00
Tran
sfer
s w
ith
in C
urr
ent
Fun
ds
16,6
15(4
00)
(3,9
50)
(11,
800)
465
Tran
sfer
s (t
o)/
fro
m E
nd
ow
men
t P
rin
cip
al
Tran
sfer
s (t
o)/
fro
m P
lan
t/S
tud
ent
Loan
(600
)(6
00)
Tota
l R
even
ues
an
d T
ran
sfer
s27
,465
850
2,35
080
075
032
,215
Exp
end
itu
res
Aca
dem
ic S
alar
ies
8,40
065
900
325
400
10,0
90
Sta
ff S
alar
ies
5,75
015
050
012
510
06,
625
Tota
l B
enef
its
3,46
053
342
110
122
4,08
7
Tota
l N
on
-Sal
ary
Exp
end
itu
res
8,74
357
550
012
512
810
,071
Lib
rary
Acq
uis
itio
ns
1,11
21,
112
Tota
l E
xpen
dit
ure
s27
,465
843
2,24
268
575
031
,985
Exc
ess
of
Rev
enu
e o
ver
Exp
end
itu
res
710
811
523
0
Beg
inn
ing
Op
erat
ing
Eq
uit
y40
08,
000
2,50
010
,900
En
din
g O
per
atin
g E
qu
ity
407
8,10
82,
615
11,1
30
No
tes:
•O
per
atin
g e
qu
ity
rep
rese
nts
res
erve
s av
aila
ble
fo
r fu
ture
use
s, a
lon
g w
ith
pro
ject
s an
d f
un
d b
alan
ces
rest
rict
ed f
or
spec
ial p
urp
ose
s.O
per
atin
g e
qu
ity
may
incl
ud
e fu
nd
s th
at a
re s
pec
ific
ally
inve
sted
an
d t
her
efo
re n
ot
avai
lab
le f
or
exp
end
itu
re in
th
e cu
rren
t p
erio
d.
•T
his
bu
dg
et d
oes
no
t re
flec
t an
allo
cati
on
of
tuit
ion
rev
enu
e o
r o
f ce
ntr
al a
dm
inis
trat
ive
cost
s. T
his
is c
on
sist
ent
wit
h S
tanf
ord
’s p
olic
yfo
r th
ose
un
its
no
t o
per
atin
g u
nd
er a
fo
rmu
la a
rran
gem
ent.
•C
urr
ent
fun
ds
are
reso
urc
es t
hat
are
exp
end
able
fo
r th
e p
rim
ary
inst
ruct
ion
an
d r
esea
rch
mis
sio
n o
f th
e U
niv
ersi
ty, w
ith
in a
cco
un
tin
gan
d d
on
or
rest
rict
ion
s, if
an
y. E
nd
ow
men
t p
rin
cip
al, s
tud
ent
loan
fu
nd
s, a
nd
pla
nt
fun
ds
are
no
t co
nsi
der
ed c
urr
ent
fun
ds,
as
they
are
hel
d f
or
oth
er s
pec
ific
pu
rpo
ses.

52 Appendix A: Consolidated Budgets for Schools, Academic Support Areas, and Auxiliaries
Vic
e P
rov
ost
for
Un
de
rgra
du
ate
Ed
uca
tio
n
20
00
/0
1 C
on
so
lid
ate
d F
ore
ca
st
(in
th
ou
san
ds
of
do
llar
s)
Op
erat
ing
Des
ign
ated
Res
tric
ted
Res
tric
ted
Gra
nts
&B
ud
get
Fu
nd
sE
xpen
dab
leE
nd
ow
men
tC
on
trac
tsTo
tal
Rev
enu
es a
nd
Tra
nsf
ers
Gen
eral
Fu
nd
s A
llo
cati
on
10,2
2410
,224
Res
tric
ted
Rev
enu
es15
3,80
31,
675
355,
528
Tran
sfer
s w
ith
in C
urr
ent
Fun
ds
6,92
0(3
21)
(3,8
31)
(3,7
53)
(985
)
Tran
sfer
s (t
o)/
fro
m E
nd
ow
men
t P
rin
cip
al1,
970
1,97
0
Tran
sfer
s (t
o)/
fro
m P
lan
t/S
tud
ent
Loan
Tota
l R
even
ues
an
d T
ran
sfer
s17
,144
(306
)(2
8)(1
08)
3516
,737
Exp
end
itu
res
Aca
dem
ic S
alar
ies
6,86
36,
863
Sta
ff S
alar
ies
3,30
25
1020
283,
365
Tota
l B
enef
its
1,77
63
67
1,79
2
Tota
l N
on
-Sal
ary
Exp
end
itu
res
5,20
315
255
5,24
8
Tota
l E
xpen
dit
ure
s17
,144
2038
3135
17,2
68
Exc
ess
of
Rev
enu
e o
ver
Exp
end
itu
res
(326
)(6
6)(1
39)
(531
)
Beg
inn
ing
Op
erat
ing
Eq
uit
y67
568
352
51,
883
En
din
g O
per
atin
g E
qu
ity
349
617
386
1,35
2
No
tes:
•O
per
atin
g e
qu
ity
rep
rese
nts
res
erve
s av
aila
ble
fo
r fu
ture
use
s, a
lon
g w
ith
pro
ject
s an
d f
un
d b
alan
ces
rest
rict
ed f
or
spec
ial p
urp
ose
s.O
per
atin
g e
qu
ity
may
incl
ud
e fu
nd
s th
at a
re s
pec
ific
ally
inve
sted
an
d t
her
efo
re n
ot
avai
lab
le f
or
exp
end
itu
re in
th
e cu
rren
t p
erio
d.
•T
his
bu
dg
et d
oes
no
t re
flec
t an
allo
cati
on
of
tuit
ion
rev
enu
e o
r o
f ce
ntr
al a
dm
inis
trat
ive
cost
s. T
his
is c
on
sist
ent
wit
h S
tanf
ord
’s p
olic
yfo
r th
ose
un
its
no
t o
per
atin
g u
nd
er a
fo
rmu
la a
rran
gem
ent.
•C
urr
ent
fun
ds
are
reso
urc
es t
hat
are
exp
end
able
fo
r th
e p
rim
ary
inst
ruct
ion
an
d r
esea
rch
mis
sio
n o
f th
e U
niv
ersi
ty, w
ith
in a
cco
un
tin
gan
d d
on
or
rest
rict
ion
s, if
an
y. E
nd
ow
men
t p
rin
cip
al, s
tud
ent
loan
fu
nd
s, a
nd
pla
nt
fun
ds
are
no
t co
nsi
der
ed c
urr
ent
fun
ds,
as
they
are
hel
d f
or
oth
er s
pec
ific
pu
rpo
ses.

Appendix A: Consolidated Budgets for Schools, Academic Support Areas, and Auxiliaries 53
Vic
e P
rov
ost
an
d D
ea
n o
f R
ese
arc
h a
nd
Gra
du
ate
Po
licy
20
00
/0
1 C
on
so
lid
ate
d F
ore
ca
st
(in
th
ou
san
ds
of
do
llar
s)
Op
erat
ing
Des
ign
ated
Res
tric
ted
Res
tric
ted
Gra
nts
&B
ud
get
Fun
ds
Exp
end
able
En
do
wm
ent
Co
ntr
acts
Tota
l
Rev
enu
es a
nd
Tra
nsf
ers
Gen
eral
Fu
nd
s A
llo
cati
on
14,4
7714
,477
Res
tric
ted
Rev
enu
es91
17,
599
5,20
418
,295
73,0
3910
5,04
8
Tran
sfer
s w
ith
in C
urr
ent
Fun
ds
6,78
5(3
,478
)(9
58)
(12,
143)
(9,7
94)
Tran
sfer
s (t
o)/
fro
m E
nd
ow
men
t
Tran
sfer
s (t
o)/
fro
m P
lan
t/S
tud
ent
Loan
Tota
l R
even
ues
an
d T
ran
sfer
s22
,173
4,12
14,
246
6,15
273
,039
109,
731
Exp
end
itu
res
Aca
dem
ic S
alar
ies
2,46
762
361
21,
435
5,40
910
,546
Sta
ff S
alar
ies
10,9
2295
591
075
210
,215
23,7
54
Tota
l B
enef
its
3,32
831
937
037
72,
832
7,22
6
Tota
l N
on
-Sal
ary
Exp
end
itu
res
5,45
63,
072
3,03
61,
419
54,5
8367
,566
Tota
l E
xpen
dit
ure
s22
,173
4,96
94,
928
3,98
373
,039
109,
092
Exc
ess
of
Rev
enu
e o
ver
Exp
end
itu
res
(848
)(6
82)
2,16
963
9
Beg
inn
ing
Op
erat
ing
Eq
uit
y17
,873
10,3
329,
486
37,6
91
En
din
g O
per
atin
g E
qu
ity
17,0
759,
650
11,6
5538
,330
No
tes:
•O
per
atin
g e
qu
ity
rep
rese
nts
res
erve
s av
aila
ble
fo
r fu
ture
use
s, a
lon
g w
ith
pro
ject
s an
d f
un
d b
alan
ces
rest
rict
ed f
or
spec
ial p
urp
ose
s.O
per
atin
g e
qu
ity
may
incl
ud
e fu
nd
s th
at a
re s
pec
ific
ally
inve
sted
an
d t
her
efo
re n
ot
avai
lab
le f
or
exp
end
itu
re in
th
e cu
rren
t p
erio
d.
•T
his
bu
dg
et d
oes
no
t re
flec
t an
allo
cati
on
of
tuit
ion
rev
enu
e o
r o
f ce
ntr
al a
dm
inis
trat
ive
cost
s. T
his
is c
on
sist
ent
wit
h S
tan
ford
’s p
olic
yfo
r th
ose
un
its
no
t o
per
atin
g u
nd
er a
fo
rmu
la a
rran
gem
ent.
•C
urr
ent
fun
ds
are
reso
urc
es t
hat
are
exp
end
able
fo
r th
e p
rim
ary
inst
ruct
ion
an
d r
esea
rch
mis
sio
n o
f th
e U
niv
ersi
ty, w
ith
in a
cco
un
tin
gan
d d
on
or
rest
rict
ion
s, if
an
y. E
nd
ow
men
t p
rin
cip
al, s
tud
ent
loan
fu
nd
s, a
nd
pla
nt
fun
ds
are
no
t co
nsi
der
ed c
urr
ent
fun
ds,
as
they
are
hel
d f
or
oth
er s
pec
ific
pu
rpo
ses.

54 Appendix A: Consolidated Budgets for Schools, Academic Support Areas, and Auxiliaries
Gra
du
ate
Sch
oo
l o
f B
usin
ess (
wit
h S
ch
wa
b)
20
00
/0
1 C
on
so
lid
ate
d F
ore
ca
st
(in
th
ou
san
ds
of
do
llar
s)
Op
erat
ing
Des
ign
ated
Res
tric
ted
Res
tric
ted
Gra
nts
&A
uxi
liar
yB
ud
get
Fun
ds
Exp
end
able
En
do
wm
ent
Co
ntr
acts
Sch
wab
Tota
l
Rev
enu
es a
nd
Tra
nsf
ers
Gen
eral
Fu
nd
s A
llo
cati
on
26
,405
26
,405
Res
tric
ted
Rev
enu
es
15,2
79
13,9
05
18,5
50
5
0
5,
900
53
,684
Tran
sfer
s w
ith
in C
urr
ent
Fun
ds
42,3
17(5
,267
)(1
8,50
0)(1
8,55
0)
Tran
sfer
s (t
o)/
fro
m E
nd
ow
men
t(2
99)
(299
)
Tran
sfer
s (t
o)/
fro
m P
lan
t/S
tud
ent
Loan
(1
,500
)
(1,5
00)
Tota
l R
even
ues
an
d T
ran
sfer
s68
,722
8,51
2
(4,5
95)
50
5,60
1
78,2
90
Exp
end
itu
res
Aca
dem
ic S
alar
ies
19
,934
1,97
8
7
5
21,9
87
Sta
ff S
alar
ies
13
,311
6
85
295
14
,291
Tota
l B
enef
its
8,27
5
694
20
75
9,06
4
Tota
l N
on
-Sal
ary
Exp
end
itu
res
26
,792
6,90
6
5
5
3,
831
37
,584
Deb
t S
ervi
ce
410
1,40
0
1,
810
Tota
l E
xpen
dit
ure
s68
,722
10
,263
1
50
5,
601
84
,736
Exc
ess
of
Rev
enu
e o
ver
Exp
end
itu
res
(1,7
51)
(4,
595)
(10
0)
(6,4
46)
Beg
inn
ing
Op
erat
ing
Eq
uit
y6,
661
20
,236
2,27
2
150
29
,319
En
din
g O
per
atin
g E
qu
ity
4,91
0
15,6
41
2,
272
50
22
,873
No
tes:
•O
per
atin
g e
qu
ity
rep
rese
nts
res
erve
s av
aila
ble
fo
r fu
ture
use
s, a
lon
g w
ith
pro
ject
s an
d f
un
d b
alan
ces
rest
rict
ed f
or
spec
ial p
urp
ose
s.O
per
atin
g e
qu
ity
may
incl
ud
e fu
nd
s th
at a
re s
pec
ific
ally
inve
sted
an
d t
her
efo
re n
ot
avai
lab
le f
or
exp
end
itu
re in
th
e cu
rren
t p
erio
d.
•C
urr
ent
fun
ds
are
reso
urc
es t
hat
are
exp
end
able
fo
r th
e p
rim
ary
inst
ruct
ion
an
d r
esea
rch
mis
sio
n o
f th
e U
niv
ersi
ty, w
ith
in a
cco
un
tin
gan
d d
on
or
rest
rict
ion
s, if
an
y. E
nd
ow
men
t p
rin
cip
al, s
tud
ent
loan
fu
nd
s, a
nd
pla
nt
fun
ds
are
no
t co
nsi
der
ed c
urr
ent
fun
ds,
as
they
are
hel
d f
or
oth
er s
pec
ific
pu
rpo
ses.

Appendix A: Consolidated Budgets for Schools, Academic Support Areas, and Auxiliaries 55
Sch
oo
l o
f M
ed
icin
e
20
00
/0
1 C
on
so
lid
ate
d F
ore
ca
st
(in
th
ou
san
ds
of
do
llar
s)
Op
erat
ing
Des
ign
ated
Res
tric
ted
Res
tric
ted
Gra
nts
&A
uxi
liar
yB
ud
get
Fun
ds
Exp
end
able
En
do
wm
ent
Co
ntr
acts
Act
ivit
ies
Tota
l
Rev
enu
es a
nd
Tra
nsf
ers
Gen
eral
Fu
nd
s A
llo
cati
on
71,9
0871
,908
Res
tric
ted
Rev
enu
es77
,157
25,1
5353
,581
254,
795
12,8
4442
3,53
0
Tran
sfer
s w
ith
in C
urr
ent
Fun
ds
31,0
81(9
,633
)(1
1,96
0)(9
,489
)97
,919
97,9
19
Tran
sfer
s (t
o)/
fro
m E
nd
ow
men
t P
rin
cip
al(3
,500
)(5
0)29
,484
25,9
34
Tran
sfer
s (t
o)/
fro
m P
lan
t/S
tud
ent
Loan
(12,
824)
(1,0
00)
(29,
529)
(43,
353)
Tota
l R
even
ues
an
d T
ran
sfer
s10
2,98
951
,200
12,1
4344
,047
254,
795
110,
763
575,
938
Exp
end
itu
res
Aca
dem
ic S
alar
ies
9,03
525
,196
2,98
25,
541
33,9
3563
,746
140,
435
Sta
ff S
alar
ies
25,1
9610
,194
5,53
51,
463
56,3
7919
,855
118,
622
Tota
l B
enef
its
8,17
46,
809
1,86
51,
760
19,5
6920
,487
58,6
64
Tota
l N
on
-Sal
ary
Exp
end
itu
res
28,8
5826
,108
16,4
179,
138
143,
463
5,97
822
9,96
2
Lib
rary
Acq
uis
itio
ns
1,84
119
849
2,70
9
Uti
liti
es10
,122
7210
,194
O&
M17
,193
423
185
541,
449
407
19,7
11
Deb
t S
ervi
ce2,
570
621
82,
794
Tota
l E
xpen
dit
ure
s10
2,98
968
,730
27,0
0318
,811
254,
795
110,
763
583,
091
Exc
ess
of
Rev
enu
e o
ver
Exp
end
itu
res
(17,
350)
(14,
860)
25,2
36(7
,153
)
Beg
inn
ing
Op
erat
ing
Eq
uit
y97
,481
79,1
9284
,894
261,
567
En
din
g O
per
atin
g E
qu
ity
79,9
5164
,332
110,
130
254,
414
No
tes:
•O
per
atin
g e
qu
ity
rep
rese
nts
res
erve
s av
aila
ble
fo
r fu
ture
use
s, a
lon
g w
ith
pro
ject
s an
d f
un
d b
alan
ces
rest
rict
ed f
or
spec
ial p
urp
ose
s.O
per
atin
g e
qu
ity
may
incl
ud
e fu
nd
s th
at a
re s
pec
ific
ally
inve
sted
an
d t
her
efo
re n
ot
avai
lab
le f
or
exp
end
itu
re in
th
e cu
rren
t p
erio
d.
•C
urr
ent
fun
ds
are
reso
urc
es t
hat
are
exp
end
able
fo
r th
e p
rim
ary
inst
ruct
ion
an
d r
esea
rch
mis
sio
n o
f th
e U
niv
ersi
ty, w
ith
in a
cco
un
tin
gan
d d
on
or
rest
rict
ion
s, if
an
y. E
nd
ow
men
t p
rin
cip
al, s
tud
ent
loan
fu
nd
s, a
nd
pla
nt
fun
ds
are
no
t co
nsi
der
ed c
urr
ent
fun
ds,
as
they
are
hel
d f
or
oth
er s
pec
ific
pu
rpo
ses.

56 Appendix A: Consolidated Budgets for Schools, Academic Support Areas, and Auxiliaries
Ho
ov
er
Insti
tuti
on
20
00
/0
1 C
on
so
lid
ate
d F
ore
ca
st
(in
th
ou
san
ds
of
do
llar
s)
Op
erat
ing
Des
ign
ated
Res
tric
ted
Res
tric
ted
Gra
nts
&B
ud
get
Fun
ds
Exp
end
able
En
do
wm
ent
Co
ntr
acts
Tota
l
Rev
enu
es a
nd
Tra
nsf
ers
Gen
eral
Fu
nd
s A
llo
cati
on
4,19
14,
191
Res
tric
ted
Rev
enu
es50
010
,000
13,6
0012
024
,220
Tran
sfer
s w
ith
in C
urr
ent
Fun
ds
23,7
50(1
50)
(10,
000)
(13,
600)
Tran
sfer
s (t
o)/
fro
m E
nd
ow
men
t P
rin
cip
al
Tran
sfer
s (t
o)/
fro
m P
lan
t/S
tud
ent
Loan
Tota
l R
even
ues
an
d T
ran
sfer
s27
,941
350
120
28,4
11
Exp
end
itu
res
Aca
dem
ic S
alar
ies
5,13
65,
136
Sta
ff S
alar
ies
7,94
820
7,96
8
Tota
l B
enef
its
3,27
13,
271
Tota
l N
on
-Sal
ary
Exp
end
itu
res
8,89
235
010
09,
342
Lib
rary
Acq
uis
itio
ns
1,90
31,
903
Tota
l E
xpen
dit
ure
s27
,150
350
120
27,6
20
Exc
ess
of
Rev
enu
e o
ver
Exp
end
itu
res
791
791
Beg
inn
ing
Op
erat
ing
Eq
uit
y18
,545
18,5
45
En
din
g O
per
atin
g E
qu
ity
19,3
3619
,336
No
tes:
•O
per
atin
g e
qu
ity
rep
rese
nts
res
erve
s av
aila
ble
fo
r fu
ture
use
s, a
lon
g w
ith
pro
ject
s an
d f
un
d b
alan
ces
rest
rict
ed f
or
spec
ial p
urp
ose
s.O
per
atin
g e
qu
ity
may
incl
ud
e fu
nd
s th
at a
re s
pec
ific
ally
inve
sted
an
d t
her
efo
re n
ot
avai
lab
le f
or
exp
end
itu
re in
th
e cu
rren
t p
erio
d.
•C
urr
ent
fun
ds
are
reso
urc
es t
hat
are
exp
end
able
fo
r th
e p
rim
ary
inst
ruct
ion
an
d r
esea
rch
mis
sio
n o
f th
e U
niv
ersi
ty, w
ith
in a
cco
un
tin
gan
d d
on
or
rest
rict
ion
s, if
an
y. E
nd
ow
men
t p
rin
cip
al, s
tud
ent
loan
fu
nd
s, a
nd
pla
nt
fun
ds
are
no
t co
nsi
der
ed c
urr
ent
fun
ds,
as
they
are
hel
d f
or
oth
er s
pec
ific
pu
rpo
ses.

Appendix A: Consolidated Budgets for Schools, Academic Support Areas, and Auxiliaries 57
Sta
nfo
rd U
niv
ers
ity
Lib
rari
es a
nd
Aca
de
mic
In
form
ati
on
Re
so
urc
es (
SU
L /
AIR
)
20
00
/0
1 C
on
so
lid
ate
d F
ore
ca
st
(in
th
ou
san
ds
of
do
llar
s)
Op
erat
ing
Des
ign
ated
Res
tric
ted
Res
tric
ted
Gra
nts
&B
ud
get
Fun
ds
Exp
end
able
En
do
wm
ent
Co
ntr
acts
Tota
l
Rev
enu
es a
nd
Tra
nsf
ers
Gen
eral
Fu
nd
s A
llo
cati
on
30,8
5130
,851
Res
tric
ted
Rev
enu
es12
,533
1,23
56,
895
20,6
63
Tran
sfer
s w
ith
in C
urr
ent
Fun
ds
14,8
18(1
2,33
3)(4
92)
(1,9
93)
Tran
sfer
s (t
o)/
fro
m E
nd
ow
men
t P
rin
cip
al
Tran
sfer
s (t
o)/
fro
m P
lan
t/S
tud
ent
Loan
Tota
l R
even
ues
an
d T
ran
sfer
s45
,669
200
743
4,90
251
,514
Exp
end
itu
res
Aca
dem
ic S
alar
ies
Sta
ff S
alar
ies
23,7
0523
,705
Tota
l B
enef
its
5,96
35,
963
Tota
l N
on
-Sal
ary
Exp
end
itu
res
7,40
320
074
393
49,
280
Lib
rary
Acq
uis
itio
ns
8,59
83,
968
12,5
66
Tota
l E
xpen
dit
ure
s45
,669
200
743
4,90
251
,514
Exc
ess
of
Rev
enu
e o
ver
Exp
end
itu
res
Beg
inn
ing
Op
erat
ing
Eq
uit
y20
02,
100
1,20
03,
500
En
din
g O
per
atin
g E
qu
ity
200
2,10
01,
200
3,50
0
No
tes:
•O
per
atin
g e
qu
ity
rep
rese
nts
res
erve
s av
aila
ble
fo
r fu
ture
use
s, a
lon
g w
ith
pro
ject
s an
d f
un
d b
alan
ces
rest
rict
ed f
or
spec
ial p
urp
ose
s.O
per
atin
g e
qu
ity
may
incl
ud
e fu
nd
s th
at a
re s
pec
ific
ally
inve
sted
an
d t
her
efo
re n
ot
avai
lab
le f
or
exp
end
itu
re in
th
e cu
rren
t p
erio
d.
•T
his
bu
dg
et d
oes
no
t re
flec
t an
allo
cati
on
of
tuit
ion
rev
enu
e o
r o
f ce
ntr
al a
dm
inis
trat
ive
cost
s. T
his
is c
on
sist
ent
wit
h S
tanf
ord
’s p
olic
yfo
r th
ose
un
its
no
t o
per
atin
g u
nd
er a
fo
rmu
la a
rran
gem
ent.
•C
urr
ent
fun
ds
are
reso
urc
es t
hat
are
exp
end
able
fo
r th
e p
rim
ary
inst
ruct
ion
an
d r
esea
rch
mis
sio
n o
f th
e U
niv
ersi
ty, w
ith
in a
cco
un
tin
gan
d d
on
or
rest
rict
ion
s, if
an
y. E
nd
ow
men
t p
rin
cip
al, s
tud
ent
loan
fu
nd
s, a
nd
pla
nt
fun
ds
are
no
t co
nsi
der
ed c
urr
ent
fun
ds,
as
they
are
hel
d f
or
oth
er s
pec
ific
pu
rpo
ses.

58 Appendix A: Consolidated Budgets for Schools, Academic Support Areas, and Auxiliaries
Vic
e P
rov
ost
for
Stu
de
nt
Aff
air
s
20
00
/0
1 C
on
so
lid
ate
d F
ore
ca
st
(in
th
ou
san
ds
of
do
llar
s)
Op
erat
ing
Des
ign
ated
Res
tric
ted
Res
tric
ted
Gra
nts
&B
ud
get
Fun
ds
Exp
end
able
En
do
wm
ent
Co
ntr
acts
Tota
l
Rev
enu
es a
nd
Tra
nsf
ers
Gen
eral
Fu
nd
s A
llo
cati
on
33,2
0933
,209
Res
tric
ted
Rev
enu
es4,
142
499
1,38
160
66,
628
Tran
sfer
s w
ith
in C
urr
ent
Fun
ds
2,42
7(1
,562
)(5
93)
272
Tran
sfer
s (t
o)/
fro
m E
nd
ow
men
t P
rin
cip
al
Tran
sfer
s (t
o)/
fro
m P
lan
t/S
tud
ent
Loan
(4,3
00)
(4,3
00)
Tota
l R
even
ues
an
d T
ran
sfer
s35
,636
(1,7
20)
499
788
606
35,8
09
Exp
end
itu
res
Aca
dem
ic S
alar
ies
Sta
ff S
alar
ies
10,5
7835
513
912
030
111
,493
Tota
l B
enef
its
2,57
078
2827
712,
774
Tota
l N
on
-Sal
ary/
No
n-A
id E
xpen
dit
ure
s9,
299
1,11
630
936
523
411
,323
Tota
l U
nd
erg
rad
uat
e A
id12
,958
12,9
58
Tota
l G
rad
uat
e A
id23
123
1
Tota
l E
xpen
dit
ure
s35
,636
1,54
947
651
260
638
,779
Exc
ess
of
Rev
enu
e o
ver
Exp
end
itu
res
(3,2
69)
2327
6(2
,970
)
Beg
inn
ing
Op
erat
ing
Eq
uit
y7,
863
1,00
41,
434
10,3
01
En
din
g O
per
atin
g E
qu
ity
4,59
41,
027
1,71
07,
331
No
tes:
•O
per
atin
g e
qu
ity
rep
rese
nts
res
erve
s av
aila
ble
fo
r fu
ture
use
s, a
lon
g w
ith
pro
ject
s an
d f
un
d b
alan
ces
rest
rict
ed f
or
spec
ial p
urp
ose
s.O
per
atin
g e
qu
ity
may
incl
ud
e fu
nd
s th
at a
re s
pec
ific
ally
inve
sted
an
d t
her
efo
re n
ot
avai
lab
le f
or
exp
end
itu
re in
th
e cu
rren
t p
erio
d.
•T
his
bu
dg
et d
oes
no
t re
flec
t an
allo
cati
on
of
tuit
ion
rev
enu
e o
r o
f ce
ntr
al a
dm
inis
trat
ive
cost
s. T
his
is c
on
sist
ent
wit
h S
tanf
ord
’s p
olic
yfo
r th
ose
un
its
no
t o
per
atin
g u
nd
er a
fo
rmu
la a
rran
gem
ent.
•C
urr
ent
fun
ds
are
reso
urc
es t
hat
are
exp
end
able
fo
r th
e p
rim
ary
inst
ruct
ion
an
d r
esea
rch
mis
sio
n o
f th
e U
niv
ersi
ty, w
ith
in a
cco
un
tin
gan
d d
on
or
rest
rict
ion
s, if
an
y. E
nd
ow
men
t p
rin
cip
al, s
tud
ent
loan
fu
nd
s, a
nd
pla
nt
fun
ds
are
no
t co
nsi
der
ed c
urr
ent
fun
ds,
as
they
are
hel
d f
or
oth
er s
pec
ific
pu
rpo
ses.

Appendix A: Consolidated Budgets for Schools, Academic Support Areas, and Auxiliaries 59
Le
arn
ing
Te
ch
no
log
y a
nd
Ex
ten
de
d E
du
ca
tio
n (
inclu
de
s L
ea
rnin
g L
ab
)
20
00
/2
00
1 C
on
so
lid
ate
d F
ore
ca
st
(in
th
ou
san
ds
of
do
llar
s)
Op
erat
ing
Des
ign
ated
Res
tric
ted
Res
tric
ted
Gra
nts
&B
ud
get
Fun
ds
Exp
end
able
En
do
wm
ent
Co
ntr
acts
Tota
l
Rev
enu
es a
nd
Tra
nsf
ers
Gen
eral
Fu
nd
s A
llo
cati
on
10,5
8510
,585
Res
tric
ted
Rev
enu
es5,
065
1,50
06,
565
Tran
sfer
s b
etw
een
un
its
(1,2
00)
2,53
31,
333
Tran
sfer
s (t
o)/
fro
m D
esig
nat
ed(1
,096
)1,
096
Tran
sfer
s (t
o)/
fro
m E
nd
ow
men
t
Tran
sfer
s (t
o)/
fro
m P
lan
t/S
tud
ent
Loan
Tota
l R
even
ues
an
d T
ran
sfer
s8,
289
8,69
41,
500
18,4
83
Exp
end
itu
res
Aca
dem
ic S
alar
ies
2,96
12,
961
Sta
ff S
alar
ies
1,49
44,
767
6,26
1
Tota
l B
enef
its
484
1,20
71,
689
Tota
l N
on
-Sal
ary
Exp
end
itu
res
3,35
23,
583
1,50
08,
435
Tota
l E
xpen
dit
ure
s8,
289
9,55
71,
500
19,3
46
Exc
ess
of
Rev
enu
e o
ver
Exp
end
itu
res
(863
)(8
63)
Beg
inn
ing
Op
erat
ing
Eq
uit
y5,
700
En
din
g O
per
atin
g E
qu
ity
4,83
7
No
tes:
•O
per
atin
g e
qu
ity
rep
rese
nts
res
erve
s av
aila
ble
fo
r fu
ture
use
s, a
lon
g w
ith
pro
ject
s an
d f
un
d b
alan
ces
rest
rict
ed f
or
spec
ial p
urp
ose
s.O
per
atin
g e
qu
ity
may
incl
ud
e fu
nd
s th
at a
re s
pec
ific
ally
inve
sted
an
d t
her
efo
re n
ot
avai
lab
le f
or
exp
end
itu
re in
th
e cu
rren
t p
erio
d.
•T
his
bu
dg
et d
oes
no
t re
flec
t an
allo
cati
on
of
tuit
ion
rev
enu
e o
r o
f ce
ntr
al a
dm
inis
trat
ive
cost
s. T
his
is c
on
sist
ent
wit
h S
tan
ford
’s p
olic
yfo
r th
ose
un
its
no
t o
per
atin
g u
nd
er a
fo
rmu
la a
rran
gem
ent.
•C
urr
ent
fun
ds
are
reso
urc
es t
hat
are
exp
end
able
fo
r th
e p
rim
ary
inst
ruct
ion
an
d r
esea
rch
mis
sio
n o
f th
e U
niv
ersi
ty, w
ith
in a
cco
un
tin
gan
d d
on
or
rest
rict
ion
s, if
an
y. E
nd
ow
men
t p
rin
cip
al, s
tud
ent
loan
fu
nd
s, a
nd
pla
nt
fun
ds
are
no
t co
nsi
der
ed c
urr
ent
fun
ds,
as
they
are
hel
d f
or
oth
er s
pec
ific
pu
rpo
ses.

60 Appendix A: Consolidated Budgets for Schools, Academic Support Areas, and Auxiliaries
Alumni Association
Income
Program Revenue 19,732
Advertising 600
Annual Membership 147
Life Membership 953
General Fund Allocation 2,279
Presidential Funds 1,251
Investment Income 1,451
Interdepartmental Charges 398
Donations 1,893
Royalties 946
Liquidation of Membership
Fund Investments 606
Total Income 30,256
Expenses
Salaries and Benefits 7,288
Part-Time/Student/Temporary Help 115
Participant and Staff Expenses 18,786
Outside Services 542
Materials and Supplies 2,973
Other Non-Salary Expenses 802
Total Expenses 30,506
Operating Gain/Loss (250)
Athletics
Operating
Income
Intercollegiate 13,344
Unrestricted Funds 6,167
Golf Course 5,006
General Funds 4,008
Restricted Funds 4,140
Faculty-Staff Recreation 950
Transfers (636)
Total Income 32,979
Expenses
Compensation 14,478
Sport Programs 7,261
Facilities & Events 3,815
Student Services 1,121
Administration 5,092
University Overhead 1,212
Other Non-Salary 0
Total Expenses 32,979
Operating Gain/(Loss) 0
Financial Aid
Restricted Income 10,773
Expenses 10,773
Gain/(Loss) 0
Consolidated
Total Income 43,752
Total Expenses 43,752
Gain/(Loss) 0
Auxiliary Enterprises
2000/01 Consolidated Forecast
(in thousands of dollars)

Appendix A: Consolidated Budgets for Schools, Academic Support Areas, and Auxiliaries 61
Auxiliary Enterprises
2000/01 Consolidated Forecast
(in thousands of dollars)
Stanford University Press
Income
Net Income 4,736
Cost of Sales (2,415)
Other Income 413
University Subsidy 484
Strategic Initiatives 381
Total Income 3,599
Expenses
Editorial 1,015
Production & Design 305
Marketing 988
Distribution 586
Accounting 205
Office & General 556
University Overhead 250
Total Expenses 3,905
Operating Gain/Loss (306)
Housing and Dining Services
Income
Student Housing 55,961
Dining Services 21,298
Conference Services 3,864
Investment Income 944
Total Income 82,067
Expenses
Student Housing 51,869
Dining Services 20,151
Conference Services 2,740
Facilities Expenses 8,832
Total Expenses 83,592
Operating Gain/Loss (1,525)

62 Appendix A: Consolidated Budgets for Schools, Academic Support Areas, and Auxiliaries

Appendix B: Supplementary Information 63
Appendix BSupplementary Information
The tables and graphs in this Appendix are usefulin providing a general picture of Stanford’s statusin many areas. The short annotations below serveas an introduction to the schedules and point outsome interesting trends or historical occurrences.
Schedule 1 – Student Enrollment
Women undergraduates outnumbered men in1999/00, as they have since 1996/97. The numberof TGR’s increased markedly in 1997/98, primarilybecause changes in Federal policy requiringpayment of the tuition of Research Assistantsdirectly from research contracts and grantsprovided a strong incentive for encouragingeligible graduate to register as TGRs. This yearthere was a slight decline in TGRs, but the num-ber remains at about the 1996/97 level. The totalnumber of graduate students again increased bymore than 100 in 1999/00, continuing the upwardrise of graduate students for the last four years.
Schedule 2 – Freshman Student Apply/Admit/Matriculate Statistics
The number of applicants dropped by 5.1% in theFall of 1999 from a record number in 1998, but thenumber of applications is still higher than Fall1997. Only 15% of applicants were accepted (onein every 12.5 applicants). This is higher than lastyear, but the lowest in the past ten years. The yieldrate continues to rise both as a result of Stanford’spopularity and the addition of an early decisionprogram in 1996.
Schedule 3 – Tuition and Room & Board Rates
In the early 1980’s tuition at Stanford rose by atleast 9% each year. The rates of increase slowedafter that, and in the last five years the rates ofincrease in total expense (tuition plus room andboard) have been the lowest in the entire period
shown in the table. In fact, the increases in tuitionthe last three years have been the lowest since thelate 1960’s, a time in which Stanford increasedtuition every other year rather than annually.
Schedule 4 – Tuition and Fee Income
Total tuition income is expected to increase at arate just about equal to the increase in the tuitionrate. The lower growth in graduate tuition isprimarily due to an overestimation last year ofengineering graduate student tuition. Applicationfees, the primary source of fee income, areexpected to grow at 2% above last year.
Schedule 5 – Undergraduate Financial Aid bySource of Funds and Type of Aid
This schedule shows the total amount of financialaid from all sources (including non-need basedscholarship aid for athletics) awarded to under-graduate students. The last row shows Stanfordtuition plus room and board. Total scholarshipsand grants increased by 1.4% percent last year,the second year of the change in financial aidformulas to reduce parental contribution. Totalloans declined to about the 1996/97 level, afterjumping in 1997/98. The work component offinancial aid has been declining since 1993/94.
Schedule 6 – Needs and Sources, IncludingParental and Student Contributions
This schedule shows the total expense and sourcesof support for undergraduate students who receiveneed-based financial aid. The last row shows thenumber of students who receive need-based aid.The expected need amount increases by more thanthe tuition, room, and board increase for next yearbecause we expect slightly more students to beaided. On the “Sources” side for 2000/01 theexpected family contribution is expected to

64 Appendix B: Supplementary Information
decrease by 5.5% due to a new financial aid policythat puts a cap on the parental contribution formiddle-income families and reduces self-help forall students. Endowment income and unrestrictedfunds will fill in. Since fewer unrestricted fundswere needed in 1999/00 than expected, the per-centage increase in unrestricted funds for 2000/01is more pronounced than usual. Unrestrictedfunds are the source used to make up the differ-ence between need and all other sources, so theamount must increase disproportionately whenmost of the other sources are expected to grow lessthan need, as is the case for next year.
Schedule 7 – Total Professorial Faculty
The total professorate has increased by 46 people(about 3%) since last year. Much of this growthwas in the non-tenure line faculty, fueled byincreases in Medical Center Line faculty in theSchool of Medicine. Tenure line faculty hasincreased back to the 1991/92 level.
Schedule 8 – Distribution of Tenured,Non-Tenured, and Non-Tenure LineProfessorial Faculty
This schedule provides a disaggregated view of thedata in Schedule 7 over the last three years. Sched-ule 8 shows that while the number of tenure-linefaculty has grown, the number of tenure linefaculty who have not obtained tenure has increasedover the last 3 years, particularly in the SocialSciences and the School of Engineering. Bycontrast, the number of non-tenured tenure linefaculty has decreased as more faculty move to thenon-tenure line Medical Center Line positions.
Schedule 9 – Number of Non-TeachingEmployees
This schedule shows the number of regular(defined in the first footnote in the Schedule)non-teaching employees by activity. The activitycategories do not track well to the current report-ing relationships among administrative units, butto maintain consistency in these data over time inthe face of reorganizations, the activity categorieshave been defined broadly. Even with these broadcategories the table has a number of footnotesindicating shifts across the categories or other
changes over the period. The School of Medicinehas been particularly affected by organizationalchanges.
The number of employees increased by 316 in1999. About 155 of the increase are in the Schoolof Medicine. The other increases are distributedthroughout the University.
Schedule 10 – Staff Employees OutsideMedicine and SLAC
This graph shows the relation between two seriesof numbers of employees in various years since1989. The first series is staff employees in theschools (except Medicine) and independent labo-ratories (the sum of employees in the categorieslabeled “Other Academic” and “Institutes andResearch Labs” in the previous schedule.) Thesecond is a measure of “core” administrative staffwho are paid almost entirely from general funds.This category excludes those employed in theschools and labs, SLAC, and the auxiliary activi-ties in the previous schedule (Athletics, Housingand Food Service, Tresidder, and the Faculty Club).
The number of core staff trended down anddeclined by about 16% between 1989 and 1995until increasing 2% in 1996, 4% in 1997, 4% in1998 (after factoring out the Alumni Association),and almost 5% percent in 1999. In 1999, core staffexceeded the 1989 level for the first time.
Employment in the schools and independent labspeaked in 1987, and declined from 1989 to 1994by about 1.3% (after factoring in an estimate of theeffect of the movement of SSRL to SLAC). Sincethen, the number has increased 14%, and is nowwell above the 1987 peak. Much of this growth wasprobably related to a steady growth in sponsoredresearch (see Schedule 12). However, in 1999, thenumber of staff in the schools and labs droppedvery slightly, by 8 people.
Schedule 11 – Staff Benefits Detail
To support the various components of non-salarybenefits provided to employees, a benefits rate isassessed to all salary and wage transactions. Aftermomentous changes in 1997/98 (multiple benefitrates introduced, the removal of tuition remission

Appendix B: Supplementary Information 65
from the benefits pool, a change to a contributoryretirement plan for all non-union employees), thechanges for the last three years have been muchsimpler. (Except for the removal of the faculty/staff tuition grant program from the benefits poolin 1999/00). The changes in Insurance Programscategories, as well as any other noticeable increasesand decreases, are due to rate changes, moreemployees utilizing particular existing benefits, orcomplicated issues related to how Stanford fundsthese various programs.
Schedule 12 - Sponsored Research Expense byAgency and Fund Source
Direct expense from research sponsored by theFederal government increased each year in thetable. The amount of government sponsoredresearch did not grow as fast in 1998/99 as it didin 1997/98, but still increased by almost 2%. Therather small increase was mostly caused by adecrease in funding from NASA. Non-US Govern-ment sponsored research reached 13.9% of totalresearch expense in 1998/99, the highest percent-age in the years in this table. For years, charitablefoundations and corporations each supplied aboutone-third of the total of research funds fromnon-US agencies, but in the last three yearscorporations have sponsored about 40% of thistotal. (Please note that research at SLAC is notincluded in this Schedule.)
Schedule 13 - Plant Expenditures
This schedule shows expenses from plant orborrowed funds for building or infrastructureprojects related to various units. General PlantImprovement expenses are included in the “AllOther” category. To the extent possible, expendi-tures for equipment are excluded from thesecalculations. These expenses have more thandoubled from 1995/96 to 1997/98 due to theconstruction of the Science and Engineering Quadand various seismic upgrade and earthquake re-pair projects such as Green Library, the Museum,and Encina. Plant expenditures increased 7.7% in1998/99, due partly to the Core Financialscomputer system project and the early phases ofthe Sand Hill Road Projects.
Schedule 14 - Endowment Value and Rateof Return
The nominal return on invested funds has beenpositive each of the years shown and has generallyexceeded 10% per annum. The target for annualreal return on endowment funds is 6.25%, net ofmanagement fees. The average annual real returnover the entire period of the table has clearlyexceeded that figure, and the figure itself has beenmet in all but three years in the table. Historically,this period has produced exceptional marketreturns for both stock and bond investments, andthe market value of our endowment has obviouslybenefited.
1997/98 was an anomaly in that the general stockmarket suffered a severe downturn at the end ofAugust 1998, just as our fiscal year ended, whichhad the effect of reducing our market value at theprecise time it was benchmarked. However, themarket recovered that decline and much moreby the end of 1998/99, and so did the endowmentmarket value. 1998/99 was a superlative year forthe endowment, reflecting the general increase inthe stock market.
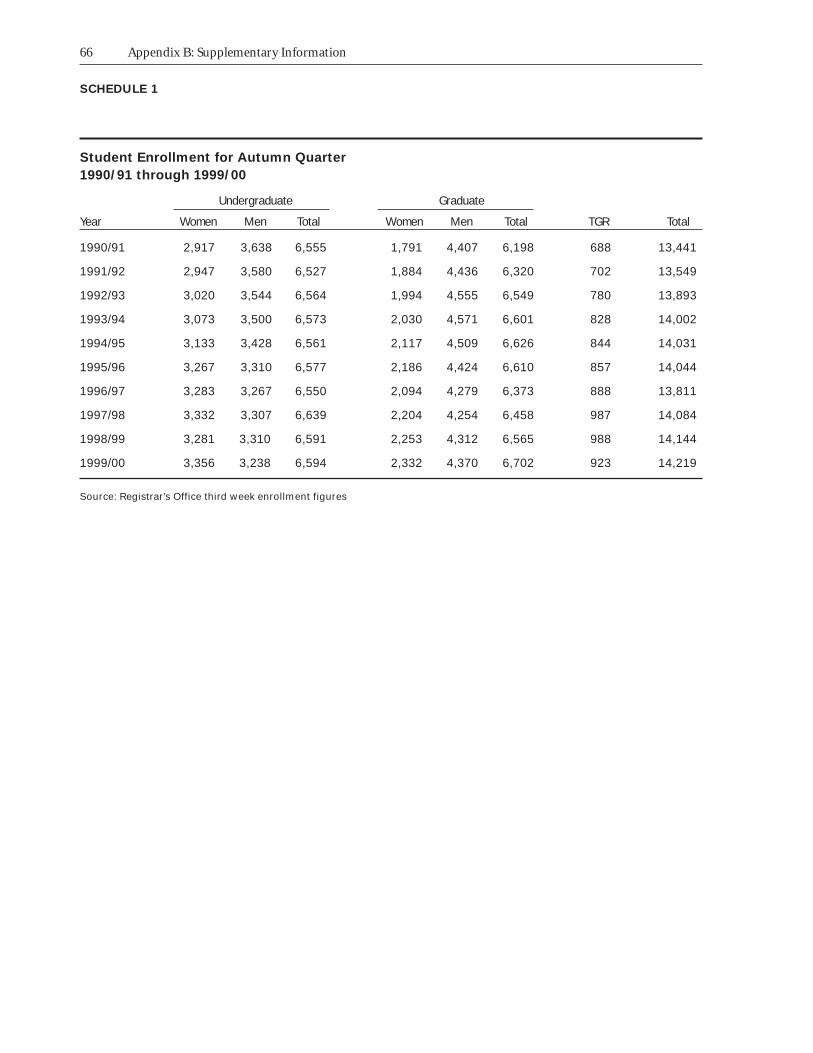
66 Appendix B: Supplementary Information
SCHEDULE 1
Student Enrollment for Autumn Quarter
1990/91 through 1999/00
Undergraduate Graduate
Year Women Men Total Women Men Total TGR Total
1990/91 2,917 3,638 6,555 1,791 4,407 6,198 688 13,441
1991/92 2,947 3,580 6,527 1,884 4,436 6,320 702 13,549
1992/93 3,020 3,544 6,564 1,994 4,555 6,549 780 13,893
1993/94 3,073 3,500 6,573 2,030 4,571 6,601 828 14,002
1994/95 3,133 3,428 6,561 2,117 4,509 6,626 844 14,031
1995/96 3,267 3,310 6,577 2,186 4,424 6,610 857 14,044
1996/97 3,283 3,267 6,550 2,094 4,279 6,373 888 13,811
1997/98 3,332 3,307 6,639 2,204 4,254 6,458 987 14,084
1998/99 3,281 3,310 6,591 2,253 4,312 6,565 988 14,144
1999/00 3,356 3,238 6,594 2,332 4,370 6,702 923 14,219
Source: Registrar’s Office third week enrollment figures

Appendix B: Supplementary Information 67
SCHEDULE 2
Freshman Apply/Admit/Enroll Statistics
Fall 1989 through Fall 1999
Total Applications Admissions EnrollmentPercent Percent of
Change from Percent of AdmittedPrevious Applicants Applicants
Year Number Year Number Admitted Number Enrolling
Fall 1989 14,912 (5.8%) 2,626 17.6% 1,567 59.7%
Fall 1990 12,954 (13.1%) 2,874 22.2% 1,600 55.7%
Fall 1991 13,528 4.4% 2,715 20.1% 1,526 56.2%
Fall 1992 13,209 (2.4%) 2,912 22.0% 1,595 54.8%
Fall 1993 13,604 3.0% 2,926 21.5% 1,607 54.9%
Fall 1994 14,707 8.1% 2,942 20.0% 1,590 54.0%
Fall 1995 15,485 5.3% 2,908 18.8% 1,597 54.9%
Fall 1996 16,478 6.4% 2,634 16.0% 1,610 61.1%
Fall 1997 16,842 2.2% 2,596 15.4% 1,648 63.5%
Fall 1998 18,885 12.1% 2,505 13.3% 1,606 64.1%
Fall 1999 17,919 (5.1%) 2,689 15.0% 1,749 65.0%

68 Appendix B: Supplementary Information
SCHEDULE 3
Undergraduate Tuition and Room & Board Rates
1979/80 through 1999/00
Percent Change Percent Change Percent Changefrom from from
Undergraduate Previous Room & Previous PreviousYear Tuition Year Board Year Total Cost Year
1979/80 5,595 9.1% 2,354 8.5% 7,949 8.9%
1980/81 6,285 12.3% 2,636 12.0% 8,921 12.2%
1981/82 7,140 13.6% 2,965 12.5% 10,105 13.3%
1982/83 8,220 15.1% 3,423 15.4% 11,643 15.2%
1983/84 9,027 9.8% 3,812 11.4% 12,839 10.3%
1984/85 9,705 7.5% 4,146 8.8% 13,851 7.9%
1985/86 10,476 7.9% 4,417 6.5% 14,893 7.5%
1986/87 11,208 7.0% 4,700 6.4% 15,908 6.8%
1987/88 11,880 6.0% 4,955 5.4% 16,835 5.8%
1988/89 12,564 5.8% 5,257 6.1% 17,821 5.9%
1989/90 13,569 8.0% 5,595 6.4% 19,164 7.5%
1990/91 14,280 5.2% 5,930 6.0% 20,210 5.5%
1991/92 15,102 5.8% 6,160 3.9% 21,262 5.2%
1992/93 16,536 9.5% 6,314 2.5% 22,850 7.5%
1993/94 17,775 7.5% 6,535 3.5% 24,310 6.4%
1994/95 18,669 5.0% 6,796 4.0% 25,465 4.8%
1995/96 19,695 5.5% 7,054 3.8% 26,749 5.0%
1996/97 20,490 4.0% 7,337 4.0% 27,827 4.0%
1997/98 21,300 4.0% 7,557 3.0% 28,857 3.7%
1998/99 22,110 3.8% 7,768 2.8% 29,878 3.5%
1999/00 23,058 4.3% 7,881 1.5% 30,939 3.6%

Appendix B: Supplementary Information 69
SCHEDULE 4
Breakdown of Tuition and Fee Income
Projected 2000/01 Budget
(In thousands of dollars)
PercentageProjected Change Change
FY00 Budget FY01 Budget FY00 to FY01 FY00 to FY01
Tuition:
Undergraduate 147,544 156,832 9,288 6.3%
Graduate 120,726 125,437 4,711 3.9%
Other 12,143 13,617 1,474 12.1%
Summer 17,961 18,415 454 2.5%
Total Tuition 298,374 314,301 15,927 5.3%
Miscellaneous Fees:
Application Fees 3,239 3,305 66 2.0%
Other Fees 1,100 1,100 0.0%
Total Fees 4,339 4,405 66 1.5%
Total Tuition and Fee Income 302,713 318,706 15,993 5.3%

70 Appendix B: Supplementary Information
SCHEDULE 5
Un
de
rgra
du
ate
Fin
an
cia
l A
id b
y S
ou
rce
of
Fu
nd
s a
nd
Ty
pe
of
Aid
1
19
91
/9
2 t
hro
ug
h 1
99
8/9
9
(In
th
ou
san
ds
of
do
llar
s)
1991
/92
1992
/93
1993
/94
1994
/95
1995
/96
1996
/97
1997
/98
1998
/99
Sch
ola
rsh
ips a
nd
Gra
nts
Sta
nfo
rd U
nre
stri
cted
Fu
nd
s15
,834
16,4
2017
,736
16,5
9317
,513
13,6
1112
,201
12,4
20G
ifts
an
d E
nd
ow
men
t In
com
e:
N
on
-Ath
leti
c26,
868
10,9
3612
,355
14,7
6215
,692
20,0
2722
,526
24,2
35A
thle
tic
Aw
ard
s5,
252
5,60
35,
639
6,32
86,
626
7,47
18,
232
8,61
4D
epar
tmen
tal
Aw
ard
s98
782
566
455
415
1,37
21,
743
2.01
6E
xter
nal
Gra
nts
38,
884
8,98
39,
448
10,4
0711
,477
13,7
5715
,541
15,3
43
Su
bto
tal
for
Sch
ola
rsh
ips
and
Gra
nts
36,9
3642
,724
45,7
4448
,545
51,7
2356
,238
60,2
4362
,629
Lo
an
s
Un
iver
sity
Fu
nd
s1,
529
1,33
31,
382
1,15
71,
290
1,23
378
760
0E
xter
nal
Fu
nd
s8,
181
9,23
49,
763
11,3
8911
,453
11,5
1912
,791
12,3
53
Su
bto
tal
for
Loan
s9,
710
10,5
6711
,145
12,5
4612
,743
12,7
5213
,578
12,9
53
Jo
bs Un
iver
sity
Fu
nd
s4 1
,473
1,86
93,
897
4,17
53,
602
3,29
53,
254
2,38
7E
xter
nal
Fu
nd
s11
012
839
636
743
845
769
185
9
Su
bto
tal
for
Job
s1,
583
1,99
74,
293
4,54
24,
040
3,75
23,
945
3,24
6
Gra
nd
To
tal
48
,22
95
5,2
88
61
,18
26
5,6
33
68
,50
67
2,7
42
77
,76
67
8,8
28
Sta
nfo
rd T
uit
ion
plu
s R
oo
m a
nd
Bo
ard
21,2
6222
,850
24,3
1025
,465
26,7
4927
,827
28,8
5730
,939
1A
ctu
al e
xpen
ses
incl
ud
e al
l fu
nd
s aw
ard
ed t
o u
nd
erg
rad
uat
e st
ud
ents
ad
min
iste
red
th
rou
gh
th
e Fi
nan
cial
Aid
Off
ice,
incl
ud
ing
aid
th
at is
no
t n
eed
-bas
ed.
2In
clu
des
su
pp
ort
fro
m t
he
Sta
nfo
rd F
un
d a
nd
th
e P
resi
den
t’s F
un
d.
3A
ll g
ran
ts f
rom
Fed
eral
, sta
te, o
r p
riva
te s
ou
rces
.
4In
clu
des
Un
iver
sity
mat
ch o
f fu
nd
s fr
om
ou
tsid
e so
urc
es.
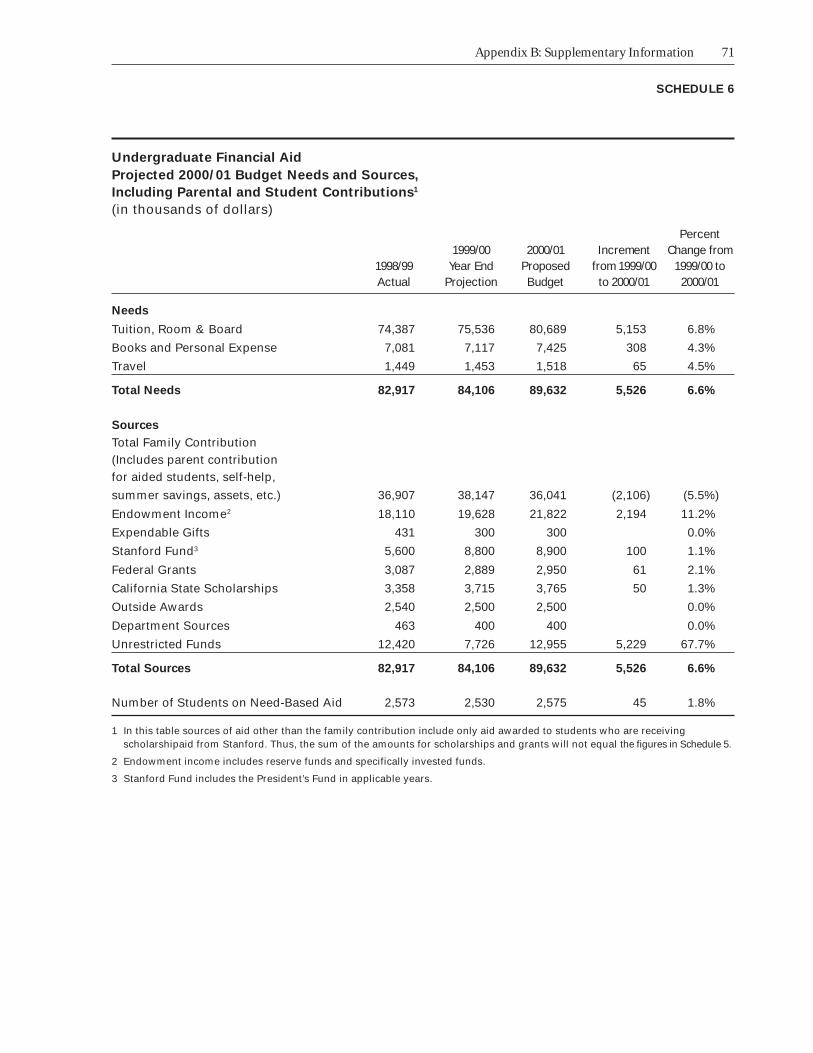
Appendix B: Supplementary Information 71
SCHEDULE 6
Undergraduate Financial Aid
Projected 2000/01 Budget Needs and Sources,
Including Parental and Student Contributions1
(in thousands of dollars)
Percent1999/00 2000/01 Increment Change from
1998/99 Year End Proposed from 1999/00 1999/00 toActual Projection Budget to 2000/01 2000/01
Needs
Tuition, Room & Board 74,387 75,536 80,689 5,153 6.8%
Books and Personal Expense 7,081 7,117 7,425 308 4.3%
Travel 1,449 1,453 1,518 65 4.5%
Total Needs 82,917 84,106 89,632 5,526 6.6%
Sources
Total Family Contribution(Includes parent contributionfor aided students, self-help,
summer savings, assets, etc.) 36,907 38,147 36,041 (2,106) (5.5%)
Endowment Income2 18,110 19,628 21,822 2,194 11.2%
Expendable Gifts 431 300 300 0.0%
Stanford Fund3 5,600 8,800 8,900 100 1.1%
Federal Grants 3,087 2,889 2,950 61 2.1%
California State Scholarships 3,358 3,715 3,765 50 1.3%
Outside Awards 2,540 2,500 2,500 0.0%
Department Sources 463 400 400 0.0%
Unrestricted Funds 12,420 7,726 12,955 5,229 67.7%
Total Sources 82,917 84,106 89,632 5,526 6.6%
Number of Students on Need-Based Aid 2,573 2,530 2,575 45 1.8%
1 In this table sources of aid other than the family contribution include only aid awarded to students who are receivingscholarshipaid from Stanford. Thus, the sum of the amounts for scholarships and grants will not equal the figures in Schedule 5.
2 Endowment income includes reserve funds and specifically invested funds.
3 Stanford Fund includes the President’s Fund in applicable years.

72 Appendix B: Supplementary Information
SCHEDULE 7
Total Professorial Faculty1
1974/75 through 1999/00
Tenure Non-TenureAssociate Assistant Line Line Grand
Professors Professors Professors2 Total Professors Total
1974/75 556 193 284 1,033 1,033
1975/76 565 186 295 1,046 1,046
1976/77 571 194 304 1,069 1,069
1977/78 586 199 287 1,072 86 1,158 3
1978/79 600 211 292 1,103 91 1,194
1979/80 620 210 286 1,116 94 1,210
1980/81 642 205 279 1,126 104 1,230
1981/82 661 200 294 1,155 103 1,258
1982/83 672 195 284 1,151 116 1,267
1983/84 682 195 286 1,163 129 1,292
1984/85 691 194 272 1,157 135 1,292
1985/86 708 191 261 1,160 135 1,295
1986/87 711 192 262 1,165 150 1,315
1987/88 719 193 274 1,186 149 1,335
1988/89 709 200 268 1,177 147 1,324
1989/90 715 198 265 1,178 146 1,324
1990/91 742 195 278 1,215 161 1,376
1991/92 756 205 263 1,224 182 1,406 4
1992/93 740 209 245 1,194 214 1,408
1993/94 729 203 241 1,173 225 1,398
1994/95 724 198 252 1,174 256 1,430
1995/96 723 205 241 1,169 287 1,456
1996/97 731 205 239 1,175 313 1,488
1997/98 750 213 231 1,194 341 1,535
1998/99 758 217 237 1,212 383 1,595
1999/00 771 204 255 1,230 411 1,641
Data Source: Provost’s Office
1 Some appointments are coterminous with the availability of funds.
2 Assistant Professors subject to Ph.D. are included.
3 Beginning in 1977/78, non-tenure line Professors are included.
4 Beginning in 1991/92, Medical Center Line and Senior Fellows in policy centers and institutes are included.

Appendix B: Supplementary Information 73
Distribution of Tenured, Non-Tenured, and Non-Tenure Line Professorial Faculty1
1997/98 through 1999/00
1997/98 1998/99 1999/00Non- Non- Non-
School Unit Non- Tenure Non- Tenure Non- Tenureor Program Tenured Tenured Line Total Tenured Tenured Line Total Tenured Tenured Line Total
Earth Sciences 31 4 4 39 33 3 4 40 32 6 4 42
Education 34 4 38 33 6 1 40 34 9 2 45
Engineering 150 31 28 209 153 40 27 220 151 43 28 222
Humanities and Sciences 360 120 17 497 362 124 18 504 371 133 18 522
(Humanities) (154) (55) (8) (217) (153) (52) (7) (212) (157) (58) (8) (223)
(Nat. Sciences & Math) (105) (33) (7) (145) (105) (32) (8) (145) (112) (34) (7) (153)
(Social Sciences) (101) (32) (2) (135) (104) (40) (3) (147) (102) (41) (3) (146)
Law 35 5 1 41 39 5 1 45 39 2 1 42
Other 1 9 10 1 9 10 2 1 10 13
Subtotal 611 164 59 834 621 178 60 859 629 194 63 886
Business 55 29 1 85 54 30 1 85 54 27 1 82
Medicine 244 65 277 586 248 55 318 621 247 53 343 643
SLAC 21 5 4 30 20 6 4 30 20 6 4 30
Total 931 263 341 1,535 943 269 383 1,595 950 280 411 1,641
Data Source: Provost’s Office
1 Population includes some appointments made part-time, “subject to Ph.D.,” and coterminous with the availability of funds.
SCHEDULE 8

74 Appendix B: Supplementary Information
SCHEDULE 9
Number of Non-Teaching Employees
As of December 31 of Each Year1
1992 through 1999
Activity 1992 1993 1994 1995 1996 1997 1998 19997
School of Medicine2 1,950 2,073 1,614 1,563 1,670 1,880 2,008 2,183
Other Academic:Business, Earth Sciences, Education,Engineering, Humanities and Sciences, Law 1,024 1,040 1,042 1,115 1,119 1,194 1,243 1,227
Physical Education and Athletics 82 83 84 98 104 110 111 118
Institutes and Research Labs 365 369 364 358 384 388 371 379
Stanford Linear Accelerator Center 1,301 1,240 1,355 1,311 1,310 1,300 1,271 1,287
Student Services:Admissions, ASSU, Bechtel InternationalCenter, Dean of Student Affairs, Financial Aids,Graduate Division, Memorial Church, OverseasStudies, Placement Center, Haas Center forPublic Service, Registrar, Residential Education,Student Health, NSI 258 252 233 232 237 226 241 278
Libraries:Includes personnel from all Libraries,Art Galleries, and Museums 574 558 569 567 573 604 651 661
Central Information Services3:Information Resources, Data Center,Networking and Communication Systems 245 264 274 359 366 386 408 415
Development Office 197 175 134 136 135 126 127 141
Plant Construction, Protection, and Maintenance:Facilities Project Management, Health and Safety,Health Physics, O&M, Planning, Procurement,Public Safety, Risk Management 473 455 449 446 470 504 487 510
Housing and Food Service 271 255 272 271 284 301 337 337
Tresidder and Faculty Club4 32 31 21 21 1 0 0 0
Administration:3,5,6
Finance, President’s Office, Provost’s Office,Faculty/Staff Services, Public Affairs,University Counsel, Press, Events & Services,Alumni Association 665 672 634 557 563 590 734 769
TOTAL 7,437 7,467 7,045 7,034 7,216 7,609 7,989 8,305
Percent Change 0.4% (5.7%) (0.2%) 2.6% 5.4% 5.0% 2.8%
1 Does not include students or employees working less than 50% time.2 The School of Medicine’s decline in staff in 1994 primarily reflects the integration of the Faculty Practice Plan and some clinics into
Stanford Health Services (SHS). The increase in 1997 is in part due to the shifting of some staff back into the School of Medicine aspart of the UCSF merger.
3 The staff members in BISA were counted in Administration prior to 1995. That function is now in Information Services.4 Faculty Club and Tresidder services have been contracted to outside companies.5 Administration includes the University Press and Events and Services in all years.6 Administration includes the Alumni Association in 1998 and beyond.7 Due to a programming change, 86 staff members not previously included in these counts are included in the 1999 numbers.
This primarily affects the School of Medicine (20) and Administration (30). These are not new staff members.

Appendix B: Supplementary Information 75
SCHEDULE 10
Staff Employees in Units Other than Medicine or SLAC
1989 through 1999, as of December 31 of each year
2,344
1,503
2,735
1,511
2,555
1,466
2,415
1,473
2,412
1,389
2,376
1,409
2,297
1,473
2,436
1,582
2,648
1,614
2,293
1,406
3,000
2,500
2,000
1,500
1,000
500
01999
Nu
mb
er o
f E
mp
loye
es
19901989 1991 19921 1993
1 SSRL was removed from the Labs in 1993 in this graph. This change reduced Lab staff by about 85.2 Core Staff includes Student Services, Libraries, Information Services, Development, Plant, and Administration.
1994 1995 1996 1997 1998
Core Staff
School/Lab Staff2,774
1,606
2

76 Appendix B: Supplementary Information
SCHEDULE 11
2000/01 Projected Consolidated Budget Staff Benefits Detail
(in thousands of dollars)
1997/98 1998/99 1999/00 2000/01Actual Actual Revised Projected Increase (Decrease)
Staff Benefits Program Expenditures Expenditures Budget Budget 1999/00 to 2000/01
Pension Programs:University Retirement 42,471 46,539 48,020 53,130 5,110 10.6%Social Security 41,226 44,941 47,436 52,085 4,649 9.8%Faculty Early Retirement 7,460 7,845 5,175 6,327 1,152 22.3%Other 1,135 1,092 1,359 1,231 (128) (9.4%)
Total Pension Programs 92,292 100,417 101,990 112,773 10,783 10.6%
Tuition Waiver Programs:Faculty/Staff Tuition
Grant Program 5,351 5,337 0 0 0 N/AResearch Assistants N/ATeaching Assistants N/A
Total Tuition Waiver Programs 5,351 5,337 0 0 0 N/A
Insurance Programs:Medical Insurance 18,747 23,379 22,495 25,748 3,253 14.5%Retirement Medical 5,455 2,934 2,642 4,074 1,432 54.2%Worker’s Comp/LTD/
Unemployment Insurance 4,556 5,854 7,353 7,832 479 6.5%Dental Insurance 5,123 5,568 5,839 6,193 354 6.1%Group Life Insurance/Other 3,848 4,573 4,451 4,504 53 1.2%
Total Insurance Programs 37,729 42,308 42,780 48,351 5,571 13.0%
Miscellaneous Programs:Severance Pay 4,165 1,982 4,339 4,200 (139) (3.2%)Sabbatical Leave 8,595 7,738 7,852 8,099 247 3.1%Other 5,155 4,873 5,660 6,706 1,046 18.5%
Total Miscellaneous Programs 17,915 14,593 17,851 19,005 1,154 6.5%
Total Staff Benefits
Programs Expense 153,287 162,655 162,621 180,129 17,508 10.8%
Carryforward/Adjustmentfrom Prior Year(s) (1,571) (858) 1,366 1,252 (114) (8.3%)
Total Expense with
Carryforward/Adjustments 151,716 161,797 163,987 181,381 17,394 10.6%
Budgeted Staff Benefits Rate 24.5% 24.1% 23.3% 23.4%
Note: The University has three fringe benefit rates for 2000/01, and the single rate shown just above is the weighted average of thethree rates. The three rates are 24.3% for regular employees, which includes all faculty and staff with continuing appointments ofhalf-time or more, 13.5% for post-doctoral scholars, and 8.5% for contingent (casual or temporary) employees.

Appendix B: Supplementary Information 77
SCHEDULE 12
Sponsored Research Expense by Agency and Fund Source1
1992/93 through 1998/99
(in thousands of dollars)
1992/93 1993/94 1994/95 1995/96 1996/97 1997/98 1998/99
US Government
Subtotal for US
Government Agencies 256,713 271,326 275,580 298,149 336,661 347,109 358,942
Agency2
DoD 41,972 40,384 44,390 48,185 53,984 53,593 54,569
DoE (Except SLAC) 10,328 9,216 9,049 7,958 8,309 10,523 13,176
NASA 53,892 57,394 58,728 66,626 84,449 77,707 67,492
DoEd 172 301 2,173 2,433 2,489
HHS 117,077 129,306 125,440 132,754 141,897 155,643 170,403
NSF 24,539 25,436 28,230 29,969 32,730 34,050 36,303
Other US Sponsors 8,733 9,590 9,743 12,356 13,119 13,160 14,509
Direct Expense-US 185,314 192,758 199,908 215,828 252,806 263,674 268,547
Indirect Expense-US3 71,399 78,568 75,672 82,321 83,855 83,435 90,395
Non-US Government
Subtotal for Non-US
Government 35,982 40,566 41,245 44,307 48,836 53,941 58,095
Direct Expense-Non US 28,791 32,640 33,280 35,804 39,430 43,671 47,022
Indirect Expense-Non US 7,191 7,926 7,965 8,503 9,406 10,270 11,073
Grand Totals-US plus Non-US
Grand Total 292,695 311,892 316,825 342,456 385,497 401,050 417,037
Grand Total Direct 214,105 225,398 233,188 251,632 292,236 307,345 315,569
Grand Total Indirect 78,590 86,494 83,637 90,824 93,261 93,705 101,468
% of Total from
US Government 87.7% 87.0% 87.0% 87.1% 87.3% 86.6% 86.1%
1 Figures are only for sponsored research and are in thousands of dollars. SLAC expense is not included in this table.
2 Agency figures include both direct and indirect expense. Agency names are abbreviated as follows:DoD=Department of Defense DoEd=Department of EducationDoE=Department of Energy HHS=Department of Health and Human ServicesNASA=National Aeronautics and Space Administration NSF=National Science Foundation
3 DLAM indirect costs are included in this figure.

78 Appendix B: Supplementary Information
SCHEDULE 13
Plant Expenditures by Unit1
1992/93 through 1998/99
(in thousands of dollars)
Unit 1992/93 1993/94 1994/95 1995/96 1996/97 1997/98 1998/99
GSB 437 90 116 1,124 2,767 9,499 14,400
Earth Science 12,792 3,288 793 284 1,754 3,703 250
Education 161 187 1,127 3,478 454
Engineering 2,253 9,293 32,839 40,626 26,509 44,076 40,801
H&S 12,676 15,488 22,445 26,448 28,576 34,023 22,409
Law 129 7 34 391 1,208 1,031
Medicine2 21,408 12,479 3,160 2,346 10,908 22,821 40,902
Libraries 6,544 413 1,852 5,783 10,000 16,216 17,823
Athletics 4,502 18,542 2,399 3,968 7,856 6,369 7,007
Housing 11,562 11,944 26,567 21,424 43,398 20,023 30,317
All Other3 28,634 20,300 14,864 21,664 54,004 98,339 104,361
TOTAL 100,808 91,966 105,203 123,888 187,290 259,755 279,754
Source: Schedule G-5 in the Annual Financial Report
1 Expenditures are in thousands of dollars, are from either Plant or borrowed funds, and are for building construction orimprovements, or infrastructure.
2 Includes the Faculty Practice Program when separately identified.
3 Includes General Plant Improvements expense.
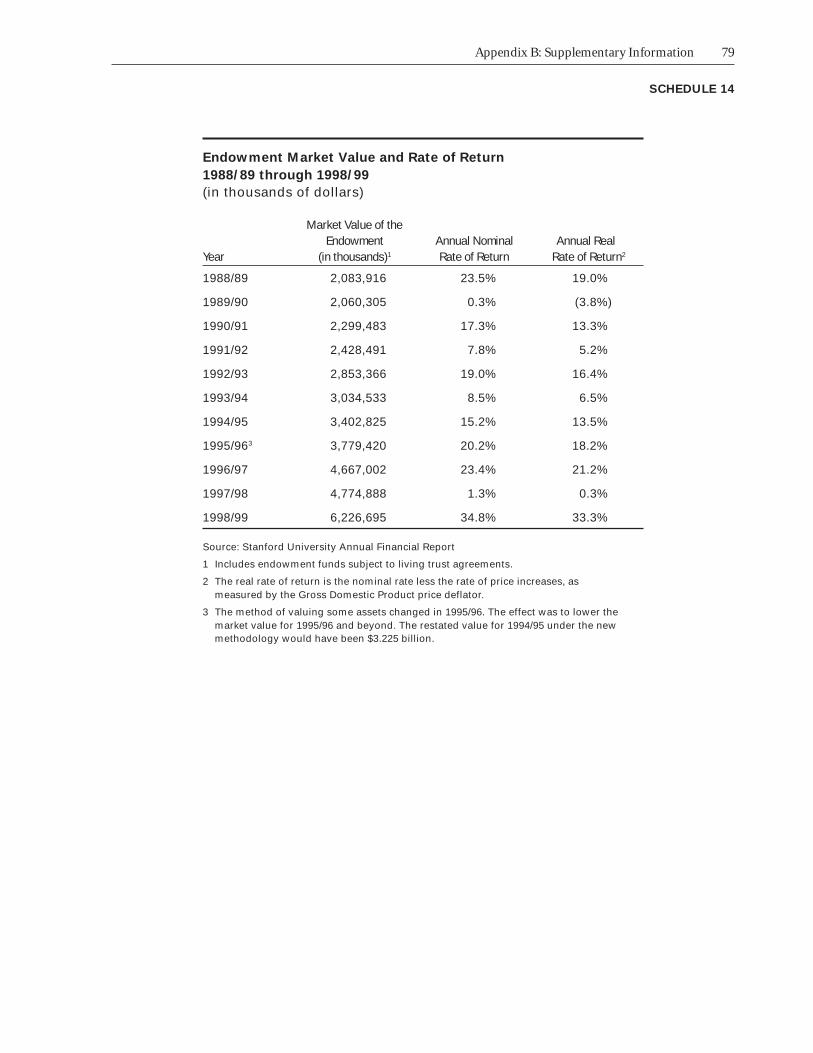
Appendix B: Supplementary Information 79
Endowment Market Value and Rate of Return
1988/89 through 1998/99
(in thousands of dollars)
Market Value of theEndowment Annual Nominal Annual Real
Year (in thousands)1 Rate of Return Rate of Return2
1988/89 2,083,916 23.5% 19.0%
1989/90 2,060,305 0.3% (3.8%)
1990/91 2,299,483 17.3% 13.3%
1991/92 2,428,491 7.8% 5.2%
1992/93 2,853,366 19.0% 16.4%
1993/94 3,034,533 8.5% 6.5%
1994/95 3,402,825 15.2% 13.5%
1995/963 3,779,420 20.2% 18.2%
1996/97 4,667,002 23.4% 21.2%
1997/98 4,774,888 1.3% 0.3%
1998/99 6,226,695 34.8% 33.3%
Source: Stanford University Annual Financial Report
1 Includes endowment funds subject to living trust agreements.
2 The real rate of return is the nominal rate less the rate of price increases, asmeasured by the Gross Domestic Product price deflator.
3 The method of valuing some assets changed in 1995/96. The effect was to lower themarket value for 1995/96 and beyond. The restated value for 1994/95 under the newmethodology would have been $3.225 billion.
SCHEDULE 14

80 Appendix B: Supplementary Information


![Budget 2014: Budget plan [French]](https://img.dokumen.tips/doc/110x75/55cf9902550346d0339afd61/budget-2014-budget-plan-french.jpg)


