Embed Size (px)
Citation preview

The Square Kilometer Array Preliminary Strawman Design
Large N - Small D
prepared by the
USSKA Consortium
15 June 2002 Version 1.0
Table of Contents
Executive Summary............................................................................................................................................................ 2 1. Introduction ........................................................................................................................................................ 4 2. Scientific Drivers and Specifications.................................................................................................................. 5 3. Array Configuration ........................................................................................................................................... 8 4. Site Selection and Development....................................................................................................................... 13 5. Antenna Elements............................................................................................................................................. 14 6. Feeds and Receivers ......................................................................................................................................... 16 7. Signal Connectivity .......................................................................................................................................... 18 8. Signal Processing.............................................................................................................................................. 19 9. Interference Mitigation ..................................................................................................................................... 21 10. Data Management......................................................................................................................................... 22 11. Design, Prototyping and Construction Plan.................................................................................................. 24 12. Future Activity.............................................................................................................................................. 27
Appendix A - Compliance Matrix .................................................................................................................................... 29 Appendix B - Construction Costs..................................................................................................................................... 30 Appendix C - SKA Operations......................................................................................................................................... 35
Executive Summary The scientific issues facing the next generation of radio telescopes require not only a large increase in physical collecting area, but also a high degree of versatility in using large instantaneous bandwidths for continuum, spectral line, and time-domain applications. The important scientific forefront to be addressed with such an instrument includes mapping the epoch of reionization; characterizing the transient radio sky; surveying H I and CO at high redshifts; probing AGNs over a wide range of luminosities; understanding star formation, stellar populations, and perhaps intelligent life in the Milky Way; and tracking near-Earth objects that are potential hazards to life on Earth. The range of objects to be studied demands sensitivity to a wide range of source sizes, from compact objects on milliarcsecond scales to low surface brightness emission on scales of arcminutes and larger. To exploit this high sensitivity, large dynamic range and image fidelity are needed for imaging applications while beam-forming over a large field of view (FOV) and the ability to probe signals with a high degree of time-frequency complexity are needed for transient source applications as well as discriminating celestial signals from radio frequency interference. We propose a design for the SKA that is a synthesis instrument of the type which has been used so successfully in radio astronomy, but which has new capabilities as well. We believe that our design concept can meet or exceed most of the stated SKA design goals, including a sensitivity specification, A/T = 20,000 m2/K. The instrument we propose will have a point source sensitivity of 25 nanoJy in one hour of integration time, and a maximum resolution of 0.5 mas at 1 cm wavelength, with excellent imaging over 4 orders of magnitude of angular scale at any given frequency. We have selected an array concept based on a large number, N, of stations whose signals are cross-correlated for imaging or processed in other ways for non-imaging applications. The individual antenna elements are small-diameter (12-meter), shaped offset-paraboloidal reflectors. A total of 4400 antenna elements is required to meet the sensitivity specification. The number of antennas in a station is a function of location within the overall array. We refer to the overall concept as “Large-N – Small D”. This architecture has a formidable list of advantages when compared to conventional, existing radio interferometer arrays:
• Extremely high quality (u,v) coverage, yielding low synthesized-beam sidelobes across the full range of observing parameters, thus maximizing the chances of achieving sufficient imaging dynamic range to fully exploit SKA sensitivity levels
• Very wide dynamic range of baseline lengths (15 m to 3000 km) with excellent imaging capability across the full range, maximizing the variety of scientific topics accessible to the SKA
• The ability to be subdivided into a possibly large number of subarrays, each with sufficient capability to be an effective standalone instrument, permitting many simultaneous diverse projects. Consequent efficiency gains are functionally equivalent to extra array sensitivity.
• Intrinsically wide field of view. The small-D part of the architecture allows the 1-degree specification at 20cm to be met with simple, inexpensive single-pixel receiver systems. At lower frequencies, cost-effective centralized electronic multibeaming is possible.
• Freedom from Earth-rotation aperture synthesis. Imaging arrays have typically exploited this from necessity, but a large-N SKA will not need to. The consequent scheduling flexibility enhances efficiency, also functionally equivalent to extra array sensitivity.
• The inherent flexibility of phased-array stations creates new and powerful calibration options. For example, one antenna within each station can be permanently pointed at a phase calibration source for low-SNR high frequency observations.
• The enormous number of fully independent measurements generated by a large-N array provides fertile ground for novel, powerful data reduction algorithms, dealing with calibration, image deconvolution, RFI excision, and other issues likely to be problematic in the SKA sensitivity regime.
• Inherent upgradability is a characteristic of this architecture. In many areas, performance is limited by data processing capacity, which is likely to benefit from dramatic cost reductions during the life of the array, allowing for potent, inexpensive upgrades.
Our choice of antenna elements follows the concepts introduced for the Allen Telescope Array (ATA) now under development in California. The cost of the array is broadly optimized by using reflecting elements in the range 10–15 meters. To cover the frequency range of 0.15 to 34 GHz, each antenna will have one prime focus and two Gregorian feeds. The optimization is based on a novel cost-effective technique for reflector manufacture (aluminum hydroforming) being used for the ATA. Also, the three receivers, which will have decade bandwidths, are based on MMICs being developed at Caltech, and are
2

expected to give system noise temperatures under 20 K over the frequency range 1 to 11 GHz. The science goals suggest the array should have a scale free configuration. About half of the 4400 antennas will be within an area of diameter 35 km, allowing detection of HI in galaxies on scales ~ 1 arcsec, and 3/4 of the collecting area within a 350-km area. The remaining ~1/4 will be located over continental dimensions to provide milliarcsecond resolution. Considerations of connectivity, power, site acquisition, operating logistics, and maintenance dictate that the more remote antennas will need to be grouped into stations. The number of stations (160) optimizes (u,v) coverage, the desire to obviate the need for moving antennas to achieve the (u,v) coverage, minimum requirements on the station beam, and issues concerning transient detection. We have adopted a station configuration that has 13 antennas per station, a minimum spacing of about 15 m, and overall dimensions of 84 m. The large baselines to the remote stations provide high angular resolution and also the ability to eliminate source confusion in imaging applications. The design is versatile in that multiple subarrays can be formed to simultaneously pursue several independent research programs. For example, the 160 outer stations, each equivalent in area to a 90-m dish, can be pointed to 160 different regions of the sky to study transient phenomena, while the inner array is being simultaneously used for low-resolution astronomy. In another mode, all 4400 12-meter dishes can be pointed in different directions to simultaneously cover 1.4 steradians of sky, albeit with reduced sensitivity. Alternatively, multiple phased array beams can be constructed from the inner 2320 antennas to observe multiple transient sources within the one-degree FOV. The Large-N array degrades gracefully with the failure of individual antennas or even full stations. Our concept for the SKA could be sited in several places around the world. For specificity in this preliminary strawman concept, we have located the main part of the array in the southwestern United States where we have good information on infrastructure costs and site performance. To achieve the high resolution needed for many scientific problems, some stations are located throughout the North American continent, including Canada and Mexico. A major challenge in our design is provision of the wideband data links between the 4400 antennas and the central processing system. For the inner approximately 35 km (with ~2320 individual antennas), it will be straightforward and economical to install dedicated optical fiber. All of these antennas will be correlated with each other to allow imaging of the full FOV of the antenna beam with very high dynamic range. For the outer array, beamforming electronics for each station will form multiple beams. On intermediate scales between ~35 and ~350 km, we will either lay our own fiber or lease existing fiber, depending on the site. Beyond a few hundred km, it will probably be necessary to use public packet-switching networks, with costs that are indeterminate at present, though there is cause for optimism that they will be affordable. The software needed to run a Large-N SKA will be a major challenge. Data management requirements include imaging, transient and other data analysis, archiving, and other tasks, constituting full end-to-end operation. An important goal is to leverage experience and software generated for related projects in order to limit costs. We estimate that the SKA could be built using currently available hardware and techniques for somewhere between $1250M and $1410M in 2002 dollars, excluding contingency. This sum is dominated by the cost of 4400 antenna and receiver systems, which together account for $800M to $850M, and which are therefore a prime target for intensive research and cost reduction efforts. The remaining costs, which include civil works, data transmission, signal processing, computing and software development, and design and engineering effort, are highly uncertain in several areas, with considerable scope for potential cost reductions in the years leading up to the construction phase. Our current cost estimates, including a discussion of uncertainties and future prospects, are detailed in the Appendices. The main uncertainties are the cost and performance of the 12-m dishes and MMIC receivers, the cost of data transmission over the outer parts of the array, the achievable correlator capacity within the allocated budget for that subsystem, and the software development costs. In order to achieve the desired SKA capabilities for under $1000M, a realistic cost ceiling, further innovation and development is required, and corresponding efforts are planned. If sufficient cost reduction proves unattainable, the Large-N SKA concept is well suited to incremental descoping, involving reduction in overall size, collecting area, upper frequency limit, bandwidth in the outer array, and other methods.
3
1. Introduction We describe a preliminary design concept for the SKA that optimizes the opportunity to explore the wide range of scientific problems that will be possible with the unprecedented combination of sensitivity, angular, spectral, and temporal resolution, combined with outstanding imaging capability, frequency agility, and dynamic range. We suggest that these goals can be best achieved with an array consisting of a large number of small fully steerable parabolic dishes, which have a long history of success in radio astronomy due to their ability to operate with high efficiency over a wide range of frequency and orientation. Efforts to refine and improve this concept, to incorporate new technologies and to lower costs are underway at many institutions throughout the U.S. Although the full range of scientific programs that will be addressed with the SKA cannot now be imagined, even today’s outstanding scientific problems demand a flexible instrument with high surface brightness sensitivity, high angular resolution, and high time resolution. These goals can be achieved only with a synthesis array that covers a wide range of spatial frequencies. With the extraordinary sensitivity of the SKA, it will be possible for the first time to detect continuum radiation from even normal galaxies at cosmologically interesting distances. At the nanojansky levels that will be reached with the SKA in a few tens of hours integration time, confusion from weak sources within the FOV will limit the sensitivity, especially at the longer wavelengths, unless the SKA has dimensions of the order of a thousand kilometers, although the precise constraints are unknown due to the uncertainty in the density of nanojansky radio sources. Moreover, astronomers will require that the SKA not only have the sensitivity to detect very weak radio sources, but that it have the resolution to image them with at least the same angular resolution of the next generation of ground and space-based instruments such as SIRTF, ALMA, and NGST which will operate in other portions of the spectrum. Moreover, pulsars, transients, and some SETI projects require observing modes that differ markedly from those designed for imaging modes of sources that do not vary with time. Therefore, care must be taken in the conceptual and design phases of the SKA to ensure that science in these areas can be undertaken and optimized. Aside from sensitivity, the achievable dynamic range is possibly the most important technical consideration, since very high dynamic range is needed to effectively utilize the full sensitivity for continuum imaging. The difficulty of achieving noise-limited performance should not be underestimated. Confusion from artifacts due to the aliasing of millijansky sources will limit the sensitivity unless the SKA can achieve a dynamic range of 106 or better. The dynamic range is directly affected by the number, composition, and layout of antenna elements; and the tight requirement implies an array with a large number of antennas. Radio frequency interference (RFI) must be reckoned with as well. We propose that the individual antenna elements be 12-m diameter fully steerable paraboloids, which give a one degree FOV at 20 cm and broadly minimize the cost curve. In order to meet the design goal of A/T = 20,000 m2//K and assuming system temperatures of 18 K, we need a total effective collecting area of 360,000 square meters or a geometric area equal to 500,000 m2 for an aperture efficiency of 72%. Each antenna has a geometric area of 113 square meters so that 4400 antennas are required. Ideally we would like to correlate all 10 million baseline pairs, each with 8 GHz input bandwidth (4 GHz in each of two polarizations) and up to 40,000 frequency channels, but it may not be possible to achieve this goal initially at reasonable cost. For this reason, and in consideration of the requirements of land access, power and signal transmission, and maintenance and operations cost, we have elected to group the array antennas beyond 35 km into stations. Within 35 km, it will be possible to acquire a suitable piece of land where the terrain permits a configuration designed primarily to optimize the (u,v) coverage. With 2320 antennas in the core region, the (u,v) coverage will be adequate for any application. The choice of 35km also represents a compromise between the surveying benefits of full antenna-antenna correlation, and cost-effective targeted imaging modes using one or more station beams at higher resolutions. The remainder of the array will be configured in 160 stations, each of which contains 13 antennas, and configured so that the overall array is heavily tapered to optimize the surface brightness sensitivity-angular resolution tradeoff. Our design concept meets or exceeds many of stated SKA design goals (Appendix A); in particular we have designed toward a sensitivity specification of A/T = 20,000 m2/K, yielding a point source sensitivity of 25 nanoJy rms in a 1-hr integration. The angular resolution will range from 0.1 arcsec at 150 MHz to 0.0005 arcsec at 34 GHz. In addition to meeting the basic performance specifications, our design will provide unprecedented levels of flexibility and versatility, which we expect will translate into scientific productivity.
4

2. Scientific Drivers and Specifications In developing the strawman design, we are guided by specific, key science goals and, equally importantly, by the fact that the SKA will be a general-purpose instrument for discovery and analysis of the radio sky. Our design aims to maximize the scientific return over the necessarily disparate specifications needed for particular applications while maintaining overall flexibility. For this reason, we consider all angular size scales to be equally important. The SKA will be sensitive enough to detect H I emission from many thousands of gas-rich galaxies in a 1-degree wide field of view. Most of these galaxies are expected to be at redshifts between 0.8 and 2. The evolution of structure in the universe will be revealed by the angular distribution of these galaxies and the depth of their gravitational potential wells as a function of redshift. A primary science driver for the high sensitivity specification is the detection of H I at high redshifts, both from L* galaxies at z ~ 1 and from diffuse H I structure at z ~ 1 and higher. Beyond sheer sensitivity, science capability is derived from specifications along several basic parameter axes: frequency range and resolution; field of view and angular resolution; dwell time and time resolution; and polarization purity. Figures of merit associated with these axes include: imaging dynamic range, sensitivity to high-and-low surface brightness, RFI rejection and mitigation capabilities, redshift coverage for atomic and molecular transitions, multibeaming capability, and throughput on sampling the transient radio sky. The large collecting area of the SKA will enable sensitive observations of basically thermal processes at much lower frequencies and at higher angular resolution than now possible. This capability will be very important for studies of nearby star formation. The SKA will revolutionize the study of galaxies, from the Milky Way and the Local Group to the furthest and youngest galaxies. The star formation history, rotation curves, large-scale structure and kinematics can be determined for a galaxy sample of many millions. Galaxy structure will be probed through direct detection of diffuse thermal and nonthermal gas as well as by using point sources to probe intervening material on a wide range of scales. The SKA will reveal and image new populations of compact objects, including AGN and stellar mass objects that serve as laboratories for fundamental physics. For both Galactic and extragalactic science, the SKA exploits the lack of obscuration by dust at radio wavelengths. The transient radio universe will be unveiled at far greater depth than ever before. Finally, the SKA will be an important instrument for solar system science, including inventorying debris from solar system formation and especially near-Earth objects that pose a potential terrestrial impact threat. The science goals that push the limits of our specifications include: Mapping the star formation history and large-scale structure of the Universe: Surveying and mapping high-redshift galaxies in the H I and CO (1-0 and 2-1) lines and in continuum emission; the redshift ranges of interest are z<4 for H I and z > 2.4 for CO (1-0). The number of galaxies will allow mapping of the star-formation history and large-scale structure of galaxies. Continuum surveys to sub-microJansky levels will probe galaxies with small star formation rates at large redshift as well as perhaps reveal new source populations. Molecular masers (OH, methanol, and water) will diagnose vigorous star formation at high redshifts. CO science is highly complementary to the capabilities for ALMA. The suite of spectral lines provides the ability to trace the star formation history over cosmological time. Study of the S-Z effect at high redshifts will further probe cosmology to a high degree of statistical significance. Magnetic fields are important in virtually all astrophysical contexts. Non thermal synchrotron and maser emission is closely connected to magnetic phenomena, and hence provides the most direct probes available to study magnetic field distributions, orientations, and strength. High sensitivity-high resolution polarization imaging and Faraday rotation measurements will trace out the magnetic field structure in parsec to Megaparsec jets, in normal galaxies and in distant clusters of galaxies, as well as locate distant (z > 2) clusters.
5

Probing strong gravitational fields and the cosmological evolution of black holes: SKA’s sensitivity along with its resolution allows imaging of structure associated with massive black holes and their relativistic outflows on scales from sub-parsecs to hundreds of kiloparsecs. Nearby AGNs can be mapped close into the black hole itself. SKA’s sensitivity will allow probing of a wide range of black hole masses and jet power in a large, unbiased sample of objects. New phenomena that will become accessible include the detection of gravitational distortions of background radiation from moderate mass black holes, which requires milliarcsecond resolution and wide-field mapping capability. Astrometric imaging of masers in the accretion disks around black holes in galaxies well into the Hubble flow provide another means for estimating black holes masses versus epoch and extend the cosmic distance scale by direct geometrical measurement. Identifying the transient radio universe: The radio sky can be sampled on time scales as small as a few nanoseconds and on arbitrarily long time scales; long dwell times over a large solid angle are needed to sample the sky. Transient sources include nanosecond giant pulses from Crab-like pulsars (Galactic and extragalactic), flares from Galactic stars and planets, radio bursts from gamma-ray burst sources at levels 100 times fainter than now detectable, and perhaps also from sources of extraterrestrial intelligence. Probing the scintillating universe and exploiting super-resolution phenomena: The high sensitivity of the SKA allows radio-wave scattering in the interstellar medium to be used for probing source structure in pulsars, gamma-ray burst afterglows, AGNs, and perhaps other sources on angular scales of microarcseconds and less. A comprehensive atlas of the Milky Way and nearby galaxies: Identifying the overall structure, discrete components, and turbulent properties via continuum imaging, Faraday rotation, H I Zeeman splitting, along with H I emission and absorption at sub-parsec scales will have a dramatic impact on our understanding of the local Universe. Combined with large samples of pulsars and compact AGNs used to probe intervening material, scales as small as hundreds of kilometers can be reached in a comprehensive sampling. A Milky Way census of pulsars and other compact objects: Deep surveys with unprecedented yield will provide lines of sight that probe every large H II region in the Galaxy, and allow mapping of the free electron distribution, the mean magnetic field, and turbulent fluctuations down to hundreds of kilometers. The astrometry of pulsars and other objects will provide key information on the pulsar distance scale, the mean electron density, velocities of neutron stars and underlying stellar evolutionary processes. Timing of pulsars will realize the great potential for probing basic physics (GR, nuclear matter equation of state) in individual objects and using ensembles of pulsars to detect or constrain gravitational wave backgrounds. Wide field sampling and multiple timing beams are needed for these programs. Searching for brown dwarfs in the local Galactic environs and mapping thermal emission from nearby stars: Brown dwarfs are detectable from radio flares out to at least 50 pc. With high-frequency capability (20 GHz) thermal emission from supergiant stars can be detected across the Galaxy, and the surfaces of large samples of main sequence stars can be imaged. Inventorying and tracking solar system debris: Detection of thermal emission from trans-Neptunian objects (TNOs) and near-Earth asteroids is enabled by extending the SKA to high frequency (34 GHz). High precision astrometry will allow accurate orbit determinations, and even better orbits and high resolution imaging of asteroid surfaces will be possible by receiving radar signals with the SKA. These (and other) science goals led the International SKA Steering Committee to adopt a series of design goals for the SKA. Appendix A summarizes these goals and how well the concept we present here meets those goals. Specific SKA specifications and their scientific drivers include: Frequency range from 0.15 to 34 GHz: The low frequency cutoff is dictated by high-z H I emission and absorption observations reaching to the epoch of reionization (EoR) currently estimated to be at z ~ 6, while taking into account feasibility of also reaching the high frequency cutoff. The high frequency cutoff is determined by high-z CO observations, and the detection of thermal radiation from stars, asteroids and TNOs, high-resolution imaging and potential spacecraft telemetry applications. The 8 mm atmospheric window is the optimum wavelength for all of these studies.
6
Primary field of view of 1 degree at 20 cm: Astrometric calibration and high efficiency surveys for galaxies require a field at least this large. Blind searches of rapidly time-variable sources (transients,

pulsars) will benefit from the larger FOV available at the longer wavelengths and through the use of sub-arrays traded against sensitivity. Array feeds can also be used to enhance the FOV, but at the expense of additional signal processing and feed/receiver units. We do not propose the construction of array feeds in the initial implementation of the SKA, but this can be added at some later time. Instantaneous bandwidth: Continuum studies demand the largest instantaneous bandwidth. Anything less, makes ineffective use of the large and expensive collecting area of the SKA. To meet the sensitivity requirements and for effective multi-frequency synthesis a fractional bandwidth about 20% at frequencies above 1 GHz is needed. For many programs, multiple passbands are desirable. The need for broad instantaneous bandwidth is, however, tempered by the corresponding increase in susceptibility to RFI. Careful engineering and attention mitigation procedures will be required to minimize the impact of RFI. Channelization. Spectral line mapping, wide-field continuum-Stokes mapping, and searches for pulsars and transient sources require at least 40,000 frequency channels over the nominal 20% bandwidth, and to give high spectral resolution when using narrower bandwidths. Imaging dynamic range of at least one million: High fidelity imaging and minimizing confusion of the nanoJy sky by strong milliJy sources places strong constraints on the array configuration. Sensitivity to low-surface brightness objects (galaxy structure, galaxies, cluster halos, etc.): Angular scales of 1 arcmin, require significant sensitivity and good dynamic range on baselines < 1 km. Intermediate Resolution/surface brightness studies: Imaging H I and star formation in galaxies as well as a wide range of programs which study radio galaxies, SNR, and other extended radio sources require excellent sensitivity and dynamic range for baselines out to about ~ 35 km. To reach high-z galaxies, to achieve resolutions comparable to other instruments such as ALMA and NGST, and to reduce the effects of confusion on sensitive continuum images, baselines at least out to a few hundred km are needed. Angular resolution as small as 0.2 mas: Astrometry and high-resolution imaging of AGN, GRB’s, stars, masers, pulsars, and other high brightness temperature objects require significant sensitivity and image quality corresponding to baselines of 3500 km or more. At the longer wavelengths baselines of a thousand km or more also be needed to reduce spurious responses from strong sources within the large FOV. Full primary-beam field of view pixelization and mapping capability with sensitivity to scales from subarcsecond to the full FOV: Wide-field imaging requires a sufficient number of channels to image the entire FOV without degradation due to bandwidth smearing. Blind searching for transients, pulsars and signals from extraterrestrial civilizations requires instantaneous access to the full FOV. This can be accomplished by forming all necessary beams or high-time-resolution channelization and imaging. Minimization of shadowing places a minimum size on station arrays and thus a lower bound on the effective number of synthesized beams required. Multiple instantaneous fields of view: Blind searches require subarray capability to trade collecting area against solid-angle coverage. Access to signals with unit time-bandwidth product: Searches for transients, giant pulses from other galaxies, and from extraterrestrial civilizations, require flexibility in transforming the signal in time and frequency. For example, predetection filtering techniques remove plasma dispersion smearing from pulses. The available bandwidth and collecting area for such analyses will undoubtedly grow with increasing digital capability. With this flexibility, the number of channels is essentially unlimited, as it must be for pulsar, transient-source, and SETI applications. Polarization purity: For off-axis detection in confused regions the polarization purity, after calibration, should be at the level of the order of -40 dB. Time-domain purity: The time-domain signals in synthesized beams must be free of self-generated RFI so that transient searches and pulsar studies may be made down to the radiometer noise limit.
7
3. Array Configuration The configuration of the SKA antennas determines several important aspects of the SKA performance including imaging resolution, sensitivity, and operating efficiency. It also strongly impacts array costs such as land acquisition, data and power connectivity, and operating costs. To address the wide range of scientific problems discussed in Section 2, the SKA will need to cover a wide range of spatial frequencies. Short spacings are needed for good surface brightness sensitivity; large spacings are needed for good angular resolution, and an array with a large number of antennas is needed for good image fidelity. However, correlator and data transmission limitations along with practical considerations require that the antennas be clustered into stations, at least on the longer baselines. Studies are now underway at the Haystack Observatory to optimize the number of stations, the number of antennas per station, the location of each station, and the cabling routes which are all variables that need to be optimized based on overall instrument versatility and performance, as well as construction, operation, and maintenance costs. Unlike the VLA, WSRT, ALMA, or the ATCA, the SKA antennas need not be moveable. The various science drivers require spatial frequencies ranging from less than the smallest VLA configuration to comparable to that of the various VLB arrays, a range approaching 105. For comparison, the four configurations of the VLA generate a range of baseline lengths of a factor of ~ 1000, while the VLBA provides baselines longer by an additional factor of 100. It will not be reasonable to make single images which utilize this entire range, due not only to the enormous range of surface brightness sensitivities involved, but also to the implied image sizes far in excess of 1010 pixels. We may think of the SKA in terms of multiple distinct arrays, each complementing and sharing the resources of the others, but serving different resolution and surface brightness regimes. It should be noted that these considerations translate directly into the requirement for a heavily centrally condensed array. With no a priori preference toward any particular scale that will dominate astronomical research decades from now, ideally we would build a scale-free configuration. For this document, we have adopted an approximate scale-free radial distribution of antenna spacings with the shortest spacings limited by the need to minimize shadowing of adjacent antennas and the longest spacings limited by the need to maintain common visibility across the array over a wide range of hour angles. In order to illustrate the possible implementation of such a configuration at a real site, we have utilized known physical constraints in the continental U.S. to modify a theoretical scale-free layout based on log-spiral geometries. For a variety of continuum observations with SKA, a dynamic range of 106 or more will be required to eliminate spurious responses from strong sources within the FOV of individual antennas. To meet this requirement, excellent (u,v) coverage is required on all but the longest baselines. Within a diameter of a few tens of km, it is feasible to cross-correlate signals from all 12-m antennas, yielding extremely dense coverage (see Figure 3.3). Further out, based on consideration of correlation capacity, connectivity, site acquisition, and operating logistics, we cluster antennas into stations, and form phased-array beams for correlation. Provided there are enough such stations, the coverage will be sufficient to meet dynamic range goals. In this strawman, antenna locations divide naturally into three groupings based on scientific drivers, signal connectivity, aspects of site acquisition, and similar factors:
Compact Array: Contains approximately 50% of the collecting within a 35 km diameter, with full cross-correlation of ~ 2320 antenna signals; Intermediate Array: Contains roughly 25% of the collecting area distributed between 35 and 350 km with the antennas grouped into stations; and Extended Array: Contains the remaining ~ 25% of the collecting area distributed between 350 and 3500 km with the antennas grouped into stations.
8
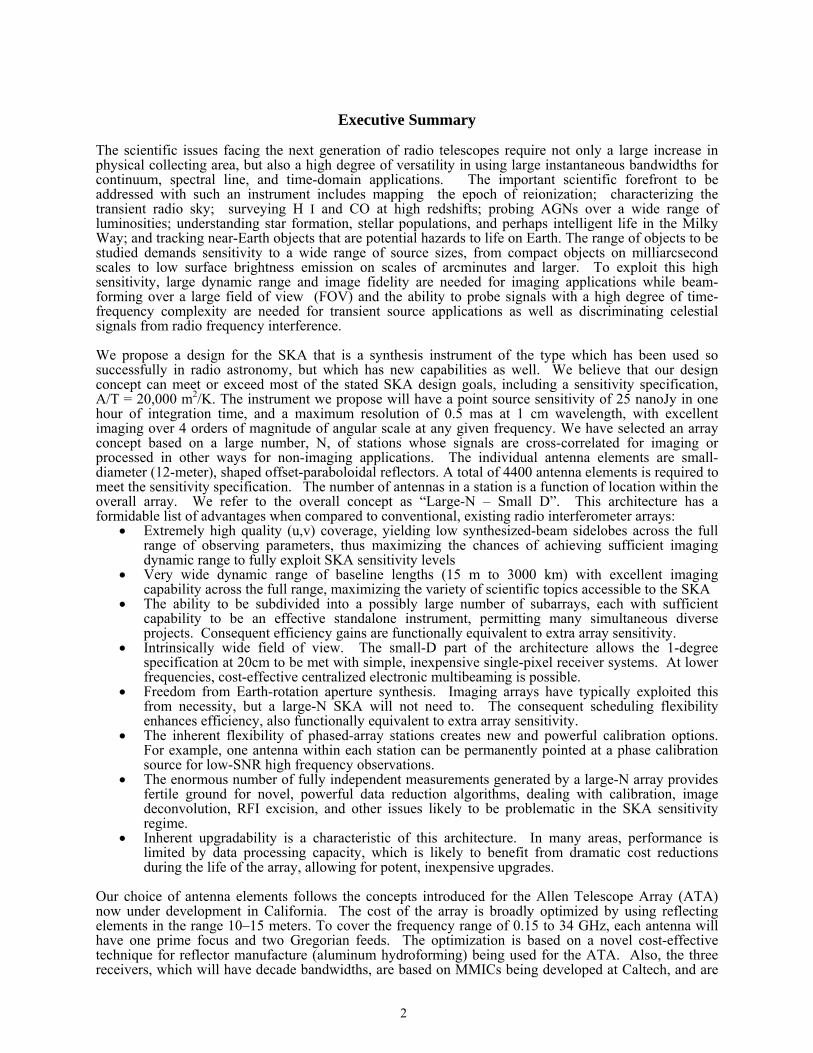
Figure 3.1 Possible configuration of the 4400 antenna elements shown on four different linear scales. The red dots show existing VLBA sites or planned EVLA sites. These plots do not reflect the locations of 2320 antennas inside the central 35 km circle, and instead for simplicity show a 3-arm log spiral of stations in this region. The inner configuration we are proposing is illustrated in Fig 3.3.
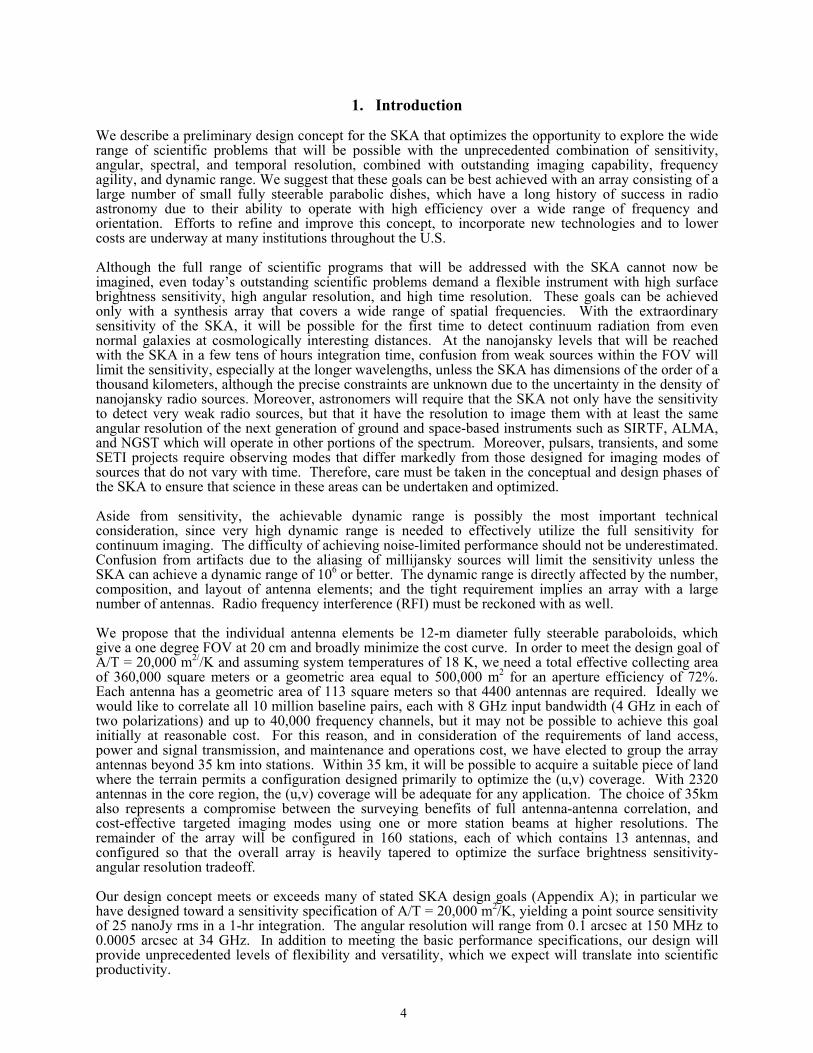
Figure 3.2 Instantaneous (u,v) coverage corresponding to the configuration shown in Figure 3.1, with the same caveat regarding the inner configuration
9

Figure 3.3 Instantaneous (u,v) coverge in the inner (5 km) region of the (u,v) plane, generated by full cross-correlation of individual antennas in this region. This extraordinary density of coverage will permit high fidelity imaging and mosaicing of large, complex, low brightness temperature regions. The axes are labeled in meters.
Figure 3.4 Sensitivity as a function of angular scale for our Large-N SKA design. The vertical axis shows effective sensitivity in units of m2/K, while the horizontal axis shows baseline length in log(meters). The curve indicates the effective collecting area of the array available on baselines shorter than a given value. More than ¼ of the total SKA sensitivity is available on baselines shorter than 1 km. Determining the number of stations, and therefore the number of antennas per station, beyond the 35 km diameter, requires consideration of certain tradeoffs. For example, the more stations, the better the (u,v) coverage and imaging quality of the array, but at the expense of poorer station beams, poorer sensitivity on individual array baselines which may compromise self calibration, and greater signal processing complexity. A larger number of stations will increase costs to some degree, due to fixed construction and maintenance costs associated with each site. Mitigating these costs, smaller stations will require less power, less land, less fencing, fewer station electronics and a smaller station electronics hut, and less frequent maintenance. There may be a price break if station power requirements drop to the point that local generation becomes feasible. As N increases, larger departures of station positions from “ideal” locations can be tolerated, which can have very favorable cable length implications
10
It is important to note that for a typical astronomical problem, we will not utilize the full range of spatial frequencies the SKA is capable of measuring. With a scale-free design, the usable range of baselines is
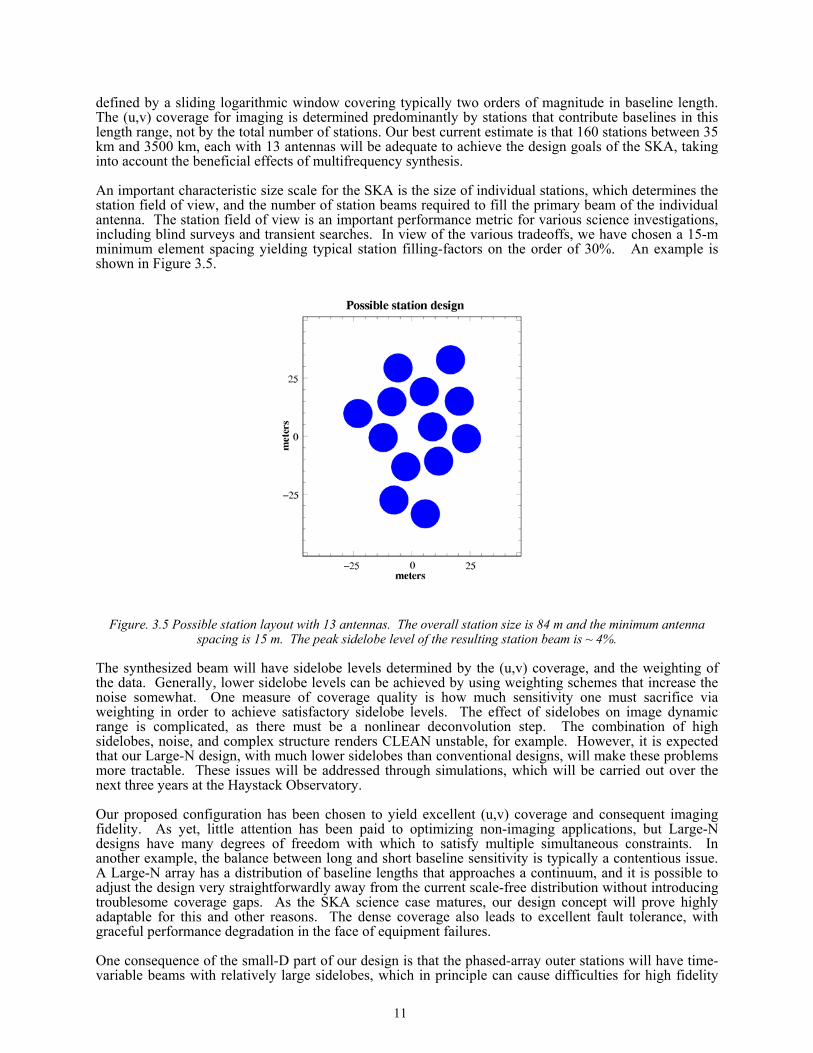
defined by a sliding logarithmic window covering typically two orders of magnitude in baseline length. The (u,v) coverage for imaging is determined predominantly by stations that contribute baselines in this length range, not by the total number of stations. Our best current estimate is that 160 stations between 35 km and 3500 km, each with 13 antennas will be adequate to achieve the design goals of the SKA, taking into account the beneficial effects of multifrequency synthesis. An important characteristic size scale for the SKA is the size of individual stations, which determines the station field of view, and the number of station beams required to fill the primary beam of the individual antenna. The station field of view is an important performance metric for various science investigations, including blind surveys and transient searches. In view of the various tradeoffs, we have chosen a 15-m minimum element spacing yielding typical station filling-factors on the order of 30%. An example is shown in Figure 3.5.
Figure. 3.5 Possible station layout with 13 antennas. The overall station size is 84 m and the minimum antenna
spacing is 15 m. The peak sidelobe level of the resulting station beam is ~ 4%. The synthesized beam will have sidelobe levels determined by the (u,v) coverage, and the weighting of the data. Generally, lower sidelobe levels can be achieved by using weighting schemes that increase the noise somewhat. One measure of coverage quality is how much sensitivity one must sacrifice via weighting in order to achieve satisfactory sidelobe levels. The effect of sidelobes on image dynamic range is complicated, as there must be a nonlinear deconvolution step. The combination of high sidelobes, noise, and complex structure renders CLEAN unstable, for example. However, it is expected that our Large-N design, with much lower sidelobes than conventional designs, will make these problems more tractable. These issues will be addressed through simulations, which will be carried out over the next three years at the Haystack Observatory. Our proposed configuration has been chosen to yield excellent (u,v) coverage and consequent imaging fidelity. As yet, little attention has been paid to optimizing non-imaging applications, but Large-N designs have many degrees of freedom with which to satisfy multiple simultaneous constraints. In another example, the balance between long and short baseline sensitivity is typically a contentious issue. A Large-N array has a distribution of baseline lengths that approaches a continuum, and it is possible to adjust the design very straightforwardly away from the current scale-free distribution without introducing troublesome coverage gaps. As the SKA science case matures, our design concept will prove highly adaptable for this and other reasons. The dense coverage also leads to excellent fault tolerance, with graceful performance degradation in the face of equipment failures. One consequence of the small-D part of our design is that the phased-array outer stations will have time-variable beams with relatively large sidelobes, which in principle can cause difficulties for high fidelity
11
imaging. It is therefore worth a brief discussion of how such problems can be addressed. In particular, we consider the effects of bright sources that lie outside the image field of view. If no attempt is made to subtract such sources, their effects will be seen on the image at a level determined by the response of the overall system at the source location, multiplied by the far-field synthesized beam sidelobe level, which we should thus try to minimize. Finite integration times (earth-rotation synthesis), finite bandwidths (multifrequency synthesis), and appropriate weighting schemes (e.g., robust weighting as implemented in AIPS) all serve to reduce the sidelobe levels of the synthesized beam. It should be recognized that self-calibration and accurate removal of sources outside the field of view and in the sidelobes of multi-antenna stations is in principle no different than calibration and removal of sources within the main field of view. The principal difference from current practice is that (a) the station gain is a strong function of position, and (b) that the amplitude of the instrumental gain variations is large. Position-dependent gain solutions are mandatory for any SKA design, and our current lack of suitable algorithms to solve for such effects is already limiting VLA performance in extreme cases. Similar algorithms are already under intensive development for LOFAR and will be a starting point for the SKA design effort. We will not need to solve for the entire station beam sidelobe pattern. Instead, we solve for the slowly varying gain only in the direction of sources bright enough to cause trouble, and the solutions should be sufficiently accurate to ensure adequate removal of the offending sources. As described above, within 35 km, we propose to cross-correlate all 2320 antenna signals individually. This simplifies the architecture, and preserves the full field of view of the 12-m antennas. In some sense, full cross-correlation is an ideal architecture. Why, then, do we not cross-correlate all 4400 antennas in the array? One reason is that for imaging, it is necessary to consider not only the correlation, but handling the correlator output data rate. This scales both as the square of the number of antennas and as the square of the array extent, and for a continent-sized array with 12-m antennas represents an unmanageable data handling load. The solution is to group antennas into phased-array stations, maintaining full sensitivity and adequate (u,v) coverage. The grouping of outer antennas into stations is also required to keep construction and maintenance costs under control, assuming conventional approaches to these problems. Eighty-four of these stations are located within an area of about 350 km diameter and which will be serviced by dedicated fiber and so it will be feasible to send the data back from all 1092 antennas individually, and form station beams at the central processing facility. Beyond 350 km, the array is likely to use rented fiber, and, at least initially, it will not be cost effective to send more than one or two station beams back from each station. This will not significantly impact the imaging performance of the array, as these higher resolution configurations will be used primarily to study compact radio sources, which are contained entirely within one station beam. Many of the requirements for imaging are beneficial for the non-imaging applications (primarily pulsars, transients, and SETI). The large spatial frequency range means that stations will be well-separated so that RFI can be identified and its impact eliminated or at least reduced because the RFI will be decorrelated, delayed, or otherwise altered. Another consequence of the large spatial frequency dynamic range is that this Large-N concept can operate efficiently, with multiple astronomical programs being observed simultaneously. For example, the 160 outer stations, each of which are each equivalent in area to a 90 m dish, can be simultaneously pointed to 160 different regions of the sky to study transient phenomena, while the inner array is being simultaneously used for low resolution astronomy; or a high resolution imaging program can be carried out with the outer part of the array while the inner part is being used for a high sensitivity transient monitoring program. In another mode all 4400 12-m antennas can be pointed in a different direction to monitor simultaneously about 1.4 steradians of sky, albeit with reduced sensitivity. Alternatively, multiple phased array beams can be constructed from the inner 2320 antennas to observe multiple transient sources within the one-degree FOV at 20 cm. Finally, as noted in the Executive Summary, Large-N designs of this type are motivated by several distinct benefits. Earlier simulation and analysis (Lonsdale & Cappallo 1999, in Technologies for Large Arrays, p. 243; Lonsdale et al. 2000, in Radio Telescopes, SPIE, 4015, 126) show that significant (u,v) coverage and imaging benefits accrue for the SKA as N increases, up to the order of N = 1000. The current strawman design and array configuration has been chosen to exploit all of the other listed benefits as well.
12

In summary, this configuration contains 1200 antennas within an area of diameter less than ~ 3 km and 2320 antennas inside 35 km. There are 1092 antennas in 84 stations between 35 and 350 km, and 988 antennas in 76 stations between 350 and 3500 km. The array layout and sensitivity as a function of angular scale are illustrated in figures 3.1 to 3.4. Similar array configurations are possible in a variety of candidate sites around the world, but for this preliminary strawman design we have chosen to center the location in the southwestern part of the United States where we have good information on station siting constraints and cost factors.
4. Site Selection and Development Site requirements for the SKA are similar to other large modern radio telescope facilities. Access to a large fraction of the sky, including the Galactic center, will be very important to reach several of the scientific goals described in Section 2, so a low latitude site is essential. Although the SKA will have many technological approaches to minimize the effect of RFI, it will still be important to locate as much of the array as feasible in areas where manmade interference will be minimal, although we cannot avoid interfering signals will be from aircraft or satellites. Also important will be atmospheric phase distortions on the image quality, so a dry site is advantageous. These requirements for a desert-like remote location needs to be balanced against the problems associated with staff recruitment in such locations. A higher degree of automation and remote operation than current instruments is essential for successful implementation of the SKA. For the purposes of this strawman design, we chose as a working model to center the our SKA configuration near the location of the current VLA, which is a credible location for such an array, and has the additional advantage that costs can be more easily estimated. Eighty-four SKA stations would be located within a 350-km diameter (Intermediate Array), which also includes the central 35 km compact array and ten of the proposed sites of EVLA antennas. An additional 76 stations would be situated to optimize the high resolution imaging capability of the SKA, with spacings out to ~ 3500 km (Extended Array). The extended array configuration would include eight sites from the current VLBA. In addition, we anticipate that some of the other large collecting area radio telescopes in the world (should they still exist when the SKA becomes active), such as the Arecibo, Lovell, Effelsberg, and Green Bank antennas, the GMRT, WSRT, ATA, VLA, and ATNF arrays could be used together with the SKA for enhanced sensitivity and (u,v) coverage on the longer baselines, over available frequency ranges. These additions have a negligible impact on the required correlator resources. The development of land for each station site will require cost and effort that is likely to be strongly location-dependent. Consistent with adequate array performance, we will want to minimize the number of separate sites. The costs for each site may be dominated by the cost of bringing the fiber, power or both to that site, and some will be easier than others. We are exploring the use of commercially available IR communication systems to solve the “last-mile” problem. For a SW US location, we might have to install up to 10 km of power lines and 10 km of fiber for each site, at a cost of about $350K. For a US location, the ownership of the sites we obtain is likely to come in many flavors: federal government, state, and private. Each site will be different and will take a significant effort. Based on estimates NRAO is receiving for the EVLA, we anticipate that it will cost about $100K to acquire each site. This includes the costs of site testing, public contact, local agents, any necessary land purchases, environmental impact statements, and so on. Roads and other miscellaneous expenses might cost another $50K. Thus, before we build anything on the site (e.g., foundations, buildings, fences, security) each site, covering a few tens of acres or less could cost up to $500K, or $80 M for the 160 sites of the Intermediate and Extended arrays. Each remote site will also need an operations/maintenance building. Such buildings for the VLBA cost $350K, though the large multiplier in our SKA design will be an incentive to meet this requirement in a more cost-effective manner. Within a few hundred km of the array center, the stations are sufficiently closely spaced, that they might be supported by a few regional maintenance centers with a reduced need for building space. The cost of acquiring the central site is unclear and will depend on the detailed arrangements but may be another $20M for roads, power, land etc. A building will be needed to accommodate a large central site operations and maintenance staff, for which we have estimated ~$10M.
13
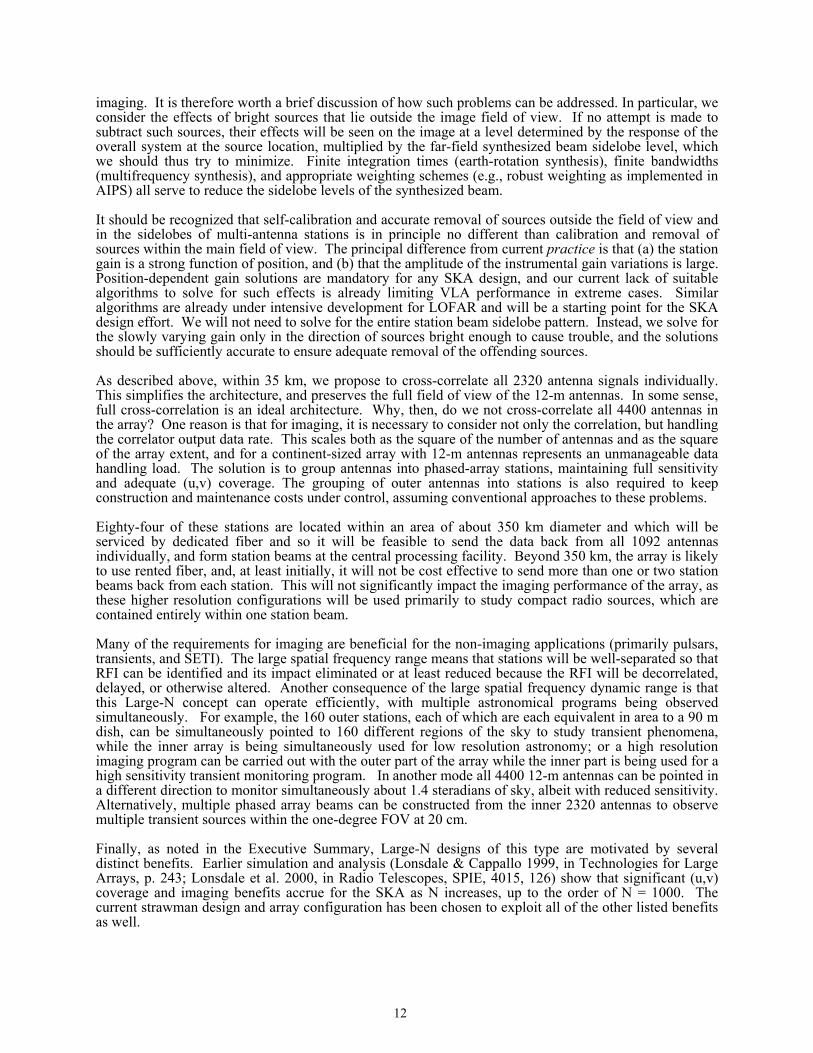
5. Antenna Elements Our proposed antenna is a 12-m, hydroformed shaped offset paraboloidal reflector with both Gregorian and prime focus feeds. The heritage for this antenna lies in the Allen Telescope Array project which has 350 6-m antennas specified for use up to 11 GHz and which are on order from Andersen, Inc. of Idaho Falls, ID.
Antenna Requirements Reflector Type – Offset Gregorian with 12-m diameter projection Surface Accuracy – 0.2 mm rms deviation from best fit caused by gravity, wind up to 15 mph, and a temperature of -10 to +55C Pointing Accuracy - 0.7' after correction table in 15mph wind Phase Center Stability – Shall move less than 1mm due to 15mph wind or sun/shade condition. Survival – Drive to stow in 50 mph wind and survive at stow in 100 mph wind. Receiver Mounting – 90 kg at Gregorian focus and 90 kg at prime focus including 2.4-m subreflector.
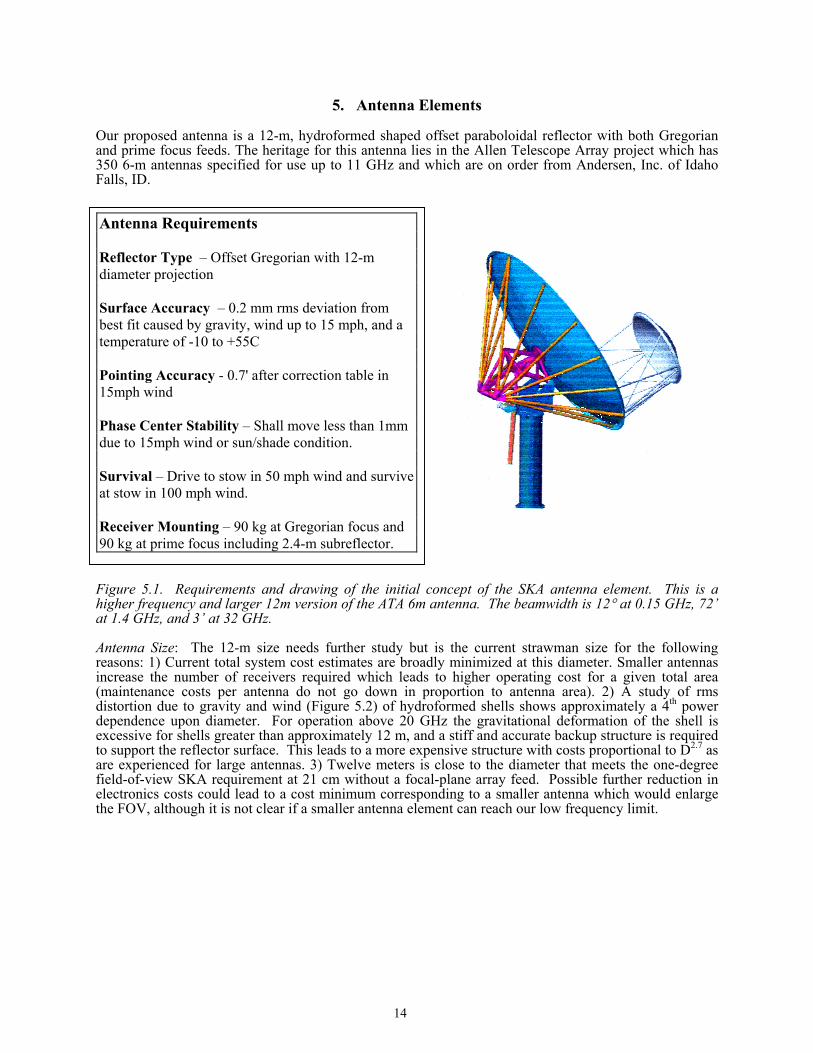
Figure 5.1. Requirements and drawing of the initial concept of the SKA antenna element. This is a higher frequency and larger 12m version of the ATA 6m antenna. The beamwidth is 12° at 0.15 GHz, 72’ at 1.4 GHz, and 3’ at 32 GHz. Antenna Size: The 12-m size needs further study but is the current strawman size for the following reasons: 1) Current total system cost estimates are broadly minimized at this diameter. Smaller antennas increase the number of receivers required which leads to higher operating cost for a given total area (maintenance costs per antenna do not go down in proportion to antenna area). 2) A study of rms distortion due to gravity and wind (Figure 5.2) of hydroformed shells shows approximately a 4th power dependence upon diameter. For operation above 20 GHz the gravitational deformation of the shell is excessive for shells greater than approximately 12 m, and a stiff and accurate backup structure is required to support the reflector surface. This leads to a more expensive structure with costs proportional to D2.7 as are experienced for large antennas. 3) Twelve meters is close to the diameter that meets the one-degree field-of-view SKA requirement at 21 cm without a focal-plane array feed. Possible further reduction in electronics costs could lead to a cost minimum corresponding to a smaller antenna which would enlarge the FOV, although it is not clear if a smaller antenna element can reach our low frequency limit.
14
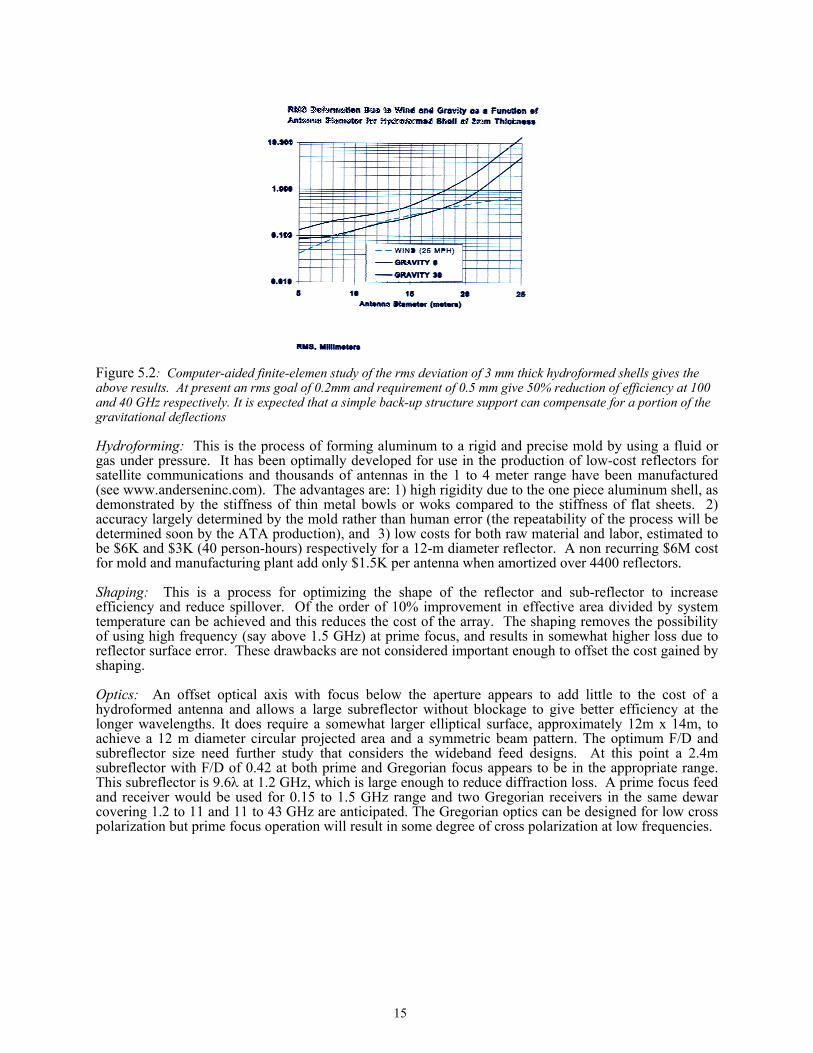
Figure 5.2: Computer-aided finite-elemen study of the rms deviation of 3 mm thick hydroformed shells gives the above results. At present an rms goal of 0.2mm and requirement of 0.5 mm give 50% reduction of efficiency at 100 and 40 GHz respectively. It is expected that a simple back-up structure support can compensate for a portion of the gravitational deflections Hydroforming: This is the process of forming aluminum to a rigid and precise mold by using a fluid or gas under pressure. It has been optimally developed for use in the production of low-cost reflectors for satellite communications and thousands of antennas in the 1 to 4 meter range have been manufactured (see www.anderseninc.com). The advantages are: 1) high rigidity due to the one piece aluminum shell, as demonstrated by the stiffness of thin metal bowls or woks compared to the stiffness of flat sheets. 2) accuracy largely determined by the mold rather than human error (the repeatability of the process will be determined soon by the ATA production), and 3) low costs for both raw material and labor, estimated to be $6K and $3K (40 person-hours) respectively for a 12-m diameter reflector. A non recurring $6M cost for mold and manufacturing plant add only $1.5K per antenna when amortized over 4400 reflectors. Shaping: This is a process for optimizing the shape of the reflector and sub-reflector to increase efficiency and reduce spillover. Of the order of 10% improvement in effective area divided by system temperature can be achieved and this reduces the cost of the array. The shaping removes the possibility of using high frequency (say above 1.5 GHz) at prime focus, and results in somewhat higher loss due to reflector surface error. These drawbacks are not considered important enough to offset the cost gained by shaping. Optics: An offset optical axis with focus below the aperture appears to add little to the cost of a hydroformed antenna and allows a large subreflector without blockage to give better efficiency at the longer wavelengths. It does require a somewhat larger elliptical surface, approximately 12m x 14m, to achieve a 12 m diameter circular projected area and a symmetric beam pattern. The optimum F/D and subreflector size need further study that considers the wideband feed designs. At this point a 2.4m subreflector with F/D of 0.42 at both prime and Gregorian focus appears to be in the appropriate range. This subreflector is 9.6λ at 1.2 GHz, which is large enough to reduce diffraction loss. A prime focus feed and receiver would be used for 0.15 to 1.5 GHz range and two Gregorian receivers in the same dewar covering 1.2 to 11 and 11 to 43 GHz are anticipated. The Gregorian optics can be designed for low cross polarization but prime focus operation will result in some degree of cross polarization at low frequencies.
15
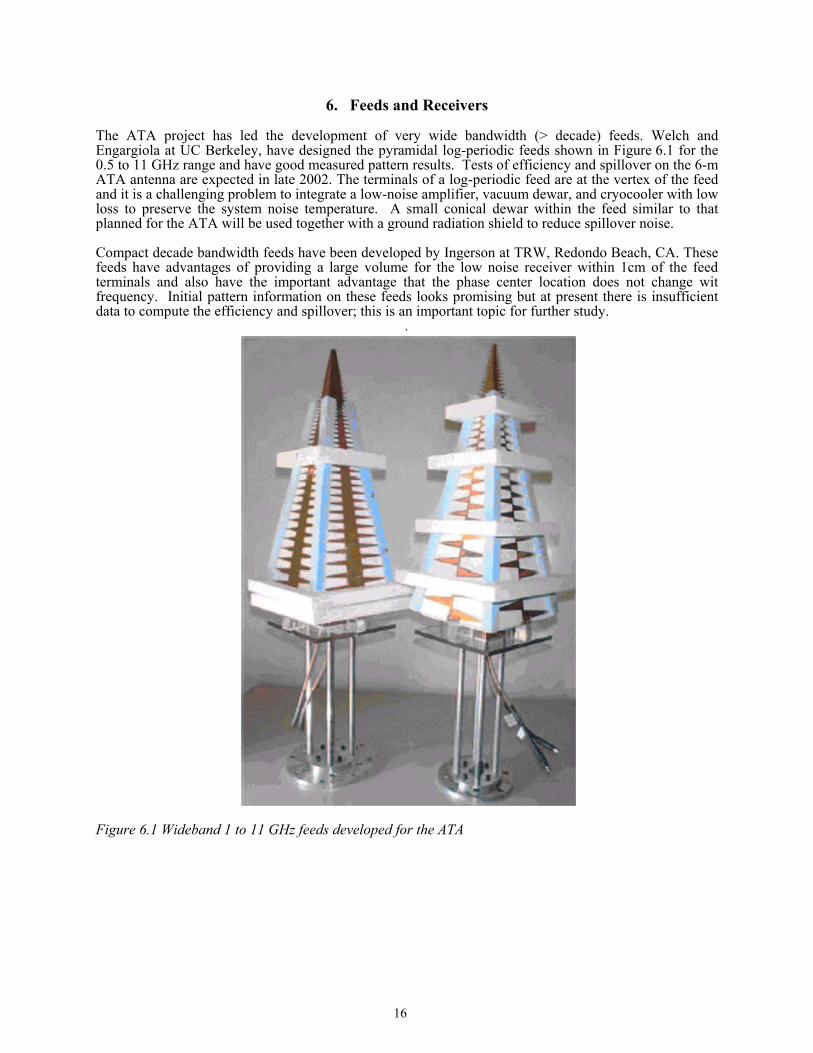
6. Feeds and Receivers The ATA project has led the development of very wide bandwidth (> decade) feeds. Welch and Engargiola at UC Berkeley, have designed the pyramidal log-periodic feeds shown in Figure 6.1 for the 0.5 to 11 GHz range and have good measured pattern results. Tests of efficiency and spillover on the 6-m ATA antenna are expected in late 2002. The terminals of a log-periodic feed are at the vertex of the feed and it is a challenging problem to integrate a low-noise amplifier, vacuum dewar, and cryocooler with low loss to preserve the system noise temperature. A small conical dewar within the feed similar to that planned for the ATA will be used together with a ground radiation shield to reduce spillover noise. Compact decade bandwidth feeds have been developed by Ingerson at TRW, Redondo Beach, CA. These feeds have advantages of providing a large volume for the low noise receiver within 1cm of the feed terminals and also have the important advantage that the phase center location does not change wit frequency. Initial pattern information on these feeds looks promising but at present there is insufficient data to compute the efficiency and spillover; this is an important topic for further study.
.
Figure 6.1 Wideband 1 to 11 GHz feeds developed for the ATA
16

Figure 6.2. Measured and modeled noise temperature vs frequency for an InP HEMT MMIC LNA at temperatures of 300 K, 77 K, and 4 K. SKA operation of such an LNA at a temperature of 15 K with noise temperature < 8 K is proposed. Further transistor development during the next few years is likely to reduce this noise or allow operation at 77 K It is apparent that feeds with decade bandwidth can be designed and we can use this fact to reduce the number of receivers required in the array and also allow wide instantaneous bandwidth. Either the ATA or TRW feed has a maximum diameter of approximately λ/2 at the longest wavelength and it is feasible to cool the entire feed for frequencies above approximately 1.2 GHz where λ/2 = 12.5 cm. Receivers with decade bandwidth have been under development by Weinreb at Caltech using microwave monolithic integrated circuits (MMIC’s) with high-electron mobility InP field-effect transistors (HEMT’s). Figure 6.2 presents the current state-of-the-art noise temperatures as a function of frequency for a single MMIC LNA at three temperatures. It is evident from this measured data that an LNA with less than 8 K noise temperature in the 1 to 12 GHz range operating at 15 K is feasible. Noise temperatures less than 18 K have been measured for both MMIC and discrete transistor LNA’s operating at 15 K at 32 GHz.
17
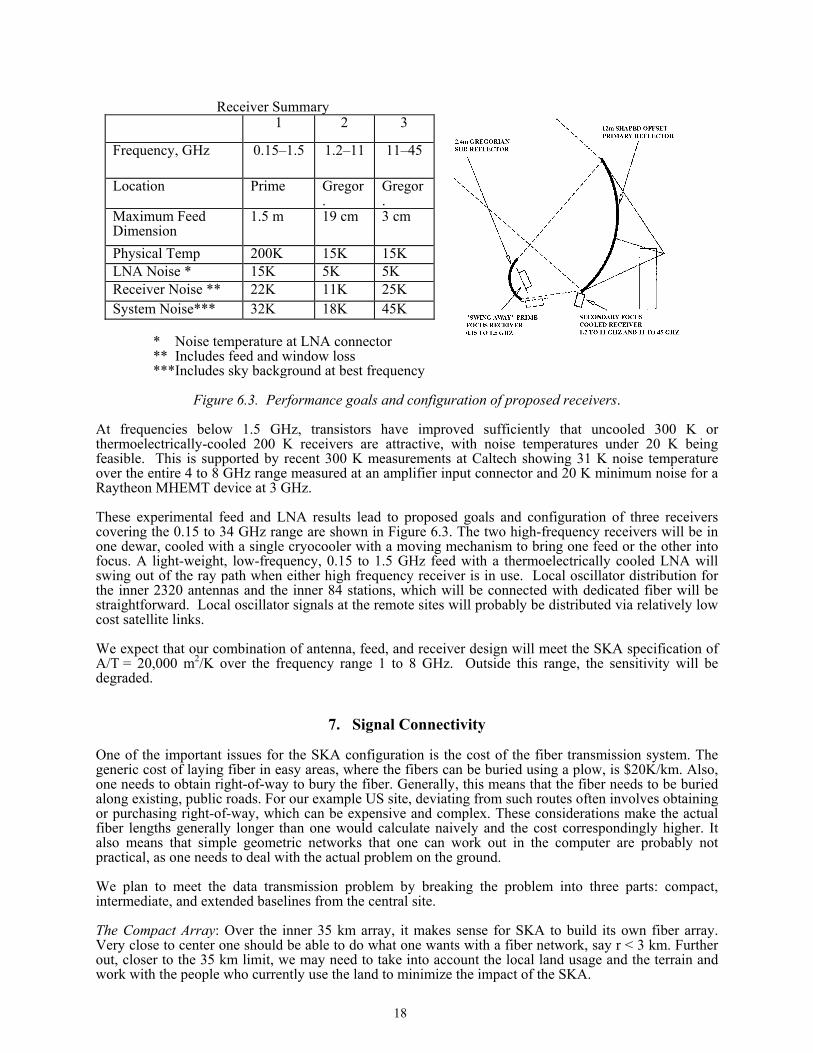
Receiver Summary 1 2 3
Frequency, GHz 0.15–1.5 1.2–11 11–45
Location Prime Gregor.
Gregor.
Maximum Feed Dimension
1.5 m 19 cm 3 cm
Physical Temp 200K 15K 15K LNA Noise * 15K 5K 5K Receiver Noise ** 22K 11K 25K System Noise*** 32K 18K 45K
* Noise temperature at LNA connector ** Includes feed and window loss ***Includes sky background at best frequency
Figure 6.3. Performance goals and configuration of proposed receivers.
At frequencies below 1.5 GHz, transistors have improved sufficiently that uncooled 300 K or thermoelectrically-cooled 200 K receivers are attractive, with noise temperatures under 20 K being feasible. This is supported by recent 300 K measurements at Caltech showing 31 K noise temperature over the entire 4 to 8 GHz range measured at an amplifier input connector and 20 K minimum noise for a Raytheon MHEMT device at 3 GHz. These experimental feed and LNA results lead to proposed goals and configuration of three receivers covering the 0.15 to 34 GHz range are shown in Figure 6.3. The two high-frequency receivers will be in one dewar, cooled with a single cryocooler with a moving mechanism to bring one feed or the other into focus. A light-weight, low-frequency, 0.15 to 1.5 GHz feed with a thermoelectrically cooled LNA will swing out of the ray path when either high frequency receiver is in use. Local oscillator distribution for the inner 2320 antennas and the inner 84 stations, which will be connected with dedicated fiber will be straightforward. Local oscillator signals at the remote sites will probably be distributed via relatively low cost satellite links. We expect that our combination of antenna, feed, and receiver design will meet the SKA specification of A/T = 20,000 m2/K over the frequency range 1 to 8 GHz. Outside this range, the sensitivity will be degraded.
7. Signal Connectivity One of the important issues for the SKA configuration is the cost of the fiber transmission system. The generic cost of laying fiber in easy areas, where the fibers can be buried using a plow, is $20K/km. Also, one needs to obtain right-of-way to bury the fiber. Generally, this means that the fiber needs to be buried along existing, public roads. For our example US site, deviating from such routes often involves obtaining or purchasing right-of-way, which can be expensive and complex. These considerations make the actual fiber lengths generally longer than one would calculate naively and the cost correspondingly higher. It also means that simple geometric networks that one can work out in the computer are probably not practical, as one needs to deal with the actual problem on the ground. We plan to meet the data transmission problem by breaking the problem into three parts: compact, intermediate, and extended baselines from the central site. The Compact Array: Over the inner 35 km array, it makes sense for SKA to build its own fiber array. Very close to center one should be able to do what one wants with a fiber network, say r < 3 km. Further out, closer to the 35 km limit, we may need to take into account the local land usage and the terrain and work with the people who currently use the land to minimize the impact of the SKA.
18
The Intermediate Array (35 km < d < 350 km). On these scales, and depending on the site, we might work with local telephone companies to lease existing fiber and to add short runs where needed. Rural companies often benefit from loans and subsidies, have more fiber in the ground than they can expect to use, and thus have a reason to provide dark fibers at quite reasonable costs. In this scenario, we would lease the dark fiber and would have to supply the electronics to drive the fibers and maintain our electronics, as we would for the short baselines. As an example, current negotiations underway for the New Mexico Array of the EVLA, suggest that a fiber can be leased at a rate of $500/yr/km/strand. Current technology in routine operation allows transmission of 1 Tbit/s on a single strand and should improve in the future, and it is thus likely that the intermediate array could be connected for lease fees of a few $M/yr. Alternatively, we could wire this region with ~1500km of our own fiber at a capital cost of ~$30M. The Extended Array (d > 350 km): Beyond about 350 km, we will probably be forced to use fibers owned by large, long-distance communications companies. Acquiring the necessary bandwidths today would be prohibitively expensive, and projections 10 or more years into the future are extremely uncertain. However, technological trends are favorable in this area, hardware costs dropping at least as fast as, and possibly faster than, Moore’s law. With the substantial caveat that the commercial landscape 10–15 years from now is difficult to predict, there is reason for optimism on the relevant timescales. In addition, the scientific capability of a Large-N SKA degrades only slowly with decreased bandwidth on the longest baselines. The principal casualty of a factor of 10 reduction in bandwidth beyond 350 km would be milliarcsecond continuum sensitivity above ~ 5 GHz. Such a limitation would probably be confined to the earliest years of SKA operation.
8. Signal Processing We focus on the correlator aspects of signal processing as these are likely to be most challenging initially. To zeroth order, non-imaging applications can treat the signals from the N antennas or stations individually, as opposed to the correlator which must handle of order N2 antennas or stations. Even in a phased-array mode, the number of antennas to be phased together will often be smaller than the number of antennas in the compact core. The task of GHz-bandwidth correlation processing of 2320 antennas plus 160 outer stations (2480 signals) at first may appear only feasible after many years of Moore’s Law. However, three recent developments have made this task feasible: 1) the F-X type of array processing (Chikada, Bunton, and D’Addario) in which the signal from each antenna is first filtered in a digital filter bank to the final desired resolution and then correlated with only one lag in the correlator, 2) new “polyphase” algorithms for digital filtering (Vaidyanathan, Ferris, Werthimer), which have reduced the required number of operations per second for sharp cut-off filters by orders of magnitude, and 3) use of application specific integrated circuits (ASIC’s) which have of the order of 20 times greater logic density than field-programmable gate-arrays (FPGA’s). The greater logic density and single-lag correlator design enables 80 antenna x 80 antenna = 6400 baseline, two-bit I and Q correlations in one chip at a 400 MHz rate (Timoc, Spaceborne, Inc). For 2500 inputs there are 3,123,750 baselines and the correlation for 800 MHz bandwidth (I and Q doubles the bandwidth) can be performed with 488 correlator ASICs. This chip would be approximately 3 cm square, have approximately 1400 connection pads, dissipate 16 W, and would cost less than $500 per chip including 50% yield, testing, and packaging. Another $500 per chip should be allocated for board mounting, power, drivers, and cooling (liquid cooled circuit boards are suggested). A similar sized ASIC for digital filter implementation could filter 800 MHz into 4096 channels with 0.2 MHz resolution for as many as ten antennas (or five antennas, two-polarizations) in a single chip. A strong consideration in the SKA signal processing design is the belief that Moore’s Law may allow a factor of 10 increase in capability at the same cost every five years. Not all the costs of components of a correlator decrease with Moore’s Law (design cost and interconnection cost, as examples) and a plot of correlator cost per operation per second vs time appears to be closer to seven years for a decade decrease in cost. A prudent approach to SKA signal processing would be to limit the initial investment in signal processing and plan to upgrade the hardware out of operations funds about every ten years. If designated operating funds provided 1% of capital costs each year; then 10%, perhaps $70M would be available for a
19
decadal upgrade. It should also be understood that the cost of increasing total bandwidth is also limited by signal transmission costs and these costs will decrease but may not follow Moore’s Law. Our strawman approach is to limit the initial signal processing investment to $80M and provide whatever capability can be obtained at the time of the detailed design. At present using technology which is certain to be available by 2005 we believe that four 800 MHz wide channels, 3.2 GHz total bandwidth, can be processed to 0.2 MHz spectral resolution, for 2500 antennas or stations, within this cost cap (Table B.4). More channels and sharper resolution can be achieved at less total bandwidth; for example at 400 MHz total bandwidth, 256,000 channels, with 1.56 KHz resolution should be feasible. Our signal processing design is in an early design phase and much work remains to be done even on the conceptual architecture. To demonstrate feasibility of the 2500 3.2 GHz bandwidth system described above, a skeleton design with some layout and interconnection numbers follows. Digitization: Sampling of each channel is at 800 MHz and quantization is to (6,6) bits (real, imaginary). This is cost effective with currently available ADCs. The Nyquist bandwidth is then 800 MHz, and we support four such channels at two per polarization. Most of the quantization is intended to provide headroom against interference. Power within each digital filter band will be measured using 6-bit quantization but correlation will be performed with 2-bit multiplication. The total bandwidth is limited mainly by the cost of signal transmission rather than processing. Tracking: For each channel, delay tracking is implemented with a first-in, first-out (FIFO) memory to a resolution of one sample and by an FIR interpolating filter for finer resolution. For the FIFO memory, 120 MB per channel allows tracking over the whole sky at 3000 km from the array reference point. The other processing is implemented via FPGAs. Phased Array Summation: As explained in Section 3 the outer half of the antennas is organized into stations, and for each station only the phased array sum of the antenna signals is brought to the center. The signal summation represents a small amount of processing; for each of the 160 summers we estimate $10K. Indeed subject to the limitations of the data transmission system, if needed, multiple beams can be formed at each station. This only requires duplicating the trackers and adders for each additional beam, but the station-to-center signal transmission would also be multiplied by the number of beams. Signal Transmission: We need to transmit 38.4 Gb/s from each antenna, regardless of whether it is part of a station group. This fits nicely into four OC192-rate optical channels, one for each signal channel, with about 3% available for formatting overhead. We estimate $4000 for the electronic and photonic components needed to support each such link, assuming that each is on its own fiber. The cost of the antenna-to-control room- data transmission is costed under data transmission in Appendix B, along with fiber and trenching costs. Transmission from the summing point of each outer station to the center will be via leased fibers, but we must still supply the electronic and photonic components. Central Processing: FX Correlator: The central processing is organized as an FX correlator due to its high efficiency. The system is constructed in large sections, each of which handles one polarization pair of channels. The present design calls for two such sections to process a total of four channels with 3.2 GHz total bandwidth. Expansion by adding sections is straightforward since no connections are needed among sections. Major components of the system are the F units (digital filter banks); dual-port buffer memories for reordering the data; interconnections; X units (cross correlators); and LTAs (long term accumulators). These are organized into two types of modules, station-oriented and baseline-oriented; the first incorporates F units and reordering buffers, and the second incorporates X units and LTAs.
20
Spectroscopic Filter Banks (F units): For each channel, the 800 MHz bandwidth is resolved into 4096 spectral channels (0.2 MHz resolution) in a polyphase filter bank. (A mode with many more spectral channels at less total bandwidth is probably possible in the same hardware.). After filtering, the signals are rounded to 2 bit + 2 bit for cross correlation. Based on preliminary designs being done for the AT and the ATA, one such filter bank for 200 MHz bandwidth can be implemented in a Xilinx XC2V3000 FPGA at 200 MHz clock. We will instead use a full-custom ASIC, for which we assume a factor of 20 higher density and 400 MHz clock. This allows 10 filter banks of 800 MHz bandwidth per chip, or two channels for each of five stations. A single F unit uses 13 such chips to process 64 stations, and 40 F units allow processing 2560 stations. The same unit includes 128 ten Gb/s optical receivers and demultiplexers for the station inputs (or 192 for outer stations, which use three optical channels for the two signal channels); a few adjacent PC boards may be needed to accommodate these. Also in the unit are the reordering
buffers, which should fit on the same PC board as the filter banks. These store blocks of 12800 samples from the 4096 spectral channels (26 MB) and send them out with all samples of each channel together. The total memory is 6.72 GB for the entire unit, with double buffering. Four logically separate outputs are then created, each with 1024 of the 4096 spectral channels and both polarizations of all 64 antennas; these go to the four X units (see below). Each output requires 102.4 Gb/s, which is transmitted on 10 optical fibers or 40 fibers altogether. The production cost of each ASIC is estimated at $500; with support components and infrastructure, the cost of each complete unit is estimated as $25K (not counting the input receivers, which were included in the signal transmission, or the output transmitters, which are included below). Cross-correlators (X units): To minimize interconnections, it is necessary to organize the cross correlations so that all baselines are handled in one unit. Each unit then handles whatever fraction of the bandwidth can be accommodated in an assembly of feasible size. We want the smallest possible number of units, also to minimize interconnections. Each unit should handle both polarizations so as to allow a mode for cross-polarized correlations. Using a bottom-up approach, we find that everything can be fitted into four X units, each of which handles 200 MHz per polarization for all stations. This is accomplished by using custom ASICs, each of which contains 6400 complex multiply-accumulators (CMACs) for 2b+2b numbers and operates at 400 MHz rate for computations and I/O. We believe that such a chip is feasible in current technology at a marginal cost of $250 on the basis of a quotation for a larger lag-correlator chip. Each chip correlates one sample of 80 stations against 80 others on each clock, and does this for a block of 12800 samples of the same spectral channel (see discussion of reordering buffer, above). The accumulators are double buffered, and over the next 12800 clocks the 6400 values are read out sequentially and further accumulated in an external RAM. We proceed to process all 1024 spectral channels of one polarization followed by those of the other polarization. About 64 MB of RAM is needed for each chip; this forms the LTA. The ASICs and RAMs are assembled in an 8 x 8 array on one PC board; each correlates 8 x 80 = 640 stations. A unit then includes 16 boards to handle 2560 stations and is comprised of 1024 ASIC’s at a cost of $500K. Each unit also needs 400 optical channel receivers; these are implemented on several adjacent boards. With support and infrastructure, an X unit is estimated to cost under $4000K (not including the input receivers, which are included below). F to X Interconnections: To connect the 40 F units to the four X units, 160 topologically separate connection paths are needed, and the design attempts to minimize this number. Using 10 Gb/s optical links requires 1600 fibers and associated electronic and photonic components. These are short-distance optical links that can be realized with 800 nm low cost VCSEL’s. These are estimated at $2K per link.
9. Interference Mitigation The SKA sensitivity alone will not make it more vulnerable to RFI than less sensitive instruments with comparable baseline lengths and bandwidths. The absolute gain of the far sidelobes of a radio telescope is essentially independent of main beam gain. Hence, the interference to system noise ratio will be the same for the SKA as it is for other telescopes, while the signal to system noise ratio for a cosmic source of given strength will be higher for the SKA than for existing instruments by the ratio of their collecting areas. For imaging applications the SKA will benefit from RFI decorrelation on longer baselines due to fringe rotation and bandwidth decorrelation well away from the white-light fringes of the array, as for current synthesis arrays; for non-imaging applications the Large-N concept offers redundancy and antenna separation in determining whether a signal is of celestial or terrestrial origin. In order to fully exploit the excellent sensitivity commensurate with the large collecting area, the SKA, like the EVLA and eMERLIN, will use large bandwidths of the order of 20% of the observing frequency for continuum observations. In order to compensate for the unfilled (u,v) coverage, especially that resulting from breaking the outer parts of the array into stations, the SKA will depend on multi-frequency-synthesis (MFS) for the most high fidelity imaging programs. Finally, the broadband nature of the receivers will make the SKA sensitive to interfering signals even outside the processed band. To the extent possible, sources of interference must be avoided, and measures must be taken to suppress any remaining interfering signals. First, and most obvious—but often ignored in the past—the RFI environment of the site chosen for the SKA must not be made worse by the installation of the signal processing electronics and other support equipment associated with operation of the array. Second, through a combination of site selection and
21
receiver design, the SKA system must be linear to all signals nearly all the time. Third, the signal processing must be designed to permit simple blanking schemes on time scales as short as microseconds and to permit the addition of more sophisticated RFI canceling algorithms as they are developed. The most vulnerable part of the SKA to moderate and low intensity interference will be the compact center of the array where RFI decorrelation will be the least. Also, most of the control and initial signal processing electronics are likely to be located near this compact array area. Unusual care must be taken to avoid spoiling the RFI environment of the array with these electronics. No observatory to date has done an adequate job of protecting its instruments from self-generated RFI, and this needs to be a top priority for the SKA from its initial development stages, including state-of-the-art techniques for designing electronics for minimum radiation, a systematic measurement and emission suppression program on all equipment to be installed at the SKA, and a continuous environmental control during all phases of construction and operation. It is much harder and more expensive to suppress emissions from a piece of equipment after it is built than it is to design it for low emissions from the start. Off-the-shelf equipment, such as workstations, controllers, and other digital gear must be placed in well-designed, shielded enclosures or, preferably, kept well away from the short baselines of the correlated array. Linearity of the RF and signal processing electronics is imperative to the success of any RFI mitigation scheme that depends on coherent subtraction of interfering signals, such as null steering or post-correlation subtraction. The SKA cannot be expected to be linear to all possible RFI conditions. Satellites in or very close to the main beam and pulsed radar signals from aircraft and powerful ground radars are simply too strong to accommodate linearly. Careful site selection and analysis of the existing and forecast RFI intensity statistics for the chosen SKA site must be available to the system designers early in the development stages to permit a careful balance between cost, dynamic range, and lost observing time. A number of promising techniques for canceling RFI in the pre- and post-correlation stages of array signal processing are now under study. A few early versions of these techniques will probably be sufficiently tested in time to incorporate them into the basic design of the array. Support of RFI mitigation research needs to be a complementary part of SKA development at least as much for the purpose of making educated guesses on how future RFI signal processing schemes are likely to develop as for the benefit of having mitigation schemes in place at first light. Some array architectures may be more favorable to canceling techniques than others, and some signal processing architectures are more likely than others to allow the addition of new signal processing techniques as they are developed. High time and frequency resolution will benefit both simple and elaborate RFI excision schemes, but this resolution is expensive and requires careful consideration based on as much research as can be supported between now and the beginning of full SKA design.
10. Data Management Constructing a large synthesis radio telescope requires striking an appropriate balance in the funds spent in various areas: antennas, correlator, and computing. Since the cost of the correlator and computing hardware are subject to cost reduction via Moore’s Law, it makes sense to design for an upgrade of correlator and computing mid-way through the lifetime of the array. In the case of SKA, this means that we will initially place more resources in building antennas and physical plant, with the expectation that the initial correlation and computing will be sufficient to exploit only a fraction of the capabilities of the hardware. The challenge of building and operating hardware needed for the SKA is matched by the challenge of assembling the software needed to run it. Data management requirements include imaging, transient source and other data analysis, archiving, etc., e.g., full end-to-end operation. In many respects, software should be considered as a capital expense, while the computing hardware is a recurring operational expense. As is true for existing instruments, the software will be divided into online and offline components. However, in contrast to existing systems, the online SKA software will include extensive automated pipeline processing and archiving of data. In this respect, it is similar to LOFAR, and can be expected to benefit substantially from that development as well as the development of software systems for scientific spacecraft, and the NVO. In addition, the hierarchical organization of a Large-N array potentially reduces
22
costs for centralized processing, which makes scaling from ALMA and EVLA practical for some applications. Online processing: Online computing is dominated by three applications; monitor and control, online data processing, and archiving. The size of the SKA makes monitor and control more complex than for existing interferometers. However, the hierarchical organization of a Large-N array that is divided into smaller stations or subarrays simplifies the problem. Antenna control, beam formation, and hopefully RFI excision, can be managed by local station computing systems, which are replicated across the array. At this point, monitor and control is reduced to a problem that can be scaled from existing systems. The most critical aspect of the monitor and control system will be fault tolerance, because the large size of the SKA and its dependence on long-distance data transmission. Online data processing comprises a pipeline capable of intelligent flagging, calibration, beamforming, and imaging. Each correlated field of view will be processed automatically and stored. Because the SKA is a high throughput instrument, the pipeline must create relatively high dynamic range images dependably. Because the pipeline will produce standardized products, it will be constructed from an optimized subset of the more general data reduction package. Experience with the ATCA, BIMA, ATA, ELVA, LOFAR, and ALMA should provide experience and or software that can be scaled. The SKA archive will store all correlator output. The design can be scaled up from existing systems and plans. However, the interface and modes in which it will be used have not been determined. Offline processing: The generality of the SKA, its high sensitivity, large number of simultaneous fields of view, and broad instantaneous bandwidth will foster the creation of a large and diverse user community. To this community, the face of the SKA will be defined by its software. The instrument will rise or fall in large measure based on the versatility and ease of use of this software. Qualitatively, the investment in hardware and in software must be comparable. There will be four types of users. Most will see the SKA as merely a radio camera that supplies moderately high dynamic range, pipeline-processed images. These users will require image analysis tools alone. A smaller number of users will wish to customize and recreate images from already calibrated data, using special algorithms or sets of imaging parameters. A minority of users will work directly with the visibility data, refining the editing and calibration of data. A fourth class of users will not make images but will analyze time series and/or spectra from the SKA. In the following we address the first three classes explicitly. The fourth class of users is already accustomed to dealing with terabyte volumes of data, possibly processed on parallel machines. A Moore’s law continuation of computer hardware improvement will enable this class of users to handle the data volume provided by individual stations and probably also from the entire core region of the array. The large, diverse user base will be best served by a group computing model, wherein users connect (via the internet) to a network of processing nodes that have the most up-to-date software packages and direct access to the SKA archives. This model stands in contrast to that used today where users receive interferometer data through a separate mechanism, and install stand-alone software packages only nominally linked to a central development site. As indicated in Section 3, perhaps the foremost challenge to the SKA will be to achieve the thermal noise limit at centimeter wavelengths with full resolution. There are a number of effects that must be considered: • The time and frequency sampling required for large fields pushes the data volumes very high. • Non-coplanar baselines mandate the use of faceted Fourier transforms. • Time-variable, station-dependent primary beams must be corrected during the removal of
sidelobes from the large number of confusing sources.
23
The last effect is the most pernicious. Stable and repeatable primary beams would help reduce the computing load, but are hard to obtain, especially in the presence of interfering signals. It makes sense to think of each station of antennas as an autonomous element that is responsible for its own beam combination. The data returned to the correlator are thus reduced by summation using optimal weights determined by the station itself. This cuts down the data volumes that must be shipped in the early days of the array. Phasing of each station is performed by that station (using conventional self-calibration
techniques). Each station can then produce an estimate of its own primary beam for use in the overall imaging problem. The station beams will thus be different but known. Current software can already correct for such effects (e.g., Holdaway, NRAO MMA memo #95). Alternative high-precision station beam calibration techniques being developed for LOFAR may also be of value to SKA. In budgeting, we have assumed a deployment date for half of the computing hardware by 2015 and the remainder by 2018. The data volumes for SKA full-field imaging are large: scaling from calculations for the EVLA (Cornwell, EVLA memo #25), we find a rate of about 5–10 TB per day, about 15–30 times that of the EVLA, but scaled to 2015 as Moore’s Law allows. The processing required scales more quickly than the data volume, however, since although the number of pixels goes as the data volume, the number of separately faceted transforms goes up as well from 32 by 32 to about 1000 by 1000. For that large number of facets, one may prefer simply to allocate one facet per confusing source. The bottom line is that, even ignoring the station-dependent primary beams, the wide-field processing load will be about 1000 times greater than that for the EVLA. Assuming that we can find a factor of ten by, e.g., imaging only the confusing sources, we estimate that the SKA pipeline computing costs will be about $40M. For a scientist, the SKA should appear much as we envisage the EVLA or ALMA. It needs to be easy to propose to, simple to schedule, and results made accessible via an automatic pipeline and archive. The facilities currently being designed for the EVLA and for ALMA should be scalable to the SKA. The data volumes will be even larger than EVLA or ALMA but the structure of the software should suffice since the underlying problem is the same. The software for processing SKA data will likely be based upon AIPS++ which has been designed to handle some of the more difficult calibration and imaging problems that will be faced by EVLA, ALMA, LOFAR, and SKA. The necessary parallelization support has been developed as a core AIPS++ capability. Although the AIPS++ package would suffice as a basis for the reduction software, there remains much to be done in development of the necessary algorithms for editing of data, calibration, and imaging. All these areas require substantial investment early in the project. Some of the EVLA and much of the LOFAR development effort will be applicable, but some SKA-specific problems will need considerable attention. One particular problem with the SKA is the visualization of both data (for engineering and debugging) and results (for science). Scaling of the real-time telescope monitor and control software from EVLA or ALMA systems is far less certain. • First of all, there will be many more stations and a much larger correlator, and some form of
system-level fault tolerance may be required. • Secondly, we have argued that each station should have a self-phasing ability. This means that
a continuum correlator and simple imaging sub-system must be present at each station to perform the self-calibration that is required to phase up the antennas into one station beam.
• Thirdly, the communications system for the array will be of sufficient size to warrant a monitor and control development team.
We show in Appendix B a computing budget reflecting computing costs including the correlator and monitor and control, which will be on a scale beyond anything developed in astronomy so far. These numbers deserve more refinement but they indicate the scale of the development necessary. The principle involved in the design should be tested in a smaller size configuration, such as would naturally occur during the deployment of the antennas and stations.
11. Design, Prototyping and Construction Plan As with the construction of any other major new scientific instrument, the SKA will benefit from techniques developed for earlier instruments. Nevertheless, for a project of this magnitude, it will be necessary to build and carefully evaluate all major sub systems. Currently, we are pursuing a number of major activities in the United States that will help to develop the technology for the SKA and to develop the scientific case better by exploring the sky with a sensitivity intermediate between the VLA and the SKA. These programs include (a) the construction of the Allen Telescope Array (ATA), (b) the construction of a prototype array for the NASA Deep Space Network, (c) the design and construction of ALMA, (d) the expansion of the VLA (EVLA), and (e) design of LOFAR. In addition, through a grant
24
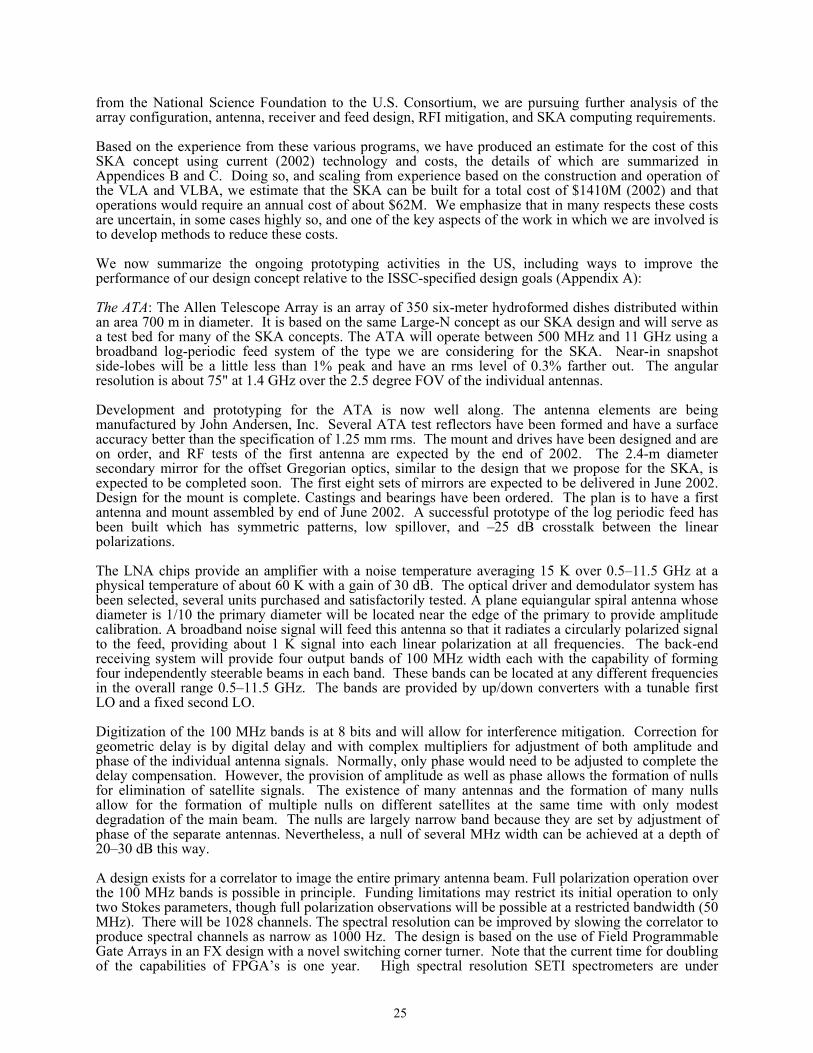
from the National Science Foundation to the U.S. Consortium, we are pursuing further analysis of the array configuration, antenna, receiver and feed design, RFI mitigation, and SKA computing requirements. Based on the experience from these various programs, we have produced an estimate for the cost of this SKA concept using current (2002) technology and costs, the details of which are summarized in Appendices B and C. Doing so, and scaling from experience based on the construction and operation of the VLA and VLBA, we estimate that the SKA can be built for a total cost of $1410M (2002) and that operations would require an annual cost of about $62M. We emphasize that in many respects these costs are uncertain, in some cases highly so, and one of the key aspects of the work in which we are involved is to develop methods to reduce these costs. We now summarize the ongoing prototyping activities in the US, including ways to improve the performance of our design concept relative to the ISSC-specified design goals (Appendix A): The ATA: The Allen Telescope Array is an array of 350 six-meter hydroformed dishes distributed within an area 700 m in diameter. It is based on the same Large-N concept as our SKA design and will serve as a test bed for many of the SKA concepts. The ATA will operate between 500 MHz and 11 GHz using a broadband log-periodic feed system of the type we are considering for the SKA. Near-in snapshot side-lobes will be a little less than 1% peak and have an rms level of 0.3% farther out. The angular resolution is about 75" at 1.4 GHz over the 2.5 degree FOV of the individual antennas. Development and prototyping for the ATA is now well along. The antenna elements are being manufactured by John Andersen, Inc. Several ATA test reflectors have been formed and have a surface accuracy better than the specification of 1.25 mm rms. The mount and drives have been designed and are on order, and RF tests of the first antenna are expected by the end of 2002. The 2.4-m diameter secondary mirror for the offset Gregorian optics, similar to the design that we propose for the SKA, is expected to be completed soon. The first eight sets of mirrors are expected to be delivered in June 2002. Design for the mount is complete. Castings and bearings have been ordered. The plan is to have a first antenna and mount assembled by end of June 2002. A successful prototype of the log periodic feed has been built which has symmetric patterns, low spillover, and –25 dB crosstalk between the linear polarizations. The LNA chips provide an amplifier with a noise temperature averaging 15 K over 0.5–11.5 GHz at a physical temperature of about 60 K with a gain of 30 dB. The optical driver and demodulator system has been selected, several units purchased and satisfactorily tested. A plane equiangular spiral antenna whose diameter is 1/10 the primary diameter will be located near the edge of the primary to provide amplitude calibration. A broadband noise signal will feed this antenna so that it radiates a circularly polarized signal to the feed, providing about 1 K signal into each linear polarization at all frequencies. The back-end receiving system will provide four output bands of 100 MHz width each with the capability of forming four independently steerable beams in each band. These bands can be located at any different frequencies in the overall range 0.5–11.5 GHz. The bands are provided by up/down converters with a tunable first LO and a fixed second LO. Digitization of the 100 MHz bands is at 8 bits and will allow for interference mitigation. Correction for geometric delay is by digital delay and with complex multipliers for adjustment of both amplitude and phase of the individual antenna signals. Normally, only phase would need to be adjusted to complete the delay compensation. However, the provision of amplitude as well as phase allows the formation of nulls for elimination of satellite signals. The existence of many antennas and the formation of many nulls allow for the formation of multiple nulls on different satellites at the same time with only modest degradation of the main beam. The nulls are largely narrow band because they are set by adjustment of phase of the separate antennas. Nevertheless, a null of several MHz width can be achieved at a depth of 20–30 dB this way. A design exists for a correlator to image the entire primary antenna beam. Full polarization operation over the 100 MHz bands is possible in principle. Funding limitations may restrict its initial operation to only two Stokes parameters, though full polarization observations will be possible at a restricted bandwidth (50 MHz). There will be 1028 channels. The spectral resolution can be improved by slowing the correlator to produce spectral channels as narrow as 1000 Hz. The design is based on the use of Field Programmable Gate Arrays in an FX design with a novel switching corner turner. Note that the current time for doubling of the capabilities of FPGA’s is one year. High spectral resolution SETI spectrometers are under
25
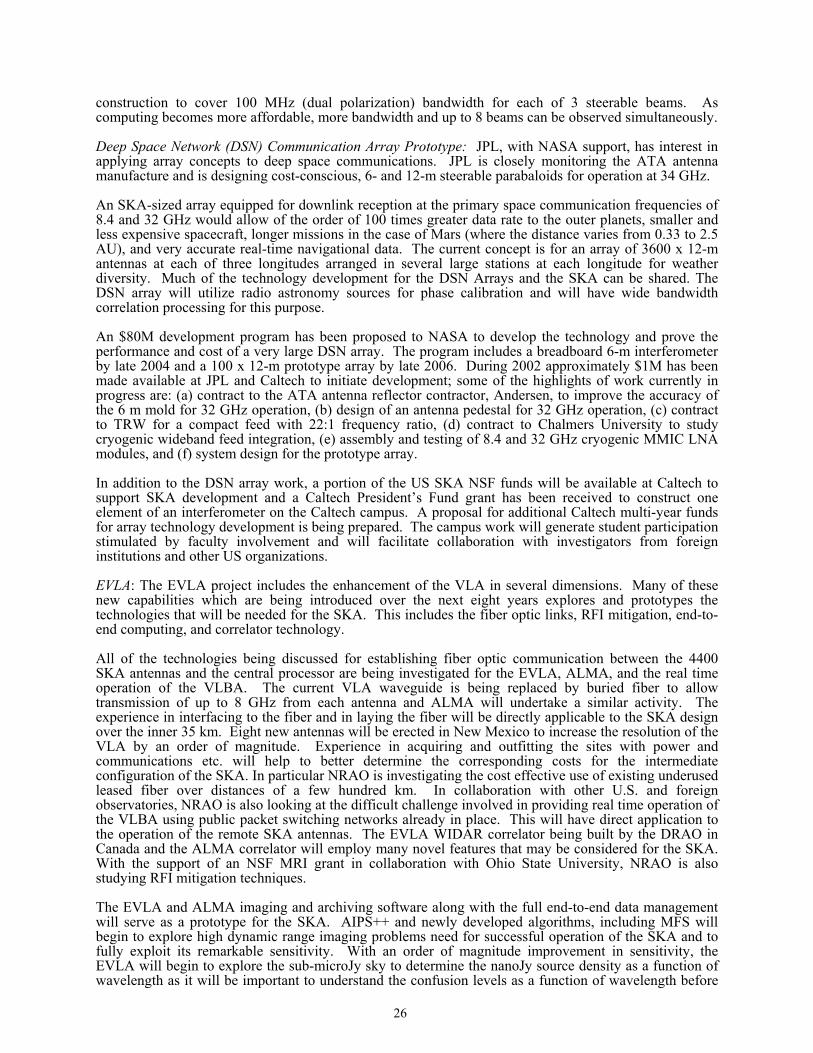
construction to cover 100 MHz (dual polarization) bandwidth for each of 3 steerable beams. As computing becomes more affordable, more bandwidth and up to 8 beams can be observed simultaneously. Deep Space Network (DSN) Communication Array Prototype: JPL, with NASA support, has interest in applying array concepts to deep space communications. JPL is closely monitoring the ATA antenna manufacture and is designing cost-conscious, 6- and 12-m steerable parabaloids for operation at 34 GHz. An SKA-sized array equipped for downlink reception at the primary space communication frequencies of 8.4 and 32 GHz would allow of the order of 100 times greater data rate to the outer planets, smaller and less expensive spacecraft, longer missions in the case of Mars (where the distance varies from 0.33 to 2.5 AU), and very accurate real-time navigational data. The current concept is for an array of 3600 x 12-m antennas at each of three longitudes arranged in several large stations at each longitude for weather diversity. Much of the technology development for the DSN Arrays and the SKA can be shared. The DSN array will utilize radio astronomy sources for phase calibration and will have wide bandwidth correlation processing for this purpose. An $80M development program has been proposed to NASA to develop the technology and prove the performance and cost of a very large DSN array. The program includes a breadboard 6-m interferometer by late 2004 and a 100 x 12-m prototype array by late 2006. During 2002 approximately $1M has been made available at JPL and Caltech to initiate development; some of the highlights of work currently in progress are: (a) contract to the ATA antenna reflector contractor, Andersen, to improve the accuracy of the 6 m mold for 32 GHz operation, (b) design of an antenna pedestal for 32 GHz operation, (c) contract to TRW for a compact feed with 22:1 frequency ratio, (d) contract to Chalmers University to study cryogenic wideband feed integration, (e) assembly and testing of 8.4 and 32 GHz cryogenic MMIC LNA modules, and (f) system design for the prototype array. In addition to the DSN array work, a portion of the US SKA NSF funds will be available at Caltech to support SKA development and a Caltech President’s Fund grant has been received to construct one element of an interferometer on the Caltech campus. A proposal for additional Caltech multi-year funds for array technology development is being prepared. The campus work will generate student participation stimulated by faculty involvement and will facilitate collaboration with investigators from foreign institutions and other US organizations. EVLA: The EVLA project includes the enhancement of the VLA in several dimensions. Many of these new capabilities which are being introduced over the next eight years explores and prototypes the technologies that will be needed for the SKA. This includes the fiber optic links, RFI mitigation, end-to-end computing, and correlator technology. All of the technologies being discussed for establishing fiber optic communication between the 4400 SKA antennas and the central processor are being investigated for the EVLA, ALMA, and the real time operation of the VLBA. The current VLA waveguide is being replaced by buried fiber to allow transmission of up to 8 GHz from each antenna and ALMA will undertake a similar activity. The experience in interfacing to the fiber and in laying the fiber will be directly applicable to the SKA design over the inner 35 km. Eight new antennas will be erected in New Mexico to increase the resolution of the VLA by an order of magnitude. Experience in acquiring and outfitting the sites with power and communications etc. will help to better determine the corresponding costs for the intermediate configuration of the SKA. In particular NRAO is investigating the cost effective use of existing underused leased fiber over distances of a few hundred km. In collaboration with other U.S. and foreign observatories, NRAO is also looking at the difficult challenge involved in providing real time operation of the VLBA using public packet switching networks already in place. This will have direct application to the operation of the remote SKA antennas. The EVLA WIDAR correlator being built by the DRAO in Canada and the ALMA correlator will employ many novel features that may be considered for the SKA. With the support of an NSF MRI grant in collaboration with Ohio State University, NRAO is also studying RFI mitigation techniques.
26
The EVLA and ALMA imaging and archiving software along with the full end-to-end data management will serve as a prototype for the SKA. AIPS++ and newly developed algorithms, including MFS will begin to explore high dynamic range imaging problems need for successful operation of the SKA and to fully exploit its remarkable sensitivity. With an order of magnitude improvement in sensitivity, the EVLA will begin to explore the sub-microJy sky to determine the nanoJy source density as a function of wavelength as it will be important to understand the confusion levels as a function of wavelength before
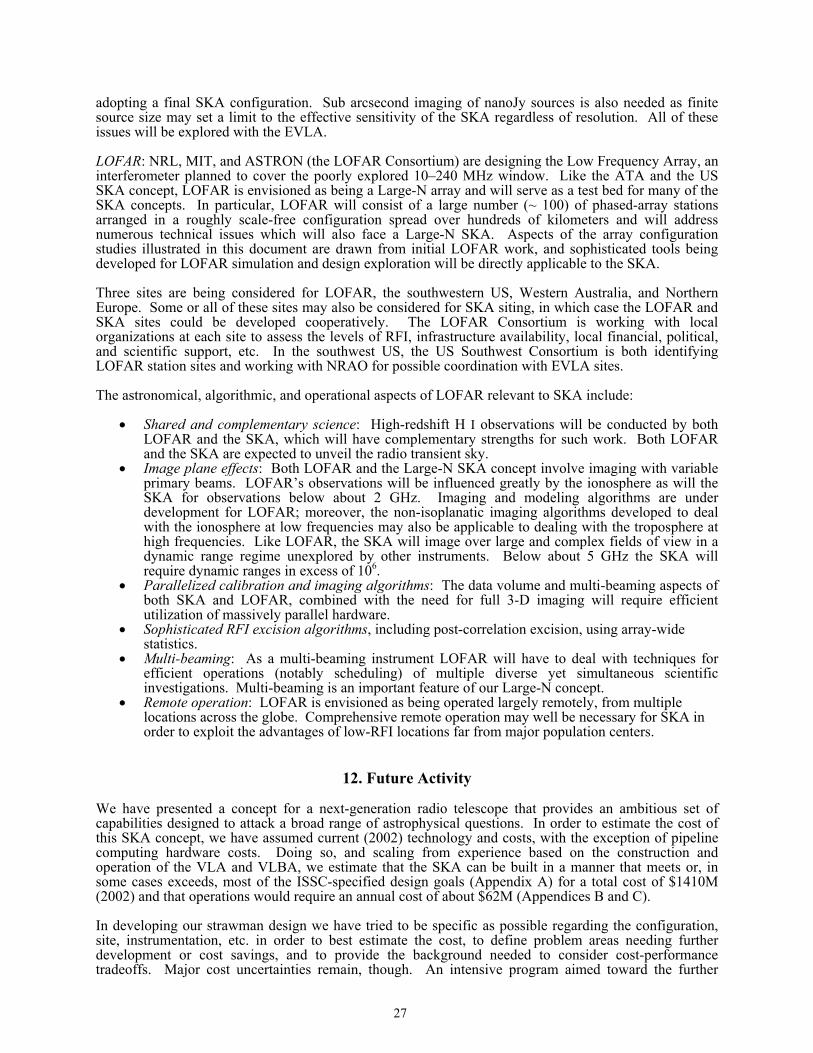
adopting a final SKA configuration. Sub arcsecond imaging of nanoJy sources is also needed as finite source size may set a limit to the effective sensitivity of the SKA regardless of resolution. All of these issues will be explored with the EVLA. LOFAR: NRL, MIT, and ASTRON (the LOFAR Consortium) are designing the Low Frequency Array, an interferometer planned to cover the poorly explored 10–240 MHz window. Like the ATA and the US SKA concept, LOFAR is envisioned as being a Large-N array and will serve as a test bed for many of the SKA concepts. In particular, LOFAR will consist of a large number (~ 100) of phased-array stations arranged in a roughly scale-free configuration spread over hundreds of kilometers and will address numerous technical issues which will also face a Large-N SKA. Aspects of the array configuration studies illustrated in this document are drawn from initial LOFAR work, and sophisticated tools being developed for LOFAR simulation and design exploration will be directly applicable to the SKA. Three sites are being considered for LOFAR, the southwestern US, Western Australia, and Northern Europe. Some or all of these sites may also be considered for SKA siting, in which case the LOFAR and SKA sites could be developed cooperatively. The LOFAR Consortium is working with local organizations at each site to assess the levels of RFI, infrastructure availability, local financial, political, and scientific support, etc. In the southwest US, the US Southwest Consortium is both identifying LOFAR station sites and working with NRAO for possible coordination with EVLA sites. The astronomical, algorithmic, and operational aspects of LOFAR relevant to SKA include:
• Shared and complementary science: High-redshift H I observations will be conducted by both LOFAR and the SKA, which will have complementary strengths for such work. Both LOFAR and the SKA are expected to unveil the radio transient sky.
• Image plane effects: Both LOFAR and the Large-N SKA concept involve imaging with variable primary beams. LOFAR’s observations will be influenced greatly by the ionosphere as will the SKA for observations below about 2 GHz. Imaging and modeling algorithms are under development for LOFAR; moreover, the non-isoplanatic imaging algorithms developed to deal with the ionosphere at low frequencies may also be applicable to dealing with the troposphere at high frequencies. Like LOFAR, the SKA will image over large and complex fields of view in a dynamic range regime unexplored by other instruments. Below about 5 GHz the SKA will require dynamic ranges in excess of 106.
• Parallelized calibration and imaging algorithms: The data volume and multi-beaming aspects of both SKA and LOFAR, combined with the need for full 3-D imaging will require efficient utilization of massively parallel hardware.
• Sophisticated RFI excision algorithms, including post-correlation excision, using array-wide statistics.
• Multi-beaming: As a multi-beaming instrument LOFAR will have to deal with techniques for efficient operations (notably scheduling) of multiple diverse yet simultaneous scientific investigations. Multi-beaming is an important feature of our Large-N concept.
• Remote operation: LOFAR is envisioned as being operated largely remotely, from multiple locations across the globe. Comprehensive remote operation may well be necessary for SKA in order to exploit the advantages of low-RFI locations far from major population centers.
12. Future Activity We have presented a concept for a next-generation radio telescope that provides an ambitious set of capabilities designed to attack a broad range of astrophysical questions. In order to estimate the cost of this SKA concept, we have assumed current (2002) technology and costs, with the exception of pipeline computing hardware costs. Doing so, and scaling from experience based on the construction and operation of the VLA and VLBA, we estimate that the SKA can be built in a manner that meets or, in some cases exceeds, most of the ISSC-specified design goals (Appendix A) for a total cost of $1410M (2002) and that operations would require an annual cost of about $62M (Appendices B and C). In developing our strawman design we have tried to be specific as possible regarding the configuration, site, instrumentation, etc. in order to best estimate the cost, to define problem areas needing further development or cost savings, and to provide the background needed to consider cost-performance tradeoffs. Major cost uncertainties remain, though. An intensive program aimed toward the further
27
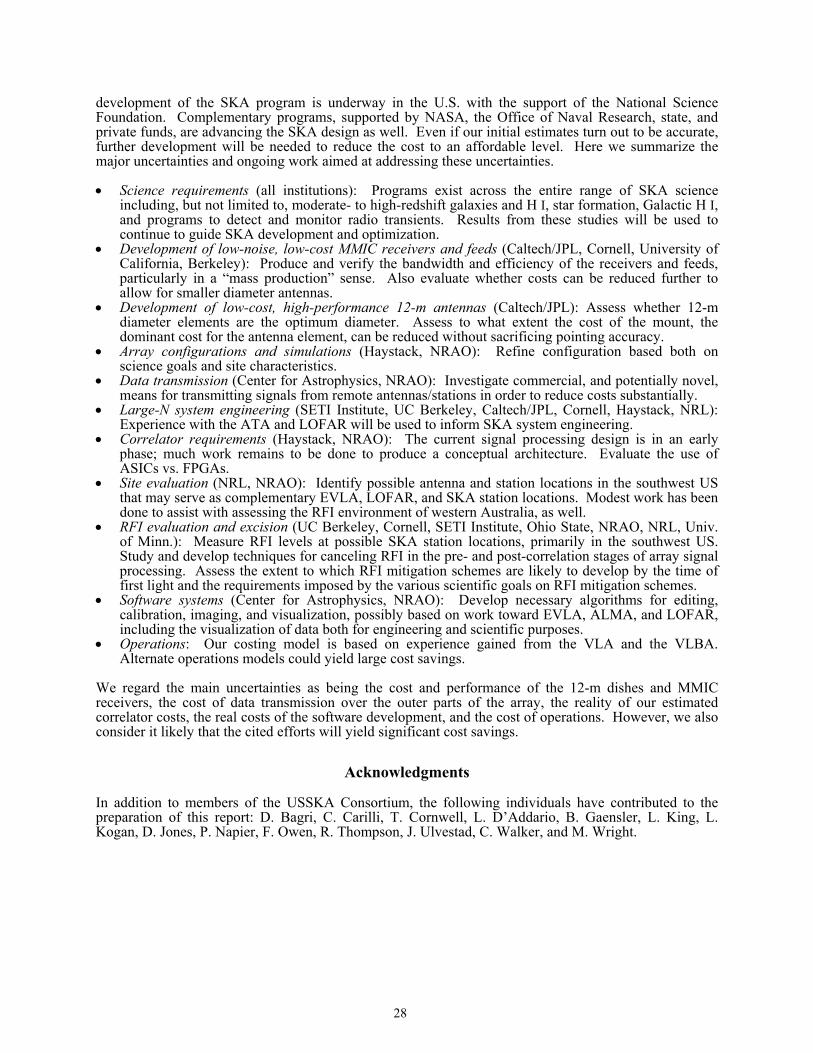
development of the SKA program is underway in the U.S. with the support of the National Science Foundation. Complementary programs, supported by NASA, the Office of Naval Research, state, and private funds, are advancing the SKA design as well. Even if our initial estimates turn out to be accurate, further development will be needed to reduce the cost to an affordable level. Here we summarize the major uncertainties and ongoing work aimed at addressing these uncertainties. • Science requirements (all institutions): Programs exist across the entire range of SKA science
including, but not limited to, moderate- to high-redshift galaxies and H I, star formation, Galactic H I, and programs to detect and monitor radio transients. Results from these studies will be used to continue to guide SKA development and optimization.
• Development of low-noise, low-cost MMIC receivers and feeds (Caltech/JPL, Cornell, University of California, Berkeley): Produce and verify the bandwidth and efficiency of the receivers and feeds, particularly in a “mass production” sense. Also evaluate whether costs can be reduced further to allow for smaller diameter antennas.
• Development of low-cost, high-performance 12-m antennas (Caltech/JPL): Assess whether 12-m diameter elements are the optimum diameter. Assess to what extent the cost of the mount, the dominant cost for the antenna element, can be reduced without sacrificing pointing accuracy.
• Array configurations and simulations (Haystack, NRAO): Refine configuration based both on science goals and site characteristics.
• Data transmission (Center for Astrophysics, NRAO): Investigate commercial, and potentially novel, means for transmitting signals from remote antennas/stations in order to reduce costs substantially.
• Large-N system engineering (SETI Institute, UC Berkeley, Caltech/JPL, Cornell, Haystack, NRL): Experience with the ATA and LOFAR will be used to inform SKA system engineering.
• Correlator requirements (Haystack, NRAO): The current signal processing design is in an early phase; much work remains to be done to produce a conceptual architecture. Evaluate the use of ASICs vs. FPGAs.
• Site evaluation (NRL, NRAO): Identify possible antenna and station locations in the southwest US that may serve as complementary EVLA, LOFAR, and SKA station locations. Modest work has been done to assist with assessing the RFI environment of western Australia, as well.
• RFI evaluation and excision (UC Berkeley, Cornell, SETI Institute, Ohio State, NRAO, NRL, Univ. of Minn.): Measure RFI levels at possible SKA station locations, primarily in the southwest US. Study and develop techniques for canceling RFI in the pre- and post-correlation stages of array signal processing. Assess the extent to which RFI mitigation schemes are likely to develop by the time of first light and the requirements imposed by the various scientific goals on RFI mitigation schemes.
• Software systems (Center for Astrophysics, NRAO): Develop necessary algorithms for editing, calibration, imaging, and visualization, possibly based on work toward EVLA, ALMA, and LOFAR, including the visualization of data both for engineering and scientific purposes.
• Operations: Our costing model is based on experience gained from the VLA and the VLBA. Alternate operations models could yield large cost savings.
We regard the main uncertainties as being the cost and performance of the 12-m dishes and MMIC receivers, the cost of data transmission over the outer parts of the array, the reality of our estimated correlator costs, the real costs of the software development, and the cost of operations. However, we also consider it likely that the cited efforts will yield significant cost savings.
Acknowledgments
In addition to members of the USSKA Consortium, the following individuals have contributed to the preparation of this report: D. Bagri, C. Carilli, T. Cornwell, L. D’Addario, B. Gaensler, L. King, L. Kogan, D. Jones, P. Napier, F. Owen, R. Thompson, J. Ulvestad, C. Walker, and M. Wright.
28
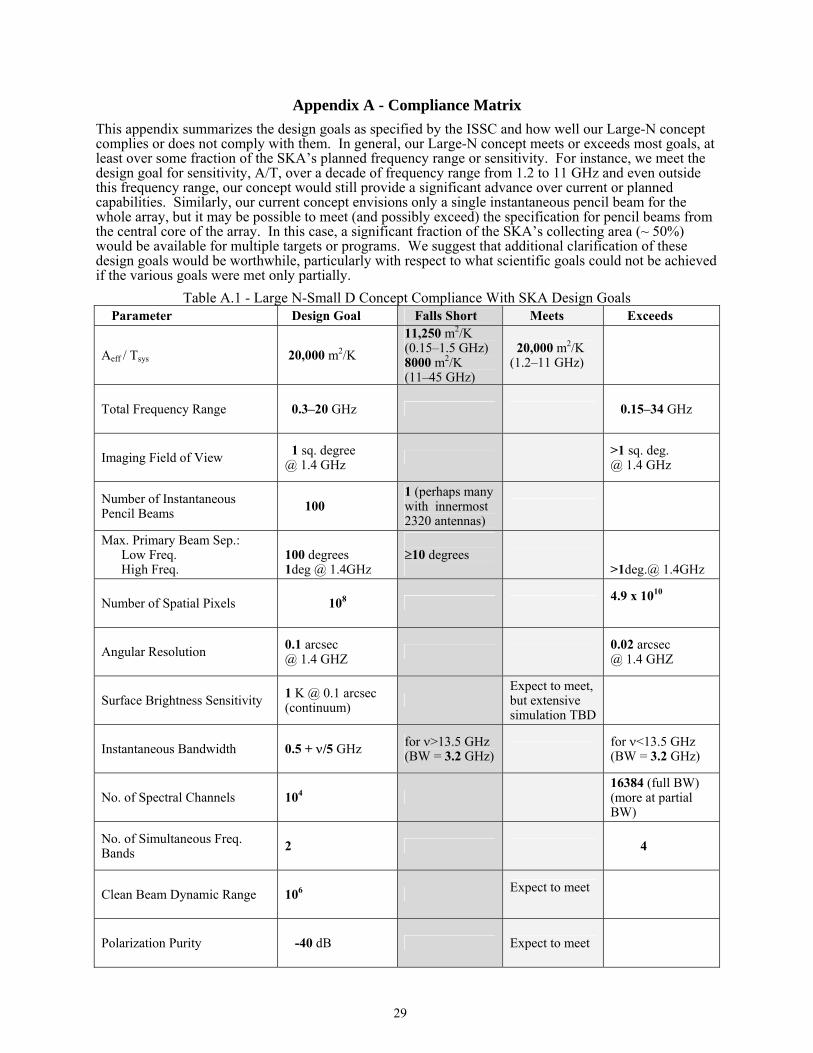
Appendix A - Compliance Matrix
This appendix summarizes the design goals as specified by the ISSC and how well our Large-N concept complies or does not comply with them. In general, our Large-N concept meets or exceeds most goals, at least over some fraction of the SKA’s planned frequency range or sensitivity. For instance, we meet the design goal for sensitivity, A/T, over a decade of frequency range from 1.2 to 11 GHz and even outside this frequency range, our concept would still provide a significant advance over current or planned capabilities. Similarly, our current concept envisions only a single instantaneous pencil beam for the whole array, but it may be possible to meet (and possibly exceed) the specification for pencil beams from the central core of the array. In this case, a significant fraction of the SKA’s collecting area (~ 50%) would be available for multiple targets or programs. We suggest that additional clarification of these design goals would be worthwhile, particularly with respect to what scientific goals could not be achieved if the various goals were met only partially.
Table A.1 - Large N-Small D Concept Compliance With SKA Design Goals Parameter Design Goal Falls Short Meets Exceeds
Aeff / Tsys 20,000 m2/K
11,250 m2/K (0.15–1.5 GHz) 8000 m2/K (11–45 GHz)
20,000 m2/K (1.2–11 GHz)
Total Frequency Range 0.3–20 GHz 0.15–34 GHz
Imaging Field of View 1 sq. degree @ 1.4 GHz >1 sq. deg.
@ 1.4 GHz
Number of Instantaneous Pencil Beams 100
1 (perhaps many with innermost 2320 antennas)
Max. Primary Beam Sep.: Low Freq. High Freq.
100 degrees 1deg @ 1.4GHz
≥10 degrees
>1deg.@ 1.4GHz
Number of Spatial Pixels 108 4.9 x 10¹⁰
Angular Resolution 0.1 arcsec @ 1.4 GHZ 0.02 arcsec
@ 1.4 GHZ
Surface Brightness Sensitivity 1 K @ 0.1 arcsec (continuum)
Expect to meet, but extensive simulation TBD
Instantaneous Bandwidth 0.5 + ν/5 GHz for ν>13.5 GHz (BW = 3.2 GHz) for ν<13.5 GHz
(BW = 3.2 GHz)
No. of Spectral Channels 104 16384 (full BW) (more at partial BW)
No. of Simultaneous Freq. Bands 2 4
Clean Beam Dynamic Range 106 Expect to meet
Polarization Purity -40 dB Expect to meet
29
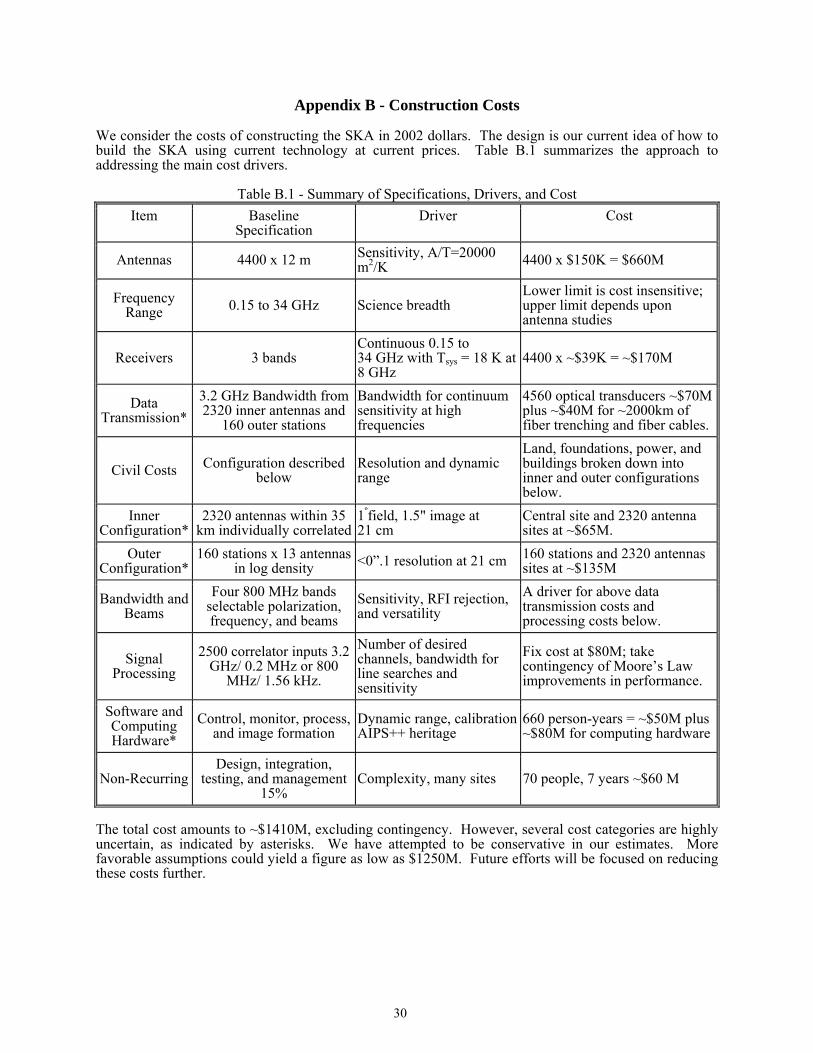
Appendix B - Construction Costs We consider the costs of constructing the SKA in 2002 dollars. The design is our current idea of how to build the SKA using current technology at current prices. Table B.1 summarizes the approach to addressing the main cost drivers.
Table B.1 - Summary of Specifications, Drivers, and Cost Item Baseline
Specification Driver Cost
Antennas 4400 x 12 m Sensitivity, A/T=20000 m2/K 4400 x $150K = $660M
Frequency Range 0.15 to 34 GHz Science breadth
Lower limit is cost insensitive; upper limit depends upon antenna studies
Receivers 3 bands Continuous 0.15 to 34 GHz with Tsys = 18 K at 8 GHz
4400 x ~$39K = ~$170M
Data Transmission*
3.2 GHz Bandwidth from 2320 inner antennas and
160 outer stations
Bandwidth for continuum sensitivity at high frequencies
4560 optical transducers ~$70M plus ~$40M for ~2000km of fiber trenching and fiber cables.
Civil Costs Configuration described below
Resolution and dynamic range
Land, foundations, power, and buildings broken down into inner and outer configurations below.
Inner Configuration*
2320 antennas within 35 km individually correlated
1ºfield, 1.5" image at 21 cm
Central site and 2320 antenna sites at ~$65M.
Outer Configuration*
160 stations x 13 antennas in log density <0”.1 resolution at 21 cm 160 stations and 2320 antennas
sites at ~$135M
Bandwidth and Beams
Four 800 MHz bands selectable polarization, frequency, and beams
Sensitivity, RFI rejection, and versatility
A driver for above data transmission costs and processing costs below.
Signal Processing
2500 correlator inputs 3.2 GHz/ 0.2 MHz or 800
MHz/ 1.56 kHz.
Number of desired channels, bandwidth for line searches and sensitivity
Fix cost at $80M; take contingency of Moore’s Law improvements in performance.
Software and Computing Hardware*
Control, monitor, process, and image formation
Dynamic range, calibration AIPS++ heritage
660 person-years = ~$50M plus ~$80M for computing hardware
Non-Recurring Design, integration,
testing, and management 15%
Complexity, many sites 70 people, 7 years ~$60 M
The total cost amounts to ~$1410M, excluding contingency. However, several cost categories are highly uncertain, as indicated by asterisks. We have attempted to be conservative in our estimates. More favorable assumptions could yield a figure as low as $1250M. Future efforts will be focused on reducing these costs further.
30
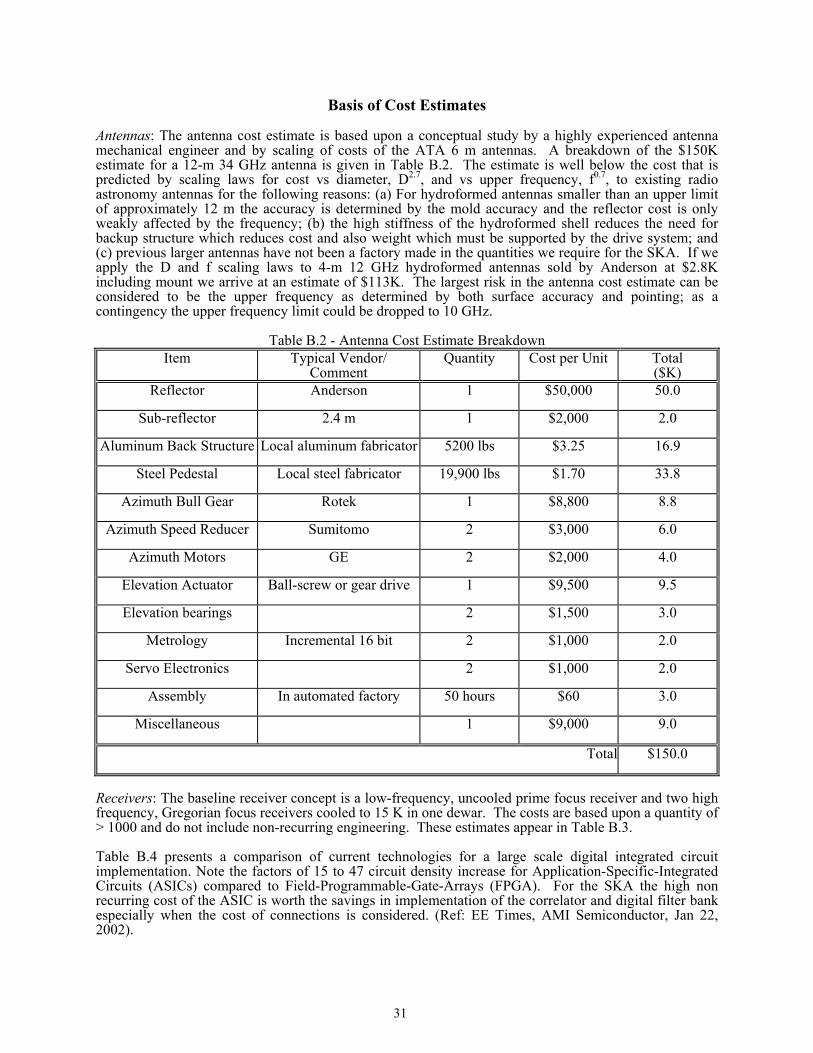
Basis of Cost Estimates Antennas: The antenna cost estimate is based upon a conceptual study by a highly experienced antenna mechanical engineer and by scaling of costs of the ATA 6 m antennas. A breakdown of the $150K estimate for a 12-m 34 GHz antenna is given in Table B.2. The estimate is well below the cost that is predicted by scaling laws for cost vs diameter, D2.7, and vs upper frequency, f0.7, to existing radio astronomy antennas for the following reasons: (a) For hydroformed antennas smaller than an upper limit of approximately 12 m the accuracy is determined by the mold accuracy and the reflector cost is only weakly affected by the frequency; (b) the high stiffness of the hydroformed shell reduces the need for backup structure which reduces cost and also weight which must be supported by the drive system; and (c) previous larger antennas have not been a factory made in the quantities we require for the SKA. If we apply the D and f scaling laws to 4-m 12 GHz hydroformed antennas sold by Anderson at $2.8K including mount we arrive at an estimate of $113K. The largest risk in the antenna cost estimate can be considered to be the upper frequency as determined by both surface accuracy and pointing; as a contingency the upper frequency limit could be dropped to 10 GHz.
Table B.2 - Antenna Cost Estimate Breakdown Item Typical Vendor/
Comment Quantity Cost per Unit Total
($K) Reflector Anderson 1 $50,000 50.0
Sub-reflector 2.4 m 1 $2,000 2.0
Aluminum Back Structure Local aluminum fabricator 5200 lbs $3.25 16.9
Steel Pedestal Local steel fabricator 19,900 lbs $1.70 33.8
Azimuth Bull Gear Rotek 1 $8,800 8.8
Azimuth Speed Reducer Sumitomo 2 $3,000 6.0
Azimuth Motors GE 2 $2,000 4.0
Elevation Actuator Ball-screw or gear drive 1 $9,500 9.5
Elevation bearings 2 $1,500 3.0
Metrology Incremental 16 bit 2 $1,000 2.0
Servo Electronics 2 $1,000 2.0
Assembly In automated factory 50 hours $60 3.0
Miscellaneous 1 $9,000 9.0
Total $150.0
Receivers: The baseline receiver concept is a low-frequency, uncooled prime focus receiver and two high frequency, Gregorian focus receivers cooled to 15 K in one dewar. The costs are based upon a quantity of > 1000 and do not include non-recurring engineering. These estimates appear in Table B.3. Table B.4 presents a comparison of current technologies for a large scale digital integrated circuit implementation. Note the factors of 15 to 47 circuit density increase for Application-Specific-Integrated Circuits (ASICs) compared to Field-Programmable-Gate-Arrays (FPGA). For the SKA the high non recurring cost of the ASIC is worth the savings in implementation of the correlator and digital filter bank especially when the cost of connections is considered. (Ref: EE Times, AMI Semiconductor, Jan 22, 2002).
31
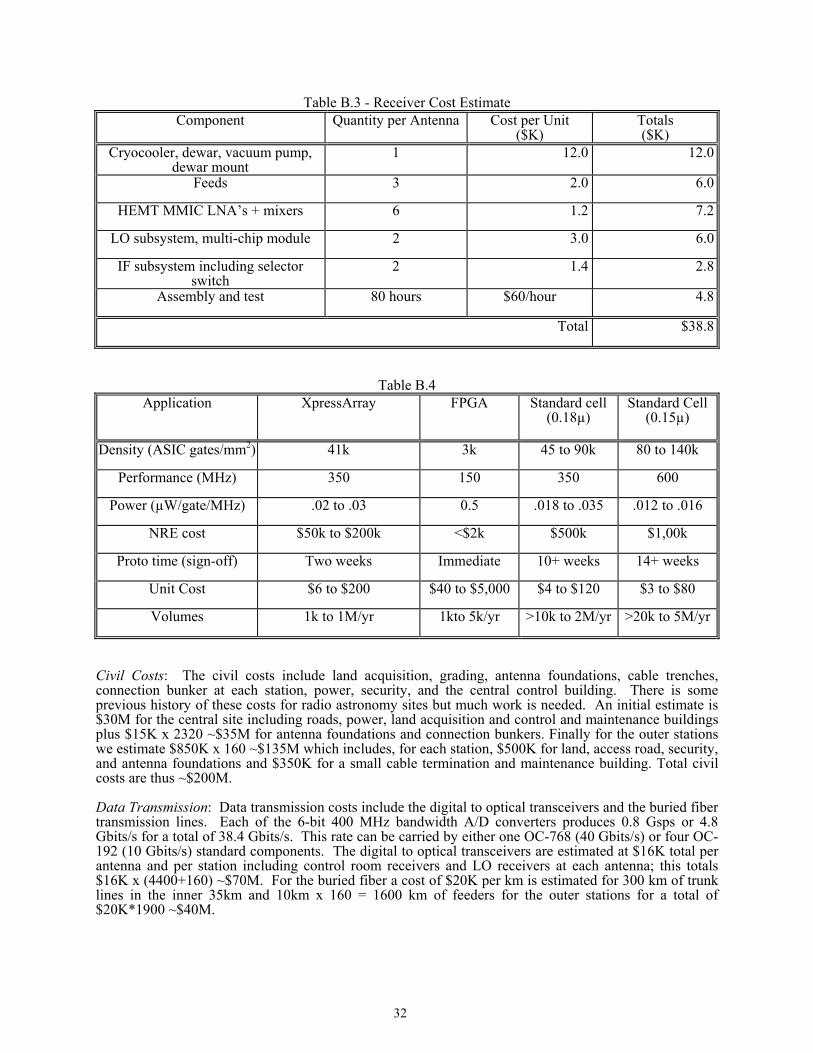
Table B.3 - Receiver Cost Estimate Component Quantity per Antenna Cost per Unit
($K) Totals ($K)
Cryocooler, dewar, vacuum pump, dewar mount
1 12.0 12.0
Feeds 3 2.0 6.0
HEMT MMIC LNA’s + mixers 6 1.2 7.2
LO subsystem, multi-chip module 2 3.0 6.0
IF subsystem including selector switch
2 1.4 2.8
Assembly and test 80 hours $60/hour 4.8
Total $38.8
Table B.4 Application XpressArray FPGA Standard cell
(0.18µ) Standard Cell
(0.15µ)
Density (ASIC gates/mm2) 41k 3k 45 to 90k 80 to 140k
Performance (MHz) 350 150 350 600
Power (µW/gate/MHz) .02 to .03 0.5 .018 to .035 .012 to .016
NRE cost $50k to $200k <$2k $500k $1,00k
Proto time (sign-off) Two weeks Immediate 10+ weeks 14+ weeks
Unit Cost $6 to $200 $40 to $5,000 $4 to $120 $3 to $80
Volumes 1k to 1M/yr 1kto 5k/yr >10k to 2M/yr >20k to 5M/yr
Civil Costs: The civil costs include land acquisition, grading, antenna foundations, cable trenches, connection bunker at each station, power, security, and the central control building. There is some previous history of these costs for radio astronomy sites but much work is needed. An initial estimate is $30M for the central site including roads, power, land acquisition and control and maintenance buildings plus $15K x 2320 ~$35M for antenna foundations and connection bunkers. Finally for the outer stations we estimate $850K x 160 ~$135M which includes, for each station, $500K for land, access road, security, and antenna foundations and $350K for a small cable termination and maintenance building. Total civil costs are thus ~$200M. Data Transmission: Data transmission costs include the digital to optical transceivers and the buried fiber transmission lines. Each of the 6-bit 400 MHz bandwidth A/D converters produces 0.8 Gsps or 4.8 Gbits/s for a total of 38.4 Gbits/s. This rate can be carried by either one OC-768 (40 Gbits/s) or four OC-192 (10 Gbits/s) standard components. The digital to optical transceivers are estimated at $16K total per antenna and per station including control room receivers and LO receivers at each antenna; this totals $16K x (4400+160) ~$70M. For the buried fiber a cost of $20K per km is estimated for 300 km of trunk lines in the inner 35km and 10km x 160 = 1600 km of feeders for the outer stations for a total of $20K*1900 ~$40M.
32

Signal Processing: Much is known about the signal processing costs due to work on ALMA, ATA, and EVLA. However, it is a rapidly developing technology and one approach is to devote a fixed amount of funds, about 6% or $80M of the total project cost, provide the performance obtainable when the hardware must be purchased, and plan to upgrade every 5 to 10 years. At present it appears that very satisfactory performance can be obtained with ASIC and FPGA integrated circuits that will be available by 2005. This performance is correlation of up to 2500 inputs (2320 antennas + 160 stations + spares) at up to 3.2 GHz total bandwidth (four 800 MHz bands chosen among polarizations, center frequency, and outer station beams) with 16,384 channels giving 200 kHz resolution at the full 3.2 GHz bandwidth. The bandwidth can be reduced for lower center frequencies with an increase in the number of channels (400 MHz, 256,000 channels, at 1.56 KHz resolution). These estimates are summarized in Table B.5.
Table B.5 - Signal Processing Cost Estimate Component Quantity per Array Cost per Unit
($K) Totals ($M)
A/D Converters, 6-bit 800 MHz 4400x8=35,200 0.5 17.6
Delay tracker, 800 MHz 4400x4=17,600 1.0 17.6
Station beam formers 160 10 1.6
Digital filter bank, 800/0.2 MHz or 100 MHz/1.5 kHz.
4400x4=17,600 0.5 8.8
F to X connections, 10 Gb/s fibers 3200 4.0 12.8
Cross-correlator, 3.3E7 baselines, 1 lag, 2-bit, 2 x 800 MHz
2 4000 8.0
Array beam formers 100 50 5.0
Time domain analyzers 100 50 5.0
ASIC development 2 1000 2.0
System assembly and test 16 person-years 120 1.9
Total 80.3
Software and Computing Hardware: Software costs are difficult to estimate and often have been underestimated for radio astronomy projects. Table B.6 below summarizes our estimate of the computing hardware and software costs involved in designing and building the SKA. We estimate that about 660 man years will be required to develop the software needed for the SKA. We anticipate about half of the software effort will occur in collaborating partner countries where personnel costs are much lower than in the U.S. so we have adopted an average cost of $80K per FTE for this activity which gives a total software cost of ~$50M. In addition ~$80M is estimated for computing hardware assuming half of the hardware is acquired in 2015 and half in 2018.
33
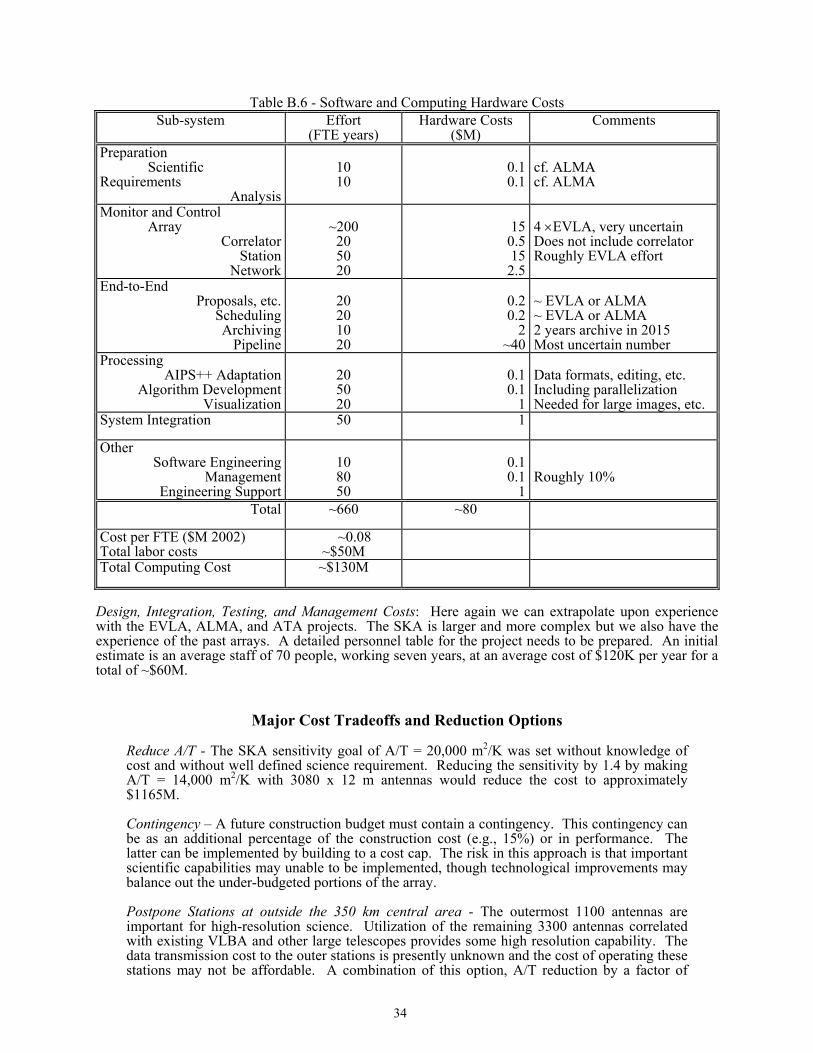
Table B.6 - Software and Computing Hardware Costs Sub-system Effort
(FTE years) Hardware Costs
($M) Comments
Preparation Scientific Requirements
Analysis
10 10
0.10.1
cf. ALMA cf. ALMA
Monitor and Control Array
Correlator Station
Network
~200
20 50 20
150.515
2.5
4 ×EVLA, very uncertain Does not include correlator Roughly EVLA effort
End-to-End Proposals, etc.
Scheduling Archiving
Pipeline
20 20 10 20
0.20.2
2~40
~ EVLA or ALMA ~ EVLA or ALMA 2 years archive in 2015 Most uncertain number
Processing AIPS++ Adaptation
Algorithm Development Visualization
20 50 20
0.10.1
1
Data formats, editing, etc. Including parallelization Needed for large images, etc.
System Integration 50 1
Other Software Engineering
Management Engineering Support
10 80 50
0.10.1
1
Roughly 10%
Total ~660 ~80
Cost per FTE ($M 2002) Total labor costs
~0.08 ~$50M
Total Computing Cost ~$130M
Design, Integration, Testing, and Management Costs: Here again we can extrapolate upon experience with the EVLA, ALMA, and ATA projects. The SKA is larger and more complex but we also have the experience of the past arrays. A detailed personnel table for the project needs to be prepared. An initial estimate is an average staff of 70 people, working seven years, at an average cost of $120K per year for a total of ~$60M.
Major Cost Tradeoffs and Reduction Options
Reduce A/T - The SKA sensitivity goal of A/T = 20,000 m2/K was set without knowledge of cost and without well defined science requirement. Reducing the sensitivity by 1.4 by making A/T = 14,000 m2/K with 3080 x 12 m antennas would reduce the cost to approximately $1165M. Contingency – A future construction budget must contain a contingency. This contingency can be as an additional percentage of the construction cost (e.g., 15%) or in performance. The latter can be implemented by building to a cost cap. The risk in this approach is that important scientific capabilities may unable to be implemented, though technological improvements may balance out the under-budgeted portions of the array. Postpone Stations at outside the 350 km central area - The outermost 1100 antennas are important for high-resolution science. Utilization of the remaining 3300 antennas correlated with existing VLBA and other large telescopes provides some high resolution capability. The data transmission cost to the outer stations is presently unknown and the cost of operating these stations may not be affordable. A combination of this option, A/T reduction by a factor of
34
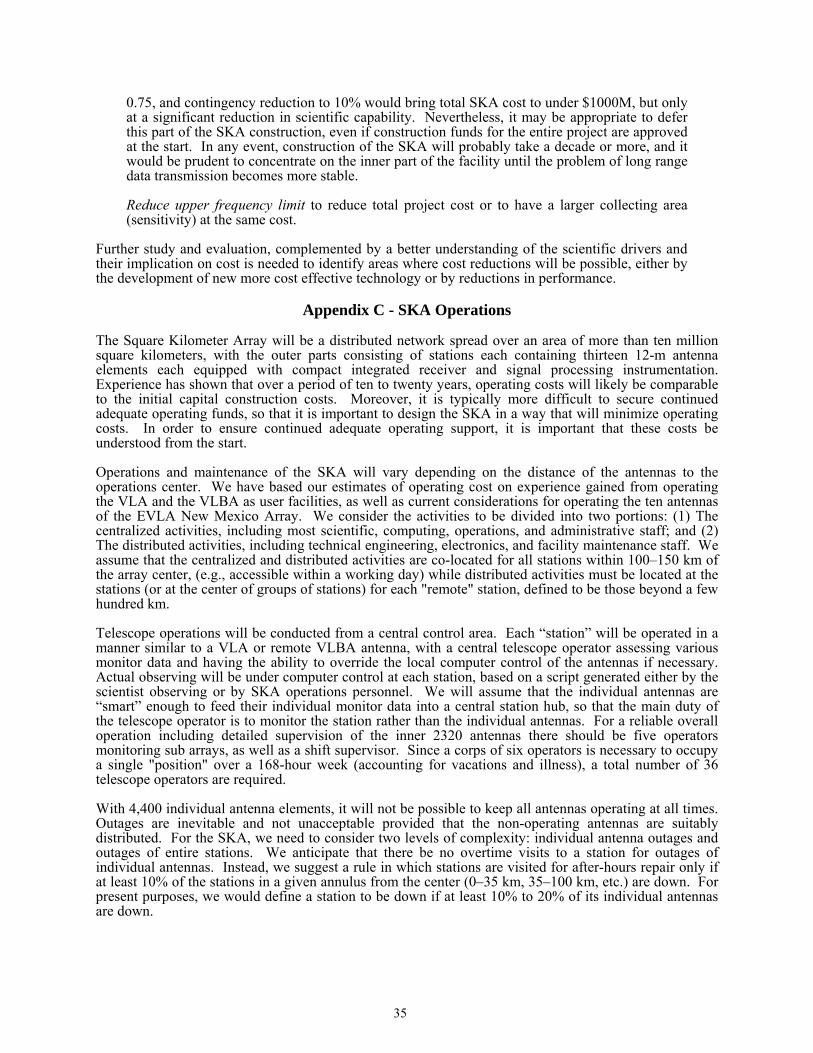
0.75, and contingency reduction to 10% would bring total SKA cost to under $1000M, but only at a significant reduction in scientific capability. Nevertheless, it may be appropriate to defer this part of the SKA construction, even if construction funds for the entire project are approved at the start. In any event, construction of the SKA will probably take a decade or more, and it would be prudent to concentrate on the inner part of the facility until the problem of long range data transmission becomes more stable.
Reduce upper frequency limit to reduce total project cost or to have a larger collecting area (sensitivity) at the same cost.
Further study and evaluation, complemented by a better understanding of the scientific drivers and their implication on cost is needed to identify areas where cost reductions will be possible, either by the development of new more cost effective technology or by reductions in performance.
Appendix C - SKA Operations The Square Kilometer Array will be a distributed network spread over an area of more than ten million square kilometers, with the outer parts consisting of stations each containing thirteen 12-m antenna elements each equipped with compact integrated receiver and signal processing instrumentation. Experience has shown that over a period of ten to twenty years, operating costs will likely be comparable to the initial capital construction costs. Moreover, it is typically more difficult to secure continued adequate operating funds, so that it is important to design the SKA in a way that will minimize operating costs. In order to ensure continued adequate operating support, it is important that these costs be understood from the start. Operations and maintenance of the SKA will vary depending on the distance of the antennas to the operations center. We have based our estimates of operating cost on experience gained from operating the VLA and the VLBA as user facilities, as well as current considerations for operating the ten antennas of the EVLA New Mexico Array. We consider the activities to be divided into two portions: (1) The centralized activities, including most scientific, computing, operations, and administrative staff; and (2) The distributed activities, including technical engineering, electronics, and facility maintenance staff. We assume that the centralized and distributed activities are co-located for all stations within 100–150 km of the array center, (e.g., accessible within a working day) while distributed activities must be located at the stations (or at the center of groups of stations) for each "remote" station, defined to be those beyond a few hundred km. Telescope operations will be conducted from a central control area. Each “station” will be operated in a manner similar to a VLA or remote VLBA antenna, with a central telescope operator assessing various monitor data and having the ability to override the local computer control of the antennas if necessary. Actual observing will be under computer control at each station, based on a script generated either by the scientist observing or by SKA operations personnel. We will assume that the individual antennas are “smart” enough to feed their individual monitor data into a central station hub, so that the main duty of the telescope operator is to monitor the station rather than the individual antennas. For a reliable overall operation including detailed supervision of the inner 2320 antennas there should be five operators monitoring sub arrays, as well as a shift supervisor. Since a corps of six operators is necessary to occupy a single "position" over a 168-hour week (accounting for vacations and illness), a total number of 36 telescope operators are required. With 4,400 individual antenna elements, it will not be possible to keep all antennas operating at all times. Outages are inevitable and not unacceptable provided that the non-operating antennas are suitably distributed. For the SKA, we need to consider two levels of complexity: individual antenna outages and outages of entire stations. We anticipate that there be no overtime visits to a station for outages of individual antennas. Instead, we suggest a rule in which stations are visited for after-hours repair only if at least 10% of the stations in a given annulus from the center (0–35 km, 35–100 km, etc.) are down. For present purposes, we would define a station to be down if at least 10% to 20% of its individual antennas are down.
35
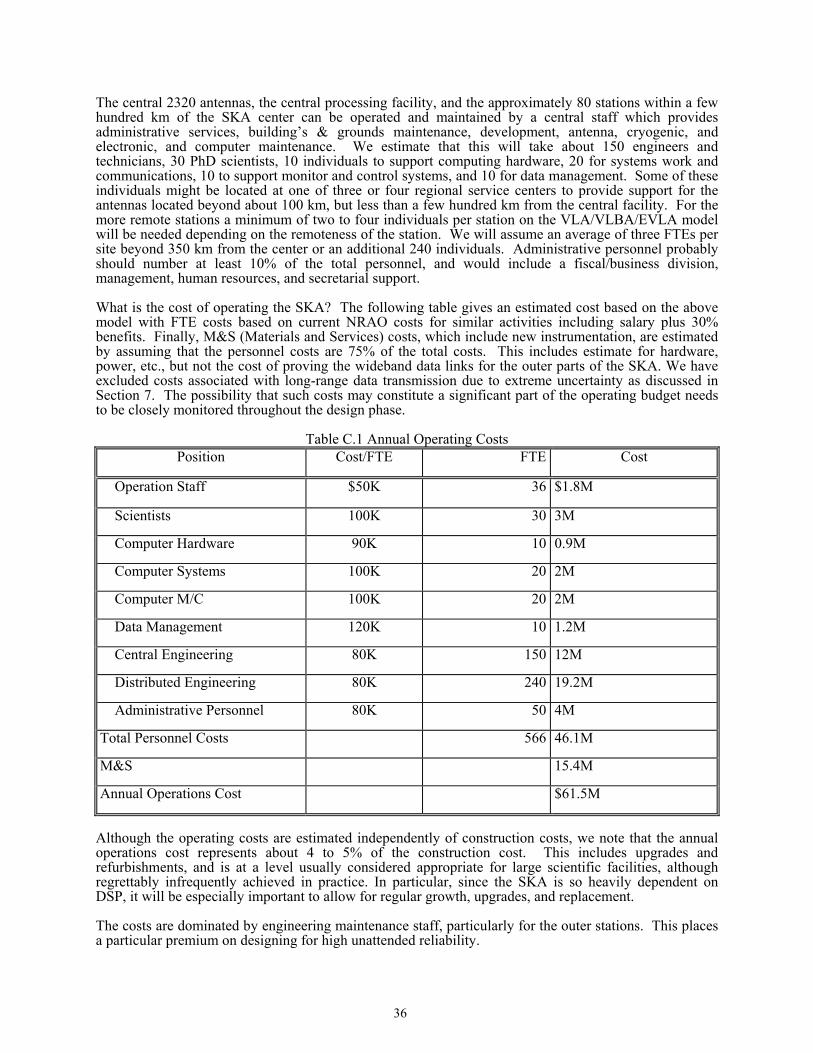
The central 2320 antennas, the central processing facility, and the approximately 80 stations within a few hundred km of the SKA center can be operated and maintained by a central staff which provides administrative services, building’s & grounds maintenance, development, antenna, cryogenic, and electronic, and computer maintenance. We estimate that this will take about 150 engineers and technicians, 30 PhD scientists, 10 individuals to support computing hardware, 20 for systems work and communications, 10 to support monitor and control systems, and 10 for data management. Some of these individuals might be located at one of three or four regional service centers to provide support for the antennas located beyond about 100 km, but less than a few hundred km from the central facility. For the more remote stations a minimum of two to four individuals per station on the VLA/VLBA/EVLA model will be needed depending on the remoteness of the station. We will assume an average of three FTEs per site beyond 350 km from the center or an additional 240 individuals. Administrative personnel probably should number at least 10% of the total personnel, and would include a fiscal/business division, management, human resources, and secretarial support. What is the cost of operating the SKA? The following table gives an estimated cost based on the above model with FTE costs based on current NRAO costs for similar activities including salary plus 30% benefits. Finally, M&S (Materials and Services) costs, which include new instrumentation, are estimated by assuming that the personnel costs are 75% of the total costs. This includes estimate for hardware, power, etc., but not the cost of proving the wideband data links for the outer parts of the SKA. We have excluded costs associated with long-range data transmission due to extreme uncertainty as discussed in Section 7. The possibility that such costs may constitute a significant part of the operating budget needs to be closely monitored throughout the design phase.
Table C.1 Annual Operating Costs Position Cost/FTE FTE Cost
Operation Staff $50K 36 $1.8M
Scientists 100K 30 3M
Computer Hardware 90K 10 0.9M
Computer Systems 100K 20 2M
Computer M/C 100K 20 2M
Data Management 120K 10 1.2M
Central Engineering 80K 150 12M
Distributed Engineering 80K 240 19.2M
Administrative Personnel 80K 50 4M
Total Personnel Costs 566 46.1M
M&S 15.4M
Annual Operations Cost $61.5M
Although the operating costs are estimated independently of construction costs, we note that the annual operations cost represents about 4 to 5% of the construction cost. This includes upgrades and refurbishments, and is at a level usually considered appropriate for large scientific facilities, although regrettably infrequently achieved in practice. In particular, since the SKA is so heavily dependent on DSP, it will be especially important to allow for regular growth, upgrades, and replacement. The costs are dominated by engineering maintenance staff, particularly for the outer stations. This places a particular premium on designing for high unattended reliability.
36


![Center ]or Radiophysics and Space Research, Cornell ...astrosun2.astro.cornell.edu/academics/courses/astro310/Jankowski... · data records (variously called SEDR's, SPICE S-, P-,](https://img.dokumen.tips/doc/110x75/5ab2b84f7f8b9a6b468dbc28/center-or-radiophysics-and-space-research-cornell-records-variously-called.jpg)