Embed Size (px)
Citation preview

The Speciation of Gold in Mine Wastes and
Natural Waters
A thesis submitted for fulfilment of the degree of Doctor of Philosophy
Christine Ta BTech (Forens&AnalytChem), BSc (Hons)
Faculty of Science and Engineering School of Chemical and Physical Sciences
May 2013

1. Introduction

Introduction | Chapter 1
Page | 2
1.1 Gold
Highly valued by man since the earliest of time, gold is recognised for its world-wide use in
monetary systems, jewellery and for decorative purposes [3]. Gold is the most inert noble
metal (unaffected by water, acids, oxygen or sulfur) and has high malleability, ductility, and
electrical conductivity [1]. Its electronic configuration, [Xe] 4f14
5d10
6s1, with the inner s shell
electrons tightly bound and shielding the outer d shell from the nuclear charge, allows gold to
both accept (into the s shell) and donate electrons (from the d shell). Therefore, gold is also
a catalyst for reactions at C-C bonds. As a result of these unique properties, the use of gold
is not restricted to coinage and jewellery, and it can be found in dental work, electronics and
plating materials [4]. Gold’s other properties – its relatively low melting and boiling points
(m.p.1064.43 °C and b.p. 2860 °C) – can be attributed to its lattice type [3]. Gold (Au) is in
the same group as silver and copper and has a face-centred cubic lattice, where each atom
has 12 equidistant neighbours and Au–Au distances of 288.4 pm [3].
1.2 Gold in the environment
Gold is relatively rare with an average abundance in the Earth’s crust of 0.005 ppm [1]. With
an identical atomic radius to Ag (1.44 Å) [1], native gold is almost always alloyed with silver
(0.1% to 50%) [5, 6]. The native elements, alloys and metallic compounds of gold are listed
in Table 1-1. The most specific pathfinder elements of gold are Ag, As, Sb and Te [1]. “Non-
metallic” gold also appears as “invisible gold”, where particles less than 0.1 μm are found
within grains of pyrite and As-rich and Fe-deficient arsenopyrite [7, 8]. The primary types of
gold deposits includes auriferous porphyry dykes, sills and stocks, skarn-type deposits,
disseminated deposits, auriferous and gold-silver veins in igneous, volcanic and sedimentary
rocks and gold deposits in quartz-pebble conglomerates and quartzites [1].
Quartz pebble conglomerates (QPC) are the most significant source of the world’s
production of gold [9]. However gold does not usually originate as QPC deposits. According
to Reith et al. [10], gold begins as a primary deposit (60 to 90 wt. % gold), usually in
hydrothermal and deep subsurfaces. The gold then undergoes many transformations to form
secondary gold (which is generally much purer than primary gold, up to 99.5 wt% gold), and
eventually a QPC deposit [10]. The two possible origins of secondary gold: are detrital or
chemical accretion [1]. Detrital gold is the physical formation of gold from the weathering of
pre-existing rocks embedded with gold [11]. Evidence for detrital gold arises from the
morphology of certain gold grains (round, toroidal grains) [12, 13], and the isotopic ages of
the surrounding minerals of gold (which rule out formation by hydrothermal events) [14, 15],
however there is evidence that the chemical mobilisation and re-concentration of gold also
contributes to the cycle of gold in the environment, as depicted in Figure 1-1.

Introduction | Chapter 1
Page | 3
Table 1-1 Known gold minerals as listed by Boyle [1].
Mineral Composition
Native gold Au
Argentian gold (electrum) (Au, Ag)
Cuprian gold (cuporauride) (Au, Cu)
Palladian gold (porpezite) (Au, Pd)
Rhodian gold (rhodite) (Au, Rh)
Iridic gold (Au, Ir)
Platinum gold (Au, Pt)
Bismuthian gold (Au, Bi)
Gold amalgam Au2Hg3 (?)
Maldonite Au2Bi
Auricupride AuCu3
Palladium cuproauride (Cu, Pd)3Au2
Uytenbogaardtite Ag3AuS2
Calaverite AuTe2
Krennerite (Au, Ag)Te2
Montbrayite (Au, Sb)2Te3
Petzite (antamokite) Ag3AuTe2
Muthmannite (Ag, Au)Te
Sylvanite (Au, Ag)Te4
Kostovite AuCuTe4
Nagyagite Pb3Au(Te, Sb)4S5-8
Aurostibite AuSb2
Fischesserite Ag3AuSe2
Gold tellurate (?)
The chemical mobilisation of gold in the environment is driven by organic matter,
microorganisms, oxidising minerals and solubilising ligands available in the soil and
groundwaters. Gold grains and nuggets are commonly coated by organic matter containing
secondary gold in colloidal form, implying a role for organics in the colloidal gold formation
[16]. It is known that microbes play a role in the dispersion and concentration of gold in the
environment [10]. Southam et al. [16] suggests that the microbial solubilisation and
precipitation of gold are responsible for the wide range of morphologies of some secondary
gold (wire, dendritic, octahedral, porous and sponge gold [13, 17-21]). The role of organics
and microbes are closely linked, where the concentration of organics in the soils can effect
heterotroph activity in ores and therefore the migration of gold [22]. The interaction of gold
with plants and organic matter and microbes are reviewed separately below.

Introduction | Chapter 1
Page | 4
Figure 1-1 The geomicrobiological cycle of gold in the environment.
An illustration from taken from Küchler [23] of Reith’s [24] conceptual model linking
the processes of gold solubilisation, transport, precipitation and authigenic gold
nugget formation.
1.2.1 Plants and organic matter
Plants
The ability of plants to uptake gold has been documented by many [25, 26], and plants such
as wormwood (Artemisia sp.), Douglas fir (Pseudotsuga menziesii) have been used for
biogeochemical prospecting [27]. It has been suggested that the ability of plants to uptake
gold from the soil is dependent on plant secretions (especially cyanide secretions) [26, 28],
however non-cyanogenic plants can be induced to hyperaccumulate gold by adding
thiocyanate, cyanide, thiourea or thiosulfate solutions as a complexing agent to solubilise the
gold in the soil [29-31], allowing the accumulation of gold to be independent of plant species
[27]. There is much interest in using hyperaccumulator plants for gold phytomining
(extracting gold from tailings and waste dumps) [31]. Plants also present an alternative
method for the synthesis of gold nanoparticles, as certain plant matter are able to reduce
Au(III) to Au(0) [32-34].
Jones and Peterson [35] suggested that the uptake of gold by plants may also be influenced
by humic matter. The authors proposed that humic-bound gold may have limited
bioavailability and mobility, as they found the perennial ryegrass (Lolium perenne L.)
absorbed more gold as Au(III)-chloride over Au-humics. [35]. However there are other
studies in which humics are shown to aid the dissolution of gold. The role of humics (and
other organics) in the biogeochemical cycle of gold are further discussed below.

Introduction | Chapter 1
Page | 5
Humics
Humics (or natural organic acids) are hydrophilic colloids that have a particle size of 2.4 to
10 µm range and have negative charges due to dissociations of their carboxylic and phenolic
groups [36]. They consist of substituted aromatic rings linked together by aliphatic chains
and have anywhere from about 15 to 92% aromaticity [37]. Humics exist in three groups –
humic acids (HA), fulvic acids and humin – which vary in molecular weight and solubility [37-
39]. Most studies on the mobility of gold have been conducted with humic acids.
Friese [40] reported the dissolution of gold by humic acids and concluded that gold migrated
chemically as a humate. This was supported by Boyle et al.’s [41] solubility experiments
which indicated that gold was either chelated, organometallically bonded or adsorbed on to
humic matter under supergene conditions. Fetzer’s [42] attempt to duplicate Friese’s [40]
experiment was unsuccessful, even with a range of minerals. Fetzer [42] concluded that
humic acids did not dissolve minerals and the solvent action of aqueous humic acid sols was
no greater than that expected of water (equilibrated with carbon dioxide). Fezter [42]
declared that HA-Au complexation – an oxidation process – was unlikely as Au prefers to
retain its valence electrons and HA is a reducing agent. This was supported by later studies
that reported the reduction of Au complexes by humic acids [43, 44].
Amino acids
Amino acids are a group of organic molecules – in the form of H2N–RCH–COOH with
different side chains attached to the α carbon – which occur in natural waters and soils.
Amino acids have been used in the synthesis of gold colloids or gold nanoparticles (GNPs).
GNPs can be synthesised from [AuCl4]- ion reduction with aspartic acid [45], citrate [46],
tyrosine [47], or tryptophan. In the latter, Selvakannan et al. [48] identified the indole group
as the reducing segment. Peptides containing such reducing amino acids are also capable of
GNPs synthesis [49], whereas amino acid derivatives tend to form complex crystals [50, 51].
Like humic substances however, different conditions and amino acids will dissolve Au(0),
including cysteine, glutathione, alanine, glycine, asparagine and histidine [52-54]. Under
alkaline conditions, Korobushkina et al. [22] ranked complex-forming capacity of amino acids
with Au(I) to be:
cysteine > histidine > asparagine > methionine > glycine, alanine and phenylalanine
Zhang et al. [54] found that gold was most soluble in histidine (compared to DL-aspartic
amide, DL-alanine, glycine, L-galacystine, and DL-aspartate). With the exception of DL-
aspartate, these amino acids extracted more gold from gold ores than from pure gold wire
[54]. Zhang et al. [54] suggested that dispersed gold is more easily extracted by amino acid

Introduction | Chapter 1
Page | 6
solutions. Similarly Brown et al. [53] found histidine and glycine extracted more gold from 9
carat gold than 18 carat or 22 carat. As a gold-copper alloy was used, Brown et al. [53]
suggested that the increased surface area – exposed by the dissolved copper – enhanced
the solubility of gold. Amino acids may serve as complexing agents for the transport of gold
in natural systems and – as some amino acids are produced or taken up by bacteria –
promote the biogeochemical cycling of gold [52].
1.2.2 Microorganisms
Microorganisms play a vital role in the transportation of gold as they can accumulate gold or
assist the leaching of gold. Sulfur-oxidising species such as Acidithiobacillus ferooxidans, A.
thiooxidans and A. caldus, are known to promote gold leaching environments via production
of sulfuric acid. The Acidithiobacillus species and Leptospirillum ferrooxidans are used to
treat refractory gold ores, such as pyrites or arsenopyrites, to liberate gold within the sulfide
matrix [55]. Bacteria are also able to produce metabolites capable of gold solubilisation.
According to Southam et al. [16] microbially mediated gold solubilisation can occur from the
production of thiosulfate (in poor organic environments), or amino acids and cyanide
(organic-rich environments) in the presence of oxygen. Cyanogenic bacteria such as
Chromobacterium violaceum, Pseudomonas aeruginosa, P. Fluorescens and Bacilus
megaterium are known to form water-soluble metal cyanides, and to solubilise gold through
cyanidation [56, 57].
The capacity of bacteria and other microorganisms (such as actinomycetes, fungi and
yeasts) to accumulate gold has been widely demonstrated [22, 58, 59]. Gold
bioaccumulation by bacteria is thought to explain the variety of secondary gold morphologies
and why gold in supergene placer environments is larger than the potential source rocks
[18]. Acidithiobacillus thiooxidans accumulates Au from the gold(I) thiosulfate complex,
Au(S2O3)23-
and precipitates elemental Au as a metabolic process [18, 19]. Lengke and
Southam [18, 19] reported the eventual formation of octahedral crystals, gold wire and other
irregular structures of gold, after the death phase and the release of gold nanoparticle from
the cells. Similarly, Bacillus subtilis 168 and Plectonema boryanum UTEX 485 immobilise
and reduces Au3+
to form octahedral gold [60, 61]. Some bacteria are able to accumulate
specific organo-gold complexes, such as Sporosarcina ureae with L-asparagine-Au [52].
As a possible origin of secondary gold, biomineralisation can explain the lace-like surface
structures (Figure 1-2) – known as “bacterioform” gold – common in QPC deposits [10, 62,
63], however, the origin of secondary gold cannot be based on observed morphologies, as
extremely acidic, experimental conditions can produce artefacts resembling “bacterioform”
Au [64].

Introduction | Chapter 1
Page | 7
Figure 1-2 Secondary electron micrographs of bacterioform gold.
Micrographs show (A) possible biofilm exopolymers (white arrows) and (B)
preserved cell wall structures (white arrows) within budding cell-like network, from
biofilms on gold grains from the Hit or Miss Gold Mine in Queensland, Australia,
taken from Reith et al. [65].
1.2.3 Aqueous forms of gold
While the geochemical cycle of gold includes organic and nanoparticulate gold, aqueous
inorganic gold species are of particular interest to geochemists due to their importance in
both the environment and the mining industry. Cyanide and sulfidic lixiviants are commonly
used in gold leaching [66], but also naturally available in the environment from plants or the
activity of microorganisms [18, 57, 67]. Halide complexes are also of interest in gold
speciation, especially due to the abundance of chloride ions in waters and the slight solubility
of gold in seawater (~30 pg L-1
[68]). Therefore, the following review will focus on gold-
cyanide, -sulfur and –halide (and –hydroxide) complexes.
Overview
Gold exists in oxidation states from -I to +V [69], however, the most common oxidation states
of Au in aqueous solutions are Au(I) and Au(III). As B-type metal ions (heavy transition metal
cations), the stability of Au(I) and Au(III) complexes tends to decrease with increasing
electronegativity of the ligand donor atom [70]. Unbound Au(I) and Au(III) cannot occur in
aqueous solution because they are stronger oxidising agents than water [36]. Therefore, in
aqueous solutions, Au(I) and Au(III) are coordinate complexes (usually linear two-coordinate
complexes, and square planar complexes respectively).
In natural waters and in the absence of other ligands, the predominant form of Au(I) is the
linear Au(OH)(H2O) [71, 72]. The absence of O2 in subsurface or ground waters favours the
formation of metallic gold, whereas ionic gold is more predominant in river waters [36]. In a
review, Senanayake [66] summarised the stability of Au(I) complexes:
CN- > HS
- > S2O3
2- > SC(NH2)2 > OH
- > I
- > SCN
- > SO3
2- > NH3 > Br
- > Cl
- > CH3CN

Introduction | Chapter 1
Page | 8
and Au(III) complexes with different ligands:
CN- > OH
- > SCN
- > Br
- > Cl
-
Due to the acidic oxidising conditions that Au(III) tends to exist in, potential complexing
ligands are less stable and hence fewer in number.
Gold sulfur complexes
Depending on the bisulfide (HS-) and thiosulfate (S2O3
2-) concentrations, Au(I) tends to form
bisulfide complexes in reducing environments (i.e. hydrothermal conditions or anoxic lakes),
or thiosulfate complexes in alkaline oxidising conditions (i.e. oxidising sulfide ores). In sulfidic
solutions, the species [Au(HS)] and [Au(HS)2] -
are present at pH 2–10, as HS- ions are
more stable than OH- ions [71]. In S-saturated solutions, polysulfide species ([AuSnS]
-, n =
2–7) are dominant (i.e. S3 -2
and S4 -2
ligands will displace the SH- ligand from [Au(SH)2]
- to
form [Au(S)3] - and [Au(S)4]
-) [71]. Thiocyanates (SCN
-) – formed from glycosides – are not
very abundant in soils and hence such natural gold complexes are scarce [73], however,
thiocyanate and thiosulfate have been considered as an alternative to cyanide for gold
recovery [74-76].
Gold cyanide complexes
The cyanide ion (CN-) is the most significant carbon donor ligand and forms the most stable
gold complex in solution [72]. In the environment, cyanides are produced by the hydrolysis of
cyanogentic glycosides [73]. CN- is found in various plant species and is released to the soil
in order to solubilise metabolically required metals, or upon decay of the plant [73]. Another
source, hydrocyanic acid (HCN), is produced by more than 1000 species of plants and a
variety of microorganisms [57, 67, 73]. While the Au(III) square planar analogue exists,
[Au(CN)4]-, it is not formed under typical conditions [77], and hence the most important form
of gold cyanide complex in soils is [Au(CN)2]- [78].
Gold halide and hydroxide complexes
As a soft metal, the stability of Au(I)–halide complexes increases along the series Cl- < Br
- <
I- ([AuF2]
- has not been identified). Excess halide is required to prevent the Au(I)-halide
complexes [AuCl2]- and [AuBr2]
- undergoing disproportionation in aqueous solution [79]:

Introduction | Chapter 1
Page | 9
Due to the abundance of Cl- ions in natural waters, gold-chloride complexes feature in many
studies [80-84]. Pan and Wood [82] found that at temperatures ≤100 °C, the square planar
Au(III)-chloride complex AuCl4-, is predominant in acidic solution, but at temperatures >100
°C is partially transformed into the linear Au(I)-chloride complex, AuCl2-. This reaction was
also favoured by a reduction of the oxygen fugacity and an increase of pH, and provides
evidence for the existence of AuCl2- in hydrothermal solutions [82].
Gammons et al. [85] found that native gold catalyses the disproportionation of Au(I)-chloride
complexes and the gold crystals formed during the disproportionation at 25°C are of varying
morphologies. They suggested that AuCl2- is the dominant form of dissolved gold in brines at
near-neutral pH (i.e. seawater). With the increase of temperature, the stability of
AuCl2- increases relative to AuCl4
-, as does the solubility of Au [85]. These authors [85]
theorised that Au is transported as AuCl2- rather than AuCl4
-, and the cooling of ore fluids
could precipitate some of the dissolved metal via disproportionation.
When Au is dissolved in NaOH, [Au(OH)(H2O)] is the predominant species at pH 0–12 [71].
This changes at pH << 0, as [Au(H2O)2]+ is much more acidic than H2O [71]. Colin and
Vieillard [86] calculated the Au(I) gold complex AuCl(OH)- to be most stable, in waters of pH
4–6 at Dondo Mobi, Gabon.
Au(III) forms stable square planar complexes with halides and hydroxides [84]. Usher et al.
[84] found that the iodide ion (I-) is unstable in the presence of Au(III) and oxidises rapidly to
I2(g) and precipitates Au(III). Usher et al. [84] identified three intermediate complexes
between [AuCl4]- and [AuBr4]
- and found that Au(III)-hydroxide precipitates approximately
between pH 8 and 13. So Au(III)-chloride-bromine complexes can be important in
transporting gold in brines with high bromide-chloride ratios (e.g. > 0.05), under oxidising
(atmospheric) and acidic (pH < 5) conditions [84]. This is in agreement with Gammons et al.
[85], who proposed Au(III) is the dominant species in air-saturated brines for all temperatures
up to 300 °C (pH < 3).
The most extensive studies on Au(III) complexes, however, have been on the hydrolysis of
[AuCl4]-. Both Peck et al. [83] and Usher et al. [84] used UV-VIS spectroscopy to observe the
successive replacement of chloride ligands in [AuCl4]-, with hydroxide ligands at increasing
pH. Figure 1-3 and Figure 1-4 (A) are absorbance spectra displaying the pH effect on Au(III)-
chloro-hydroxide speciation, from Peck et al. [83] and Usher et al. [84] respectively. Both
authors report the peak at 314 nm, [AuCl4]-, decreasing in absorbance and shifting toward
lower wavelengths as [AuCl4]- undergoes hydrolysis.

Introduction | Chapter 1
Page | 10
Figure 1-3 Absorption spectra of 10-4
M Au(III) in 1 M NaCl solution at varying pH.
Spectra are taken from Peck et al. [83] and show an isosbestic point at 300 nm
between pH 5 and 6.
Peck et al. [83] observed an isosbestic point at 300 nm (in Figure 1-3). According to Rao [87]
an isosbestic point is the criterion that two species (and only two) are in equilibrium. Hence
Peck et al. [83] suggested there was a change in the relative abundances of
[AuCl3(OH)]- and [AuCl4]
- between pH 5 and 6. In contrast, Usher et al. [84] did not find an
isosbestic point and due to changes in the absorbance at specific wavelengths (shown in
Figure 1-4 (B)), proposed at least four Au(III)-Cl-OH species were present at pH 5–6. Both
Peck et al. [83] and Usher et al. [84] allowed some time for their solutions to equilibrate after
pH adjustment. The former allowed several hours for the solutions to equilibrate after pH
adjustment, while the latter stirred the solution for 30 minutes before analysis. But it was Lee
and Gavriilidis [88] who spectroscopically investigated the effects of ageing time on pH
adjusted HAuCl4 solutions.
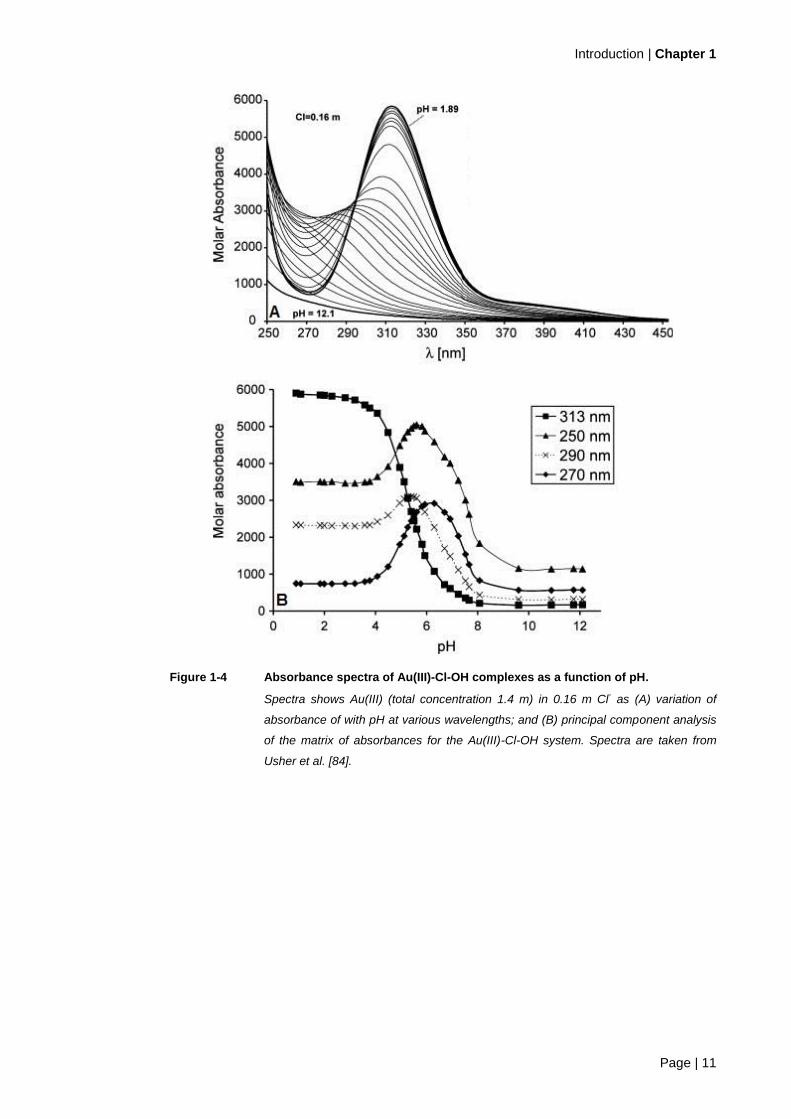
Figure 1-5 shows the absorbance spectra of 2.5 x 10⁻³
M HAuCl4 solutions ranging from pH 5
to 11 at 15–720 min. Similar to Peck et al.’s [83] work, the greatest change in absorbance
over this time period was seen at the lower pH levels (i.e. pH 5 and 7), suggesting a change
in the dominant species at that pH range. According to Lee and Gavriilidis [88], the expected
dominant species at equilibrium for pH 5, 7, 9 and 11 are [AuCl2(OH)2]-, [AuCl(OH)3]
- and
[Au(OH)4]- (at both pH 9 and pH 11) respectively. But at short ageing times, the dominant
species are possibly AuCl2(H2O)OH, [AuCl(OH)2]-, [AuCl(OH)3]
- and [Au(OH)4]
- respectively
[88]. Lee and Gavriilidis’s [88] work indicates that the exchange of ligands on gold
complexes can occur over hours, especially at lower pH’s (i.e. pH 5 – 7).
Introduction | Chapter 1
Page | 11
Figure 1-4 Absorbance spectra of Au(III)-Cl-OH complexes as a function of pH.
Spectra shows Au(III) (total concentration 1.4 m) in 0.16 m Cl- as (A) variation of
absorbance of with pH at various wavelengths; and (B) principal component analysis
of the matrix of absorbances for the Au(III)-Cl-OH system. Spectra are taken from
Usher et al. [84].
Introduction | Chapter 1
Page | 12
Figure 1-5 Absorbance spectra of 2.5 x 10⁻³
M HAuCl4 solutions.
Spectra from Lee and Gavriilidis [88] show (a) pH 5, (b) pH 7, (c) pH 9, (d), pH 11
and (e) pH 2 without adding Na2CO3 solution.
The hydrolysis of [AuCl4]- (as a function of pH) has also been monitored with Raman
spectroscopy [81-83]. The Au-Cl and Au-OH stretches are represented by peaks in the 320-
350 cm-1
and 560-580 cm-1
regions respectively, as shown in Figure 1-6, a series of Raman
spectra of a Au(III)-chloride solution adjusted to pH 1-12 by Murphy and LaGrange [81]. It
can be seen, that as the pH is increased and the chloride ligands are replaced with
hydroxide groups, the peak area ratio of Au-OH to Au-Cl increases.

Introduction | Chapter 1
Page | 13
Figure 1-6 Raman spectra of the Au-Cl stretching and Au-OH stretching ranges.
Spectra of 0.02 M HAuCl4·4H2O solution at pH 1–12 taken from Murphy and
LaGrange [81]. Vertical lines are shown for comparison of peak positions. Intensity is
not necessarily to scale. The unit “Rcm-1
” denotes “relative cm-1
”, meaning the
frequency is measured relative to the frequency of the laser light [89].

Introduction | Chapter 1
Page | 14
Peck et al. [83] also observed the hydrolysis of the [AuCl4]- complex with the increase of pH,
however, they noted that hydrolysis began at pH ≈ 5.8, while Murphy and LaGrange [81]
recorded hydrolysis beginning at pH = 3.8. Murphy and LaGrange [81] attributed the
difference in results to variation in gold and chloride concentrations (the higher the gold
concentration or chloride concentration, the higher the pH was for the start of hydrolysis),
and variation in equilibrium times. As expected, there was no evidence of hydrolysis in Pan
and Wood’s [82] study, which were conducted under very acid conditions (mHCl = 2-5).
In conclusion, an array of [AuCl4]- hydrolysis studies have been conducted by UV-VIS [83,
84, 88, 90-92] and Raman spectroscopy [81-83]. These studies have found that the
equilibrium time, the matrix and the concentration of gold and chloride in the solutions
analysed played a significant role in the speciation of gold. Gold speciation techniques, UV-
VIS, Raman spectroscopy and others are discussed in the following section.
1.3 Previous gold speciation techniques
1.3.1 Overview
As previously discussed (in Section 1.2), the transport and mobility of gold in the
environment and its interaction with plants and microorganisms has been extensively
studied. A majority of these studies were comprised of gold dissolution/precipitation
experiments to hypothesise what conditions promote the mobility or formation of gold in the
environment. Other studies have focussed on measuring the speciation of gold under
aqueous conditions. Discussed in this section, are the various techniques used to determine
the speciation of gold in those studies. It will be shown that most studies have only been on
model solutions, due to the limitations of certain techniques. There are a couple of studies
that have examined the speciation of gold in natural waters, yet only indirectly with chemical
speciation modelling [93, 94]. Therefore developing a new method that is capable of
determining the speciation of gold in natural waters is vital to furthering our understanding of
the behaviour of gold in the environment.
1.3.2 Ultraviolet-Visible Spectroscopy (UV-VIS) studies
Au(III) like other d8 transition metal ions forms square planar complexes with halide ions,
[AuX4]- (X= Cl, Br), which yield two intense bands in the U.V. region [95, 96]. Figure 1-7 is an
absorbance spectra of [AuCl4]- and [AuBr4]
- displaying these two bands. Gangopadhayay
and Chakravorty [96] attributed the two peaks around 225 nm and 315 nm to ligand-to-metal
charge-transfer transitions (LMCT), pσ dx2–y
2 and pπ dx
2–y
2 respectively. As a result of
the LMCT absorptions, Au(III)-halides are coloured ([AuCl4]- is yellow and [AuBr4]
- is orange)
[84].

Introduction | Chapter 1
Page | 15
Figure 1-7 Absorbance spectra of [AuCl4]- and [AuBr4]
-.
Spectra taken from Gangopadhayay and Chakravorty [96].
In 1962, Lingane [97] found absorption measurements were an accurate means of
determining the concentration of AuCl4- in the presence of AuCl2
- since AuCl4
- solutions are
yellow and AuCl2- solutions are colourless. Gammons et al. [85] used this difference in light
absorbance to determine the Au(I)/Au(III) ratio in mixed Au(I)/Au(III) solutions by measuring
at 314 nm (a local maximum for AuCl4-), then analysing for total gold with AAS. The detection
limits were ~0.1 ppm Au(III) for UV-VIS and 0.5 ppm for AAS.
Gold nanoparticles (GNPs) are also known to be a deep red colour (with absorbances
around 525 nm) [98], although this can vary with size and shape [99]. Bohren and Huffman
[99] compared the optical effects of gold particles of different radii in Figure 1-8. The
absorption by gold particles is independent of size between about 26 and 100 Å, but
broadens outside this range [99]. Gold particles larger than 100 Å change from a ruby red
through to purple and violet to pale blue at 800 Å [99].

Introduction | Chapter 1
Page | 16
Figure 1-8 Absorption spectra by gold particles of different radii.
The solid curves are from Turkevich et al. [100] and the dashed curves are from
Doremus [98], as shown in Bohren and Huffman [99].
While UV-VIS spectrophotometry can be used to detect different gold complexes, care must
be taken as Au(I) and Au(III) complexes are light sensitive and photolysis commonly leads to
the deposition of metallic gold [69]. Another disadvantage of UV-VIS analysis of natural
waters is that groundwaters often contain colloids, bacteria, algae or suspended particles
[101], which can absorb in regions of interest. Also UV-VIS spectroscopy is not sensitive
enough to detect the typical low levels of gold found in groundwaters (ng L-1
) [50, 102-105].
1.3.3 Raman studies
The square planar [AuCl4]- has 9 vibrational modes, three of which are Raman active: A1g +
B1g + B2g [82], as shown in Figure 1-9. The majority of Raman studies have been conducted
on the [AuCl4]- complex and the effect of pH on its hydrolysis products, [AuCl4-n(OH)n
]- (where x = 0-4) [81-83]. Raman spectroscopy is ideal for aqueous speciation studies as the
Raman spectrum of water is unlikely to interfere with analysis [81, 83]. Another advantage is
that spectra with mixed complexes can be simplified through Resonance Raman (RR)
scattering. RR scattering is achieved by tuning the excitation laser to the same frequency of
the electronic absorption band of one complex. This can increase the scattering intensity by
a factor of 104 – 10
6 and selectively enhance the one complex as shown in Figure 1-10 [83].

Introduction | Chapter 1
Page | 17
Figure 1-9 Raman active vibrational modes of the [AuCl4]- complex.
Stretching (A1g, B2g) and bending (B1g) modes.
A disadvantage in Raman is that although concentration is proportional to peak intensity a
direct comparison of concentrations is not usually possible. However different bonds (such
as Au-OH and Au-Cl) have different intensities and the Au-Cl stretching peak is more intense
in [AuCl4]- than in [AuCl3(OH)]
-, (the former contains four Au-Cl bonds and the latter three)
[81]. Therefore the detection limit for gold speciation in Raman is more dependent on the
species present rather than the total gold concentration [81]. Typical concentrations in
previous Raman studies range from ~10-2
to 10-3
M gold, (the latter in excess chloride
solutions) [81-83].
Figure 1-10 Enhancement of the symmetric stretch of [AuCl4]- at ~347 cm
-1.
Spectra of normal (laser excitation at 458 nm) and resonance (364 nm) Raman of
10-2
M Au(III) in NaCl solution at 4ºC at pH = 5.8. Spectra taken from Peck et al. [83].

Introduction | Chapter 1
Page | 18
1.3.4 X-ray absorption spectroscopy (XAS)
The absorption of X-rays can excite the 1s (K edge) or 2s,2p (L edge) electrons of an
element to empty orbitals or the continuum [106]. There are two regions in X-ray absorption
spectroscopy: X-ray Absorption Near Edge Structure (XANES), which indicates the oxidation
state of the metal ion and the coordination chemistry of the neighbouring atoms [107], and
Extended X-ray Absorption Fine Structure (EXAFS), which provides information on
interatomic distances for ligands and neighbouring atoms [108]. These two spectral regions
are illustrated in a schematic of a XAS spectrum in Figure 1-11.
Figure 1-11 The two spectral regions in XAS: XANES and EXAFS.
Schematic is taken from Vainshtein [108].
For gold, the absorption of the 2p5d electronic transition at the Au-LIII edge gives rise to a
peak (also known as a “white-line”) on the edge of the XANES region [109]. The “white-line”
intensity reflects the density of the unoccupied d states or the oxidation state of the metal ion
[110]. Figure 1-12 (A) shows that the “white-line” intensity is highest for Au(III) and lowest for
Au(0). The absorption spectrum of the metal ion is also affected by its neighbouring atoms,
where the ejected photo-electron from the metal ion interacts and scatters from the
surrounding atoms. This high energy region or EXAFS, is used to determine the distances or
the coordination of the neighbouring atoms, as shown in Figure 1-13.

Introduction | Chapter 1
Page | 19
Figure 1-12 Typical Au-LIII edge XANES spectra as taken from Berrodier et al. [111].
Spectra for selected model compounds showing (A) the shift in the absorbance edge
and “white-line” intensity for Au(0), Au(I) and Au(III).
Figure 1-13 Fourier transforms of EXAFS spectra of Au solutions.
Spectra of 1 M NaCl, crystalline KAuCl4∙2H2O and metallic gold (taken from Farges
et al. [80]).

Introduction | Chapter 1
Page | 20
Previous XAS gold speciation studies have looked at both solid and aqueous samples. Solid
studies included investigations into the geometry of potential antitumor gold drugs [112] and
the determination of the chemical form of invisible gold in arsenopyrite [113, 114]. Farges et
al. [80] used EXAFS to monitor the change in speciation of Au(III)-chloride with the change in
pH. XANES has also been used to monitor changes in gold oxidation states, to show the
Shewenella algae cells’ ability to reduce AuCl4- ions to Au(0) [115]. Berrodier et al. [111]
used XAS to examine Au(III) speciation in solutions and on mineral surfaces, such as
goethite, ferrihydrite and boehmite.
The advantage of using XAS for gold speciation is that the oxidation state of gold can easily
be interpreted from the intensity of the “white-line”, however, determination of distances and
neighbouring atoms from the multiple scattering feature or the EXAFS region is more difficult
to interpret. A high energy X-ray source is also necessary for XAS spectroscopy, requiring
access to a synchrotron X-ray fluorescence beam line.
1.3.5 Extraction-photometric reagents
Extraction-photometric speciation methods rely on the formation of an ion associate between
[AuCl4]- and large organic cations such as rhodamine, tripheynlmethane, antipyrine, thiazine
and oxazine dyes [116]. This is then usually followed by a liquid-liquid extraction step with an
organic solvent and then photometric analysis with atomic absorption spectroscopy,
fluorescence or UV-VIS etc. [116-119].
The gold can also be preconcentrated during the liquid-liquid extraction step, which is
necessary for the sensitivity of photometric detections (spectrophotometric methods are
limited to the molar absorptivity of the reagent). This is achieved by limiting the volume of the
extractor solvent. Another method is the use of an adsorbant column to preconcentrate the
gold. Examples of reported detection limits after preconcentration include:
Serbin et al.’s [117] detection limits of 0.031 mg L-1
and 0.084 g L-1
for
spectrophotometric and atomic absorption analysis respectively.
Tang et al. [118] achieved a detection limit of 0.16 g L-1
by using a polyamide
column for the adsorption and preconcentration of Au3+
(AuCl4- can bind to the O
and N in the polyamide by static effect) before fluorescence.
Tsukahara [119] was able to detect 0.1 – 33 mg L-1
of gold with spectrophotometric
analysis.
Yet despite these low detection limits for gold, most of the described extraction-photometric
methods are more suited for the detection of gold – rather than its speciation – as most
methods require a specific pH for the extraction, and for the gold to be in either the AuCl4- or
AuBr4- form [116-120]. Even El-Shahawi et al.’s [121] liquid-liquid extraction separation of

Introduction | Chapter 1
Page | 21
Au(I) and Au(III) ions relied on the oxidation of Au(I) species to Au(III) species. Hence, there
can be many extraction steps for these methods.
1.3.6 Chemical speciation modelling
Chemical speciation modelling is based on the presumption of a system reaching equilibrium
and writing mass balance and mass action equations for the possible minerals and species
in the system. The equilibrium constants required for this are determined experimentally by
measuring the concentration of species under varying conditions (pH, temperature etc.), and
can be stored in databases such as the IUPAC Critical Database and the NIST Standard
Reference Database [122]. In previous gold speciation studies these equilibrium (or stability)
constants are often used for comparing and verifying experimental results [72, 83, 84]. There
are also thermodynamic modelling softwares that are able to access these databases of
equilibrium constants for chemical speciation (i.e. HYDROGEOCHEM [123], PHREEQC
[124] and The Geochemist’s Workbench® [125]). (The latter (or GWB) was used in this thesis
and modelling with GWB is explained in more detail in Section 1.5.1).
Speciation modelling is often paired with an analytical method that measures the metal ion or
the total metal concentration [122]. Leybourne et al. [94] used inductively coupled plasma
emission spectrometry (ICP-ES) and ICP-MS to determine the major and trace elements in
creek water. These species were then modelled with the software PHREEQC to determine
the ligands available for complexing with Au. Based on their modelling, Leybourne et al. [94]
theorised that gold was being mobilised from the nearby tailings as [Au(CN)2]-. Gray and
Pirlo [93] also analysed groundwaters in South Australia with ICP-ES and ICP-MS, and then
constructed equilibrium activity diagrams, computed solution species and mineral saturation
and modelled ion interaction with GWB [125], PHREEQE [126] and PHRQPITZ [127]
respectively. Gold(I)-halides (i.e. [AuCl2]-) was expected to be the dominant complex in the
saline regions [93].
A limitation of chemical speciation modelling is that it is an indirect method of speciation and
there are potentially many sources of errors associated with modelling, arising from
uncertainties in the chemical analyses, whether the correct model has been used, relying on
assumption about the system and the depth and accuracy of the thermodynamic datasets
[125]. Use of incorrect equilibrium constant values and the propagation of the errors can lead
to significant uncertainties [122]
1.3.7 HPLC-ICP-MS studies
Unlike chemical speciation modelling, HPLC-ICP-MS is a direct speciation technique. This
powerful speciation technique has been used to speciate many trace elements, particularly
As, Se and Sb [128-130]. Gold possesses only one stable isotope, 197
Au, has a first

Introduction | Chapter 1
Page | 22
ionisation energy of 890.1 kJ mol-1
and can be analysed by ICP-MS with detection limits
below the part-per-trillion (ppt) range [131]. Previous Au speciation work on HPLC-ICP-MS
has arisen from pharmacokinetic studies on gold-based drugs. These methods include size-
exclusion, weak anion-exchange and reversed-phase ion pairing chromatography (RP-IPC),
where gold-based drugs and their metabolites were successfully separated [132-135].
Size exclusion chromatography with ICP-MS detection has been used to monitor the size
distribution of protein-bound gold in blood plasma, serum and red blood cell lysate [133,
134]. Low molecular weight gold metabolites, however, were strongly retained on size
exclusion columns. Hence gold metabolites were also studied by Elder and colleagues with
weak anion-exchange chromatography and reversed phase-ion pair chromatography (RP-
IPC) with ICP-MS detection [132-135]. Matz et al. [133] and Elder et al. [132] used weak
anion-exchange chromatography with gradient elution to monitor changes to the gold
distribution in patient urine and blood undergoing gold therapy (containing 0.20–1.45 mg L-1
of total gold). Quantification of the gold species was difficult, however, due to the gradient
elution. Alternatively, RP-IPC can be used with an isocratic elution. Zhang et al. [134] used
RP-IPC coupled with ICP-MS to detect Au-glutathione, [Au(CN)2]- and other gold-complexes
in red blood cell lysate containing approximate 0.1–2.5 µg L-1
of total gold. Zhao et al’s [135]
RP-IPC method reported detection limits of 0.3 ng of drug using an injection volume of 200 µl
for the gold drug auranofin. This equates to a detection limit of 1.5 µg L-1
using these
conditions.
There are limitations to what samples can be analysed with ICP-MS, due to the sensitivity of
the technique/instrumentation. Difficulties mainly arise from matrix issues such as:
Drift in the signal caused by deposition of sample material on the interface cones
and the ion optics [136],
Suppression/enhancement of the signal from components in the matrix [137], and
Plasma instability caused by introduction of high volumes of organic solvent
commonly used in HPLC mobile phases [138].
Yet there are still many important advantages of HPLC-ICP-MS over other gold speciation
techniques:
It is a direct and sensitive speciation technique,
Little sample preparation is required, and
There is potential to differentiate between gold thiosulfate, cyanide and halide-
hydroxide species.
Therefore, a new method for the speciation of gold complexes will be developed for HPLC-
ICP-MS (with RP-IPC).

Introduction | Chapter 1
Page | 23
1.4 Instrumentation
1.4.1 Separation by HPLC
Reversed Phase Ion Pair Chromatography (RP-IPC) is a mode in High Performance Liquid
Chromatography (HPLC) that allows the separation of ionic analytes. In reversed phase
liquid chromatography (RPLC), the stationary phase is non-polar (hydrophobic) and the
mobile phase is polar. Separation is based on the partitioning of analyte X between the
mobile (Xm) and stationary phase (Xs), (i.e. the partition coefficient, K, governs the
distribution of X) [139, 140]:
sm XX Partition coefficient][
][
m
s
X
XK
In order to separate ionic species, an organic ion-pairing reagent (or counter-ion) is added to
the mobile phase to form an ion pair with the sample component. Figure 1-14 shows the
structure of tetrabutylammonium chloride (TBAC); an ion-pairing agent suitable for anionic
species. The organic end reacts with the stationary phase, whereas the ionic end reacts with
the analyte [140]. These “detergent” like molecules improve the retention of ionic analytes
and retention is proportional to the concentration and hydrophobic chain length of the ion-
pairing agent [141]. Once the sample has been separated on the HPLC, the analytes are
then introduced into the ICP-MS for detection.
Figure 1-14 TBAC structure.
1.4.2 Detection with ICP-MS
As depicted in Figure 1-15, the ICP-MS instrument consists of several components, including
the spray chamber, plasma, quadrupole and detector. The role of these components in the
sample introduction and the production, focussing and detection of the ions are briefly
discussed below.

Introduction | Chapter 1
Page | 24
Figure 1-15 Schematic of the Agilent ICP-MS set up.
Schematic taken from Agilent Technologies [142].
Sample introduction
The liquid sample is introduced into the ICP-MS through the nebuliser. The purpose of the
nebuliser is to convert the liquid sample into an aerosol for transport into the plasma. The
large aerosol droplets are then removed in the spray chamber, allowing only small droplets
to be introduced into the plasma.
Ion production and focusing
The plasma is the source of ion production, and at ~6500 K, has sufficient energy to dry,
atomise and ionise the sample aerosol [142]. From the plasma, a sample of the ions enters
the interface, which consists of the vacuum between the sample and skimmer cone
(depicted in the inset in Figure 1-15). As only positive ions are produced in the plasma, the
ion beam can be focussed by the electrostatic field generated by the following lenses (this
also removes the neutral species and photons from the ions). The ion beam then passes
through a collision/reaction cell where the ion beam reacts with the chosen gas (i.e. H2, He)
to remove interfering species (not required for HPLC-ICP-MS). The ions are then mass
filtered by the electric field generated by the quadrupole (comprised of two pairs of cylindrical
rods, with varying AC and DC fields), so only ions with the desired mass-to-charge ratio
(m/z) reach the detector.
Detection
The most common detector in ICP-MS instruments is the electron multiplier [142]. As
depicted in Figure 1-16, the electron multiplier is made up of a series of dynodes, which

Introduction | Chapter 1
Page | 25
release several electrons upon impact of an ion on the first dynode surface. The released
electrons continue to impact on the dynodes located further down the detector, effectively
amplifying the signal. This amplification is largely responsible for the high sensitivity
associated with ICP-MS [142].
Figure 1-16 Schematic of electron multiplier.
Schematic taken from Agilent Technologies [142].
1.5 Software and modelling
1.5.1 The Geochemist’s Workbench® (GWB)
The Geochemist’s Workbench® (GWB) [125] is a geochemical modelling software package.
The programs consist of RXN, ACT2, TACT, SPECE8, REACT, GTPLOT, X1T, X2T,
XTPLOT. GWB allows users to balance chemical reactions, calculate equilibrium constants,
trace reaction pathways and generate stability diagrams.
As detailed by Bethke [125], GWB modelling consists of:
Defining the initial equilibrium system (i.e. the amounts of minerals in the system and
dissolved components in the fluid, fugacities of gases, temperature and the pH).
Writing a combination of mass action equations (relating to the species’ activities to
the reaction’s equilibrium constant), mass balance equations (the concentrations of
the system’s species, minerals and gases which add up to give the system’s bulk
composition) and charge balance equations (where the ionic species in the system
are balanced for an overall system electroneutrality).
These equations are then solved iteratively to obtain the distribution, concentration and
activity of the species in the equilibrium state.
Introduction | Chapter 1
Page | 26
1.6 Conclusions & Project Premise
In view of the limited direct speciation techniques for aqueous gold in groundwaters, there is
a need to develop a sensitive analytical method for the speciation of gold. A direct and
sensitive speciation technique for gold in waters may lead to improved gold recovery and
extraction processes, benefit gold mineral exploration and advance the understanding of the
geological and geobiological cycle of gold. Gold complexes that are significant in the
environment and in mining processes include gold cyanide, gold-sulfur, and gold-halide
complexes. Hence, the research in this thesis is focussed on speciating complexes that are
readily available and known to be soluble in water: Au(I)-thiosulfate, Au(I)-cyanide, Au(III)-
chloro-hydroyl complexes and Au(III)-bromo-hydroxyl complexes. In order to conduct the
studies in this project a HPLC-ICP-MS method will need to be developed for the speciation
of gold.
Therefore the aims of this research are:
1. Systematically develop a HPLC-ICP-MS method for the speciation of Au(I)-
thiosulfate, Au(I)-cyanide, Au(III)-chloro-hydroxyl complexes and Au(III)-bromo-
hydroxyl complexes.
2. Determine the speciation of gold in various mine wastes and groundwaters samples.
3. Investigate possible mechanisms for the formation of Au(III) complexes in
groundwaters.