Embed Size (px)
Citation preview
THE SPATIAL ANALYSIS OF AN HISTORICAL PHENOMENON: USING GIS TO DEMONSTRATE
THE STRATEGIC PLACEMENT OF THE UMAYYAD "DESERT PALACES."
MAHMOUD BASHIR ABDALLAH ALHASANAT
UNIVERSITI SAINS MALAYSIA 2009

THE SPATIAL ANALYSIS OF AN HISTORICAL PHENOMENON: USING GIS TO DEMONSTRATE THE STRATEGIC PLACEMENT
OF THE UMAYYAD "DESERT PALACES."
by
MAHMOUD BASHIR ABDALLAH ALHASANAT
Thesis submitted in fulfillment of the requirements for the Degree of Master of Science
January 2009

ACKNOWLEDGMENTS Bism Allah wa al-hamdulellah wa ssallat wa salam Allah ‘ala saidna Muhammad. I am deeply indebted to my sweet, wonderful friend, Dr. Erin Addison, for her constant support and encouragement: without her help, this work would not be possible. I deeply thank my advisors, Prof. Norizan Md and Dr. Tarmiji Masron, whose help, advice, guidance and supervision was invaluable. Without them, this work could not have been completed. I also would like to thank all my lecturers, Prof. Ruslan, Dr. Narimah, Dr Wan and Dr. Ashirah, also Mr. Jahan and Mr. Faiyaz, for their time, efforts, understanding and patience during the period of my study. USM and its staff, is greatly acknowledged. Besides, I would like to thank Dr. Ali Abbas Albdour for his cameraderie. Finally I would also like to extend my deepest gratitude to my family. Without their encouragement I would not have a chance to be at USM. My brothers and sisters (Dr.Ahmed, Eng, Naeem, Eng. Riad , Eng. Mansour, Dr. Asa’ad, Ruqaia and Ola), their help, support and patience has been most appreciated. I especially owe much to my parents for their prayers for me. I dedicate this dissertation to my mother, father and to my country.
ii

iii
TABLE OF CONTENS
PAGE
ACKNOWLEDGMENTS………………………………………………………… ii
TABLE OF CONTENS…………………………………………………………. iii
LIST OF TABLES……………………………………………………………….. vii
LIST OF FIGURES……………………………………………………………… viii
ABSTRAK………………………………………………………………………… xii
ABSTRACT……………………………………………………………………… xv
CHAPTER ONE: AN INTRODUCTION
1.1 Introduction…………………………………………………………... .1
1.2 Background of the study………………………………………....... .3
1.2.1 Tubah & Mushatta………………………………………..... 7
1.2.2 Qasr Haranah………………………………………………. .10
1.2.3 Qasr Burqu…………………………………………………. 12
1.2.4 Qasr Jabal Sais............................................................... 13
1.2.5 Qasr Qusayr `Amra......................................................... 15
1.2.6 Qasr al- Hallabat..............................................................17
1.2.7 Qasr al-Muwaqqar.......................................................... 19
1.2.8 Azraq............................................................................... 20
1.2.9 Qasr al-Qastal.................................................................. 23
1.2.10 Hammam as_Sarah......................................................... 27
1.3 The qusour of Bilad-ash-Sham.................................................... 28
1.4 Thesis statement.......................................................................... 29

iv
1.5 Significance…………………………………………………………... 29
1.6 Objectives..................................................................................... 30
1.7 Research questions.................................................................... 30
1.8 Hypothesis.................................................................................... 31
1.9 Scope and Limitations of Study………………………………….. 31
1.10 Thesis Layout.............................................................................. 32
CHPTER TWO: LITERATURE REVIEW
2.1 Archaeological Research.............................................................. 33
2.2 Spatial Analysis and Computing in the discipline of history…. 33
2.3 Geographical Information Systems in Historical Research…... 35
2.4 GIS in Cultural History.................................................................. 37
2.5 GIS and spatial analysis................................................................ 40
2.6 Buffering......................................................................................... 41
CHAPTER THREE: METHODOLOGY
3.1 Methodological application............................................................. 43
3.2 What is GIS? .................................................................................... 44
3.3 Components of a GIS....................................................................... 46
3.3.1 People................................................................................... 46
3.3.2 Procedures……………………………………………………… 47
3.3.3 Hardware………………………………………………………… 48
3.3.4 Software ……………………………………………………….. 48
3.3.5 Data………………………………………………………………. 48
3.4 Data Capture…………………………………………………………….. 51

v
3.4.1 Spatial data……………………………………………………… 51
3.4.1.1 Global Positioning System (GPS)…………….. 52
3.4.1.2 Point feature………………………………………. 53
3.4.1.3 Line feature………………………………………...53
3.4.1.4 Arial feature……………………………………….. 53
3.4.1.5 Triangulated Irregular Network (TIN)…………. 53
3.4.1.6 Projection and Rectification…………………….54
3.4.1.7 Palestine Grid Projection……………………….. 55
3.4.1.8 Data Modeling…………………………………….. 55
3.4.1.9 Raster Data Model..............................................56
3.4.1.10 Vector Data Model............................................. 57
3.4.1.11 Shapefile............................................................. 60
3.4.2 Tabular Data…………………………………………………….. 60
3.5 Building a Geodatabase ………………………………………………. 62
3.6 Database………………………………………………………………….. 64
3.7 Relational Database Model……………………………………………. 64
3.8 Database design …………………………………………………………66
3.8.1 Requirements analysis……………………………………….. 67
3.8.1.1 Entities……………………………………………….. 69
3.8.2 Data modeling……………………………………………………73
3.8.2.1 Logical Modeling…………………………………………. 73
3.8.2.2 Physical Modeling……………………………………….. 73
3.8.3 Automated Design Tools……………………………………….75
3.8.4 Normalization…………………………………………………… 75

vi
CHAPTER FOUR: ANALYSIS
4.1 Visualization……………………………………………………………... 77
4.2 Proximity analysis………………………………………………………. 78
4.2.1 Buffering………………………………………………………….78
4.3 Exploratory digital map…………………………………………………79
4.4 Line-of-sight communication…………………………………………. 83
4.5 Point pattern analysis………………………………………………….. 84
4.5.1 Quadrant Count Method……………………………………… 86
CHAPTER FIVE: RESULTS
5.1 Digital map and geodatabase………………………………………… 91
5.2 Exploratory digital map…………………………………………………101
5.3 Line-of-sight communication…………………………………………..109
5.4 results of Quadrant Count Method……………………………………114
CHAPTER SIX
6.1 Discussion…………………………………………………………………116
6.2 Conclusion………………………………………………………………...123
6.3 Recommendations……………………………………………………….125
REFERENCES……………………………………………………………………127
APPENDIXES: DEFINITIONS…………………………………………………. 134

vii
LIST OF TABLES
PAGE
TABLE 1.1: List of qusour of Bilad-ash-Sham in order of onstruction. 28
TABLE 3.1: Parameters of Palestine Grid Projection. 55
TABLE 3.2: Layers used in the study. 60
TABLE 5.1: Database of Umayyad qusour. 94
TABLE 5.2: Results of conducting Quadrat Analysis. 115
TABLE 6.1: Significant location between desert castle and their
water sources or water infrastructure.
118

viii
LIST OF FIGURES
PAGE
Figure 1.1: Jordan in international context 3
Figure 1.2: Harrah. 5
Figure 1.3: Wadi Sirhan. 6
Figure 1.4: Qasr Tubah. 8
Figure 1.5: Location of Qasr Tubah and the well at wadi Ghataf. 9
Figure 1.6: Well of qasr Tuba. 9
Figure 1.7: Qasr Mushatta. 10
Figure 1.8: Qasr Harranah. 11
Figure 1.9: Location of qasr Haranah between two wadis. 11
Figure 1.10: Qasr Burqu. 12
Figure 1.11: Location of qasr Burqu at the lake. 13
Figure 1.12: Qasr Jabal Sais. 14
Figure 1.13: Location of qasr Jabal Sais, volcano and two lakes. 14
Figure 1.14: Qusayr Amra. 17
Figure 1.15: Qasr al-Hallabat. 18
Figure 16: Location of qasr al-Hallabat, its reservoir and Hammam as-Sarah.
19
Figure 1.17: Qasr Azraq. 22
Figure 1.18: Locations of qasr Azraq, Jabal Sais and Burqu around the Harrah.
22
Figure 1.18: Locations of qasr al-Qastal , reservoirs,dams, masjid and paths.
27
Figure3.1: Components of GIS. 50
Figure 3.2: DEM for the study area using Global Mapper7. 54

ix
Figure 3.3: As an illustration of transferring a real world geographic area into the raster and vector formats. (Source: Defense Mapping School National Imagery and Mapping Agency).
56
Figure 3.4: Raster image from Google Earth used in this study. 57
Figure 3.5: Vector model. 59
Figure 3.6: Different ways of graphically displaying data with vector and raster models. (Burrough, Peter, McDonnell.1998).
59
Figure 3.7: Linking between features and their attributes. 62
Figure 3.8: Relational database used in this study represents the source of water and water infrastructure database.
66
Figure 3.9: One-to-one relationship in ERD 71
Figure 3.10: One-to-many relationship in ERD 71
Figure 3.11: ERD for the entire study. 72
Figure 3.12: One-to-many relationship in Physical modeling. 75
Figure 4.1: The distance between Hammam as-Sarah and qasr Hallabat.
80
Figure 4.2: Buffer zone with radius 3,477m. 80
Figure 4.3: Cities, triangle shape, mean and the terrain. 82
Figure 4.4: Distribution of qusour in second group looks like a diamond shape.
83
Figure 4.5: Desert castles in the context of terrain and DEM. 84
Figure 5.1: Resulted digital map. 92
Figure 5.2: Resulted geodatabase made by ArcCatalog_ArcInfo. 93
Figure 5.3: Resulted attributes of geodatabase made by ArcGIS
9.2.
93
Figure 5.4.A: Report of Umayyad qusour, page1. 97
Figure 5.4.B: Report of Umayyad qusour, page2. 98

x
Figure 5.4.C: Report of Umayyad qusour, page3. 99
Figure 5.4.D: Report of Umayyad qusour, page4. 100
Figure 5.5.A: Buffer zone around qasr Al_Hallabat. 101
Figure 5.5.B: Buffer zone around qasr Jaba Sais. 102
Figure 5.5.C: Buffer zone around qasr Al_Tuba. 102
Figure 5.5.D: Buffer zone around qasr Burqu. 103
Figure 5.5.E: Buffer zone around qasr Al_Amra. 103
Figure 5.5.F: Buffer zone around qasr Haranah. 104
Figure 5.5.G: Buffer zone around qasr Al_Muwaqqar. 104
Figure 5.5.H: Buffer zone around qasr Umm Al_Walid. 105
Figure 5.5.I: Buffer zone around qasr Mushatta. 105
Figure 5.5.J: Buffer zone around qasr Al_Qastal. 106
Figure 5.5.K: Buffer zone around qasr Al-Azraq. 106
Figure 5.7: Shows how can qasr Al-Hallabat patrolled the routes within in one hour.
107
Figure 5.8: Tuba located almost in the middle of the two routes. 107
Figure 5.9: Two groups of Desert castles. 108
Figure 5.10: First group dotted precisely on the route. 108
Figure 5.11: Distribution of qusour , diamond shape and buffer zones.
109
Figure 5.12: Distribution of qusour, diamond shape and buffer zones.
110
Figure 5.13.A: Terrain profiles between Umm al-Walid and
Mushatta.
110
Figure 5.13.B: Terrain profiles between Azraq and Amra. 111
Figure 5.13.C: Terrain profiles between Qastal and Mushatta. 111

xi
Figure 5.13.D: Terrain profiles between Muwaqqar and Haranah. 112
Figure 5.13.E: Terrain profiles between Muwaqqar and Mushatta. 112
Figure 5.13.F: Terrain profiles between Muwaqqar and Qastal. 113
Figure 5.13.G: Terrain profiles between Muwaqqar and Umm al-
Walid.
113
Figure 5.13.H: Terrain profiles between Qastal and Umm al-Walid. 114
Figure 5.14: A region into 16 quadrants illustrates points’
intensity.
114
Figure 6.1: Possess of patrolling. 121
Figure 6.2: Travel routes between political centers of Kufa, Madina, Mekkah & Damascus.
122

xii
ABSTRAK
Istana Umaiyah adalah merupakan struktur binaan peringatan yang telah dibina
semasa pemerintahan Khalifah Islam yang pertama. Struktur binaan ini
dianggap oleh kebanyakan pengkaji sejarah termasuk Cresswell (1969),
Hilllenbrand (1982), Bisheh (1985 dan 1998) sebagai sebuah Istana Percutian
atau Istana Persinggahan untuk aktiviti memburu binatang. Namun sesetengah
pengkaji masa kini mula memberi hujah bahawa struktur binaan yang unik ini
sebenarnya adalah merupakan campurtangan strategik manusia ke atas
landskap (Addison 2000, Almagro 1992, Arce 2008, King 1992). Pusat-pusat
pentadbiran utama pada zaman tersebut ialah bandar Kufa, Madina dan
Damascus. Bandar Damascus adalah merupakan pusat pentadbiran Khalifah
Umaiyah. Oleh yang demikian Khalifah Umaiyah mempunyai sebab yang
munasabah untuk menjaga dan memantau dengan rapi laluan menghala ke
bandar Damascus tersebut daripada pesaing-pesaing lain iaitu pusat-pusat
pemerintahan yang terdapat pada ketika itu. Dapat disimpulkan di sini bahawa
hujah-hujah yang disebutkan tadi akan menjadi lebih mantap dan teguh jika
dapat ditunjukkan dalam bentuk hubungan ruangan yang diwakilkan melalui
analisis sistem maklumat geografi (GIS).
Sehingga kini, ahli sejarah sangat bergantung kepada analisis tekstual, seni
bina dan sejarah-sastera istana bagi memahami seni bina zaman Umaiyah.
Perbincangan dalam kajian ini menggunakan hujah analisis ruangan sebagai
membuka lembaran dan satu dimensi baru. Dalam menggunakan analisis
ruangan, struktur binaan tidak dlilihat sebagai satu unit arkiologi yang

xiii
berasingan tetapi dilihat sebagai satu sistem secara menyeluruh. Sistem
maklumat geografi (GIS) telah mula digunakan dalam bidang sains sosial, alam
sekitar, dan juga kejuruteraan. Penghujahan permasalahan kajian dalam
penyelidikan ini menggunakan GIS sebagai pembuka ruang kepada bidang
kajian kemanusiaan.
Kajian ini menyatakan bahawa Istana Umaiyah dibina secara strategik di
kawasan sumber air bagi memantau laluan pergerakan penduduk di dalam
kalangan pusat-pusat sosio-politik pada zaman itu.
Objektif kajian ini ialah untuk membina pangkalan data geografi dan peta digital
Istana Umaiyah dalam konteks geografi dan untuk membuat analisis
kesalingnampakan (visual) dan analisis ruangan ke atas taburan istana-istana
tersebut.
Kajian ini merumuskan bahawa terdapat bentuk yang signifikan di dalam
taburan lokasi Istana-Istana Umaiyah, kedapatan garisan komunikasi
kesalingnampakan yang tidak terhalang di antara setiap istana dengan istana
kejiranan puak berhampiran yang terletak di bahagian barat Harrah dan wujud
perhubungan yang boleh dikirakan di antara istana dan sumber air dan laluan
perdagangan. Taburan sedemikian menunjukkan bahawa lokasi istana
mempunyai kedudukan yang strategik.

xiv
Kaedah yang digunakan di dalam kajian ini bermula dengan membangunkan
pangkalan data dan peta digital. Ia disusuli dengan menguji kesalingnampakan
antara istana, menjalankan analisis kedekatan dan penilaian quadrant.
Penemuan kajian menunjukkan bahawa Istana-Istana Umaiyah telah dibina
dengan teliti pada kedudukan laluan pergerakan manusia dan di lembangan
sumber air. Corak taburan Istana-Istana Umaiyah, berkelompok di outlet
Wadi_Sarhan, wujud komunikasi garisan kesalingnampakan di antara Azraq,
Amra, Haranah, Muwaqqar, Umm Awlaid, Mushatta, dan Qastal, dan terdapat
assosiasi positif di antara Istana-Istana Umaiyah dan lembangan sumber
bekalan air. Penemuan kajian menunjukkan bahawa dengan menggunakan
sistem maklumat geografi (GIS) dan analisis ruangan hasil kajian adalah
selaras dan menyokong hujah dan pandangan yang dibuat oleh Addison,
Almagro, Arce and King seperti yang dinyatakan sebelum ini.

xv
ABSTRACT
The Umayyad qusour are monumental structures built during the reign of the
first caliphate of Islam. The Umayyad qusour are usually dismissed as "pleasure
palaces" or "hunting lodges," even by prominent scholars (e.g., Cresswell 1969;
Hilllenbrand 1982; Bisheh 1985, 1998). Some scholars of the period are,
however, beginning to argue that these prominent structures were strategic
interventions in the landscape (Addison 2000, Almagro 1992, Arce 2008, King
1992). The major political centers of the time were Kufa, Madina and
Damascus. Damascus was the center of the Umayyad caliphate. Kufa and
Madina were the centers of opposition to the Umayyads. Therefore the
Umayyad caliphs had good reason to monitor carefully the routes which led to
Damascus from these rival political centers. The argument summarized above
becomes much more powerful when these spatial relationships are represented
and analyzed in GIS.
Until now, historians have relied mainly on textual, architectural and art-
historical analyses of the qusour in order to understand Umayyad state
architecture. This argument uses spatial analysis to lend a new dimension to
the discussion. Using spatial analysis the structures are treated not as
individual archaeological exempla, but as a system. GIS has typically been
employed for the social sciences, environmental and engineering disciplines.
This argument uses GIS to shed light on a research problem in the humanities.

xvi
This argues that the Umayyad qusour were built strategically at perennial water
sources in order to monitor routes of transhumance amongst the socio-political
centers of the period. The objectives of the study are to construct a geo-
database and digital map of the Umayyad qusour in their geographical context
and to conduct a visualization and spatial analysis of the distribution of the
qusour.
This study suggests that there are significant patterns in the locations of the
Umayyad qusour, there is unobstructed line-of-sight communication between
each qasr and its neighboring qusour among the group located west of Harrah,
and there is a quantifiable relationship between the qusour, perennial water
sources, and established trade routes. These patterns suggest strategic
placement of the qusour.
Methods used were construction of a geo-database and digital map, a
visualization, as well as proximity analysis and quadrant analysis.
The results of the analysis show that Umayyad qusour are carefully situated at
routes of transhumance and the water sources. The distribution pattern of the
Umayyad qusour is clustered at the out let of Wadi Sarhan, There is actually
line-of-sight communication between Azraq, Amra, Haranah, Muwaqqar, Umm
al wlaid, Mushatta, and Qastal, and there is a positive association between
Umayyad qusour and their water sources. These results derived from GIS and
spatial analyses, support the argument of Addison, Almagro, Arce and King.

1
CHAPTER ONE
AN INTRODUCTION
1.1 Introduction.
The Umayyad qusour are monumental structures built during the reign of the
first caliphate of Islam (VIIIth century AD/ I-II century AH). The architectural
remains of the qusour are largely found in Jordan, and there are a few in Syria
and one on the West Bank. One group of the qusour are referred to, however,
as the "Desert Castles of Jordan." They stand out as a group because of their
size and elaborate architecture, their concentration in what, today, seems like
the deserted arid steppe, and by the fact that they were all constructed with in a
30-year period.
The Umayyad qusour are usually dismissed as "pleasure palaces" or "hunting
lodges," even by prominent scholars (e.g., Cresswell 1969; Hilllenbrand 1982;
Bisheh 1985, 1998). Some scholars of the period are, however, beginning to
argue that these prominent structures were strategic interventions in the
landscape (Addison 2000, Almagro 1992, Arce 2008, King 1992). Spatial
depiction of the co-occurrence of the qusour, trade/ travel routes and perennial
water sources support the notion that the Umayyad dynasty poured resources
into building the qusour for highly functional purposes.
The major political centers of the time were Kufa, Madina and Damascus.
Damascus was the center of the Umayyad caliphate. Kufa and Madina were

2
the centers of opposition to the Umayyads. Therefore the Umayyad caliphs had
good reason to monitor carefully the routes which led to Damascus from these
rival political centers.
Furthermore, the Umayyads established a "fast post" or bar UiUd route between the
Hijaz and Damascus There were two routes that the barid took:
Damascus > Busra > `Amman > Ma'an > Tayma;
Damascus > Busra > `Amman > `Azraq > Wadi Sirhan > Jawf
All of these pass through the "screen" of the qusour – and all of them connect
water sources.
Thus, if someone wanted to reach Damascus from Kufa or the Hijaz, they would
encounter the Umayyad official presence on the way. The Umayyads ensured
the security of this network by placing the qusour in control of water sources. In
an arid landscape water is power – travel routes are essentially connections
between water sources; to control water is to control movement on the
landscape.
Most of these relationships between the qusour and their geographical context
are only hinted at in the historical sources. The argument summarized above
becomes much more powerful when these spatial relationships are represented
and analyzed in GIS.

3
1.2 Background of the study.
The Hashemite Kingdom of Jordan is located between the latitudes 29° and 32°
north, and between longitude 35° and 39°. It is bounded by the Syrian Republic
to the north and Palestine from the west, Saudi Arabia to the south and east,
and Iraq to the east. It has an area 89,000.
The capital of Jordan called Amman. The Desert castles consist of a number of
minor castles distributed over the desert in HJordan H. Most of the remaining
castles are located east of the capital HAmmanH.
Figure 2.1: Jordan in international context
For thousands of years Wadi Sirhan has been a primary trade route from Arabia
into the eastern Mediterranean world (bilad ash-sham), because all the way
along this low depression in the landscape there are perennial water sources
(Parker 1987). At the north northwest end of Wadi Sirhan was the Azraq oasis;
at the south end is the oasis of al-Jauf. Travelers would come from Kufa and
Madina to al-Jauf, water their animals and stock up with water for the journey,

4
then move up through Wadi Sirhan to `Azraq where they would rest again
before continuing the journey (al-Muqaddisi, quoted in Bisheh, 1998).
`Azraq lies at the southern edge of the harra, the black basalt desert. This
basalt is extremely hot and dry, and impossible to cross on horseback or camel
because of the size and dense cover of the basalt stones. There are no
significant settlements from the Roman or Islamic periods in the harra, and
there are extremely few perennial water sources. Therefore, from `Azraq, the
traveler wanting to reach Damascus had two choices: he could go west toward
the plateau, to the King's Highway and the Hajj route (`Azraq > `Amman >
Busra > Damascus or `Azraq > Al-Hallabat > Busra > Damascus); or he could
go northeast around the eastern edge of the harra, then turning west/ southwest
to arrive at Damascus. In order to have skirted north of `Amman one would
have to pass Al-Hallabat and Umm al-Jimal before reaching Busra (Kennedy,
1983).
Figure 1.2: Harrah.

5
The placement of the sites becomes especially interesting when one looks at
the placement of the qusour in the eastern desert: Tubah, Haranah, Amra,
Azraq and Burqu` effectively surround the outlets from Wadi Sirhan in every
direction. Moreover, the qusour constructed in Bilad ash-Sham during the
Marwanid period without exception control a perennial water source. It would
have been nearly impossible to reach Damascus from the eastern route without
stopping for water at qasr Burqu`, which stands on the very edge of the only
perennial water source for hundreds of kilometers (King, 1992).
Wadi Sirhan is the name of a wadi (valley) that runs southeast from the ancient
site of Al-Azrak in eastern Jordan that eventually crosses the border into Saudi
Arabia and ends at the wells of Maybuu. It is about 140 km in length, and 5-18
kilometers (13-11) miles wide. (Encyclopedia of Islam).

6
Figure 1.3: Wadi Sirhan.
1.2.1 Qasr Tubah & Mushatta.
Qasr Tubah and qasr Mushatta were both built under Walid II ibn Yazid in the
mid-700's – at any rate before Walid II died in 744.
They grouped together because they are unusual architecturally - built of mud
brick with marble details, rather than limestone – and with much more
imaginative structural design – and because they are both the latest Umayyad
qusour and both were left unfinished.
7
Qasr Tubah was probably earlier, because it was more complete when it was
abandoned. It sits in the bottom of Wadi Ghadaf, one of the access routes from
Wadi Sirhan onto the plateau. Qast Tubah has three enormously deep wells,
large pools for watering livestock, and complex water-raising systems unusual
for the time period.
It seems likely that qasr Tubah was placed on Wadi Ghadaf late in the
construction of the Umayyad system, because as the other qusour were built
the traveller would have had to depart from Wadi Sirhan further and further
south to escape being detected by the network. Wadi Ghadaf is the latest and
southernmost of the network around Wadi Sirhan.
Qasr Mushatta is located on a hill between qasr al-Qastal and qasr al-
Muwaqqar, placing it within the line-of-site communication network.
It has at least 30 cisterns associated with it, and seems to have had a system of
pools and elaborate pipes – these may have been intended for a bath complex,
but we will never know, since the qasr was left unfinished.
It is important to note that the "patrol" network of the Umayyad qusour would be
complete without qasr Mushatta.

8
Figure 1.4: Qasr Tubah.
Figure 1.5: Location of Qasr Tubah and the well at wadi Ghataf.

9
Figure 1.6: Well of qasr Tuba.
Figure 1.7: Qasr Mushatta.
1.2.2 Qasr Haranah.
Haranah is the earliest of the Desert Castles, built in the Sufyanid Umayyad
period (between AD 661-685). it is very different in architectural style and
function from the other qusour (it is built more like a fortified khan than a

10
palace), and it does not have the water infrastructure that the other qusour
have.
It was, however, used during the Marwanid Umayyad period (685-750) – we
know this because there is a very early Kufic inscription in one of the reception
rooms which refers to a governor of the Jund al-Balqa` who served under `Abd
al-Malik. It is clear, however, that Haranah was never intended for permanent
residence.
What Haranah has shares in common with the Marwanid qusour is its position
monitoring a wadi (Wadi Dab3a) which is an outlet from Wadi Sirhan via Wadi
Ghadaf. It is also in line-of-sight communication with Muwaqqar, to the east,
and Qusayr `Amra's watchtower to the northeast.
Although Haranah was built earlier, it was incorporated into the network of
Desert Castles designed by the Marwanid Umayyads.
Figure 1.8: Qasr Harranah.

11
Figure 1.9: Location of qasr Haranah between two wadis.
1.2.3 Qasr Burqu.
We believe that Burqu` was built in 708, because there is an inscription to that
effect at the qasr – it was reconstructed and improved from an old Byzantine
building. It is built exactly on a lake which is still the only year-round watering
place in eastern Jordan for migratory birds. In fact, the northwest-facing wall of
the qasr actually disappears into the lake.
It is thought that Walid I built it because it is clearly part of the network patrolling
the outlets from Wadi Sirhan, and Walid I was in charge of that region in 708,
during his father `Abd al-Malik's reign when Burqu` was built.

12
Figure 1.10: Qasr Burqu.
Figure 1.11: Location of qasr Burqu at the lake.
1.2.4 Qasr Jabal Sais.
There were two water points on the edge of the harra between `Azraq and
Damascus: Burqu` and Jabal Sais. Walid ibn `Abd al-Malik (Walid I) seems to
have constructed both of them. We believe that Burqu` was built in 708,

13
because there is an inscription to that effect at the qasr – it was reconstructed
and improved from an old Byzantine building. Jabal Sais was probably built
later – it is an original building constructed in that place on purpose, no doubt to
guard the lake. Because of the style of construction, it appears to be later,
when the Umayyad buildings took on a typical form. It is thought that Walid I
built it because it is clearly part of the network patrolling the outlets from Wadi
Sirhan, and Walid I was in charge of that region during his father's reign (when
Burqu` -- and probably Jabal Sais) were built.
Notice the volcano just to the left (northwest) of the qasr. Typically the eruption
of volcanoes opens springs – cracks and faults which allow underground water
to escape to the surface. It is clear that two lakes were so formed -- just
northwest and just southeast of the volcano, where there are massive silt
deposits.
Figure 1.12: Qasr Jabal Sais.

14
Figure 1.13: Location of qasr Jabal Sais, volcano and two lakes.
As the water table has dropped all over the Middle East in recent decades,
these lakes and springs recede. If you look due east of the volcano, you will
see a modern reservoir which is now harvesting water. Between the lake and
the modern reservoir is an earlier (but modern) reservoir, now dry. It isn't clear
why the reservoir has been moved – the bottom of the dry lake shows a lower
elevation than the two reservoirs. Maybe they were just moved because they
are more accessible from the marrab from the harra. I suspect, however, that
as the water table has dropped, the springs which feed the reservoirs are
dropping, too.
The main point is this: Jabal Sais and qasr Burqu were the only perennial water
sources on the edge of the harra on the route to Damascus: if someone was
trying to reach Damascus (the capital of Umayyad power) from Kufa or Madina
through Wadi Sirhan, they would have to skirt the edge of the harra – and they
would need to use these water points. So the Umayyad's built qusour there.

15
Furthermore, if someone tried to come from Kufa (where the main opposition to
the Umayyads was based) around Wadi Sirhan and `Azraq, they would have to
come past Burqu` for water – because it would be the first water source for
hundreds of miles.
1.2.5 Qusayr Amra.
Usually it is called "qusayr" – little qasr – because it is not a fort or palace.
Qusayr `Amra is a reception hall and bath-house situated in the main
watercourse of Wadi Butm, The baths are in the traditional Hellenistic style,
with a cold room, tepidarium and calderium. They are conceived in a rather
personal, miniature scale – apparently intended for two people, as there are two
small seating alcoves in the calderium.
Qusayr `Amra is best known for the dramatic and lively frescoes which cover
every centimeter of its interior. In the main reception hall these combine
sporting and leisure themes with royal themes. In fact, the western wall is
dominated by a portrait of six kings extending their hands in a traditional gesture
of obeisance. The six kings portrayed are precisely those who were defeated
during the reign of Walid ibn `Abd al-Malik. This is how the qasr has been
dated quite precisely to 714-715 AD.
As noted, the qasr was constructed in the very flow of the watercourse –
presumably in order to take full advantage of seasonal water which is still
relatively close to the surface. There is a flood-wall protecting the qasr from the

16
brief but powerful seasonal flash floods typical to the region. Just outside the
qasr doors is a very deep well which once fed the baths. Though the
surrounding landscape is harsh hammada, even today the long line of "butm"
trees (Pistacia atlantica) is visible in satellite images of eastern Jordan – the
main thread of trees extends 11km up Wadi Butm, still tracing out the deep flow
of underground water. Thus the baths at `Amra could be supplied year-round.
On the ridge just a few hundred meters northwest of `Amra are the ruins of a
watchtower and a small garrison. Whereas the qasr is elegantly constructed
and remains in beautiful condition today – it's frescoes and mosaic floors still
amazingly well preserved – the garrison and watchtower were of humbler
construction, and have never been restored. However, even a modest
watchtower set on this ridge would have been visible from qasr Haranah to the
south.
Figure 1.14: Qusayr Amra.
17
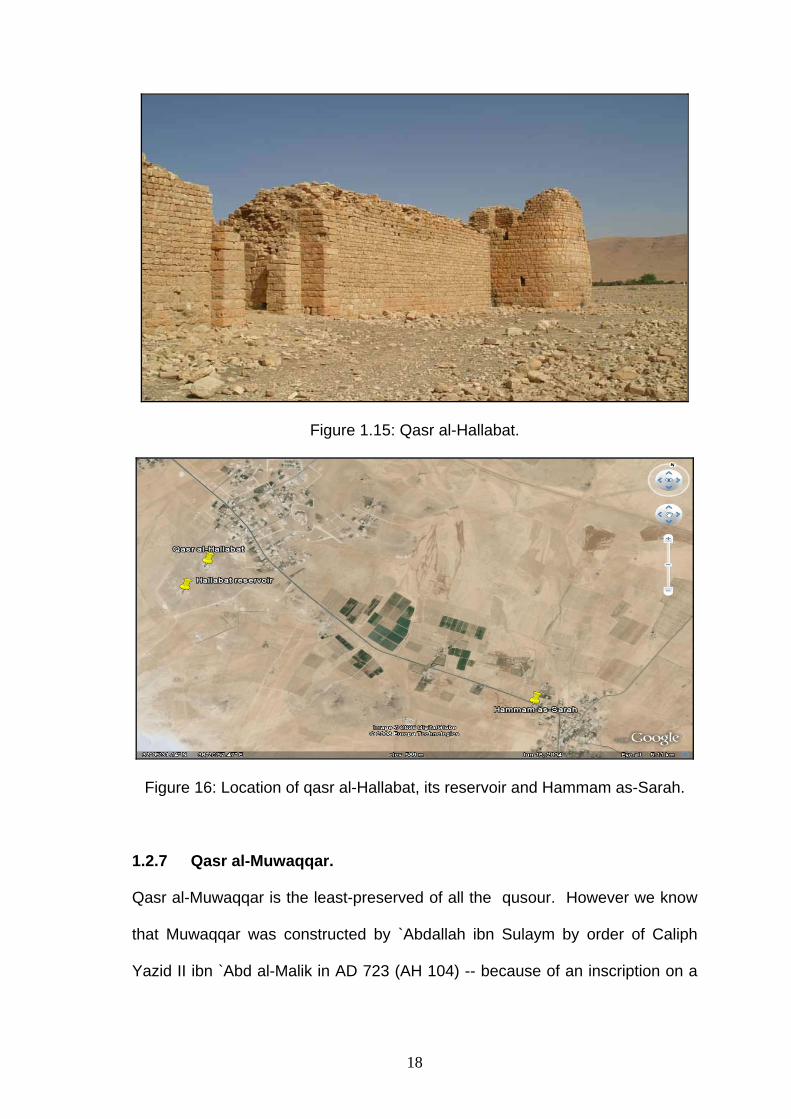
1.2.6 Qasr al-Hallabat.
qasr al-Hallabat was originally a Roman fort constructed to the 2nd or 3rd century
AD. It was rebuilt under the Umayyad Caliph Hisham ibn `Abd al-Malik.
The qasr includes the important elements of:
a. It is located in an area of numerous springs and water sources.
b. The qasr includes a complicated water system, huge reservoir, at least
five large cisterns and an elaborate bath complex (Hammam as-Sarah) –
again, this is all richly decorated, displaying the Umayyad celebration of
their water infrastructure and their control over water resources.
c. It is situated on the top of a mountain which overlooks a broad area to
the southeast towards `Azraq, from which travelers would be observable
for many kilometers approaching the plateau and the Amman-Bosra-
Damascus road.
18
Figure 1.15: Qasr al-Hallabat.
Figure 16: Location of qasr al-Hallabat, its reservoir and Hammam as-Sarah.
1.2.7 Qasr al-Muwaqqar.
Qasr al-Muwaqqar is the least-preserved of all the qusour. However we know
that Muwaqqar was constructed by `Abdallah ibn Sulaym by order of Caliph
Yazid II ibn `Abd al-Malik in AD 723 (AH 104) -- because of an inscription on a

19
huge, beautifully carved capital on the top of the water gauge-column in the
qasr's reservoir.
We don't know that much about the qasr, but it fits into the network of the other
qusour for the following reasons:
a. The importance placed on the water infrastructure (the dedication of a
structure is usually placed in a position of importance to the founder).
b. The number of cisterns (at least 18 still remaining) and the large
reservoir.
c. Its position in line-of-sight communication with Qastal & Mushatta to the
west and Haranah to the east.
d. Muwaqqar is actually visible at dusk on a clear day as far away as
Thuleithewat – which means it would have been visible to anyone
travelling out of Wadi Sirhan toward `Azraq or the plateau.
1.2.8 Azraq.
We don't know exactly what was built at `Azraq. What we do know is that a
huge reservoir was there, as well as some strange, decorated pools and
channels. Based on basalt carvings from `Azraq and some of the paintings at
20
`Amra it seems perhaps that an Umayyad official or prince or caliph some kind
of "water park" at `Azraq, for water sports. There were also large, wealthy
Umayyad farms with substantial houses around `Azraq. More importantly, we
know that `Azraq was the 3rd largest wetlands in southwest Asia. The journey
from the Jauf oasis in Arabia into Bilad ash-Sham ended at `Azraq, where
travelers could rest and replenish their supplies and water their livestock.
What is also interesting is that the Roman and Byzantine armies fortified `Azraq:
they saw `Azraq and the western rim of Wadi Sirhan as the outer edge of the
Roman frontier (the limes exterior). The Umayyads did not fortify it – and they
seem not to have re-used the old Roman fortifications. The Umayyads saw
Wadi Sirhan – and of course the oases at Jauf and `Azraq – as the central
corridor of the Islamic world: the conduit between Arabia, Iraq and Syria (al-
Madina, Kufa and Damascus). So instead of "protecting themselves from the
barbarians" as the Romans did, they used `Azraq for recreation, rest and
relaxation – and they patrolled the traffic that went beyond `Azraq. So the
Umayyad installations do not fortify: they "monitor" – there is no way out of
`Azraq that is not patrolled by an Umayyad qasr.
As discussed before, `Azraq lies on the edge of the black desert, or harra,
which cannot be traversed "off road" (even now with a 4WD vehicle it is difficult
or impossible) – the black lava boulders cover the sand, very close together,
and it is extremely hazardous to cross by horse or camel. Walking is slow. The
black desert is the result of volcanic eruptions from the Hauran in Syria, and
small, extinct volcanoes continue down into what is today Jordan – some are

21
visible from `Azraq. Thus it was not possible to reach Damascus quickly (or
without being detected) unless one circumnavigated the harra.
But even so, one needed water. Thus all the water points on routes leading out
of `Azraq are patrolled by an Umayyad qasr: Qusayr `Amra watches Wadi
Butm, leading south and west out of the Qa` al-Shaumari. Across the
hammada, or limestone-chert desert to the northwest, one passed qasr al-
Hallabat and its associated springs. Then the way was blocked by the black
desert from the northwest to northeast. If one attempted to pass east around
the harra, there were qasr Burqu` on Lake Burqu` and qasr Jabal al-Sais on its
volcanic lake.
Figure 1.17: Qasr Azraq.

22
Figure 1.18: Locations of qasr Azraq, Jabal Sais and Burqu around the Harrah.
.
1.2.9 Qasr al-Qastal.
Qasr al-Qastal is part of a larger complex which included the qasr, a small and
elaborate mosque, an extensive water system and probably a bath complex.
There is also a very early Islamic cemetery there, some of whose headstones
bear the earliest known examples of Kufic script. The minaret of Qastal's
mosque is the oldest existing minaret in the world.
Qasr al-Qastal may have been built under the patronage of Yazid II ibn `Abd al-
Malik, who ruled from AD 720-724. This assumption is based on two quotes
from the poet Kuthayyir bin `Abd al-Rahman `Azza (AH24-105/ AD644-723),
found in a panegyric in praise of Yazid II (Bisheh, 2000) The style of
construction and ornamentation on the qasr is also remarkably like what is
found at the qusour of Muwaqqar and Amman, also built under the patronage of

23
Yazid II. Since `Azza died in 723, the qasr must have been constructed before
then. Certain details of the mosque construction suggest a date after AD 708.
It is likely that the complex was begun earlier than the reign of Yazid II, as it
could not have been completed in only three years, and it was impressive
enough when it was built to have been mentioned by `Azza before 723.
The qasr was enormous (70x70m) and solidly built of ashlar-cut limestone. The
stone was ornately carved; interior walls were covered with frescoed plaster and
rich mosaics on both walls and floors, like qasr al-Hallabat, Qastal also had an
elegant bath complex situated nearby. The baths' mosaics and marble-tiled
floors, frescoed walls and carved stone are even richer than the qasr((Bisheh,
2000) .The baths complex is remarkably similar to the "little palace," or "Qusayr"
`Amra.
All that remains of the original mosque is part of its minaret and west wall. It is
also possible that a cistern in the former forecourt supplied an ablution fountain
or pool. A19th century British traveler drew the minaret at Qastal and described
the building's "perfection" and the marble columns and carved capitals that
flanked the mihrab (Tristram, 1873).
Today, however, nothing remains of the original mihrab or prayer hall. The
minaret is built of the same stone and mortars as the qasr, and what remains is
beautifully constructed and carved as well. The minaret is significant because it
is accessed from the courtyard by a beautifully constructed spiral staircase
which is the core of the construction. This internal staircase means that it was

24
constructed as a minaret, for the call to prayer – as opposed to being adapted
from a church tower (Addison, 2000).
Maybe the most interesting thing about Qastal is its water infrastructure. The
qasr was built with a careful and skillfully constructed roof catchment system:
set into each join between buttress towers and the qasr wall are ceramic pipes
which conduct water into cisterns which are built into the foundations. The
forecourt of the qasr was some 50x70m of cream-colored mosaic pavement,
and at the northeast corner was a reflecting pool and pavilion. The low wall
around the pool was stuccoed and painted with frescoes. There is evidence to
suggest that there was a matching pool and pavilion at the southeast corner of
the forecourt.
The qasr is built on limestone that is naturally bubbled with caves of various
sizes. These caves were turned into sturdily constructed cisterns with three
layers of plaster lining – much of which was found intact in excavations between
1998-2001. Surrounding the qasr six of these cisterns were excavated to reveal
a system of channels and filters linking them to a spring on the top of the hill
above the qasr. Surrounding Qastal, within an area 2km2, are over 70 cisterns.
Under the central courtyard of the qasr is a huge cistern, which once held over
1000 m3. This cistern was also fed by roof & hardscape catchment. It was
accessed through a carved and decorated mouth at the center of the courtyard,
but also at least one marble-lined stairwell in the southwest corner of the
courtyard. Over the entrance to the cistern is a beautiful shell-niche with an
intricately carved arch over it.
25
Qastal had three large reservoirs, which together held over 10,000m3 (see
Google Earth image). One of these appears to have been associated with the
baths. The qasr looked out over a lake which was formed behind a 400m+
dam, holding water from Wadi al-Qastal, which ran from west to east below the
north side of the qasr and mosque complex. The dam was strongly constructed
– more than four meters thick and equipped with large spill pipes constructed
hollowed from solid chunks of marble. Also on Wadi al-Qastal is another,
smaller dam – the remains are 24m long, but they are not complete. In what
was probably the center of this dam are double sluice-gates, again carved
carefully and ornamentally from limestone. It appears that this dam, which runs
from NW > SE almost parallel to the wadi course, held runoff from the slopes to
the southwest, which was then released through the sluice-gates into Wadi al-
Qastal.
The whole complex was built precisely on the famous hajj, or pilgrimage road.
qasr al-Qastal was in line of site communication with Muwaqqar and – later –
Mushatta. It seems likely that Qastal was built earlier than Muwaqqar, on this
main traffic route (the hajj road). Then Muwaqqar was situated so as to link
communications between `Amra/ Haranah and Qastal.
The water infrastructure at Qastal was fabulous, and it is clear that its builder
wanted to display the water. There is also the question of why so much water
was being captured – far, far more than was necessary for the size of
settlement at Qastal. It is likely that it was expected that travellers would stop at

26
Qastal, water their livestock, and register their presence with officials there.
Once again, the control of water corresponded with control of travel routes.
Figure 1.18: Locations of qasr al-Qastal , reservoirs,dams, masjid and paths.
1.2.10 Hammam as_Sarah.
Its complex bath consists of 3 principal elements: The Audience Hall, The Bath
Complex, and The Hydraulic Structures. The audience-hall is roofed by 3
tunnel-vaults resting on the sidewall and two intermediate transverse arches.
The northeastern corner of this hall had a fountain, which received its water
from an elevated tank to the east. The bath proper consists of 3 rooms
corresponding to the cold, warm, and hot rooms.

27
1.3 The Qusour of Bilad-ash-Sham.
TABLE 1.1: List of qusour of Bilad-ash-Sham in order of construction.
Qusour Name Period
Haranah Sufyanid, but used into (661-683) the Umayyad period
Azraq continuous settlement from Roman period – or earlier – to
resent
(Jerusalem - `Abd al-Malik ibn Marwan) 685-705
Jabal Sais Walid I ibn `Abd al-Malik 705-715
Burqu Walid I ibn `Abd al-Malik 705-715
`Amra Walid I ibn `Abd al-Malik 705-715
Ramlah Suleiman ibn `Abd al-Malik 716-717
Qastal Yazid II ibn `Abd al-Malik 721-724
`Amman Yazid II ibn `Abd al-Malik 721-724
Muwaqqar Yazid II ibn `Abd al-Malik 721-724
Hallabat Hisham ibn `Abd al-Malik 724-743
Mushatta Walid II ibn `Abd al-Malik 743-744
Tubah Walid II ibn `Abd al-Malik 743-744
Umm al-Walid Unknown
.

28
1.4 Thesis statement.
The Umayyad qusour are monumental structures built during the reign of the
first caliphate of Islam. The Umayyad qusour are usually dismissed as "pleasure
palaces" or "hunting lodges," even by prominent scholars (e.g., Cresswell 1969;
Hilllenbrand 1982; Bisheh 1985, 1998). Some scholars of the period are,
however, beginning to argue that these prominent structures were strategic
interventions in the landscape (Addison 2000, Almagro 1992, Arce 2008, King
1992). This study states that the Umayyad “Desert Castles” were built
strategically at perennial water sources in order to monitor routes of
transhumance amongst the socio-political centers of the period.
1.5 Significance.
Historical: It has long been thought that the desert castles, or qusour, were
merely elaborate hunting lodges or pleasure palaces isolated in the desert.
However, the Umayyad dynasty invested an unprecedented amount of money
and resources into these structures. This argument shows that the desert
castles had practical and political significance for the Umayyad regime.
Methodological (1): Until now, historians have relied mainly on textual,
architectural and art-historical analyses of the qusour in order to understand
Umayyad state architecture. This argument uses spatial analysis to lend a new
dimension to the discussion. Using spatial analysis the structures are treated
not as individual archaeological exempla, but as a system.

29
Methodological (2): Until now GIS has typically been employed for the social
sciences, environmental and engineering disciplines. This argument uses GIS
to shed light on a research problem in the humanities.
1.6 Objectives.
The objective of the study is to construct a geo-database and digital map of the
Umayyad qusour in their geographical context, and to use the resulting
database and map to conduct a visualization and spatial analysis of the
distribution of the qusour.
1.7 Research questions.
I. How to construct a geo-database and digital map of the Umayyad qusour?
II. How to conduct a visualization and spatial analysis of the distribution of the
qusour?
1.8 Hypothesis
I. There are significant patterns in the locations of the Umayyad qusour.
II. There is unobstructed line-of-sight communication between each qasr
and its neighboring qasr, among the group located west of Harrah.
30
III. There is a quantifiable relationship between the qusour, perennial water
sources, and established trade and courier routes.
IV. These patterns suggest strategic placement of the qusour (vs. merely
ornamental or recreational constructions).
1.9 Scope and Limitations of Study
I. This study includes only the qusour known as the Desert Castles (Tubah,
Hallabat, `Amra, `Azraq, Burqu`, Muwaqqar, Harranah, Mushatta, Umm
al-Walid, Jabal Sais and Qastal).
II. Because a high resolution DEM was unavailable from the Royal
Jordanian Geographical Society, a low resolution DEM from a free
internet resource will be utilized in this study.
1.10 Thesis Layout This thesis is divided into six chapters. The first chapter is an introduction which
includes the Background of the Study, introduction to the qusour of the Bilad
ash-Sham, Thesis Layout, Thesis statement, Significance, Objectives,
Research questions, Hypothesis and Scope and Limitations of Study. The
second chapter includes the Literature Review, highlights Archaeological
Research, Spatial Analysis and Computing in the Discipline of History,

31
Geographical Information Systems in Historical Research, GIS in Cultural
History, GIS and Spatial Analysis, and Buffering. The third chapter is the
research methodology: it discusses Methodological Application, What is GIS?,
Components of a GIS, Data Capture, Building a Geodatabase, Database,
Relational Database Model and Database design. The fourth chapter is the
analysis; it discusses Visualization, Proximity Analysis, Exploratory Digital
Mapping, Line-of-sight Communication and Point Pattern Analysis. The fifth
chapter discusses the results of the study: Digital Mapping and Geodatabase,
Exploratory Digital Map, Line-of-sight Communication and the results of the
Quadrant Count Method. The sixth chapter includes the Research Discussion,
Conclusion and Recommendations.

32
CHAPTER TWO LITERATURE REVIEW
2.1 Archaeological Research
Although the researcher has for many years been interested in the Umayyad
qusour, during the period of May-June 2008 he was fortunate to have access to
three scholars of the Umayyad period in Jordan: Dr. Ghazi Bisheh (former
Director General of the Department of Antiquities of Jordan), Dr. Ignacio Arce
(of the Spanish Archaeological Mission), and Dr. Erin Addison (former Director
of the Qastal Conservation & Development Project). These scholars were kind
enough to direct me to articles and books on the Umayyad qusour (see
References), as well as guiding me to visit the sites themselves. So the basic
data for this study came from historical research on the qusour themselves, and
from site visits. In the process of the site visits the researcher gathered the data
to use in the spatial analysis.
2.2 Spatial Analysis and Computing in the discipline of history
Historians (and other scholars in the humanities) have a documented reluctance
to use computers in their research. O. Boonstra, et al., claim that :
“if we look back at what ‘history and computing’ has accomplished, the results
are slightly disappointing. They are not disappointing because ‘computing’ failed
to do what it intended to do, which was to provide ‘history’ with computerised
tools and methods historians could use to expand the possibilities and to im-

33
prove the quality of their research, but because ‘history’ failed to acknowledge
many of the tools ‘computing’ had come up with” (2004).
In the United States computers were first incorporated into historical research
by social and economic historians, focusing on computation and quantitative
aspects (Greenstein, 1997). From the 1980s on computing – first in the form of
databases and searchable texts – has become more thoroughly integrated into
the social sciences and historical research (Greenhalgh, 1987). Relational
models and data modeling techniques such as the "Entity Relationship Model"
of Lou Burnard and Charles Harvey, multilevel regression analysis, event
history analysis (Raffalovich et al, 1983) and other, less quantitative techniques
have become widespread. Today, in the 21st century, there are several journals
devoted to computing in the humanities, e.g., History and Computing. In the
1990s the British Library Research Series published a monograph series
devoted to computing in the humanities (Katzen, 1990; Kenna and Ross, 1995;
Mullings, 1996).
While the role of computing in the humanities and social sciences has come far
since the 1960's, "the profession is still divided between the small minority of
historians who uses computers as tools for analysing historical data and the
vast majority who, while they might use a pc for wordprocessing, remain
unconvinced of the case that it can become a methodological asset.’ (Speck,
1994). Since GIS is primarily a methodological tool, its role in historical
research is still far behind the role that it is performing in other disciplines.

34
2.3 Geographical Information Systems in Historical Research
So far, only limited uses of spatial statistical techniques have been made by
historians. A. K. Knowles' Past Time, Past Place: GIS for Historians was the
first collection of case studies on the application of GIS to historical research.
Except for Knowles, the literature on using GIS for historical applications is
sparse. However, 'Historical GIS' is a term that is now used to describe
approaches to historical research involving the use of GIS (2002, ESRI Press).
In the 1970s and '80s GIS was marketed for its ability to handle complex sets of
spatial information more quickly and more cost-effectively that could humans. In
the words of Michael Goodchild, "although humans have highly developed
visual systems, they are easily misled by optical illusions and unable to perform
the kinds of precise rapid manipulations of data that computers are design for.
The computer seemed much better at the kinds of rigorous and logical analysis
demanded by the scientific method than common researchers" (2000).
An overview of the field in 1994 documented the use of GIS in historical
research in several countries in Europe as well as the U.S. (Goerke, 1994), but
that number has risen dramatically. GIS has improved in visual quality, in its
flexibility in handling data in a variety of formats, and in its availability. "Most
important, the problem of geographic changes over time has been noted by
historians, geographers and information scientists alike." In the 21st century GIS
is most widely used in resources management, utilities management,
telecommunications, urban and regional planning, vehicle routing and parcel

35
delivery, and in all of the sciences that treat problems associated in some way
the surface of the earth. (Boonstra et al, 2004).
Several examples illustrate the growing use of techniques of spatial analysis
GIS in history-related disciplines. In the early 1990s several introductions to
cluster analysis in historical research were published (Bacher, 1989; Boonstra
ea al, 1990). In historiography "cluster analysis" uses geographical information
systems to visualize the results of historical research, and since the 1990s this
ability to visualize information has made the method more appealing to
historians. GIS has also been used to test historical hypotheses about nations
(Obinger et al, 2001), provinces (Delger, 2003), districts (Debuisson, 2001),
municipalities (Boonstra, 2001), parishes (Song, 2002) and households (Galt,
1986) and (Spree, 1997). Nearest neighbor analysis was used in an article by
Vasiliadis and Kobotis use "nearest neighbor anlayisis" to analyze the
distribution of tourism locations in Macedonia in their article in 1999.
In 2001 Ian Gregory, Daniel Dorling and Humphrey Southall published an
analysis of 20th century patterns of poverty in England and Wales. The data
was drawn from census records. Their study tried to distinguish between
patterns of real change in income vs. apparent change that actually results from
changing administrative areas and means of collecting and publishing census
data. In order to deal with the mechanical changes, they "interpolate data
published for a variety of mosaics of spatial units onto a single set of
administrative units. Once on a common geography, it is possible to compare

36
patterns on different dates using a combination of simple statistics and
sophisticated visualizations" (Gregory et al, 2001).
Because it integrates spatial and attribute components of geographical
information, GIS becomes a powerful tool in historiographical methodology.
GIS can analyze the information in traditional historical texts describing places,
and from other forms of historical geographical investigation (e.g., historical
topography). Bertrum MacDonald and Fiona Black’s work on the spread of print
culture demonstrates the importance of spatial analysis in historical research.
Their argument is that print culture spread across continents and oceans as a
result of the interaction of a complex set of spatially distributed variables, and
that the diffusion of new reading practices can be modeled using spatial
analysis (MacDonald et al, 2000).
2.4 GIS in Cultural History
Research problems in cultural history, however, are different from
socioeconomic questions in that the data is rarely as quantitative. Also, simply,
the deeper past is more obscure than the present or recent past. In the
question of historical sites such as the Umayyad qusour, for example, there is
no textual record of the "intentions" of their builders, nor even of the builders'
names. State patronage is assumed because of the massive richness of the
structures and anchored by a very few textual references to the caliphs'

37
activities. The data to be analyzed in this, as in many such studies, is hardly
quantitative at all – the qusour are exempla, not data.
D.J. Unwin claims that "what is required... is an ability to explicitly incorporate
uncertainty into geographical information" (1995). Commercial GIS software as
yet is awkward at "managing uncertainty." So the researcher is more or less on
his own in figuring out how to make cultural and historical exempla into
quantitative data. As one author says, "history and computing is not only about
historical research, but also about historical resource creation" (Woollard,
1999).
One example of this kind of problem is seen in the study of Bartley and
Campbell regarding land use in medieval England. In the1990s Bartley and
Campbell used GIS to produce a land use classification for medieval England
based on 6,000 records in the Inquisitiones Post Mortem, a detailed record of
information about the estates of deceased landholders. They identified the
records as points on a map of England using a gazetteer of place names. Many
of the points overlapped, so they may have represented large areas with a
variety of land uses; so they then used kernel estimation to construct a raster
grid to overlay the map of England. They then used a weighted ranking to
assign primary and secondary categories of land use to each cell in the grid.
The result is a land use map for medieval England (Bartley et al 1995).
The very expression "historical site" denotes an intersection between space
("site") and time ("historical"). As such, an historical site should be an ideal

38
candidate for analysis by GIS. In this regard it is worthwhile to quote in full the
following paragraph from the study of Chiu, Lee, and Koshak:
“Historical sites are proof of history. They represent interaction between
different cultures throughout history reflecting the social values, economic
situations, and behaviors of a particular time. Documenting historic sites is
important. It preserves information for future generations to learn from the past.
A rich architectural and urban heritage provides future architects and urban
planners and designers with design and planning solutions to various problems.
There are many related documents describe in detail the historical sites’ spatial
structures, characteristics, categories, value of arts, and educational meanings.
However, these documents that use paper-based static media have several
shortcomings. They represent the past historical events for a specific site using
descriptive lists, words, and simple marked maps to display the urban
environment information despite that these historical sites should belong to a
structure of spatial-temporal data. Historical sites interact dynamically with the
place they locate and over time. Using the traditional ways cannot fully describe
the past historical events which occurred, the reasons for their occurrences,
their impact on historical buildings, and the evolution of these historical
buildings. In other words, they lack the capability to represent the meanings and
changes of historical sites in a spatial and temporal manner” (Chiu et al, 2002).
In Past Time, Past Place Knowles asserts that "if we define geography as the
study of spatial differentiation, and history as the study of temporal
differentiation, historical GIS can be defined as the study spatial patterns of

39
change over time" (Knowles, 2002). In the case of the proposed research,
however, the question is posed about the relationships between several
disparate sets of spatial data in the past. It is – just as described by Chiu, et al.
– a matter of describing spatial-temporal data relationships fully in ways that
paper-based media are not capable of doing.
In summary, spatial analysis draws data from archival and archaeological
research and reconfigures it spatially and visually. This reconfiguration not only
makes it easier to draw and demonstrate relationships between phenomena, it
can actually reveal relationships that are invisible in textual description or on the
ground.
2.5 GIS and spatial analysis
The origins of spatial analysis lie in the development in the early1960s of
quantitative geography and regional science and many developments have
taken place ever since (Chou, 1997). Spatial analysis and GIS have enjoyed a
long and productive relationship over the past decades (Goodchild et al, 1992).
GIS has been seen as the key to implementing methods of spatial analysis,
making them more accessible to broad range of users, and hopefully more
widely used in making effective decisions.
GIS is unlike other statistical analysis because tabular data has established
links to maps for visual analysis (Clarke, 1997).Any statistic we can think of to

40
describe the data then automatically has geographic properties and as a result
can be placed on maps for visual processing.
It has been argued that in this sense the relationship between Spatial analysis
and GIS is similar to that relationship between statistics and statistical packages
.Specialized GIS packages directed specifically at spatial analysis have
emerged Bailey & Gatrell(1995). Chou (1997) has discussed the ways in which
implementation of spatial analysis methods in GIS are leading to a new
exploratory emphasis.
2.6 Buffering
The U.S. Government in late 1997 released the results of a twenty year long
study on the effects that large power lines have on neighboring communities
property values. The outcome of this study illustrated that when residential
houses were within 150 m of power lines there was a significant decrease in the
property value of the houses that were located closer to the power line. The
report suggested that communities should take localized action to test whether
or not the findings of this study were applicable to their specific area. If the
findings of the study were found to be similar in the High Rolls/Mountain Park
area the report suggested tax breaks for those individuals that were affected by
the power line. The study also recommended other actions which could be
taken by communities including the rerouting of the existing power line away

41
from the affected area or relocating those households that were within the buffer
zone (Gis.usu, 2008).

42
CHAPTER THREE METHODOLOGY
3.1 Methodological application
The spread of geographic information science and systems (GIS) have
prompted researchers in many areas to review the methods of conducting
research or problem-solving process. GIS tools have enabled users to
effectively capture, management, analysis and presentation their geographically
referenced data. With GIS, researchers can now process larger volumes of data
within a shorter time and with greater precision. Furthermore, similar analytical
processes can be easily repeated for different data sets. What used to be labor-
intensive tasks are now often performed within minutes or even seconds with
computers. Researchers are less likely to be limited by computation time. They
do not need to avoid working with large volumes of data when they explore new
ways of processing data. As a result, new approaches to exploring spatial and
non spatial data have been developed to execute processes that once were
only dreamed of. The commercialization of GIS technology also elevated the
uses of GIS to a higher level than ever before. With packaged computer
programs available to everyone at a reasonable cost, mapping complex
geographic data and overlaying thematic data layers for site selections have
become routine tasks that can be performed even by novice GIS users (Lee et
al, 2001).
One important characteristic that separates GIS from other information systems
is their ability to handle spatial data. Spatial data are sensitive to scales and to

43
the way they are measured (scales of measurement). A qasr or lake is only a
point on a large scale. The same qasr, however, occupies an entire sheet of
map when all of its rooms, corridors, squares, plazas and paths, and so on are
displayed in detail, become an areal phenomenon when it is mapped at a local
scale. The ability to manage geographic objects across different scales has
made GIS valuable tools for many research fields and applications.
Another characteristic that makes spatial data unique is that location information
is embedded in the observations. In addition to the attributes describing the
characteristics of the observations (geographic features), locations of features
can be extracted from the data and analyzed. GIS are valuable tools to
accomplish this (Lee et al, 2001).
3.2 What is GIS?
A definition quoted in William Huxhold's Introduction to Urban Geographic
Information Systems.
“The purpose of a traditional GIS is first and foremost spatial analysis.
Therefore, capabilities may have limited data capture and cartographic output.
Capabilities of analyses typically support decision making for specific projects
and/or limited geographic areas. The map data-base characteristics (accuracy,
continuity, completeness, etc) are typically appropriate for small-scale map
output. Vector and raster data interfaces may be available. However, topology

44
is usually the sole underlying data structure for spatial analyses." (William. H,
1991).
Dana Tomlin's defined GIS as:
A geographic information system is a facility for preparing, presenting, and
interpreting facts that pertain to the surface of the earth. This is a broad
definition, a considerably narrower definition, however, is more often employed.
In common parlance, a geographic information system or GIS is a configuration
of computer hardware and software specifically designed for the acquisition,
maintenance, and use of cartographic data. ( Dana, 1990).
Jeffrey Star and John Estes say:
A geographic information system (GIS) is an information system that is
designed to work with data referenced by spatial or geographic coordinates. In
other words, a GIS is both a database system with specific capabilities for
spatially-reference data, as well as a set of operations for working with data. In
a sense, a GIS may be thought of as a higher-order map. (Jeffrey .S, and John
E, 1990).
And from ESRI:
A GIS is "an organized collection of computer hardware, software, geographic
data, and personnel designed to efficiently capture, store, update, manipulate,
analyze, and display all forms of geographically referenced information."(1990).

45
3.3 Components of a GIS
According to HDr. Helmut KraenzleH, A GIS can be divided into five components:
People, Data, Hardware, Software, and Procedures. All of these elements need
to be in balance for the system to be successful. No one part can run without
the other.
3.3.1 People The people are the element who actually makes the GIS work. They include a
plethora of positions including GIS managers, database administrators,
application specialists, systems analysts, and programmers. They are
responsible for maintenance of the geographic database and provide technical
support. People also need to be knowledgeable to make decisions on what
type of system to use. People related with a GIS can be categorized into:
viewers, general users, and GIS specialists.
A. Viewers are the public at large whose only need is to browse a
geographic database for referential material. These constitute the largest
class of users.
B. General Users are people who use GIS to conducting business,
performing professional services, and making decisions. They include
facility managers, resource managers, planners, scientists, engineers,
lawyers, business entrepreneurs, etc.

46
C. GIS specialists are the people who make the GIS work. They include
GIS managers, database administrators, application specialists, systems
analysts, and programmers. They are responsible for the maintenance
of the geographic database and the provision of technical support to the
other two classes of users.
3.3.2 Procedures
Procedures involved how the data will be retrieved, input into the system,
stored, managed, transformed, analyzed, and finally presented in a final output.
The procedures are the step taken to answer the question needs to be
resolved. The ability of a GIS to perform spatial analysis and answer these
questions is what differentiates this type of system from any other information
systems. The transformation processes includes such duties as adjusting the
coordinate system, setting a projection, correcting any digitized errors in a data
set, and converting data from vector to raster or raster to vector.
3.3.3 Hardware
Hardware consists of the technical equipment needed to run a GIS including a
computer system with enough power to run the software, enough memory to
store large amounts of data, and input and output devices such as scanners,
digitizers, GPS data loggers, media disks, and printers.
47
3.3.4 Software
There are many different GIS software packages available today. All packages
must be capable of data input, storage, management, transformation, analysis,
and output, but the appearance, methods, resources, and ease of use of the
various systems may be very different. Today’s software packages are capable
of allowing both graphical and descriptive data to be stored in a single
database, known as the object-relational model. Before this innovation, the
geo-relational model was used. In this model, graphical and descriptive data
sets were handled separately. ARC GIS 9.2 and Global Mapper 7 were used in
this study.
3.3.5 Data
Perhaps the most time consuming and costly aspect of initiating a GIS is
creating a database. There are several things to consider before acquiring
geographic data. It is crucial to check the quality of the data before obtaining it.
Errors in the data set can put in many unpleasant and costly hours to
implementing a GIS and the results and conclusions of the GIS analysis most
likely will be wrong.
There are several guidelines to look at include:
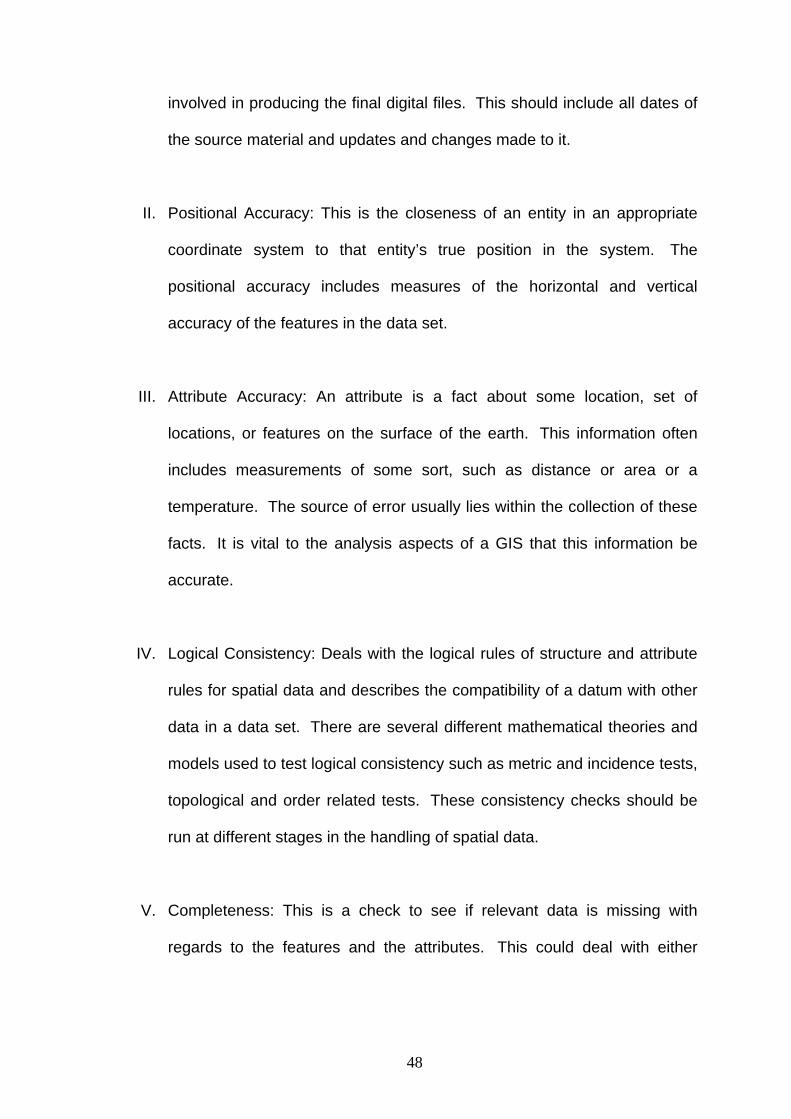
I. Lineage: This is a description of the source material from which the data
were derived, and the methods of derivation, including all transformations
48
involved in producing the final digital files. This should include all dates of
the source material and updates and changes made to it.
II. Positional Accuracy: This is the closeness of an entity in an appropriate
coordinate system to that entity’s true position in the system. The
positional accuracy includes measures of the horizontal and vertical
accuracy of the features in the data set.
III. Attribute Accuracy: An attribute is a fact about some location, set of
locations, or features on the surface of the earth. This information often
includes measurements of some sort, such as distance or area or a
temperature. The source of error usually lies within the collection of these
facts. It is vital to the analysis aspects of a GIS that this information be
accurate.
IV. Logical Consistency: Deals with the logical rules of structure and attribute
rules for spatial data and describes the compatibility of a datum with other
data in a data set. There are several different mathematical theories and
models used to test logical consistency such as metric and incidence tests,
topological and order related tests. These consistency checks should be
run at different stages in the handling of spatial data.
V. Completeness: This is a check to see if relevant data is missing with
regards to the features and the attributes. This could deal with either

49
omission errors or spatial rules such as minimum width or area that may
limit the information.
GIS
Data
Procedure
People
Software
Hardware
Figure3.1: Components of GIS.
3.4 Data Capture
Data input to a geographical information system can be best broken into three
categories: entering the spatial data, entering non-spatial data, and linking the
two together. Entering the spatial data can be done in many ways. Spatial data
can be acquired from existing data in digital or paper form, or it can be collected
from scratch or using GPS.

50
In this study were used two types of data; spatial data and non spatial data.
3.4.1 Spatial data
a) Satellite images; obtained from Google Earth for the entire study area
with Geographic Coordinate System: GCS_WGS_1984, Datum:
D_WGS_1984, Prime Meridian: Greenwich and Angular Unit is Degree.
b) A digital elevation model (DEM) is a HdigitalH representation of ground
HsurfaceH or Hterrain H heights. Usually X, Y and Z locations It is also as a
digital terrain model (DTM). It’s three dimensional representations, a
DEM can be represented as a Htriangular irregular network H (TIN) or as a
HrasterH .DEMs are generally built using Hremote sensingH techniques or can
be also built from land HsurveyingH. The U.S. Geological Survey (USGS)
produces many types of elevation data, such as: 7.5-minute DEM, 15-
minute Alaska DEM, 1-degree DEM, 7.5-minute Alaska DEM, and. 30-
minute DEM. Digital elevation Model for this study was obtained from
International Centre for Tropical Agriculture (CIAT) the data in ARC
GRID, ARC ASCII and Geotiff format, in decimal degrees and datum
WGS84. With accuracy 90m, they are derived from the USGS/NASA
SRTM data (Jarvis et al, 2006).
c) Documentation of the location of routes of transhumance, obtained from
historian researcher’s studies, like. Kennedy, MacAdam, etc...
d) Direct measurement using GPS. The GPS device which used in this
study is eTrex® from Garmin , it was used to capture the locations of the

51
qusour, the sources of water and Wadis. with Geographic Coordinate
System: GCS_WGS_1984, Datum: D_WGS_1984, Prime Meridian:
Greenwich and Angular Unit is Degree.
3.4.1.1 Global Positioning System (GPS)
The GPS is a collection of 24 well-spaced satellites that orbit the Earth,
developed by the HUnited States Department of Defense H. and allowed for people
with ground receivers to get their geographic location, the time, and their
velocity. The location accuracy is anyplace within 10 and 100 meters for most
equipment. To get better Accuracy within one meter need a special military
approved. GPS equipment is extensively used in science and for general use
around the world, and has now become adequately low cost.
Four methods were used in this study to represent the Real world in building the
digital map for the Ummayad qusour:
3.4.1.2 Point feature
Points are zero dimensional objects which have locations and attribute
information but are too small to be represented as areas. For example: the
qusour and source of water.

52
3.4.1.3 Line feature
Lines are one dimensional object which have length but no area. Each line must
begin and end at a node. For example the transhumance routes.
3.4.1.4 Arial feature
Polygons are closed mathematical figures of any shape or size. They are
formed by a series of connected lines. For example: Harrah and Wadi-Sarhan
3.4.1.5 Triangulated Irregular Network (TIN)
A data model typically used to represent terrain heights, usually X, Y and Z
locations for measured points are entered into the model. It’s three dimensional
representations. For example DEM.
Figure 3.2: DEM for the study area using Global Mapper7.

53
3.4.1.6 Projection and Rectification
In order for the spatial data of a 3-dimensional earth to be represented in a 2-
dimensional GIS, the data must make use of one of the various projection
methods Because different projections place the same special entities on
different coordinates on the flat surface, it is very important that a projection be
set for the specific data set being used. One of the main features of a GIS is
the ability to overlap different data layers for better analysis. These different
layers must have the same projection, datum, and reference ellipsoid so that all
coordinates are lined up correctly. Therefore the researcher converts the
projection of the data into Palestine Grid Projection, this done by using the utility
of The Middle East Map Reprojection (Reproject, 2008).
3.4.1.7 Palestine Grid Projection
Most of the Jordanian local maps used Palestine Grid Projection, in order to
match the maps in the region, this study used Palestine Grid Projection.
TABLE 3.1: Parameters of Palestine Grid Projection.
Projected Coordinate System: Palestine_1923_Palestine_Grid False_Easting: 170251.5550 False_Northing: 126867.9090 Central_Meridian: 35.21208056 Scale_Factor: 1.00000000 Latitude_Of_Origin: 31.73409694 Linear Unit: Meter Geographic Coordinate System: GCS_Palestine_1923 Datum: D_Palestine_1923 Prime Meridian: Greenwich Angular Unit: Degree
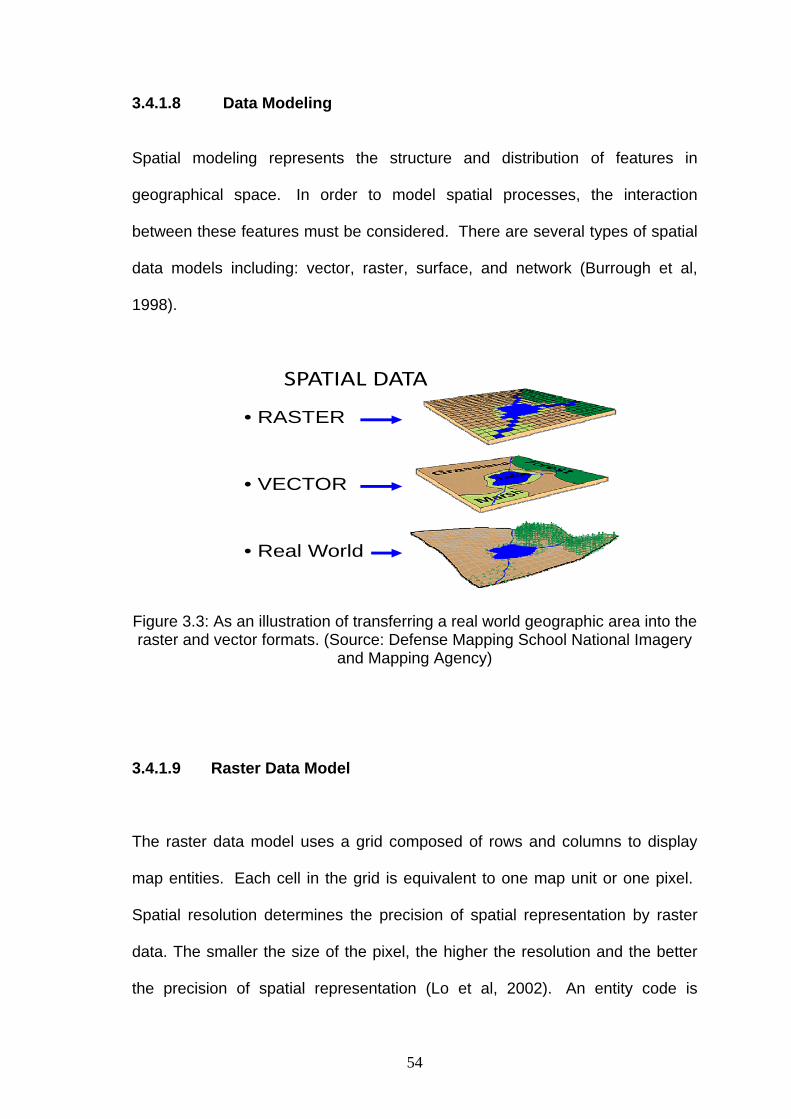
54
3.4.1.8 Data Modeling
Spatial modeling represents the structure and distribution of features in
geographical space. In order to model spatial processes, the interaction
between these features must be considered. There are several types of spatial
data models including: vector, raster, surface, and network (Burrough et al,
1998).
SPATIAL DATA
• RASTER
• VECTOR
• Real World
Figure 3.3: As an illustration of transferring a real world geographic area into the raster and vector formats. (Source: Defense Mapping School National Imagery
and Mapping Agency) 3.4.1.9 Raster Data Model
The raster data model uses a grid composed of rows and columns to display
map entities. Each cell in the grid is equivalent to one map unit or one pixel.
Spatial resolution determines the precision of spatial representation by raster
data. The smaller the size of the pixel, the higher the resolution and the better
the precision of spatial representation (Lo et al, 2002). An entity code is

55
assigned to each cell that is connected to a separate attribute table, which
provides information to the user as to what entity is present in what cell.
The raster data model represents spatial phenomenon such as topography,
land use cover, and air quality as categorical or continuous surfaces. This
makes raster-based methods particularly suitable for spatial modeling that
involves multiple surface data sets. However, this method is not suitable for
applications that rely on individual spatial features represented by points
(qusour), lines (routes), and polygons (Lo et al, 2002).
Figure 3.4: Raster image from Google Earth used in this study.

56
3.4.1.10 Vector Data Model
Real world entities represented by a set of coordinates with associated
attributes. The vector data model is a method of storing and representing data
on an X,Y Cartesian plane. A coordinate and an equation defining the
curvature of each feature is stored for both the beginning and the end point of
each feature. The building block of the vector structure is the point; lines and
areas are composed of a series of points in a specific order that gives the object
direction (Clarke, 1997) the attribute data in the vector model is stored in a
separate table that can be linked to the map. Because every item on the map
has its own separate attribute data, analysis can be very easy. For example, if
a vector the transhumance route network in this study is being used to analyze
the amount of the locations of perennial source of water, each route would be
capable of having separate attributes, thus allowing the GIS user to view or
select each route and access information associated with just that route.
Vector data entities in a GIS hold individual values, for example, if two lines
overlap, unique values are recorded for each line in the database (spaghetti
model). Selecting an appropriate number of points is another consideration to
be made with vector data; if too few points are chosen, the shape and
properties of the entity will be compromised and if too many points are used,
duplicated information can be stored resulting in data overload (Burrough et al,
1998).

57
The vector modle used in this study was result of GPS points represented the
qusour, Wadis, and source of water. And also wadi_Sarhan, routes and Harra
after being digitized.
Figure 3.5: Vector model.
Figure 3.6: Different ways of graphically displaying data with vector and raster
models. (Burrough et al, 1998).

58
3.4.1.11 Shapefile
The shapefile format is the geometry and attributes of geographically-
referenced features in as many with specific file extensions that stored in the
project. They are:
a) .shp - the file that stores the feature geometry. Required.
b) .shx - the file that stores the index of the feature geometry. Required.
c) .dbf - the dBASE file that stores the tabular information of features. And it
is required.
d) .sbn and .sbx - the files that store the spatial index of the features. This one is optional.
There are seven layers were built during the digital map process as the following table:
TABLE 3.2: Layers used in the study. UNoU ULayer NameU UType of FeatureU UType of Data SourceU
1 qusour point Shapefile 2 water_source point Shapefile 3 cities point Shapefile 4 Routes Line Shapefile 5 wadi_Sarhan polygon Shapefile 6 Jordan polygon Shapefile 7 Harrah polygon Shapefile

59
3.4.2 Tabular Data.
Tabular data, also called attribute or descriptive data, is one of the most
important elements in a GIS. It is statistical, numerical, or characteristic
information that can be attributed to spatial features. Similar to spatial data the
tabular data is stored by the GIS software in a method that allows it to be
accessed and viewed, usually in a relational database format. The attribute data
about the study were obtained, these data contains the description of the
qusour, the name of the qusour, sources of water and wadis and also some
historic data about the objects being study. (qusour, source of water, routes
transhumance, Wadi_Sarhan and Harrah).
The GIS software (Arc GIS.9.2) allows the attribute data to be linked to the
spatial data in such a way that it gives the attributes a location. A GIS package
knows a specific location geographically from the storage of spatial data. By
linking attribute data to the spatial data, the GIS package knows some of the
characteristics of a feature in the spatial data set.
Two or more tabular databases can be linked when there is a common data
filed. This allows the GIS to become a powerful spatial analysis tool. A GIS
user, after integrating both spatial and attribute data, has the capability to learn
a great deal about the defined study area.
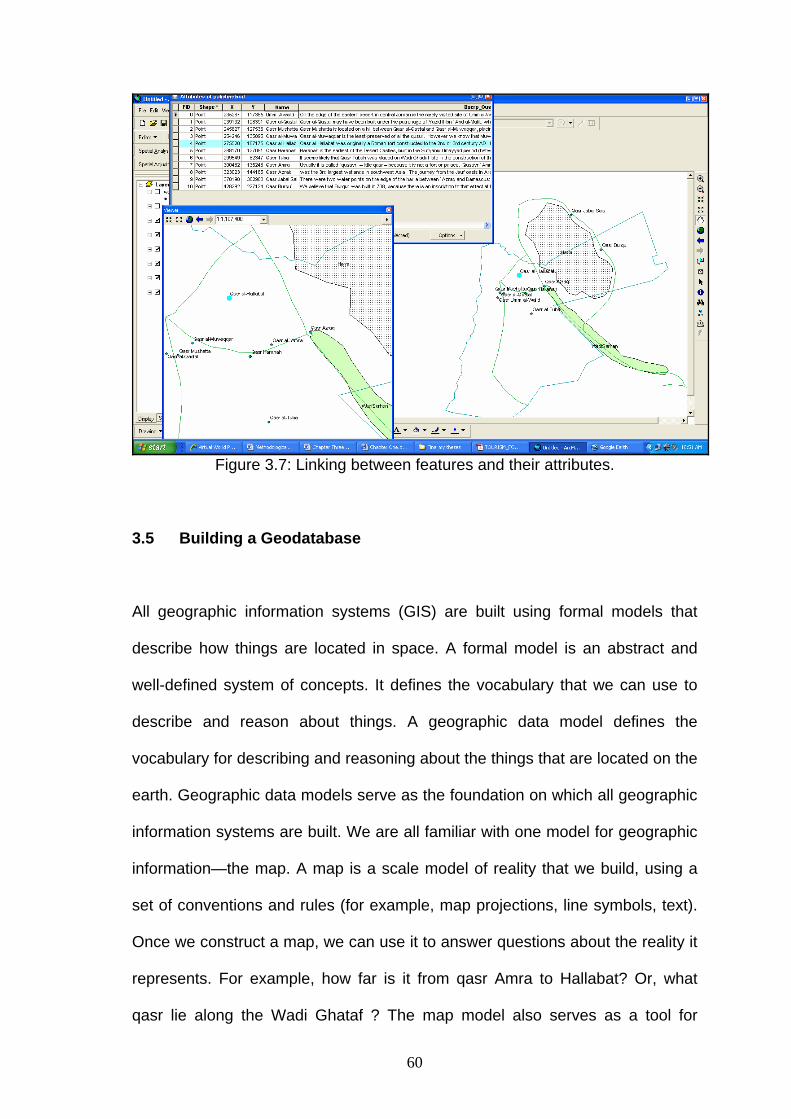
60
Figure 3.7: Linking between features and their attributes.
3.5 Building a Geodatabase
All geographic information systems (GIS) are built using formal models that
describe how things are located in space. A formal model is an abstract and
well-defined system of concepts. It defines the vocabulary that we can use to
describe and reason about things. A geographic data model defines the
vocabulary for describing and reasoning about the things that are located on the
earth. Geographic data models serve as the foundation on which all geographic
information systems are built. We are all familiar with one model for geographic
information—the map. A map is a scale model of reality that we build, using a
set of conventions and rules (for example, map projections, line symbols, text).
Once we construct a map, we can use it to answer questions about the reality it
represents. For example, how far is it from qasr Amra to Hallabat? Or, what
qasr lie along the Wadi Ghataf ? The map model also serves as a tool for

61
communicating facts about geography visually: Is the terrain rough? Which way
is north? In fact, when we see a map, we often understand things that might not
even occur to us as specific questions.
Maps work because we know the “rules” of conventional map reading: blue
lines are rivers, North is toward the top of the page, and so on. In a similar way,
geographic data models define their own set of concepts and relationships,
which must be understood before we can expect to create or interpret your own
data model. These concepts relate to how we can represent geographic
information in a computer system, rather than, as in the map example, on
paper.
In Modeling Our World, Michael Zeiler has written an excellent primer for
understanding the various models used to represent geographic information in
ArcInfo™ 8 software. He presents, using straightforward text and excellent
illustrations, the concepts and vocabulary employed in the design,
implementation, and use of the ArcInfo 8 geographic database. In addition to
explaining the ArcInfo data model (objects, features, surfaces, networks,
images, and so forth) in detail, Michael also provides good insight into how to
use this framework to design useful information models that fit your particular
needs. (Michael , 1999).
3.6 Database
A database is a mechanism that is used to store information, or data.
Information is something that we all use on a daily basis for a variety of
reasons. With a database, users should be able to store data in an organized

62
manner. Once the data is stored, it should be easy to retrieve information.
Criteria can be used to retrieve information. The way the data is stored in the
database determines how easy it is to search for information based on multiple
criteria. Data should also be easy to add to the database, modify, and remove.
A personal address book is a good example of a dynamic database that many
of us use on a daily basis. And the Database elements are the database
schema, Schema objects, Tables, Fields and columns, Records and rows,
Keys, Relationships and Data types (Ryan et al, 2001).
3.7 Relational Database Model
The relational model was designed by the IBM research scientist and
mathematician, Dr. E.F. Codd. Two of Dr. Codd’s main focal points when
designing the relational model were to further reduce data redundancy and to
improve data integrity within database systems. The relational model originated
from a paper authored by Dr. Codd entitled, “A Relational Model of Data for
Large Shared Data Banks,” written in 1970. The relational database model is
the most popular database model used today. Many improvements have been
made to prior database models that simplify data management, data retrieval,
and change propagation management. Data is easier to manage, mainly
through the use of integrity constraints. The retrieval of data is also a refined
process, allowing the user to visualize the database through relational table
structures and to ask for specific data without a detailed knowledge of the
database layout. Changes are also easier to propagate, thanks to features such
as integrity constraints and the benefits that normalization (reduction of data

63
redundancy) provides. The primary unit of storage in a database is a table, or
group of related data. A table consists of rows and columns, a row is associated
with an individual record in the table, and a column contains values for all rows
associated with a particular field. Tables can be related to one another through
common column values, called keys (Ryan et al, 2001).
Three different types of table relationships are allowed: one-to-one, one-to-
many, and many-to many. Different relationships should be allowed to exist
between tables in a database. For example, one table might be required to have
a record based on the existence of a record in another table. Some tables might
optionally have one or more existing records that correspond to records in
another table.
Table relationships are defined by referential integrity, which suggests the use
of primary key and foreign key constraints. Referential integrity is the use of
these constraints to validate data entered into a table and manage the
relationship between sub table and main tables. Other types of constraints can
also be created to control the permissible data in particular table columns and to
establish relationships between tables (Ryan et al, 2001).
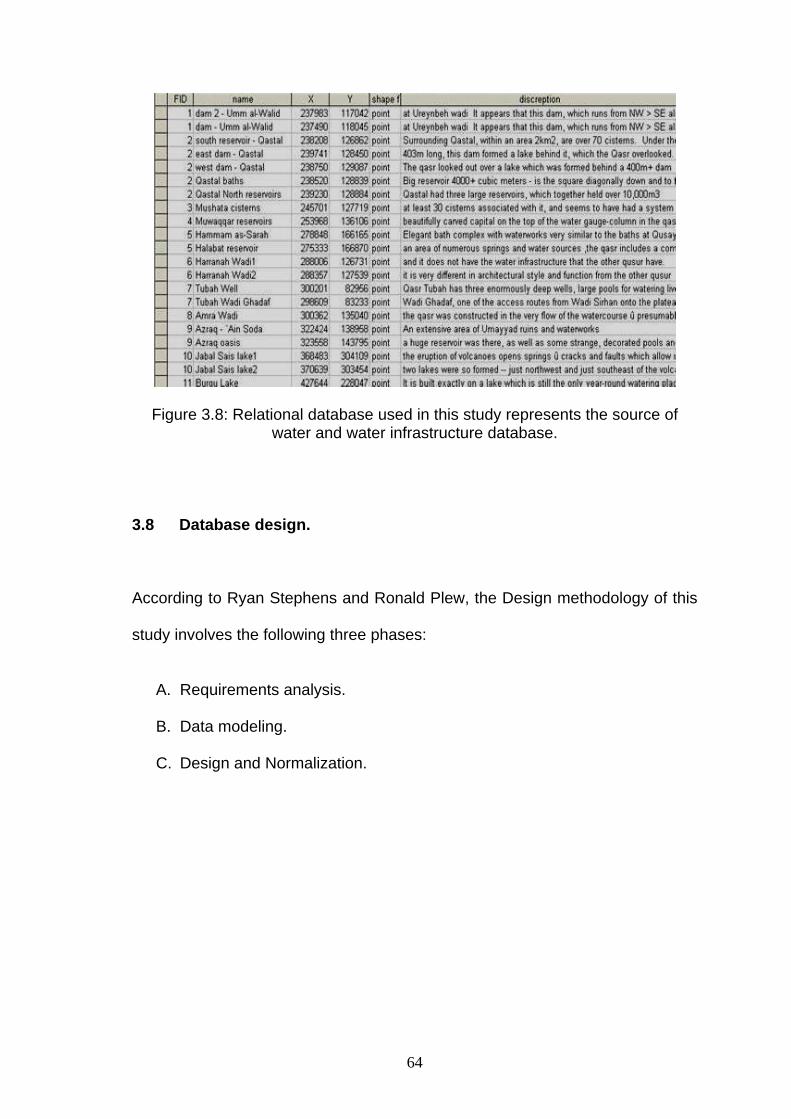
64
Figure 3.8: Relational database used in this study represents the source of water and water infrastructure database.
3.8 Database design.
According to Ryan Stephens and Ronald Plew, the Design methodology of this
study involves the following three phases:
A. Requirements analysis.
B. Data modeling.
C. Design and Normalization.

65
3.8.1 Requirements analysis
Requirements analysis involves capturing the needs of the qusour database,
and converting those needs into the requirements for a qusour database
system. Information is gathered in order to begin modeling the database in the
data modeling phase. During data modeling, entities are visually represented in
order to get good understanding of the qusour database system’s needs.
Finally, objects in the data model are designed into tables and normalized to
reduce the amount of redundant data stored in the database. Most
methodologies follow these three steps.
The analysis plan is basically an outline of the events that will occur during the
requirements phase of the design process One of the most important products
of the requirements phase is an entity relationship diagram that illustrates the
qusour model. This diagram is also referred to as an analysis ERD. The point of
this initial ERD is to provide the researcher with a picture of the different
categories of data for the qusour, as well as how these categories of data are
related to one another. The analysis ERD might also be used during researcher
feedback sessions to see that the work has actually been performed so far. The
ERD can also be used when compiling summarized documentation of what
occurred during the requirements phase. With respect this ERD should be
simple and focused on the qusour, not the actual system.
The ERD is used to generate the physical model. The physical model consists
primarily of tables which are based on the entities defined during logical
modeling and should be shown in the ERD. After the tables have been defined,

66
columns are defined, which more specifically identify rows of data, or records,
that are stored in a particular table.
Entity relationship modeling is the process of visually representing entities and
attributes that are defined as a result of interviews, one of the initial steps during
the qusour-analysis process. The entity relationship diagram (ERD) is an
iterative tool and process that models logical data structures during the analysis
phase of system development. ERD components are data entities, the attributes
of those entities, and the relationships among the entities. The complete ERD is
used later in database design to physically design database tables.
The creation of an ERD first involves the definition and identification the entities.
Entities are classes of things of importance about which data must be stored or
manipulated in the course of qusour processes, for example qusour or source of
water. Entities are the nouns of the study information system.
The first step in creating an ERD, then, is to capture an unconstrained group of
entities that represent all the objects in data model and then draw them into
ERD. Over time, as working on data model, that group of entities will evolve
toward completion. As the process continues, was creating, deleting, and
modifying entities in the ERD to fit the qusour database requirements (Ryan et
al, 2001).

67
3.8.1.1 Entities There are various definitions of an entity:
"Any distinguishable person, place, thing, event, or concept, about which
information is kept" (Brus, 1992).
"A thing which can be distinctly identified" (Chen, 1976).
"Any distinguishable object that is to be represented in a database" (Date,
1986).
"anything about which we store information (e.g. supplier, machine tool,
employee, utility pole, airline seat, etc.). For each entity type, certain attributes
are stored". (Mart, 1989).
Once researcher has identified a list of potential entities and placed them into
an ERD, the next step is to identify the relationships between the entities.
Relationships are the verbs of the system. a relationship is a bidirectional
connection between two entities or between an entity and itself.
Relationships were represented by diamonds between entities in an ERD.
Entities were represented by rectangle and attributes were represented
ellipsoid.
Table relationships are modeled in the logical model and implemented in the
physical model using primary key and foreign key constraints. Each primary key
value of a table was a unique. Foreign keys do not have to be unique, although
a unique constraint might be placed on a foreign key column. The primary key

68
represents the parent record, whereas the foreign key represents the child
record of some primary key.
Two basic table relationships was used in this study with the relational model.
These relationships are:
A. One-to-one.
B. One-to-many.
In a few words, a one-to-one relationship involves the existence of a maximum
of one record of sub table per one record of main table. With the one-to-many
relationship, a record of main table might have many records of sub table.
Once the entities and their relationships captured in the ERD, the next step is to
capture and identify the attributes of the entities. the first task was to identify a
unique identifier attribute or combination of attributes for each entity. Every
entity must start with a unique primary key.
Attribute and column names should not include space for hyphens, commas, or
other formatting punctuation. Such items are not stored in the database and are
not allowable characters for most relational database management systems
(RDBMSs). Sometimes, entity and attribute names include spaces. When the
converting entities to tables and physically designing those tables, spaces that
are found in entity and attribute names are replaced with underscores (Ryan et
al, 2001).
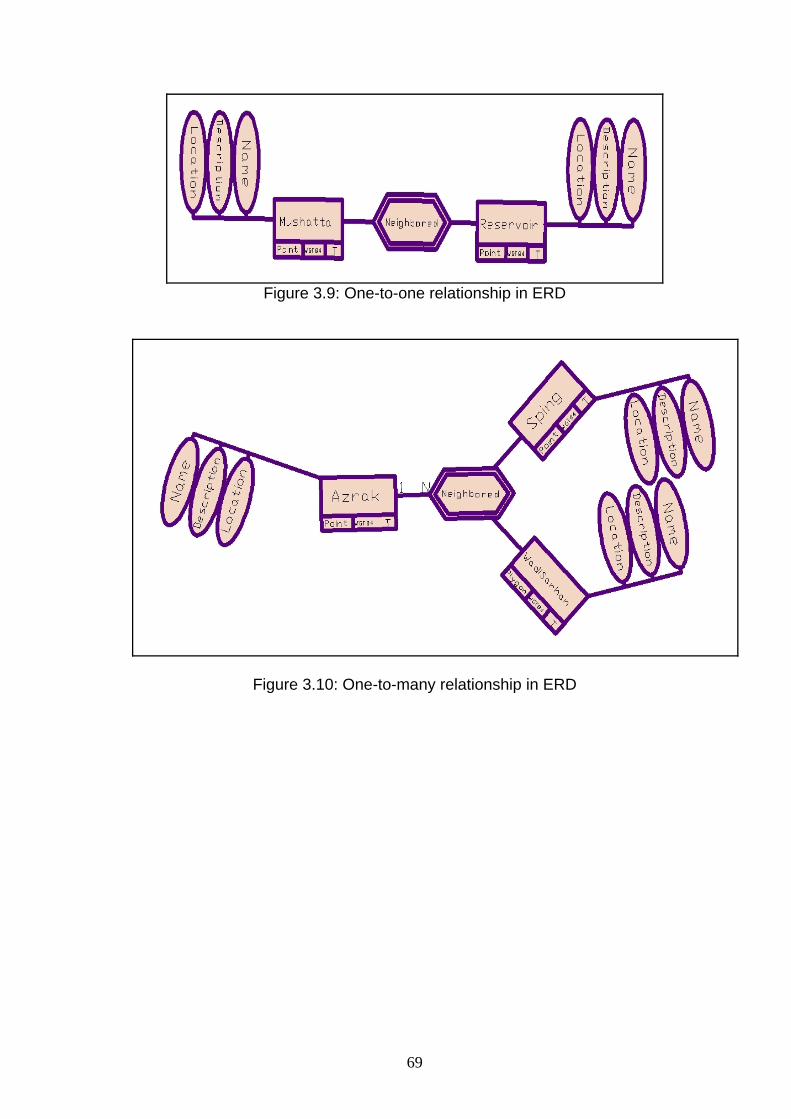
69
Figure 3.9: One-to-one relationship in ERD
Figure 3.10: One-to-many relationship in ERD

70
Figure 3.11: ERD for the entire study.
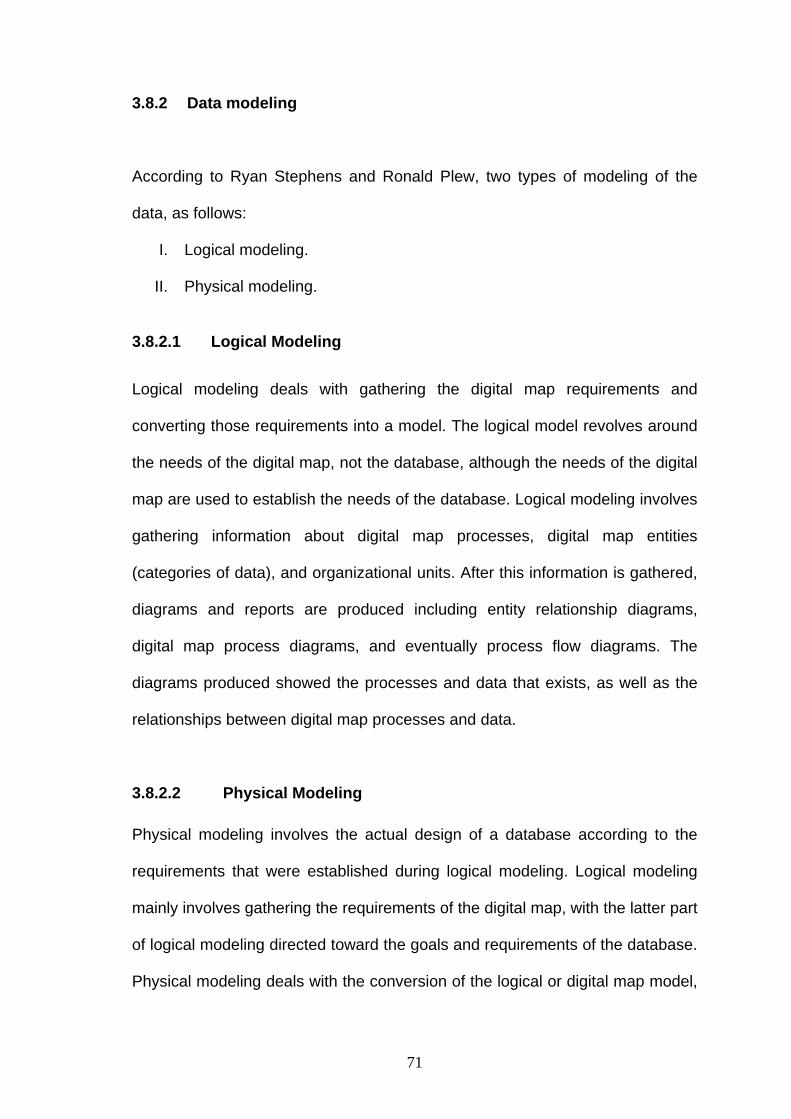
71
3.8.2 Data modeling
According to Ryan Stephens and Ronald Plew, two types of modeling of the
data, as follows:
I. Logical modeling.
II. Physical modeling.
3.8.2.1 Logical Modeling
Logical modeling deals with gathering the digital map requirements and
converting those requirements into a model. The logical model revolves around
the needs of the digital map, not the database, although the needs of the digital
map are used to establish the needs of the database. Logical modeling involves
gathering information about digital map processes, digital map entities
(categories of data), and organizational units. After this information is gathered,
diagrams and reports are produced including entity relationship diagrams,
digital map process diagrams, and eventually process flow diagrams. The
diagrams produced showed the processes and data that exists, as well as the
relationships between digital map processes and data.
3.8.2.2 Physical Modeling Physical modeling involves the actual design of a database according to the
requirements that were established during logical modeling. Logical modeling
mainly involves gathering the requirements of the digital map, with the latter part
of logical modeling directed toward the goals and requirements of the database.
Physical modeling deals with the conversion of the logical or digital map model,

72
into a relational database model. When physical modeling occurs, objects are
being defined at the schema level. a schema is a group of related objects in a
database. A database design effort is normally associated with one schema.
During physical modeling, objects such as tables and columns are created
based on entities and attributes that were defined during logical modeling.
Constraints are also defined, including primary keys, foreign keys, other unique
keys, and check constraints. Views can be created from database tables to
summarize data or to simply provide the researcher with another perspective of
certain data. Other objects such as indexes and snapshots can also be defined
during physical modeling. Physical modeling is when all the pieces come
together to complete the process of defining a database for a digital map.
Physical modeling is database software specific, meaning that the objects
defined during physical modeling can vary depending on the relational database
software being used. For example, most relational database systems have
variations with the way data types are represented and the way data is stored,
although basic data types are conceptually the same among different
implementations. Additionally, some database systems have objects that are
not available in other database systems (Ryan et al, 2001).

73
Figure 3.12: One-to-many relationship in Physical modeling.
3.8.3 Automated Design Tools
Automated design tools formerly known as CASE tools are graphical user
interface (GUI) applications that are used to aid in the design of a database or
database application. Automated design tools are used to automate and
expedite the task of designing a digital map system. These automated tools
store information about digital map requirements and assist in the overall design
and generation of a digital map system.
3.8.4 Normalization Normalization is the process of reducing the redundancy of data in a relational
database. Redundant data refers to the data that is stored in more than one
location in the database. Data should not be redundant, which means that the
duplication of data should be kept to a minimum for several reasons. For
instance, it is unnecessary to store qasr al_Hallabat in more than one table.
With duplicate data, unnecessary space is used. Confusion is always a threat
when, for example, the description for qasr Amrah in one table does not match
the description of the same qasr in another table. Which table is correct?!! As if

74
data management is not difficult enough, redundancy of data could prove to be
a disaster. On the other hand, there are also benefits to databases that have
not been normalized, mainly related to increased database performance (Ryan
et al, 2001).

75
CHAPTER FOUR ANALYSIS
4.1 Visualization
Visualization is the cheaper way in GIS and the easiest to implement. Seeing
the data on a digital map, rather than a spreadsheet, makes possible more
informed and faster decision making. After completing the digital map the
researcher will examine the distribution of all of the features on the map in order
to grasp visually an imagination of the landscape and how the Umayyad qusour
were distributed along the routes of transhumance. The visualization will also
allow us to place the qusour in the context of other geographically determinative
features such as water sources, wadis (seasonal washes), etc.
Visualization, the representation of data in a viewable medium or format. In GIS,
visualization is used to organize spatial data and related information into layers
that can be analyzed or displayed as maps, for example: three-dimensional,
tables, summary charts, time-based views, and schematics. (ESRI, 2006).
Visualizing information interactively is one of the most attractive and useful
capabilities of GIS. High-powered computers can change any element of the
display "on the fly," changing not just the look of the graphic image but also its
interpretation. This ability to create multiple perspectives enhances a viewer's
perceptive abilities to understand the phenomenon being studied like never
before. Visualizing data using current computing technology and interactive GIS
has many advantages over doing so using traditional paper maps (ncgia, 2008).
76
Maps have conventionally been used to represent the real world. GIS
technology has improved the effectiveness traditional cartography. Through a
process known as visualization, a GIS can be used to produce images not only
maps, but animations, drawings, and other cartographic products. These
images allow researcher to view the objects in ways that he can’t see by
traditional map.
4.2 Proximity analysis
Proximity analysis is a type of analyzing locations of features points, lines,
polygons, or raster by measuring the distance between them and any features
in the study area. The distance between one point and another can be
measured as straight lines directly or by topologic network’s paths, in this study
the measurements conducting directly without paths, because of no routable
network involved. After getting the database and digital map done, viewer can
easily measure the distance between any qasr and its source of water or
between any two features in the map. Or can search which qasr closer to the
transhumance routes, etc…
4.2.1 Buffering
It is a type of proximity analysis that is supported by most GIS, buffer can be a
polygon of a specified width around a point, line, or area. And is defined in such
systems by real-world distances from one or more map elements.or a polygon
enclosing a point, line, or polygon at a specified distance. A buffer is useful for
proximity analysis (magic.gov).

77
Therefore using the query and buffer tool would answer for the question which
points located within specific distance from any other point in study area? For
example which source of water located within 500m from qasr Al-Qastal?.
4.3 Exploratory digital map
The researcher examined the Umayyad qusour’s digital map and fined out that
there are three matters concern of the features being study:
First: the distance between Hammam as-Sarah and qasr Hallabat is 3,477m.
Because the bath complex and qasr were constructed at the same time, and the
baths built in order to serve the qasr, it is reasonable to assume that this
distance (three and a half kilometers) was satisfactory to the Umayyad
caliphate. Because they decided the location of the qasr and the baths, this is
mean they dicided the distance between their buldings. Seeing Hammam as-
Sarah as a part of the complex of water systems serving the qasr, we might
generalize that three and a half kilometers is a typical radius of buffer for the
water infrastructure of the Umayyad qusour. Thus the researcher drew a
circular buffer zone with a 3.477 radius around each of the desert qusour in the
study area in order to examine whether there is a water source within every
buffer zone. By this method we can demonstrate a positive association
between water sources and the qusour.

78
Figure 4.1: The distance between Hammam as-Sarah and qasr Hallabat.
Figure 4.2: Buffer zone with radius 3,477m. Second: the routes connected three cities together (Busra, Azraq and Amman),
with a triangle shape, qasr Al-Hallabatlocated almost in the center of these
cities, the qasr deviated form the mean 9km toward the west, this is make
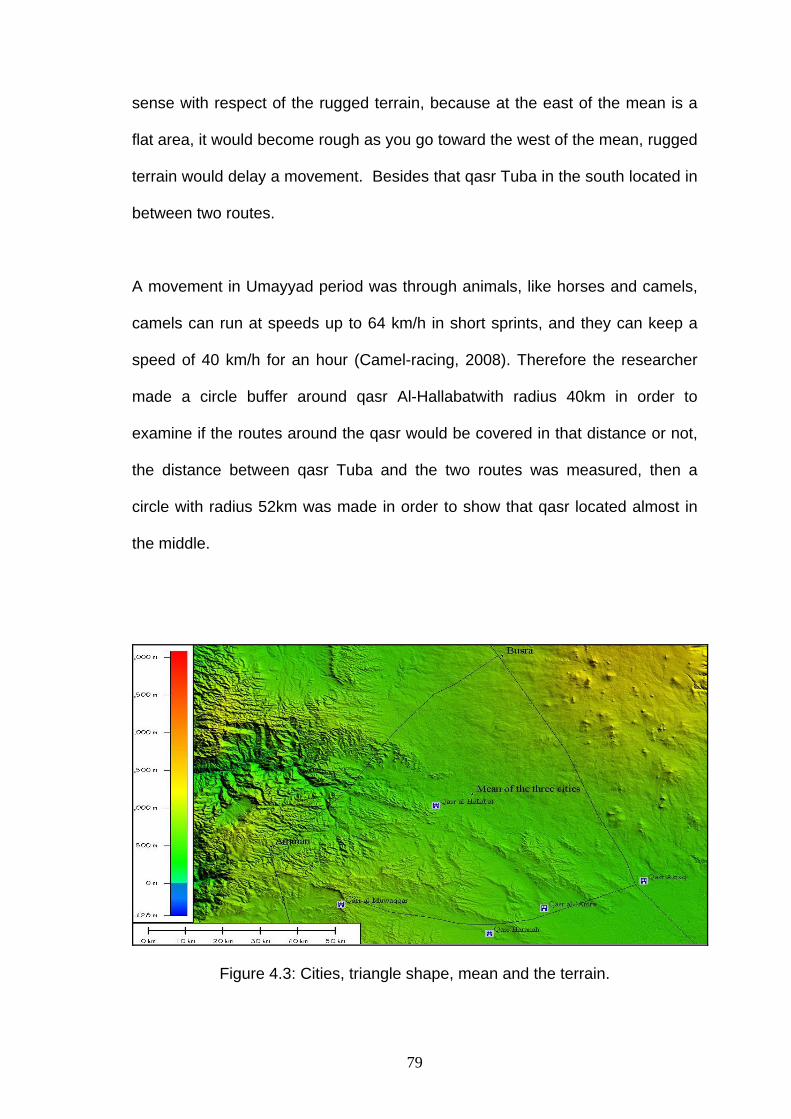
79
sense with respect of the rugged terrain, because at the east of the mean is a
flat area, it would become rough as you go toward the west of the mean, rugged
terrain would delay a movement. Besides that qasr Tuba in the south located in
between two routes.
A movement in Umayyad period was through animals, like horses and camels,
Hcamels H can run at speeds up to 64 km/h in short sprints, and they can keep a
speed of 40 km/h for an hour ( HCamel-racing, 2008) H. Therefore the researcher
made a circle buffer around qasr Al-Hallabatwith radius 40km in order to
examine if the routes around the qasr would be covered in that distance or not,
the distance between qasr Tuba and the two routes was measured, then a
circle with radius 52km was made in order to show that qasr located almost in
the middle.
Figure 4.3: Cities, triangle shape, mean and the terrain.

80
Third: there are two groups of desert castles; one of them located east of
Harrah and the other located west of Harrah, once the one located east of
Harrah and its qusour are dotted fitly on the route, therefore the researcher
considered their locations as points for patrolled station on the transhumance
routes at the east of Harrah.
The second group of desert castles is located west of Harrah, This group is
distributed in a sort of diamond-shape, for better understanding the distribution
and ease for analysis, the researcher highlighted the diamond shape , the four
vertices point to the four cardinal directions (north, south, east, west); qasr
Hallabat is at the north vertex, qasr Tubah at the south. The other qusour are
located along the diagonal lines connecting the east and west vertices. After
that circle buffer made around each qasr of which located a long of the
diagonal, with radius 17km, the radius length was 17km to cover the whole
diagonal distance. The distance of qasr Halabat and the closest qasr is
measured (37.82km), the distance between qasr Tuba and closest qasr is
measured (46.16km).

81
Figure 4.4: Distribution of qusour in second group looks like a diamond shape.
4.4 Line-of-sight communication
The proximity analysis was made in previous step, next the second step is to
examine the line-of-sight communication between the desert castles, for that the
writer used Global Mapper7 software and DEM, then the SHP file of the desert
castles imported into Global Mapper7 software as a qusour layer at that time
DEM installed as the second layer and then overlapping two layer in one map,
then simply the researcher examined the profiles between each qasr with
consideration of the earth curviness and the height of qusour as 20m, the height
of qusour were choose arbitrarily because most of the qusour are damaged but
still some of them which higher than 20m.

82
Figure 4.5: Desert castles in the context of terrain and DEM.
4.5 Point pattern analysis
Point Pattern Analysis engages the ability to describe patterns of locations of
point events and then test whether there is a significant occurrence of clustering
of points in a particular area. The spatial pattern of a distribution is distinct by
the arrangement of points in the space and also the geographic relationships
among them. The ability of evaluating spatial patterns is a requirement to
understanding the spatial processes original the distribution of a phenomenon.
There are three general patterns:
I. Random any entity is equally likely to happen at any location and the
location of any entity is not affected by the location of any other entity.
There is no apparent ordering of the distribution.

83
II. Uniform every entity is as far from all of its neighbors as possible.
III. Clustered many entities (points) are concentrated close together, and large
areas that contain very few, if any, entities (Upton ea al, 1985).
The most common methods for measure the spatial pattern analysis are as
follows:
A. Quadrant Count Method.
B. Kernel Density Estimation.
C. Nearest Neighbor Distance. (Erum T, 2004).
According to Erum .T in the Introduction to Point Pattern Analysis, The criteria
would use to determine if a data set is appropriate for study area’s type of point
pattern analysis is given by the following:
I. Spatial data must be mapped on a plane.
II. The study area must be selected and determined before to the analysis.
III. Point data should not be a selected sample, but whole set of data must be
analyzed.
IV. There should be one to one correspondence between objects in study
area and events in pattern.

84
V. Points must be true incidents with real spatial coordinates; latitude and
longitude coordinates are needed.
The researcher selected the Quadrant Count Method for analyze the distribution
pattern of the qusour. While the other techniques listed can be more descriptive
and more accurate it is also true that many of these other methods are more
complicated and difficult to implement. Quadrant Count Analysis is relatively
easy method to implement and it has provided several opportunities to apply
basic mathematical and statistical concepts, and also allowed for Test Statistic.
4.5.1 Quadrant Count Method
Quadrant Count Methods: This method simply record and count the number of
events that occur in each quadrant. Based on a measure resulting from data
obtained after a uniform grid network is drawn over a digital map of the desert
castle, Quadrats don’t have to be square and their size has a big influence and
they should be the same size and same shape among the entire grid. The
frequency count, the number of qusour occurring within each quadrat is
recorded, These data are then used to compute a measure called the variance,
then The variance compares the number of qusour in each grid cell with the
average number of points over all of the cells, Then the variance of the
distribution of the qusour is compared to the characteristics of a random
distribution.
The Mean and Variance are then computed to calculate the Variance-to-Mean
Ratio (VTMR). The following is the way we will interpret the VTMR:

85
If VTMR>1, the pattern is clustered. This means that the data set has one or
more groups of points in clusters and large areas of maps without points.
If VTMR<1, the pattern is regularly dispersed implying the events are distributed
more or less regularly over the region.
If VTMR=1, the pattern is random. This means that the data set has no trend
towards clustering or dispersion.
Weakness of Quadrat Analysis:
a) If the quadrats are too small, they may contain only a few points. If they
are too large, they may contain too many points.
b) It is suggested that area of the quadrat should be twice as big as the
study mean area.
nareaTotalWidth 2=
c) Actually a measure of dispersion, is not really pattern, because it is
based primarily on the density of points, and not their arrangement in
relation to one another.
d) Results in a single measure for the entire distribution, so variations within
the region are not recognized.

86
e) Different sizes or orientations of the quadrad would effects the results.
(Arthur J, Lembo .Jr).
The Mean can then be calculated as:
quadrantsofNostudyareatheinqusurofNoMean
...
= .
Let ix be the frequency of qusour in each quadrant and n number of all qusour.
Then Variance can be calculated as:
1
)( 22
−
−=
∑∑n
nx
xVariance
ii
.
The Variance to Mean Ratio or VTMR is calculated as:
MeanVarianceVTMR= .
H0: The distribution of desert castle is not significantly different than random.
Ha: The distribution of desert castle is significantly different than random.
Test Statistic: use the D statistic of the Kolmogorov-Simirnov , K-S test:
If D calculated> D critical at a given significance level reject the null-hypothesis.
Calculate the test statistic D:
87
D = max [Cumulative Observed Frequency _Cumulative Expected Frequency]
The critical value Dcritical at the 5% level is given by:
QnD 36.1
05.0 =
quadrats ofnumber theis Qn (Upton ea al, 1985). The researcher conducted the quadrant analysis using Arc view GIS 3.2
software, with category projections of the world and type geographic as the
projection systems. The type of coverage quadrats was complete and the
Quadrat shape was square, with 16 quadrats.

88
CHAPTER FIVE RESULTS
5.1 Digital map and geodatabase
The digital map and geodatabase for the desert castle, represent the Umayyad
qusour, source of water, wadi_sarhan, Harrah, mager cities in Umayyad period
and the transhumance routes, by the aid of GIS and its capability the viewer can
linking between features on map and its attributes and get the information he
need, the information can be obtained of this digital map and geodatabase; the
position of any feature and its coordinates, the names, brief historic information
about each feature and others, as will as viewer can proceed a all kind of
analysis to get better understanding for Umayyad qusour, Any statistic we can
think of to describe the data then automatically has geographic properties and
as a result can be placed on maps for visual processing. "history and computing
is not only about historical research, but also about historical resource creation"
(Woollard, 1999). So digital map and geodatabase of the desert castle as a
result of this research would be a historical resource for Umayyad qusour.

89
Figure 5.1: Resulted digital map.
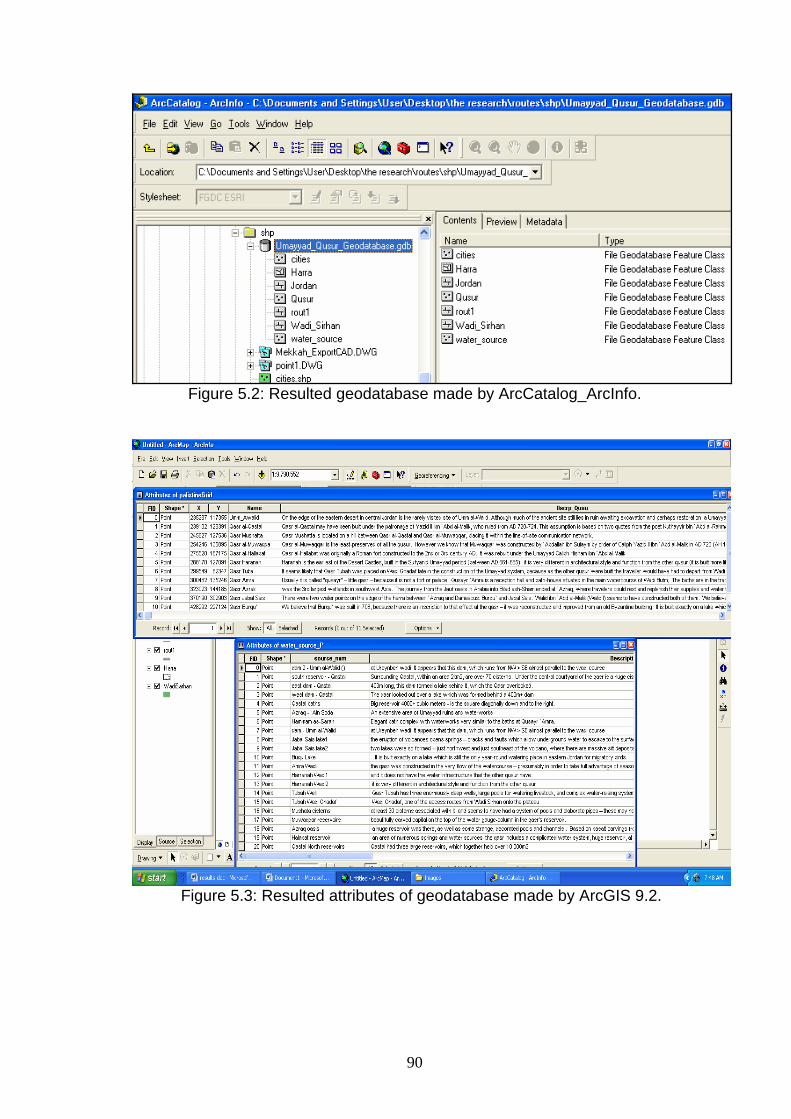
90
Figure 5.2: Resulted geodatabase made by ArcCatalog_ArcInfo.
Figure 5.3: Resulted attributes of geodatabase made by ArcGIS 9.2.

91
TABLE 5.1: Database of Umayyad qusour. Umayyad qusour
FID qasr Name X Y shape
file Description
1 Umm al-Walid
235287 117355 point On the edge of the eastern desert in central Jordan is the rarely visited site of Umm al-Walid. Although much of the ancient site still lies in ruin awaiting excavation and perhaps restoration, a Umayyad qasr and Mosque have been excavated and preserved.
2 qasr al-Qastal
239132 128391 point qasr al-Qastal may have been built under the patronage of Yazid II ibn `Abd al-Malik, who ruled from AD 720-724. This assumption is based on two quotes from the poet Kuthayyir bin `Abd al-Rahman `Azza (AH24-105/ AD644-723), found in a panegyric in praise
3 qasr Mushatta
245827 127536 point qasr Mushatta is located on a hill between qasr al-Qastal and qasr al-Muwaqqar, placing it within the line-of-site communication network.
4 qasr al-Muwaqqa
254246 135895 point qasr al-Muwaqqar is the least-preserved of all the qusour. However we know that Muwaqqar was constructed by `Abdallah ibn Sulaym by order of Caliph Yazid II ibn `Abd al-Malik in AD 723 (AH 104) -- because of an inscription on a huge, beautifully carved c
5 qasr al-Hallabat
275520 167175 point qasr al-Hallabat was originally a Roman fort constructed to the 2nd or 3rd century AD. It was rebuilt under the Umayyad Caliph Hisham ibn `Abd al-Malik
6 qasr Haranah
288170 127091 point Haranah is the earliest of the Desert Castles, built in the Sufyanid Umayyad period (between AD 661-685). it is very different in architectural style and function from the other qusour (it is built more like a fortified khan than a palace), and it does n
7 qasr Tuba 299549 82347 point It seems likely that qasr Tubah was placed on Wadi Ghadaf late in the construction of the Umayyad system, because as the other qusour were built the traveller would have had to depart

92
Umayyad qusour
FID qasr Name X Y shape
file Description
from Wadi Sirhan further and further south to escape being detected by
8 qasr Amra 300482 135246 point Usually it is called "qusayr" û little qasr û because it is not a fort or palace. Qusayr `Amra is a reception hall and bath-house situated in the main watercourse of Wadi Butm, The baths are in the traditional Hellenistic style, with a cold room, tepid
9 qasr Azrak
323023 144185 point was the 3rd largest wetlands in southwest Asia. The journey from the Jauf oasis in Arabia into Bilad ash-Sham ended at `Azraq, where travelers could rest and replenish their supplies and water their livestock
10 qasr Jabal Sais
370190 302903 point There were two water points on the edge of the harra between `Azraq and Damascus: Burqu` and Jabal Sais. Walid ibn `Abd al-Malik (Walid I) seems to have constructed both of them. We believe that Burqu` was built in 708, because there is an inscription
11 qasr Burqu`
428292 227124 point We believe that Burqu` was built in 708, because there is an inscription to that effect at the qasr, it was reconstructed and improved from an old Byzantine building. It is built exactly on a lake which is still the only year-round watering place
The next figure 5.4 is report for Umayyad qusour made via Access 2003
software, it contains four pages (A,B,C,D); the report represents names of
Umayyad qusour, coordinates(X,Y), the relative water_source or water
infrastructure and its coordinates (X,Y). Palestine Grid was used as a
coordinate system.

93
Figure 5.4.A: Report of Umayyad qusour, page1.
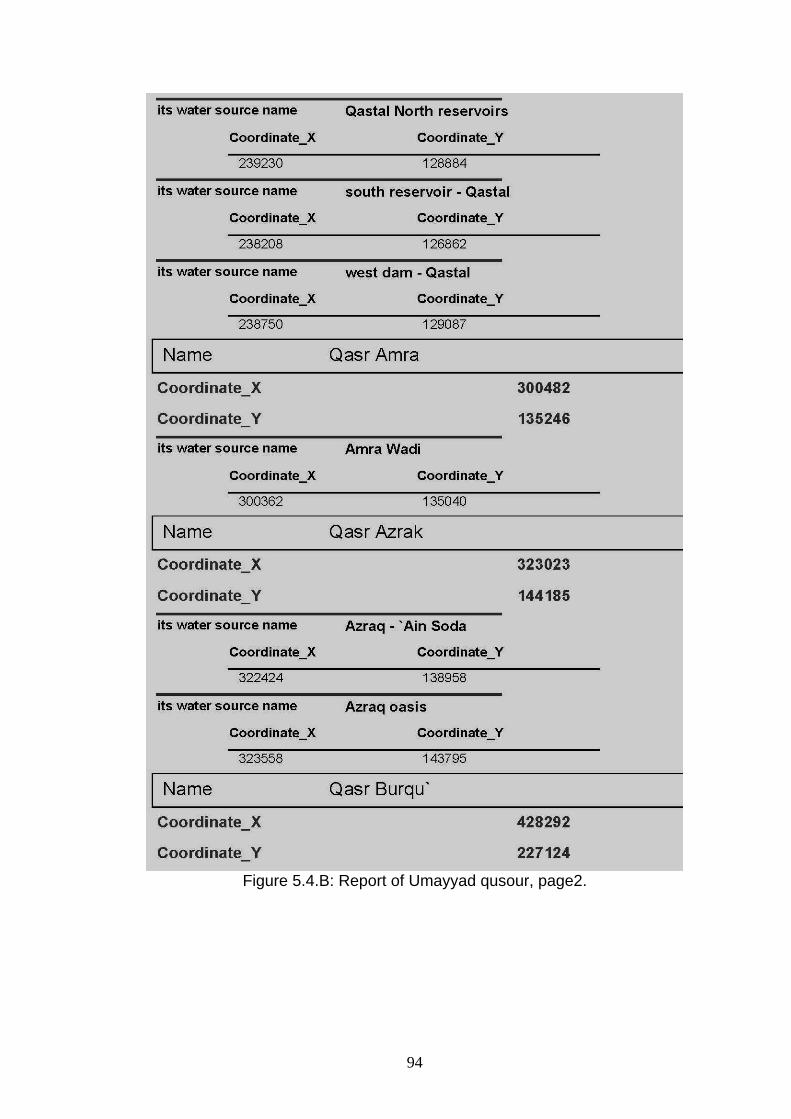
94
Figure 5.4.B: Report of Umayyad qusour, page2.

95
Figure 5.4.C: Report of Umayyad qusour, page3.

96
Figure 5.4.D: Report of Umayyad qusour, page4.
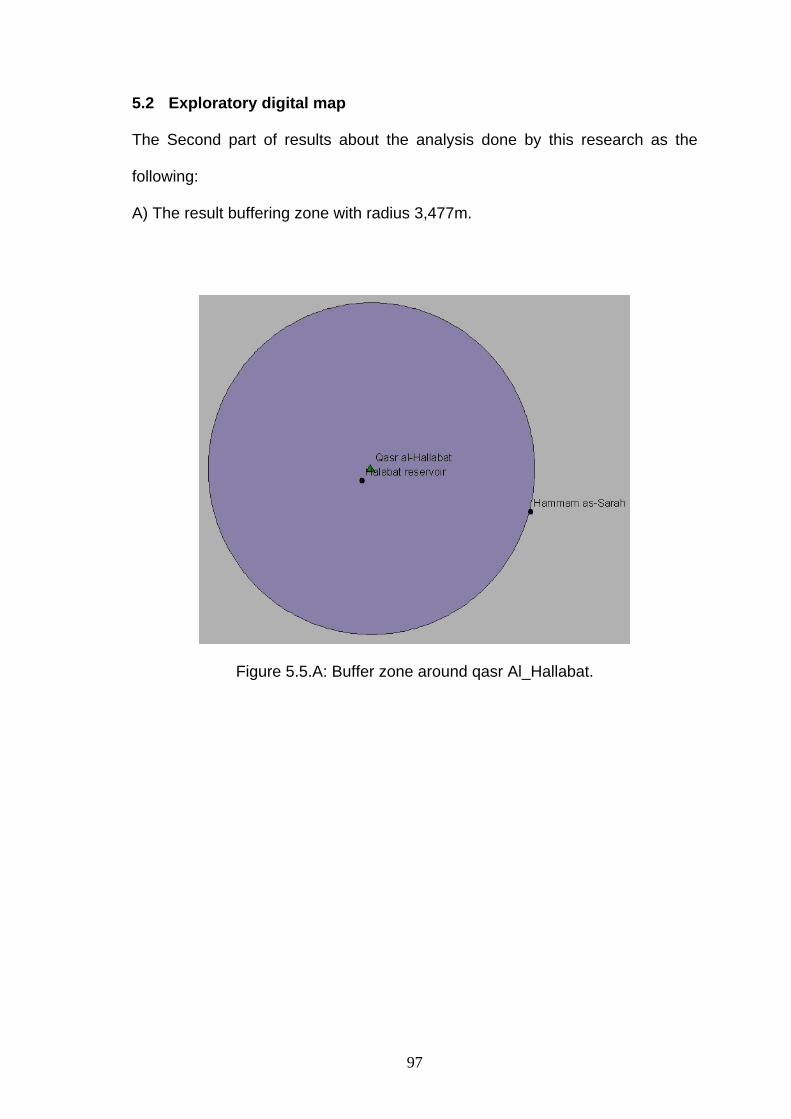
97
5.2 Exploratory digital map The Second part of results about the analysis done by this research as the
following:
A) The result buffering zone with radius 3,477m.
Figure 5.5.A: Buffer zone around qasr Al_Hallabat.
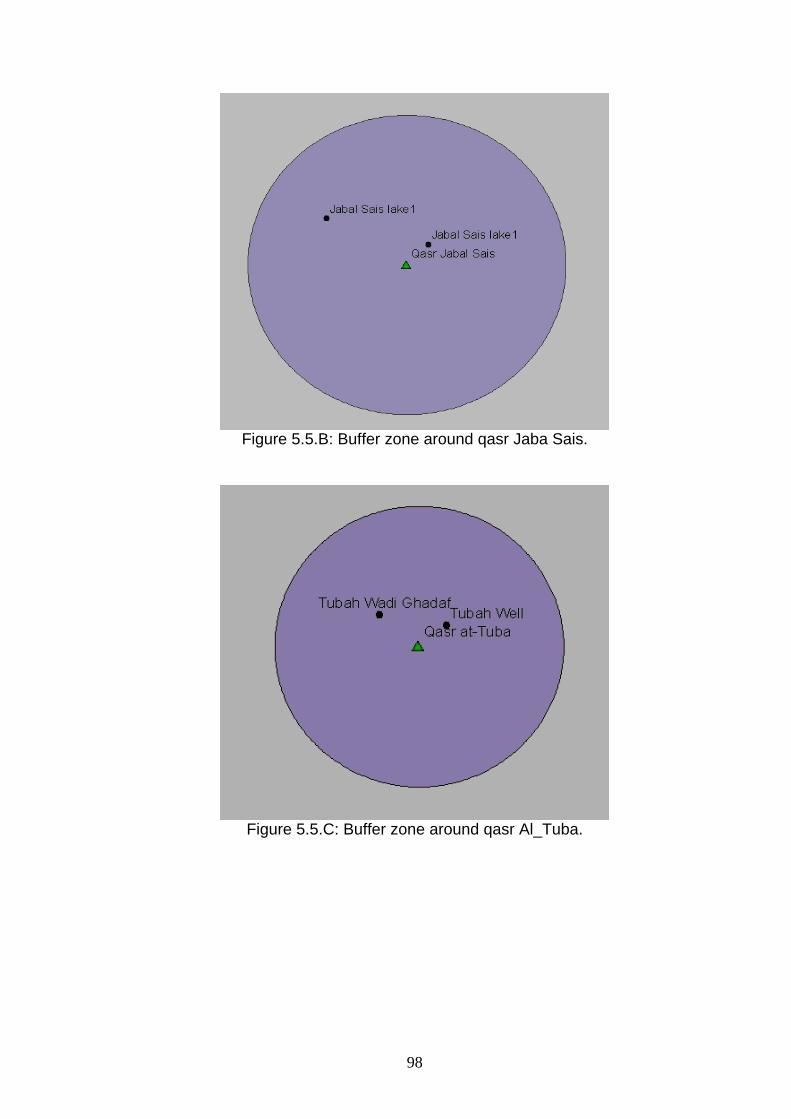
98
Figure 5.5.B: Buffer zone around qasr Jaba Sais.
Figure 5.5.C: Buffer zone around qasr Al_Tuba.

99
Figure 5.5.D: Buffer zone around qasr Burqu.
Figure 5.5.E: Buffer zone around qasr Al_Amra.

100
Figure 5.5.F: Buffer zone around qasr Haranah.
Figure 5.5.G: Buffer zone around qasr Al_Muwaqqar.

101
Figure 5.5.H: Buffer zone around qasr Umm Al_Walid.
Figure 5.5.I: Buffer zone around qasr Mushatta.
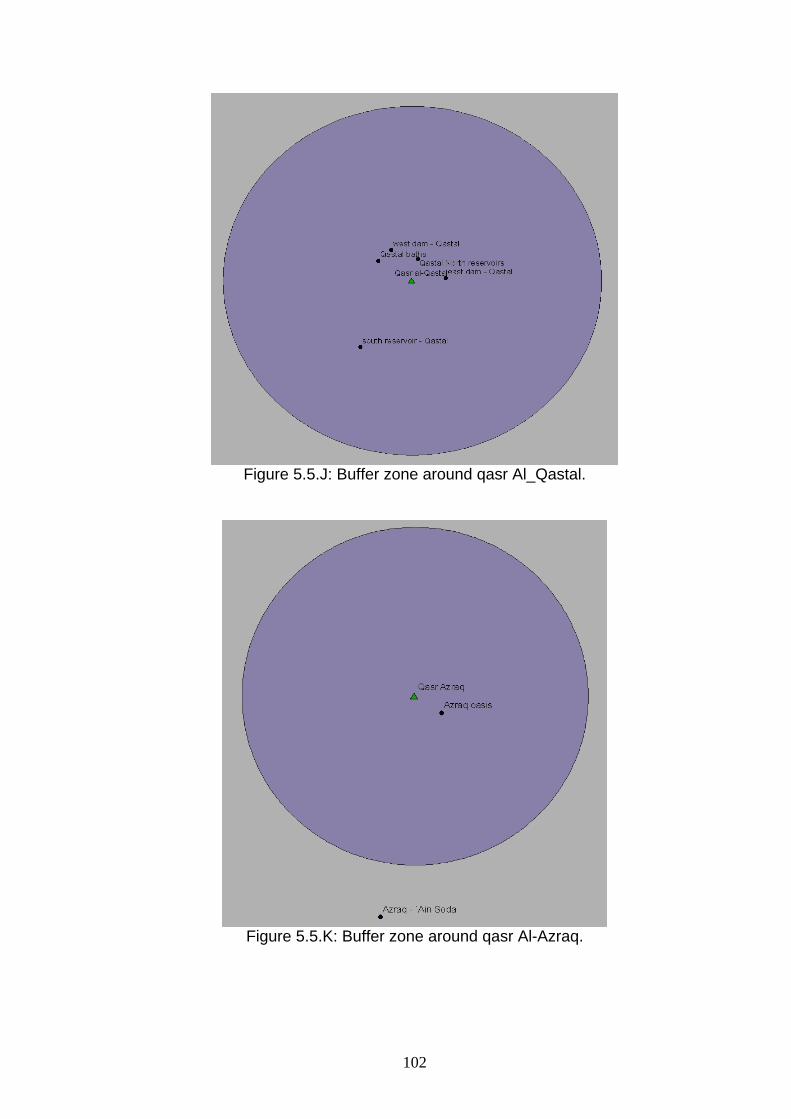
102
Figure 5.5.J: Buffer zone around qasr Al_Qastal.
Figure 5.5.K: Buffer zone around qasr Al-Azraq.
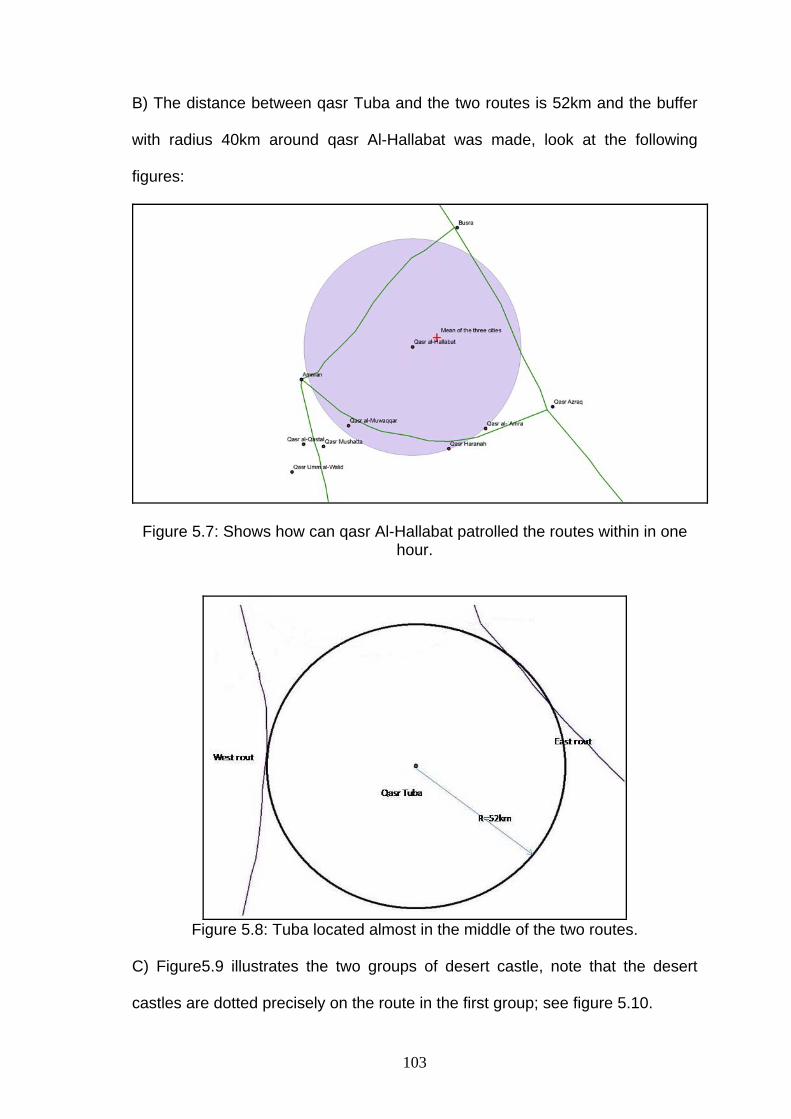
103
B) The distance between qasr Tuba and the two routes is 52km and the buffer
with radius 40km around qasr Al-Hallabat was made, look at the following
figures:
Figure 5.7: Shows how can qasr Al-Hallabat patrolled the routes within in one hour.
Figure 5.8: Tuba located almost in the middle of the two routes.
C) Figure5.9 illustrates the two groups of desert castle, note that the desert
castles are dotted precisely on the route in the first group; see figure 5.10.

104
Figure 5.9: Two groups of Desert castles.
Figure 5.10: First group dotted precisely on the route.
The second group of desert castles has a different distribution pattern;
figure5.12 illustrates the distribution pattern and the circle buffer zone around
the qusour that located a long of the diagonal, the circle’s radius was 17km.

105
Figure 5.11: Distribution of qusour , diamond shape and buffer zones.
5.3 Line-of-sight communication
The researcher checked up all of terrain profiles between desert castles, then
he find out that there is unobstructed line-of-sight communication between qasr
Azraq and Amra, Muwaqqar and Haranah, Muwaqqar and Mushatta, Muwaqqar
and Qastal, Muwaqqar and Umm al-Walid, Qastal and Umm al-Walid, Umm al-
Walid and Mushatta and between Qastal and Mushatta. See figure5.12 and
figures5.13.

106
Figure 5.12: Distribution of qusour, diamond shape and buffer zones.
Figure 5.13.A: Terrain profiles between Umm al-Walid and Mushatta.

107
Figure 5.13.B: Terrain profiles between Azraq and Amra.
Figure 5.13.C: Terrain profiles between Qastal and Mushatta.

108
Figure 5.13.D: Terrain profiles between Muwaqqar and Haranah.
Figure 5.13.E: Terrain profiles between Muwaqqar and Mushatta.

109
Figure 5.13.F: Terrain profiles between Muwaqqar and Qastal.
Figure 5.13.G: Terrain profiles between Muwaqqar and Umm al-Walid.

110
Figure 5.13.H: Terrain profiles between Qastal and Umm al-Walid.
5.4 Result of Quadrant Count Method Then the result as the following:
Figure 5.14: A region into 16 quadrants illustrates points’ intensity.

111
TABLE 5.2: Results of conducting Quadrat Analysis.
Name results
Quadrats number 16 Quadrat length 0.555551degree Vertical step 4 Horizontal step 4 Average of points per quadrat 0.6875 Frequency 10,2,3,1 Variance 1.40341 Variance to mean ratio(VTMR) 2.32847 K-S-D statistic 0.459951 Critical value of K-s statistic with Alpha 5%:
0.391
The result of quadrant cont analysis indicates the qusour pattern is clustered
because the VTMR>1; VTMR =2.32847.
H0: The distribution of desert castle is not significantly different than random.
Ha: The distribution of desert castle is significantly different than random.
K-S-D > Critical value with Alpha 5%, so that we reject the null-hypothesis.
Where K-S-D=0.459951 and Critical value=0.391

112
CHAPTER SIX
6.1 Discussion
This study uses GIS techniques to develop a geo-database and digital map for
the Umayyad qusour. Historians can utilize this product in order to develop and
test hypotheses about the qusour, linking features on the map with their
attributes and producing reports which display information in a well-managed
and comprehensible format. GIS is especially useful because it displays
quantitative analysis visually. In addition viewer can conduct a variety of spatial
analyses in this product, so that anyone extract information from the resulting
map. One can make analysis, for example, measuring distance between
features or finding point pattern, and in a variety of other ways.
The relationship between the qusour and their water sources grows out of the
simple fact that desert travelers must stop at water sources. By placing the
qusour close to these scarce water resources, the builders of the qusour
effectively exert power over the water sources. The perennial water sources
were not built by the Umayyads, but the extensive water infrastructure
associated with the qusour maximized their potential and displayed their power
over the region. Therefore the researcher used the distance between qasr
Al_Hallabat and the bath complex Hammam as_Sarah, which has been
demonstrated archaeologically to be associated with the construction of the
qasr, as an example of a relationship between water sources and the qusour.
The distance was 3,477meters. Buffers around the qusour were made with

113
radius 3,477m. Thus is it is possible to visualize which water sources lie
outside the buffer area. Water sources which lie inside the buffer are
interpreted as having a positive association with the qasr. If the source of water
is located out of the buffer, it is interpreted to have no indicator for a positive
association. Ain Soda, which "lies outside a buffer," is complex of water
systems – but there is no associated qasr; therefore our assumption is unable
to demonstrate whether there is a positive association or not.
To get better understanding, results of buffers were summarized in the table in
Table 6.1.

114
TABLE 6.1: Significant location between desert castle and their water sources or water infrastructure.
No Name Water_name Distance<=3,477m Significant
dam1 Umm al-
Walid yes yes
1 Umm al-
Walid dam2 Umm al-
Walid yes yes Qastal baths yes yes
south reservoir
- Qastal yes yes
east dam -
Qastal yes yes
west dam -
Qastal yes yes
2 qasr al-Qastal
Qastal North reservoirs yes yes
3 qasr
Mushatta Mushata cisterns yes yes
4 qasr al-
Muwaqqa Muwaqqar reservoirs yes yes
Hammam as-
Sarah yes yes
5 qasr al-Hallabat
Halabat reservoir yes yes
Wadi ad-Dab`a yes yes
6 qasr
Haranah Wadi2 yes yes Tubah Well yes yes
7 qasr Tuba Wadi al-Ghadaf yes yes
8 qasr Amra Wadi al-Butm yes yes
Azraq - `Ain
Soda No No
9 qasr Azraq Azraq oasis yes yes
Jabal Sais
lake1 yes yes
10 qasr Jabal
Sais Jabal Sais
lake2 yes yes
11 qasr
Burqu` Burqu Lake yes yes

115
From the figure above there is one record out of 21 records located out of the
buffer, i.e., 1/21=0.047619. This indicates that the water sources for Umayyad
qusour tend to be located significantly close to each other more than 95%.
The desert castles are carefully situated at water sources and in the landscape
to monitor important routes of transhumance, specifically access to Damascus.
If some travelers come up Wadi Sirhan, they would have to go east or west
around the black desert to get to Damascus, see Figure 6.2. If they go east,
they have to go around the black desert and there is no water available on that
route except at qasr Burqu` and Jabal Sais, which is why there are qusour
there. If they go west of the Harrah they have been observed by the second
group of qusour, which are clustered at the outlet of Wadi Sarhan. Azraq-Amra-
Haranah-Muwaqqar-Mushatta-Qastal-Umm al-Walid provide a strong net of
communications around the outlet of Wadi Sirhan. Qasr Al_Hallabat and Qasr
Tubah function more as two main patrol stations (see figure 5.12).
The second group of desert castles has different functionality characteristics
than the first group. For example: if some travelers come from south, they would
travel the Jawf-Wadi Sarhan route or the Ma’an-Amman route on which they
would face official observation from Umayyad cavalry. The southernmost patrol
station, Qasr Tubah, is located exactly in the middle of these routes around
52km. Umayyad cavalry will convey the information to their stations in
approximately 78 minutes, because speed of camels is approximately 40km per
hour. The information could have been evaluated and then conveyed once
again to the nearest qasr within 69 minutes. The nearest qasr to Qasr Tuba is

116
Qasr al-Harranah, part of the network of communications, so the whole qusour
along the diagonal of the diamond shape would have been informed. If there
were any danger the Umayyads could close of the south part of Jordan from the
north part. If travelers came from north, it would have been the same
procedure, except that the patrolled station would have been Qasr Al_Hallabat,
and it would have taken 55 minutes for the information to reach (place).

117
Figure 6.1: Possess of patrolling

118
Figure 6.2: Travel routes between political centers of Kufa, Madina, Mekkah &
Damascus.

119
We conducted quadrant analysis to examine the distribution pattern of the
desert castles (qusour). The result was clustered, and this indicates that the
locations of the qusour depend on something. Consulting the information in
Figure 6.2 reveals that the location of qusour are situated in this way because of
the relative positions of the Harrah, the outlet of Wadi Sarhan, the positions of
water sources and the resulting disposition of travel routes.
6.2 Conclusion
The Umayyad qusour are usually dismissed as "pleasure palaces" or "hunting
lodges," even by prominent scholars (e.g., Cresswell 1969; Hilllenbrand 1982;
Bisheh 1985, 1998). Some scholars of the period are, however, beginning to
argue that these prominent structures were strategic interventions in the
landscape (Addison 2000, Almagro 1992, Arce 2008, King 1992. Spatial
depiction of the co-occurrence of the qusour, trade/ travel routes and perennial
water sources support the notion that the Umayyad dynasty poured resources
into building the qusour for highly functional purposes.
The major political centers of the time were Kufa, Madina and Damascus.
Damascus was the center of the Umayyad caliphate. Kufa and Madina were
the centers of opposition to the Umayyads. Therefore the Umayyad caliphs had
good reason to monitor carefully the routes which led to Damascus from these
rival political centers.

120
Most of relationships between the qusour and their geographical context are
only hinted at in the historical sources. The argument summarized above
becomes much more powerful when these spatial relationships are represented
and analyzed in GIS.
Spatial analysis draws data from archival and archaeological research and
reconfigures it spatially and visually. This reconfiguration not only makes it
easier to draw and demonstrate relationships between phenomena, the attribute
data has established links to maps for visual analysis. Any statistic we can think
of to describe the data then automatically has geographic properties and as a
result can be placed on maps for visual processing.
This argues that the Umayyad qusour were built strategically at perennial water
sources in order to monitor routes of transhumance amongst the socio-political
centers of the period. The objectives of the study are to construct a geo-
database and digital map of the Umayyad qusour in their geographical context
and to conduct a visualization and spatial analysis of the distribution of the
qusour.
This study suggests that there are significant patterns in the locations of the
Umayyad qusour, there is unobstructed line-of-sight communication between
each qasr and its neighboring qusour among the group located west of Harrah,
and there is a quantifiable relationship between the qusour, perennial water
sources, and established trade routes. These patterns suggest strategic
placement of the qusour.

121
Methods used were construction of a geo-database and digital map, a
visualization, as well as proximity analysis and quadrant analysis.
The results of the analysis show that Umayyad qusour are carefully situated at
routes of transhumance and the water sources. The distribution pattern of the
Umayyad qusour is clustered at the out let of Wadi Sarhan, There is actually
line-of-sight communication between Azraq, Amra, Haranah, Muwaqqar, Umm
al wlaid, Mushatta, and Qastal, and there is a positive association between
Umayyad qusour and their water sources. These results derived from GIS and
spatial analyses, support the argument of Addison, Almagro, Arce and King.
6.3 Recommendations GIS has typically been employed for the social sciences, environmental and
engineering disciplines. Until now, historians have relied mainly on textual,
architectural and art-historical analyses of the qusour in order to understand
Umayyad state architecture, also most of relationships between the qusour and
their geographical context are only hinted at in the historical sources. It would
become much more powerful when these spatial relationships are represented
and analyzed in GIS. Therefore we recommend researchers using GIS and
spatial analysis in their researches problem in the humanities.

122
REFERENCES Addison, E, 2000. "The Limes Interior: the Umayyad qusour in political
context." Unpublished presentation to the Fulbright Commission, Amman, Jordan.
Addison, E, 2000. “The Mosque at al-Qastal: report from al-Qastal Conservation
and Development Project, 1999-2000,” ADAJ, XLIV, 477-90. Addison, E, PhD. MLA , 2008 , Director of Research & Design, Royal Botanic
Garden,Tel al-Rumman, Jordan, tel. +962 [0]3 215 5083, cell +962 [0]79 679 0530, (personal communication).
Almagro, A. 1992. Building Patterns in Umayyad Architecture in Jordan.
Studies in the History and Archaeology of Jordan, IV: 351-356. Arce, I. 2008. Director of the Spanish Archeological Mission in Amman, Jordan.
(personal communication). Arthur J, Lembo .Jr , 2008, Cornell University. Hhttp://72.14.235.132/search?q=
cache:xkTzaBxaoogJ:www.css.cornell.edu/courses/620/lecture8.ppt+Arthur+J.+Lembo,Jr.+cornell+University&hl=en&ct=clnk&cd=1&gl=myH accessed on December 15 2008.
Bacher, J. (1989). ‘Introduction to cluster analysis using SPSS-X for historians
and social scientists’ , Historical Social Research 14 (2): 6-167. Bailey .T. C, Gatrell A 1995, Interactive spatial data analysis. Harlow,
Longman. Bartley, K, Campbell, B. M. S. 1995. Inquisitiones Post Mortem, GIS, and the
creation of a land-use map of medieval England. Transactions in GIS, 2. 333-346).
Batini, C., Ceri .S, Kant .S, Navathe. B. 1991.,Conceptual Database Design: An
Entity Relational Approach. The Benjamin/Cummings Publishing Company,
Bengtsson, T., Dribbe, M. (2002). ‘Fertility Response to Economic Stress.
Deliberate control or Reduced Fecundability?’ Lund Papers in Economic History 78.
Bisheh, G. 2008. Former Director of the Department of Antiquities, Jordan.
(personal communication). Bisheh, G. 1985. Qasr al-Hallabat: an Umayyad Desert Retreat or farm-Land.
Studies in the History and Archaeology of Jordan, !I: 263-265.

123
Bisheh, G. 1998. The Umayyad Monuments between al-Muwaqqar and `Azraq:
Palatial residences or caravanserais? (unpublished manuscript). Bisheh, G. 2000. Liber Annuus: Annual of the Studium Biblicum Franciscanum
Jerusalem (4311-438). Accessed 24 Nov 2008: Hhttp://198.62.75.1/www1/ofm/sbf/Books/LA50/431BishehH.
Boonstra , O.W.A. (2001). ‘Breukvlakken in de Eenwording van Nederland’, in:
J.G.S.J.v. Maarseveen and P.K. Doorn, Nederland een eeuw geleden geteld. Een terugblik op de samenleving rond 1900 Amsterdam: iisg, 277-298.
Boonstra. O, Breure. L, Doorn. P, (2004) ‘past, present and future of historical
information science’ :Accessed on August 24 2008. http://hist.msu.ru/Departments/Inf/Stud/Heuristics/Reader/PPFofHIS.pdf
Boonstra, O.W.A, Doorn, P.K , Hendrickx, F.M.M. (1990). ‘Voortgezette
Statistiek voor Historici’. Muiderberg: Coutinho. Bryk, A.S, Raudenbush, S.W. (1992). Hierachical Linear Models. Applications
and Data Analysis Methods. Newbury Park: Sage. Burrough, Peter. A, Rachael. A, McDonnell. (1998). Principles of Geographic
Information Systems. p 27. fig. 2.6. Camel-racing, (2008) Hhttp://www.nationmaster.com/encyclopedia/ Camel-racing Haccessed on DecemberH 13 2008. Chiu, H., Lee, J., Koshak, N. (2002) ‘Visualization of Spatial-Temporal
Information for Historical Sites on GIS’ Accessed on 24 August 2008. http:// www.geocomputation.org/2005/Abstracts/Chiu2.pdf. Chou, YH, 1997. Exploring Spatial Analysis in Geographic Information Systems.
Santa Fe, N. Mex.: OnWard120Press. Chrisman , N. R. (2002) ‘Exploring Geographical Information Systems’, 2nd ed.
(New York, 2002). Clarke KC (1997) Getting Started with Geographic Information Systems
Prentice Hall: Upper Saddle River, NJ. Cresswell, K.A.C. 1969. Early Muslim Architecture (2 vols.). Oxford University
Press. Dana. T, 1990, ‘Geographic Information Systems and Cartographic Modeling’,
Englewood Cliffs, NJ: Prentice-Hall, page xi. Date, C. J. 1990, An Introduction to Database Systems, 5th ed. Addison-
Wesley.

124
Debuisson , M. (2001). ‘The Decline of Infant Mortality in the Belgian Districts at
the Turn of the 20th Century’, Belgisch Tijdschrift voor Nieuwste Geschiedenis 31 (3-4):
Delger , H.E. (2003). Nuptiality and Fertility: an Investigation into Local
Variations in Demographic Behaviour in Rural Netherlands about 1800 Hilversum: Verloren.
DeMers, M. N. (2000) ‘Fundamentals of Geographic Information Systems’, 2nd
ed. (New York, 2000). Drobnic,S., Blossfeld, H.P. , Rohwer, G. (1999). ‘Dynamics of Women’s
Employment Patterns over the Family Life Course: a Comparison of the United States and Germany’, Journal of Marriage and the Family 61 (1): 133-146.
Erum T, 2004 ‘Introduction to Point Pattern Analysis, Math 402, Spring 2004. ESRI, 1990, ‘Understanding GIS: The ARC/INFO Method’,Redlands, CA:
Environmental System Research Institute, page 1.2: ESRI, 2002,’Place. GIS for history. Redlands, CA: ESRI Press. Feeney,M., Ross, S. (1993). Information technology in humanities scholarship:
British achievements, prospects and barriers. London: British Library and British Academy.
Fleming, 1989. Candace C. and Barbara von Halle. Handbook of Relational
Database Design. Addison-Wesley. Galt , A.H. (1986). ‘Social Class in a Mid-Eighteenth-Century Apulian Town:
Indications from the Castato Onciario’, Ethnohistory 33 (4): 419-447. Gilberto, C., Antônio, M. M, Suzana, D. F, Marília, S.C. (2004) ‘Spatial Analysis
and GIS: A Primer’ HUhttp://www.dpi.inpe.br/gilberto /tutorials/spatial_analysis/spatial_analysis_primer.pdfUH. Accessed on August 24 2008.
Gis.usu, 2008, Hhttp://www.gis.usu.edu/~tl009/lab8.htm#Assignment%20#7 H.
Accessed on November 29 2008. Goerke,M. (1994). Coordinates for Historical Maps. St. Katharinen: Halbgraue
Reihe. Goodchild M F, Haining R P, Wise S and others 1992, Integrating GIS and
spatial analysis — problems and possibilities. International Journal of Geographical Information Systems.
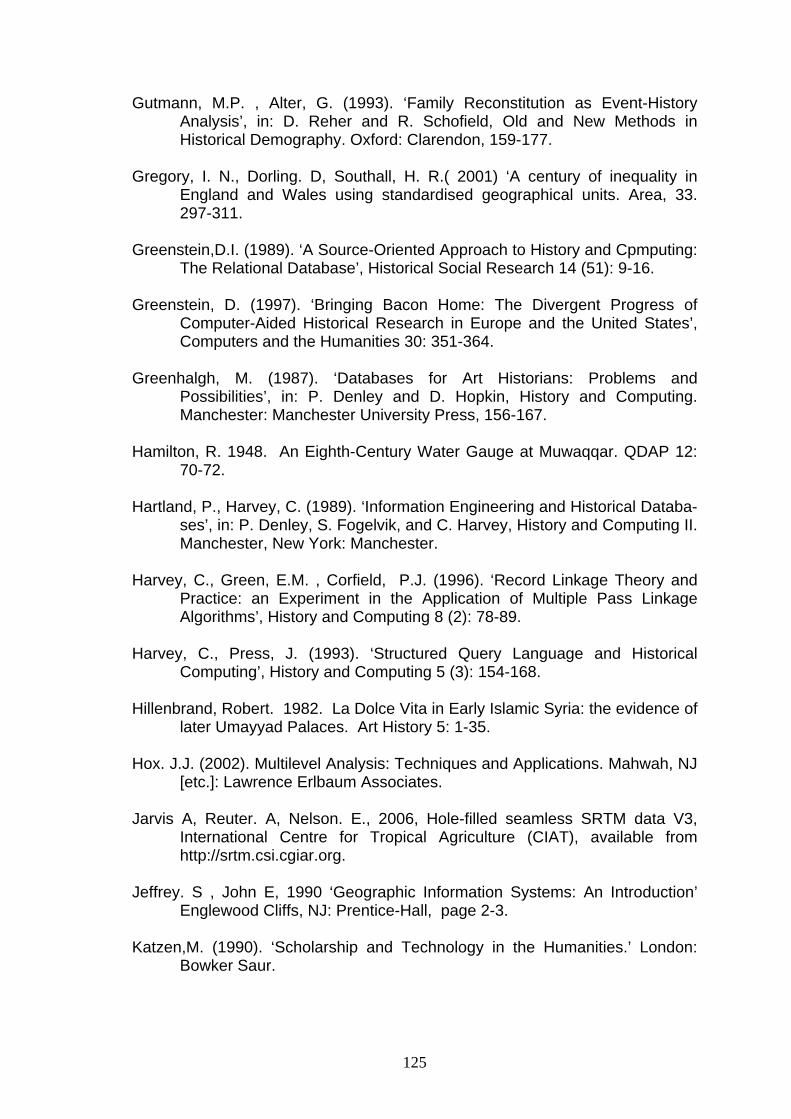
125
Gutmann, M.P. , Alter, G. (1993). ‘Family Reconstitution as Event-History Analysis’, in: D. Reher and R. Schofield, Old and New Methods in Historical Demography. Oxford: Clarendon, 159-177.
Gregory, I. N., Dorling. D, Southall, H. R.( 2001) ‘A century of inequality in
England and Wales using standardised geographical units. Area, 33. 297-311.
Greenstein,D.I. (1989). ‘A Source-Oriented Approach to History and Cpmputing:
The Relational Database’, Historical Social Research 14 (51): 9-16. Greenstein, D. (1997). ‘Bringing Bacon Home: The Divergent Progress of
Computer-Aided Historical Research in Europe and the United States’, Computers and the Humanities 30: 351-364.
Greenhalgh, M. (1987). ‘Databases for Art Historians: Problems and
Possibilities’, in: P. Denley and D. Hopkin, History and Computing. Manchester: Manchester University Press, 156-167.
Hamilton, R. 1948. An Eighth-Century Water Gauge at Muwaqqar. QDAP 12:
70-72. Hartland, P., Harvey, C. (1989). ‘Information Engineering and Historical Databa-
ses’, in: P. Denley, S. Fogelvik, and C. Harvey, History and Computing II. Manchester, New York: Manchester.
Harvey, C., Green, E.M. , Corfield, P.J. (1996). ‘Record Linkage Theory and
Practice: an Experiment in the Application of Multiple Pass Linkage Algorithms’, History and Computing 8 (2): 78-89.
Harvey, C., Press, J. (1993). ‘Structured Query Language and Historical
Computing’, History and Computing 5 (3): 154-168. Hillenbrand, Robert. 1982. La Dolce Vita in Early Islamic Syria: the evidence of
later Umayyad Palaces. Art History 5: 1-35. Hox. J.J. (2002). Multilevel Analysis: Techniques and Applications. Mahwah, NJ
[etc.]: Lawrence Erlbaum Associates. Jarvis A, Reuter. A, Nelson. E., 2006, Hole-filled seamless SRTM data V3,
International Centre for Tropical Agriculture (CIAT), available from http://srtm.csi.cgiar.org.
Jeffrey. S , John E, 1990 ‘Geographic Information Systems: An Introduction’
Englewood Cliffs, NJ: Prentice-Hall, page 2-3. Katzen,M. (1990). ‘Scholarship and Technology in the Humanities.’ London:
Bowker Saur.

126
Kenna, S., Ross, S. (1995). ‘Networking in the Humanities.’ London, etc: Bowker Saur.
Kennedy, H. 1983. The Prophet and the age of the Caliphates. Longman
Press. King. G. 1992. Settlement Patterns in Islamic Jordan: the U mayyads and their
Use of the Land. Studies in the History and Archaeology of Jordan, !V. 369-375
Knowles, A.K., 2002, ed. Past Time, Past Place: GIS for Historians. ESRI
Press. Kreft, I., Leeuw, J.d. (1998). Introducing Multilevel Modelling. London: Sage. Kroenke, David. 1983. Database Processing, 2nd ed. Science Research
Associates. Lee. J, David.W. S, 2001, ‘Statistical analysis with ArcView GIS’ , ISBN 0-471-
34874-0,cloth: alk. Paper. Lo. C.P, Yang .X., (2002), Drivers of land-use/land-cover changes and dynamic
modeling for the Atlanta, Georgia metropolitan area, Photogrammetric Engineering and Remote Sensing 68.
MacDonald. B. M, Black. F. A. 2000 ‘Using GIS for spatial and temporal
analysis in print culture studies: Some opportunities and challenges’, Social Science History, 505-536.
Magic, 2008, Hhttp://www.magic.gov.uk/textonly/Help/to_glossary.asp H) accessed
on December 9 2008. Maic.jmu, 2008, Hhttp://maic.jmu.edu/sic/gis/components.htmH. Accessed on
December 03 2008 Martin, D. 1996 ‘Geographic Information Systems and their socio-economic
applications’, 2nd ed. Hampshire. Martin, James. Information Engineering. Prentice-Hall, 1989. McCarty, W. (1999). ‘Humanities Computing as Interdiscipline’. Derived from
the World Wide Web: Hhttp://www.kcl.ac.uk/humanities/cch/wlm/essays/inter/H. Accessed on August 24 2008.
Michael, F., Goodchild (2000) , Part 1 Spatial analysts and GIS practitioners,
The current status of GIS and spatial analysis, National Center for Geographic Information and Analysis, and Department of Geography,University of California, Santa Barbara, CA 93106-4060, USA (e-mail: [email protected]) UH.

127
Michael. Z, 1999, Modeling Our World, The ESRI Guide to Geodatabase Design, Environmental Systems Research Institute, Inc. ISBN 1-879102-62-5.
Mullings,C. (1996). ‘New Technologies for the Humanities.’ London: Bowker
Saur. Ncgia, 2008, Hhttp://www.ncgia.ucsb.edu/cctp/units/unit47/html/aware_intro.htmlH.
Accessed on December 9 2008. Obinger, H. , Wagschal, U. (2001). ‘Families of Nations and Public Policy’, West
European Politics 24 (1). Parker, S. Thomas, 1987, ‘The Roman Frontier in Central Jordan: Interim
Report on the Limes Arabicus Project, 1980-1985. BAR International Series 340, part II.
Peuquet. 1994. It's About Time: A Conceptual Framework for the
Representation of TemporalDynamics in GIS. Annals of the Association of American Geographers, 84:441-461).
Raffalovich,L.E. , Knoke D. (1983). ‘Quantitative Methods for the Analysis of
Historical Change’, Historical Methods 16 (4): 149-154. Reingruber, Michael C. and William W. Gregory.1994, ‘The Data Modeling
Handbook: A Best-Practice Approach to Building Quality Data Models. John Wiley & Sons, Inc.
Reproject, 2008, Hhttp://gaialab.asu.edu/Jordan/Reproject.php H, accessed on
November12 2008. Ryan. K. S, Ronald R. P, 2001 ‘Database Design’, 800 East 96th St.,
Indianapolis, Indiana, 46240 USA, International Standard Book Number: 0-672-31758-3, pages 11,44,50,68,69,70,71, 72,84,98,99,112,225,223, 210,214,186.
Simsion, Graeme. Data Modeling Essentials: Analysis, Design, and Innovation.
International Thompson Computer Press, 1994. Song, B.K. (2002). ‘Parish typology and the Operation of the Poor Laws in early
Nineteenth-Century Oxfordshire’, Agricultural History Review 50 (2): 203-224.
Speck, W.A. (1994). ‘History and Computing: Some Reflections on the Past
Decade’, History and Computing 6 (1): 28-32. Spree , R. (1997). ‘Klassen- und Schichtbildung im Medium der Privaten
Konsums: Vom Späten Kaiserreich in die Weimarer Republik’, Historical Social Research 22 (2): 29-80.

128
Stephen. C, Guptill. 1995, ‘Elements of Cartography’ 6. th. ed. New York. Teory, Toby J. Database Modeling & Design: The Basic Principles, 2nd ed..
Tobler, W. (1970), ‘A Computer Movie Simulating Urban Growth in the Detroit
Region’, Economic Geography, 46 pp. 234-240. Tristram, H.B. 1873. The Land of Moab. New York. Vasiliadis C.A.; Kobotis A. 1999 ‘Spatial analysis - an application of nearest-
neighbour analysis to tourism locations in Macedonia’ Source: HTourism Management H, Volume 20, Number 1, February, pp. 141-148.
Unwin, D.J. 1995 Geographical Information and the problem of 'error and
uncertainty.' Progress in human geography, 19. 549-558). University of Texas at Tustin. Accessed on December 02 2008.
Hhttp://www.utexas.edu/its/archive/windows/database/datamodeling/dm/erintro.htmlH.
Upton.G, Fingleton. B, 1985 ’Spatial Data Analysis by Example’: Volume 1:
Point Pattern and Qualitative Data, John Wiley. Urice, S.K. 1987.Qasr Kharaneh in the Transjordan. William. H, 1991, ‘Introduction to Urban Geographic Information Systems’ New
York: Oxford University Press, page 27. Woollard, M. (1999). ‘Introduction: What is History and Computing? An Introduc-
tion to a Problem’, History and Computing 11 (1-2): 1-8.

129
APPENDIXES
DEFINITIONS
Accuracy: "The closeness of observations, computations or estimates to the
true value as accepted as being true. Accuracy relates to the exactness of the
result, and is distinguished from precision which relates to the exactness of the
operation by which the result was obtained" (Gittings & Patterson, 1999).
Bilad ash-sham: refers to Jordan, Syria, Palestine, Iraq and Lebanon.
Coordinate system - "A reference system for the unique definition of a location
of a point in n-dimensional space" (Bonham .C, 1994).
Conceptual Model is concerned with the real world view and understanding of
data; the logical model is a generalized formal structure in the rules of
information science; the physical model specifies how this will be executed in a
particular DBMS instance.
Data model - "Collection of concepts allowing for the representation of an
environment according to arbitrary requirements" (Bonham .C, 1994).
Database design: design the logical and physical structure of one or more
databases to accommodate the information needs of the users in an
organization for a defined set of applications.

130
Datum - "1. Any point, line, or surface used as a reference for a measurement
of another quantity. 2. A model of the earth used for geodetic calculations"
(Bonham .C, 1994).
Digitizing - A method of data capture that involves the conversion of data in
hard copy or raster form, such as maps and aerial photographs, into a digital
vector format. This is usually done by a human operator using on a digitizing
tablet or sitting at a computer screen with a mouse, drawing over top of a raster
image. Methods of automated digitizing and semi-automated digitizing also
exist.
Exempla- are the plural of exemplum; an exemplum is one data-sample of
something you are trying to explain.
Feature - "An object in a spatial data base with a distinct set of characteristics"
(Bonham .C, 1994).
Geodetic reference system - "The true technical name for a datum. The
combination of an ellipsoid, which specifies the size and shape of the earth, and
a base point from which the latitude and longitude of all other points are
referenced" (GIS Development, n.d.).
Geographic database - "A collection of spatial data and related descriptive
data organized for efficient storage and retrieval by many users" (GIS
Development, n.d.).

131
GIS is an organized collection of computer hardware, software, geographic
data, and personnel designed to efficiently capture, store, update, manipulate,
analyze, and display all forms of geographically referenced information.(ESRI,
1990)
Global Positioning System - A satellite-based navigational system allowing
the determination of any point on the earth's surfacewith a high degree of
accuracy given a suitable GPS receiver. The network of satellites is owned by
the US Department of Defense. Error in the accuracy of GPS derived positions
can be introduced through the nature of local conditions. These errors can be
greatly reduced using a technique known as differential GPS.
Haranah- was constructed by the Sufyani Umayyads (Urice) – the brief
dynasty established by Abu Sufyan (AD 661-683/ AH 41-63) which immediately
preceded the caliph Marwan, who established the Umayyad dynasty (AD 683-
750/ AH 64-137). The Umayyad dynasty in Syria fell in 750/ 137 to a coup by
the Kufa-based `Abbasids, who launched their takeover from Humeima, a small
settlement on the Hajj route. Caliph `Abd ar-Rahman I escaped (on foot!) to
establish the Umayyad dynasty in Spain, where they ruled until AD 1050.
Kraenzle- is the Geographic Information Team Leader at the Mine Action
Information Center at JMU and the Co-Director of the JMU Applied Spatial
Research Center. He received his Ph.D. degree in natural science at the
University of Munich. Before joining JMU in 1996, Dr. Kraenzle was a
supervisor of the Section "Geographical Services" at E-Plus Mobile

132
Communications in Duesseldorf, Germany. His research interests are in
Geographic Information Systems and Spatial Databases. (maic, 2008).
Map projection - "A method of representing the earth's three-dimensional
surface as a flat two-dimensional surface. This normally involves a
mathematical model that transforms the locations of features on the earth's
surface to locations on a two-dimensional surface. Because the earth is three-
dimensional, some method must be used to depict the map in two dimensions.
Therefore such representations distort some parameter of the earth's surface,
be it distance, area, shape, or direction" (Gittings & Patterson, 1999).
Qasr- (pl. qusour) is not directly translatable into English. These structures
functioned as official reception houses, retreats, residences and centers of
government administration for the first Islamic caliphate. Usually the translation
is "palace," and so the Umayyad qusour are often referred to as the "desert
castles" or "desert palaces."
Raster - "1. An element of a space that has been subdivided into regular tiles
by tessellation. 2. Commonly, a data set, as for an image or DEM, composed of
rasters. 3. Often used as a synonym for grid" (Bonham .C, 1994).
Resolution - "A measure of the ability to detect quantities. High resolution
implies a high degree of discrimination but has no implication as to accuracy"
(Gittings & Patterson, 1999).

133
Shapefile - "An ArcView GIS data set used to represent a set of geographic
features such as streets, hospital locations, trade areas, and ZIP Code
boundaries. Shapefiles can represent point, line, or area features. Each feature
in a shapefile represents a single geographic feature and its attributes" (ESRI,
1998).
Spatial data - "Any information about the location and shape of, and
relationships among, geographic features. This includes remotely sensed data
as well as map data" (Gittings & Patterson, 1999).
Tabular or Attribute Data - A trait, quality or property describing a
geographical feature. A fact describing an entity in a relational data model,
equivalent to the column in a relational table.
Vector - "1. A quantity which has magnitude and direction. 2. Commonly, the
notation used to represent spatial information" (Bonham .C, 1994).
Water source or source of water: The expression refers to the perennial
sources of water and/or water infrastructure; the perennial sources of water
could be springs, lakes, pools, or underground water. The water infrastructure
makes the water from the water sources available; through channels, pipes,
wells, pumps, dams, cisterns and reservoirs.