Embed Size (px)
Citation preview

The South America Land Data Assimilation System(SALDAS)
Luis Gustavo G. De [email protected]
ESSIC University of MarylandNASA Goddard Space Flight Center
LIMA Water Cycle Capacity Building workshopNovember 30 – December 4, 2009

You are going in the right general direction…
…but when you open your eyes, you correct towards the center of the road
(Land surface model)
(Observations)
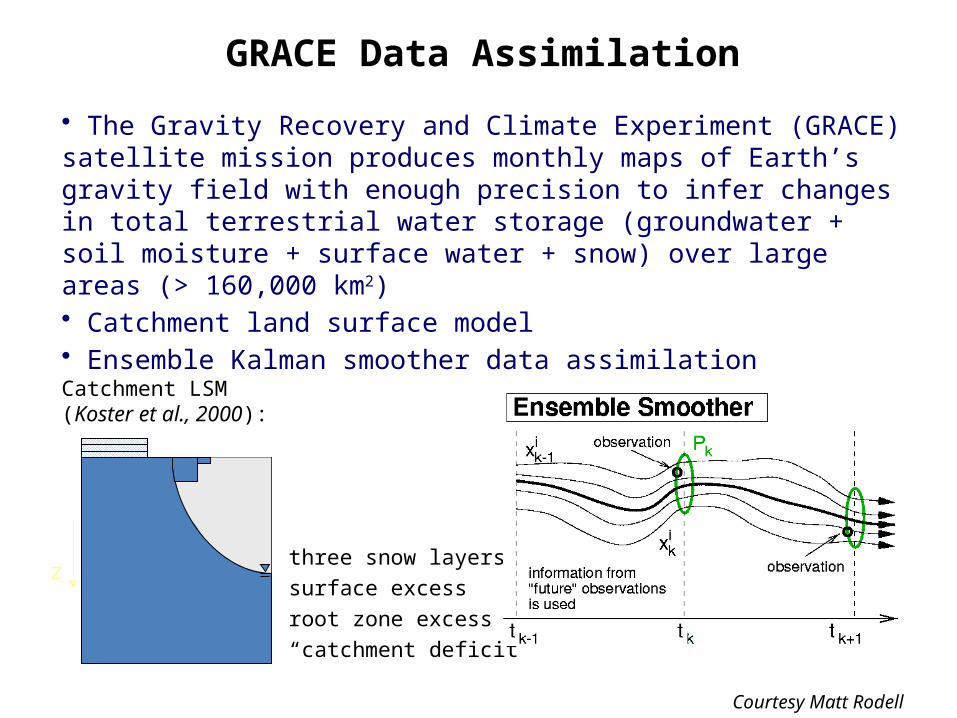
Data Assimilation:Sleepy Driver Analogy
Courtesy Matt Rodell

Weight matrix K depends on model uncertainty.Extended KF:
Linearized dynamic matrix equation for P.
Horizontal error correlations too expensive.EnKF:
Use sample covariance from ensemble.
Nonlinear propagation of uncertainty.Can account for horizontal error
correlations.
Update: xi
(+) = xi(-) + K [ Z - H xi
(-)]
K = P Ht [ H P Ht + R]-1
X = soil moisture state (i-th ensemble member)(-) before update (+) after update
Z = remote sensing dataH = measurement operatorK = weight matrixP = state error covariance
(model uncertainty)R = measurement error cov
(meas. uncertainty)
Ensemble Kalman Filter
Slide credit: Paul Houser
Courtesy Matt Rodell

Goal: combine local observations and parameters with NASA advanced hydrological modeling expertise and capabilities to improve Global and SA NWP, climate and water management through collaboration with various centers (government, universities and research institutes)
•Missions•Land Information System
NASA/GSFC•Local resources (observations)•Human Resources•Central to South America
CPTEC/INPE
SALDAS
REGIONALWeather and ClimateWater Management
GlobalHydromet Databanks
CapacityBuilding
South American Land Data Assimilation System (SALDAS)

South American Land Data Assimilation System (SALDAS)
Background
• SALDAS project seeks to provide accurate, near-real-time and retrospective land surface states over South America
• Quality of land surface model (LSM) output is closely tied to the quality of the meteorological forcing data used to drive the model
• Model and observation-based data used to create high-quality forcing data used by Noah, SSiB, SiB2, CLM2, MOSAIC, and VIC (to be tested) LSMs– Retrospective (2000-2005, CPTEC)– Real-time (2002-Present, CPTEC)
GRACE Data Assimilation
three snow layerssurface excessroot zone excess“catchment deficit”
Catchment LSM (Koster et al., 2000):
z
• The Gravity Recovery and Climate Experiment (GRACE) satellite mission produces monthly maps of Earth’s gravity field with enough precision to infer changes in total terrestrial water storage (groundwater + soil moisture + surface water + snow) over large areas (> 160,000 km2)• Catchment land surface model• Ensemble Kalman smoother data assimilation
Courtesy Matt Rodell
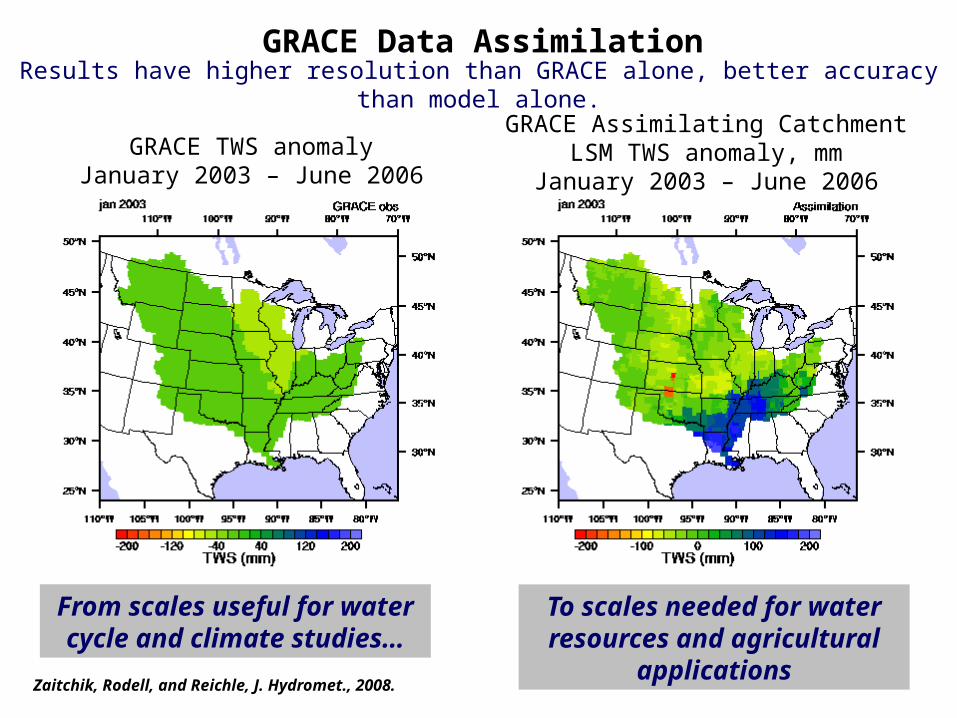
Results have higher resolution than GRACE alone, better accuracy than model alone.
GRACE TWS anomalyJanuary 2003 – June 2006
GRACE Assimilating Catchment LSM TWS anomaly, mm
January 2003 – June 2006
From scales useful for water cycle and climate studies…
To scales needed for water resources and agricultural
applications
GRACE Data Assimilation
Zaitchik, Rodell, and Reichle, J. Hydromet., 2008.

Upper Mississippi
colu
mn
wat
er (m
m)
Ohio-Tennessee
colu
mn
wat
er (m
m)
Missouri
colu
mn
wat
er (m
m)
Lower Miss-Red-Arkansascolu
mn
wat
er (m
m)
Modeled Water Storage
Model-GRACE Assimilation
GRACE Water Storage
LDAS models produce continuous time series; near-real time capable.
Mississippi River sub-basins
Daily estimates are critical for
operational applications
Monthly GRACE data anchor model
results in reality
GRACE Data Assimilation

LDAS models produce continuous time series; near-real time capable.GRACE Data Assimilation
LPB Implementation plan 2005

Schematic representation of the land surface modeling into the NASA Land Information System (LIS), a multi-LSM distributed framework where SALDAS in built upon. (S.V. Kumar, et al, 2006)
South American Land Data Assimilation System (SALDAS)
NASA Land Information System (LIS)

• 3-Hourly files• 1/8th and 1/10th Degree over
Equator• Quality controlled, adjusted for
terrain height• Modeled and observation-based
fields
Spatial Domain
South American Land Data Assimilation System (SALDAS)
Forcing Specification

Atmospheric Forcing Fields• Model-Based Estimates of Standard Climate Station Data
– Temperature ( 2 m assuming grass)– Specific Humidity ( 2 m assuming grass)– U East-West Wind Component (10 m assuming grass)– V North-South Wind Component (10 m assuming grass)– Surface Pressure ( 0 m assuming grass)
• Observation-Based Data– Downward Shortwave Radiation– Precipitation
South American Land Data Assimilation System (SALDAS)

Terrain Height Adjustment
South American Land Data Assimilation System (SALDAS)
• ETA temperature, pressure, humidity and longwave radiation adjusted for differences in ETA versus LDAS terrain height
• Temperature and pressure corrected using standard lapse rate• Specific humidity and longwave radiation corrected by holding relative humidity
constant
• Corrections of up to 3.7K, 60hPa, 2.24W/m2, 0.06 Kg/kg

South American Land Data Assimilation System (SALDAS)
Forcing File Creation
• Observations not always available, so CPTEC/SARR and CPTEC/ODAS data used as base– Current stage:– SARR, 6 hourly, 40km, 2000-2004 (planned 1979-2008)– Next step:– ODAS, 3 and 6 hourly, 20km, 2002-present (planned 20Km)
• Spatially interpolated to 1/10th degree• Temporally interpolated to 3-hourly data• To be quality controlled using ALMA ranges
CPTEC ETA South American Regional Reanalysis SARRCPTEC ETA Operational Data Assimilation System ODAS

Spatial Distribution of GPCC/GTS Raingauges
Spatial Distribution of CPTEC/INPE Raingauges
(a) (b)
Spatial Distribution of GPCC/GTS Raingauges
Spatial Distribution of CPTEC/INPE Raingauges
(a) (b)
Precipitation

Automated Surface Stations
Courtesy: INMET/INPE
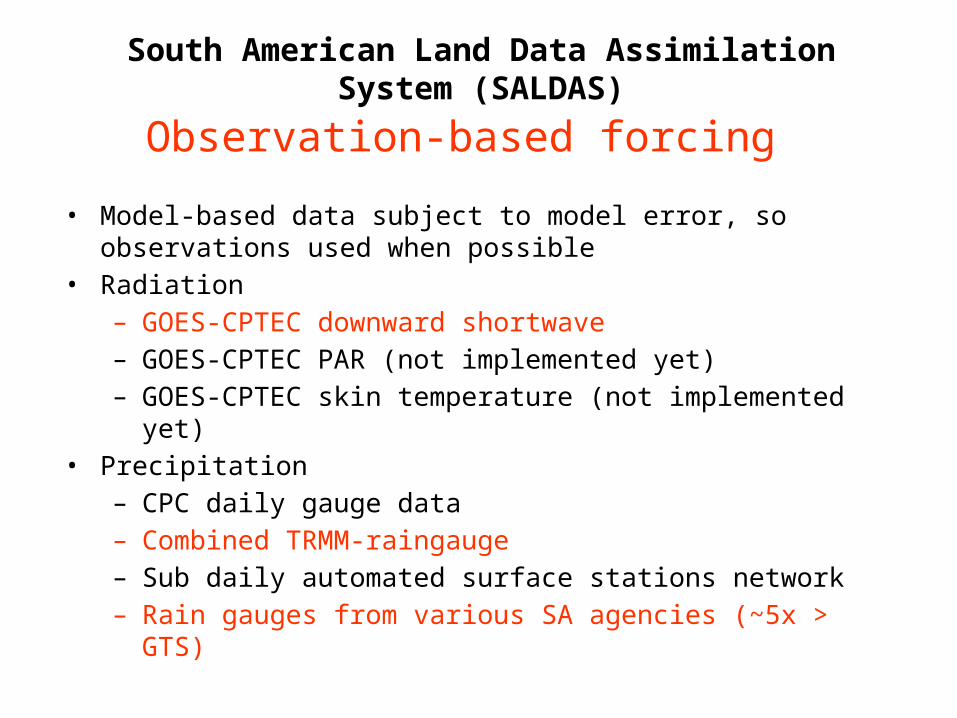
Observation-based forcing
• Model-based data subject to model error, so observations used when possible
• Radiation– GOES-CPTEC downward shortwave– GOES-CPTEC PAR (not implemented yet)– GOES-CPTEC skin temperature (not implemented yet)
• Precipitation– CPC daily gauge data– Combined TRMM-raingauge– Sub daily automated surface stations network– Rain gauges from various SA agencies (~5x > GTS)
South American Land Data Assimilation System (SALDAS)

• GOES data processed at CPTEC/DSA (Divisao de Satelites Ambientais: Environmental Satellites Division) to create 1/25 degree, hourly, instantaneous surface downward shortwave radiation, PAR and skin temperature fields– Interpolated to 1/10th degree
GL 1.2 GOES downward shortwave radiation (W/m2)
SARR downward shortwave radiation (W/m2)
Merged SALDAS downward shortwave radiation (W/m2)
South American Land Data Assimilation System (SALDAS)

Radiation Forcing Processing Statistics
Jan Feb Mar Apr May Jun Jul Aug Sep Oct Nov Dec0
10
20
30
40
50
60
70
80
90
100
110
Shortwave radiation data frequency GL1.2 Model to 2000
%
Months
9Z 12Z 15Z 18Z 21Z monthly rel. freq.
Jan Feb Mar Apr May Jun Jul Aug Sep Oct Nov Dec0
10
20
30
40
50
60
70
80
90
100
110
Shortwave radiation data frequency GL1.2 Model to 2001
%
Months
9Z 12Z 15Z 18Z 21Z monthly rel. freq.
Jan Feb Mar Apr May Jun Jul Aug Sep Oct Nov Dec0
10
20
30
40
50
60
70
80
90
100
110
Shortwave radiation data frequency GL1.2 Model to 2002
%
Months
9Z 12Z 15Z 18Z 21Z monthly rel. freq.
Jan Feb Mar Apr May Jun Jul Aug Sep Oct Nov Dec0
10
20
30
40
50
60
70
80
90
100
110
Shortwave radiation data frequency GL1.2 Model to 2003
%
Months
9Z 12Z 15Z 18Z 21Z monthly rel. freq.
South American Land Data Assimilation System (SALDAS)

Observed RadiationMean difference
SARR - GL1.2 (W/m2)15Z - January 2004
Mean GL1.2 (W/m2)15Z - January 2004

Mean difference SARR - GL1.2 (W/m2)
15Z - June 2004
Mean GL1.2 (W/m2) 15Z - June 2004
Observed Radiation

Precipitation• Make use of TRMM and raingauges analysis data to form best available
product—a temporally disaggregated 3-hourly value
Temporal Disaggregation Process Description: Use of rain gauge to correct satellite bias precipitationSpatial Resolution: 0.25 degreeTemporal Resolution: total daily precipitationDomain: South AmericaMethodology: Use TRMM sub-daily precipitation pulses to dissagregate the total daily
amounts.
• Make use of TRMM and rain gauges analysis data to form best available product—a temporally disaggregated 3-hourly value
Temporal Disaggregation Process
Data interpolated to 1/8th degree
TRMM-3B42RT total daily ingestion at 0.25º
combined with rain gauges
Temporally dissagregate raingauge to 3-hour using 3B42RT hourly weights,
conserving the total daily precipitation
3B42RT 3-hourly precipitationpulses at 0.25º
Note:*3B42RT data used to derivetemporal disaggregation weights*Sum of hourly data values equals original daily TRMM/gauges total
Note:•3B42RT data used to derive temporal disaggregation weights•Sum of hourly data values equals original total daily TRMM/gauge•Additive/Ratio Bias correction (Vila et al, 2009) JHM

South American Land Data Assimilation System (SALDAS)
Implement data assimilation techniques (EKF, EnKF) for low data density regions Participants: CPTEC, NASA, COLA, GMU, University of Arizona, Utah University, IPH,
Universidade de Vicosa, Universidade de Santa Maria
Streamflow data assimilation (use of ANA monitoring capabilities for determining average soil moisture over low data density basins)Soil moisture data assimilation (combine AMSR-E Aqua satellite estimates with ground based observations over areas with low vegetation cover) PCD’sSkin temperature data assimilation (remote sensed skin temperature, DSA derived, combined with surface observations) PCD’s
SENAMHI (Peru)?

South American Land Data Assimilation System (SALDAS)
Eta
CPTECRPSAS
Observations Error Stats
LSM
LSM4DDA
EKF/EnKF
Observations Error Stats
Eta
LSM
An operational implementation of a land surface data assimilation into the CPTEC-INPE ETA/PSAS/LTEKF atmospheric data assimilation cycle
… Timestep1
Timestep2
Timestep …3
SALDAS SALDAS SALDAS

Modeling Activities Summary
LDAS Applications
LDAS ODAS
Uncoupled Land Data
Assimilation
CoupledEarth SystemModel with
Atmospheric,Land and
Ocean Data Assimilation
ADAS
Current
Future

South American Land Data Assimilation System (SALDAS)
La Plata Basin: high spatial and temporal resolution runs help to improve the understanding of the hydrological and meteorological processes over the region. Under the LIS framework, SALDAS can be set to run at up to 1Km spatial resolution with hourly output.
La Plata basin volumetric soil moisture at 1Km resolution (January 2000)
La Plata basin integrated total runoff (Kg/m2) at 1Km resolution (January 2000)

South American Land Data Assimilation System (SALDAS)
High resolution satellite-based 1Km crop mapping over the LPB
Courtesy: Mutlu Ozdogan

Four LSM’s (NOAH, CLM, MOSAIC and VIC) were run from 1990-2005 using GDAS and NASA’s MERRA as atmospheric forcing.
We are interested on seeing how different models under the same conditions simulate the same period of time.
The focus is on the models spread and mean for simulated water balance variables: surface and subsurface runoff and evaporation and how they compare with input precipitation.
We concentrate on three major basins in South America: Amazonas, Tocantins and La Plata, each with its unique characteristics.
South American Land Data Assimilation System (SALDAS)Multi-model ensemble

South American Land Data Assimilation System (SALDAS)Multi-model ensemble
AM
TC
PL
Three major South American hydrological basins analyzed: Amazonas (blue), Tocantins (green) and La Plata (purple). High resolution simulations (1Km) are being performed at the Parana sub-basin for the La Plata Basin as shown in the figure details.

South American Land Data Assimilation System (SALDAS)Multi-model ensemble
-4e-005
-2e-005
0
2e-005
4e-005
6e-005
8e-005
0.0001
0.00012
0.00014
0 2 4 6 8 10 12 14
Kg
/m2
/s
Month
Mean Monthly Water Balance 1990-2005Precipitation
Surface RunoffSubsurface RunoffEvapotranspirationChange in Storage
0
1e-005
2e-005
3e-005
4e-005
5e-005
0 2 4 6 8 10 12
Kg
/m2
/s
Month
Mean Monthly Surface Runoff 1990-2005CLM
NOAHMOSAIC
VICAverage
0
1e-005
2e-005
3e-005
4e-005
5e-005
6e-005
0 2 4 6 8 10 12
Kg
/m2
/s
Month
Mean Monthly Subsurface Runoff 1990-2005CLM
NOAHMOSAIC
VICAverage
2.5e-005
3e-005
3.5e-005
4e-005
4.5e-005
5e-005
5.5e-005
6e-005
0 2 4 6 8 10 12
Kg
/m2
/s
Month
Mean Monthly Evapotranspiration 1990-2005CLM
NOAHMOSAIC
VICAverage
AM AM
AM AM
South American Land Data Assimilation System (SALDAS)
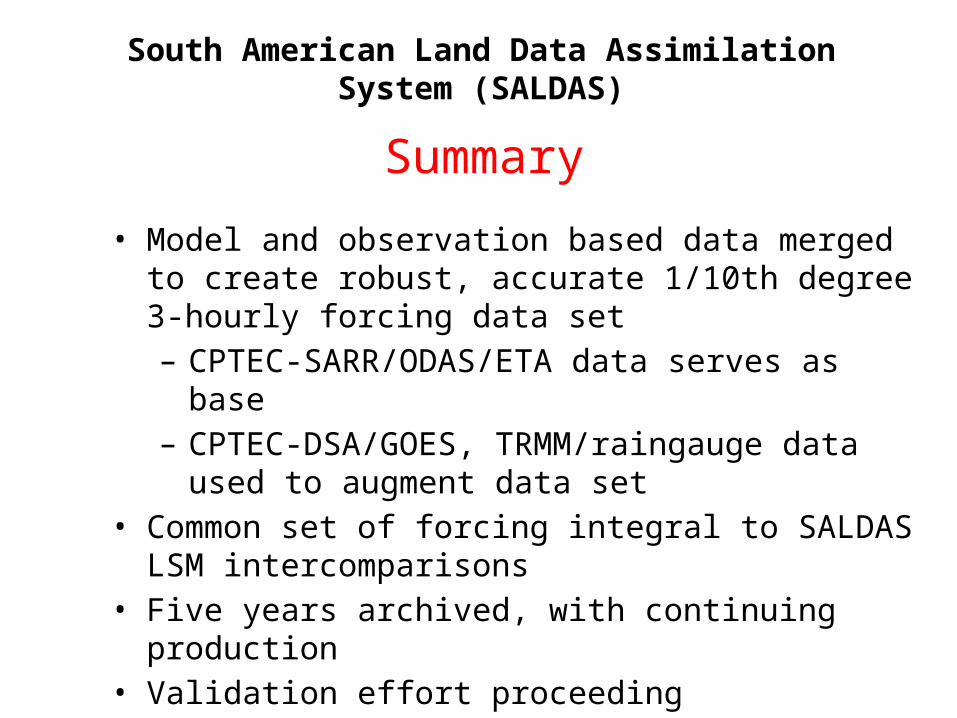
Summary
• Model and observation based data merged to create robust, accurate 1/10th degree 3-hourly forcing data set– CPTEC-SARR/ODAS/ETA data serves as base– CPTEC-DSA/GOES, TRMM/raingauge data used to
augment data set• Common set of forcing integral to SALDAS LSM
intercomparisons• Five years archived, with continuing production• Validation effort proceeding

South American Land Data Assimilation System (SALDAS)
Summary
• High resolution simulations up to 1Km over selected regions (e.g. La Plata basin) with soil moisture and soil temperature DA
• Improvement of ancillary data over regions outside Brazil based on in situ and remote sensing observations (SENAMHI?)

Gracias
Luis Gustavo G. De [email protected]
ESSIC University of MarylandNASA Goddard Space Flight Center
LIMA Water Cycle Capacity Building workshopNovember 30 – December 4, 2009
http://ldas.gsfc.nasa.gov/SALDAS/
ftp://ftp1.cptec.inpe.br/jgerd/SALDAS/Assimila.html

Integrating NASA Earth Sciences Research results into Decision Support Systems for Agriculture and Water Management in South America
Ernesto H. Berbery3, Eric F. Wood4, Maria Assuncao F. Silva Dias5, Osvaldo Luiz L. De Moraes6 and Jurandir Zullo7
&
Latin America Water Resources and Capacity Building
David L. Toll2, Ted Engman2
Luis Gustavo G. de Goncalves1,2
1Earth System Science Interdisciplinary Center, University of Maryland2Hydrological Sciences Branch, NASA Goddard Space Flight Center3Department of Atmospheric and Oceanic Science, University of Maryland4Princeton University5Centro de Previsao do Tempo e Estudos Climaticos/Instituto Nacional de Pesquisas Espaciais6Universidade Federal de Santa Maria7University of Campinas

Paul Simon Water Act for the Poorlegislation that requires special attention to be given to
semi-arid regions such as Northeast Brazil, western Argentina and Atacama
Integrating NASA Earth Sciences Research results into Decision Support Systems for Agriculture and Water Management in South America
NASA Applied Sciences starting FY10
Use of NASA remote sensing and modeling products combined with surface observations at various scales to improve decisions support systems in agriculture, drought and water resources management for South America (SA)
Build upon a partnership between NASA and various U.S. and international agencies and universities to contribute to the dissemination of NASA Earth Sciences research results within that continent
Provide valuable information based on NASA Earth Sciences products to South American national agencies and other end-users
OUTLINE

Integrating NASA Earth Sciences Research results into Decision Support Systems for Agriculture and Water Management in South America
Development of methods to estimate climatic risks of regional individual crops, intercropping and cattle-farming integration systems
The “Agricultural Zoning for Climatic Risks” (AZCR) is a program developed in Brazil since 1995, to provide guidance information for agricultural practices.
THE AZCR
Cattle farming systems are adding up quality to the grain production
and yield of pastures, mitigating the environmental impacts and reducing
the pressure on the Amazonian forest

Integrating NASA Earth Sciences Research results into Decision Support Systems for Agriculture and Water Management in South America
“Incorporating high quality observations of surface conditions from NASA satellites and other observing systems to quantify continental scale daily ET at 5~20Km spatial resolution and water storages and fluxes at basin scale will enable enhancement of decision support tools for agriculture, human use and disaster mitigation over South America.”
EOS multi-sensor (AIRS, CERES and MODIS) based
evapotranspiration
The Gravity Recovery and Climate Experiment (GRACE) estimates of monthly variations in terrestrial water storage (TWS)
The Tropical Rainfall Mission Measurement (TRMM) derived precipitation
AMSR-E and TRMM Microwave Imager (TMI) soil moisture
NASA’s Land Information System (LIS) and the South American Land Data Assimilation System (SALDAS)
Land Surface Modeling Framework
CPTEC/INPE atmospheric models
INMET surface observations network

Integrating NASA Earth Sciences Research results into Decision Support Systems for Agriculture and Water Management in South America
PRINCETON UNIVERSITY Remote Sensed ET Estimation
Data Type Variable Unit Source Platform Resolution
Surface Meteorological
Data
Air temperature
Pressure
U-Wind
V-Wind
Vapor Pressure
C
KPa
m/s
m/s
KPa
AIRS
AIRS
CERES (GMAO)
AIRS
AQUA
AQUA
AQUA
AQUA
AQUA
25 km*
25 km*
20 km
20 km
25 km*
Radiative Energy Flux
Incident SW Incident LW
W/m2
W/m2
CERES
CERES
AQUA
AQUA
20 km
20 km
Vegetation Parameters
Emissivity
Albedo
LAI
Veg. Type (MODIS UMD
Classification)
-
-
-
-
MODIS
MODIS
MODIS
MODIS
AQUA
AQUA
AQUA
TERRA
5 km
5 km
1– 5 km
20 km
Processing the Data streams
*Processed to 25-km at Princeton“Fast response” variables put into global, hourly UTC files“Slow” MODIS land cover variables are in 8-day or 16-day files
}
7 GB raw RS data/day
Processing the Princeton Remotely-Sensed ET Product (beta version)
necessary upscaling & downscaling
Use the calculated EF (soon from both Aqua and Terra) to scale SRB diurnalinsolation data to obtain daily (weekly, monthly) LE and ET [mm/day]
Penman-MonteithInstantaneous Retrieval
(1:30pm local)
SEBSInstantaneous Retrieval
(1:30pm local)
apply quality flag filters
Determination of cell-specific, instantaneous EFEF = LE / (Rn – G )
Figure. Mean seasonal maps of ET from RS-PM and VIC for 1984-2000.
ET Estimates (Mexico): Comparison with VIC LSM
Jan
Apr
Jul
Oct
RS-PM ET VIC ET VIC – RS-PM

NASA Water Resources Program Project Support for Activities in Latin America
“Initiate capacity building {and end to end projects} programs to develop tools for using remote sensing data in support of water management, and to show the value of Earth observations generally in water resource management. The program will be initiated in Latin America” {GEO Tasks WA-06-07 & DI-07-01}
The NASA Water Resources Program may assist:
1) Assist with workshop support including the training of students and travel for US visits.
2) Support graduate students & post-docs3) End to End Projects with Decision Support Systems

South American Land Data Assimilation System (SALDAS)
Collaborative work for the past 4 years (mostly unfunded) with the Brazilian Center for Weather Forecast and Climate Studies (CPTEC - an equivalent no NOAA/NCEP in SA) a division from the Brazilian National Institute for Space
Research (INPE - an equivalent to NASA in SA). CPTEC/INPE is a lead and reference institution in Latin America for operational and research modeling.
This collaborative work includes promoting interaction between Latin America students and researchers and US institutions as well as Capacity Building
Funded Activities
Recently Funded
La Plata basin integrated total runoff (Kg/m2) at 1Km resolution (January 2000)
NASA THP - La Plata Basin combine NASA products with local observations to improve understanding of the hydrological and meteorological processes over the region NDVI1981-2000 trends: surrogate for
primary production from NOAA-AVHRR images. Red: decrease Blue: increase. [Courtesy of Jobbagy.]
IAI - La Plata Basin Land Use/Land Change due to natural and anthropogenic causes
NASA LBA Ecology – LSM Intercomparison Project leverage on 8 flux sites in the Amazon region. SALDAS forcing used for wall-to-wall intercomparison.
NASA Applied Sciences Program proposal to improve decisions support systems in agriculture, drought and water resources management for South America
Amazon Observational Network of eddy flux tower sites (red dots) on a map of vegetation types in Amazônia and Brazil.
mm Wm-2(a) (b)
SALDAS – CTR precipitation SALDAS – CTR latent heat flux
mmmm Wm-2Wm-2(a) (b)
SALDAS – CTR precipitation SALDAS – CTR latent heat flux
Regions with significant impacts on latent heat flux when comparing initial conditions for operational NWP models models with well-balanced SALDAS fields
NASA Water Resources Program Project Support for Activities in Latin America

NASA Water Resources Program Project Support for Activities in Latin America
2006 Enrique Rosero (Ecuador) Amazon LSM parameter calibration
2007 Rafael Rosolem (Brazil)Amazon Hydrology & Calibration
2009 Mario Quadro (Brazil)La Plata Precipitation Recycling
Debora Roberti (Brazil)Wet Lab for regional soil moisture and ETIn support to agriculture
2008 Joao Mattos (Brazil)Operational Land-Surface DA
2009 Claudia Ramos (Brazil)AMSR-E Soil Moisture DA
Visiting Researchers and Students to NASA/GSFC/HSB

NASA Water Resources Program Project Support for Activities in Latin America
Capacity Building Meetings and Workshops
Public: graduate students and young scientists
Two weeks hands-on training in hydrology, meteorology, ecological modeling and data assimilation
More than 100 registrations from North and South America, Africa, Europe and few from Asia…
To be held at the ITAIPU hydropower plant at the border of Brazil, Argentina and Paraguay
Inter-American Institute
PI: Hugo Berbery (UMD)