Embed Size (px)
Citation preview

University of Rhode Island University of Rhode Island
DigitalCommons@URI DigitalCommons@URI
Open Access Master's Theses
1976
The Solubility of Calcium Oxalate as a Function of Dielectric The Solubility of Calcium Oxalate as a Function of Dielectric
Constant Constant
Justina A. Molzon University of Rhode Island
Follow this and additional works at: https://digitalcommons.uri.edu/theses
Recommended Citation Recommended Citation Molzon, Justina A., "The Solubility of Calcium Oxalate as a Function of Dielectric Constant" (1976). Open Access Master's Theses. Paper 210. https://digitalcommons.uri.edu/theses/210
This Thesis is brought to you for free and open access by DigitalCommons@URI. It has been accepted for inclusion in Open Access Master's Theses by an authorized administrator of DigitalCommons@URI. For more information, please contact [email protected].
(
THE SOLUBILITY OF Ci LCIUM OXALATE
AS A FUNCTION OF DIELECTRIC CONSTANT
BY
JUST JN.A. A. MOLZ ON
A TH.E:S~S SU.SlV.flTTEn l_1\; PAH TL.\L FULFILLMENT OF
THE H:SQUlREME: ·~\f TS FOR THE DEGREE OF
MASTER OF SCIENCE
Ii.~
PH-6.,R lvtAC -l
UNIVERSITY OF RHODE ISLAND
1976
(
(
(
MASTER OF SCIENCE THESIS
OF
JUSTINA A. MOLZON
Approved:
The sis Committee:
Major Professor
tL~J. L;ti; t2.{l. ~ Dean of the Graduate School
UNIVERSITY OF RHODE _SLAND
1976

(
(
TABLE OF CONTENTS
ABSTRACT ...... .
TAB LE OF CONTENTS
LIST OF TABLES .
LIST OF FIGURES .
PAGE
ii
iii
iv
v
I. INTRODUCTION. 1
II. CALCIUM OXALATE 2
III. CALCIUM OXALATE SOLUBILITY. 4
IV. DIELECTRIC CONSTANT AND SOLUBILITY. 10
V. ANALYTICAL METHODS . 16
VI. EXPERIMENT AL . . . . . 20
VII. RESULTS AND DISCUSSION. 42
VIII. SUMMARY. . . 54
IX. REFERENCES. 56
iii

(
(
ABSTRACT
The solubility of calcium oxalate inonohydrate was
determined via atomic absorption spectroscopy in a series
of 1-alkanols and ethanol-water mixtures at 25°C_. , having
known dielectric constants. It was found that solubility was
linearly related to the dielectric constant of the 1-alkanols.
In the ethanol-v·1ater mixtures, the solubility isotherm was
curvilinear and on a dielectric constant basis an apparent
break occurre d in the isotherm, at a dielectric constant of
sixty. This can be considered to be the point of ionization
of divalent cations. The solubility isotherms in the cosolvent
mixtures can be considered as repressive ionization
phenomena.
ii

(
TABLE
1.
LIST OF TABLES
Solubility of Calcium Oxalate in Various Salt Solutions, Compared at the Same Ionic Strength at 28°C ......... . .
2. Refractive Index Values for Various Ale ohols at 25°c ..
3. Dielectric Constant Values for Various Alc ohol s at 25°C. . . . . . . ....
4. A Summary of the Dieledric Constants for the
PAGE
8
. . . 25
. . 26
Ethanol-Water Mixtures Used in thi s Sludy. . . 28
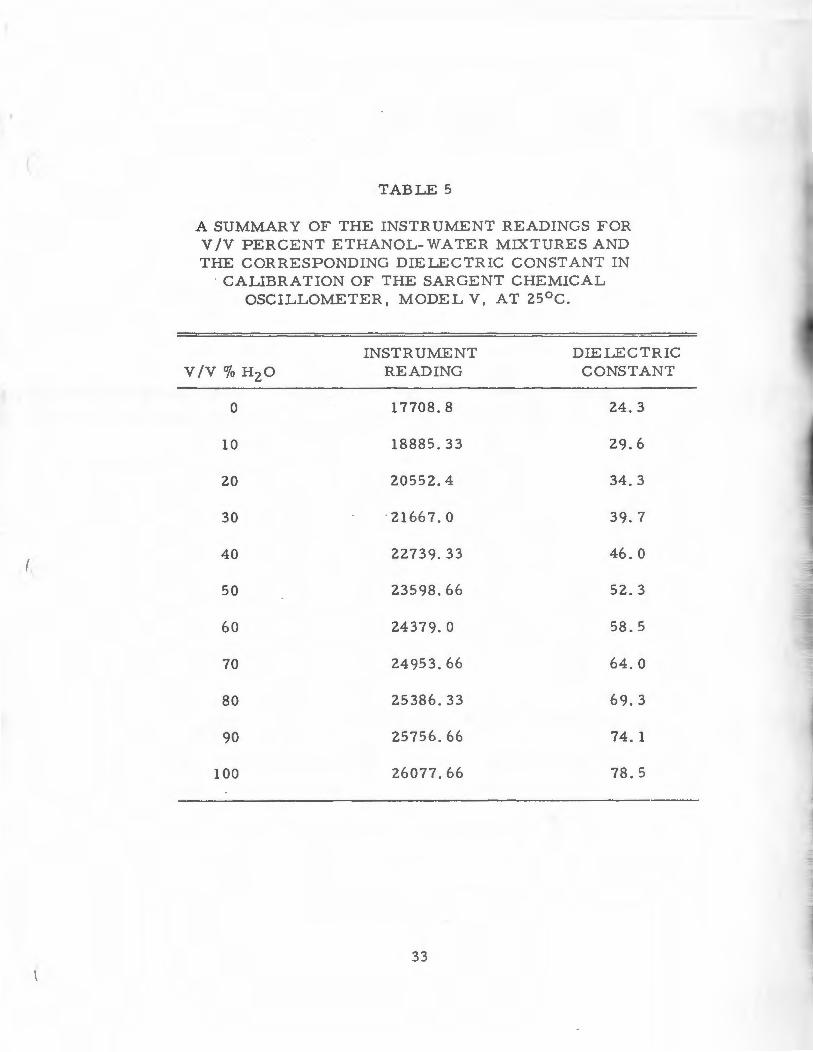
5. A Summary of the Instrume nt Readings for V /V Percent Ethanol-Wate r Mixtures and the Corresponding Dielectr i c Constant in Calibration of the Sargent Chemical Oscillometer Model V, at 25°C ....
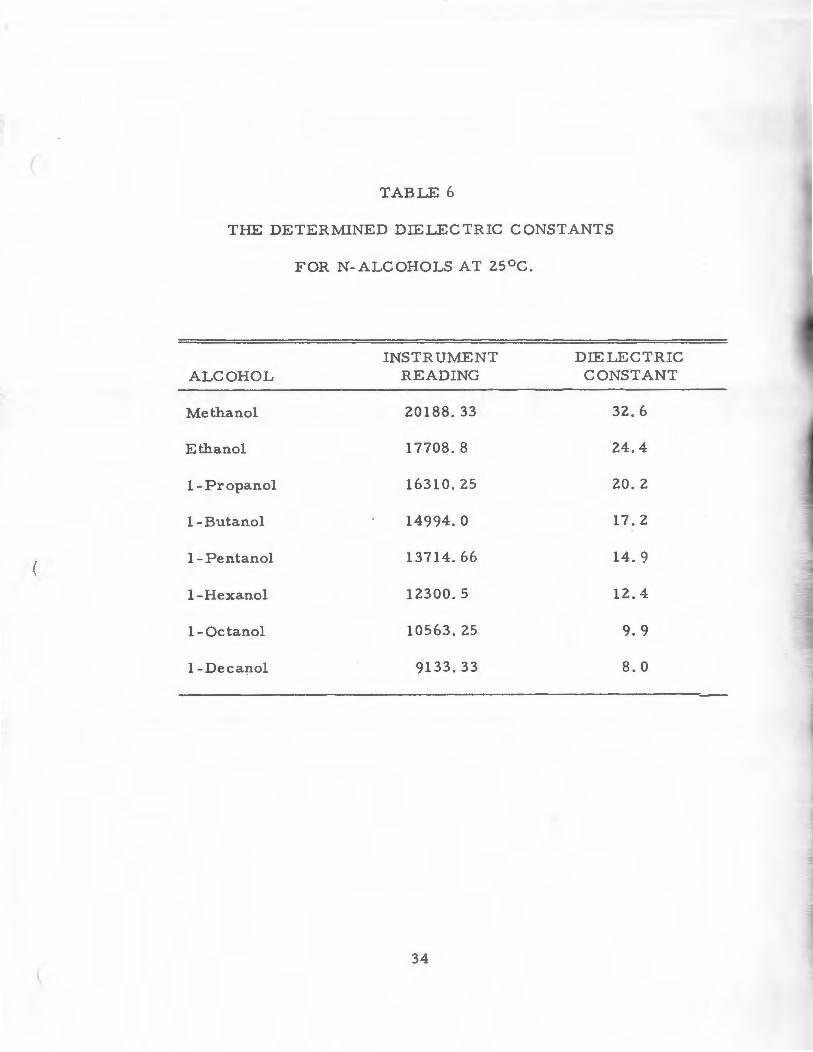
6. The Determined Die lee tric Constants for
. . ... 33
n-alcohols at ?..5°C. . . . . . . . . . . . .... 34
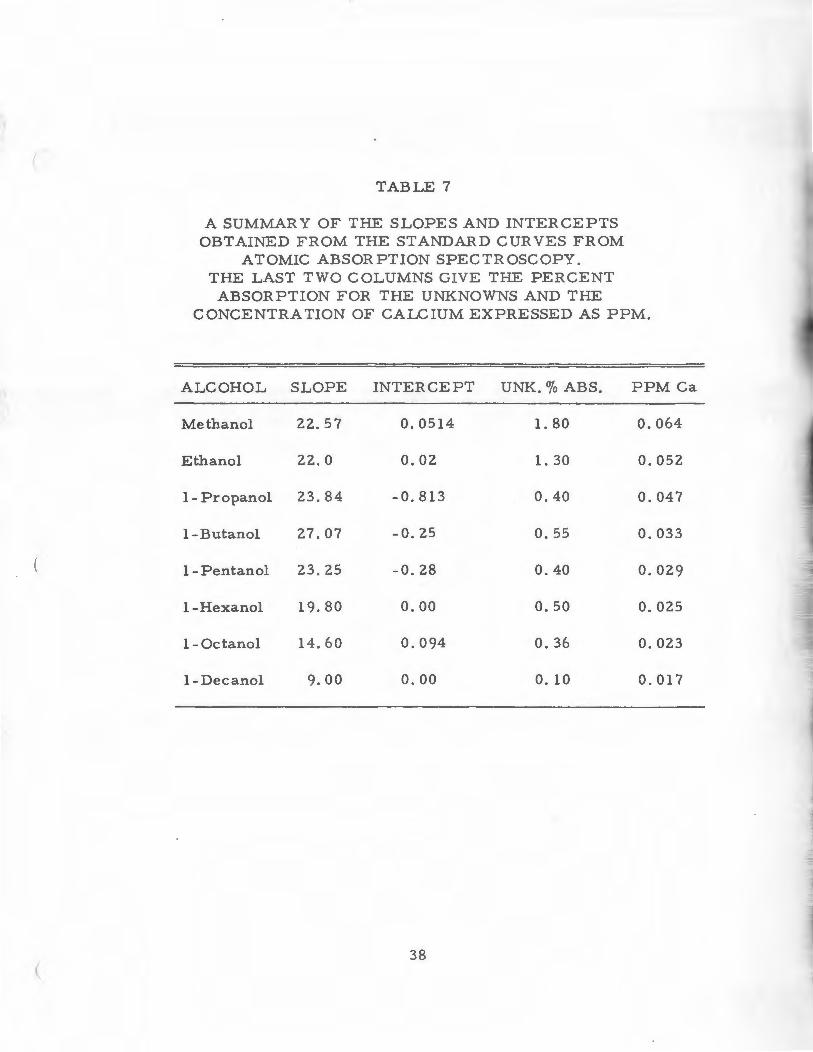
7. A Summary of the Slopes and Intercepts Obtained from the Standard Curve s from Aton1ic Abs or ption Spectroscopy. The Last Two Columns Give the P e r ce nt Absorption for foe Unknowns and the Concentration of Cakium Expressed as ppm . ........... . 38
8. A Summary of the Soluoility of Calcium Oxalate , Expresse d in ppm, at zs 0 c. a s a Function .::of the Die lee tric Cans tant of the n-a.lcohol s Used in this S tudy ... . ........ 43
9. A Summary of the So~ubilHy of Calcium Oxalate, Expr es se d i.:1. ppn-1, at z5oc. as a Function of the Dielectric C onstant in a Series of Ethanol- Water Mixtures ... . ..... 49
l V
(
(
FIGURES
FIGURE PAGE
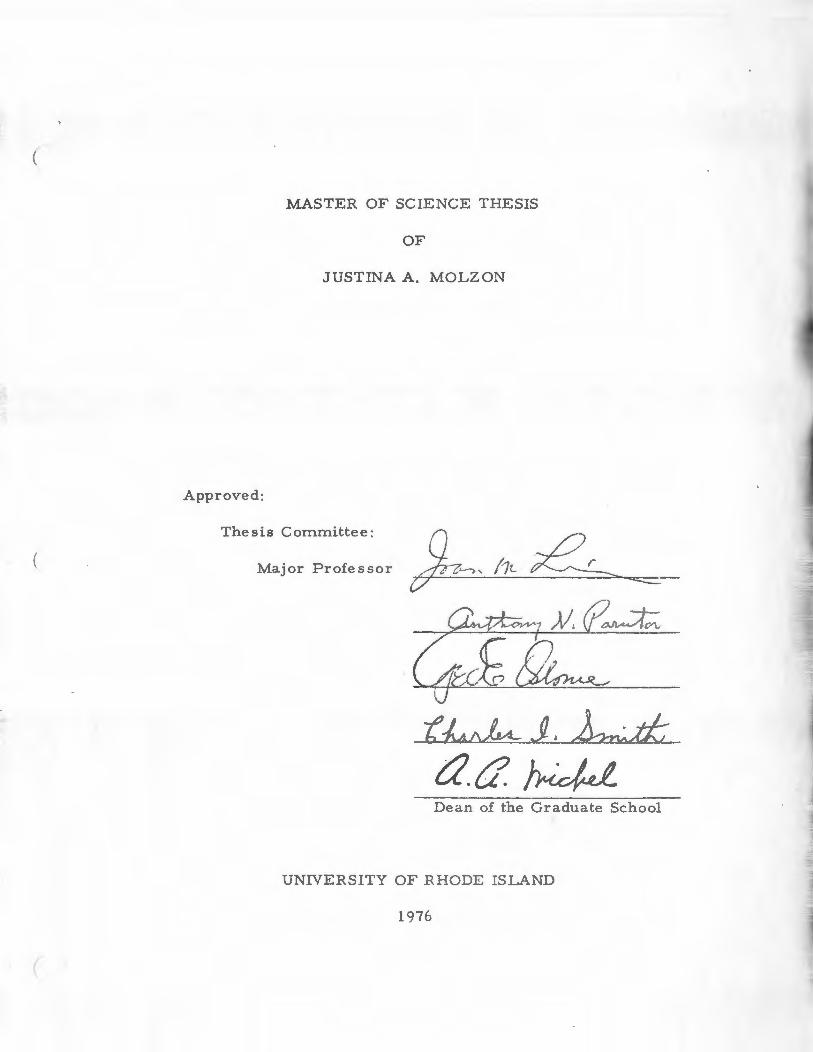
1. An Illustration of the Superimposition of Curves When E ithe r the Solubility Parameter or Dielectric Constant of a Series of n-alkyl Alcohols is Plotted vs. the Number of Carbons. ... 11
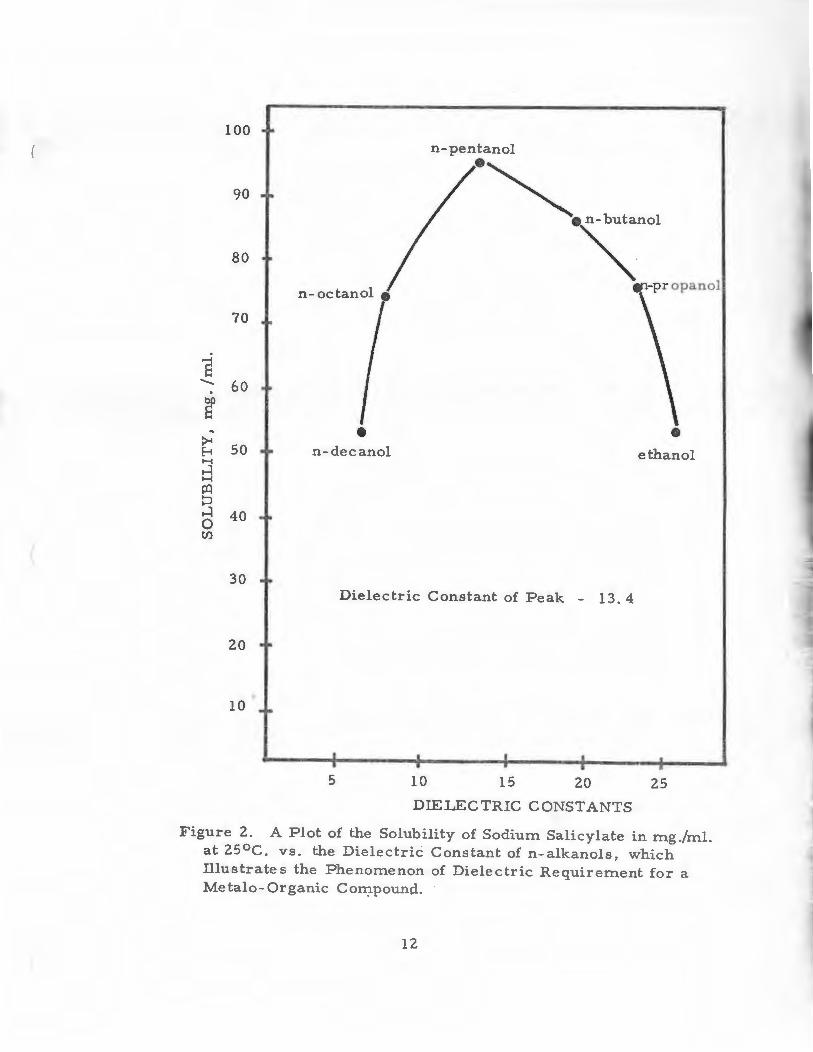
2. A Plot of the Solubility of Sodium Salicylate in mg. /ml. at 25°C. vs . the Dielectric Constant of n-alkanols, which Illustrates the Phenomenon of Di electr!c Requirement for a Metalo-Organic Compound ............ 12
3. A Plot of the Dielectric C onstants at 25°C. as a Function of Composition, E xpressed as W/W Pe rcent Water . . . . . . . . . . . . 29
4. A Plot of the Calibration Curve Obtained on the Model V Sargent Oscillometer with Respect to Instrument Readings vs. Known Die l ectric Constants of Pure Solvent s and Solvent Mixtures
5 . A Plot of P e rcent Absorption vs. Concentration for Standar d Solutions of Calciurr1 , Expressed
. 32
in Parts Per Million ... . .... .... .. .. 36
6. A Representative Determination of the C alciurr_ Concentratio.:i of Unknowns in n-a.lcohols at 25°C. , Expressed in Parts Per Million ...... 37
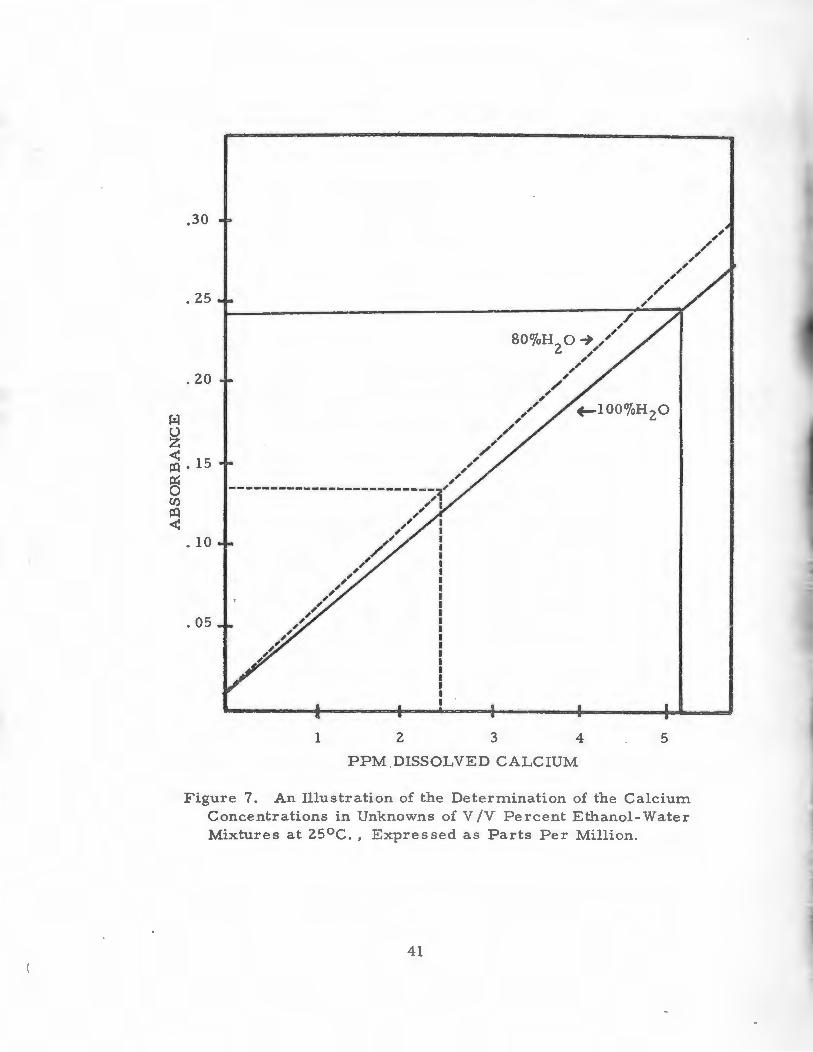
7. An Illustration of the De termination of the Calcium Concentrations of Unknowns i n V /V Percent Etha.nol- Vvater Mixtures at 25°C. , Express e d as Parts Per Million .......... 41
v

( FIGURE
8.
9.
A Plot of the Solubility of Calcium Oxalate at 25°C., Express ed in Parts Per Million as a Function of the Carbon Num.ber of the n-alkanols Used in this Study ....... .
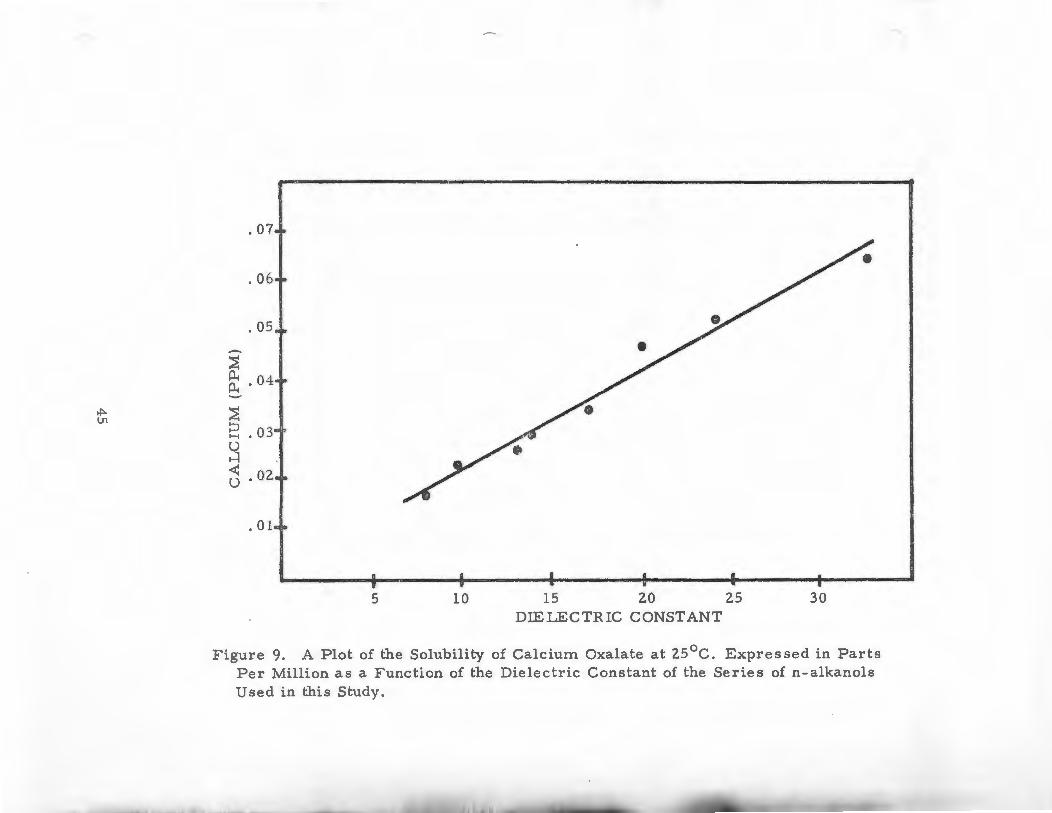
A Plot of the Solubility of Calcium Oxalate at 25°C., Expressed in Parts Per Million as a Function of the Dielectric Constant of the Series of n-alkanol s Used in this Study ...
10. A Piot of the Solubility of Calcium Oxalate at Z5°C. , Expressed in Parts Per Million as a Function of V /V P e rcent Ethanol- Water Mixtures ....... .
11. A Plot of the Solubility of Cale ium Oxalate at z5oc., Expressed in Parts Per Million as a Function of the Dielectric Constant of Ethanol - Water Mixtur es
vi
PAGE
44
45
50
51

(
I. INTRODUCTION
This investigation involves the study of the solubility of
calcium oxalate which, because of its very low aqueous solu
bility, is a n1ajor constituent of kidney stones. As this
problem is directly related to the improvement of world living
standards (1), the need to develop techniques to help dissolve
and/or prevent these stones increases yearly. Any informa
tion related to the solubility phenomena of calcium. oxalate
should prove useful to the body of knowledge on this con1pound.
This inorganic compound is semi polar in nature, and the
approach to the investigation was to develop a solubility
isotherm by changing solvent polarity to mimic more closely
the forces in the solute. A wide range of polarity can be
obtained by using a variety of pure solvents or solvent mixtures
having a broad spectrum of dielectric constants. This method
yield s a useful description 0£ the solubility parameters of the
compound under inn.~ stiga t· o n.
l

II. CALCIUM OXALATE
The chemical formula for calcium oxalate is CaC204; it
has a molecular weight of 128. 10, in the dehydrated state. The
structure considered to b e most stable is:
It is considered to be relatively insoluhle in both polar and
nonpolar solvents. The Merck Incle isls it as being practically
insoluble in water or acetic acid. Only dilute solutions of strong
acids, such as hydrochloric or nitric, will effect its solution (2).
Calcium oxalate may occur as either the mono-, di-, or
trihydrate . Of these three forms, the monohydrate is the com-
pound most co1nmonly constituting kidney stones that are com-
posed of a single chemical entity (3) . It i s also the least soluble,
having a solubility product of 2. 57 x 10-9 mole per liter at
25° C. (4). Further, the monohydrate is stable at temperatures
above o0 c., while the other hydrates are unstable, giving off
2
(
3
water of crystallization to revert to the more stable
monohydrate (5 ). Both solubility and instability of calcium
oxalate increases with increasing degrees of hydration (5 ). For
example, at o0 c. the solubility of the trihydrate is found to be
1. 25 times as soluble as the dihydrate, which in turn is 1. 25
times as soluble as the monohydrate (5 ).
It should be pointe d out that most of the literature concerning
calcium oxalate focuses on its connection with renal stones. As
a result, much of the information presented in this study has
been extracted from reports pertai ning to renal stone solubility,
and this con nection will freque ntly be mentione d.
(
III. CALCIUM OXALATE SOLUBILITY
The solubility of calcium oxalate has been studied under a
variety of conditions. The approach take n by many authors is
one related to the solubility of this compound in urine, where
it is generally recognized that b o th calcium and oxalate ar e
present in higher concentrations than can be obtained even in a
saturated aqueous solution of calcium oxalat e. This pheno
menon, couple d with the basic aim to incr e as e the solubility of
calcium oxalat e renal stone s, has led to the design of many
experiments which alter urinary compo n e nts to study that effect
upon calcium oxalate solubility.
Gretta Hammarsten, in 1929 (6), carried out one of the
fundamental studies, applying the the ory of Debye and Hlkkel to
study the solubility of calcium oxalate in aque ous solutions of
common urinary electrolyt es. According to De bye and Huckel,
the solubility of a salt is rais e d wh e n the activity of the ions of
the dissolved electrolyte s , brought about by the i nte raction of
the ions in solution, is d ec r e a s ed . The s e r e sults c ould be
interpreted mechanistically as a 11 salting -in 11 phe nome non .
4

( 5
Mathematically this concept, in terms of the activity
coefficient of the ion under consideration (fr), is as follows:
[ 1. 817
~D ·T) 3/2
where D signifies the dielectric constant of the water, T the
temperature, r the ion whose solubility is being studied, with
r 2* being the square of the valence cf the ion and-f the ionic
strength. From this expression it may be seen that log fr
becomes tnore negative as r and"'( increases, and that fr
decreases with increasing charge and conc e ntration of the ions
of the solution. Further mathen-1atica.l manipulation would
demonstrate that these factors would cause an increase in the
solubility product.
Hammarsten (6) found that the equations derived from this
theory held only for very dilute solutions, since the experi-
mentally determined solubilities of calcium oxalate in the
various solutions did not follo w those calculated fr om the given
equations. Hence, she determined the effect of each salt on the
solubility of calcium oxalate with the end result that calcium
oxalate solubility was inde ed increased by this 11 salting-in11
effect.

6
It was found that sodium (either as the chloride or the
dihydrogen phosphate), when present in a concentration com-
parable to urine, increased the solubility of calcium oxalate
about three times. Potassium had a similar effect, but the
addition of magnesium ions increased the solubility seven to
eight times that found in water. Hamm.ar sten explained this
result suggesting the formation of a complex wh ereby a mag-
nesium ion combines with two oxalate ions. When such a com-
plex is formed, the ions as such disappear from the solution,
and the solubility of calcium oxalate is increased.
Hammarsten also varied pH , and found that there was no
significant increase in the solubility of calcium oxalate until
the pH range exceeded that possible in normal human urine.
In 1938, Shehyn and Pall (7) studied the solubility of calcium
oxalate in various salt solutions. They dealt with sodium sulfate,
ammonium chloride, ammonium nitrate and ammonium sulfate,
and related their findings to ionic strength. Ionic strength is
defined as : where m.,,,. is the molarity
of the,,1/.11ion, and ~is the charge of the ~"f'11ion. Basically
the rule regarding ionic strength states that the effect of the
addition of a second salt on the solubility of a given, slightly
soluble salt is the same for all salts and depends only on the

7
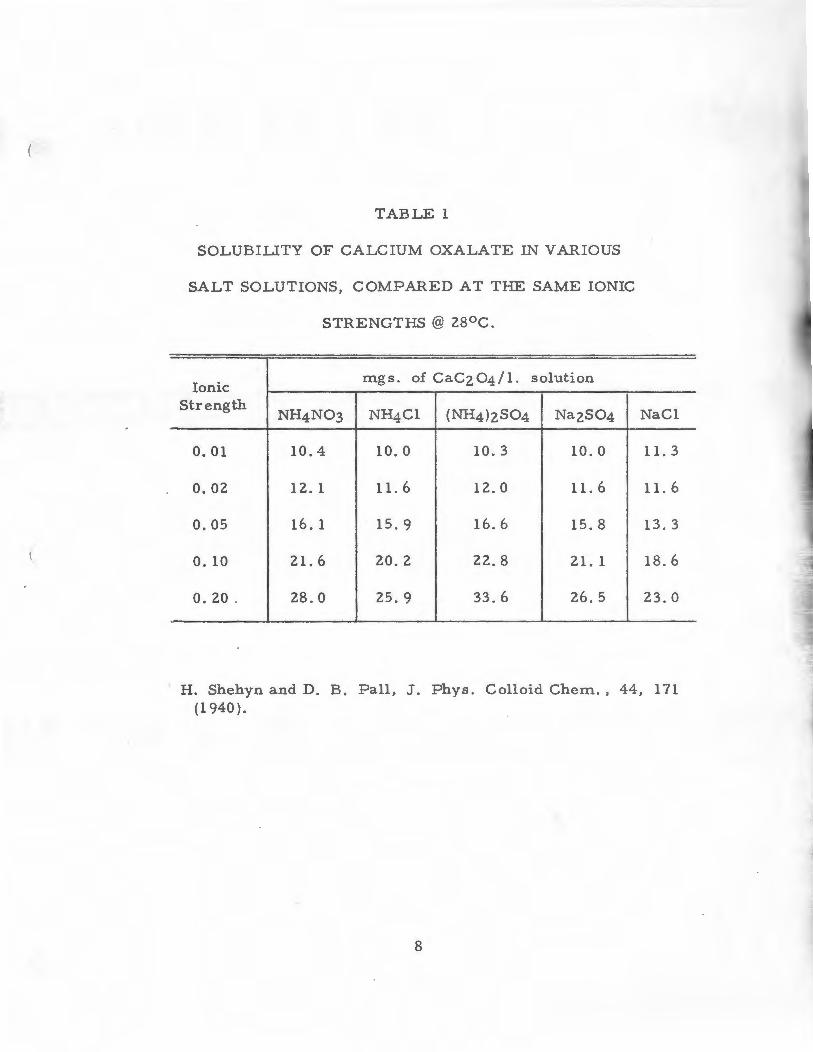
ionic strength. Table 1 compares the solubilities of calcium • .
oxalate for various ionic strengths of the sec and salt. As it
can be seen, the agreement is fairly good.
In an attempt to determine the mechanisms playing a role
in increasing the solubility of calcium oxalate in urine, Miller,
Vermeulen and Moore (8) experimented in another series of pure
solutions. They found that creatinine and hippuric acid had no
effect in increasing solubility and that urea, sodium sulfate and
sodium dihydrogen phosphate all showed slight solubilizing
action. Magnesium chloride produced a marke d increase in
oxalate solubility, thus confirming Hammarsten' s observations
on solubilizing by magnesium ions . Sodium chloride was quite
effective, because of the relatively high concentrations used.
Citric acid markedly increased the oxalate solubility b ec ause
of its calcium complexing properties.
In 1965, Elliot and Eus e bio (9) varied the concentrations of
each of the principal urinary inorganic and organic components
in simple salt solutions to study those effects on calcium oxalate
solubility. Maximal increase in solubility was provided by
magnesium ion and by citric, lactic and hippuric acids. A minor
in.crease was provided by sodium, potassium ammonium and
sulfate ions. No increase in solubility was brought ab.out by
urea or creatinine.
(
TABLE 1
SOLUBILITY OF CALCIUM OXALATE IN VARIOUS
SALT SOLUTIONS, COMPARED AT THE SAME IONIC
STRENGTHS @ 28°C.
Ionic mgs. of CaC204/l. solution
Strength NH4N03 NH4Cl (NH4)2S04 Na2S04 NaCl
0.01 10.4 10.0 10.3 10.0 11. 3
0.02 12. 1 11. 6 12.0 11. 6 11. 6
0.05 16. 1 15.9 16.6 15.8 13.3
0. 10 21. 6 20.2 22.8 21. 1 18.6
0. 20 . 28.0 25. 9 33.6 26.5 23.0
H. Shehyn and D. B. Pall, J. Phys. Colloid Chem., 44, 171 (1940).
8

9
In another study, Elliot and Eusebio (10) also studied the
effect of urinary amino acids upon the solubility of calcium
oxalate. However, no significant effect was established.
The work of Hammarsten and of Elliot and Eusebio has
prompted the current concept of calcium oxalate solubility :
calcium and oxalate combine to form an uncharged complex
Cac 2 o4 , of constant concentration when in equilibrium with
solid calcium oxalate. Work by Finlayson, Roth and DuBois (11)
takes issue with this concept; these authors state that calcium
oxalate solubility cannot be explained by a single CaCz04 com
plex at calcium-to-oxalate con<::e ntration ratios greater than ten.
It was not their concern to alter the solubility of calcium oxalate
however, but to expound on the current solubility theory.
Nevertheless the data derived are of great interest in that they
provide a much needed means of comparison for this investiga
tion. Also, since the study was done in 1973, their methods of
investigation were considered to be up to date and therefore used
as a model.

(
IV. DIELECTRIC CONSTANT AND SOLUBILITY
Polarity differences between solutes and solvents reflect
the solubility of a variety of substances. Solubility studies
usually have involved homologous series, which in turn results
in a change in polarity, physical properties and solubility
characteristics.
Since many properties of a homologous series change
according to a geometric progression ( 12), the plot of the
logarithm of these properties against. the carbon number of the
nonpola.r hydrocarbon chain is linear. This has allowed for the
development of a variety of solubility theories which attempt to
predict the points of maximum solute/ solvent solubility.
Notable among these is the Hildebrand and Scott solubility-
parameter theory. Basically a thermodynamic d e scription, the
solubility paran1eter, J1 , is a measure of intermolecular forces
or cohesion between molecules and is d e fined as "the square root
of the internal pressure. 11 (13) Expressed mathematically the
relationship is:
10
(
15 35
14 30
p:; r.x:l f-i r.x:l 13 25
~ < p:; < ~
~ f-i H
H H
P'.I ::::> ;..::i 0 U)
12 20
11 15
10 10
1 2 3 4 5 6 7 8
NUMBER OF CARBON ATOMS
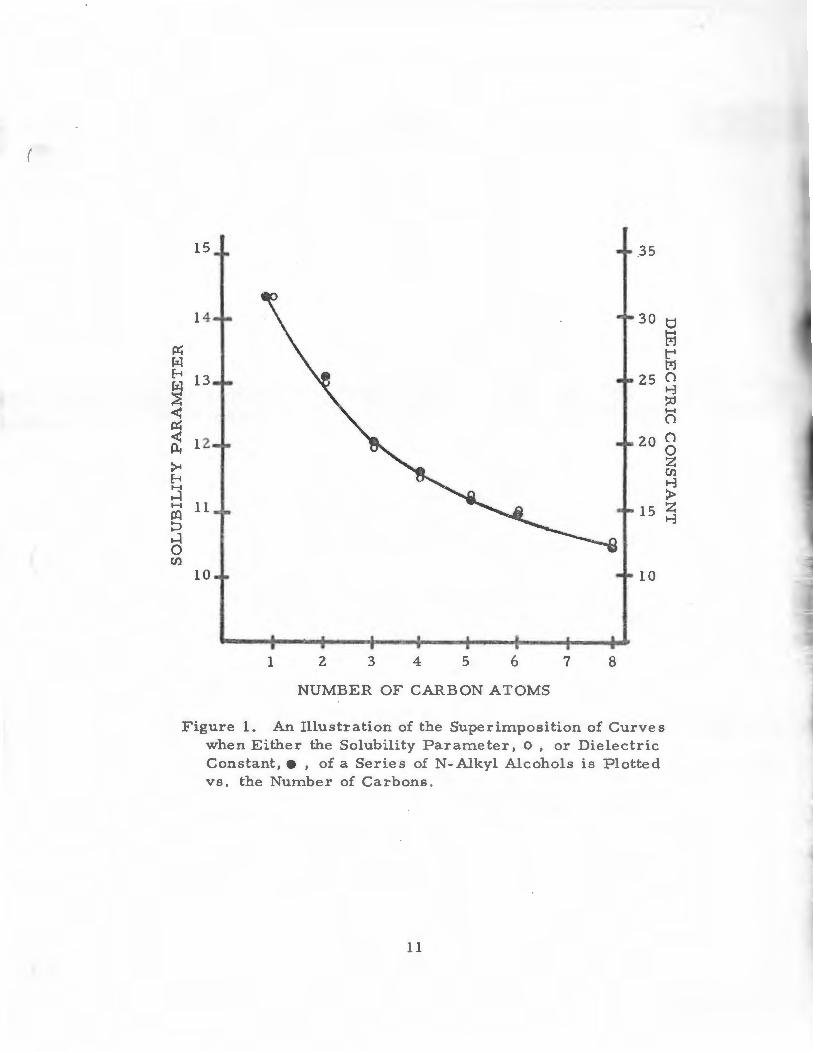
Figure 1. An Illustration of the Superimposition of Curves when Either the Solubility Parameter, O , or Dielectr ic Constant, e , of a Sed es of N-Alkyl Alcohols is Plotted vs. the Number of Carbons .
11
t1 M t-< M ()
t-:3 ~ H ()
()
0 z C/l t-:3 > z t-:3
(
(
100 n-pentanol
90
80
91-pr opanol
70
~ s - 60 . tlO s ~ • • ~
50 n-deca.nol ethanol t-1 H
...:i H
p:i 0 ...:i 40 0 ti)
30 Dielectric Constant of Peak - 13.4
20
10
5 10 15 20 25
DIELECTRIC CONSTANTS
Figure 2. A P lot of the Solubility of Sodium Salicylate in mg./ml. at 25°C. vs. the Dielectric Constant of n-alkanols, which Illustrates the Phenomenon of Dielectric Requirement for a Me talc-Organic Con:ipound.
12
(
(
13
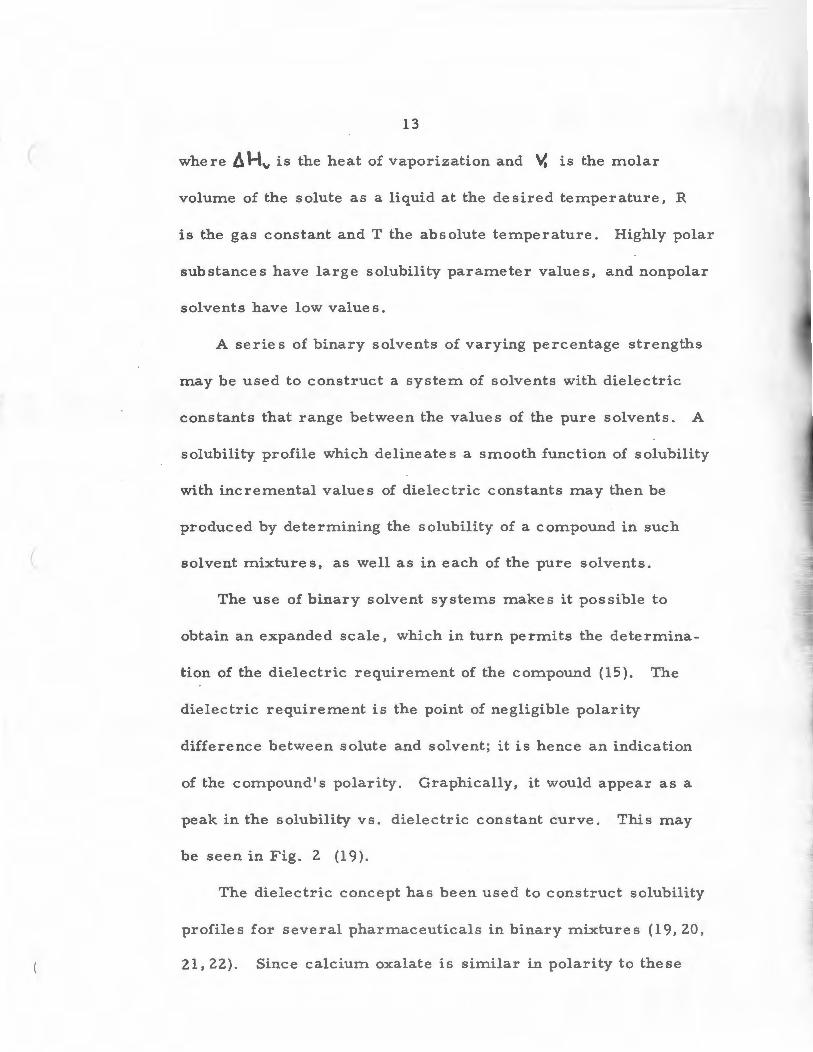
where 6 H" is the heat of v aporization and V. is the molar
volume of the solute as a liquid at the desired t e mperature, R
is the gas constant and T the absolute temperatur e . Highly polar
substances have large solubility parameter values, and nonpolar
solvents have low values.
A series of binary solvents of varying percentag e stre ngths
may be used to construct a syste m of solvents with dielectric
constants that range between the values of the pure solvents. A
solubility profile which delineate s a smooth function of solubility
with incremental values of dielectric constants may then be
produced by determining the s olubility of a compound in such
solvent mixtures, as well as in each of the pure solvents.
The use of binary solvent syste1ns makes it possible to
obtain an expanded scale, which in turn permits the determina-
tion of the dielectric requirement of the compound (15 ). The
dielectric requirement is the point of negligible polarity
differenc e betwe en solute and solvent; it is hence an indication
of the compound ' s p o lar i ty. Graphically, it would appe ar as a
peak in the solubility v s. dielectric constant curve. This may
be seen in Fig. 2 (19).
The die lectric conce p t has b een us e d to cons t ruct solubility
profile s for s e veral pha rmaceutical s in binary mixtur e s (19, 20,
21, 22). S i n ce calc ium oxalate is s imilar in polarity to these

(
14
compounds, it was felt that a study considering the effect of
altering the dielectric constant upon the solubility of calcium
oxalate would be fruitful.
Paruta et al. (14) have shown that the solubility parameter
is also a linear function of the dielectric constant, E . The
relationship is: cf:::=. 0.2 E + 7.S
Several investigators have used dielectric constants rather than
solubility paramete rs to investigate the solubility of various
solutes (15, 16, 17).
The dielectric constant of a solvent is its " charge
separating " capability. In other wo rds the dielectric constant
is responsible for the dissociation of dissolved electrolytes.
Paruta, et al. , recognized a basic relationship between solu-
bility and this aspect of many solvents, citing the correlation
between decreasing solubility and decreasing dielectric constant.
A clear example of this concept is shown in Figure 1 (14).
This relationship is supported by that shown in Coulomb's
law where the dielectric constant is inversely related to the
force separating two charged particles (18).
FORCE= q1 qz
€ r2
where q and q are the net charges on the particles and ~ is the dielectric constant
of the medium in which the charges exist.

(
15
Also the Born equation relates the solubility of a weakly ionized,
relatively insoluble salt to the dielectric constant:
Log = 1 1
(Z. 303 )ZrkT (- - - ) Dz D1
where s1 and Sz are the molar solubilities at the respective
dielectric constants D 1 and Dz. The charge on an electron
is taken in e. s. u., is an effective ion radius, k is B oltzn1an' s
constant, and Tis the absolute temperature (19).
(
V. ANALYTICAL METHODS
The classical procedure for the determination of calcium
in biologic fluids involves the precipitation of calcium as the
oxalate, solution in sulfuric acid, and titration of the oxalate
with potassium permanganate . However this procedure has
inherent problems . The solutions of oxalate must be heated
during titration and in dilute solutions the end point is
unr eliable (23 ).
A newer method which uses cerate oxidimetry avoids these
problems (24). The principle of this method is to precipitate
calcium as the oxalale salt and then oxidize it with ammonium
hexanitratocerate. The excess cerate is then titrated with
ferrous ion, using ortho-phenanthroline as an oxidation
reduction indicator. The only problem with this method is that
the chemicals are difficult to obtain.
Another relatively new method makes us e of a specific ion
electrode (25 ). Similar in appearanc e to a s tandard glass
electrode, specific ion electrodes measure the single ion
activity of an ion in solution. The major disadvantage of this
inethod is that it is not adaptable to us e with organic solvents.
16

(
17
The method of choice in this study was atomic absorption
spectroscopy, which was also used by Finlay, Roth and
DuBois (11 ). It is based on the ability of atoms to absorb
radiation at definite, characteristic wavelengths. Besides
being a convenient and neat method of analysis, it can detect
calcium in amounts as little as one part per billion.
Atomic absorption spectroscopy is based on the theory
that neutral atoms in the gaseous state absorb radiant energy
by means of electronic transitions of the outermost electrons
within the atomic structure. As radiant energy is focused on
the gaseous atoms, some e nergy at particular wavelengths is
absorbed by the neutral atoms, raising their energy levels to
excited states. The absorption spectrum of a particular ele
ment is characteristic of that element. Consequently, this
procedur e may be used as a qualitative test. Ii the quantity of the
energy which is absorbed is determined, this procedure becomes
a quantitative analytical technique (26, 27).
For quantitative work the atomic absorption spectroscopy
apparatus is used as follows: A flame is produced using
nitrous oxide or acetylene as fuels; oxidants are used in various
concentrations, depending on the temperatur e of the flame
needed to vaporize the sample. The sample solu tion is

(
18
aspirated directly into the "carburetor " as a fine mist and
intimately mixed with the fuel and oxidant. This mixture is
then fed into the burner where the fuel is oxidized and the
sample is vaporized. A hollow cathode ray tube is aimed at a
particular region of the flame. The cathode tube and b1.i.rner
are aligned with the monochromator and the detector to assure
maximum sensitivity . The monochromator is set at the wave
length of the energy to be measured. A variable slit in the
system increases the sensitivity. A meter calibrated in
arbitrary units is incorporated in the electronics of the system
to measure the quantity of energy absorbed by the neutral atoms.
This meter can be calibrated using known standards so that an
unknown solution can be quantitatively measured.
The major instrumental differences between atomic and
solution absorption instruments lie in the radiation source (the
hollow cathode ray tube) and the sample container. The whole
system is dependent on the principles behind the hollow cathode
ray tube. Atomic absorption lines are very narrow and thus
create a measurement problem not encountered with solution
absorption apparatus. No ordinary monochromator is capable
of yieldjng a band of radiation as narrow as these absorption

19
( peaks, so in order to follow Beer's law, some means of
narrowing the band width with respect to the width of the
absorption peak had to be developed. ?he hollow cathode ray
tube provided a solution to this problem.
These tubes are constructed of the metal to be analysed.
As a result, a source of radiation is available which emits
a line of the same wavelength as that to be used for the absorp-
0 tion analysis. For example, if the 4227 A absorption line of
calcium is chosen for the analysis of that element, a calcium
vapor lamp can be used as a source. In such a lamp, gaseous
calcium atoms are excited by an electrical discharge; the
( excited atoms then emit characteristic radiation as they return
to lower energy leve1s. A part of the emitted radiation will
have exactly the same wavelength as the resonance absorption
lines. Thus, for example, calcium atoms that have been
0 excited will emit 4227 A lines. With a properly designed source,
the emission lines will have band widths that are significantly
narrower than the absorption band widths, and the absorption
bands will be discernible. Now Beer's law will apply and a
linear relationship between absorbance and concentration will
be present.
(

(
VI. EXPERIMENTAL
EQUIPMENT
A rotating apparatus holding twenty-eight screw-capped
glass vials of twenty milliter volume was set to cycle at forty
revolutions per minute. The rotation of the vials caused the
solute to traverse the full length of the vial twice per revolution,
providing a means of agitation of the contents. This apparatus
was immersed in a fifteen-gallon circulating 1 water bath
maintained at 25 . 0 ±" • 5°C. by a Temptrol 150 unit. 2
The assay procedure employed : a Perkin-Elmer atomic
absorption spectrophotometer, Model 303 3 ; Mettler type H8 4
analytical balance; a Sargent Chemical Oscillorneter, Model v 5 ;
lsargent HE>ater and Circulator for Thermostatic Baths, E. H. Sargent and Co. , Chicago, Ill.
2 Precision Scientific Company, Chicago, Illinois .
3Perkin-Elmer, Norwalk, Conn.
4will Scientific , Inc., Rochester, N. Y.
5E .• H. Sargent and Company, Chicago, Illinois.
20

(
(
21
Abee-3L Refractomcter 1 ; Bantam Demineralizer, Model BD-12
and an IEC HT 3 centrifuge. The data were computed with a
Hewlett Packard Model 10 calculator4 and 98262A calculator
5 plotter .
CHEMICALS
The chemicals used for this study we re as follows:
Calcium Oxal3.te, Certified Powder, Lot 762198 6
CaJcium Chloride, Anhydrous, Analytical Reagent, Lot XGZ 7
Methyl Alcohol Anhydrous, Spectrophotometric Grade Solvent,
Lot VMN7
Absolute Ethyl Alcohol, U.S. P. ·-N. F., Reagent Quality8
lBausch and Lomb Optical Company, Rochester, N. Y.
2Barnstead Still and Sterilizer Co., Boston, Mass.
3Damon/JEC Division Damon Corp., Needham Hts., :Mass.
4Hewlett-Packard Calculator Products Div., Loveland, Col.
5Hewlett- Packard Calculator Products Div., Loveland, Col.
6Fisher Scientific Company
?Mallinckrodt Chemical Works
Bu. S. Industrial Chemicals Company

(
(
22
1- Propanol, "Baker Analyzed '' Reagent, Lot 355 92 1
1-Butanol, Analytical Reagent, Lot TDY2
1-Pentanol, Certifie d, Lot 7762913
1-Hexanol, Lot Hi330 4
tm 2 1-0ctanol, OR , Lot 22
5 1-Decanol, Lot 1 7
C e rtifie d B e nzene, 99 Mol % Pure (Thiophene Fre e )
Lot 7938693
Certified Acetone , 99 Mol % Pure, Lot 7927023
lJ. T. Baker Chemical Company
2Mallinckrodt Chemical Works
3 Fisher Scientific Company
4Aldrich Chemical Company, Inc .
5Matheson, Coleman and Bell

(
DISSOLUTION PROCEDURES
Approximately ten to twenty milliter volumes of each
solvent mixture were placed in vials along with exces s calcium
oxalate. The vials were rotated in the water bath for twenty
four hours, a period found to be adequate for equilibriurn (11).
The vials were removed from the water bath, set upright,
and allowed to settle. Due to the very fine nature of the
suspended material, it was necessary to centrifuge the vials
containing the more viscous solvents at 1000 r.p.m. for ten
minutes. Sample aliquots were then withdrawn from the
supernatant using pipets tipped with glass wool. Three
sample vials were run for each solvent system and each solu
bility determination represents the average value from at least
three runs for each sample.
23
(
ESTABLISHMENT OF PURITY
The purity of the alcohols was verified by means of
refractive index and dielectric constant measurements.
Refractive Index - Benzene, 99% mole free, was used to check
the accuracy of the Abee-3L Refractometer. An experimental
value of 1. 4986 compared with the literature value of 1. 4979 (28).
Refractive index values at 25°C. for the various alcohols tested
are presented in Table 2.
Dielectric Constant - The procedure used was the same as that
de scribed for the determination of dielectric constant for the
experimental solvent mixture. Water contamination is an
i1nportant consideration with methanol, ethanol and propanol,
since they are very hygroscopic. F ur ther, any water present
as a contaminant would strongly influence the solubility proper
ties of the alcohol under consideration. The dielectric constant,
which is sensitive to water contamination, may therefore be used
as a purity index. Dielectric constants for the variou s alcohols
tested are presented in Table 3, and strongly agree with litera-
ture value s, thus indicating no water contamination.
24

(
TABLE 2
REFRACTIVE INDEX VALUES FOR
VARIOUS ALCOHOLS AT 25°c.
EXPERIMENT AL LITERATURE ALCOHOL VALUE VALUE
Methanol 1. 3274 1. 3266a(25°)
Ethanol 1. 3597 1. 35 94a(z5°)
1-Propanol 1.3837 1. 3835a(25°)
1-Butanol 1. 3980 1. 3992a(25°)
1-Pentanol 1. 4087 1. 4080a(z5o)
1-Hexanol 1. 4180 1. 4178b(20°)
1-0ctanol 1. 42 78 i. 4z75a(25°)
1-Decanol 1. 4359 1. 4366b (20°)
aA. Weissberger and E. Proskauer, Organic Solvents, 2nd ed. , Interscienc e Publishers, Inc., New York, 1955.
bHandbook of Chemistry and Physics, 49th ed. , The Chemical Rubber Co. , Cleveland, 1968.
25

(
TABLE 3
DIELECTRIC CONSTANT VALUES FOR
VARIOUS ALCOHOLS AT 25°C .
EXPERIMENTAL LITERATUREa ALCOHOL VALUE VALUE
Methanol 32.6 32.63
Ethanol 24.4 24.30
1-Propanol 20.2 20. 1
1-Butanol 17.2 17. 1
1-Pentanol 14.9 13.9
1-Hexanol 12.4 13.3
1-0ctanol 9.9 9.86b
1-Decanol 8.0 7.93b
a"Table of Dielectric Constants of Pure Liquids 11, U. S. Dept.
of Commerce, NBS Circular 514.
bcalculated from literature value at 20° and temperature coefficients to adjust value to 25°.
26
(
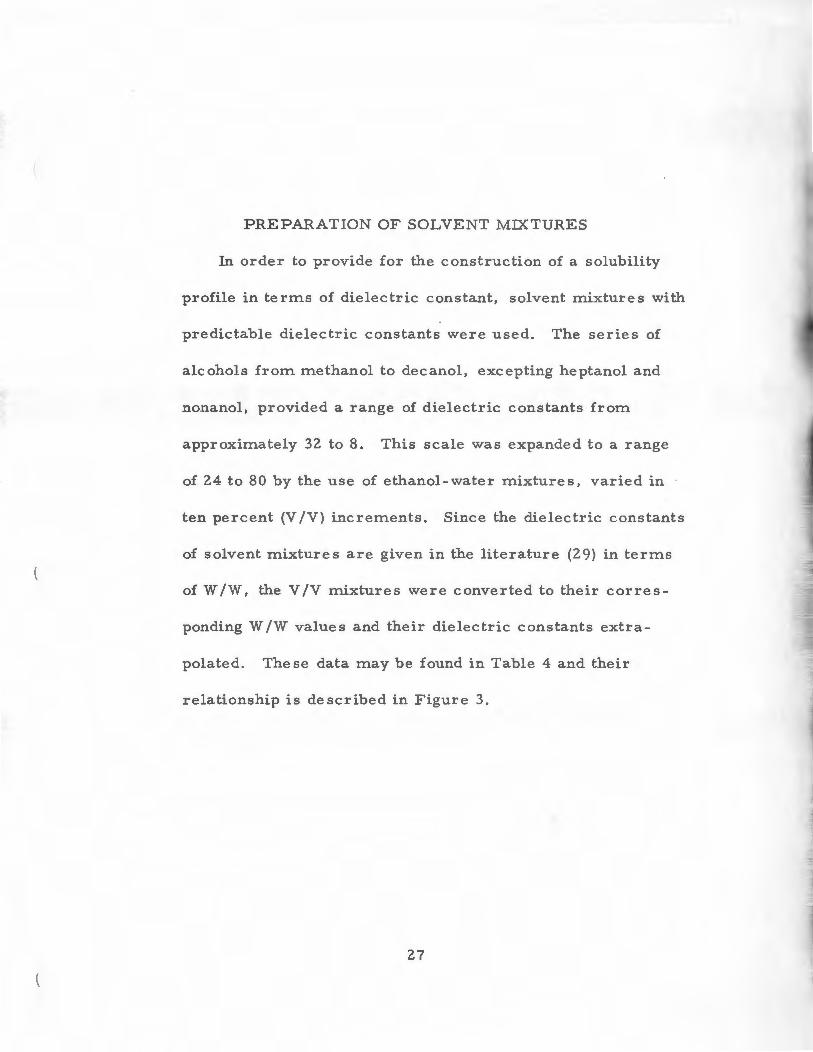
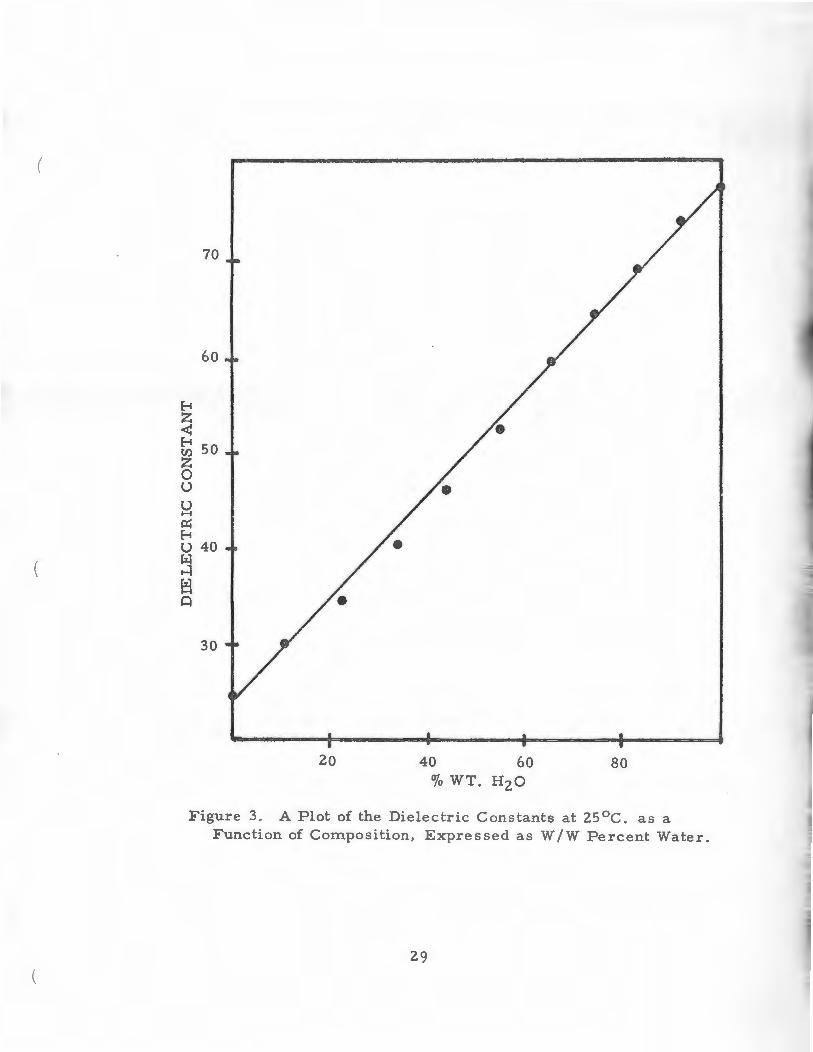
PREPARATION OF SOLVENT MIXTURES
In order to provide for the construction of a solubility
profile in terms of dielectric constant, solvent mixtures with
predictable dielectric constants were used. The series of
alcohols from methanol to decanol, excepting heptanol and
nonanol, provided a range of dielectric constants from
approximately 32 to 8. This scale was expanded to a range
of 24 to 80 by the use of ethanol-water mixtures, varied in
ten percent (V /V) increments. Since the dielectric constants
of solvent mixtures are given in the literature (29) in terms
of W /W, the V /V mixtures were converted to their corres
ponding W /W values and their dielectric constants extra
polated. These data may be found in Table 4 and their
relationship is described in Figure 3.
27

TABLE 4
A SUMMARY OF THE DIELECTRIC CONSTANTS FOR.
THE ETHANOL-WATER MIXTURES USED IN THIS
STUDY.
DIELECTRIC V /V%H2 0 W/W%H20 CONSTANT
0 0.0 24.3
10 12. 19 29.6
20 23.80 34.3
30 34.88 39. 7
40 45.45 46.0
50 55.50 52.3
60 65.20 58.5
70 74.50 64.0
80 83.30 69.3
90 91. 80 74. 1
100 100.00 78.5
28
(
(
(
E-t z ~
70
60
t; 50 z 0 u u H
IZ E-t u 40 ~ H ~ Cl
30
20 40 60 80 o/o WT. H20
Figure 3. A Plot of the Dielectric Constants at zs 0 c. as a Function of Composition, Expressed as W"/W Percent Water.
29

(
THE MEASUREMENT OF DIELECTRIC CONSTANT
A Model V Sargent Oscillometer was used to measure the
dielectric constants of the various solvents and solvent mixtures.
The instrument was warmed for at least twenty-four hours prior
to use. The sample holder , a glass cell, was washed, rinsed
with deionized water, and dried in an oven at 150°c. prior to
use. When readings were made, the clean dry cell was first
placed in the cell holder to obtain a zero adjustment of the
instrument. After the test solvent was placed in the cell, three
readings were taken, and then the cell was emptied and rinsed
three times with the solvent to be next tested. To increase
the reproducibility of the readings, the cell was filled to the
same level for each measurement and placed in the cell holder
in the same geometric position.
Since this method is a relative one becaus e the oscillometer
does not yield a direct r e ading of the dielectric constant, the
instrument must be calibrated with solvents of known dielectric
constant. Mixtures of ethyl alcohol and deionized water along
with 99 mol % pure benzene and acetone were used as standards.
30
(
31
The dielectric constants and temperature coefficients for the
standard liquids are given in the literature (30).
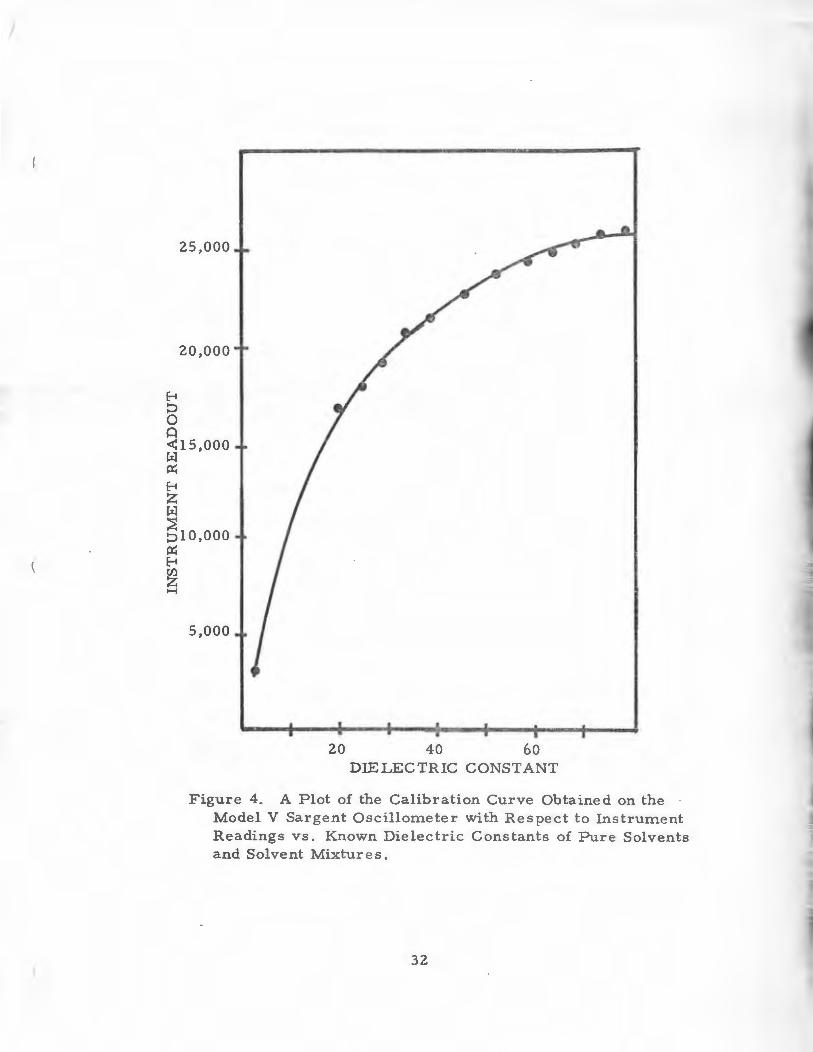
The data from several readouts made possible the
generation of a graph of readout vs. dielectric constant. The
readouts from. the solvents being tested were then plotted
against this standard curve and the corresponding dielectric
constant was determined. These data may be found in
Tables 5 and 6 and Figure 4.
I
( \
(
25 ,000
20 ,000
E-t 0 0 0 ~15,000 ~ p:i
E-t z ~ ::8 010,000 p:i E-t Uj z H
5,000
20 40 60 DIELECTRIC CONST ANT
Figure 4. A Plot of the Calibration Curve Obtained on the Model V Sargent Os cillometer with Respect to Instrument Readings vs. Known Dielectric Constants of Pure Solvents and Solvent Mixtures.
32
I I
TABLE 5
A SUMMARY OF THE INSTRUMENT READINGS FOR V /V PERCENT ETHANOL-WATER MIXTURES AND THE CORRESPONDING DIELECTRIC CONSTANT IN
CALIBRATION OF THE SARGENT CHEMICAL OSCILLOMETER, MODEL V, AT 25°C.
INSTRUMENT DIELECTRIC
V/V % H20 READING CONSTANT
0 17708.8 24.3
10 18885.33 29.6
20 20552.4 34.3
30 21667.0 39. 7
40 22739.33 46.0
50 23598.66 52.3
60 24379.0 58.5
70 24953.66 64.0
80 25386.33 69.3
90 25756.66 74. 1
100 26077.66 78.5
33
(
TABLE 6
THE DETERMINED DIELECTRIC CONSTANTS
FOR N-ALCOHOLS AT 25°C.
INSTRUMENT DIELECTRIC ALCOHOL READING CONSTANT
Methanol 20188.33 32.6
Et.lianol 17708.8 24.4
1-Propanol 16310.25 20.2
1-Butanol 14994.0 17.2
1-Pentanol 13714.66 14.9
1-Hexanol 12300.5 12.4
1-0ctanol 10563. 25 9.9
1-Decanol 9133.33 8.0
34

ASSAY PROCEDURE
The samples were analyzed for calcium using a Perkin-
Elmer atomic absorption spectrophotometer, Model 303.
0 Measurements were made at a wavelength of 4227 A and a slit
setting of 4 . The visible range was used and the source current
was set at 12 ma. A scale setting of 1 or 3 was used, depending
upon the concentration of calciun~ present. An air flow rate of
9 flowrater units was employed. Before the start of each series
of analyses, the . fuel (acetylene) flow rate was adjusted to
compensate for the various solvents. This value was usually 8
flowrater units.
Due to variability in absorbance vs. concentration curves,
it was necessary to prepare a series of standard solutions for
each solvent. This variability may be seen in Figure 5. A
solute series consisted of the following concentrations of
calcium (expressed in ppm): 0. l , 0. 25, 0. 5, 0. 75, 1. 0, 2. 0,
3. 0, 4. 0, 5. 0, 6. 0, 10. 0, 15. 0, and 20. 0. This allowed the
establishment of a set of standard curves, from which the values
of the unknowns could be read. Each unknown w as read three
times to establish continuity of data , and three unknowns were
run for each solvent.
35

(
(
25
20
z 0 H
E-1 p.. 15 i::r:; 0 ti)
i:Q ~ E-1 z ~ 10 l) i::r:; ~ p..
5
. 1 . 2 . 3 . 4 . 5 . 6 . 7 . 8 .9 CALCIUM (PPM)
Figure 5. A Plot of Percent Absorption vs. Concentration for Standard Solutions of Calcium (inn-alcohols), Expressed in Parts Per Million.
36

(
(
N-PENTANOL
25 SLOPE = 23. 25
INTERCEPT = - . 28
UNK. % ABS. = .40 20
PPM Ca = . 0293
z 0 H
E-i 15 P;
~ U)
p:i , .
~ E-i z 10 ~ u p:; ~ P;
5
. 2 .4 . 6 . 8
PPM OF CALCIUM
Figure 6. A Representative Determination of the Calcium Concentration in Unknowns of n-alcohols at 25°C. Expressed in Parts Per Million.
37
f
(
TABLE 7
A SUMMARY OF THE SLOPES AND INTERCEPTS OBTAINED FROM THE STANDARD CURVES FROM
ATOMIC ABSORPTION SPECTROSCOPY. THE LAST TWO COLUMNS GIVE THE PERCENT
ABSORPTION FOR THE UNKNOWNS AND THE CONCENTRATION OF CALCIUM EXPRESSED AS PPM.
ALCOHOL SLOPE INTERCEPT UNK. % ABS. PPM Ca
Methanol 22.57 0.0514 1. 80 0.064
Ethanol 22.0 0.02 1. 30 0.052
1-Propanol 23.84 -0.813 0.40 0.047
1-Butanol 27.07 -0.25 0.55 0.033
1-Pentanol 23.25 -0.28 0.40 0.029
1-Hexanol 19.80 0.00 0.50 0.025
1-0ctanol 14.60 0.094 0.36 0.023
1-Decanol 9.00 0.00 0. 10 0.017
38

39
It was not necessary to prepare a series of standard
solutions for each of the binary solvent mixtures, since a
preliminary study showed little variability between absorbance
vs. concentration curves. This is illustrated in Figure 7. As a
result, standards were made for Oo/o, 20%, 50%, 80% and 100%
V /V concentrations of ethanol/water mixtures. The unknowns
were then determined by using the closest standard curve, in
terms of concentration.
The standards for each solvent we re made by initially pre
paring 1000 ppm of calcium samples by dissolving 0. 277 gram
of calcium chloride in sufficient deionized water to yield
100 milliters of solution. The series of standards was then
obtained by appropriate dilutions of the concentrate.
The 100% standards consisted of 1. 0, 2. 0, 3. 0, 4. 0, and
5. 0 ppm of calcium.
The 80% standards consisted of 1. 0, 3. 0, 5. 0, and 6. 0 ppm
of calcium.
The 50% standards consisted of 0. 25, 0. 5, 0. 75 and 1. 0 ppm
of calcium.
The 20% standards consisted of 0. 25, 0. 5, 0. 75, and 1. 0 ppm
of calcium.
40
The 0% standards consisted of 0. 25, 0. 5, 0. 75 and 1. 0 ppm
of calcium.
After all the standards and unknowns were analyzed, plots
of percent absorption vs. concentration yielded a linear rela
tionship, indicating that the Bee r- Lambert relation held. The
unknowns were then determined in terms of ppm of calcium
present, by reading them directly from the graph. This method
is illustrated in Figure 7. It was not felt necessary to convert
these values into the corresponding amount of calcium oxalate
monohydrate, sinc.e a relationship was being defined.
(
.30
. 25
. 20
. 10
. 05
1 2 3 4 5
PPM .DISSOLVED CALCIUM
Figure 7. An Illustration of the Determination of the Calcium Concentrations in Unknowns of V /V Percent Ethanol-Water Mixtures at 25°C. , Expressed as Par ts Per Million.
41

(
VII. RESULTS AND DISCUSSION
The solubility of calcium oxalate in parts per million was
determined in a series of 1-alkanols at 25°C. The alkanols
enc om pass a relatively wide variation of polarity which, because
it is directly related both to carbon number and dielectric
constant, permits the interchange of these values in graphic
presentation of results, as convenience and/ or clarity dictate .
In Figure 8, the experimentally determined solubility of
calcium oxalate is shown v ersus the carbon number of the
alkanols used in this study. This information is also tabulate d
in Table 8. The values shown are average values of solubility
in replicate samples. In all cases at least six samples were
assayed, and in many cases nine to twe lve replicate determina
tions were made. As can be seen, the solubility decreases in
non-linear fashion with increasing carbon number, results which
could be expected b e cause of the diminishing non-polarity of the
solvents used. It would, no doubt, be e x p e cte d that 1-heptanol
and 1-nonanol would fit into this obs e r v ed n on-linear curve, since
the experimentally dete rmine d poin ts for the alcohols c lose to
these in polarity or carbon number were plotte d.
42

TABLE 8
A SUMMARY OF THE SOLUBILITY OF CALCIUM OXALATE , EXPRESSED IN PPM, AT 25°C.
AS A FUNG TION OF THE DIE LEG TRIG CONST ANT OF THE N-ALCOHOLS USED IN THIS STUDY.
DIELECTRIC PPM ALCOHOL CONSTANT CALCIUM
Methanol 32.6 0.064
Ethanol 24.4 0.0522
1-Propanol 20.2 0.047
1-Butanol 17.2 0.0325
1-Pentanol 14.9 0.0293
1-Hexanol 12.4 0.0252
1-0ctanol 9.9 0.0225
1-Decanol 8.0 0.017
43

~ ~ ~
~ ~ H
u ...:i <: u
. 09
• 08
• 07
. 06
. 05
. 04·
. 03
• . 02
. 01
1 2 3 4 5 6 7 8 9 CARBON NUMBER
Figure 8. A Plot of the Solubility of Calcium 0)0.late at 25°C. Expressed in Par t s Per Million as a Function of the Carbon Number of the n-alkanols Used in this Study.
44
•
10
*"' \}1
"'
. 07
. 06
. 05
-~ Pot 04 ~· ~
~ :.:> 03 H •
u H ~ 02 u·
. 01
5 10 15 20 25 30 DIELECTRIC CONSTANT
Figure 9. A Plot of the Solubility of Calcium Oxalate at 25 °c. Expressed in Parts Per Million as a Function of the Dielectric Constant of the Series of n-alkanols Used in this Study.

I
46
In Figure 9, where the solubility of calcium oxalate in parts
per million versus the dielectric constant of the 1-alkanols is
shown, an approximately linear relationship is observed. ln
this case, a slope can be determined which will yield a relation
ship of solubility per di.electric unit. As determined by a least
square s method of analysis, the slope has a value of 1. 986 x 1 o- 3
per dielectric unit (r 2 = . 971). This very interesting pheno
m enon of linear relationship of solubility to dielectric constant
of very diverse nonelectrolytes has been previously found for
other systems (19).
In order to determine the va.ria.tion of solubility with
composition of a binary solvent system, the solubility of calcium
oxalate was also determined in ethanol-water systems. This
allowed for the incremental variation of both polarity and
dielectric constant; the range of dielectric constants was
approximately twenty-four to seventy-eight. These experi
mental values are given in Table 9 and were determined in the
same manner as that of the pure solvent scan.
In Figure 10, where the solubility of calcium oxalate in
parts per n1.illion versus the percent volume/volume of water is
shown, the solubility is s ee n to vary in a non-linear fashion,
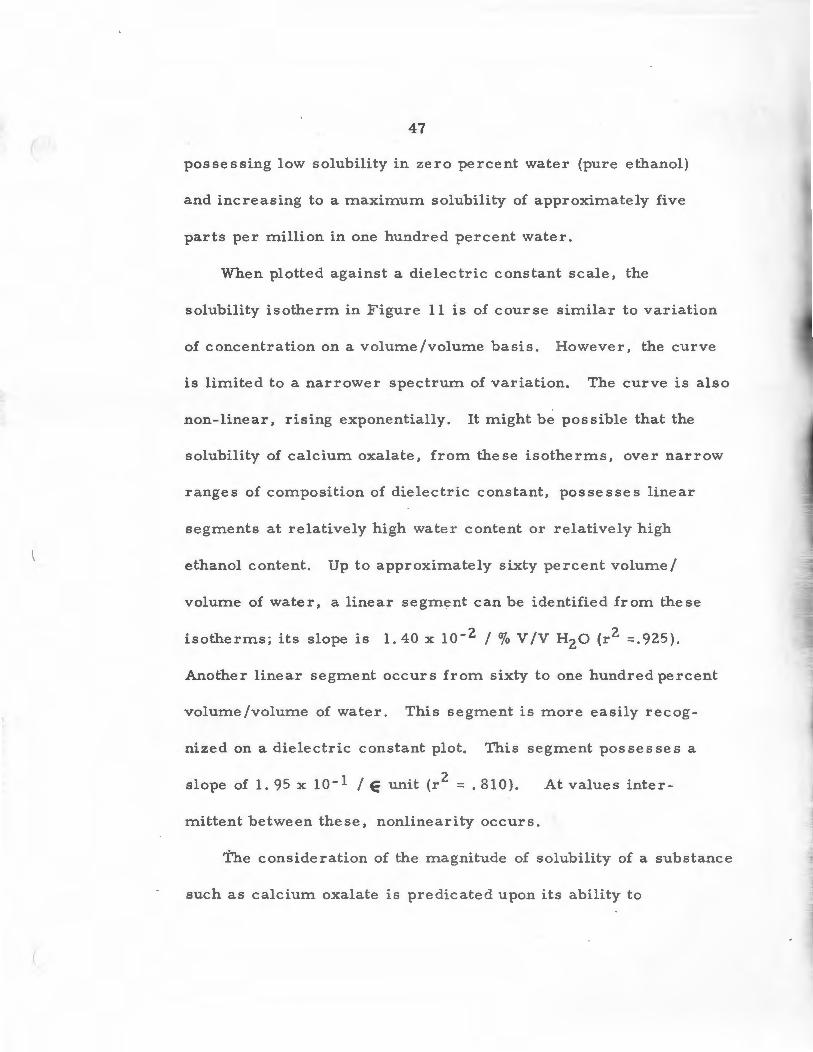
( 47
possessing low solubility in zero percent water (pure e thanol)
and increasing to a maximum solubility of approximately five
parts per million in one hundred p e rcent water.
When plotted against a dielectric constant scale, the
solubility isotherm in Figure 11 is of course similar to variation
of concentration on a v olume/volume basis. Ho we ver, the curve
is limited to a narrower spectrum of variation. The curve is also
non-linear, rising exponentially. It might be possible that the
solubility of calcium oxalate, from these isotherms, over narrow
ranges of composition of dielectric constant, possesses line ar
segments at relatively high wate r conte nt or relative ly high
ethanol content. Up to approximately sixty p e rcent volume/
volume of water, a linear segm~nt can be identifie d from these
isotherms; its slope is 1. 40 x io- 2 I% V /V H 2 o (r 2 =.925).
Another linear segment occurs from sixty to one hundred p e rcent
volume /volume of water. This segment is more easily recog
nized on a dielectric constant plot. This segment possesses a
slope of 1. 95 x io-1 IE unit (r 2 = . 810). At values inter-
mittent between the se, nonline arity occurs.
The con side ration of the mag nitude of solubility of a substanc e
such as calcium oxala t e is predicated upon its ability to

48
dissociate and ionize in polar and sen1ipolar solvent systems,
whether the solvents be pure or mixed systems.
The curves gene rated in the determination of calcium
oxalate solubility versus the changing polarity of the pure solvent
or mixed solvent, in reality indicate suppressive ionization
phenomena. There can be no doubt that in the case of this very
insoluble inorganic compound, these effects are related to the
charge - separating ability or capacity of the solvents or solvent
mixtures. A modification of Coulomb 1 s law indicates a reci-
procal relationship between solubility and dielectric constant,
whereby the greater the dielectric constant of the media, the less
the force required to separate the ions. This means that the
capacity of these semipolar solvents to induce the separation
of charge is continuously diminished with diminishing dielectric
constant.
Often the presence of a semipolar solvent enhances the
ionization phenomena of a compound. However, in the case of
calcium oxalate, the types of solubility isotherms obtained are
more appropriately related to the dissociative phenomena of this
weak electrolyte, thus implying the separation of charge over a
sufficient distance so that these ions act independently.

(
TABLE 9
A SUMMARY OF THE SOLUBILITY OF CALCIUM OXALATE, EXPRESSED IN PPM, AT 25°C. AS
A FUNCTION OF THE DIELECTRIC CONSTANT IN A SERIES OF ETHANOL- WATER MIXTURES.
DIELECTRIC PPM VOL. % HzO CONSTANT CALCIUM
0 24.3 0.0522
10 29.3 0.05
20 34.3 0. 15
30 39.7 0.24
40 46.0 0.426
50 52.3 0.65
60 58.3 0.866
70 64.0 1. 4
80 69.3 2.13
90 74. 1 2.53
100 78.5 5.33
49

f I
5
4
Q l'.z"1 > ...:i 0 ti) 3 U) H
0
~ ::> H
u ...:i 2 <l'.! u ~ P.t P.t
1
20 40 60 % VOLUME HzO
ETHANOL-WATER MIXTURES
80
Figure 10. A Plot of the Solubility of Calcium Oxalate at zsoc. Expressed in Parts Per Million as a Function of V /V Percent Ethanol- Water Mix tures.
50

(
(
5
1
10 20 30 40 50 60 DIELEC TR IG CONST ANT
ETHANOL-WATER MIXTURES
70
Figure 11. A Plot of the Solubil ity of Calcium Oxalate at 25°C. Expressed in Parts Per Million as a Function of the Dielectric Constant of Ethanol - Water Mixb..tres.
51
52
It has been stated (31) that in media of dielectric constant
below sixty, divalent ions will be associated. Since calcium
oxalate dissociates as shown,
2+ 2-CaC204--+ Ca + C204
this may account for the sharp increase in slope at approximately
the dielectric constant of sixty, where the calcium oxalate has a
greater tendency to dissociate.
Since the solubility profile for calcium oxalate is a repressive
ionization curve, the compound acts as if it were completely
associated at low dielectric constant values. The decrease in
dielectric constant with increasing nonpolar solvent concentration
causes the solubility to decrease, since the work required to
separate the charges becomes larger.
The curves obtained in this solubility profile reveal no peaks
or shoulders, but generally rise continuously and asymptotically
toward greatest solubility in pure water. Hence, a dielectric
requirement is not indicated. However, assuming that water has
the practical maximum polarity, the dielectric requirement in
this case would be about eighty.
A consequence of these results related the rather poor
solvating capacity of the solvent systems used. This indicates
l

(
53
that the cohesional interactions of the solutes are the
determinant of its aqueous, alcoholic and hydro-alcoholic
solubility.
(
VIII. SUMMARY
1. The solubility of calcium oxalate monohydrate was
determined at 25°C. in a series of 1-alkanols and ethanol -
water mixtures, having known dielectric constants, via atomic
absorption spectroscopy.
2. When ·solubility was plotted versus the dielectric
constant of the 1-alkanols, a linear relationship was developed.
This showed that solubility had fair parallelism to dielectric
constant.
3. ·when the solubility was plotted versus the dielectric
constant of the ethanol-water mixtures, a non-linear relationship
resulted, with low solubility occurring in zero percent water
(pure ethanol) and increasing solubility occurring until a
maximum was reached in one hundred percent water.
4. The solubility isotherms in the ethanol - water mixtures
can be considered as repressive ionization phenomena.
5. In the ethanol - water mixtures, the solubility isotherm
was curvilinear and on a dielectric constant basis, an apparent
54
(
(
55
break occurred in the isothern~ at a dielectric constant of sixty.
This can be considered to be the point of ionization of divalent
cations.

(
IX. REFERENCES
(1) Foreword to the compilation of papers presented at the Renal Stone Re search Symposium, Leeds, England, 17-20 April, 1968.
(2) Merck Index, 7th ed., Merck and Co., Inc. , R~hway, N.J., 1960, p. 196.
(3) E. L. Prien and E. L. Prien, Jr., Amer. J. Med., 45, 659 (1968).
(4) Handbook of Chemistry and Physics, 49th ed. , The Chemical Rubber Co., Cleveland, 1968, p. B-307.
(5) G. Hammarsten, " On Calcium Oxalate Stones", in Etiologic Factors in Renal Lithiasis, ed. by A. J. Butt (Springfield, ill.: Charles C. Thomas, 1956), pp. 89-94.
(6) G. Hammarsten, Compt. Rend. Trav. Lab. Carlsberg, 17, 1 (1929).
(7) H. Shehyn and D. B. Pall, J. Phys. Colloid. Chem., 44, 166 (1940).
(8) G. H. Miller, G. W. Vermeulen and J. D. Moore, Journ. of Urology, 79, 607 (1958).
(9) J. S. Elliot and E. Eusebio, Invest. Urology, 3, 72 (1965).
(10) J. S. Elliot and E. Eusebio, Invest. Urology, 2, 428 (1965).
(11) B. Finlayson, R. Roth and L. DuBois, " Calcium Oxalate Solubility Studies 11
, in Urinary Calculi, Int. Sy1n. Renal Stone Res ., Madrid, 1972 (Karger, Basel, 1973), pp. 1-7.
(12) J. Ferguson, J. Proc. R oy S oc. (Series B), 127, 397 (1939} cited by P. A. Schwartz, "Solubility of Aminobenzoate Esters" (M. S. Thesis, University of Rhode Island, 1972), p. 3.
56
(
57
(13) A. Martin, Physical Pharmacy, Lea and Febiger, Philadelphia, 1970, p. 302.
(14) A. N. Paruta, B. J. Sciarrone, and N. G. Lordi, J. Pharm. Sci., 53, 1349 (1964).
(15) N. G. Lordi, B. J. Sciarrone, T. J. Ambrosio and A. N. Paruta, J. Pharm. Sci., 53, 463 (1964).
(16) W. E. Moore, J. Pharm. Sci., 51, 391 (1962).
(17) W. G. Gorman and G. D. Hall, J. Pharm. Sci., 53, 1017 (1964).
(18) V. R. Williams and H. B. Williams, " Basic Physical Chemistry for the Life Sciences, W. H. Freeman and Cc., San Francisco, 1973, p. 3.
(19) A. N. Paruta and J. W. Mauger, J. Pharm. Sci., 60, 432 (1971 ).
(20) A. N. Paruta, B. J. Sciarrone, and N. G. Lordi, J. Pharm. Sci. , 5 3 , 13 4 9 ( 1 9 6 4) .
(21) A. N. Paruta and S. A. Irani, J. Pharm. Sci., 54, 1334 (1965).
(22) T. L. Breon and A. N. Paruta, J. Pharm. Sci. , 59, 1306 (1970 ).
(23) P. L. Kirk and P. C. Tompkins, Ind. Eng . Chem. Anal. Ed., 13, 277 (1941).
(24) E. Y. Berger, Clin. Che m., 1, 249 (1955).
(25) Analytical Methods Guide, Orion Research Inc ., Cambridge, Mass . , 197 5.
(26) D. A. Skoog and D. M. West, Principles of Instrumental Analysis, Holt, R inehart and Winston, Inc., N. Y., 1971, pp. 1 15 - 13 0 .
58
(27) J. Ramierez-Munoz, Atomic-Absorption Spectroscopy, Elsevier Publishing Co. , N. Y., 1968.
(28) A. Weissberger and E. Proskauer, Organic Solvents, Inter science Publishers, Inc. , N. Y. , 1955.
(29) T. L. Breon, 11Solubility of Several Barbiturates 11, (M. S.
Thesis, University of Rhode Island, 1969), p. 28.
(30) P. Sherrick, G. Dowe, R. Karr, and E. Ewan, Manual of Chemical Oscillometry, E. H. Sargent and Co., Chicago, 1954.
(31) R. G. Larson and H. Hunt, J. Phys. Chem., 1939, 417.