Embed Size (px)
Citation preview

TTThhheee SSSoooccciiioooeeecccooonnnooommmiiiccc BBBeeennneeefffiiitttsss GGGeeennneeerrraaattteeeddd bbbyyy LLLaaarrreeedddooo CCCooommmmmmuuunnniiitttyyy
CCCooolllllleeegggeee
State of Texas
Volume 1: Main Report
28-May-2002
Kjell A. Christophersen & M. Henry Robison

Table of Contents
The Socioeconomic Benefits of Laredo Community College
i
Table of Contents
ACKNOWLEDGMENTS......................................................................................................... iii
ACRONYMS ............................................................................................................................... iv
Preface............................................................................................................................................ v
Chapter 1 INTRODUCTION ................................................................................................... 1
Overview................................................................................................................................. 1
Annual Private and Public Benefits..................................................................................... 1
Present Values of Future Benefits ........................................................................................ 2
Regional Economic Benefits ................................................................................................. 3
Chapter 2 DATA SOURCES AND ASSUMPTIONS ........................................................... 4
Introduction ............................................................................................................................ 4
College Profile ........................................................................................................................ 4 Faculty, Staff, and Operating Budget ................................................................................ 4 The Students ...................................................................................................................... 5 Entry-Level Education, Gender, and Ethnicity ................................................................. 7 The Achievements .............................................................................................................. 8
Annual Private Benefits ...................................................................................................... 10
Annual Public Benefits ........................................................................................................ 12 Higher Earnings............................................................................................................... 13 Health Savings ................................................................................................................. 13 Crime Reduction Benefits................................................................................................. 16 Welfare and Unemployment Reduction Benefits ............................................................. 17
Costs....................................................................................................................................... 19 Opportunity Cost of Time................................................................................................ 19 The Budget ....................................................................................................................... 20
Other Assumptions.............................................................................................................. 20
Regional Economic Benefits ............................................................................................... 21 The Impact of LCC Operations ........................................................................................ 22 The Direct Economic Development Effects of Students................................................... 24 From Embodied CHEs to Direct Income Effects .............................................................. 25 The Indirect Economic Development Effects of Students ................................................ 27
Chapter 3 PRIVATE, PUBLIC AND REGIONAL ECONOMIC BENEFITS................. 29

Table of Contents
The Socioeconomic Benefits of Laredo Community College
ii
Introduction .......................................................................................................................... 29
Annual Benefits .................................................................................................................... 29 Higher Student Earnings................................................................................................. 29 Social Savings .................................................................................................................. 29
Health-Related Savings.......................................................................................... 29 Crime-Related Savings........................................................................................... 30 Welfare and Unemployment Savings .................................................................. 30 Total Public Benefits ............................................................................................... 30
Annual Benefits Per CHE and Per Student ...................................................................... 31
The Investment Analysis: Incorporating Future Benefits .............................................. 33 The Student Perspective................................................................................................... 35 The Broad Taxpayer Perspective ...................................................................................... 37 The Narrow Taxpayer Perspective ................................................................................... 38 With and Without Social Benefits.................................................................................... 40 Summary.......................................................................................................................... 42
Regional Economic Benefits ............................................................................................... 43 LCC Operations ............................................................................................................... 44 Past Student Economic Development Effects .................................................................. 44 Total Regional Economic Benefits.................................................................................... 45
Chapter 4 SENSITIVITY ANALYSIS OF KEY VARIABLES............................................ 46
Introduction .......................................................................................................................... 46
Investment Analysis: The Student Perspective................................................................ 46 Percent of Students Employed ......................................................................................... 46 Percent of Earnings Relative to Full Earnings ................................................................ 47
Results.................................................................................................................................... 47
Regional Economic Development...................................................................................... 48 The Economic Impact of Student Spending ..................................................................... 49 Economic Impacts Reported as Gross Sales ..................................................................... 50
REFERENCES............................................................................................................................. 53
Appendix 1: Explaining the Results—a Primer ................................................................... 57
The Net Present Value (NPV)............................................................................................. 58
The Internal Rate of Return (IRR) ...................................................................................... 59
The Benefit/Cost Ratio (B/C) ............................................................................................ 61
The Payback Period ............................................................................................................. 61
Appendix 2: Methodology for Creating Income Gains by Levels of Education ........... 62

Acknowledgments
The Socioeconomic Benefits of Laredo Community College
iii
ACKNOWLEDGMENTS he successful completion of this case study is largely due to excellent support from the institutional research staff of the Laredo Community College (LCC). We would like to express our appreciation to Dr. Ramon H. Dovalina, President, who approved the study, and to Mr. Eleazar Gonzalez, Institutional Research & Planning, who collected and organized much of the data we requested. In addition, our own staff, Lucy Schneider and Steve Peterson, respectively, contributed invaluable modeling and data collection expertise throughout the study period. Any errors committed in the report belong to the authors and not to any of the above-mentioned institutions or individuals.
T
CCbenefits Inc. is a company created in collaboration with the Association of Community College Trustees (ACCT) to provide economic analysis services to community and 2-year community colleges. Questions of a technical nature concerning the approach, assumptions, and/or results should be directed to CCbenefits, Inc., c/o Drs Kjell Christophersen and Hank Robison, 121 Sweet Ave., Moscow ID 83843, phone: 208-883-3500, fax: 208-885-3803, e-mail: [email protected].

Acronyms
The Socioeconomic Benefits of Laredo Community College
iv
ACRONYMS LCC Laredo Community College
AD Associate Degree
ABE Adult basic education
ACCT Association of Community College Trustees
B/C Benefit–cost ratio
CC Community College
CHE Credit hour equivalent
ESL English as a second language
GED General Equivalency Diploma (also Education Development Certificate)
HS High school
IO Input–output analysis
NCF Net cash flow
NPV Net present value
REIS Regional Economic Information System
RR Rate of return
TC Technical College
TD Technical Diploma

Preface
The Socioeconomic Benefits of Laredo Community College
v
Preface The Association of Community College Trustees (ACCT) contracted with the authors in 1999 to create the model used in this study. The original vision was simple—to make available to colleges a generic and low cost yet comprehensive tool that would allow them to estimate the economic benefits accrued by students and taxpayers as a result of the higher education achieved. In short: it only makes economic sense for the students to attend college if their future earnings increase beyond their present investments of time and money; likewise, taxpayers will only agree to fund colleges at the current levels or increase funding if the economic benefits exceed the costs.
An important requirement of the ACCT vision was that the model reach beyond the “standard” study—the computation of the simple multiplier effects stemming from the annual operations of the colleges. Although the standard study was part and parcel of the model ultimately developed, it was only a relatively small part. The current model also accounts for the economic impacts generated by past students who are still applying their skills in the local workforce; and it accounts for a number of external social benefits such as reduced crime, improved health, and reduced welfare and unemployment, which translate into avoided costs to the taxpayers. All of these benefits are computed for each college and analyzed. To the extent possible, the analysis is based on regional data adjusted to local situations.
Although the written reports generated for each college are similar in text, the results differ widely. This, however, should not be taken as an indication that some colleges are doing a better job than others in educating the students. Differences among colleges are a reflection of the student profiles, particularly whether or not the students are able to maintain their jobs while attending, and the extent to which state and local taxpayers fund the colleges. Some students give up substantial earnings while attending college because employment opportunities are few and far between. In other cases they are able to work while attending because the area has an abundance of opportunities. That the average student rate of return of 15% for college A is different from the rate of return of 20% for college B, therefore, does not mean that B is doing a better job than A. Rather,

Preface
The Socioeconomic Benefits of Laredo Community College
vi
it is attributable to the employment opportunities in the region, and to the fact that one college may cater more to women than to men, or to minorities, and/or to different kinds of students such as transfer, workforce or retired, etc. In turn, the student body profiles are associated with their own distinct earnings functions reflecting these employment, gender and ethnicity differences. The location of the college, therefore, dictates the profile of the student body, which, to a large extent, translates into the magnitudes of the results. In this sense, it could well be that College A with a 15% student rate of return is actually a better or more efficiently managed school than College B with a 20% student rate of return. The qualitative difference in management efficiency is not equal to the difference between the two returns.

Chapter 1: Introduction
The Socioeconomic Benefits of Laredo Community College
1
Chapter 1 INTRODUCTION
OVERVIEW
ommunity colleges (CCs) generate a wide array of benefits. Students benefit directly from higher personal earnings and society at large benefits indirectly from cost savings (avoided costs) associated with reduced welfare and unemployment, improved health, and reduced crime. Higher education, however, requires a substantial investment on the part of the students and society as a whole. Therefore, all education stakeholders—taxpayers, legislators, employers, and students—want to know if they are getting their money’s worth. In this study, Laredo Community College (LCC) investigates the attractiveness of its returns relative to alternative public investments. The benefits are presented in three ways: 1) annual benefits, 2) present values of future annual benefits (rates of return and benefit-cost ratios, etc.), and 3) regional economic benefits.
The study has four chapters and two appendices. Chapter 1 is an overview of the benefits measured. Chapter 2 details the major assumptions underlying the analysis. Chapter 3 presents the main socioeconomic and regional economic results. Finally, Chapter 4 presents a sensitivity analysis of some key assumptions—tracking the changes in the results as assumptions are changed. Appendix 1 is a short primer on the context and meaning of the investment analysis results—the net present values (NPV), rates of return (RR), benefit/cost ratios (B/C), and the payback period. Appendix 2 explains how the earnings related to higher education data were derived.
ANNUAL PRIVATE AND PUBLIC BENEFITS
Private benefits are the higher earnings captured by the students; these are well known and well documented in the economics literature. Less well- known and documented is a collection of public benefits captured by society at large, the indirect benefits, or what economists call positive externalities, such as improved health and lifestyle habits, lower crime, and lower
C

Chapter 1: Introduction
The Socioeconomic Benefits of Laredo Community College
2
incidences of welfare and unemployment. These stem from savings to society from reduced burdens on taxpayer-provided services. The dollar savings (or avoided costs) associated with reduced arrest, prosecution, jail, and reform expenditures are estimated based on published crime statistics arranged by education levels. Likewise, statistics that relate unemployment, welfare, and health habits to education levels are used to measure other savings. The annual economic impacts are presented in three ways: 1) per credit-hour equivalent (CHE), defined as a combination of credit and non-credit attendance 1, 2) per student, and 3) in the aggregate (statewide).
PRESENT VALUES OF FUTURE BENEFITS
The annual impacts continue and accrue into the future and are quantified and counted as part of the economic return of investing in education. This lifetime perspective is summarized as present values–a standard approach of projecting benefits into the future and discounting them back to the present. The present value analysis determines the economic feasibility of investing in CC education—i.e., whether the benefits outweigh the costs. The time horizon over which future benefits are measured is the retirement age (65) less the average age of the students.
The values of future benefits are also expressed in four ways: 1) net present value (NPV) total, per CHE, and per student, 2) rate of return (RR) where the results are expressed as a percent return on investment, 3) benefit/cost (B/C) ratio—the returns per dollar expended, and 4) the payback period—the number of years needed to fully recover the investments made (see Appendix 1 for a more detailed explanation of the meaning of these terms).
1Instruction hours are not the same as credit hours. CCs prepare people for jobs and are less concerned with (ceremonial) degrees. Many attend for short periods and then leave to accept jobs without graduating. Others simply enroll in non-academic programs. Nonetheless, the CHEs earned will positively impact the students’ lifetime earnings and social behavior.

Chapter 1: Introduction
The Socioeconomic Benefits of Laredo Community College
3
REGIONAL ECONOMIC BENEFITS
The benefits of a robust local economy are many: jobs for the young, increased business revenues, greater availability of public investment funds, and eased tax burdens. In this study we estimate the role of LCC in the local community economy in terms of its share of total community earnings, defined as indicated in Figure 1.1. In general, these CC-linked regional earnings fall under two categories: 1) earnings generated by the annual operating expenditures of the college, and 2) earnings attributable to the CC skills embodied in the local workforce.
Figure 1.1: The Economic Region
Note: the map shows both the district boundary and the whole counties included as a backdrop for the calculation of the economic impacts. The calculated impacts are adjusted to the actual college district.
Webb
ZapataJim Hogg
MEXICO
Texas
Laredo Community College Area

Chapter 2: Data Sources and Assumptions
The Socioeconomic Benefits of Laredo Community College
4
Chapter 2 DATA SOURCES AND ASSUMPTIONS
INTRODUCTION
o the extent possible, documented statistics obtained from several databases and from the colleges themselves are used to craft the assumptions on which the results are based. In the few cases where hard data are scarce, however, institutional researchers on the scene apply best judgments and estimations on the basis of their intimate knowledge of the college and the student body.
This chapter contains six assumption sections, all based on various data imbedded in the analytic model: 1) the LCC profile; 2) annual earnings by education levels; 3) the social benefit assumptions (health, crime and welfare/unemployment); 4) education costs; 5) other assumptions (the discount rate used, health, crime, and welfare cost statistics, etc.); and 6) assumptions pertaining to regional economic effects.
COLLEGE PROFILE
Faculty, Staff, and Operating Budget
LCC employed 505 full- and 196 part-time faculty and staff in year 2000 amounting to a total annual payroll of some $21.1 million. Table 2.1 shows LCC‘s annual revenues by funding source: a total of $29 million. Two main revenue sources—private and public—are indicated. Private sources include tuition and fees (16.1%) plus 0.6% from other private sources (such as contract revenues, interest payments and the like). Public funding is comprised of local taxes (26.6%), state aid (44.6%), and federal grants (12.1%). These budget data are critical in identifying the annual costs of educating the CC student body from the perspectives of the students and the taxpayers alike.
T

Chapter 2: Data Sources and Assumptions
The Socioeconomic Benefits of Laredo Community College
5
Figure 2.1. Revenues: The Budget
16%
44%
12%
1%
27%
Tuition payments
Institut. & other sources ofrevenues
Local taxes
State aid
Federal grants
Table 2.1. Aggregate Revenues, the BudgetSources Revenues Total % of TotalPrivate Funding Tuition paym ents $4,595,994 16.1% Ins titut. & other sources of revenues $180,394 $4,776,388 0.6%Public Funding Local taxes $7,599,490 26.6% State aid $12,724,237 44.6% Federal grants $3,459,849 $23,783,576 12.1%Total $28,559,964 100%
The Students
Students attend community colleges for different reasons: to prepare for transfer to four-year institutions, to obtain Associate Degrees or Certificates, obtain basic skills, or perhaps most importantly, to take refresher courses or participate in non-credit programs. Students also leave for various reasons; they may have achieved their educational goals or decided to interrupt their college career to work full-time. Tables 2.2 – 2.4 summarize the student body profile. The LCC unduplicated student body (headcount) is 15,541 (FY00-01 enrollment). This total consists of both credit and non-credit students.
Chapter 2: Data Sources and Assumptions
The Socioeconomic Benefits of Laredo Community College
6
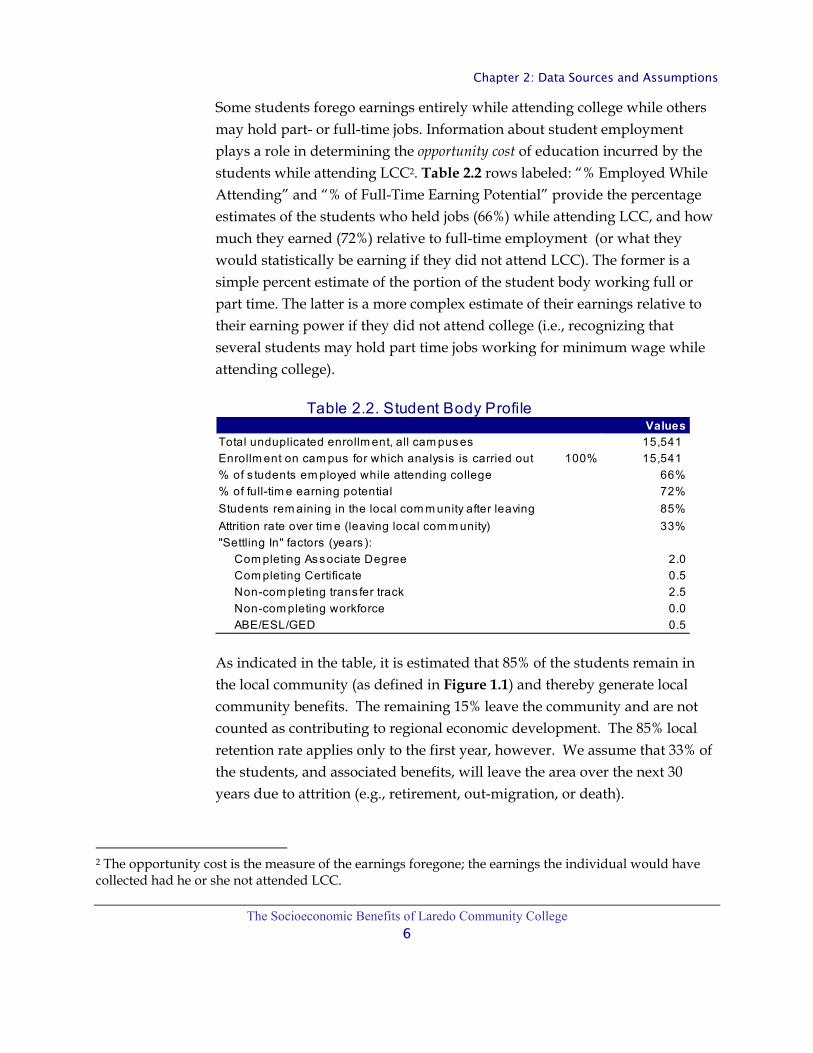
Some students forego earnings entirely while attending college while others may hold part- or full-time jobs. Information about student employment plays a role in determining the opportunity cost of education incurred by the students while attending LCC2. Table 2.2 rows labeled: “% Employed While Attending” and “% of Full-Time Earning Potential” provide the percentage estimates of the students who held jobs (66%) while attending LCC, and how much they earned (72%) relative to full-time employment (or what they would statistically be earning if they did not attend LCC). The former is a simple percent estimate of the portion of the student body working full or part time. The latter is a more complex estimate of their earnings relative to their earning power if they did not attend college (i.e., recognizing that several students may hold part time jobs working for minimum wage while attending college).
Table 2.2. Student Body Profile Values
Total unduplicated enrollm ent, all cam puses 15,541 Enrollm ent on cam pus for which analys is is carried out 100% 15,541 % of s tudents em ployed while attending college 66%% of full-tim e earning potential 72%Students rem aining in the local com m unity after leaving 85%Attrition rate over tim e (leaving local com m unity) 33%"Settling In" factors (years ):
Com pleting Associate Degree 2.0Com pleting Certificate 0.5Non-com pleting trans fer track 2.5Non-com pleting workforce 0.0ABE/ESL/GED 0.5
As indicated in the table, it is estimated that 85% of the students remain in the local community (as defined in Figure 1.1) and thereby generate local community benefits. The remaining 15% leave the community and are not counted as contributing to regional economic development. The 85% local retention rate applies only to the first year, however. We assume that 33% of the students, and associated benefits, will leave the area over the next 30 years due to attrition (e.g., retirement, out-migration, or death).
2 The opportunity cost is the measure of the earnings foregone; the earnings the individual would have collected had he or she not attended LCC.

Chapter 2: Data Sources and Assumptions
The Socioeconomic Benefits of Laredo Community College
7
The last five items in Table 2.2 are settling-in factors—the time needed by students to settle into the careers that will characterize their working lives. These factors are adapted from Norton Grubb (June 1999). Settling-in factors have the effect of delaying the onset of the benefits to the students and to society at large. Thus, we assume that for transfer track students, the earnings benefits will be delayed for at least 2.5 years to account for the time spent subsequently at 4-year colleges.
Entry-Level Education, Gender, and Ethnicity
Table 2.3 shows the education level, gender, and ethnicity of the LCC student body. This breakdown is used only to add precision to the analysis, not for purposes of comparing between different groups. Five education entry levels are indicated in approximate one-year increments, ranging from less than HS to post AD. These provide the platform upon which the economic benefits are computed.
The entry level characterizes the education level of the students when they first enter the college; this is consistent with the way most colleges keep their records. The analysis in this report, however, is based on the educational achievements of the students during the current year. As not all students reported in the enrollment figures for the fiscal year are in their first year of college, an adjustment was made to account for upper class students who had accumulated credits during their community college experience and moved up from the <HS/GED category. For this reason, the education levels of the student body must also be estimated for the beginning of the analysis year. Thus, of the 318 white males who first entered with HS/GED, it is estimated that only 87 still remain in that category at the beginning of the analysis year, meaning that 231 students have actually moved up from the “HS/GED equivalent” category to the “1-year post HS or less“ category or beyond since they first entered LCC. Note that the “Entry Level” and “Begin Year” columns always add to the same total. Differences between the two columns reflect a redistribution of students from entry level to where they are at the beginning of the analysis year. The assumptions underlying the process of redistributing the students from the “Entry Level” to “Begin Year” columns are internal to the economic model—they are designed to capture

Chapter 2: Data Sources and Assumptions
The Socioeconomic Benefits of Laredo Community College
8
02,0004,0006,0008,000
10,00012,00014,000
No.
of S
tude
nts
<HS
HS/
GED
HS+
1
HS+
2
> AD
Figure 2.2. Student Body Education Level: Entry vs. Beginning of Analysis Year
01,000
2,0003,000
4,0005,000
6,0007,000
No.
of S
tude
nts
<HS
HS/
GED
HS+
1
HS+
2
> AD
Table 2.3. Education Entry Level of Student Body
Entry Begin Entry Begin Entry Begin Entry Begin Entry BeginEntry Level Level Year Level Year Level Year Level Year Level Year< HS/GED 0 0 552 304 1 1 1,112 613 1,665 918HS/GED equivalent 318 87 6,137 1,776 155 42 6,733 2,040 13,343 3,9451 year pos t HS or less 1 136 36 2,730 1 67 75 3,100 113 6,0322 years pos t HS or less 1 85 64 1,743 1 42 115 2,012 180 3,883> AD 21 33 87 323 24 30 108 377 240 763Total 341 341 6,876 6,876 182 182 8,142 8,142 15,541 15,541
Minority Female TotalWhite Male Minority Male White Female
the dynamics of the educational progress as the students move up the educational ladder beyond their initial entry level.
The Achievements
Table 2.4 shows the student breakdown in terms of analysis year academic pursuits and/or achievements according to six categories: 1) retirees who attend largely for self enrichment, 2) Associate Degree completers, 3) Diploma and Certificate completers, 4) all transfer students, 5) all workforce students, and 6) ABE/ESL students3.
As indicated in the table, students achieving their graduation goals would be those completing Associate Degrees or Certificates (2.9% and 1.1%, respectively). The majority of students complete college credits, and either fulfill their educational needs, or return the following year to continue to work toward their goals (29.9% + 55.0% = 84.9% in the transfer track and workforce categories, respectively). The retired (0.4%) and ABE/ESL/GED students (10.7%) complete the breakdown of the student body. The retired
3 ABE/ESL = Adult basic education and English as a second language

Chapter 2: Data Sources and Assumptions
The Socioeconomic Benefits of Laredo Community College
9
Table 2.4. Levels of AchievementSt. Body Avg. CHEs This Total # Years
Student Body % 15,541 Age Year Credits Resid.Retired + recreation s tudents 0.4% 67 71 3.7 247 0.12Com pleting AA 2.9% 448 26 20.1 8,997 0.67Com pleting Certificate 1.1% 164 28 19.0 3,115 0.63Non-com pleting trans fer track 29.9% 4,647 24 13.7 63,664 0.46Non-com pleting workforce 55.0% 8,550 29 11.3 96,272 0.38ABE/ESL/GED 10.7% 1,665 36 6.3 10,556 0.21Total or weighted averages 100.0% 15,541 28.2 11.8 182,852Credits required for one full-tim e year equivalent of s tudy 30Note: weighted average of "CHEs per year does not include the retired s tudents
students are simply backed out of the analysis altogether on the assumption that they do not attend LCC to acquire skills that will increase their earnings. ABE/ESL/GED students are assumed to have a lower percentage impact than other students, because the end product of their education is to arrive at the “starting gate” on an equal basis with others. This does not mean that ABE/ESL/GED education has lower value; it simply means that these students must complete an extra step before they can compete effectively in the job market and reap the benefits of higher earnings.
The third column shows the average age of the students generating the benefits (excluding retirees). The difference between the average age (28.2 years) and retirement at 65, or 36.8 years is the time horizon for the analysis.
As indicated in column four, the average Associate Degree and Certificate student completed 20.1 and 19.0 CHEs of study, respectively, during the analysis year. The total number of CHEs completed during the year of analysis for the entire student body is 182,852. Finally, the last column shows the average time the students are actually in residence on campus during the analysis year. This information is needed to determine the opportunity cost of their education.

Chapter 2: Data Sources and Assumptions
The Socioeconomic Benefits of Laredo Community College
10
0.0
5.0
10.0
15.0
20.0
25.0
Ave
rage
CH
Es
Ret
ired
AA Cer
t.
Tran
sfer
Wor
kfor
ce
ABE/
ESL
Figure 2.4. Average and Total CHEs Earned for the Analysis Year
0
20,000
40,000
60,000
80,000
100,000
Tota
l Cre
dits
Ret
ired
AA Cer
t.
Tran
sfer
Wor
kfor
ce
ABE/
ESL
01,0002,0003,0004,0005,0006,0007,0008,0009,000
No.
of S
tude
nts
Ret
ired AA
Cer
t.
Tran
sfer
Wor
kfor
ce
ABE/
ESL
Figure 2.3. Number of Students
ANNUAL PRIVATE BENEFITS
The earnings statistics in Table 2.5, on which the benefit estimates (reported in Chapter 3 below) are based, reflect all occupations (technical and non-technical). The lower the education level, the lower the average earnings, regardless of the subject matters studied. The distinguishing feature among the achievement categories, therefore, is the number of CHEs completed. Statistics indicate that earnings are highly correlated with education. Correlation does not necessarily equal causation, however. Higher education is not the only factor explaining the private and public benefits reported in the statistics. Other variables such as ability, family background, and socioeconomic status play significant roles. The simple correlation between higher earnings and education nonetheless defines the upper limit of the effect
Chapter 2: Data Sources and Assumptions
The Socioeconomic Benefits of Laredo Community College
11
$0$5,000
$10,000$15,000$20,000$25,000$30,000
Earn
ings
/Ye
ar
<HS HS/GED HS+1 HS+2 > AD
Education Levels
Figure 2.5. Average Earnings by Education Levels
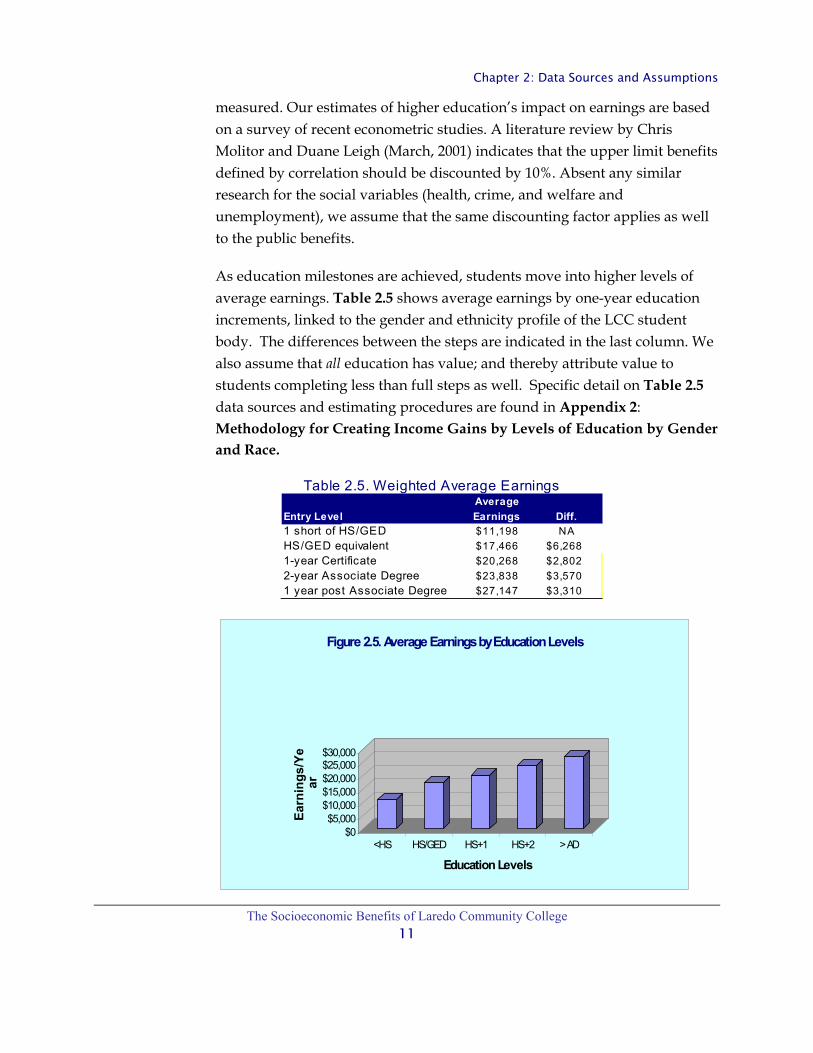
Table 2.5. Weighted Average EarningsAverage
Entry Level Earnings Diff.1 short of HS/GED $11,198 NAHS/GED equivalent $17,466 $6,2681-year Certificate $20,268 $2,8022-year Associate Degree $23,838 $3,5701 year post Associate Degree $27,147 $3,310
measured. Our estimates of higher education’s impact on earnings are based on a survey of recent econometric studies. A literature review by Chris Molitor and Duane Leigh (March, 2001) indicates that the upper limit benefits defined by correlation should be discounted by 10%. Absent any similar research for the social variables (health, crime, and welfare and unemployment), we assume that the same discounting factor applies as well to the public benefits.
As education milestones are achieved, students move into higher levels of average earnings. Table 2.5 shows average earnings by one-year education increments, linked to the gender and ethnicity profile of the LCC student body. The differences between the steps are indicated in the last column. We also assume that all education has value; and thereby attribute value to students completing less than full steps as well. Specific detail on Table 2.5 data sources and estimating procedures are found in Appendix 2: Methodology for Creating Income Gains by Levels of Education by Gender and Race.
Chapter 2: Data Sources and Assumptions
The Socioeconomic Benefits of Laredo Community College
12
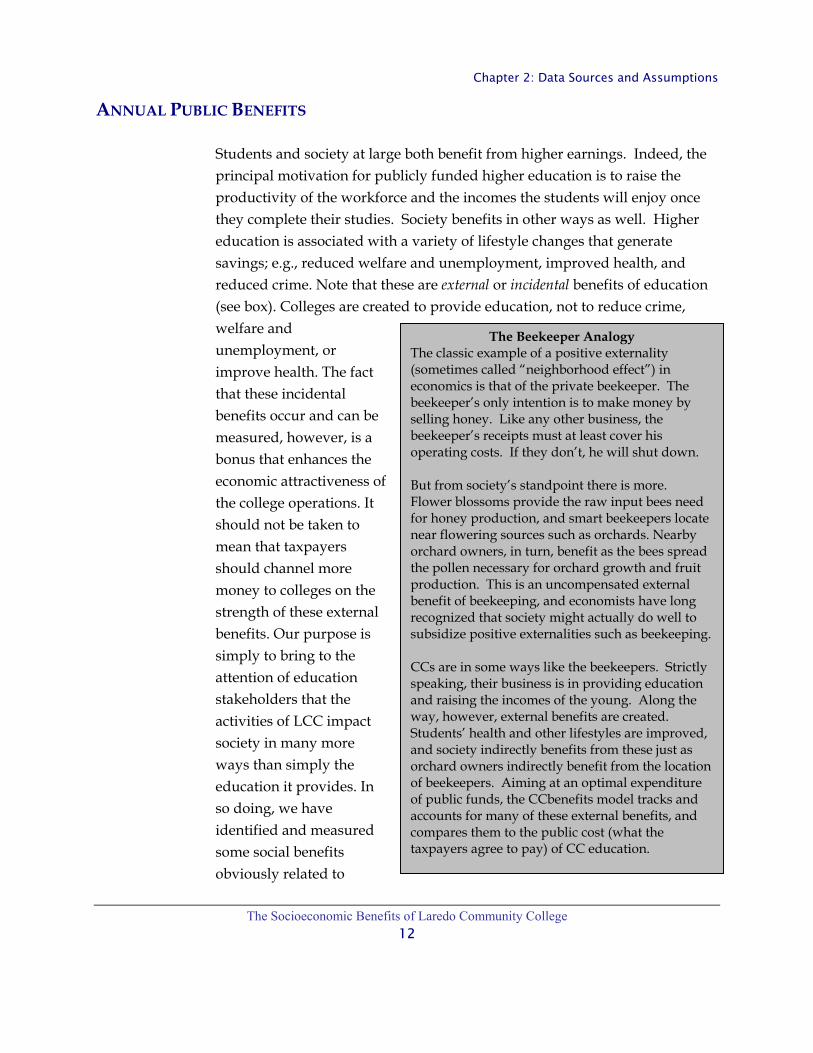
The Beekeeper Analogy The classic example of a positive externality (sometimes called “neighborhood effect”) in economics is that of the private beekeeper. The beekeeper’s only intention is to make money by selling honey. Like any other business, the beekeeper’s receipts must at least cover his operating costs. If they don’t, he will shut down. But from society’s standpoint there is more. Flower blossoms provide the raw input bees need for honey production, and smart beekeepers locate near flowering sources such as orchards. Nearby orchard owners, in turn, benefit as the bees spread the pollen necessary for orchard growth and fruit production. This is an uncompensated external benefit of beekeeping, and economists have long recognized that society might actually do well to subsidize positive externalities such as beekeeping. CCs are in some ways like the beekeepers. Strictly speaking, their business is in providing education and raising the incomes of the young. Along the way, however, external benefits are created. Students’ health and other lifestyles are improved, and society indirectly benefits from these just as orchard owners indirectly benefit from the location of beekeepers. Aiming at an optimal expenditure of public funds, the CCbenefits model tracks and accounts for many of these external benefits, and compares them to the public cost (what the taxpayers agree to pay) of CC education.
ANNUAL PUBLIC BENEFITS
Students and society at large both benefit from higher earnings. Indeed, the principal motivation for publicly funded higher education is to raise the productivity of the workforce and the incomes the students will enjoy once they complete their studies. Society benefits in other ways as well. Higher education is associated with a variety of lifestyle changes that generate savings; e.g., reduced welfare and unemployment, improved health, and reduced crime. Note that these are external or incidental benefits of education (see box). Colleges are created to provide education, not to reduce crime, welfare and unemployment, or improve health. The fact that these incidental benefits occur and can be measured, however, is a bonus that enhances the economic attractiveness of the college operations. It should not be taken to mean that taxpayers should channel more money to colleges on the strength of these external benefits. Our purpose is simply to bring to the attention of education stakeholders that the activities of LCC impact society in many more ways than simply the education it provides. In so doing, we have identified and measured some social benefits obviously related to

Chapter 2: Data Sources and Assumptions
The Socioeconomic Benefits of Laredo Community College
13
educational achievements and included them in the mix of impacts generated by the college.
Assuming state and local taxpayers represent the public, the public benefits of higher education can be gauged from two perspectives, 1) a broad perspective that tallies all benefits, and 2) a narrow perspective that considers only changes in the revenues and expenditures of state and local government.
Higher Earnings
Broad Perspective: Higher education begets higher earnings. The economy generates more income than it would absent the CC skills embodied in the labor force. From the broad taxpayer perspective, the total increase in regional earnings is counted as benefits of CC education, adjusted down by the benefits accruing to students covered by the alternative education variable in Table 2.9 further below (26.9%)—these students would still attend college elsewhere even if the LCC did not exist.
Narrow Perspective: Higher regional earnings translate into higher state and local tax collections. In the narrow taxpayer perspective we assume that the state and local authorities will collect 14.3% of the higher earnings in the form of taxes—the estimated composite of all taxes other than the federal income taxes.4
Health Savings
The improved health of students generates savings in three measurable ways: 1) lower absenteeism from work, 2) reduced smoking and 3) reduced alcohol abuse (Table 2.6). These variables are based on softer (i.e., less-documented) data. In general, statistics show a positive correlation between higher education and improved health habits. The table shows the calculated reductions in the incidences of smoking and alcohol abuse as a function of adding the higher education, also linked to the gender and ethnicity profile of the LCC student body. Recall from above, the health savings are reduced by 10% in recognition of causation variables not yet identified.
4 The tax data are obtained from the U.S. Census Bureau. See also Appendix 2.

Chapter 2: Data Sources and Assumptions
The Socioeconomic Benefits of Laredo Community College
14
Broad Perspective: The benefits from reduced absenteeism are equal to the average earnings per day multiplied by the number of days saved (less the students covered by the alternative education variable, as above). These are benefits that accrue largely to employers. Smoking- and alcohol-related savings accrue mostly to the individuals who will not have to incur the health-related costs. In the broad taxpayer perspective, however, these benefits accrued to employers and individuals are also public benefits.
Narrow Perspective: Taxpayers benefit from reduced absenteeism to the extent that state and local government is an employer. Accordingly, we assume a taxpayer’s portion of absenteeism savings at 10.1%, equal to the estimated public portion of employment in the region.5 As for smoking- and alcohol-related savings, the taxpayers benefit to the extent that state and local health subsidies (to hospitals, for example) are reduced. We assume that 6% of the total benefits can be counted as taxpayer savings.
5 The ratio of state and local earnings over total earnings in the US (Regional Economic Information System—REIS, Bureau of Economic Analysis, Dept. of Commerce, 1998)

Chapter 2: Data Sources and Assumptions
The Socioeconomic Benefits of Laredo Community College
15
0.0%10.0%
20.0%30.0%
40.0%
% o
f Pop
.
<HS HS/GED HS+1 HS+2 > AD
Education Level
Figure 2.7. Average Incidence of Smoking by Education Levels
0.02.04.06.08.0
10.012.014.0
No.
Day
s
<HS HS/GED HS+1 HS+2 > AD
Education Level
Figure 2.6. Days of Absenteeism by Education Levels
Table 2.6. Reduced Absenteeism, Smoking and Alcohol Habits
Education Level Days %/Year Average Reduction Average Reduction< HS/GED 12.6 4.8% 33.7% NA 9.6% NAHS/GED equivalent 7.9 3.0% 27.3% 19.0% 8.9% 7.3%1 year pos t HS or less 6.1 2.3% 23.1% 15.3% 7.8% 12.4%2 years pos t HS or les s 5.3 2.0% 18.8% 18.5% 6.8% 13.0%> AD 4.5 1.7% 14.7% 21.7% 5.9% 13.3%
2. Smoking: Health, United States, 2001, T able 61: Centers for Disease Cont rol and P revent ion; Nat ional Center for Health Stat ist ics; and The Econom ic Costs of Sm oking in the United States and the Benefits of Com prehensive Tobacco Legislation, U.S. T reasury Department , ht tp://www.ust reas.gov/press/releases/docs/tobacco.pdf3. Alcoholism: Health Prom otion and Disease Questionnaire of t he 1990 Nat ional Health Int erview Survey of the Center for Health Stat ist ics; and Nat ional Inst it ute on Drug Abuse and the Nat ional Inst it ute on Alcohol Abuse and Alcoholism,ht tp://www.nida.nih.gov/EconomicCost s/Index.html.
Smoking Alcohol AbuseAbsenteeism
1. Absenteeism: U.S. Department of Labor, Bureau of Labor Stat ist ics, Division of Labor Force Stat ist ics, ftp://ftp.bls.gov/pub/special.request s/lf/aat46.txt

Chapter 2: Data Sources and Assumptions
The Socioeconomic Benefits of Laredo Community College
16
0.0%2.0%4.0%6.0%8.0%
10.0%
% o
f Pop
.<HS HS/GED HS+1 HS+2 > AD
Education Level
Figure 2.8. Average Incidence of Alcohol Abuse
Crime Reduction Benefits
The first column of Table 2.7 relates the probabilities of incarceration to education levels—incarceration drops on a sliding scale as education levels rise (linked to the gender and ethnicity profile of the LCC student body). The percentage reductions are based on total prison population relative to the population at large.6 The implication is, as people achieve higher education levels, they are statistically less likely to commit crimes. The difference between before and after comprises the benefit attributable to education.
We identify three types of crime-related expenses, 1) the expense of prosecution, imprisonment, and reform, tracked as incarceration expense, 2) victim costs, and 3) productivity lost as a result of time spent in jail or prison rather than working. As with our other social statistics, crime-related expenses are reduced by 10% in recognition of other causation factors.
Broad Perspective: From the broad taxpayer perspective, all reductions in crime-related expenses are counted as a benefit (less the students covered by the alternative education variable, as above).
Narrow Perspective: We assume that nearly all (80%) of the incarceration savings accrue to the state and local taxpayers—federal funding covers the remainder. Crime victim savings are avoided costs to the potential victims,

Chapter 2: Data Sources and Assumptions
The Socioeconomic Benefits of Laredo Community College
17
0.0%
2.0%
4.0%
6.0%
8.0%
10.0%
12.0%
14.0%
16.0%
% o
f Pop
.
<HS HS/GED HS+1 HS+2 > ADEducation Level
Figure 2.10. Incidence of Incarceration
Table 2.7. Incarceration Rates Education Level Average Reduction< HS/GED 14.1% NAHS/GED equivalent 12.4% 12.1%1 year pos t HS or less 7.3% 41.6%2 years pos t HS or less 6.3% 13.2%> AD 5.6% 10.4%1. Literacy Behind Walls , Nat ional Center for Educat ion Stat ist ics, P rison Lit eracy P rograms, DIGEST No. 159 Lit eracy in Correct ions, Correct ional Educat ional Associat ion, 2. T . P . Bonczar & Alan J. Beck; Lifet ime likelihood of Going to Stat e or Federal P rison, US Department of Just ice, Office of Just ice P rograms, March 1997.3. Crim inal Justice Expenditure and Em ploym ent , Ext ract s P rogram (CJEE), author: Sidra Lea Gifford, [email protected] (202) 307-0765, 12/14/00.
not to the taxpayers. As such, we claim none of these as taxpayer savings. Finally, we apply our “composite” state and local government average tax rate (14.3%) to the added productivity of persons not incarcerated to arrive at the taxpayer benefits.
Welfare and Unemployment Reduction Benefits
Higher education is statistically associated with lower welfare and unemployment. Table 2.8 relates the probabilities of individuals applying for welfare and/or unemployment assistance to education levels (linked to the
6 See also: http://www.ojp.usdoj.gov/bjs/abstract/p00.htm.

Chapter 2: Data Sources and Assumptions
The Socioeconomic Benefits of Laredo Community College
18
0.0%
5.0%
10.0%
15.0%
% o
f Pop
.
<HS HS/GED HS+1 HS+2 > AD
Education Level
Figure 2.11. Welfare and Unemployment
Welfare Unemployment
Table 2.8. Welfare & Unemployment
Education Level Average Reduction Average Reduction< HS/GED 14.4% NA 15.0% NAHS/GED equivalent 7.2% 50.2% 9.4% 37.0%1 year pos t HS or less 4.0% 43.7% 7.2% 23.2%2 years pos t HS or less 3.7% 9.3% 6.3% 13.4%> AD 3.5% 3.3% 5.3% 14.8%1. T emporary Assistance for Needy Families, T ANF P rogram 3rd annual report to Congress, US Dept of Health and Human Resources, T able 10:12.2. T he Herit age Foundat ion, Means-Tested Welfare Spending: Past and Future Growth , T est imony by Robert Rector, (3/07/01).
UnemploymentW elfare
gender and ethnicity profile of the LCC student body). As above, all welfare and unemployment savings are reduced by 10% in recognition of other causation factors.
Broad Perspective: Reduced welfare and unemployment claims are counted in full as benefits in the broad taxpayer perspective (less the students covered by the alternative education variable, as above).
Narrow Perspective: Local taxpayer benefits from reduced welfare are limited to 16%--the extent to which the state and local taxpayers subsidize the welfare system. None is claimed for unemployment, because most of these costs are borne by the Federal Government.

Chapter 2: Data Sources and Assumptions
The Socioeconomic Benefits of Laredo Community College
19
COSTS
There are two main cost components considered in the analytic framework: 1) the cost incurred by the student, including the opportunity cost of his or her time (represented by the earnings foregone while attending LCC), and expenses for tuition and books, and 2) the cost incurred by state and local government taxpayers, part of the college’s operating and capital costs (the budget—see Table 2.1). These are briefly discussed below.
Opportunity Cost of Time
The opportunity cost of time is, by far, the largest cost. While attending LCC, most students forego some earnings, because they are not employed or are employed only part-time. The assumptions are discussed in conjunction with Table 2.2 above. For the non-working students, the opportunity cost is the full measure of the incomes not earned during their CC attendance. For students working part-time, the opportunity cost is the difference between what they could make full-time less what they are making part-time. No opportunity cost of time is charged for the fully employed. The opportunity costs are derived from the earnings categories by education entry levels given in Table 2.5, although with some important modifications, as briefly described below:
• The earnings in Table 2.5 are averages based on trajectories of earnings for all ages, from 17 to 65 (roughly defining the time spent engaged in the workforce).
• The average earnings, therefore, define the mid-point of a working life trajectory that begins with low entry-level wages and culminates with a typical worker’s highest wages around age 60. 7 The earnings data shown in Table 2.5 are specific to the state of Texas, weighted, however, to reflect the specific gender and ethnicity makeup of the
7 This profile of lifetime earnings is well documented in labor economics literature. For example, see Willis (1986), supported by the well-respected theoretical and empirical work of Becker (1964) and Mincer (1958).

Chapter 2: Data Sources and Assumptions
The Socioeconomic Benefits of Laredo Community College
20
LCC student body. Details on earnings and education sources are found in Appendix 2.
• The opportunity cost of time is then conditioned by the average age of the student (28.2 years, see Table 2.4). In particular, the average earnings at the midpoint ($19,489 in Table 3.5) are adjusted downward to $13,753 to reflect the average earnings at age 28.2.
The Budget
Beyond the student perspective, our assessment of LCC considers the benefits and costs from the state and local government taxpayer perspective. Accordingly, only the state and local government revenues in Table 2.1 are included as costs in the investment and benefit-cost assessment. All else equal, the larger the other revenue sources in Table 2.1 (federal grants, student tuition, and contract revenues) relative to state and local government revenues, the larger will be the relative economic payback to state and local taxpayers.
OTHER ASSUMPTIONS
Table 2.9 lists several other assumptions imbedded in the analytic model: a) the discount rate and time horizon, b) crime-related costs (incarceration costs are inclusive of the cost per prison year plus all costs associated with arrest, investigation, trial and finally incarceration), c) welfare and unemployment costs per year8, and d) health-related costs. 9 Annual real increases in costs are also included, although these are not used in the study. The alternative education opportunity assumption is discussed further below in association with the regional economic impacts.
8 As indicated in the table, we assume that the average duration on welfare and unemployment is 4.0 and 4.0 years, respectively. This means that, over the next 30 years or so, the cumulative incidence of welfare and/or unemployment will be spread evenly over the time horizon—it is not a consecutive period. 9 The incarceration, health, welfare and unemployment probability and cost variables are internal to the analytic model.

Chapter 2: Data Sources and Assumptions
The Socioeconomic Benefits of Laredo Community College
21
Table 2.9. Miscellaneous VariablesVariables
Discount rate 4.0%Tim e horizon, years to retirem ent 36.8Avg. cos t/prison year (all incl.: arres t, trial, incarc., rehab. etc.) $82,415Avg. length of incarc. (total years over 30-year tim e horizon) 4.0Real cos t increase per prison year 0.0%Average victim cos t $ 60,219Real victim cos t increase per year 0.0%Average cos t per welfare year $ 75,138Avg. duration on welfare (total years over 30-year tim e horizon) 4.0Welfare/unem ploym ent cos t increase per year 0.0%Average cos t per unem ploym ent year $ 36,249Avg. duration on unem pl. (total years over 30-year tim e horizon) 4.0Sm oking-related m edical cos ts per year $ 2,962Alcohol-related m edical cos ts /year $ 7,946Real m edical cos t increase per year 0.0%Alternative education opportunities 26.9%Assumptions adapted f rom:
5. T he Economic Costs of Smoking in the Unit ed States and the Benefit s of Comprehensive T obacco Legislat ion, ht tp://www.ust reas.gov/press/releases/docs/tobacco.pdf.6. Nat ional Inst itut e on Drug Abuse and the Nat ional Inst itut e on Alcohol Abuse and Alcoholism, found at : ht tp://www.nida.nih.gov/EconomicCost s/Index.html.
1. Bureau of Just ice Stat ist ics, T able #. 05 T otal direct and intergovernmental expenditure, by act ivity and level of government , fiscal years 1980-97, Criminal Just ice Expenditure and Employment Ext ract s P rogram, 12/14/00.
2. OICJ T he Extent and Costs of Vict imizat ion, Crime and Just ice: T he Americas, Dec-Jan 1995.3. T he Herit age Foundat ion, Means-Tested Welfare Spending: Past and Future Growth , T est imony by Robert Rector, (3/07/01).4. U.S. Department of Labor, Bureau of Labor Stat ist ics, ht tp://www.bls.gov/news.release/annpay.t01.htm.
REGIONAL ECONOMIC BENEFITS
In general, the regional economy is affected by the presence of LCC in two ways: from its day-to-day operations (including capital spending), and from students who enter the workforce with increased skills and know-how. Day-to-day operations of the college provide the direct jobs and earnings of the faculty and staff, and additional indirect jobs and earnings through the action of regional multiplier effects. At the same time, students expand the skill-base of the local workforce, deepening the economy’s stock of human capital, which attracts new industry and makes existing industry more productive.
Estimating these regional economic effects requires a number of interrelated models. Multiplier effects are obtained with an input-output (IO) model

Chapter 2: Data Sources and Assumptions
The Socioeconomic Benefits of Laredo Community College
22
constructed for the Laredo Community College economic region.10 Estimating CC operations effects requires an additional model that takes CC expenditures, deducts spending that leaks from the economy, and bridges what is left to the sectors of the IO model.
Several steps are involved in estimating the skill-enhancing effect of past students on the regional workforce, and in turn, the effect of these workforce changes on the regional economy. First, the number of past students still active in the regional workforce is estimated and converted to total workforce embodied CHEs. In the Annual Private Benefits section above an estimate was made of the incremental (per CHE) effect on student earnings of LCC instruction. This estimate is applied to total embodied CHEs to arrive at an initial estimate of the past student regional income effect. In arriving at the final estimate, the initial value must first be reduced to account for a collection of substitution effects, and then expanded to capture a collection of demand and supply-side effects. The end result is an estimate of the impact of past student skills and increased productivity on the size of the regional economy.
This section is divided into two subsections. The first documents our estimation of day-to-day LCC operations effects. The second documents our estimation of the effect of past student skills on the regional economy.
The Impact of LCC Operations
The first step in estimating the impact of LCC operations is to assemble a profile of its combined operating and capital expenditures (see Table 2.10). These data are drawn from the college budget and collected into the categories of Table 2.10. Column 1 simply shows the total dollar amount of spending. Columns 2 through 5 apportion that spending to in-region, in-
10 The Laredo Community College model is constructed according to traditional practice using national model IO coefficients and secondary data. The models employ the IO accounting framework presented in Robison (1997) and are equipped with regional purchase coefficients adapted from Stevens et. al., 1983.

Chapter 2: Data Sources and Assumptions
The Socioeconomic Benefits of Laredo Community College
23
Table 2.10. Profile of College Spending in and out of Regional Economy ($ Thousands)Non- Manufact. Net
Tot. Dollar Local Local, but % Local % Non-Loc. LocalAmount % in-state % Manufact. in-state % Spending
Spending Categories (1) (2) (3) (4) (5) (6)Salaries and Wages $21,069 87% 9% $18,413Travel $410 64% 11% $263Electricity and natural gas $774 20% 76% $155Telephone $214 37% 54% $78Building Materials & Gardening Supplies $0 0% 0% 0% 0% $0General Merchandise Stores $2,045 17% 59% 27% 6% $354Eating & Drinking $31 33% 27% $10Maintenance & Repair Construction $383 68% 20% $260New Construction $6,698 90% 10% $6,028Insurance $106 2% 98% $2Legal Services $118 90% 10% $106Credit Agencies $0 0% 0% $0U.S. Postal Service $64 82% 4% $53Accounting, Auditing & Bookkeeping $20 100% 0% $20Marketing $316 37% 53% $117Other Business Services $617 47% 22% $290Water Supply & Sewerage Systems $182 100% 0% $182Printing & Publishing $30 10% 90% $3Rental Property $0 0% 0% $0Services to Buildings $241 15% 85% $36Unemployment Compensation $26 10% 90% $3Honoraria + other payments to households $0 0% 0% $0Total $33,344 $26,371Note: this table provides details for the summary of the college role in the regional economy (Table 3.10)
state and out-of-state vendors. The net local portion is derived in Column 6. The spending data shown in this column are fed into the regional IO model.11
The information on total spending required for column 1 is generally readily available, though sorting specific items to the categories of the table can take some time. Information in columns 2 through 5 is generally more problematic—hard data are scarce on the local/non-local split. In these cases, staff is asked to use their best judgment.
The first row in Table 2.10 shows salaries and wages. These direct earnings are part of the economic region’s overall earnings, and appear as “Direct Earnings of Faculty and Staff” in the table of findings, Table 3.10. Dollar values in Table 2.10 column 6, “net local spending,” are fed into the economic region IO model. The IO model provides an estimate of indirect effects, and these appear as “Indirect Earnings” in Table 3.10.
11 Table 2.10, by itself, provides very important information to present to local audiences—Chambers of Commerce, local business establishments, Rotary clubs, and the like. The table demonstrates that the college is a “good neighbor” in the local community, evidenced by the fact that an estimated 79% of all college expenditures benefit local vendors ($26,371 / $33,344 = 79%).

Chapter 2: Data Sources and Assumptions
The Socioeconomic Benefits of Laredo Community College
24
The Direct Economic Development Effects of Students
In the next chapter we estimate that the average CHE of LCC instruction is worth $95 per year in increased employee earnings (see Table 3.3). This is the average value across the student’s entire working life.12 At any point in time, the local workforce will embody thousands of CHEs of past LCC instruction. We obtain an initial estimate of the direct past student economic development effect by multiplying the total hours of embodied instruction by the $95 value.
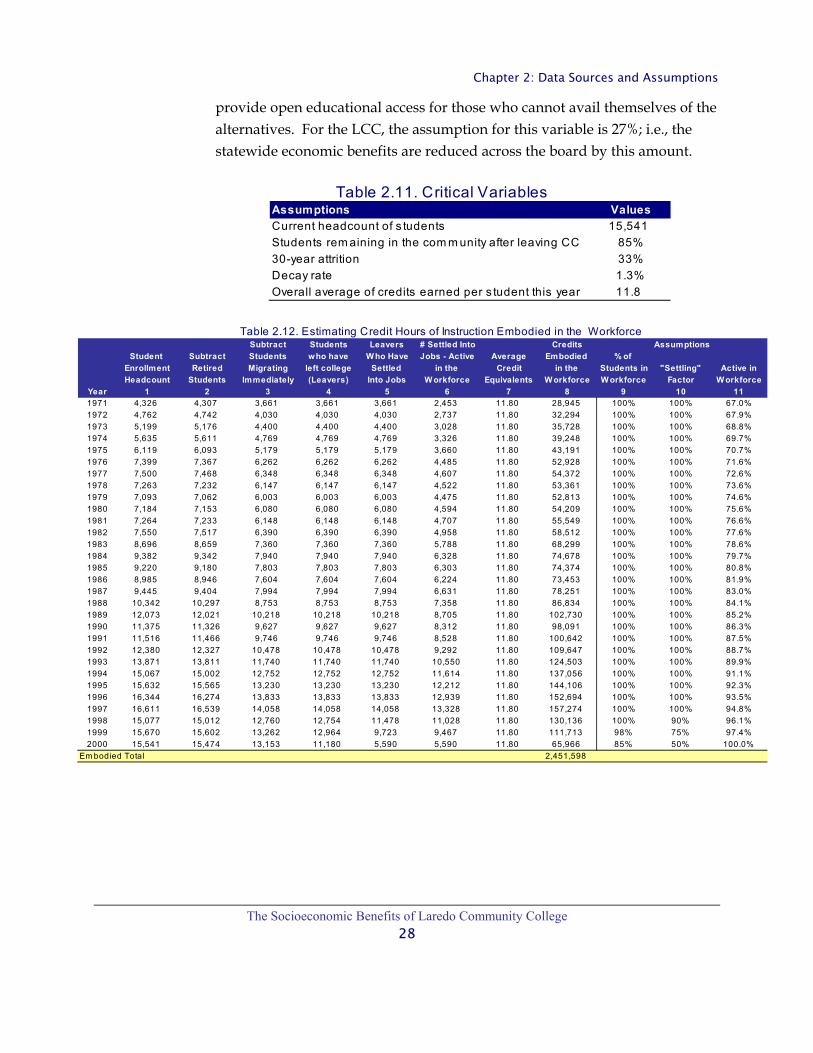
A separate model is constructed to estimate the CHEs of past LCC instruction embodied in the regional workforce. Table 2.11 indicates variables critical to the model, while Table 2.12 shows the output of the model itself. Considering Table 2.12 one column at a time conveys the logic of the model.
Column 1 provides an estimate of the enrollment history (unduplicated headcount) of LCC students. Column 2 represents the non-retired students, in other words, the students who have the potential to go into the workforce. Column 3 is the same as column 2, but net of students who leave the region immediately upon leaving LCC. As shown in the table, 85% of the students remain in the area upon leaving the CC, 15% leave.
Column 4 goes one step further—a comparison of columns 3 and 4 indicates that all past students have left LCC except for the last three years (1997 – 2000) where students are still enrolled (the leaver assumptions are shown in column 9).
Column 5 further reduces leavers to focus only on those who have settled into a somewhat permanent occupation. As shown in column 10 (the “settling factor”), it is assumed that all students settle into permanent
12 In reality, the earnings increment due to LCC skills might be expected to start low and grow over the course of a student’s working life. LCC-acquired skills open doors for the students, giving them a chance to excel and advance in their careers. Our earnings increment due to LCC attendance is an average across all age levels (as also discussed above in relation to the opportunity cost of time variable). It would thus overstate earnings in the early years and understate them in later years. Our interest, however, is to arrive at an estimate of the lifetime accumulated earnings increment. Use of the average for the entire course of student working lives should provide the proper aggregate estimate.

Chapter 2: Data Sources and Assumptions
The Socioeconomic Benefits of Laredo Community College
25
occupations by their fourth year out of school. Settling-in assumptions are specified in Table 2.2 above.
Column 6 transitions further from leavers who have settled into jobs to leavers still active in the current workforce. Here we net off workers who, subsequent to leaving LCC and settling into the local workforce, have out-migrated, retired, or died. As shown in Table 2.11, 33% of the past students will out-migrate, retire or die over the course of the next 30 years. This “30-year attrition” follows an assumed logarithmic decay function shown in column 11 labeled “active in local workforce.”
Column 7 shows the average CHEs generated per year back to 1971. These data were obtained by dividing total year-by-year CHEs by the corresponding headcount.13 Column 8 shows the product of the year-by-year average CHEs, and the estimate of the number of past students active in the current workforce in column 6. Looking to the total in Column 8, we estimate that the current workforce of the Laredo Community College economic region embodies some 2.5 million CHEs of past LCC instruction.
From Embodied CHEs to Direct Income Effects
An upper-bound estimate of the past student economic development effect is obtained by multiplying the total embodied CHEs (Table 2.12) by the estimated $95 per-CHE value (Table 3.2). The result of this calculation is still an upper bound, for reasons pertaining to economic development theory. We constructed a model to capture this dynamic, and thereby reduced the upper bound to arrive at the estimate of the direct past student economic development effect. Our model hinges on two assumptions for two polar case scenarios (see Box).
Note that with polar case scenario 1, we would reduce our upper-bound estimate to zero – i.e., an enhanced workforce skill base has no economic development effect. In contrast, with polar case scenario 2 we would accept the full upper-bound amount as our past student economic development effect. Obviously the true measure is somewhere in between.

Chapter 2: Data Sources and Assumptions
The Socioeconomic Benefits of Laredo Community College
26
Polar Cases
Polar Case Scenario 1. Assumption #1 is that the rate of technical substitution between local skilled and unskilled workers is infinitely elastic; or, the newly skilled past LCC students are substituted for unskilled workers in a manner that creates no net additional regional earnings. Businesses simply replace lower productivity (and lower paid) unskilled workers with some smaller number of higher productivity (and higher paid) skilled workers, with no net change in overall output or earnings.
Assumption #2 is that the rate of technical substitution between local and non-local workers is infinitely elastic, and that the existence of a skilled workforce is not a factor in attracting new industry to the region. This means that existing industry can readily draw skilled workers from outside the region, and regionalgrowth is driven by something other than skills in the local workforce. Skilled workers are easily imported without extraordinary inducements or wage premiums that would otherwise increase costs and reduce competitiveness.
Polar Scenario 2. Assumption #1 is that the rate of technical substitution between local skilled and unskilled workers is infinitely inelastic. Skilled workers are able to perform the same tasks at less expense than unskilled workers, and they are able to perform many tasks that unskilled workers cannot. Under this assumption, skilled workers increase efficiency, enable an expansion of the product line, and generally increase the competitiveness of existing industry. The result is an expansion of earnings as well as output.
Assumption #2 is that the rate of technical substitution between local and non-local workers is infinitely inelastic. The existence of a skilled workforce, therefore, is a factor in attracting new industry to the region (there is a near stand-alone development theory based on the notion that skilled workers attract new industry—Borts and Stein, 1964).
There is considerable empirical literature on the economic development effects of education from which we adapted a documented adjustment factor. In particular, in a recent study Bils and Klenow (2000) survey past work on the economic development effects of education, and advance a model of their own. Based on their findings, we reduce the upper bound to 30%of the potential (upper bound) total to arrive at our final estimate: thus $57.0 million of the upper bound value is counted as the direct past student economic development effect. These appear in Table 3.10 under the heading “Earnings Attributable to Past Student Economic Development Effects,” “Direct Earnings.”
13 We used the current year estimate of CHEs (see Table 2.4), adjusted for the retired students, as a proxy for the average achievement per student in all prior years before FY 2000-01.

Chapter 2: Data Sources and Assumptions
The Socioeconomic Benefits of Laredo Community College
27
The Indirect Economic Development Effects of Students
The direct earnings attributed to the LCC skills embodied in the current region workforce are not the only past student economic development effects. Associated with the increased output and earnings is an increased demand for both consumer goods and services, and goods and services purchased by businesses as inputs. These, in turn, produce a set of regional economic multiplier effects as increased employee and business spending ripples through the other parts of the economy.
We assume that the students will acquire jobs in the higher-stage sectors of the economy (e.g., technical services and advanced manufacturing sectors, see Parr, 1999). For demand-induced effects, we compute a weighted average demand-driven earnings multiplier from the IO model for the impact area. Higher-stage sectors receive greater weight than lower-stage sectors. Demand-side indirect effects are obtained in the usual manner by applying the multiplier to the direct effect estimate.
There is still more. Economic development theory describes an “agglomeration” effect whereby regional growth itself stimulates growth. A new plant (A) established in a region attracts other plants to the same region (B, C, and D) that use A’s outputs as inputs in their production processes. This in turn spawns another round of industry growth, and so on. To estimate agglomeration effects, we configure our economic region IO model to provide a set of so-called supply-driven multipliers (see for example Miller and Blair, 1985). We then compute a weighted average supply-driven earnings multiplier, again favoring higher-stage sectors. Agglomeration (or supply-side) effects are obtained by applying the multiplier to the direct effect estimate.
Finally, a third key element is accounted for—the alternative education opportunity variable (see Table 2.9). This is technically not a cost variable, but rather a “negative benefit,” one that recognizes the fact that, absent the LCC, some portion of the aggregate student body would obtain an education elsewhere. The problem is determining what this portion is. Clearly, 100% would be incorrect because not everyone would be able to attend a technical college in a neighboring state. Indeed, an integral part of the CC mission is to
Chapter 2: Data Sources and Assumptions
The Socioeconomic Benefits of Laredo Community College
28
Table 2.12. Estimating Credit Hours of Instruction Embodied in the WorkforceSubtract Students Leavers # Settled Into Credits
Student Subtract Students who have W ho Have Jobs - Active Average Embodied % of Enrollment Retired Migrating left college Settled in the Credit in the Students in "Settling" Active inHeadcount Students Immediately (Leavers) Into Jobs W orkforce Equivalents W orkforce W orkforce Factor W orkforce
Year 1 2 3 4 5 6 7 8 9 10 111971 4,326 4,307 3,661 3,661 3,661 2,453 11.80 28,945 100% 100% 67.0%1972 4,762 4,742 4,030 4,030 4,030 2,737 11.80 32,294 100% 100% 67.9%1973 5,199 5,176 4,400 4,400 4,400 3,028 11.80 35,728 100% 100% 68.8%1974 5,635 5,611 4,769 4,769 4,769 3,326 11.80 39,248 100% 100% 69.7%1975 6,119 6,093 5,179 5,179 5,179 3,660 11.80 43,191 100% 100% 70.7%1976 7,399 7,367 6,262 6,262 6,262 4,485 11.80 52,928 100% 100% 71.6%1977 7,500 7,468 6,348 6,348 6,348 4,607 11.80 54,372 100% 100% 72.6%1978 7,263 7,232 6,147 6,147 6,147 4,522 11.80 53,361 100% 100% 73.6%1979 7,093 7,062 6,003 6,003 6,003 4,475 11.80 52,813 100% 100% 74.6%1980 7,184 7,153 6,080 6,080 6,080 4,594 11.80 54,209 100% 100% 75.6%1981 7,264 7,233 6,148 6,148 6,148 4,707 11.80 55,549 100% 100% 76.6%1982 7,550 7,517 6,390 6,390 6,390 4,958 11.80 58,512 100% 100% 77.6%1983 8,696 8,659 7,360 7,360 7,360 5,788 11.80 68,299 100% 100% 78.6%1984 9,382 9,342 7,940 7,940 7,940 6,328 11.80 74,678 100% 100% 79.7%1985 9,220 9,180 7,803 7,803 7,803 6,303 11.80 74,374 100% 100% 80.8%1986 8,985 8,946 7,604 7,604 7,604 6,224 11.80 73,453 100% 100% 81.9%1987 9,445 9,404 7,994 7,994 7,994 6,631 11.80 78,251 100% 100% 83.0%1988 10,342 10,297 8,753 8,753 8,753 7,358 11.80 86,834 100% 100% 84.1%1989 12,073 12,021 10,218 10,218 10,218 8,705 11.80 102,730 100% 100% 85.2%1990 11,375 11,326 9,627 9,627 9,627 8,312 11.80 98,091 100% 100% 86.3%1991 11,516 11,466 9,746 9,746 9,746 8,528 11.80 100,642 100% 100% 87.5%1992 12,380 12,327 10,478 10,478 10,478 9,292 11.80 109,647 100% 100% 88.7%1993 13,871 13,811 11,740 11,740 11,740 10,550 11.80 124,503 100% 100% 89.9%1994 15,067 15,002 12,752 12,752 12,752 11,614 11.80 137,056 100% 100% 91.1%1995 15,632 15,565 13,230 13,230 13,230 12,212 11.80 144,106 100% 100% 92.3%1996 16,344 16,274 13,833 13,833 13,833 12,939 11.80 152,694 100% 100% 93.5%1997 16,611 16,539 14,058 14,058 14,058 13,328 11.80 157,274 100% 100% 94.8%1998 15,077 15,012 12,760 12,754 11,478 11,028 11.80 130,136 100% 90% 96.1%1999 15,670 15,602 13,262 12,964 9,723 9,467 11.80 111,713 98% 75% 97.4%2000 15,541 15,474 13,153 11,180 5,590 5,590 11.80 65,966 85% 50% 100.0%
Em bodied Total 2,451,598
Assumptions
Table 2.11. Critical Variables Assumptions ValuesCurrent headcount of s tudents 15,541Students rem aining in the com m unity after leaving CC 85%30-year attrition 33%Decay rate 1.3%Overall average of credits earned per s tudent this year 11.8
provide open educational access for those who cannot avail themselves of the alternatives. For the LCC, the assumption for this variable is 27%; i.e., the statewide economic benefits are reduced across the board by this amount.

Chapter 3: Private, Public, and Regional Economic Benefits
The Socioeconomic Benefits of Laredo Community College
29
Chapter 3 PRIVATE, PUBLIC AND REGIONAL ECONOMIC
BENEFITS
INTRODUCTION
his chapter summarizes the main LCC case study results in four sections: 1) the aggregate annual private and public benefits; 2) these same benefits measured per CHE and per student; 3) future benefits expressed in terms of NPV, RR, and B/C ratio, and 4) the regional economic benefits.
ANNUAL BENEFITS
Higher Student Earnings
The annual benefits are summarized in Tables 3.1 and 3.2. We begin with earnings growth in Table 3.1. Last year, each student completed, on average, 11.8 CHEs at LCC (see Table 2.4), only a fraction of one full year of study. This is because the majority of students attend for a variety of purposes as discussed in conjunction with Table 2.4; for some, to make progress towards an eventual degree, and for others, simply to acquire certain skills that will increase their productivity in the workforce. A total of 15,541 students will capture $17.4million worth of higher annual earnings based on this average increase in educational attainment.
Social Savings
Health-Related Savings
Also in Table 3.1, we see that improved health, lower welfare and unemployment, and lower crime will result in annual dollar savings to the taxpayers of $2.5, $1.9, and $4.4 million (rounded). In Table 3.2, these same results are presented in greater detail—health-related absenteeism will decline by 12,348 days per year, translating to a total of 47 years’ worth of productivity gained per year (based on 260 workdays per year). Annual total
T

Chapter 3: Private, Public, and Regional Economic Benefits
The Socioeconomic Benefits of Laredo Community College
30
dollar savings from reduced absenteeism days equals $0.9 million. There will be 337 fewer smokers and 80 fewer alcohol abusers, amounting to annual total dollar savings of $1.00 and $0.6 million, respectively, inclusive of insurance premiums, personal payments, and withholding for Medicare and Medicaid.
Crime-Related Savings
There will be 256 fewer people incarcerated as a result of the higher education obtained, saving the taxpayers a grand total of some $3,001,012 per year. The assumptions pertaining to these results are listed in Table 2.9 in the previous chapter. They are based on an average duration of 4.0 years incarcerated at an average cost of $82,415 per year (inclusive of arrest, prosecution, incarceration, and rehabilitation). 14 Fewer people incarcerated means more people gainfully employed—this translates to $790,394 in additional annual earnings for the local community. Victim costs will be reduced by $630,244 per year.
Welfare and Unemployment Savings
There will be 184 and 150 fewer people on welfare and unemployment, respectively, in the community. The corresponding total dollar savings for the local community amounts to $1,949,381 ($724,523 welfare + $1,224,857 unemployment savings) for one year, assuming that the average time spent on welfare and unemployment is 4.0 years (see Table 2.9).
Total Public Benefits
All told, there will be $8.9 million in public savings per year in the community—the sum of all health, crime, and welfare/unemployment benefits in Table 3.2.
14 The calculation is as follows: 256 not incarcerated x $82,415 x 4.0 years / 36.8 years to retirement from Table 2.9 = $143,319.

Chapter 3: Private, Public, and Regional Economic Benefits
The Socioeconomic Benefits of Laredo Community College
31
Figure 3.1. Higher Earnings and Social Savings per Year
$17,430,679
$2,508,141
$4,421,650
$1,949,381
EarningsHealthWelfare/Unempl.Crime
Table 3.2. Summary of Annual BenefitsUnits Earnings Social Savings
Higher earnings NA $17,430,679Health benefits Absenteeism savings (days ) 12,348 NA $871,662 Fewer sm okers , m edical savings (# persons ) 337 NA $997,337 Fewer alcohol abusers (# persons) 80 NA $639,142Crime benefits Incarceration savings (# persons) 256 NA $3,001,012 Crim e victim savings NA NA $630,244 Added productivity (fewer incarcerated) NA NA $790,394W elfare/unemployment benefits Welfare savings (# persons ) 184 NA $724,523 Unem ploym ent savings (# persons ) 150 NA $1,224,857Total $17,430,679 $8,879,171
Table 3.1 Student Body Achievements, Higher Earnings
Higher Improved Low er W elfare Low erLevel of Education Earnings Health Unemployment Crime Total< HS/GED $773,542 $97,370 $195,937 $49,083 $1,115,931HS/GED equivalent $1,108,391 $122,428 $185,226 $51,243 $1,467,2871 year post HS or less $7,833,036 $1,498,549 $1,324,015 $3,982,115 $14,637,7162 years post HS or less $6,377,774 $614,009 $191,394 $258,418 $7,441,595> Associate Degree $1,337,936 $175,785 $52,809 $80,790 $1,647,320Total $17,430,679 $2,508,141 $1,949,381 $4,421,650 $26,309,850
Social (External Benefits)
ANNUAL BENEFITS PER CHE AND PER STUDENT
The aggregate benefits reported in Tables 3.1 and 3.2 above are expressed per CHE and per student in Table 3.3. On average, students capture: a) $95 per

Chapter 3: Private, Public, and Regional Economic Benefits
The Socioeconomic Benefits of Laredo Community College
32
Figure 3.2. Annual Benefits per Credit
$95.3
$16.4
$3.4
$8.9$4.8
$ 3 $4.0 $6.7 Higher earnings
Absenteeism Savings
Medical Cost Savings
Incarceration Savings
Crime Victim Savings
Add Prod. (few er incarc.)
Welfare Savings
Unemployment Savings
Table 3.3. Annual $ per Credit and StudentPer Credit Per Student Annualized
Higher earnings $95 $1,339 $3,405Absenteeism Savings $5 $49 $124Medical Cos t Savings $9 $110 $279Incarceration Savings $16 $274 $697Crim e Victim Savings $3 $58 $146Add Prod. (fewer incarc.) $4 $76 $193Welfare Savings $4 $85 $215Unem ploym ent Savings $7 $70 $179Total $144 $2,060 $5,238
year in higher earnings per CHE,15 and b) $1,339 per year in higher earnings per student on the basis of the number of CHEs completed. Converted to a full-year-equivalent (30 CHEs), the annual earnings would amount to $3,405 per student. On average, the social benefits per CHE range from a low of $3 for Crime Victim Savings to a high of $16 per CHE for Incarceration Savings. On a per student basis, they range from a low of $49 per student for Crime Victim Savings to a high of $274 for Incarceration Savings. On a full-year equivalent basis (30 CHEs), the social savings would amount to $1,833 per student (the total of $5,238 less $3,405 of higher private earnings as indicated in Table 3.3).
15 Thus, a student attending for 10 CHEs will add $953 per year to the lifetime earnings. A longer curriculum will add substantially more. The earnings expectations are portrayed as linear but with many computational steps involved (see Chapter 2). The extrapolation is based on the averages of low earnings additions for leavers completing few CHEs, plus higher additions for leavers completing more CHEs.

Chapter 3: Private, Public, and Regional Economic Benefits
The Socioeconomic Benefits of Laredo Community College
33
THE INVESTMENT ANALYSIS: INCORPORATING FUTURE BENEFITS
The results in Tables 3.1 and 3.2 provide only a single-year snapshot of the benefits. As long as the students remain in the workforce, however, the CC-acquired skills continue to add productivity over time. In the investment analysis, the higher earnings and avoided costs are projected into the future over the working life of the student, discounted to the present, and then compared to the present costs of education. The investment is feasible if all discounted future benefits are greater than or equal to the costs.16
The investment analysis results are shown in Table 3.9 (in the aggregate, per CHE and per student). The end results sought are the Net Present Value (NPV), Rate of Return (RR), the Benefit/Cost (B/C) ratio and the Payback Period.17 These are simply different ways of expressing the results. All of the present value results shown are intermediary steps that ultimately generate the NPVs, RRs and B/C ratios.
We begin with some definitions in Table 3.4. Private benefits are the higher earnings captured by the students themselves. Broad taxpayer benefits are the additions to regional earnings plus lower overall expenditures related to health, crime, welfare and unemployment. Narrow taxpayer benefits include increased state and local tax revenues (from increased regional income), and savings from reduced state and local government expenditures for incarceration, health and welfare.
16 Future benefits are worth less than present benefits. The present value of $5,000 to be received 30 years from today is worth only $1,603 given a 4% discount rate ($5,000/(1.04)30 = $1,603). If the same benefits occur each year for 30 years, each year’s benefit must be discounted to the present, summed and collapsed into one value that represents the cumulative present value of all future benefits. Thus, the present value of 30-years’ worth of $5,000 per year is $90,000. 17 The criteria for feasibility: a) NPV must be positive or equal to zero; b) RR must be equal to or greater than the returns from other similar risk investments; c) the B/C ratio must be equal to or greater than 1; and d) the payback period is the number of years of benefits required to fully recover the investment made.

Chapter 3: Private, Public, and Regional Economic Benefits
The Socioeconomic Benefits of Laredo Community College
34
Table 3.4. Some DefinitionsDefinitionsStudent Benefits Higher earnings , captured by the s tudents Taxpayer Benefits: Broad Additions to earnings plus lower overall expenditures related to
health, crim e, welfare and unem ploym entIncreased s tate & local governm ent tax collections plus lower s tate & local govt. exp. related to health, crim e, welfare and unem ploym ent
Student Costs Tuition (Table 2.1) + opportunity cos t of tim eTaxpayer Costs Taxes (s tate and local, see Table 2.1)Results: Student Perspective Student Benefits / Student Cos ts Taxpayer Perspective: Broad Taxpayer Benefits (Broad) / Taxpayer Cos ts Taxpayer Perspective: Narrow Taxpayer Benefits (Narrow) / Taxpayer Cos ts
Taxpayer Benefits: Narrow
On the cost side, student costs consist of the tuition paid by the students (16.1% of the total budget in Table 2.1) and, most importantly, the opportunity cost of time (the earnings foregone). Also included here are the other sources of institutional revenues from private sources (0.6% in the case of LCC). The taxpayer costs consist of the state and local tax items in Table 2.1, or a total of 26.6% plus 44.6% = 71.2%.
The opportunity cost (earnings foregone) incurred by the student body in the aggregate is estimated in Table 3.5. The first number in the table is the overall average statistical annual income of the student body (given gender and ethnicity characteristics). This number, however, reflects the midpoint of the lifetime trajectory of earnings, while what is needed is the earnings of the students while enrolled (which is expected to be less than earnings at the midpoint). This is the second number in the table, or $13,753 per year, assuming full-time employment. The adjustment from the first to the second number takes into account the average age of the student body and the relationship between earnings and age as specified by the well-known and tested “Mincer equation” (see, for example, Willis 1986, p 530).
We then deduct the retired student body (0.4%) to arrive at the net number of students subject to opportunity cost calculations— 15,474 students. The 5,255 students not working are charged the full opportunity cost of time (based on the average term in residence), or $28,428,765. The 10,219 working students are charged only a fraction of the full opportunity cost (72%), or $15,236,197 as indicated in the table. Finally, we adjust the opportunity cost downward

Chapter 3: Private, Public, and Regional Economic Benefits
The Socioeconomic Benefits of Laredo Community College
35
Table 3.5. Opportunity Costs (Earnings Foregone), $ per Year Opp. Cost
Avg. s tatis tical annual income of given gender and ethnicity profile $19,489Annual income, given gender and ethnicity profile, at current age of s tudents $13,753CHEs per s tudent (net of retired) 11.8Avg. term in res idence and avg. income while in res idence 39% $5,410Total num ber of s tudents 15,541 Less retired % 0.4% 67 Remaining s tudents subject to opportunity cos t computation 15,474 Students not working while attending college and opportunity cos t 34% 5,255 $28,428,765No. of working s tudents 10,219 % working part time, earnings relative to s tat. averages , and opp. cost 72% $1,491 $15,236,197Total opportunity cos t $43,664,962Pell and other s tudent aid $9,218,243Restricted portion of s tudent aid (tuition and fees) 10% $921,824 ($8,296,419)GRAND TOTAL STUDENT OPPORTUNITY COST $35,368,544
by the Pell and other student aid grants and the estimated 10% adjustment for the restricted use of these grants for tuition and fees.
We also present the results in different ways. First, the student perspective results indicate whether the LCC education pays by comparing the private benefits (higher earnings) to the private costs. Second (as discussed in the previous chapter), we compare all private and public benefits to the public costs (the state and local taxpayer contributions in Table 2.1) in a broad taxpayer perspective in present value terms. Third and finally, in a narrow taxpayer perspective, we compare only a portion of the public benefits (taxpayer actual savings) to the public costs; i.e., do state and local taxpayer investments of $20,323,727 (Table 2.1) pay off in terms of the public savings generated?
The Student Perspective
The collective investment of the students (time and money) is assessed in Table 3.6. Column 1 tracks the increased earnings of the student body as they leave the CC, and follows them over the course of their working life (65 - 28.2 = 36.8 years, see Table 2.4). The upward trend in earnings is calculated based on the Mincer equation (see Willis, 1986). It reflects both the growth in students’ earnings over time and the spread in the increased earnings attributable to education.18 Column 2 is simply column 1 reduced by the 10% discount value that accounts for causation factors affecting student earnings.
18 We computed a Mincer equation based on the estimated coefficients presented in Willis, 1986, p. 545. These were adjusted to 2001 dollars in the usual fashion by applying the “GDP Implicit Price Deflator.”

Chapter 3: Private, Public, and Regional Economic Benefits
The Socioeconomic Benefits of Laredo Community College
36
Table 3.6. Student Earnings ($ Thousands) 1 2 3 4
Higher Higher Earnings Earnings Net Cash
Year Gross Net Cost Flow1 $6,786 $6,108 $39,823 ($33,716)2 $7,869 $7,082 $0 $7,0823 $12,444 $11,199 $0 $11,1994 $13,707 $12,337 $0 $12,3375 $15,035 $13,532 $0 $13,5326 $16,424 $14,781 $0 $14,7817 $17,869 $16,083 $0 $16,0838 $19,367 $17,431 $0 $17,4319 $20,912 $18,821 $0 $18,82110 $22,498 $20,248 $0 $20,24811 $24,117 $21,705 $0 $21,70512 $25,763 $23,187 $0 $23,18713 $27,427 $24,684 $0 $24,68414 $29,100 $26,190 $0 $26,19015 $30,773 $27,695 $0 $27,69516 $32,436 $29,192 $0 $29,19217 $34,080 $30,672 $0 $30,67218 $35,694 $32,124 $0 $32,12419 $37,267 $33,541 $0 $33,54120 $38,791 $34,912 $0 $34,91221 $40,253 $36,228 $0 $36,22822 $41,645 $37,480 $0 $37,48023 $42,956 $38,660 $0 $38,66024 $44,177 $39,760 $0 $39,76025 $45,300 $40,770 $0 $40,77026 $46,317 $41,685 $0 $41,68527 $47,219 $42,497 $0 $42,49728 $48,001 $43,201 $0 $43,20129 $48,657 $43,791 $0 $43,79130 $49,183 $44,265 $0 $44,26531 $49,575 $44,617 $0 $44,61732 $49,830 $44,847 $0 $44,84733 $49,947 $44,953 $0 $44,95334 $49,927 $44,934 $0 $44,93435 $49,769 $44,792 $0 $44,79236 $49,476 $44,528 $0 $44,5280 $0 $0 $0 $00 $0 $0 $0 $00 $0 $0 $0 $0
NPV $482,986 $38,292 $444,695IRR 37.2%B/C ratio 12.6Payback (years ) 4.2
Column 3 shows the cost of the single year’s education. Finally, Column 4 looks at the educational investment from a cash flow perspective, subtracting annual costs from the annual benefits.
Does attending LCC make economic sense for the students? The answer is a resounding yes. The future stream of benefits (higher earnings) accruing to the students has an NPV of $444,695 (Table 3.6)—a positive NPV (greater than zero) indicates that the investments made are strongly feasible. The B/C ratio of 12.6 is strongly positive since the ratio is well above 1. The RR of 37.2% is also well above the long-term rates of return obtainable in the stock

Chapter 3: Private, Public, and Regional Economic Benefits
The Socioeconomic Benefits of Laredo Community College
37
or bond markets, and certainly above the 4.0%discount rate used in the analysis. In the long run, therefore, the average LCC student will be substantially better off attending the college. The payback period for a student (tuition plus the earnings foregone) is 4.2 years—the higher earnings received beyond that period are pure economic rent—or a persistent earnings flow over and beyond the initial investments.
The Broad Taxpayer Perspective
Table 3.7 assesses one year’s operation of LCC from the broad taxpayer perspective. The taxpayers must weigh requests for LCC funding against the myriad other public needs. As such, they need information to better allocate increasingly scarce resources between alternative and competing ends. Column 1 shows the stream of total benefits, including increased regional earnings, and social savings from reduced spending on incarceration, health, welfare and unemployment. Specifics on the estimation of values in column 1 are presented in Volume 2: Detailed Results, Table 19. Column 2 adjusts for the 27% alternative education opportunity assumption (the percent of the student body able to avail themselves of similar education elsewhere absent the Texas community colleges). Column 3 is simply column 1 less column 2. Column 4 shows the single year state and local taxpayer cost, as reflected in state and local tax items in Table 2.1. Finally, Column 5 considers the broad perspective on the taxpayer’s investment in a cash flow sense, subtracting annual costs from annual benefits.
The NPV given this broad perspective is $365 million and the B/C ratio is 19.7. More succinctly, every dollar of tax monies spent on LCC education will generate a total of $19.67 worth of social savings.19
19 A word of caution—the RR approach sometimes generates percentage results that defy the imagination. Technically, the approach requires at least one negative cash flow (tuition plus opportunity cost of time) to offset all subsequent positive flows. A very high percentage return may be technically correct, but perhaps not consistent with conventional understanding of returns expressed as percentages. For purposes of the reports prepared for all colleges in the statewide system, therefore, we express all RR results as: “NA” (particularly for the broad taxpayer perspective where high returns are expected). Only the B/C ratio is reported for the broad taxpayer perspective.

Chapter 3: Private, Public, and Regional Economic Benefits
The Socioeconomic Benefits of Laredo Community College
38
Table 3.7. Taxpayer Perspective: Broad ($ Thousands)1 2 3 4 5
Benefits Total LessAll from Alt. Ed. Net Taxpayer CC Income
Year Benefits Opportunities Benefits Costs Cash Flow1 $48,473 $3,693 $44,780 $20,324 $24,4572 $14,411 $3,872 $10,539 $0 $10,5393 $17,521 $4,708 $12,813 $0 $12,8134 $18,265 $4,908 $13,357 $0 $13,3575 $19,037 $5,115 $13,922 $0 $13,9226 $19,834 $5,330 $14,505 $0 $14,5057 $20,654 $5,550 $15,104 $0 $15,1048 $21,492 $5,775 $15,717 $0 $15,7179 $22,343 $6,004 $16,340 $0 $16,340
10 $23,204 $6,235 $16,969 $0 $16,96911 $24,068 $6,467 $17,601 $0 $17,60112 $24,931 $6,699 $18,232 $0 $18,23213 $25,787 $6,929 $18,858 $0 $18,85814 $26,632 $7,156 $19,476 $0 $19,47615 $27,458 $7,378 $20,080 $0 $20,08016 $28,260 $7,593 $20,666 $0 $20,66617 $29,033 $7,801 $21,232 $0 $21,23218 $29,770 $7,999 $21,771 $0 $21,77119 $30,467 $8,187 $22,281 $0 $22,28120 $31,118 $8,361 $22,757 $0 $22,75721 $31,718 $8,523 $23,196 $0 $23,19622 $32,263 $8,669 $23,594 $0 $23,59423 $32,748 $8,799 $23,948 $0 $23,94824 $33,169 $8,912 $24,256 $0 $24,25625 $33,523 $9,008 $24,515 $0 $24,51526 $33,807 $9,084 $24,723 $0 $24,72327 $34,019 $9,141 $24,878 $0 $24,87828 $34,158 $9,178 $24,980 $0 $24,98029 $34,221 $9,195 $25,026 $0 $25,02630 $34,210 $9,192 $25,018 $0 $25,01831 $34,123 $9,169 $24,954 $0 $24,95432 $33,963 $9,126 $24,837 $0 $24,83733 $33,729 $9,063 $24,666 $0 $24,66634 $33,424 $8,981 $24,443 $0 $24,44335 $33,051 $8,881 $24,170 $0 $24,17036 $32,612 $8,763 $23,849 $0 $23,8490 $0 $0 $0 $0 $00 $0 $0 $0 $0 $00 $0 $0 $0 $0 $0
NPV $384,348 $19,542 $364,806IRR NAB/C ratio 19.7Payback (years) NA
The Narrow Taxpayer Perspective
Table 3.8 provides an investment analysis of LCC from the narrow taxpayer perspective. Recall from Chapter 2 that the narrow perspective considers only moneys that actually appear on the books of state and local governments: revenue items such as tax receipts, and expenditure items such as road, bridge and street maintenance, police, public libraries and hospitals, jails and prisons, welfare payments, and so on.
Table 3.8, column 1 shows additions to state and local government revenues stemming from the operation of LCC during the single analysis year. The

Chapter 3: Private, Public, and Regional Economic Benefits
The Socioeconomic Benefits of Laredo Community College
39
values in column 1 are computed by applying average state and local government tax rates to the net increase in regional income attributed to LCC.20 Also included in column 1 are reductions (entered as negatives) in state and local government expenditures on crime, welfare, unemployment and health. Projected dollar amounts in column 1 are thus the sum of additional taxes collected, plus associated tax dollars saved as a result of the education provided by LCC during the single analysis year. As in Table 3.7, column 2 reflects the adjustment attributable to the alternative education variable. Column 3 is simply column 1 less column 2.
Column 4 shows the state and local government expenditure in support of LCC for the analysis year, a value obtained directly from Table 2.1. Finally, column 5 subtracts state and local government cost (column 4) from the net benefits (column 3), thereby providing the temporal cash flow needed for the investment analysis. As shown at the bottom of the table, LCC provides state and local government with an annual return of $56.0 million expressed as a net present value on its one year investment. Alternatively, the one year investment generates a 25.7% RR and a B/C ratio of 3.9, both indicating that the investment is attractive. The payback period is 5.1 years.
The returns shown in Table 3.8 would be attractive even in the private sector, and they are very attractive in the public sector. Recall that the public sector generally undertakes those activities the private sector finds unprofitable, i.e., investments that generate book revenues insufficient to cover book costs, thus requiring taxpayer subsidy. For example, state governments fund the operation and maintenance of state parks at a substantial loss, collecting revenues in the form of camping and entrance fees that cover only a fraction of costs. Taxpayers are willing to subsidize parks because they perceive off-budget benefits, e.g., access to the outdoors, local development effects, environmental protection, and so on, that justify the budgetary losses. Note that this broader collection of off-budget benefits would normally be captured in the broad taxpayer perspective.
20 Increased regional income includes a portion of direct student earnings, salaries and wages at the college during the single analysis year, and an additional increment aimed at a collection of backward and forward multiplier effects.

Chapter 3: Private, Public, and Regional Economic Benefits
The Socioeconomic Benefits of Laredo Community College
40
Investments in public education are usually viewed in the same way as investments in parks and other publicly subsidized activities, i.e., activities that generate losses from a narrow investment perspective but are justified by net benefits from a broad investment perspective. As shown in Table 3.8, however, LCC is a notable exception to this general net-subsidy rule. The narrow perspective rate of return is strongly positive, and thereby indicates that the taxpayers’ investments in the college generate increased public revenues, and reduced expenditures, that actually exceed the subsidy by taxpayers. The practical effect of this is the following: If the investments made in LCC were reduced, taxes would actually have to be raised in order for state and local governments to continue their support of other activities at current levels. The taxpayer investments of 71% of the LCC budget community colleges in Table 2.1, in effect, subsidize other sectors of the economy that also receive taxpayer support. The simple bottom line from the narrow taxpayer perspective is that benefits accruing to the taxpayers far outweigh the relatively low investments they make in LCC.
With and Without Social Benefits
Earlier in Chapter 2, the social benefits attributable to CC-education (reduced crime, welfare and unemployment, and improved health) were defined as external benefits, incidental to the operations of the college. Colleges do not directly aim at creating these benefits. Some would question the legitimacy of including these benefits in the calculation of the rates of return to higher education, they would argue only the direct benefits—the higher earnings—should be counted. Tables 3.7 and 3.8 are both inclusive of the social benefits and are reported here as attributable to the college. Recognizing the other point of view, Table 3.9 shows the rates of return for both the broad and narrow persepctives exclusive of the social benefits. As indicated, the returns are still well above the threshold values (a B/C ratio greater than 1) confirming that the taxpayers receive great value from investing in LCC.

Chapter 3: Private, Public, and Regional Economic Benefits
The Socioeconomic Benefits of Laredo Community College
41
Table 3.8. Taxpayer Perspective: Narrow ($ Thousands)1 2 3 4 5
Total Benefits Net TotalTaxpayer from Alt. Ed. Taxpayer Taxpayer Net Cash
Year Benefits Opportunities Benefits Costs Flow1 $8,473 $280 $8,193 $20,324 ($12,131)2 $3,599 $967 $2,632 $0 $2,6323 $4,035 $1,084 $2,951 $0 $2,9514 $4,134 $1,111 $3,023 $0 $3,0235 $4,236 $1,138 $3,098 $0 $3,0986 $4,342 $1,167 $3,176 $0 $3,1767 $4,452 $1,196 $3,256 $0 $3,2568 $4,564 $1,226 $3,338 $0 $3,3389 $4,678 $1,257 $3,421 $0 $3,42110 $4,794 $1,288 $3,506 $0 $3,50611 $4,910 $1,319 $3,590 $0 $3,59012 $5,025 $1,350 $3,675 $0 $3,67513 $5,140 $1,381 $3,759 $0 $3,75914 $5,254 $1,412 $3,842 $0 $3,84215 $5,364 $1,441 $3,923 $0 $3,92316 $5,472 $1,470 $4,001 $0 $4,00117 $5,575 $1,498 $4,077 $0 $4,07718 $5,673 $1,524 $4,149 $0 $4,14919 $5,765 $1,549 $4,216 $0 $4,21620 $5,851 $1,572 $4,279 $0 $4,27921 $5,930 $1,593 $4,336 $0 $4,33622 $6,000 $1,612 $4,388 $0 $4,38823 $6,062 $1,629 $4,433 $0 $4,43324 $6,116 $1,643 $4,472 $0 $4,47225 $6,159 $1,655 $4,504 $0 $4,50426 $6,193 $1,664 $4,529 $0 $4,52927 $6,216 $1,670 $4,546 $0 $4,54628 $6,229 $1,674 $4,555 $0 $4,55529 $6,231 $1,674 $4,557 $0 $4,55730 $6,223 $1,672 $4,551 $0 $4,55131 $6,204 $1,667 $4,537 $0 $4,53732 $6,174 $1,659 $4,515 $0 $4,51533 $6,134 $1,648 $4,486 $0 $4,48634 $6,083 $1,635 $4,449 $0 $4,44935 $6,023 $1,619 $4,405 $0 $4,40536 $5,954 $1,600 $4,354 $0 $4,3540 $0 $0 $0 $0 $00 $0 $0 $0 $0 $00 $0 $0 $0 $0 $0
NPV $75,565 $19,542 $56,023IRR 25.7%B/C ratio 3.9Payback (years) 5.1
Table 3.9. Taxpayer Perspective ($ Thousands)
Included Excluded Included ExcludedNPV $364,806 $251,688 $56,023 $19,210IRR NA NA 25.7% 10.0%B/C ratio 19.7 13.9 3.9 2.0Payback (years ) NA NA 5.1 12.6
Narrow PerspectiveW ith Social SavingsW ith Social Savings
Broad Perspective
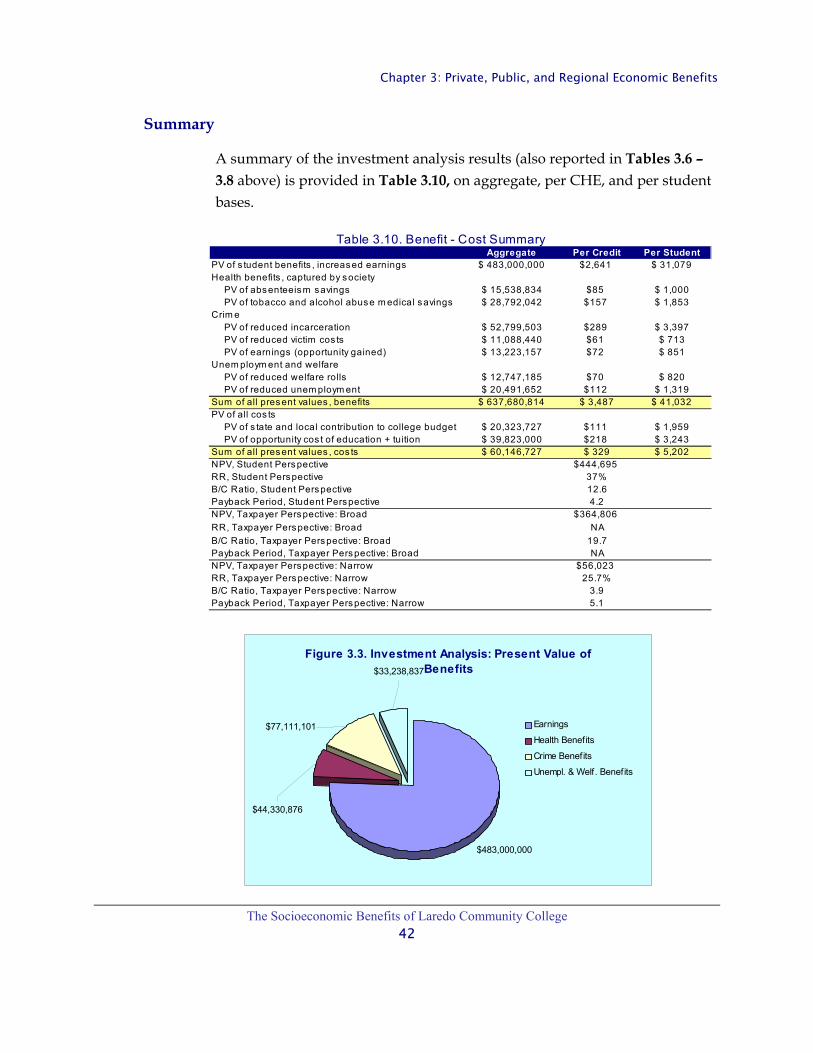
Chapter 3: Private, Public, and Regional Economic Benefits
The Socioeconomic Benefits of Laredo Community College
42
Figure 3.3. Investment Analysis: Present Value of Benefits
$483,000,000
$77,111,101
$44,330,876
$33,238,837
Earnings
Health Benefits
Crime Benefits
Unempl. & Welf. Benefits
Summary
A summary of the investment analysis results (also reported in Tables 3.6 – 3.8 above) is provided in Table 3.10, on aggregate, per CHE, and per student bases.
Table 3.10. Benefit - Cost Summary Aggregate Per Credit Per Student
PV of s tudent benefits , increased earnings $ 483,000,000 $2,641 $ 31,079Health benefits , captured by society PV of absenteeism savings $ 15,538,834 $85 $ 1,000 PV of tobacco and alcohol abuse m edical savings $ 28,792,042 $157 $ 1,853Crim e PV of reduced incarceration $ 52,799,503 $289 $ 3,397 PV of reduced victim cos ts $ 11,088,440 $61 $ 713 PV of earnings (opportunity gained) $ 13,223,157 $72 $ 851Unem ploym ent and welfare PV of reduced welfare rolls $ 12,747,185 $70 $ 820 PV of reduced unem ploym ent $ 20,491,652 $112 $ 1,319Sum of all present values , benefits $ 637,680,814 $ 3,487 $ 41,032PV of all cos ts PV of s tate and local contribution to college budget $ 20,323,727 $111 $ 1,959 PV of opportunity cos t of education + tuition $ 39,823,000 $218 $ 3,243Sum of all present values , cos ts $ 60,146,727 $ 329 $ 5,202NPV, Student Perspective $444,695RR, Student Perspective 37%B/C Ratio, Student Perspective 12.6Payback Period, Student Perspective 4.2NPV, Taxpayer Perspective: Broad $364,806RR, Taxpayer Perspective: Broad NAB/C Ratio, Taxpayer Perspective: Broad 19.7Payback Period, Taxpayer Perspective: Broad NANPV, Taxpayer Perspective: Narrow $56,023RR, Taxpayer Perspective: Narrow 25.7%B/C Ratio, Taxpayer Perspective: Narrow 3.9Payback Period, Taxpayer Perspective: Narrow 5.1
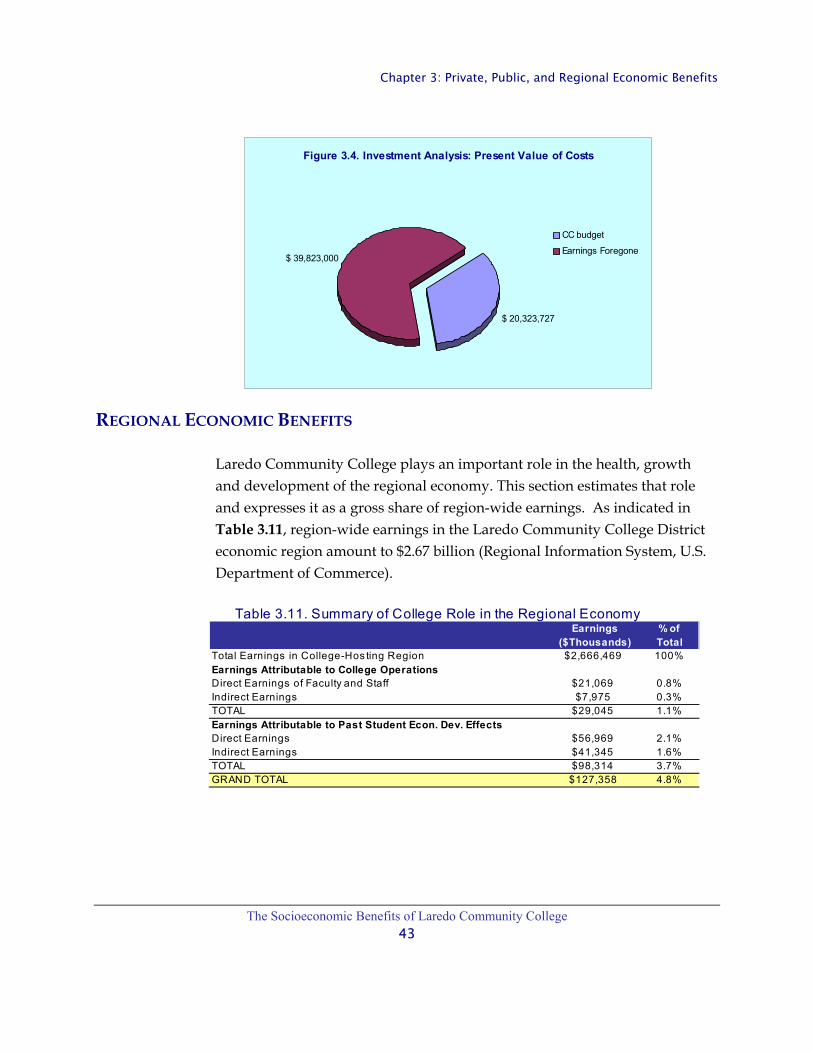
Chapter 3: Private, Public, and Regional Economic Benefits
The Socioeconomic Benefits of Laredo Community College
43
Figure 3.4. Investment Analysis: Present Value of Costs
$ 20,323,727
$ 39,823,000
CC budget
Earnings Foregone
Table 3.11. Summary of College Role in the Regional EconomyEarnings % of
($Thousands) TotalTotal Earnings in College-Hos ting Region $2,666,469 100%Earnings Attributable to College OperationsDirect Earnings of Faculty and Staff $21,069 0.8%Indirect Earnings $7,975 0.3%TOTAL $29,045 1.1%Earnings Attributable to Past Student Econ. Dev. EffectsDirect Earnings $56,969 2.1%Indirect Earnings $41,345 1.6%TOTAL $98,314 3.7%GRAND TOTAL $127,358 4.8%
REGIONAL ECONOMIC BENEFITS
Laredo Community College plays an important role in the health, growth and development of the regional economy. This section estimates that role and expresses it as a gross share of region-wide earnings. As indicated in Table 3.11, region-wide earnings in the Laredo Community College District economic region amount to $2.67 billion (Regional Information System, U.S. Department of Commerce).

Chapter 3: Private, Public, and Regional Economic Benefits
The Socioeconomic Benefits of Laredo Community College
44
Figure 3.5. College Role in Regional Economy, % of All Earnings Explained by College Operations
2.14%
1.55%0.30%
0.79%
College Operations Direct
College Operations Indirect
Past Student Direct
Past Student Indirect
LCC Operations
As shown in Table 3.11, the direct earnings of faculty and staff are equal to $21.1 million per year, and thus account for 0.8% of region-wide earnings. Multiplier effects, from the spending of faculty and staff salaries and from LCC’s purchase of local goods and services, account for another $8.0 million, or 0.3% of region-wide earnings. Altogether, LCC operations directly or indirectly account for $29.0 million per year, or 1.1% of region-wide earnings.
Past Student Economic Development Effects
Past students provide skills that attract new industry and make existing industry more competitive and productive. Accounting for retirement, out-migration and death, we estimate that the current Laredo Community College workforce embodies 2.5 million CHEs of past instruction (see Table 2.12). As shown in Table 3.11, these directly account for $57.0 million, or 2.1% of region-wide earnings.
Associated with the increased earnings of past LCC students is a collection of demand-induced and agglomeration-induced indirect effects. As shown in Table 3.11, these indirect effects account for $41.3 million, or 1.6% of region-wide earnings.

Chapter 3: Private, Public, and Regional Economic Benefits
The Socioeconomic Benefits of Laredo Community College
45
Total Regional Economic Benefits
Finally, the overall role of LCC in the regional economy is equal to the sum of the direct and indirect effects. Accordingly, the college accounts for $127.4 million, or 4.8% of region-wide earnings.

Chapter 4: Sensitivity Analysis of Key Variables
The Socioeconomic Benefits of Laredo Community College
46
Chapter 4 SENSITIVITY ANALYSIS OF KEY VARIABLES
INTRODUCTION
We conclude this study with a base case sensitivity analysis of some key variables on both the investment and regional economic development sides. The purpose of the sensitivity analysis is to set our approach apart from “advocacy” education impact analyses. Many of these may lack uniformity and use assumptions that will not stand up to rigorous peer scrutiny, and they often generate results that grossly overstate benefits. The approach taken here is to account for all relevant variables on both the benefit and cost sides as reflected in the conservatively estimated base case assumptions laid out in Chapter 2.
INVESTMENT ANALYSIS: THE STUDENT PERSPECTIVE
The variables tested relate to the earnings foregone by the students—the opportunity cost of time. They include: 1) the % of the students employed, and 2) of those employed, the earnings received relative to the full earnings they would have received if not attending LCC. These affect the investment analysis manifested in the results (NPV, RR, B/C, and payback period).
Percent of Students Employed
The students incur substantial expense by attending LCC because of time spent not gainfully employed. Some of that cost is recaptured if the student remains partially (or fully) employed while attending LCC. It is estimated that 66% of the current student body is employed. We test this variable in the sensitivity analysis by changing this assumption to 100%. The revised assumption would mean that all of the students are employed, thus the average opportunity cost of time would be reduced accordingly.

Chapter 4: Sensitivity Analysis of Key Variables
The Socioeconomic Benefits of Laredo Community College
47
Percent of Earnings Relative to Full Earnings
The second opportunity cost variable is more difficult to estimate. For LCC it is estimated that for the students working while attending classes, their earnings amounted to only 72%, on average, of the earnings they would have statistically received if not attending the CC. This suggests that many of the students hold part-time jobs earning minimum wage (or less than their “statistical” wages). The model captures these differences and counts them as a part of the opportunity cost of time. As above, we test this variable in the sensitivity analysis by changing the assumption to 100%. This would mean that the students are fully employed, and the average opportunity cost of time would be reduced accordingly.
RESULTS
The changed results are summarized in Table 4.1. Here, the base case assumptions are reflected in the two shaded rows for the variables tested—66% for the portion of students employed, and 72% for their earnings relative to the statistical averages, taken from Table 2.2. These (base case) assumptions are held constant in the shaded rows for the student perspective. The sensitivity analysis results are shown in the non-shaded rows—the extent to which the investment analysis results would change if the two base case variables were increased to 100%, first separately, and second, together. Changing both assumptions to 100% (all students fully employed) would automatically increase the benefits because the opportunity cost of time would reduce to zero.
1. Increasing the students employed assumption from 66% to 100% first (holding all of the other assumptions constant), the RR, B/C, and payback period results would improve to 78.2%, 26.1, and 2.5 years, respectively, relative to the base case results. The improved results are attributable to a lower opportunity cost of time—all students would be employed in this case.
2. Increasing the earnings relative to the statistical averages from 72% to 100% second (holding the second employment assumption constant at the base case level), the RR, B/C, and payback period results would improve to

Chapter 4: Sensitivity Analysis of Key Variables
The Socioeconomic Benefits of Laredo Community College
48
Table 4.1 Sensitivity Analysis of Student PerspectiveVariables Assumptions RR B/C Payback
1. Percent 66% 37.2% 12.6 4.2 Em ployed 100% 78.2% 26.1 2.52. Percent of 72% 37.2% 12.6 4.2 Earnings 100% 59.3% 20.4 3.01 = 100%, 2 = 100% >100% -130.7 1.8
59.3%, 20.4, and 3.0 years, respectively, relative to the base case results—a strong improvement over the base case results, again attributable to a lower opportunity cost of time.
3. Finally, increasing both of the above assumptions to 100% simultaneously, the RR, B/C, and payback period results would improve yet further to >100%, -130.7, and 1.8 years, respectively, relative to the base case results. This scenario assumes that all students are fully employed and earning full salaries (equal to the statistical averages) while attending classes. These results are unrealistic, albeit not uncommon for advocacy analyses.
A final note to this student perspective sensitivity analysis—we strongly emphasize that the results, given the assumptions, are very attractive—the results are all well above their threshold levels and the payback periods are short. As clearly demonstrated here, advocacy results appear much more attractive, although they would overstate the benefits. The results presented in Chapter 3 are realistic, indicating that investments in LCC will generate excellent returns, well above the long-term average percent rates of return of roughly 7% in the stock and bond markets.
REGIONAL ECONOMIC DEVELOPMENT
We estimated the regional economic impacts of LCC in Chapter 3, Table 3.11 based on college operations and capital spending, and the increased productivity effects of past LCC students in the regional workforce. The impacts were expressed in terms of regional earnings, i.e., area wages, salaries and proprietors’ income, published by the U.S. Department of

Chapter 4: Sensitivity Analysis of Key Variables
The Socioeconomic Benefits of Laredo Community College
49
Commerce. 21 In the present section we address two issues that occasionally arise in college economic impact studies: 1) the addition of student spending effects to impact estimates, and 2) the expression of economic impacts in terms of regional gross sales rather than earnings.
The Economic Impact of Student Spending
Students spend money while attending college: they buy books and supplies, rent rooms, purchase food, pay for transportation, attend sports events and go to movies, and so on. These expenditures create jobs and incomes for local businesses, which, as argued by some, should be counted among the regional economic impacts attributable to the college.
In Table 3.11, however, we exclude student spending because most of the students already reside in the college region. Student expenditures, therefore, do not represent new monies in the region, but rather a redirection of monies that would have been spent anyway. The other side of the argument is that, even though the college-related spending of a resident student does not constitute new money, absent the college, some students will leave the region to obtain an education elsewhere. Thus, the region loses the spending and related jobs and incomes. Both cases have merit, although we believe the former has more than the latter. This is because only a few students will actually be able to avail themselves of education elsewhere (see Table 2.9). Our approach, therefore, is to exclude student spending, recognizing at the same time, that the regional impact estimates may err on the conservative side.
In Table 4.2 we show the potential magnitude of student spending effects in the LCC region economy. The table parallels Table 3.11 in the previous chapter, but adds the section “Earnings Attributable to Student Spending,”22
21 U.S. Department of Commerce, Regional Economic Information System (REIS) data includes earnings estimates for counties and states, and is published annually in the Department’s Survey of Current Business. It is also readily available in electronic form. 22 We estimated student spending effects by borrowing average college student information from a study conducted for higher education economic impacts in Illinois (University of Illinois, 2000). Student spending by broad expenditure category was bridged to the sectors of the LCC regional economy input-

Chapter 4: Sensitivity Analysis of Key Variables
The Socioeconomic Benefits of Laredo Community College
50
Table 4.2. Summary of College Role in the Regional EconomyEarnings % of
($ Thousands) TotalTotal Earnings in College-Hos ting Region $2,666,469 100%Earnings Attributable to Student SpendingDirect Earnings $32,073 1.2%Indirect Earnings $18,512 0.7%TOTAL $50,585 1.9%Earnings Attributable to College OperationsDirect Earnings of Faculty and Staff $21,069 0.8%Indirect Earnings $7,975 0.3%TOTAL $29,045 1.1%Earnings Attributable to Past Student Econ. Dev. EffectsDirect Earnings $56,969 2.1%Indirect Earnings $41,345 1.6%TOTAL $98,314 3.7%GRAND TOTAL $177,944 6.7%
creating some $32.1 million in additional earnings for the local businesses patronized by students (the direct effects), plus another $18.5 million in earnings stemming from related multiplier effects (indirect effects). Adding the student spending to the mix increases the LCC total “explanatory power” of the regional earnings from 4.8% in Table 3.11 to 6.7% in Table 4.2.
Economic Impacts Reported as Gross Sales
Advocates sometimes favor gross sales over earnings as an impact measure, because sales are always larger than the earnings. But using gross sales as an impact measure has notable drawbacks. An immediate drawback is that, unlike earnings, there is generally no published total against which a sales impact can be measured. More importantly though, the most troublesome aspect of gross sales impact measures is captured in the following example:
Two visitors spend $50,000 each in the economic region. One visits a local auto dealer and purchases a new luxury automobile. The other enters the county hospital for a medical procedure. In terms of direct economic impact, both have spent $50,000. However, the expenditures will likely have very different meanings to the local economy. Of the $50,000 spent for the luxury automobile, perhaps $9,000 remains in the county as salesperson commissions and auto dealer income (part of the county’s overall earnings), while the other $41,000
output model. Adjustments were made consistent with the model’s regional accounts to allow for spending leakages.

Chapter 4: Sensitivity Analysis of Key Variables
The Socioeconomic Benefits of Laredo Community College
51
leaves the area for Detroit or somewhere else as wholesale payment for the new automobile. Contrast this to the hospital expenditure. Here perhaps $40,000 appears as physician, nurse, and assorted hospital employee wages (part of the county’s overall earnings), while only $10,000 leaves the area, to pay for hospital supplies, or to help amortize building and equipment loans. In terms of sales, both have the same impact, while in terms of earnings, the former has less than one-fourth the impact of the latter.
Table 4.3 expresses the LCC impacts in terms of gross sales rather than earnings. Note that gross sales measures are everywhere larger than earnings. The economy-wide measure of total gross sales estimated by the economic model is $6.4 billion.23 Direct local spending by students reflects their total spending, reduced by the estimated portion that leaks out-of-region to purchase goods produced elsewhere.24 In the usual fashion, indirect effects reflect the action of local economic multiplier effects, also estimated by the economic model.
Direct local expenditures include all spending by the college for consumer items and faculty and staff salaries. Both items are reduced to reflect purchases from outside the region. All told, the operation of LCC is estimated to explain some $337.6 million in regional gross sales, a number substantially larger than the $177.9 million explained by the college in regional gross earnings shown in Table 4.2.
23 Simply stated, economy-wide gross sales are obtained by multiplying sector-specific regional earnings by a national estimate of sales-to-earnings. 24 Students purchase gasoline for their cars, for example, and while the trade margin stays in the area, in most cases the producer price of gasoline itself will leak out to the oil producing region.

Chapter 4: Sensitivity Analysis of Key Variables
The Socioeconomic Benefits of Laredo Community College
52
Table 4.3. Summary of College Role in the Regional EconomyGross Sales % of
(1,000) TotalTotal Gross Sales in College-Hosting Region $6,364,443 100%Gross Sales Attributable to Student SpendingDirect Local Spending by Students $57,109 0.9%Indirect Spending Effect $19,660 0.3%TOTAL $76,769 1.2%Gross Sales Attributable to College OperationsDirect Local Expenditures of CC $14,987 0.2%Indirect Spending Effect $7,741 0.1%TOTAL $22,727 0.4%Gross Sales Attributable to Past Student Econ. Dev. EffectsDirect Gross Sales $131,871 2.1%Indirect Gross Sales $106,185 1.7%TOTAL $238,056 3.7%GRAND TOTAL $337,553 5.3%
While the gross sales impacts shown in Table 4.3 are not incorrect, we prefer to report college impacts in terms of earnings in Table 3.11 rather than gross sales because they reflect the economic realities in the local community much more accurately than the sales numbers. Advocacy studies, on the other hand, will often opt to express the results in terms of sales because the numbers are much more impressive. Such results, however, will likely not stand up to peer scrutiny in the economics profession.

References
The Socioeconomic Benefits of Laredo Community College
53
REFERENCES Becker, Gary S., 1964. Human Capital: A Theoretical Analysis With Special
Reference to Education. New York: Columbia University Press for NBER.
Bils, M. and P.J. Klenow, 2000. Does Schooling Cause Growth? American Economic Review, 90(5), 1160-1183.
Bonczar, Thomas P. and Alan J. Beck, 1997. Lifetime Likelihood of Going to State or Federal Prison. US Department of Justice, Office of Justice Programs, March 1997.
Borts, G. H., and J. L. Stein, 1964. Economic Growth in a Free Market. NY: Columbia University Press.
Cato Institute; Policy Analysis 240, 1995. Authors: Michael Tanner, Stephen Moore, and David Hartman. The Work Versus Welfare Tradeoff, An Analysis of Total Welfare Benefits by State.
Centers for Disease Control and Prevention; National Center for Health Statistics, Health, United States, 2001, Table 61.
The Center for Health Statistics, Health Promotion and Disease Questionnaire of the 1990 National Health Interview Survey.
Christaller, 1966; Central Places in Southern Germany (C.W. Baskins, trans.). Englewood Cliffs, N.J., Prentice Hall.
Christophersen, Kjell A., and H. Robison, 2000. The Socioeconomic Benefits of Community Colleges, Illustrated with Case Studies of Everett Community College and Walla Walla Community College in Washington State. Volume 1: Summary Report. EMSI, Consulting Economists.
Drake, R. L. 1976. A Shortcut to Estimates of Regional Input – Output Multipliers: Methodology and Evaluation. International Regional Science Review, Vol. 1, No. 2, Fall 1976.
Grubb, Norton, CCRC Brief No. 2, ICCN 15-26-2049, June 1999.

References
The Socioeconomic Benefits of Laredo Community College
54
Heritage Foundation, Means-Tested Welfare Spending: Past and Future Growth, Testimony by Robert Rector, (3/07/01), http://www.heritage.org/library/testimony/test080101.html.
Losch, 1954. The Economics of Location (W.H. Woglom and W.F. Stolper, trans.). New Haven: Yale University Press.
Miller, R.E. and P. Blair. 1985. Input-Output Analysis: Foundations and Extensions. Englwood Cliffs, NJ: Prentice Hall.
Mincer, Jacob, 1958. Investment in Human Capital and Personal Income Distribution”, Journal of Political Economy: 281-302.
Molitor, Chris and D. Leigh. March 2001. Estimating the Returns to Schooling: Calculating the Difference Between Correlation and Causation. Discussion Paper prepared for CCbenefits, Inc.
National Center for Education Statistics, The Digest of Education Statistics: 2000, 1990 K Street, NW, Washington, DC 20006, USA, Phone: (202) 502-7300, http://nces.ed.gov/pubs2001/digest/list_figures.html.
National Center for Education Statistics, Literacy Behind Walls, Prison Literacy Programs, DIGEST No. 159 Literacy in Corrections, Correctional Educational Association, http://www.nifl.gov/newworld/correct.htm.
National Institute on Drug Abuse and the National Institute on Alcohol Abuse and Alcoholism, http://www.nida.nih.gov/EconomicCosts/Index.html
Parr, J.B. 1999. “Regional Economic Development: An Export-Stages Framework.” Land Economics, 77(1): 94-114.
Robison, M.H. 1997. “Community Input-Output Models for Rural Area Analysis: with an Example from Central Idaho,” Annals of Regional Science, 31(3), 325-351.
Stevens, B.H., G.I. Treyz, D.J. Ehrlich, and J.R. Bower, 1983. "A New Technique for the Construction of Non-Survey Regional Input-Output Models," International Regional Science Review, 8(3), 271-186.

References
The Socioeconomic Benefits of Laredo Community College
55
University of Illinois, Institute of Government and Public Affairs, 2000. Illinois Higher Education: Building the Economy, Shaping Society. Illinois Board of Hugher Education.
US Census Bureau, Current Population Survey, 2000.
US Dept. of Commerce, Regional Economic Information Systems, Zip Code Business Patterns, 1998.
US Dept. of Commerce, US Bureau of the Census, 1998. Money Income of the United States 1998, Current Population Reports, Household and Economic Statistics Division.
U.S. Department Of Health And Human Services,Centers for Disease Control and Prevention, National Center for Health Statistics, Division of Data Services, Hyattsville, MD, 20782-2003, (301) 458-4636, http://www.cdc.gov/nchs/.
US Dept. of Commerce, County Business Patterns, annual.
US Dept. of Commerce, Regional Economic Information System, county data on CD ROM, annual.
US Department of Commerce Statistical Abstract, 1997-1999.
Willis, Robert J., 1986, in Handbook of Labor Economics, Vol. 1 , edited by Kenneth J. Arrow and Michael D. Intriligator. North Holland: Amsterdam
The National Clearinghouse for Alcohol and Drug Information 11426 Rockville Pike, Suite 200, Rockville, Maryland, http://www.health.org/govstudy/bkd265/Index.htm
National Institute on Alcohol Abuse and Alcoholism (NIAAA) 6000 Executive Boulevard - Willco Building Bethesda, Maryland 20892-7003, http://www.niaaa.nih.gov/
Bureau of Justice Statistics, Table #. 05 Total direct and intergovernmental expenditure, by activity and level of government, fiscal years 1980-97, Criminal Justice Expenditure and Employment Extracts Program, 12/14/00.

References
The Socioeconomic Benefits of Laredo Community College
56
US Department of Labor, Bureau of Labor Statistics, Office of Employment and Unemployment, 2000.
US Department of Labor, The Public Purpose: U.S. Employee Absences by Industry, 2000.
U.S. Department of Treasury, The Economic Costs of Smoking in the United States and the Benefits of Comprehensive Tobacco Legislation http://www.ustreas.gov/press/releases/docs/tobacco.pdf.
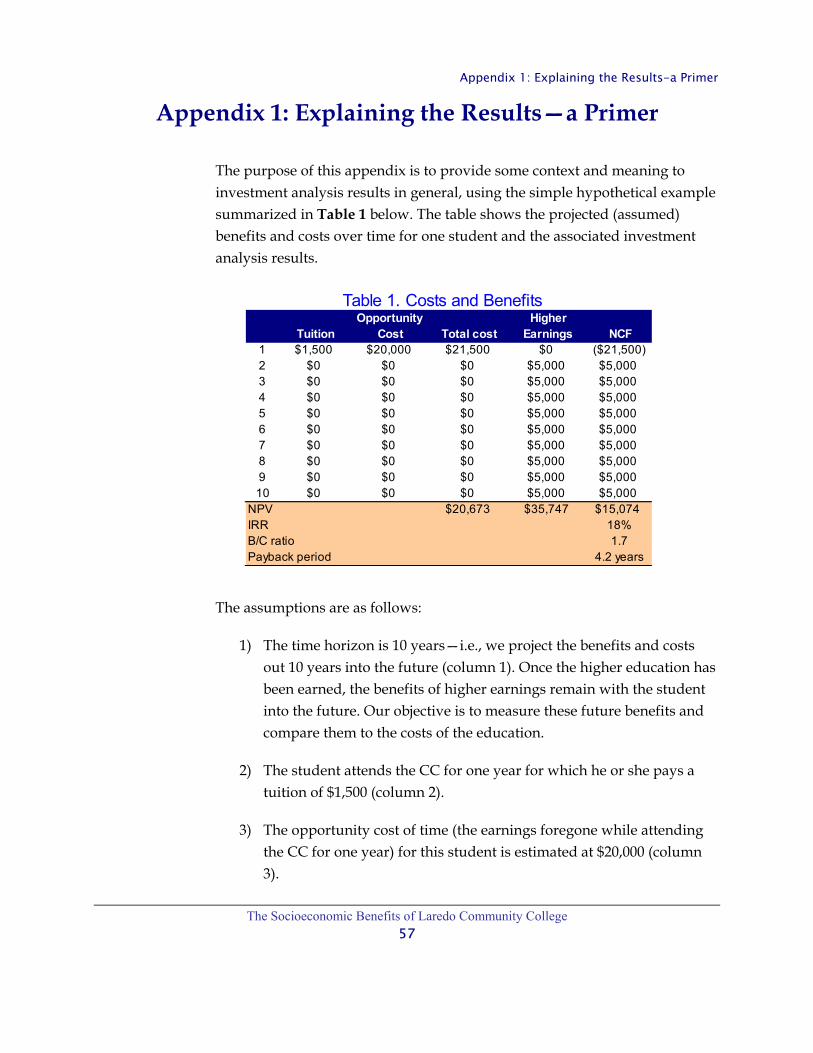
Appendix 1: Explaining the Results-a Primer
The Socioeconomic Benefits of Laredo Community College
57
Appendix 1: Explaining the Results—a Primer
The purpose of this appendix is to provide some context and meaning to investment analysis results in general, using the simple hypothetical example summarized in Table 1 below. The table shows the projected (assumed) benefits and costs over time for one student and the associated investment analysis results.
The assumptions are as follows:
1) The time horizon is 10 years—i.e., we project the benefits and costs out 10 years into the future (column 1). Once the higher education has been earned, the benefits of higher earnings remain with the student into the future. Our objective is to measure these future benefits and compare them to the costs of the education.
2) The student attends the CC for one year for which he or she pays a tuition of $1,500 (column 2).
3) The opportunity cost of time (the earnings foregone while attending the CC for one year) for this student is estimated at $20,000 (column 3).
Table 1. Costs and BenefitsOpportunity Higher
Tuition Cost Total cost Earnings NCF1 $1,500 $20,000 $21,500 $0 ($21,500)2 $0 $0 $0 $5,000 $5,0003 $0 $0 $0 $5,000 $5,0004 $0 $0 $0 $5,000 $5,0005 $0 $0 $0 $5,000 $5,0006 $0 $0 $0 $5,000 $5,0007 $0 $0 $0 $5,000 $5,0008 $0 $0 $0 $5,000 $5,0009 $0 $0 $0 $5,000 $5,00010 $0 $0 $0 $5,000 $5,000
NPV $20,673 $35,747 $15,074IRR 18%B/C ratio 1.7Payback period 4.2 years

Appendix 1: Explaining the Results-a Primer
The Socioeconomic Benefits of Laredo Community College
58
4) Together, these two cost elements ($21,500 total) represent the out-of-pocket investment made by the student (column 4).
5) In return, we assume that the student, having completed the one year of study, will earn $5,000 more per year than without the education (column 5).
6) Finally, the net cash flow column (NCF) in column 6 shows higher earnings (column 5) less the total cost (column 4).
7) We assume a “going rate” of interest of 4%, the rate of return from alternative investment schemes, for the use of the $21,500.
Now the “mechanics”—we express the results in standard investment analysis terms: the net present value (NPV), the internal rate of return (IRR—or, as referred to in the main report, simply the rate of return—RR), the benefit/cost ratio (B/C), and the payback period. Each of these is briefly explained below in the context of the cash flow numbers in Table 1.
THE NET PRESENT VALUE (NPV)
“A bird in hand is worth two in the bush.” This simple folk wisdom lies at the heart of any economic analysis of investments lasting more than one year. The student we are tracking in Table 1 has choices: a) to attend the CC, or b) forget about higher education and hold on to the present employment. If he or she decides to enroll, certain economic implications unfold: the tuition must be paid and earnings will cease for one year. In exchange, the student calculates that, with the higher education, his or her income will increase by at least the $5,000 per year as indicated in the table.
The question is simple: will the prospective student be economically better off by choosing to enroll? If we add up the higher earnings of $5,000 per year for the remaining nine years in Table 1, the total will be $45,000. Compared to a total investment of $21,500, this appears to be a very solid investment. The reality, however, is different—the benefits are far lower than $45,000 because future money is worth less than present money. The costs (tuition plus foregone earnings) are felt immediately because they are incurred

Appendix 1: Explaining the Results-a Primer
The Socioeconomic Benefits of Laredo Community College
59
today—in the present. The benefits (higher earnings), on the other hand, occur in the future. They are not yet available. We must discount all future benefits by the going rate of interest (referred to as the discount rate) to be able to express them in present value terms.25 A brief example: at 4%, the present value of $5,000 to be received one year from today is $4,807. If the $5,000 were to be received in year 10, the present value would reduce to $3,377. Or put another way, $4,807 deposited in the bank today earning 4% interest will grow to $5,000 in one year; and $3,377 deposited today would grow to $5,000 in 10 years. An “economically rational” person would, therefore, be equally satisfied receiving $3,377 today or $5,000 10 years from today given the going rate of interest of 4%. The process of discounting—finding the present value of future higher earnings—allows us express values on an equal basis in future or present value terms.
Our goal is to express all future higher earnings in present value terms so that we can compare them to the investments incurred today—the tuition and foregone earnings. As indicated in Table 1, the cumulative present value of the flow of $5,000 worth of higher earnings between years 2 and 10 is $35,747 given the 4% interest rate, far lower than the undiscounted $45,000 discussed above.
The measure we are looking for is the NPV result of $15,074. It is simply the present value of the benefits less the present value of the costs, or $35,747 - $20,673 = $15,074. In other words, the present value of benefits exceeds the present value of costs by as much as $15,074. The criterion for an economically worthwhile investment is that the NPV is equal to or greater than zero. Given this result, it can be concluded that, in this case, and given these assumptions, this particular investment in CC education is very strong.
THE INTERNAL RATE OF RETURN (IRR)
The IRR is another way of measuring the worth of the investment in education using the same cash flows shown in Table 1. In technical terms—
25 Technically, the interest rate is applied to compounding—the process of looking at deposits today and determining how much they will be worth in the future. The same interest rate is called a discount rate when we reverse the process—determining the present value of future earnings.

Appendix 1: Explaining the Results-a Primer
The Socioeconomic Benefits of Laredo Community College
60
the IRR is a measure of the average earning power of the money used over the life of the investment. It is simply the interest rate that makes the NPV equal to zero. In the NPV example above we applied the “going rate” of interest of 4% and computed a positive NPV of $15,074. The question now is: what would the interest rate have to be in order to reduce the NPV to zero? Obviously it would have to be higher—18% in fact, as indicated in Table 1. Or, if we applied 18% to the NPV calculations instead of the 4%, then the NPV would reduce to zero.
What does this mean? The IRR of 18% defines a breakeven solution—the point where the present value of benefits just equals the present value of costs, or where the NPV equals zero. Or, at 18%, the higher incomes of $5,000 per year for the next 9 years will earn back all the investments of $21,500 made plus pay 18% for the use of that money (the $21,500) in the meantime. Is this a good return? Indeed it is—first, if we compare it to the 4% “going rate” of interest we applied to the NPV calculations, 18% is far higher than 4%. We can conclude, therefore, that the investment in this case is solid. Alternatively, we can compare the rate to the long-term 7% rate or so obtained from investments in stocks and bonds. Again, the 18% is far higher, indicating that the investment in CC education is strong relative to the stock market returns (on average).
A word of caution—the IRR approach can sometimes generate “wild” or “unbelievable” results—percentages that defy the imagination. Technically, the approach requires at least one negative cash flow (tuition plus opportunity cost of time) to offset all subsequent positive flows. For example, if the student works full time while attending college, the opportunity cost of time would be much lower—the only out-of-pocket cost would be the $1,500 paid for tuition. In this case, it is still possible to compute the IRR, but it would be a staggering 333% because only a negative $1,500 cash flow will be offsetting 9 subsequent years of $5,000 worth of higher earnings. The 333% return is technically correct, but not consistent with conventional understanding of returns expressed as percentages. For purposes of this report, therefore, we express all results in the main report exceeding 100% simply as: “> than 100%.”

Appendix 1: Explaining the Results-a Primer
The Socioeconomic Benefits of Laredo Community College
61
THE BENEFIT/COST RATIO (B/C)
The B/C ratio is simply the present value of benefits divided by present value of costs, or $35,747 / $21,500 = 1.7 (based on the 4% discount rate). Of course, any change in the discount rate will also change the B/C ratio. If we applied the 18% IRR discussed above, the B/C ratio would reduce to 1.0—or the breakeven solution where benefits just equal the costs. Applying a discount rate higher than the 18 percent would reduce the ratio to less than one and the investment would not be feasible. The 1.7 ratio means that a dollar invested today will return a cumulative $1.70 over the 10-year time period.
THE PAYBACK PERIOD
This is the length of time from the beginning of the investment (consisting of the tuition plus the earnings foregone) before the higher future earnings return the investments made. In Table 1, it will take roughly 4.2 years of $5,000 worth of higher earnings to recapture the student’s investment of $1,500 in tuition and the $20,000 earnings he or she foregoes while attending the CC. The higher earnings occurring beyond the 4.2 years are the returns (the “gravy”) that make the investment in education in this example, economically worthwhile. The payback period is a fairly rough, albeit common, means of choosing between investments. The shorter the payback period, the stronger the investment.

Appendix 2: Methodology for Creating Income Gains by Levels of Education
The Socioeconomic Benefits of Laredo Community College
62
Appendix 2: Methodology for Creating Income Gains by Levels of Education
The US Bureau of the Census reports income in two ways:
1) Mean income by race and Hispanic origin and by sex.
2) Mean income by educational attainment and sex.
The first and second data sets can be found at the following sources:
U.S. Census Bureau and U.S. Department of Commerce. Table P-3: Race and Hispanic Origin of People by Mean Income and Sex: 1947 to 2000, and Table P-18: Educational Attainment--People 25 Years Old and Over by Mean Income and Sex: 1991 to 2000. Also consult:
http://www.census.gov/ftp/pub/hhes/income/histinc/histinctb.html
Further contact information: a) Income Surveys Branch, b) Housing & Household Economic Statistics Division, c) U.S. Census Bureau, and d) U.S. Department of Commerce.
The data needed for this analysis is mean income by educational attainment reported by race/ethnic origin and by sex. A model was developed to translate these two data sets into the data needed for the analysis. This was accomplished in the following way:
1. Mean income by race and sex are calculated as a percent of all races.
2. This percent is then applied to mean income by educational attainment. For example, African-American males make an average income of $28,392 versus $40,293 for all males, or 70% of the average income of all males.

Appendix 2: Methodology for Creating Income Gains by Levels of Education
The Socioeconomic Benefits of Laredo Community College
63
3. This percent (70%) is then applied to the income levels by educational attainment for all males to estimate the income levels by educational attainment for African-American males.
4. To simplify the analysis, all nonwhite males are averaged together as are all nonwhite females. The same process is repeated for white males and white females.
5. The educational levels of attainment are aggregated together in some categories to model the educational system of community colleges. These numbers are then adjusted for inflation to 2001 dollars.
6. The final step is to adjust these income levels by state. The Four Person Median Family Income by State from the Bureau of the Census was used to make state level adjustments. Each state’s median family income is taken as a percentage of the national average. These percentages are then applied to the income levels by educational attainment by race, ethnicity and sex calculated earlier.