Embed Size (px)
Citation preview

The Socio-Cognitive Links between Road Pricing
Acceptability and Changes in Travel-Behavior
Mario Coolsa,b, Kris Brijsa,c, Hans Tormansa, Elke Moonsa,d, DavyJanssensa, Geert Wetsa
aTransportation Research Institute (IMOB), Hasselt University, Wetenschapspark 5, bus6, 3590 Diepenbeek, Belgium
bResearch Foundation Flanders (FWO), Brussels, BelgiumcXIOS University College, Department of Construction Engineering, Agoralaan -
Building H, 3590 Diepenbeek, BelgiumdStatistics Netherlands (CBS), Social and Spatial Statistics Division (SRS-SAH),
Postbus 4481, 6401 CZ Heerlen, the Netherlands
Abstract
The objective of this study is to examine the effect of road pricing onpeople’s tendency to adapt their current travel behavior. To this end, therelationship between changes in activity-travel behavior on the one hand andpublic acceptability and its most important determinants on the other areinvestigated by means of a stated adaptation experiment. Using a two-stagehierarchical model, it was found that behavioral changes themselves are notdependent on the perceived acceptability of road pricing itself, and that onlya small amount of the variability in the behavioral changes were explainedby socio-cognitive factors. The lesson for policy makers is that road pricingcharges must surpass a minimum threshold in order to to entice changes inactivity-travel behavior and that the benefits of road pricing should be clearlycommunicated, taking into account the needs and abilities of different typesof travelers. Secondly, earlier findings concerning the acceptability of pushmeasures were validated, supporting transferability of results. In line withother studies, effectiveness, fairness and personal norm all had a significantdirect impact on perceived acceptability. Finally, the relevance of using latentfactors rather than aggregate indicators was underlined.
Keywords: road pricing, socio-cognitive factors, acceptability,activity-travel behavior, stated adaptation experiment
Preprint submitted to Transportation Research Part A June 1, 2011

1. Introduction1
The previous century is characterized by an extraordinary growth in car2
use that has continued in the current century (Blythe, 2005). Passenger car3
use in the European Union grew by 18% between 1995 and 2004 and was re-4
sponsible for 74% of all passenger transport in 2004 (European Environment5
Agency, 2008). As a result, in today’s society, various car-related problems6
are manifested, including serious environmental, economic and societal reper-7
cussions (Schuitema et al., 2010). It is estimated that urban transport in the8
European Union accounts for 80% of congestion costs, 15% of all greenhouse9
gas emissions and annually 20,000 road fatalities (May et al., 2008). Ris-10
ing concerns over these increasingly intolerable externalities have generated11
particular interest in how transport-planning policies might moderate the12
pressures resulting from growth in personal mobility and support the princi-13
ples of sustainable development (Janssens et al., 2009a).14
Although no standard definition of sustainable transport is available (Beat-15
ley, 1995), most delineations imply that sustainable transport balances envi-16
ronmental, social and economic qualities (Steg and Gifford, 2005). Generally17
speaking, sustainable transport could be seen as the outcome of different pol-18
icy measures that aim at lowering the ecological footprint of activity-travel19
patterns in an economically feasible manner (Wittneben et al., 2009). These20
policy measures are commonly referred to as Travel Demand Management21
(TDM) measures. As indicated by Eriksson et al. (2006, pg. 15), Travel De-22
mand Management measures can be defined as ‘strategies aiming to change23
travel behavior’.24
An important policy measure for governments in modifying activity-travel25
behavior is the introduction of road pricing (Xie and Olszewski, 2011). The26
term road pricing, also referred to as congestion charging and congestion27
pricing, can be defined as any form of charging of the use of roads during28
periods of peak demand (Janssens et al., 2009a). A key issue in making road29
pricing systems operational is building support for the policy measure.30
The objective of this study is to investigate the effect of road pricing on31
people’s tendency to adapt their current travel behavior. In order to reach32
this goal, we will make use of a two-stage hierarchical model (see Figure 1)33
concentrated around the concept of public acceptability. By means of this34
model, three specific research targets will be set. Firstly, we will explore35
the relationship between adapted travel behavior itself on the one hand and36
public acceptability as well as its most important first- (i.e., effectiveness37
2

and fairness) and second-order determinants (i.e., general environmental be-38
liefs and values, problem awareness, personal norm, and willingness to act39
pro-environmentally) on the other. Secondly, we verify whether earlier find-40
ings concerning the acceptability of push measures replicate for road pric-41
ing. In line with previous research (Eriksson et al., 2006, 2008), we expect42
for instance that public acceptability in case of road pricing, besides being43
determined by perceived effectiveness and fairness, is rather a function of44
personal norm than problem awareness. In addition, we expect road pricing45
to be perceived as a rather unfair policy measure. Thirdly, while estimating46
the model, latent constructs measured by means of multiple items will not47
be replaced by the aggregate of their indicators.48
In the next Section, a literature review will be provided discussing the49
concept of public acceptability and the use of two-stage models. Special50
emphasis will be put on the delineation of the socio-cognitive factors. Con-51
sequently, in Section 3 the methodology will be elucidated and the actual52
interpretation of the various socio-cognitive factors will be highlighted. Af-53
terwards, in Sections 4 and 5, the results will be presented and discussed more54
in detail. Finally, Section 6 will recapitulate the most important findings and55
pin-point some worthwhile avenues for policy makers.56
2. Literature Review57
Together with Schade (2003), Eriksson et al. (2006, pg. 16) define public58
acceptability as ‘the degree of positive or negative evaluation of a TDM-59
measure that may be implemented in the future.’ In line with its basic60
definition, public acceptability is traditionally operationalized as a single-61
dimensional concept, captured by means of one (or more) item(s) probing62
for some kind of overall evaluative assessment such as the degree to which63
individuals consider a certain TDM-measure is likeable, acceptable, admissi-64
ble, agreeable or favorable.65
In general, studies on public acceptability of TDM-measures concentrate66
around one main issue which is how to model the concept’s origination. Ac-67
cording to Eriksson et al. (2006, 2008), two basic approaches can be distin-68
guished within the extant literature.69
A first approach is to treat a TDM-measure’s public acceptability ex-70
clusively in function of TDM-measure-specific aspects with the two most71
important ones being perceived effectiveness and fairness. A measure’s per-72
ceived effectiveness stands for the extent to which a person believes it will73
3

PE
PA
PN
WTA
EFF
FAIR
ACC
ADAPT
PE1
PE2
PE3
PE4
PN1 PN2
PA1 PA2 PA3
FAIR
1
FAIR
2
EFF1 EFF2
AW AS AL AV
PE: Pro-environmental orientation
PA: Problem awareness
PN: Personal norm
WTA: Willingness to act
EFF: Effectiveness
FAIR: Fairness
ACC: Acceptability
ADAPT: Change in travel behaviour
AW: Change in work trips
AS: Change in shopping trips
AL: Change in leisure trips
AV: Change in visit trips
Note that the error terms are not
displayed in the Figure
Figure 1: Conceptual model
reach the purpose for which it has been developed (in case of road pricing,74
the final objective is to reduce car use and thereby diminish human pressure75
on the ecological environment). Perceived fairness is more a matter of moral76
legitimacy, i.e., the degree to which a policy measure is seen as ethically just.77
On the one hand, fairness is seen as a function of the degree to which a mea-78
sure infringes on personal freedom with the underlying reasoning being that,79
the more a measure threatens individual freedom, the less fair it is perceived80
to be (Bamberg and Rolle, 2003). On the other hand, a measure’s fairness81
is considered as dependent upon its perceived effectiveness as well. That82
is, given a measure is not believed to reach its goal, its implementation is83
perceived as unfair (Eriksson et al., 2006). In terms of how both perceived84
effectiveness and fairness structurally relate to a measure’s overall acceptabil-85
ity, it is assumed the effect of effectiveness can be direct as well as indirect,86
4

i.e., mediated through fairness.87
An alternative approach is to treat public acceptability of a TDM-measure88
as a two-stage hierarchical model, that is, with the inclusion of deeper-lying89
environmental-related beliefs, norms and values. As indicated by Eriksson90
et al. (2006, 2008), the primary reason for doing so is drawn from the work of91
Schwartz (1977) on Norm Activation Theory where he explains pro-social be-92
havior in function of altruistic norms and motives. With pro-environmental93
actions (such as recycling or reducing car use) seen as typical examples of94
pro-social behavior, the idea of explaining pro-environmental behavior in95
function of more deeply ingrained environment-related beliefs, norms and96
values is perfectly arguable. One of the most popular theoretical frameworks97
to this respect is the Value-Belief-Norm (VBN) Theory of Environmentalism98
(Stern, 2000; Stern et al., 1999). One of its basic hypotheses is that gen-99
eral environmental beliefs and values determine both the extent to which the100
individual is cognizant of the environmental problem (i.e., problem aware-101
ness) and whether s/he feels a personal obligation to contribute to the solu-102
tion and thus behave in a (more) pro-environmental manner (i.e., personal103
norm). Personal norm and problem awareness in turn, are believed to affect104
the individual’s willingness to act pro-environmentally.105
3. Methodology106
3.1. Two-Stage Model107
This paper adopts the two-stage hierarchical model approach, explain-108
ing public acceptability by measure-specific aspects (i.e., effectiveness and109
fairness) as first-stage constructs and variables appearing within the VBN110
framework (i.e., general environmental beliefs and values, problem awareness,111
personal norm and willingness to act pro-environmentally) as second-stage112
constructs (see Figure 1). The starting point is the two-stage hierarchical113
model proposed by Eriksson et al. (2006, 2008), but addresses the following114
concerns and issues.115
1. Relationship between public acceptability and changes in travel behav-116
ior. Although lack of public acceptability is widely acknowledged as the117
single greatest barrier to the implementation of road pricing (see e.g.118
Gaunt et al., 2007), to the best of our knowledge, no studies focusing119
on the psychological underpinnings of road pricing, have investigated120
whether or how public acceptability itself, as well as its most impor-121
tant determinants, relate to people’s actual changes in travel behavior.122
5

Put differently, prior research investigating the socio-cognitive under-123
pinnings of road pricing has systematically taken public acceptability124
instead of behavior as the final outcome variable. This is somewhat sur-125
prising since, strictly taken, the key-question when it comes to exam-126
ining the effectiveness of TDM-measures is not so much to understand127
what makes such measures more or less acceptable, but whether and128
(even more importantly) how acceptability relates to the induction of129
a behavioral change. Indeed, as for the ‘whether’ question, although it130
seems an agreed upon idea that acceptability is an important condition131
for TDM-measures to make people adapt their behavior, without this132
assumption being empirically verified, it remains a speculative asser-133
tion. As for the ‘how’ question, we do not know for instance whether134
it is overall acceptability itself or (one of) its underlying determinants135
that leads to the desired behavioral change.136
2. The use of latent factors rather than aggregate indicators. A second137
issue is related to the way in which two-stage models for public accept-138
ability of TDM-measures have been statistically analyzed. Given the139
fact that (1) two-stage models are structural by definition with multiple140
equations to be estimated simultaneously and, (2) variables appearing141
in such two-stage models are typical latent (i.e., not directly observ-142
able) constructs, Structural Equation Modeling (SEM) is the preferred143
approach in terms of model estimation. Interestingly, a closer look at144
how latent constructs are treated in the literature reveals that, in strict145
sense, these are not operationalized as full worthy latent constructs. In-146
stead, a typical practice is to have the unobservable construct itself be-147
ing replaced by the aggregation of values obtained for that construct’s148
observable indicators (see e.g. Eriksson et al., 2006, 2008). Nonethe-149
less, this practice is to be avoided. First, from theoretical point of view,150
SEM should be used as a confirmatory approach. As most of the socio-151
cognitive factors have their operationalization rooted in the theories on152
the explanation and prediction of behavior, the reflective structure of153
the latent constructs should be kept. Second, dropping an indicator154
from the aggregate construct might alter the meaning of the construct155
and measurement errors are capitalized in this one construct. Third,156
as the different indicators are likely to be correlated and the direction157
of the causality is from the construct to the indicators, only a reflective158
model structure will yield valid results. For a more elaborate method-159
ological discussion concerning the need for a reflective model structure160
6

in this type of analysis, the reader is referred to Bollen (1984) and161
Jarvis et al. (2003).162
3.2. Stated Adaptation Experiment163
The research represented in this paper was conducted in Flanders, the164
Dutch-speaking region of Belgium, by means of an interactive stated adap-165
tation survey, administered on the internet, involving 300 respondents. Al-166
though it could be argued that sample bias is introduced when solely con-167
ducting an internet-based data collection, internet-based surveys allow for168
automatic randomization of the ordering of the questions and can be com-169
pleted at the respondent’s discretion. Furthermore, it is simpler to prompt170
additional questions within the situational context entered in the question-171
naire (Janssens et al., 2009a). On the basis of these arguments, it was decided172
to choose for an internet-based survey rather than a traditional paper-and-173
pencil survey as the advantages outweighed the disadvantages.174
Given that private car use is derived from needs, desires and obligations175
to participate in out-of-home activities, it is argued that changes in activity-176
travel behavior in response to road pricing are not one-dimensional and need177
to be conceptualized in function of the engagement of out-of-home activities178
(Loukopoulos et al., 2006). Therefore in this paper, changes in activity-179
travel behavior in response to road pricing for the four most frequent out-180
of-home activities (commuting (work/school), shopping, leisure and visits),181
most frequent according to the Flemish travel behavior survey 2007-2008182
(Janssens et al., 2009b), are surveyed.183
3.2.1. Behavioral Adaptations184
For each activity a congestion pricing scenario was formulated of the185
following general form:186
Assume that the fixed vehicle taxation is replaced by a variable road price187
which is to be paid for each kilometer traveled by car. The charge will be 7188
eurocents on roads at un-congested periods, and 27 eurocents at congested189
periods.190
After the introduction of the congestion price measure, the respondents191
could indicate multiple long-term and short-term adaptations. For each trip192
for a particular activity, the following long-term changes were considered: (i)193
a change of residential location of the household (e.g. moving to a location194
closer to the workplace), (ii) a change of work location of the individual195
7

(closer to the residential location), and (iii) no change. Concerning short-196
term changes the following alternatives were defined: (i) eliminating the trip197
by conducting the activity at home, (ii) eliminating the trip by skipping the198
activity, (iii) reduce the distance of the trip by conducting the activity more199
close to home, (iv) change the transport mode of the trip, (v) change the200
departure time of the trip, (vi) change the route of the trip, and (vii) no201
change.202
For each activity, these behavioral alterations have been recoded on six203
point scales (1 representing the smallest impact on the activity-travel be-204
havior, 6 the largest impact): 6 representing structural changes, 5 corre-205
sponding to changes in activity situation, 4 indicating a model shift towards206
environment-friendly transport modes, 3 representing time-of-day changes, 2207
indicating route changes, and 1 corresponding to the no change alternative.208
Thus, four indicators to represent the changes in activity-travel behavior have209
been obtained: changes in work trips [AW], changes in shopping trips [AS],210
changes in leisures trips [AL] and changes in visit trips [AV].211
3.2.2. Socio-Cognitive Factors212
Next to indicating changes in travel behavior, the respondents were asked213
to answer questions concerning general environmental and policy-specific be-214
liefs. Beliefs are defined as the subjective probability that an object has a215
certain outcome. The outcome of an object can be judged to be favorable,216
neutral or unfavorable, referring to the valance of a belief (Schuitema et al.,217
2010). It was decided to adopt the questionnaire implemented by Eriksson218
et al. (2008) to assess whether earlier findings concerning the acceptability219
of road pricing are transferrable across notations.220
221
222
Concerning general environmental beliefs, first, the respondents’ pro-envi-223
ronmental orientation [PE] was assessed by four items (see Table 1) included224
in the NEP scale (Dunlap et al., 2000). The respondents had to indicate to225
what extent they agreed to the statements on a five point scale (1 = strongly226
disagree, 2 = mildly disagree, 3 = unsure, 4 = mildly agree, 5 = strongly227
agree). The internal consistency of the latent construct pro-environmental228
orientation was reassured by a Cronbach’s alpha of 0.67. Note that Moss229
et al. (1998) suggest that an alpha score of 0.60 is generally acceptable.230
Next, problem awareness [PA] and personal norm [PN] were assessed by231
respectively three and two statements. Similar to the pro-environmental232
8

orientation, respondents had to evaluate the statements on a five point scale.233
Alpha scores of 0.91 for the indicators of problem awareness, and 0.79 for the234
indicators of personal norm, underlined the high internal reliability of the235
latent constructs. Finally, willingness to act [WTA] was directly measured236
with one item, again measured on the same five point scale.237
Table 1: Statements for the indicators of the socio-cognitive factorsIndicator1 StatementsGeneral environmental beliefsPE1 When humans interfere with nature it often produces disastrous consequences.PE2 Humans are severely abusing the environment.PE3 If things continue on their present course, we will soon experience a major ecological
catastrophe.PE4 The balance of nature is very delicate and easily upset.PA1 Air pollution from private car use is a threat to humans and the environment in the
whole world.PA2 Air pollution from private car use is a threat to humans and the environment in Belgium.PA3 Air pollution from private car use is a threat to the health and well-being of me and my
family.PN1 I feel morally responsible to reduce the negative environmental effects of my car use.PN2 I get a guilty conscience if I don’t try to reduce the negative environmental effects of my
car use.WTA I am willing to reduce the negative environmental effects of my car use.Policy specific beliefsEFF1 To what extent do you perceive road pricing to be effective?EFF2 To what extent do you perceive road pricing will lead to an improved environment?FAIR1 To what extent do you perceive road pricing to be fair for you?FAIR2 To what extent do you perceive road pricing to be fair for others?ACC To what extent are you in favor or against the implementation of this policy measure?1 Abbreviations are indicated in the text between square brackets.
With respect to policy specific beliefs, road pricing was evaluated to the238
extent road pricing was perceived to be effective, fair and acceptable. First,239
perceived effectiveness [EFF] was evaluated by two questions rated on a five240
point scale (1 = not all effective, 3 = neither effective nor ineffective, 5 =241
very effective). Second, respondents evaluated perceived fairness [FAIR] for242
both themselves and others using also a five point scale (1 = very unfair,243
3 = neither fair nor unfair, 5 = very fair). The internal reliability of both244
latent constructs was reassured by alpha values of respectively 0.87 and 0.89.245
Finally, perceived acceptability [ACC] was directly measured with one item,246
again measured on a five point scale (1 = completely against, 3 = neither in247
favor nor against, 5 = completely in favor).248
9

4. Results249
4.1. Descriptive Analysis250
Before providing an in-depth interpretation of the results of the proposed251
conceptual model, first the relationships between adapted travel behavior252
itself on the one hand and public acceptability as well as its most important253
first- and second-order determinants on the other, are investigated by means254
of Pearson correlations between the observable variables.255
From Table 2 one could notice that the direct relationship between ac-256
ceptability [ACC] and changes in travel behavior are not significant, except257
for visit trips [AV]. Moreover, most of the indicators of the first- and second-258
order determinants of acceptability neither have a significant relationship259
with the changes in travel behavior. In contrast, all these indicators, with260
exception of the first indicator of pro-environmental orientation, do have a261
statistically significant correlation with perceived acceptability. Next to the262
relationships between the various indicators on the one hand and accept-263
ability on the other, most of these indicators are highly correlated among264
themselves.265
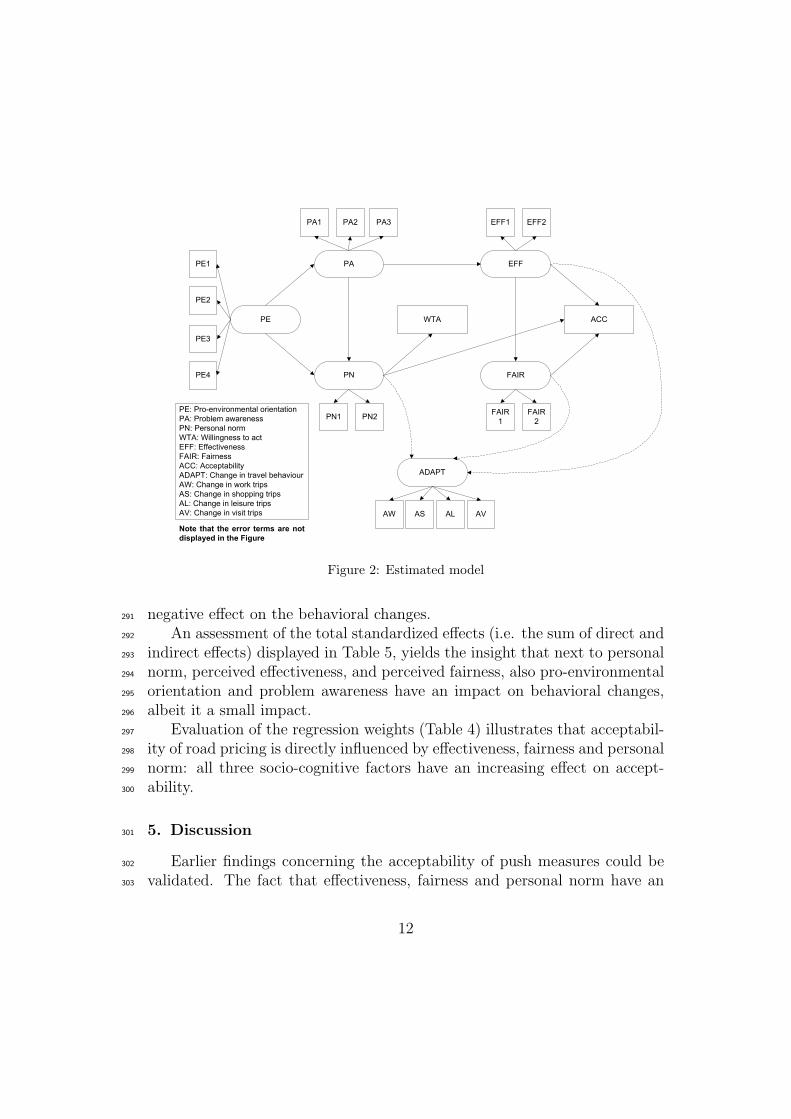
4.2. Two-Stage Model Results266
The estimated model predicting both acceptability of road pricing and267
behavioral adaptations in response to road pricing, is displayed in Figure268
2. Recall that both general environmental and policy specific beliefs were269
included in the model. One could observe that the final obtained model270
deviates from the proposed model displayed in Figure 1 as only the significant271
paths (at the 5% level) were kept in the final model to ensure the parsimony272
of the model. The whole sample (N = 300) was used in the analysis. Note273
that the proposed model was tested using AMOS 4.0 (Arbuckle and Wothke,274
1999).275
To assess the appropriateness of the proposed model, different goodness-276
of-fit measures were tabulated, for the proposed model, as well as for the277
independence model and the saturated model. All the tabulated goodness-of-278
fit and model evaluation criteria (see Table 3) are indicating a good model fit,279
providing evidence that the proposed model can explain well the relationships280
between adapted travel behavior on the one hand and public acceptability281
and its most important determinants on the other hand.282
Investigation of the causal relationships between adapted travel behavior283
on the one hand and public acceptability and its most important determi-284
10

Table 2: Correlation matrix of observed variables included in the modelAW AS AL AV ACC PE1 PE2 PE3 PE4
AW 1AS .259?? 1AL .251?? .439?? 1AV .268?? .356?? .456?? 1ACC .014 .024 .016 .134? 1PE1 -.110 -.016 -.024 .004 .092 1PE2 .051 .033 .005 .115? .234?? .398?? 1PE3 -.040 .027 -.012 .035 .193?? .293?? .433?? 1PE4 .044 .112 -.010 .105 .144? .180?? .347?? .353?? 1PA1 .086 .146? .110 .016 .331?? .239?? .305?? .324?? .283??
PA2 -.002 .106 .049 .057 .306?? .249?? .291?? .361?? .286??
PA3 .013 .105 .055 .043 .299?? .265?? .286?? .388?? .297??
PN1 .111 .136? .078 .097 .309?? .047 .286?? .256?? .222??
PN2 .060 .120? .032 .080 .289?? .076 .323?? .274?? .188??
EFF1 .129? .026 .066 .127? .690?? .002 .139? .146? .162??
EFF2 .042 .095 .014 .095 .694?? .073 .151?? .233?? .165??
FAIR1 -.046 -.041 -.061 .022 .773?? .060 .184?? .140? .162??
FAIR2 .029 -.019 -.061 .058 .756?? .069 .206?? .170?? .183??
WTA .037 .033 .078 .129? .164?? .059 .139? .160?? .136?
PA1 PA2 PA3 PN1 PN2 EFF1 EFF2 FAIR1 FAIR2 WTAPA1 1PA2 .740?? 1PA3 .719?? .882?? 1PN1 .416?? .375?? .419?? 1PN2 .370?? .405?? .450?? .651?? 1EFF1 .366?? .344?? .312?? .254?? .218?? 1EFF2 .318?? .308?? .284?? .232?? .266?? .774?? 1FAIR1 .257?? .267?? .266?? .239?? .268?? .651?? .648?? 1FAIR2 .255?? .245?? .224?? .204?? .274?? .684?? .681?? .812?? 1WTA .271?? .304?? .325?? .505?? .412?? .119? .094 .132? .072 1?? Pearson correlation is significant at the 0.01 level (2-tailed)? Pearson correlation is significant at the 0.05 level (2-tailed)
Table 3: Goodness-of-fit-statisticsModel χ2/df CFI GFI AFGI NFI TLITwo-stage model 1.41 0.98 0.94 0.91 0.93 0.97Independence model 16.99 0.00 0.39 0.32 0.00 0.00Saturated model 1.00 1.00 1.00Model RMSEA PCLOSE AIC BIC ECVITwo-stage model 0.037 0.97 297 616 0.99Independence model 0.231 0.00 2944 3070 9.85Saturated model 380 1643 1.27
nants on the other (Table 4), reveals that the behavioral changes themselves285
are not dependent on the perceived acceptability of road pricing. Moreover,286
only a relative small amount of the variability in the behavioral changes287
(10.7%) is explained by the socio-cognitive factors. Nonetheless, personal288
norm and in particular, perceived effectiveness, have an inducing effect on289
changes in activity-travel behavior. In contrast, perceived fairness has a290
11
PE
PA
PN
WTA
EFF
FAIR
ACC
ADAPT
PE1
PE2
PE3
PE4
PN1 PN2
PA1 PA2 PA3
FAIR
1
FAIR
2
EFF1 EFF2
AW AS AL AV
PE: Pro-environmental orientation
PA: Problem awareness
PN: Personal norm
WTA: Willingness to act
EFF: Effectiveness
FAIR: Fairness
ACC: Acceptability
ADAPT: Change in travel behaviour
AW: Change in work trips
AS: Change in shopping trips
AL: Change in leisure trips
AV: Change in visit trips
Note that the error terms are not
displayed in the Figure
Figure 2: Estimated model
negative effect on the behavioral changes.291
An assessment of the total standardized effects (i.e. the sum of direct and292
indirect effects) displayed in Table 5, yields the insight that next to personal293
norm, perceived effectiveness, and perceived fairness, also pro-environmental294
orientation and problem awareness have an impact on behavioral changes,295
albeit it a small impact.296
Evaluation of the regression weights (Table 4) illustrates that acceptabil-297
ity of road pricing is directly influenced by effectiveness, fairness and personal298
norm: all three socio-cognitive factors have an increasing effect on accept-299
ability.300
5. Discussion301
Earlier findings concerning the acceptability of push measures could be302
validated. The fact that effectiveness, fairness and personal norm have an303
12

Table 4: Regression weights, standard errors and standardized regression weightsPath Est. S.E. S. Est Path Est. S.E. S. EstEFF → ACC 0.324 0.107 0.246 ADAPT → AW 1.000 0.402EFF → ADAPT 0.404 0.156 0.477 EFF → EFF1 1.093 0.057 0.885EFF → FAIR 0.959 0.062 0.838 EFF → EFF2 1.000 0.875FAIR → ACC 0.711 0.093 0.618 FAIR → FAIR1 1.000 0.901FAIR → ADAPT -0.349 0.134 -0.470 FAIR → FAIR2 0.917 0.041 0.903PA → EFF 0.432 0.067 0.390 PA → PA1 0.899 0.048 0.784PA → PN 0.440 0.080 0.425 PA → PA2 1.001 0.037 0.941PE → PA 1.044 0.181 0.552 PA → PA3 1.000 0.934PE → PN 0.436 0.177 0.223 PE → PE1 1.000 0.473PN → ACC 0.141 0.052 0.100 PE → PE2 1.389 0.217 0.680PN → ADAPT 0.153 0.073 0.168 PE → PE3 1.391 0.218 0.662PN → WTA 0.525 0.056 0.577 PE → PE4 1.042 0.183 0.514ADAPT → AL 1.624 0.298 0.706 PN → PN1 1.000 0.846ADAPT → AS 1.459 0.274 0.611 PN → PN2 0.969 0.082 0.768ADAPT → AV 1.283 0.240 0.625Note: Est. = Estimate, S.E. = Standard Error, S. Est = Standardized EstimateExplained variance: ADAPT 10.7%, ACCEPT 74.1%, FAIR 70.2%, EFF 15.2%,WTA 33.3%, PN 33.5%, PA 30.5%
Table 5: Total standardized effects for road pricingPE PA EFF FAIR PN
ADAPT 0.095 0.104 0.083 -0.470 0.168ACC 0.211 0.341 0.764 0.618 0.100
increasing effect on acceptability is in line with the model predicting the304
acceptability of raised tax on fossil fuel (which could be seen as an op-305
erationalization of road pricing) presented by Eriksson et al. (2008). The306
transferability of the results across nations is even further supported by the307
mutual relationships between the most important first- (i.e. effectiveness and308
fairness) and second-order determinants (i.e. pro-environmental orientation,309
problem awareness and personal norm).310
Despite the large amount of similarities, the relationships concerning the311
willingness to act differ between the two studies. Whereas willingness to act312
was significantly influenced by both problem awareness and personal norm,313
and had on its own a positive effect on effectiveness and fairness in the314
study reported by Eriksson et al. (2008), in the study reported in this paper315
willingness to act was only directly influenced by personal norm, and had on316
its own no significant impact on effectiveness and fairness. This could be an317
indication that the concept of willingness to act might be better grasped by318
a latent factor using multiple indicators.319
An important difference between the present study and the study reported320
by Eriksson et al. (2008) is that the latent constructs measured by means321
13

of multiple items in this study are not replaced by the aggregate of their322
indicators. The appropriateness of using latent constructs is supported by323
the proportion of the variance that is explained by the model presented in324
this paper, when compared to the percentage of the variance that is explained325
by the TAX-model presented by Eriksson et al. (2008). When focussing on326
the final outcome variable of their model (i.e. perceived acceptability) in327
the present study, 74% of the variance is explained, while the TAX-model328
reported by Eriksson et al. (2008) accounts for 58%. Also for all underlying329
determinants a larger portion of the variance is explained by the model that330
uses the latent constructs. The largest difference in variance explained could331
be noticed for perceived fairness: 70% of the variance was explained by the332
latent construct model, while only 22% of the variance was accounted for333
by the model using aggregate indicators. Especially for this socio-cognitive334
factor the reflective structure of the construct contributed significantly.335
A controversial finding in this paper is the negative effect caused by per-336
ceived fairness on changes in activity-travel behavior. This finding can be337
partially accounted for by the fact that the monetary value of the road pric-338
ing charges must surpass a minimum threshold before people will actually339
change their activity-travel behavior. This is especially true for the structural340
changes, such as residential relocations and changes of job location. This is341
in line with the findings reported by Tillema et al. (2010) who reported that342
travel costs (i.e. toll and fuel) are a crucial factor in the actual residential343
location choice in the case of road pricing. Notwithstanding, this finding344
does not imply that the level of congestion charging has no boundaries. Af-345
ter all, when congestion charges are too high, and no reasonable alternatives346
are available, people might oppose to the congestion charges and accessibil-347
ity (see e.g. Condeco-Melhorado et al. (2011)) and equity problems (see e.g.348
Eliasson and Mattsson (2006)) can arise.349
6. Conclusions350
In this paper, changes in activity-travel behavior in response to road pric-351
ing are treated as a complex psychological phenomenon. The most important352
finding is that acceptability of road pricing as a single dimensional overall353
evaluative construct itself does not directly entice changes in activity-travel354
behavior. As Goodwin and Lyons (2010) reported, there are strong argu-355
ments that socio-cognitive factors and actual choices may be ill-matched.356
The lack of a direct impact of acceptability on behavioral changes supports357
14

this hypothesis of mismatching. From policy point of view however, it was358
argued that road pricing charges must surpass a minimum threshold in or-359
der to change a person’s mind set in such way that he/she alters his/her360
activity-travel behavior. This however, does not mean that acceptability361
can be neglected. A very delicate issue of importance in every (mobility)362
policymaking program lays in the challenge to shift people away from the363
self-interest that commonly drives them. Therefore, creating a sound basis364
of policy support first is essential, especially when push measures such as365
road pricing are to be introduced (Cools et al., 2009).366
How much effort is required to convincing someone to move over to the367
societal side of the spectrum and thus to create policy support for the policy368
initiatives is heavily dependent on the individual’s values, i.e. the individu-369
als’ orientation with respect to how inclusive the measures’ impact on their370
environment is perceived to be (Stern et al., 1999). Homocentric and ecocen-371
tric personalities can fairly easily be convinced by focusing the attention on372
the pressure daily congestion lays on society and the ecosystem. To convince373
the most radical egocentric members of society to adapt to the new initia-374
tive, the before-mentioned negative impact of perceived fairness on changes375
in activity-travel behavior is of interest here: because of their self-centered376
mind-set, they will continue to strive for the optimization of their own ben-377
efits. Driving more in off-peak hours will therefore become more interesting,378
since the egocentric human being will experience it as more beneficial when379
compared to driving during rush hour. As Bonsall et al. (2007) suggest, op-380
portunities for getting these people on board may lay in presenting the road381
pricing tariff as an off-peak discount rather than as a peak surcharge.382
Thus, a main focus point in the strategy of creating broad policy support383
for road pricing lays in clearly communicating and even providing education384
on the benefits thereof. It is a matter of convincing rather than seducing the385
public. In addition, these benefits should be clearly visible for the road users386
(Schuitema et al., 2010). The rationale “may need to be communicated in a387
variety of ways, in both summary and detailed formats, in order to meet the388
needs and abilities of different types of driver. Significant effort would be re-389
quired, prior to launch, to explain the reasons for the scheme and the logic of390
the charging structure, and the system should be trialed with no actual charg-391
ing to help people become familiar with the charge structure. The development392
of information services [...] could play an enormous role in helping people to393
understand, predict and react to variable charges. Government has a role in394
facilitating this development while staying alert to the equity.” (Bonsall et al.,395
15

2007, pg. 680). Additional issues that have to be taken into account when396
introducing a road pricing policy on order to enhance the measure’s accep-397
tance are matters of technical simplicity and minimized hindrance (Blythe,398
2005) and uniformity, clarity and stability in the diversity of tariffs (Bonsall399
et al., 2007).400
Note that an increase in generalized transport costs (e.g. induced by401
road pricing), may cause accessibility disparities at a regional level (Condeco-402
Melhorado et al., 2011) and within the population. Certain areas may be-403
come economically unattractive and people may be cut off from opportuni-404
ties because of the increased transport costs. The introduction of congestion405
charging policies will remain a controversial issue, making it politically risky.406
Urban planners, policy makers and politicians are forced to consider how they407
can legitimately introduce a policy that the public may not want. Especially408
for the latter group of actors, this is an unnatural given. Politicians have409
a difficult task: to continuously find a good balance between acceptability410
and efficiency (Eriksson et al., 2008; Isaksson and Richardson, 2009; Rotaris411
et al., 2010). For a combination of the before mentioned arguments, it is sug-412
gested that the responsibility of introducing a road pricing policy is assigned413
to a higher (national or regional) level of policymaking. In general, a decent414
preparation and a strong leadership with a clear and well-underpinned vision415
in mind are essential when bringing a road pricing initiative into practice416
(Isaksson and Richardson, 2009).417
In the attempt of achieving a more sustainable transport, road pricing418
alone will not counterbalance the growth in car use. As discussed by Jakobs-419
son et al. (2002), even substantial economic disincentives are unlikely to lead420
to any large reduction in private car use. Therefore, it is important to im-421
plement a wider range of policy packages at a higher intensity in application422
(Hickman et al., 2010). Combined improvements to public transport services423
and fares, road pricing and integration of land use and transport planning424
can be instrumental in achieving a more sustainable transport (May et al.,425
2008). A single policy response is unlikely to encourage changed behavior426
in all users. The travel market is thus probably best simplified and under-427
stood by segmentation into coherent groups that share similar characteris-428
tics (Hickman et al., 2010). The key challenge will be to induce the most429
car-dependent travelers to shift towards more sustainable activity-travel be-430
havior. Even focusing on small changes in behavior might yield significantly431
larger benefits on the long term, as people who are already inclined to show432
ecological activity-travel behavior are more likely to express similar behavior.433
16
Once a first step toward an increased environmental awareness is achieved,434
more significant changes can be obtained more easily (Janssens et al., 2009a).435
Appendix A. Model Evaluation436
As was indicated before, the appropriateness of the proposed model has437
been assessed by tabulating different goodness-of-fit and model evaluation438
criteria. The first criterion that is displayed in Table 3 is the chi-square439
value divided by the degrees of freedom of the model. Values lower than 2440
are generally considered to represent a minimally plausible model (Byrne,441
1991). Second, the comparative fit index (CFI) is displayed, which should be442
greater than 0.95 to represent a good fit (Hu and Bentler, 1999). Next, the443
goodness-of-fit index (GFI), adjusted GFI (AFGI), normed fit index (NFI)444
and Tucker-Lewis index are computed. A good fit is indicated by values445
greater than 0.90 (Hu and Bentler, 1999; Sanders et al., 2005). In addi-446
tion, the root mean square error of approximation (RMSEA) and PCLOSE447
are presented. RMSEA values lower than 0.05 indicate a good fit (Browne448
and Cudeck, 1993). PCLOSE tests the null hypothesis that RMSEA is not449
greater than 0.05. If PCLOSE is greater than 0.05, the null hypothesis is450
not rejected, indicating a good fit. Finally, the Akaike information criterion451
(AIC), Bayesian information criterion (BIC) and expected cross-validation452
index (ECVI) are displayed. The model with the lowest value is considered453
to be the best model according to these criteria.454
Acknowledgements455
We thank two anonymous reviewers for the helpful comments on this456
paper.457
References458
Arbuckle, J., Wothke, W., 1999. Amos User’s Guide Version 4.0. SPSS,459
Incorporated, Chicago, IL.460
Bamberg, S., Rolle, D., 2003. Determinants of people’s acceptability of pric-461
ing measures: Replication and extension of a causal model, in: Schade, J.,462
Schlag, B. (Eds.), Acceptability of transport pricing strategies. Elsevier,463
Oxford, pp. 235–248.464
17

Beatley, T., 1995. The many meanings of sustainability: Introduction to a465
special issue of jpl. Journal of Planning Literature 9, 339–342.466
Blythe, P., 2005. Congestion charging: Technical options for the delivery of467
future uk policy. Transportation Research Part A: Policy and Practice 39,468
571–587.469
Bollen, K.A., 1984. Multiple indicators: Internal consistency or no necessary470
relationship? Quality and Quantity 18, 377–385.471
Bonsall, P., Shires, J., Maule, J., Matthews, B., Beale, J., 2007. Responses472
to complex pricing signals: Theory, evidence and implications for road473
pricing. Transportation Research Part A: Policy and Practice 41, 672–683.474
Browne, M., Cudeck, R., 1993. Alternative ways of assessing model fit, in:475
Bollen, K., Long, J. (Eds.), Testing Structural Equation Models. Sage,476
New Park, CA, pp. 136–162.477
Byrne, B.M., 1991. The maslach burnout inventory: Validating factorial478
structure and invariance across intermediate, secondary, and university479
educators. Multivariate Behavioral Research 26, 583–605.480
Condeco-Melhorado, A., Gutierrez, J., Garcıa-Palomares, J.C., 2011. Spatial481
impacts of road pricing: Accessibility, regional spillovers and territorial482
cohesion. Transportation Research Part A: Policy and Practice 45, 185–483
203.484
Cools, M., Moons, E., Janssens, B., Wets, G., 2009. Shifting towards485
environment-friendly modes: profiling travelers using q-methodology.486
Transportation 36, 437–453.487
Dunlap, R.E., Liere, K.D.V., Mertig, A.G., Jones, R.E., 2000. Measuring488
endorsement of the new ecological paradigm: A revised nep scale. Journal489
of Social Issues 56, 425–442.490
Eliasson, J., Mattsson, L.G., 2006. Equity effects of congestion pricing:491
Quantitative methodology and a case study for stockholm. Transporta-492
tion Research Part A: Policy and Practice 40, 602–620.493
18

Eriksson, L., Garvill, J., Nordlund, A.M., 2006. Acceptability of travel de-494
mand management measures: The importance of problem awareness, per-495
sonal norm, freedom, and fairness. Journal of Environmental Psychology496
26, 15–26.497
Eriksson, L., Garvill, J., Nordlund, A.M., 2008. Acceptability of single and498
combined transport policy measures: The importance of environmental499
and policy specific beliefs. Transportation Research Part A: Policy and500
Practice 42, 1117–1128.501
European Environment Agency, 2008. Climate for a transport change, TERM502
2007: indicators tracking transport and environment in the European503
Union. Number 1/2008 in EEA Report, Office for Official Publications504
of the European Communities, Luxembourg.505
Gaunt, M., Rye, T., Allen, S., 2007. Public acceptability of road user charg-506
ing: The case of edinburgh and the 2005 referendum. Transport Reviews507
27, 85–102.508
Goodwin, P., Lyons, G., 2010. Public attitudes to transport: interpreting509
the evidence. Transportation Planning and Technology 33, 3.510
Hickman, R., Ashiru, O., Banister, D., 2010. Transport and climate change:511
Simulating the options for carbon reduction in london. Transport Policy512
17, 110–125.513
Hu, L.T., Bentler, P.M., 1999. Cutoff criteria for fit indexes in covariance514
structure analysis: Conventional criteria versus new alternatives. Struc-515
tural Equation Modeling: A Multidisciplinary Journal 6, 1–55.516
Isaksson, K., Richardson, T., 2009. Building legitimacy for risky policies:517
The cost of avoiding conflict in stockholm. Transportation Research Part518
A: Policy and Practice 43, 251–257.519
Jakobsson, C., Fujii, S., Garling, T., 2002. Effects of economic disincentives520
on private car use. Transportation 29, 349–370.521
Janssens, D., Cools, M., Moons, E., Wets, G., Arentze, T.A., Timmermans,522
H.J.P., 2009a. Road pricing as an impetus for environment-friendly travel523
behavior: Results from a stated adaptation experiment. Transportation524
19

Research Record: Journal of the Transportation Research Board 2115,525
50–59.526
Janssens, D., Moons, E., Nuyts, E., Wets, G., 2009b. Onderzoek Verplaats-527
ingsgedrag Vlaanderen 3 (2007-2008): Verkeerskundige interpretatie van528
de belangrijkste tabellen. Technical Report. Transportation Research In-529
stitute (IMOB), Hasselt University. Diepenbeek.530
Jarvis, C.B., Mackenzie, S.B., Podsakoff, P.M., Mick, D.G., Bearden, W.O.,531
2003. A critical review of construct indicators and measurement model532
misspecification in marketing and consumer research. Journal of Consumer533
Research 30, 199–218.534
Loukopoulos, P., Jakobsson, C., Garling, T., Meland, S., Fujii, S., 2006. Un-535
derstanding the process of adaptation to car-use reduction goals. Trans-536
portation Research Part F: Traffic Psychology and Behaviour 9, 115–127.537
May, A.D., Page, M., Hull, A., 2008. Developing a set of decision-support538
tools for sustainable urban transport in the uk. Transport Policy 15, 328–539
340.540
Moss, S., Prosser, H., Costello, H., Simpson, N., Patel, P., Rowe, S., Turner,541
S., Hatton, C., 1998. Reliability and validity of the pas-add checklist542
for detecting psychiatric disorders in adults with intellectual disability.543
Journal of Intellectual Disability Research 42, 173–183.544
Rotaris, L., Danielis, R., Marcucci, E., Massiani, J., 2010. The urban road545
pricing scheme to curb pollution in milan, italy: Description, impacts546
and preliminary cost-benefit analysis assessment. Transportation Research547
Part A: Policy and Practice 44, 359–375.548
Sanders, R.D., Allen, D.N., Forman, S.D., Tarpey, T., Keshavan, M.S., Gold-549
stein, G., 2005. Confirmatory factor analysis of the neurological evaluation550
scale in unmedicated schizophrenia. Psychiatry Research 133, 65–71.551
Schade, J., 2003. European research results on transport pricing acceptabil-552
ity, in: Schade, J., Schlag, B. (Eds.), Acceptability of transport pricing553
strategies. Elsevier, Oxford, pp. 109–123.554
Schuitema, G., Steg, L., Forward, S., 2010. Explaining differences in accept-555
ability before and acceptance after the implementation of a congestion556
20

charge in stockholm. Transportation Research Part A: Policy and Practice557
44, 99–109.558
Schwartz, S., 1977. Normative influences on altruism, in: Berkowitz, L. (Ed.),559
Advances in experimental social psychology. Academic Press, New York.560
volume 10, pp. 221–279.561
Steg, L., Gifford, R., 2005. Sustainable transportation and quality of life.562
Journal of Transport Geography 13, 59–69.563
Stern, P.C., 2000. Toward a coherent theory of environmentally significant564
behavior. Journal of Social Issues 56, 407–424.565
Stern, P.C., Dietz, T., Abel, T., Guagnano, G.A., Kalof, L., 1999. A value-566
belief-norm theory of support for social movements: The case of environ-567
mentalism. Human Ecology Review 6, 81–97.568
Tillema, T., van Wee, B., Ettema, D., 2010. The influence of (toll-related)569
travel costs in residential location decisions of households: A stated choice570
approach. Transportation Research Part A: Policy and Practice 44, 785–571
796.572
Wittneben, B., Bongardt, D., Dalkmann, H., Sterk, W., Baatz, C., 2009. In-573
tegrating sustainable transport measures into the clean development mech-574
anism. Transport Reviews: A Transnational Transdisciplinary Journal 29,575
91–113.576
Xie, L., Olszewski, P., 2011. Modelling the effects of road pricing on traffic577
using erp traffic data. Transportation Research Part A: Policy and Practice578
45, 512–522.579
21