Embed Size (px)
Citation preview

Georgia Southern University
Digital Commons@Georgia Southern
Electronic Theses and Dissertations Graduate Studies, Jack N. Averitt College of
Spring 2020
The Smartphone Addiction Measure Taylor Bradish
Follow this and additional works at: https://digitalcommons.georgiasouthern.edu/etd
Part of the Psychology Commons
Recommended Citation Bradish, Taylor, "The Smartphone Addiction Measure" (2020). Electronic Theses and Dissertations. 2054. https://digitalcommons.georgiasouthern.edu/etd/2054
This thesis (open access) is brought to you for free and open access by the Graduate Studies, Jack N. Averitt College of at Digital Commons@Georgia Southern. It has been accepted for inclusion in Electronic Theses and Dissertations by an authorized administrator of Digital Commons@Georgia Southern. For more information, please contact [email protected].

THE SMARTPHONE ADDICTION MEASURE
by
TAYLOR BRADISH
(Under the Direction of Janie H. Wilson)
ABSTRACT
Due to the multifaceted capabilities of the smartphone, college students have become increasingly
susceptible to the overuse of and addiction to smartphone use. This susceptibility has led to many
negative effects both mentally and physically in addition to the creation of new pathologies. There are
many scales to measure cellphone addiction; however, scales to measure smartphone addiction in
particular are scarce and have limitations that call into question their validity and reliability, especially for
use on U.S. college students. This study aimed to investigate the validity and reliability of a diagnostic
tool to measure smartphone addiction in U.S. college students. We aimed to account for the limitations
that were present in previous scales and to further the support of smartphone addiction as a valid
diagnosis that should be recognized by reputable resources. We found the Smartphone Addiction Measure
to be reliable across time in addition to having internal consistency. Additionally, the evaluation of
construct validity through the use of positive and negative correlations indicated support for a valid
measure. This study provided a new smartphone addiction measurement tool that may allow for a way to
clinically diagnosis addiction among college students.
INDEX WORDS: Smartphone, Smartphone addiction, Behavioral addiction, Cellphone, Smartphone
addiction scale
THE SMARTPHONE ADDICTION MEASURE
by
TAYLOR BRADISH
B.S., University of Georgia, 2018
B.A., University of Georgia, 2018
A Thesis Submitted to the Graduate Faculty of Georgia Southern University
in Partial Fulfillment of the Requirements for the Degree
MASTER OF SCIENCE

© 2020
TAYLOR BRADISH
All Rights Reserved

1
THE SMARTPHONE ADDICTION MEASURE
by
TAYLOR BRADISH
Major Professor: Janie H. Wilson
Committee: Lawrence Locker Jr.
Rebecca Ryan
Electronic Version Approved:
May 2020
2
ACKNOWLEDGMENTS
I wish to express my deepest gratitude to my thesis advisor, Dr. Janie H. Wilson, for providing
me with the opportunity to be a part of this master’s program and to conduct research under her
supervision. She imparted her vast amount of knowledge unto me to allow for me to successfully
complete all phases of this project. She also supported me in all my endeavors in my time at Georgia
Southern University. Without her guidance and continuous help, this thesis would not have been possible.
I would also like to express my thanks to the other members of my thesis committee, Dr.
Lawrence Locker and Dr. Rebecca Ryan. Their input and valuable advice throughout the duration of this
project allowed for a more thorough investigation and evaluation of the thesis topic. Their time,
suggestions, and encouragement have been greatly appreciated.
I would also like to recognize the invaluable assistance of the members of our lab. Their review
and constructive criticism allowed me to formulate the best possible project I could. I would especially
like to thank Linsey Perdue for taking the time to help me read through all the prompts for the first phase
of this project to formulate the items for this scale.
I further wish to extend my gratitude to the members of my cohort. The exchanging of ideas and
the support of each other that was expressed amongst my peers throughout our time in this program gave
me the confidence to thrive in all my endeavors and to pursue my educational and professional goals.
Lastly, I must express my sincerest appreciation to my family, especially my parents,
grandparents, and siblings, for the love, encouragement, and constant support in my education and all my
pursuits. Without their words of affirmation, I could not have succeeded in the pursuit of my degree.
Additionally, I am grateful to my friends who never stopped believing in me and motivated me to be the
best I could be.

3
TABLE OF CONTENTS
Page
ACKNOWLEDGMENTS......................................................................................................................2
LIST OF TABLES..................................................................................................................................4
CHAPTER
1 INTRODUCTION..................................................................................................................5
2 METHOD...............................................................................................................................13
Participants...................................................................................................................13
SAM Item Construction...............................................................................................15
Factor Analysis.............................................................................................................16
Materials.......................................................................................................................17
Procedure......................................................................................................................19
3 RESULTS...............................................................................................................................20
Validity with Positive Correlations..............................................................................20
Validity with Negative Correlations ............................................................................20
Reliability.....................................................................................................................21
4 DISCUSSION.........................................................................................................................22
Validity with Positive Correlations…..........................................................................23
Validity with Negative Correlations.............................................................................25
Reliability.....................................................................................................................27
Potential Limititations..................................................................................................28
5 CONCLUSIONS....................................................................................................................30
REFERENCES ......................................................................................................................................31
APPENDICES........................................................................................................................................39
A SMARTPHONE ADDICTION MEASURE.........................................................................39
B SMARTPHONE ADDICTION SCALE ...............................................................................41
C INTERNET ADDICTION TEST..........................................................................................43
D SHORT URGENCY, PREMEDITATION (LACK OF), PERSEVERANCE (LACK OF),
SENSATION SEEKING, POSITIVE URGENCY, IMPULSIVE BEHAVIOR SCALE- SHORT
VERSION..................................................................................................................................45
E ROTTER’S LOC SCALE......................................................................................................47
F CONNECTEDNESS TO NATURE SCALE.........................................................................50
G BIG FIVE INVENTORY......................................................................................................51

4
LIST OF TABLES
Page
Table 2.1: Sociodemographic Characteristics and SAM Scores….................................................14
Table 2.2: Sociodemographic Characteristics of Test-Retest Reliability........................................15
Table 3.1: Construct Validity of the SAM.......................................................................................21

5
CHAPTER 1
INTRODUCTION
Addiction has been defined by the American Society of Addiction Medicine (2011) as a “chronic
disease of brain reward, motivation, memory and related circuitry” (p.1), which is characterized by a
person’s inability to abstain from use, impairment in behavioral control, lack of recognition of problems
with behaviors and interpersonal relationships, and emotional response dysfunction. Addiction typically is
discussed as it relates to drug use, but the language of addiction can also pertain to a variety of stimuli,
including cellphone use.
The concept of addiction in relation to cellphone and smartphone use is not a new phenomenon,
with several researchers who have explored this phenomenon (e.g., Carbonell et al., 2018; De-Sola
Gutiérrez et al., 2016; Jenaro et al., 2007; Kwon et al., 2013; Lopez-Fernandez et al., 2017; Roberts et al.,
2014; Smetanuik, 2014; Tossell et al., 2015). Within the literature, “cellphone” and “smartphone” has
been used interchangeably, but specifically, smartphones are simply cellphones that have advanced
capabilities such as the ability to download and use apps and access to the internet (Smith, 2011). In the
past, cellphone addiction has been categorized as problematic cellphone or smartphone use (Carbonell et
al., 2018; Jenero et al., 2007; Lopez-Fernandez et al., 2017; Smetanuik, 2014). The addictive nature of
cellphones is characterized along the lines of a behavioral addiction, a disorder with symptoms
behaviorally expressed, and associated with a pleasurable and irresistible quality (Black, 2013).
According to Griffiths (1996), a behavior must fulfill six criteria in order to be considered an
addiction: salience, mood modification, tolerance, withdrawal, conflict, and relapse. Many researchers see
these as the core components of behavioral addiction (De-Sola Gutiérrez et al., 2016; Jenaro et al., 2007;
Roberts et al., 2014; Smetaniuk, 2014). However, behavioral addictions have not been universally
accepted within some reputable sources, including the Diagnostic and Statistical Manual of Mental
Disorders, Version 5 (DSM-5). With the exception of gambling addiction, the DSM-5 fails to elaborate
on behavioral addictions due to the lack of sufficient peer-reviewed evidence to establish diagnostic
6
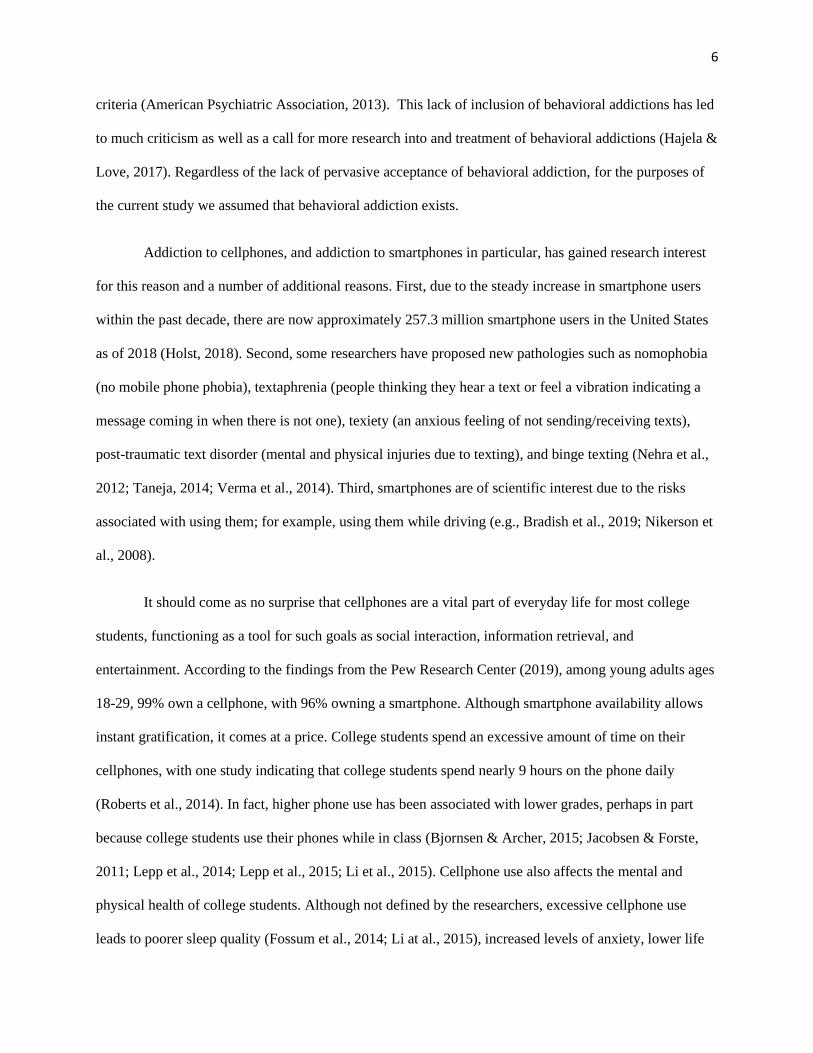
criteria (American Psychiatric Association, 2013). This lack of inclusion of behavioral addictions has led
to much criticism as well as a call for more research into and treatment of behavioral addictions (Hajela &
Love, 2017). Regardless of the lack of pervasive acceptance of behavioral addiction, for the purposes of
the current study we assumed that behavioral addiction exists.
Addiction to cellphones, and addiction to smartphones in particular, has gained research interest
for this reason and a number of additional reasons. First, due to the steady increase in smartphone users
within the past decade, there are now approximately 257.3 million smartphone users in the United States
as of 2018 (Holst, 2018). Second, some researchers have proposed new pathologies such as nomophobia
(no mobile phone phobia), textaphrenia (people thinking they hear a text or feel a vibration indicating a
message coming in when there is not one), texiety (an anxious feeling of not sending/receiving texts),
post-traumatic text disorder (mental and physical injuries due to texting), and binge texting (Nehra et al.,
2012; Taneja, 2014; Verma et al., 2014). Third, smartphones are of scientific interest due to the risks
associated with using them; for example, using them while driving (e.g., Bradish et al., 2019; Nikerson et
al., 2008).
It should come as no surprise that cellphones are a vital part of everyday life for most college
students, functioning as a tool for such goals as social interaction, information retrieval, and
entertainment. According to the findings from the Pew Research Center (2019), among young adults ages
18-29, 99% own a cellphone, with 96% owning a smartphone. Although smartphone availability allows
instant gratification, it comes at a price. College students spend an excessive amount of time on their
cellphones, with one study indicating that college students spend nearly 9 hours on the phone daily
(Roberts et al., 2014). In fact, higher phone use has been associated with lower grades, perhaps in part
because college students use their phones while in class (Bjornsen & Archer, 2015; Jacobsen & Forste,
2011; Lepp et al., 2014; Lepp et al., 2015; Li et al., 2015). Cellphone use also affects the mental and
physical health of college students. Although not defined by the researchers, excessive cellphone use
leads to poorer sleep quality (Fossum et al., 2014; Li at al., 2015), increased levels of anxiety, lower life
7
satisfaction, (Lepp at el., 2014), headaches, irritability, and lack of concentration (Acharya et al., 2013),
just to name a few.
Many researchers have postulated why college students are showing signs of smartphone
addiction. One prominent idea is that students are showing these symptoms due to the fear of missing out
(FOMO). FOMO moderately relates with smartphone use frequency (r = .42, p < .001) and significantly
relates to problematic cellphone use (r = .51, p < .001), such as dependence or withdrawal when not using
a smartphone (Elhai et al., 2018; Wolniewicz et al., 2018). The abundance of information students might
be missing expanded exponentially with advanced capabilities of smartphones, such as internet
connectivity and access to social networking sites (Kwon et al., 2013). In fact, diverse usage may lead to
more specific addictions, such as social networking site addiction (Liu & Ma, 2018) or internet addiction
(Chak & Leung, 2004). It is highly likely that expanded uses of smartphones contribute to the potential
for addictive behaviors.
The allure of discovering what constitutes cellphone addiction has been widespread. Currently
over 18 scales have been created to identify the possible psychological variables that may underlie
addiction to cellphones. Given the expanded functions of smartphones over cellphones and the likelihood
that smartphones exacerbate symptoms of addiction, we begin by making a distinction between the two
types of phones. Our review focuses on scales designed to assess smartphone addiction specifically.
Existing assessments of smartphone addiction include four scales (De-Sola Gutierrez et al., 2016): the
Smartphone Addiction Inventory (SPAI; Lin et al., 2014), Smartphone Addiction Questionnaire (SPAQ;
Al-Barashdi et al., 2014), Smartphone Addiction Measurement Instrument (SAMI; Tossell et al., 2015),
and the Smartphone Addiction Scale (SAS; Kwon et al., 2013).
The SPAI is a 26-item self-report measurement used to identify smartphone addiction (Lin et al.,
2014). Each item is rated on the following 4-point Likert Scale: 1 = strongly disagree, 2 = somewhat
disagree, 3 = somewhat agree, and 4 = strongly agree. Scale items offer good face validity; however, we
note some potential limitations. First, the male to female ratio for the study was highly disproportionate,
8
with 260 male participants and only 23 female participants. The authors rationalized this disproportionate
population by arguing that male college students are at higher risk for substance and internet addiction.
We propose that although male college students may be at higher risk for these types of addictions that
does not necessarily mean that they are also at higher risk for smartphone addiction. Second, their sample
was recruited from only the electrical engineering and department of computer and communication
engineering at two Taiwan universities (Lin et al., 2014). Again, this demographic is limiting the
variability and generalizability of their sample and, by extension, the generalizability of their scale. Third,
the scale was created primarily through modifying the Chen Internet Addiction Scale by switching terms
from “internet” to “smartphone” (Lin et al., 2014). Though internet accessibility is likely one of the many
aspects of smartphone addiction, that does not necessarily mean that smartphone addiction represents the
same construct. As a result, a modified internet addiction scale may fail to fully assess aspects of
smartphone addiction. The authors established internal consistency by finding a Cronbach’s alpha of 0.94
for the total scale, and a two-week test-retest of the SPAI and its subscales revealing a reliability of 0.80
to 0.91. However, the authors failed to establish construct validity, which calls in to question the validity
of the scale as measuring the construct of interest.
The Smartphone Addiction Questionnaire (SPAQ) is a 39-item questionnaire to measure the level
of smartphone addiction a person may possess (Al-Barashdi, Bouazza, & Al Zubaidi, 2014). The
questionnaire consists of 3 parts: level of smartphone usage (5 open-answer questions), level of addiction
to smartphones’ different activities and applications (17 items), and the level of appearance of smartphone
addiction symptoms (17 items). This questionnaire has a number of limitations. First, the 140-student
sample had a disproportionate gender ratio, with 37.1% males and 62.9% females. Second, the translation
to English is not completely coherent. For example, one of the items states “More than once I have been
in trouble because I didn't switched on my smartphone during lectures.” Third, the authors performed a t-
test examining potential gender differences in smartphone addiction as a measure of construct validity.
We would argue that gender differences do not establish construct validity. Finally, the authors reported
9
construct validity with a positive correlation between their scale and the SAS (described below); however,
this correlation was the only attempt to establish construct validity.
The SAMI is a 15-question survey used to evaluate smartphone addiction (Tossell et al., 2015).
Participants respond to the questions using a 5-point Likert scale that ranges from never (1) to always (5).
This measurement is currently the only scale that has been developed in the United States to measure
smartphone addiction; however, the scale has several limitations. First, this instrument was merely created
as a tool to measure smartphone addiction in the authors’ study and was not the focus of their research.
Consequently, the instrument was not validated. The authors modified the smartphone addiction survey
after combining two other scales: the Cellular Phone Addiction Scale (CPAS) and the Internet Addiction
Test (IAT; Tossell et al., 2015). Furthermore, the authors did not assess test-retest reliability of the scale
in their study. Finally, the study consisted of a population of only 34 university students, which is a small
sample considering the development of a unique measurement tool.
The Smartphone Addiction Scale (SAS) is a 48-item measure of smartphone addiction (Kwon et
al., 2013). This scale is comprised of 6 subscales: daily-life disturbance, positive anticipation, withdrawal,
cyberspace-oriented relationship, overuse, and tolerance. Items are rated on a 6-point Likert scale ranging
from strongly disagree (1) to strongly agree (6). The SAS is useful because it was devised specifically for
smartphones and does not include internet addiction, per se. However, the authors pointed out limitations.
They mentioned that their sample was small with 214 adult participants from two companies and two
universities in South Korea and ages ranging from 18-53 (M = 26.06, SD = 5.96; Kwon et al., 2013).
There was also a disproportionate gender ratio of 133 females in comparison to the 64 males. To establish
construct validity with positive correlations, the authors used the K-scale, Y-scale, and the Visual
Analogue Scale. However, we should note that the K- and Y-scales are measures of internet addiction,
likely one component of a broader smartphone addiction construct. The Visual Analogue Scale evaluated
the participants’ thoughts of the seriousness of their addiction. Though the sample size and
disproportionate gender ratio are limitations, the authors were able to establish construct validity through
positive correlations with the K-scale, Y-scale, and the Visual Analogue Scale, as well as internal

10
reliability with a Cronbach’s alpha of 0.97. Similar measures beyond internet addiction were not assessed,
and the authors failed to include dissimilar scales (negative correlations), limiting convergence on
construct validity.
The SAS has been the most influential of the four key smartphone addiction instruments reviewed
here. Among all of these instruments specifically measuring smartphone addiction, only the SAMI has
focused on university students in the United States, and that scale has limitations, as explained above.
Based on existing scales for smartphone addiction, this area of research would benefit from the creation
of a scale for a key demographic; namely, college students in the United States, as well as a thorough
assessment of the resultant scale’s reliability and validity.
Our goal in the present study was to create a smartphone addiction scale for university students in
the United States, where 99% of young adults ages 18-29 own a cellphone, with 96% of those owning a
smartphone (Pew Research Center, 2019), and assess the reliability and validity of the scale. The scale
was created to address many of the aforementioned limitations found in the previous smartphone
addiction scales. First, we created a smartphone addiction scale that could apply to the population in the
U.S. The current scale of choice for smartphone addiction is the Smartphone Addiction Scale (SAS),
which was developed in South Korea (Kwon et al., 2013). Though this scale has been widely used, we
must take into account that what may constitute smartphone addiction in one culture may be different in
another. Due to this, data obtained from international students and recent immigrants to the U.S. were
excluded from our analyses. The United States stands out from other countries in numerous ways. U.S.
residents are considered the most individualistic people in the world (Henrich et al., 2010). In comparison
to other industrialized Western countries specifically, U.S. citizens are also seen as the most optimistic
and patriotic people in the world, but with the highest divorce rate, longest work hours, and lowest
relational focus in work settings (Henrich, Heine, and Norenzayan, 2010).
Second, we created a scale that specifically focuses on smartphone addiction in college students.
The college-educated population in the U.S. differs from the non-college educated population in the U.S.

11
in a number of ways. They score higher on certain aspects of individualism, such as self-actualization,
uniqueness, and locus of control, they are less likely to conform than non-college-educated U.S. citizens,
and their moral reasoning occurs due mostly to autonomy, in comparison to non-college educated citizens
whose moral reasoning is more likely to come from community and divinity (Henrich et al., 2010). U.S.
college students are, in comparison to non-college educated Americans, also more favorable toward other
societal groups, more supportive of racial diversity, and more motivated to explain away negative
intergroup attitudes (Henrich et al., 2010).
Lastly, most of the previous scales established construct validity by assessing only scales
assumed to positively correlate with the new measure, and the focus was on internet addiction. To
establish a scale with an extensive assessment of validity, we examined construct validity using both
similar scales (only one of which ties to internet addiction) and dissimilar scales to converge on our
concept of smartphone addiction. We believed such a thorough examination of construct validity, as well
as measures of reliability, would reveal the usefulness of a measure of smartphone addiction among U.S.
college students.
The creation of this scale had three phases: 1) item construction, 2) factor analysis, and 3)
assessment of the validity and reliability of the scale. Item construction came directly from U.S. college
students rather than a modification of existing scale items. Factor analysis revealed useful items that
remained in the Smartphone Addiction Measure (SAM) as well as identified items that load to specific
subscales. The third and final phase of the scale creation assessed the reliability and validity of the scale.
The current study covers this final phase. We planned to establish validity by assessing the construct
validity of the scale in numerous ways, including measuring several similar and dissimilar constructs. We
also planned to assess the reliability of the scale by using a test-retest design and evaluating Cronbach’s
alpha.
12
We expected to establish construct validity of the SAM through positive correlations with the
Smartphone Addiction Scale (SAS), the Internet Addiction Test (IAT), and the subscales of the Short
Urgency, Premeditation (lack of), Perseverance (lack of), Sensation Seeking, Positive Urgency, Impulsive
Behavior Scale (SUPPS-P). We also expected to establish construct validity of the SAM through negative
correlations with Rotter’s Locus of Control Scale (LOC), the Connectedness to Nature Scale (CNS), and
the Big Five Inventory (BFI), specifically in reference to conscientiousness. Lastly, we aimed to verify
the reliability of the SAM over time through a two-week test-retest design as well as through the use of
Cronbach’s alpha.
13
CHAPTER 2
METHOD
Participants
We used the Georgia Southern University SONA system to recruit participants for this study.
Participants consisted of both male and female students who were eighteen years old or older. Data from
international students and recent immigrants were excluded from our analyses. Students enrolled in any
psychology course were allowed to participate and received SONA credit for their participation.
Item Construction
In the item construction phase, we had 113 university students (32 male, 81 female). The average
age of the students was 20 (SD = 2.20), with a range from 18-31. There were 44 first-year students
(38.9%), 34 second-year students (30.1%), 10 third-year students (8.85%), and 25 fourth-year students
(22.1%) who participated in this phase of the study. The ethnicities of the participants included Caucasian
(59.3%), African American (25.7%), Hispanic (4.42%), and others (10.6%).
Factor Analysis
The factor analysis stage consisted of 286 participants (78 males, 207 females, and 1 other).
Many ethnicities were represented, include Caucasian (55.9%), African American (32.2%), Hispanic
(4.2%), Asian (1%), and other (6.6%). In relation to education level, there were 127 first-year students
(44.4%), 76 second-year students (26.6%), 56 third-year students (19.6%), 24 fourth-year students
(8.4%), and 3 students who were beyond their fourth year (1.0%). The age of the participants ranged from
18 to 44, with a mean age of 19.79 (SD = 2.95).
Validity and Internal Reliability
As demonstrated in Table 2.1 a total of 131 participants (24 males, 103 females, 4 others) were
included in the validation of the SAM. The majority of our sample indicated that their ethnicity was

14
Caucasian (58.8%), however other ethnicities were represented, including African American (19.8%),
Hispanic (6.9%), and Asian (1.5%), and other (13.0%). The majority of participants were first (29.0%)-,
second- (29.8%), or third-year (24.4%) students. The age of participants ranged from 18 to 53, with a
mean age of 21.31 (SD = 5.14).
Table 2.1: Sociodemographic Characteristics and SAM Scores
Variables N % p
Gender Male
Female
Other
24
103
4
18.3%
78.6%
3.1%
.231**
Race
Caucasian
African American
Hispanic
Asian
Other
77
26
9
2
17
58.8%
19.8%
6.9%
1.5%
13%
-.037
Education
1st year
2nd year
3rd year
4th year
Beyond 4th year
38
39
32
14
8
29.0%
29.8%
24.4%
10.7%
6.1%
-.198*
Key: *: p < .05; **: p < .01
Test-Retest Reliability
To identify the reliability of the SAM, a two-week test-retest design was used. Forty-seven
students (10 males, 37 females) completed the test-retest assessment (Table 2). Participants’ ages ranged
from 18 to 45, with an average age of 21.19 (SD = 4.85). The majority indicated their ethnicity to be
Caucasian (76.6%), however other ethnicities were represented, including African Americans (12.8 %),

15
Hispanics (4.3%), and others (6.4%). The majority of participants were first- (29.8%), second- (27.7%),
or third-year (27.7%) students.
Table 2.2: Sociodemographic Characteristics of the Test-Retest Reliability
Variables N %
Gender Male
Female
10
37
21.3%
78.7%
Race
Caucasian
African American
Hispanic
Other
36
6
2
3
76.6%
12.8%
4.3%
6.4%
Education
1st year
2nd year
3rd year
4th year
Beyond 4th year
14
13
13
2
5
29.8%
27.7%
27.7%
4.3%
10.6%
SAM Item Construction
In the first phase of this study, participants answered the following prompt: “In your opinion,
what might cellphone addiction look like? In other words, what kind of behaviors might you see if
someone is addicted to cellphone use? What kind of thoughts might people have if they are addicted to
their cellphone? What feelings might be associated with cellphone addiction?” The responses were
compiled to create 97 items for the SAM. These items were reviewed for redundancy and subsequently
reduced to a total of 75 items.

16
Factor Analysis
In the second phase, we completed exploratory factor analysis on the remaining 75 items. We
began this phase by conducting a Qualtrics survey where students answered each of the items on the
following scale: 1 = Never, 2 = Rarely, 3 = Occasionally, 4 = Often, 5 = Very Often, 6 = Always. In
addition to the scale items, we asked participants to go into their phone settings, navigate to their screen-
time option, and report how much time they spent on social networking, entertainment, productivity, and
gaming over the past 7 days. We also included a seriousness check that stated, “It would be very helpful if
you could tell us at this point whether you have focused on the survey items and taken the survey
seriously. It helps us to know if you were just clicking through the items or carefully responding to the
survey.” Participants could choose one of two answers, “I have taken part in the survey seriously” or "I
have just clicked through, please throw my data away” (modified from Aust et al., 2013). A seriousness
check measure has shown to improve the validity of data (Aust et al., 2013).
After data were collected, we removed all responses from participants who indicated that they did
not take the study seriously then conducted an exploratory factor analysis with varimax rotation. SPSS
identified separate factors with an Eigenvalue of 1.0. 18 factors received an Eigenvalue of 1.0 or above,
but an examination of the scree plot indicated 4 unique factors before the slope flattened considerably.
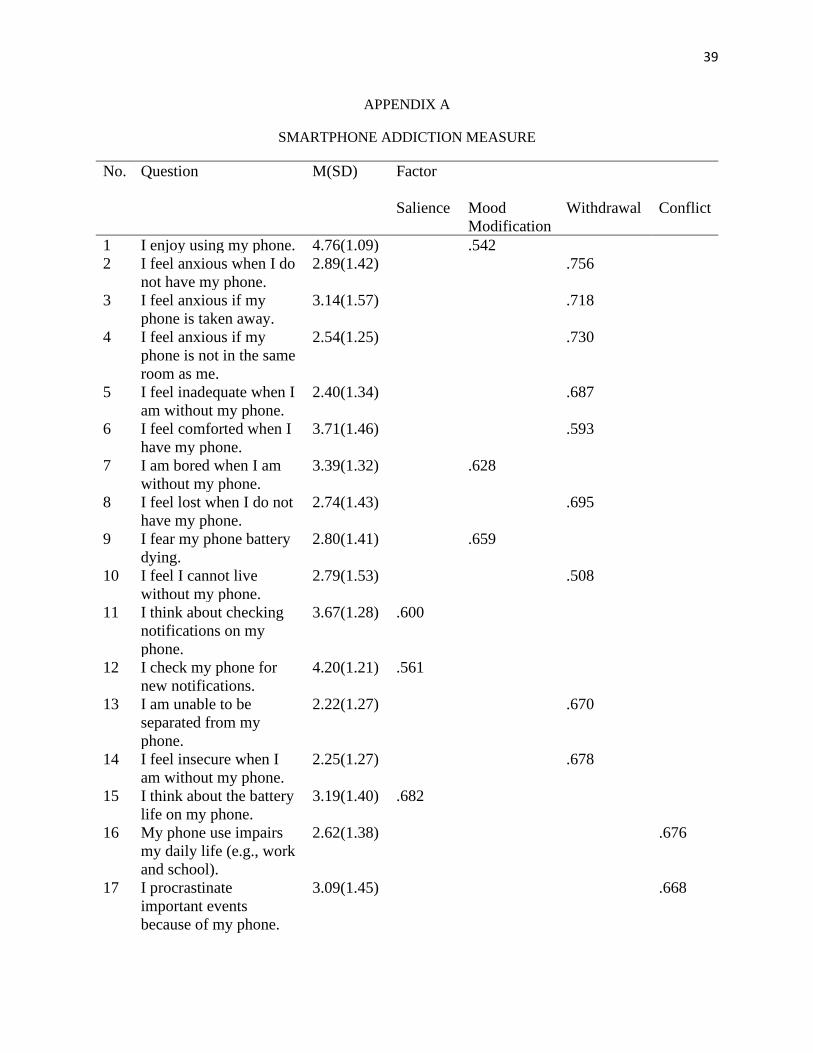
When we examined unique loadings above .50, four key constructs emerged. Closer examination of each
item provided evidence for constructs aligning with addiction components (Griffiths, 1996): withdrawal,
conflict, salience, and mood modification. The entire scale then consisted of 27 items, with 16 items
representing the withdrawal construct, 4 items representing the conflict construct, 4 items representing
salience, and 3 items representing mood modification.
In the third phase of this study the portion associated with the thesis, we assessed both validity and
the reliability of the SAM. Details of this third phase are provided in the following sections.
17
Materials
Smartphone Addiction Measure (SAM). Items for the smartphone addiction scale were generated
from the responses of 113 college students to a prompt asking for their opinion on what constitutes
cellphone addiction. Students were asked what thoughts, behaviors, and feelings they believed
accompany such an addiction. 27 items were created with responses rated on the following scale: 1 =
Never, 2 = Rarely, 3 = Occasionally, 4 = Often, 5 = Very Often, 6 = Always. None of the items were
reverse scored. Please see Appendix A for the SAM.
Validity with Positive Correlations
Smartphone Addiction Scale (SAS; Kwon et al., 2013). To verify the construct validity of the
SAM through a positive correlation with a similar scale, we used the 33-item Smartphone Addiction
scale, with six subscales: daily-life disturbance, positive anticipation, withdrawal, cyberspace-oriented
relationship, overuse, and tolerance. Each item is answered on a Likert-type scale from strongly disagree
(1) to strongly agree (6). None of the items are reversed scored. Each participant’s scores were summed,
with a higher score indicating more smartphone addiction. Please see Appendix B for the SAS.
Internet Addiction Test (IAT; Young, 1998). To establish construct validity using a positive
correlation with a similar scale, we also used the internet addiction test. This is a 20-item scale that
measures internet addiction on the following 5-point Likert-type scale: 0 = Not Applicable 1 = Rarely, 2 =
Occasionally, 3 = Frequently, 4 = Often, 5 = Always. No items are reverse scored. Answers to each item
are summed together with higher totals illustrating more internet addiction. Please see Appendix C for the
IAT.
Short Urgency, Premeditation (lack of), Perseverance (lack of), Sensation Seeking, Positive
Urgency, Impulsive Behavior Scale (SUPPS-P; Cyders et al., 2014). To establish construct validity using
a positive correlation with a similarly related scale, we used the short version of the UPPS-P. This is a 20-
item 4-point Likert-type scale that measures impulsivity and ranges from agree strongly (1) to disagree
18
strongly (4). The SUPPS-P has five subscales with four items on each: negative urgency, lack of
perseverance, lack of premeditation, sensation seeking, and positive urgency. Items 3, 6, 8, 9, 10, 13, 14,
15, 16, 17, 18, and 20 are reversed score items. Scores for each item are averaged together within each
subscale with higher scores indicating higher levels of impulsivity. Please see appendix D for the SUPPS-
P.
Validity with Negative Correlations
Rotter’s LOC Scale (LOC; Rotter, 1966). To assess construct validity using a negative
correlation with a dissimilar scale, we used the LOC scale which measures the extent to which a person
feels in control of life events. This is a 29-item forced-choice questionnaire with 6 filler questions
(questions 1, 8, 14, 19, 24, and 27). Participants’ scores are calculated by summing up the number of
external choices: 2.a, 3.b, 4.b, 5.b, 6.a, 7.a, 9.a, 10.b, 11.b, 12.b, 13.b, 15.b, 16.a, 17.a, 18.a, 20.a, 21. a,
22.b, 23.a, 25.a, 26.b, 28.b, 29.a. A higher score indicates an external locus of control, and a lower score
indicates an internal locus of control. Please see Appendix E for Rotter’s Internal External Control Scale.
Connectedness to Nature Scale (CNS; Mayer & Frantz, 2004). To establish construct validity
with a negative correlation between the SAM and a dissimilar measure, we used the connectedness to
nature scale. We expect that those who are experiencing smartphone addiction lack the ability to be
connected with nature due to their incessant use of their smartphone. The CNS is a 14-item scale that
measures the extent to which participants feel that they are a part of the natural world. Participants answer
the items using a 5-point Likert-type scale from strongly disagree (1) to strongly agree (5). Items 4, 12,
and 14 are reverse scored items. The score is the mean response on the items, with higher scores related
with stronger feelings of connection to nature. Please see appendix F for the CNS.
The Big Five Inventory (BFI; John & Srivastava, 1999). To examine construct validity using a
negative correlation with an unrelated scale, we also utilized the Big Five Inventory. This version of a
Big-Five measure is a 44-item inventory that assesses individuals based on five factors of personality:

19
extraversion, agreeableness, conscientiousness, neuroticism, and openness. Participants answer each
question using a 5-point Likert-type scale from disagree strongly (1) to agree strongly (5). The reverse
scored items for this scale are items 2, 6, 8, 9, 12, 18, 21, 23, 24, 27, 31, 34, 35, 37, 41, and 43. Each
question is associated with a subscale that pertains to one of the five personality factors. The items in each
subscale were averaged, with a higher score indicating a higher level of each personality type. We
focused on the conscientiousness portion of this inventory in our evaluation of construct validity because
those who are experiencing smartphone addiction are expected to report lower self-discipline,
organization efficiency, and deliberation. Please see Appendix G for the BFI.
Procedure
Participants signed up for this study through the university’s SONA system. After signing up for
the study, participants were directed to a Qualtrics survey where they were first asked to provide informed
consent. After providing informed consent, they were asked to complete the aforementioned scales. The
order of presentation of the scales were randomized for each participant. The participants were also asked
to complete the entire questionnaire to the best of their ability. After a period of two weeks, participants
were asked to complete a second survey that contained only the SAM so as to establish reliability through
a test-retest design.
20
CHAPTER 3
RESULTS
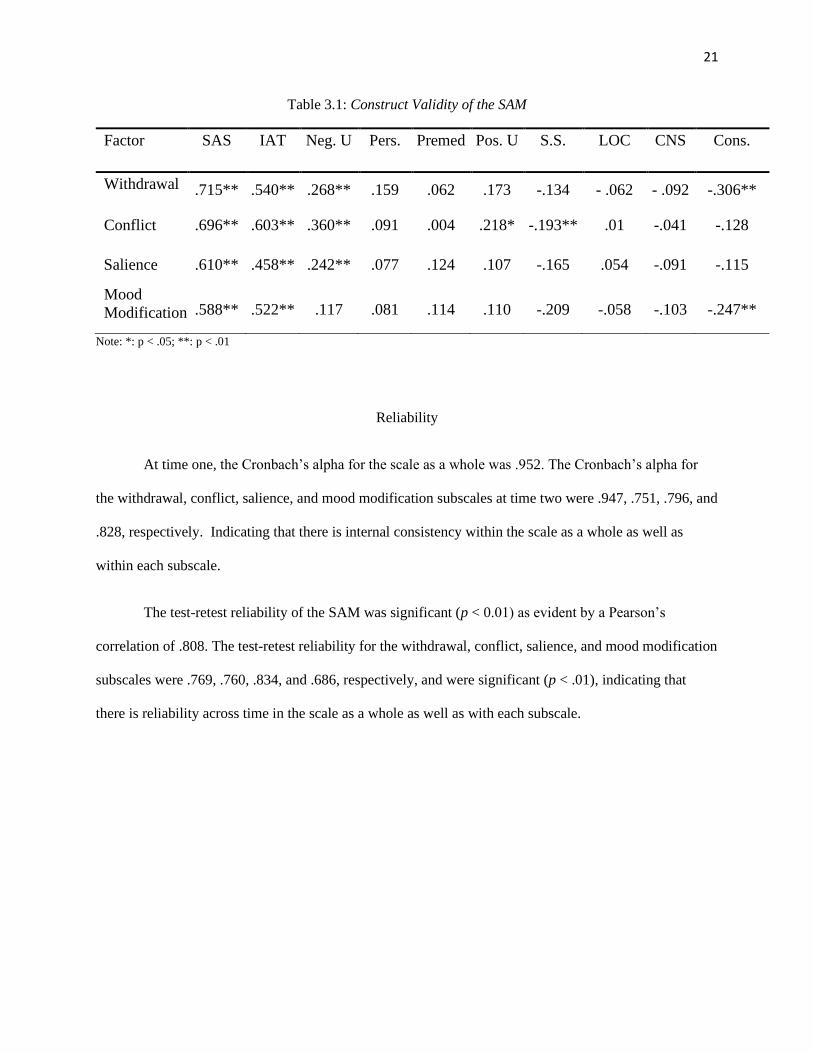
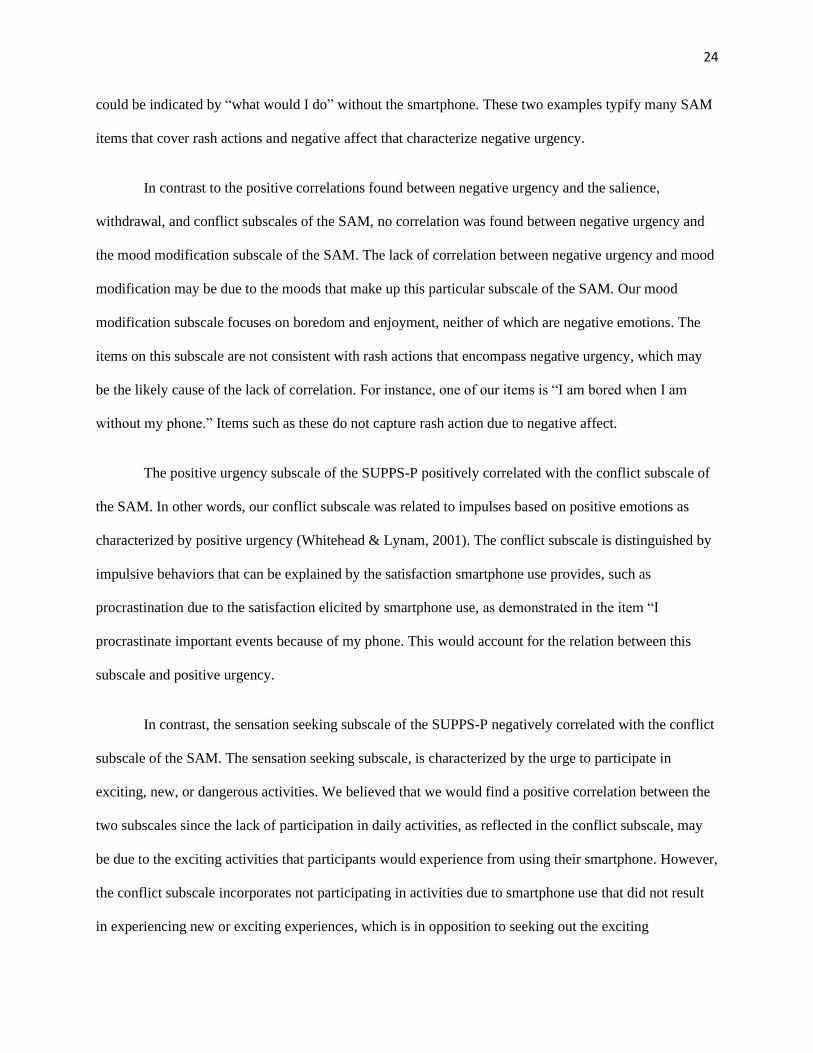
Validity with Positive Correlations
To establish the validity of the SAM, bivariate correlations were conducted between each of the
aforementioned scales (i.e., SAS, IAT, SUPPS-P, LOC, CNS, & BFI) and the subscales of the SAM. As
shown in Table 3.1, there were significant (p < .01) positive correlations between the SAS and each of the
SAM subscales. The data also revealed that there were significant (p < .01) positive correlations between
the IAT and each SAM subscale.
In reference to the SUPPS-P, significant (p < .01) positive correlations were established between
its negative urgency subscale and the SAM’s withdrawal r(126) = .268, conflict r(126) = .360, and
salience subscales r(126) = .242. However, no significant correlation was present between negative
urgency and mood modification r(128) = .117. No significant correlations were present between the
SAM’s subscales and the SUPPS-P’s lack of perseverance and lack of premeditation subscales. There was
a significant (p < .05) positive correlation between positive urgency and conflict, r(127) = .218, but no
other correlations were found between positive urgency and the other subscales. Lastly, sensation seeking
only significantly correlated (p < .01) with conflict, r(128) = -.193.
Validity with Negative Correlations
In reference to the scales that were predicted to have a negative correlation with the SAM, the
LOC and CNS were not found to have any significant correlations with the subscales of the SAM. The
conscientiousness subscale of the BFI also did not correlate with the conflict or salience subscales.
However, conscientiousness was found to have a significant (p < .01) negative correlation with
withdrawal, r(123) = -.306, and mood modification, r(125) = -.247.
21
Table 3.1: Construct Validity of the SAM
Note: *: p < .05; **: p < .01
Reliability
At time one, the Cronbach’s alpha for the scale as a whole was .952. The Cronbach’s alpha for
the withdrawal, conflict, salience, and mood modification subscales at time two were .947, .751, .796, and
.828, respectively. Indicating that there is internal consistency within the scale as a whole as well as
within each subscale.
The test-retest reliability of the SAM was significant (p < 0.01) as evident by a Pearson’s
correlation of .808. The test-retest reliability for the withdrawal, conflict, salience, and mood modification
subscales were .769, .760, .834, and .686, respectively, and were significant (p < .01), indicating that
there is reliability across time in the scale as a whole as well as with each subscale.
Factor SAS IAT Neg. U Pers. Premed Pos. U S.S. LOC CNS Cons.
Withdrawal .715** .540** .268** .159 .062 .173 -.134 - .062 - .092 -.306**
Conflict .696** .603** .360** .091 .004 .218* -.193** .01 -.041 -.128
Salience .610** .458** .242** .077 .124 .107 -.165 .054 -.091 -.115
Mood
Modification .588** .522** .117 .081 .114 .110 -.209 -.058 -.103 -.247**

22
CHAPTER 4
DISCUSSION
We created a smartphone addiction measure (SAM) that would be applicable to college students
in the U.S. This measure was comprised of 27 items representing 4 subscales: salience, mood
modification, withdrawal, and conflict. Interestingly, these subscales parallel four of the six faucets of a
behavioral addiction suggested by Griffiths (1996). The six faucets include: salience, mood modification,
withdrawal, conflict, tolerance, and relapse. According to Griffiths, salience means that the addictive
behavior becomes the most important focus of the person’s life, leading to its domination of thoughts,
feelings, and behavior. Mood modification is the subjective experiences (e.g., feeling a buzz or high)
caused by the addictive behavior and can be a coping mechanism. Withdrawal encompasses the
unpleasant feelings or physical effects caused the removal or reduction of the addictive behavior. Conflict
is characterized by the addictive behavior being the cause of conflicts both between the individual and
others as well as within the individual. Tolerance is when the amount of time spent on the behavior
continually increases to achieve former effects. Lastly, relapse is the tendency to readily return to the
previously addictive behavior after the absence of it for many years.
With the exceptions of tolerance and relapse, the components of behavioral addiction as
suggested by Griffiths (1996) are applicable to smartphone addiction. The salience component involves a
smartphone becoming the most important focus in life and thus use of the smartphone dominates the
thoughts, feelings, and behavior of the individual. Mood modification entails subjective experiences due
to smartphone use, such as increased enjoyment as addressed in the SAM. The withdrawal component is
characterized by unpleasant feelings, such as anxiety, worry, and irritability, that occur when one is
without a smartphone or usage is restricted. Lastly, conflict consists of interpersonal conflict, such as
being unable to interact with others, and intrapsychic conflict, such as impairments in daily functioning,
due to smartphone use.

23
Validity with Positive Correlations
The presence of four established addiction components speaks to the validity of the SAM as a
measure of addiction. We formally established the construct validity of the SAM through positive
correlations with the SAS, the IAT, and each of the subscales in the SUPPS-P.
Theoretically, the SAS and IAT should be related to the SAM because they measure similar
constructs; the SAS measures smartphone addiction, and the IAT measures internet addiction. As
hypothesized, we found strong positive correlations between each of the SAMs subscales and the SAS
and IAT, thus providing support for construct validity.
As a final series of construct-validity measures seeking positive correlations with the SAM, we
used the SUPPS-P. Recall that this assessment contains 5 subscales: negative urgency, lack of
perseverance, lack of premeditation, sensation seeking, and positive urgency. Because impulsivity has
been considered a core feature of addiction (Kim et al., 2016), we believed that the different aspects of
impulsivity, as provided by the SUPPS-P, would also positively correlate with the SAM and thus provide
additional support for construct validity, however that was not the case with all of the subscales.
The negative urgency subscale of the SUPPS-P had a positive correlation with the salience,
withdrawal, and conflict subscales of the SAM. Negative urgency reflects impulsive or rash actions as a
consequence of negative affect (Whiteside & Lynam, 2001). The most likely reason that these three
subscales were found to be positively associated with negative urgency is because they incorporate rash
actions and negative affect. For example, one of the items on the salience subscale is “I check my phone
for new notifications.” We can assume that a person with smartphone addiction would indicate either
“very often” or “always” as their answer choice for this item, thus reflecting a rash or impulsive action.
Another example would be the item on the withdrawal subscale that states: “I worry about what I would
do if I could not use my phone.” Negative affect is covered by the worry aspect, and possible rash actions
24
could be indicated by “what would I do” without the smartphone. These two examples typify many SAM
items that cover rash actions and negative affect that characterize negative urgency.
In contrast to the positive correlations found between negative urgency and the salience,
withdrawal, and conflict subscales of the SAM, no correlation was found between negative urgency and
the mood modification subscale of the SAM. The lack of correlation between negative urgency and mood
modification may be due to the moods that make up this particular subscale of the SAM. Our mood
modification subscale focuses on boredom and enjoyment, neither of which are negative emotions. The
items on this subscale are not consistent with rash actions that encompass negative urgency, which may
be the likely cause of the lack of correlation. For instance, one of our items is “I am bored when I am
without my phone.” Items such as these do not capture rash action due to negative affect.
The positive urgency subscale of the SUPPS-P positively correlated with the conflict subscale of
the SAM. In other words, our conflict subscale was related to impulses based on positive emotions as
characterized by positive urgency (Whitehead & Lynam, 2001). The conflict subscale is distinguished by
impulsive behaviors that can be explained by the satisfaction smartphone use provides, such as
procrastination due to the satisfaction elicited by smartphone use, as demonstrated in the item “I
procrastinate important events because of my phone. This would account for the relation between this
subscale and positive urgency.
In contrast, the sensation seeking subscale of the SUPPS-P negatively correlated with the conflict
subscale of the SAM. The sensation seeking subscale, is characterized by the urge to participate in
exciting, new, or dangerous activities. We believed that we would find a positive correlation between the
two subscales since the lack of participation in daily activities, as reflected in the conflict subscale, may
be due to the exciting activities that participants would experience from using their smartphone. However,
the conflict subscale incorporates not participating in activities due to smartphone use that did not result
in experiencing new or exciting experiences, which is in opposition to seeking out the exciting
25
experiences as comprised in sensation seeking, thus accounting for the negative relationship between the
two scales.
The correlations found between the subscales of both the SAM and the SUPPS-P suggests that
there are certain aspects of impulsivity that have a relationship, whether positive or negative, with
smartphone addiction, while others do not. For instance, the conflict subscale of the SAM showed
significant correlations with three of the five SUPPS-P subscales, whereas the mood modification
subscale was not correlated with any of them. Previous studies have found that there is a positive
correlation between smartphone use and impulsivity, however it has been noted that such studies are scant
and have been conducted in Asian countries, which calls into question the generalizability to western
cultures (Peterka-Bonetta, 2019). It is important to point out that the generalizability of eastern cultures to
a western culture was one of the reasons that we proposed the creation of the SAM. Therefore, it is
possible that the differences between cultures may account for the lack of adequate correlations between
the SAM and the SUPPS-P. Also, the previous study used the short form of the Barratt Impulsivity Scale
15 to measure impulsivity; a difference in the measurements used in each study may help account for the
lack of consistent correlations (Peterka-Bonetta, 2019).
Validation with Negative Correlations
We believed that we would find a negative correlation between the SAM and the LOC, CNS, and
the conscientiousness subscale of the BFI. However, a significant correlation was not found between the
SAM subscales and the LOC. A possible explanation for this may be that, as indicated by previous
research, both an internal and external locus of control can lead to increased phone use (Li et al., 2015).
Those with an internal locus of control increase phone use because they believe that they can strategically
use the device to their advantage, such as for data management or scheduling, which may allow them to
better control their lives. In contrast, those with an external locus of control may use their phone often to
reach out to others using calls, texting, and social media. Therefore, smartphone addiction and locus of
26
control may not be associated since both types of control can lead to the same amount of phone use but
for different reasons.
We predicted that we would find a negative correlation between the SAM subscales and the
connection with nature (i.e., the CNS); however, our results did not support our hypothesis. The research
on the relationship between smartphone addiction and connectedness with nature is sparse. One study
found that there is a negative correlation between connection with nature and problematic smartphone
use, although the authors did not elaborate on what that connection entailed (Richardson, Hussain, &
Griffiths, 2018). The CNS addresses one’s affective, experiential connection to nature (Mayer & Frantz,
2004). We believed that a person with smartphone addiction would lack this affective connection because
of their excessive use of, and connectedness to, smartphones. Focus on phones was expected to reduce
interaction with the external world, including natural surroundings. However, given the many functions of
a smartphone (e.g., a camera), it is possible that people use smartphones to enjoy nature, such as taking
pictures while they experience nature (e.g., hiking or going to the beach) or watching videos about aspects
of nature, which could influence an individual’s thoughts, feelings, and behaviors toward smartphone use
as addressed by the SAM.
Finally, we predicted a negative correlation between subscales of the SAM and the
conscientiousness subscale of the BFI. In fact, we did find significant negative correlations between
conscientiousness and the mood modification and withdrawal subscales of the SAM. Conscientiousness is
comprised of the abilities to be self-controlled, hardworking, orderly, rule abiding, and responsible to
others (Roberts et al., 2014a). Hence, it is readily apparent why conscientiousness is negatively correlated
with withdrawal and mood modification. A person with smartphone addiction who is experiencing
withdrawal or mood modification in accordance with the SAM would have thoughts, feelings, and
behaviors determined by their use, or lack thereof, of a smartphone. Such negative experiences would
correlate with a lack of self-control, responsibility to others, and orderliness as characterized by
conscientiousness.
27
Additionally, we expected that conscientiousness would be negatively correlated with the salience
and conflict subscales of the SAM. However, we did not find significant correlations between
conscientiousness and these two subscales. One explanation would be that each of these subscales did not
address all aspects of conscientiousness. The salience items do cover lack of self-control (e.g., checking
notification) and the conflict items do address lack of hard work (e.g., impairment of daily life), but they
are each only addressing one aspect of conscientiousness which may not have been sufficient to establish
the correlation that we had predicted with an overall measure of conscientiousness.
Reliability
In addition to measures of potential validity, the reliability of the SAM was evaluated. First, we
looked at the internal reliability of the scale through the use of Cronbach’s alpha. Internal reliability, also
known as internal consistency, is the extent to which all items in a scale measure the same concept
(Tavakol & Dennick, 2011). An acceptable alpha typically lies within the range of 0.70 to 0.95. As a
whole, the SAM had an alpha of .967, and the subscales had Cronbach’s alphas ranging from 0.751 to
0.952. This means that each item in the SAM, as well as each of the subscales, converge well on a single
construct. From these data we can see that the SAM shows strong internal consistency.
As a second measure of reliability, we used a two-week test-retest design to determine the
reliability of the scale over time. Although a true standard does not exist, a test-retest coefficient of 0.80
or higher has been recommended for good reliability, and .70 has been deemed acceptable (Polit, 2014).
For the SAM as a whole, and each of its subscales independently, the test-retest reliability can be deemed
consistent across time. Thus, the SAM is a dependable measure that captures a consistent assessment of
smartphone addiction. We can rely on the SAM to measure the same constructs across time.
28
Potential Limitations
The limitations of this study must be taken into account when interpreting these results. First, the
sample was fairly small with only 133 participants, and of those, only 47 completed the retest portion of
the study. It is suggested that at least 200 participants should be tested when initially assessing the
validity and reliability of a psychometric measurement, such as the SAM (Frost et al., 2007).
Second, the gender ratio was highly disproportionate throughout all three phases of this research.
There were 103 females (76%), which is more than four times the proportion of male participants (24,
17.8%). The authors of the SAS (Kwon et al. 2013a) also mentioned their gender ratio to be a limitation
since there were twice as many women as men when they validated their scale, thus allowing for a
possible gender difference error. The differences in smartphone use and, in turn, smartphone addiction
between the genders must be evaluated to account for this possible error.
Lastly, we had the limitation of using a convenience sample. Convenience sampling occurs when
researchers choose to use the sample most readily available to them (Etikan et al., 2016). Convenience
sampling is more likely to be biased as well as highly susceptible to outliers. In our case, our sample only
included students from one university because that was the easiest sample to obtain. This makes us more
susceptible to possible bias due to various factors, including the location of the university, the
predominant ethnicity of students, and acceptance standards (e.g., standardized test scores, grades in high
schools, etc.). Additionally, there is a higher susceptibility to outliers, such as age, in convenience
samples. In our study we had a 53-year-old participant that may be considered a possible outlier. Only
79% of U.S. adults in the age range of 50-64 own a smartphone in comparison to the 96% of young adults
who own a smartphone (Pew Research Center, 2019). We also encounter the issue of there being much
research on college students (e.g., Acharya et al., 2013, Carbonall et al., 2018, Lepp et al., 2015, Roberts
et al., 2014b, etc.) and the elderly, those who are 60 or more years old (e.g., Hwangbo et al., 2016,
29
McGaughey et al., 2013), but little research focuses on middle adulthood. Therefore, we cannot control
for a potential age-difference error.
Despite these limitations, this research has proposed a new diagnostic tool for the measurement of
smartphone addiction among U.S. college students. Future research will need to further evaluate the
construct validity of the SAM using other dissimilar measures than the ones presented here, since most of
our hypothesized negative correlations were not supported. Another option would be changing the scale
used for a particular factor of interest, such as a different scale to measure impulsivity, since there may be
better measures (e.g., Barratt Impulsivity Scale 15) to assess this association. Additionally, it would be
beneficial for future researchers to evaluate the generalizability of the SAM to other populations across
the U.S. since item construction and validation of the scale all took place at only one university, which
may lack the necessary diversity for the creation of a new behavioral measurement instrument.
30
CHAPTER 5
CONCLUSION
In conclusion, this study provided a new smartphone addiction measurement tool that may allow
for a way to clinically diagnosis addiction among college students. The SAM does address four of the six
behavioral addiction criteria suggested by Griffiths (1996). Behavioral addictions, besides gambling
addiction, have been consistently overlooked by reputable sources, such as any version of the DSM. The
lack of recognition of behavioral addictions, including smartphone addiction, hinders progress in
establishing treatment regimens to alleviate addictive symptoms. Smartphone addiction is detrimental,
especially in young adults, in so many aspects of life, including health (Acharya et al., 2013), academics
(Bjorsen &Archer, 2015), and driving (Bradish et al., 2019).
Having a measurement to diagnosis smartphone addiction in the college population can be useful
in various ways. The subscales of the SAM address four of the six suggested behavioral addiction criteria:
withdrawal, conflict, salience, and mood modification. The association of these criteria to smartphone
addiction gives us clearer insight into what components could be further evaluated. For instance, the SAM
could be used to help evaluate the interpersonal interactions of those with smartphone addiction since the
SAM addresses conflict. Further, the SAM addresses withdrawal, which lends support for using it to
evaluate the unpleasant feelings, such as anxiety, worry, and irritability, that occur due to the reduction of
or inability to use a smartphone.
Beyond applications of the SAM based on its subscales, it could also be used in a broader
research setting to evaluate possible relationships between smartphone addiction and other observed
behaviors or consequences, such as car accidents, reduced work ethic, and the degeneration of academic
accomplishments. Additionally, the SAM could be used in a clinical setting to help diagnosis students and
create treatment regimens to lessen or remove the addictive behaviors, thus allowing for possible
improvements in their quality of life and daily functioning. This measurement provides a specific

31
evaluation of an at-risk population: U.S. college students – a population of young adults who would
benefit from intervention.

32
REFERENCES
Acharya, J. P., Acharya, I., & Waghrey, D. (2013). A study on some of the common health effects of cell-
phones amongst college students. Journal of Community Medicine & Health Education, 3(4), 1-4.
https://doi.org/10.4172/2161-0711.1000214.
Al-Barashdi, H. S., Bouazza, A., & Zubaidi, A. A. (2014). Psychometric properties of Smartphone
Addiction Questionnaire (SPAQ) among Sulton Qaboos University undergraduate students.
Journal of Educational and Psychological Studies, 8(4), 637-
644. https://doi.org/10.24200/jeps.vol8iss4pp637-644
American Psychiatric Association. (2013). Diagnostic and Statistical Manual of Mental Disorders (DSM-
5). 5th ed. Washington, DC: American Psychiatric Association Publishing
American Society of Addiction Medicine. (2011). Public Policy Statement: Definition of Addiction Short.
American Society of Addiction medicine, 1-8.
Aust, F., Diedenhofen, B., Ullrich, S., & Musch, J. (2013). Seriousness checks are useful to improve data
validity in online research. Behavior Research Methods, 45(2), 527-535.
https://doi.org/10.3758/s13428-012-0265-2.
Bjornsen, C. A., & Archer, K. J. (2015). Relations between college students’ cellphone use during class
and grades. Scholarship of Teaching and Learning in Psychology, 1(4), 326-336.
https://doi.org/10.1037/stl0000045
Black, D. W. (2013). Behavioural addictions as a way to classify behaviours. The Canadian Journal of
Psychiatry, 58(5), 249-251. https://doi.org/10.1177/070674371305800501
Bradish, T, Wilson, J. H., & Locker, L. (2019). Hands-free law in Georgia: Predictors of post-law
cellphone use among college drivers. Transportation Research Part F, 66, 226-233.
https://doi.org/10.1016/j.trf.2019.09.007

33
Carbonell, X., Chamarro, A., Oberst, U., Rodrigo, B., & Prades, M. (2018). Problematic use of the
internet and smartphones in university students: 2006-2017. International Journal of
Environmental Research and Public Health, 15(3):457, 1-13.
https://doi.org/10.3390/ijerph15030475
Chak, K., & Leung, L. (2004). Shyness and locus of control as predictors of internet addiction and
internet use. CyberPsychology & Behavior, 7(5), 559-570. https://doi.org/10.1089/cpb.2004.7.559
Crowne, D. P., & Marlowe, D. (1960). A New Scale of Social Desirability Independent of
Psychopathology. Journal of Consulting Psychology, 24(4), 349-354.
https://doi.org/10.1037/h0047358
Cyders, M. A., Littlefield, A. K., Coffey, S., & Karyadi, K. A. (2014). Examination of a short versión of
the UPPS-P Impulsive Behavior Scale. Addictive Behaviors, 39(9), 1372-1376.
https://doi.org/10.1016/j.addbeh.2014.02.013
De-Sola Gutiérrez, J., Rodríguez de Fonseca, F., & Rubio, G. (2016). Cell-Phone Addiction: A Review.
Frontiers in Psychiatry, 7(175), 1-15. https://doi.org/10.3389/fpsyt.2016.00175
Elhai, J. D., Levine, J. C., Alghraibeh, A. M., Alafnan, A. A., Aldraiweesh A. A., & Hall, B. J. (2018).
Fear of missing out: Testing relationships with negative affectivity, online social engagement, and
problematic smartphone use. Computers in Human Behavior, 89, 289-298.
https://doi.org/10.1016/j.chb.2018.08.020
Etikan, I., Musa, S. A., & Alkassim, R. S. (2016). Comparison of convenience sampling and purposive
sampling. American Journal of Theoretical and Applied Statistics, 5(1), 1-4.
https://doi.org/10.11648/j.ajtas.20160501.11
Fossum, I. N., Nordnes, L. T., & Storemark, S. S. (2014). The association between use of electronic
media in bed before going to sleep and insomnia symptoms, daytime sleepiness, morningness,
and chronotype. Behavioral Sleep Medicine, 12, 343-357.
https://doi.org/10.1080/15402002.2013.819468

34
Frost, M. H., Reeve, B. B., Liepa, A. M., Stauffer, J. W., Hays, R. D., & the Mayo/FDA Patient-Reported
Outcomes Consensus Meeting Group. (2007). What is sufficient evidence for the reliability and
validity of patient-reporting outcome measures?. Value in Health, 10(2), S94-S105.
https://doi.org/10.1111/j.1524-4733.2007.00272.x
Griffiths, M. (1996). Nicotine, tobacco and addiction. Nature International Journal of Science,
384(6604), 18. https://doi.org/10.1038/384018a0
Hajela, R., & Love, T. (2017). Addiction beyond substances—what’s up with the DSM? Sexual Addiction
& Compulsivity, 24(1-2), 11-22. https://doi.org/10.1080/10720162.2017.1306468
Henrich, J., Heine, S. J., & Norenzayan,A. (2010). The weirdest people in the world? Behavioral and
Brain Science, 33, 61-135. https://doi.org/10.1017/S0140525X0999152X
Holst, A. (2018). Smartphones in the U.S. - Statistics & Facts. Statista. Retrieved from
https://www.statista.com/topics/2711/us-smartphone-market/
Hwangbo, H., Yoon, S. H., Jin, B. S., Han, Y. S., & Ji, Y. G. (2013). A study of pointing performance of
elderly users on smartphones. International Journal of Human-Computer Interaction, 29, 604-
618. https://doi.org/10.1080/10447318.2012.729996
Jacobsen, W. C., & Forste, R. (2011). The wired generation: Academic and social outcomes of electronic
media use among university students. Cyberpsychology, Behavior and Social Networking, 14(5),
275-80. https://doi.org/10.1089/cyber.2010.0135
Jenaro, C., Flores, N., Gomez-Vela, M., Gonzalez-Gil, F., & Caballo, C. (2007) Problematic internet and
cell-phone use: Psychological, behavioral, and health correlates. Addiction Research and Theory,
15(3), 309-320. https://doi.org/10.1080/16066350701350247
35
John, O. P., & Srivastava, S. (1999). The Big-Five trait taxonomy: History, measurement, and theoretical
perspectives. In L. A. Pervin & O. P. John (Eds.), Handbook of personality: Theory and research
(Vol. 2, pp. 102–138). New York: Guilford Press.
Kim, Y., Jeong, J-E., Cho, H., Jung, D-J., Kwak, M., Rho, M.J., Yu, H., Kim, D-J., &Choi, I. Y. (2016)
Personality Factors Predicting Smartphone Addiction Predisposition: Behavioral Inhibition and
Activation Systems, Impulsivity, and Self-Control. PLoS ONE, 11(8), 1-15.
https://doi.org/10.1371/journal.pone.0159788
Kwon, M., Lee, J., Won, W., Park, J., Min, J., Hahn, C., Gu, X., Choi, J., & Kim, D. (2013).
Development and Validation of a Smartphone Addiction Scale (SAS). PLOS One, 8(2), 1-7.
https://doi.org/10.1371/journal.pone.0056936.
Lambert, C. E., Spencer, S. A., & Holden, R. R. (2016). The Marlowe-Crowne Social Desirability Scale
outperforms Impression Management Scale for identifying fakers. Journal of Research in
Personality, 61, 80-86. https://doi.org/10.1016/j.jrp.2016.02.004
Lepp, A., Barkley, J. E., & Karpinski, A. C. (2015). The relationship between cellphone use and academic
performance in a sample of U.S. college students. SAGE Open, 1-9.
https://doi.org/10.1177/2158244015573169c
Lepp, A., Barkley, J., & Karpinski, A. C. (2014). The relationship between cellphone use, academic
performance, anxiety, and Satisfaction with Life in college students. Computers in Human
Behavior. 31, 343-350. https://doi.org/10.1016/j.chb.2013.10.049
Li, L., Lepp, A., & Barkley, J. E. (2015). Locus of Control and Cell Phone Use: Implications for Sleep
Quality, Academic Performance, and Subjective Well-Being. Computers in Human Behavior, 52,
450-457. https://doi.org/10.1016/j.chb.2015.06.021
Lin, Y., Chang, L., Lee, Y., Tseng, H., Kuo, T. B. J., & Chen, S. (2014). Development and validation of
the smartphone addiction inventory (SPAI). PLoS ONE, 9(6), 1-5.
https://doi.org/10.1371/journal.pone.0098312
36
Liu, C., & Ma, J. (2018). Social support through online social networking sites and addiction among
college students: The mediating roles of fear of missing out and problematic smartphone use.
Current Psychology, 1-8. https://doi.org/10.1007/s12144-018-0075-5
Lopez-Fernandez, O. & Kuss, D., Romo, L., Morvan, Y., Kern, L., Graziani, P., Rousseau, A. Rumpf,
H., Bischof, A., Gässler, A., Schimmenti, A., Passanisi, A., Männikkö, N., Kääriäinen, M.,
Demetrovics, Z., Király, O., Chóliz, M., Zacarés, J., Serra, E., Griffiths, M.D., Pontes, H.M.,
Lelpnek-Kuleta, B., Chwaszcz, J., Zullino, D., Rochat, L., Achab, S., & Billieux, Joel. (2017).
Self-Reported Dependence on Mobile Phones in Young Adults: A European Cross-Cultural
Empirical Survey. Journal of Behavioral Addictions, 6, 168-177.
https://doi.org/10.1556/2006.6.2017.020.
Mayer, F. S. & Frantz, C. M. (2004). The connectedness to nature scale: A measure of individuals’
feeling in community with nature. Journal of Environmental Psychology, 24, 503-515.
https://doi.org/10.1016/j.jenvp.2004.10.001
McGaughey, R. E., Zeltmann, S. M., & McMurtey, M. E. (2013). Motivations and obstacles to
smartphone use by the elderly: developing a research framework. International Journal of
Electronic Finance, 7(3/4), 177-195. https://doi.org/10.1504/IJEF.2013.058601
Nehra, R., Kate, N., Grover, S., Khehra, N., & Basu, D. (2012). Does the excessive use of mobile phones
in young adults reflect an emerging behavioral addiction? J Postgrad Med Edu Res, 46(4), 177-
182. https://doi.org/10.5005/jp-journals-10028-1040.
Nickerson, R.C., Isaac, H., & Mak, B. (2008). A multi-national study of attitudes about mobile phone use
in social settings. International Journal of Mobile Communications, 6(5), 541-563.
https://doi.org/10.1504/IJMC.2008.019321.
Peterka-Bonetta, J., Sindermann, C., Elhai, J. D., & Montag, C. (2019). Personality associations with
smartphone and internet use disorder: A comparison study including links to impulsivity and
37
social anxiety. Frontiers in Public Health, 7(127), 1-12.
https://doi.org,10.33899.fpubh.2019.00127
Pew Research Center. (2019). Mobile Fact Sheet. Retrieved from https://www.pewinternet.org/fact-
sheet/mobile/
Polit, D. F. (2014). Getting serious about test-retest reliability: a critique of retest research and some
recommendations. Quality of Life Research, 23, 1713-1720. https://doi.org/10.007/s11136-014-
0632-9
Richardson, M., Hussain, Z., & Griffiths, M. D. (2018). Problematic smartphone use, nature
connectedness, and anxiety. Journal of Behavioral Addictions, 7(1), 109-116.
https://doi.org/10.1556/206.7.2018.10
Roberts, B.W., Lejuez, C., Krueger, R. F., Richards, J. M., & Hill, P.L. (2014a). What is
conscientiousness and how can it be assessed?. Developmental Psychology, 50(5), 1315-1330.
https://doi.org/10.1037/a0031109
Roberts, J. A., Yaya, L. H. P., & Manolis, C. (2014b). The invisible addiction: Cell-phone activities and
addiction among male and female college students. Journal of Behavioral Addictions, 3(4), 254-
265. https://doi.org/10.1556/JBA.3.2014.015
Rotter, J. B. (1966). Generalized Expectancies for internal versus external control of reinforcement.
Psychological Monographs: General and Applied, 80(1), 1-28. https://doi.org/10.1037/h0092976
Rozgonjuk, D., Rosenvald, V., Janno, S., & Täht, K. (2016) Developing a shorter version of the Estonian
smartphone proneness scale (E-SAPS18). Cyberpsychology: Journal of Psychosocial Research
on Cyberspace, 10(4), article 4. https://doi.org/10.5817/CP2016-4-4
Smetaniuk, P. A preliminary investigation into the prevalence and prediction of problematic cell phone
use. Journal of Behavioral Addictions, 3(1), 41-53. https://doi.org/10.1556/JBA.3.2014.004
38
Smith, A. (2011). 35% of American adults own a smartphone. Pew Research Center.
http://pewinternet.org/Reports/2011/Smartphones.aspx
Taneja, C. (2014). The psychology of excessive cellular phone use. Delhi Psychiatry Journal, 17(2), 448-
451.
Tavakol, M., & Dennick, R. (2011). Making sense of Cronbach’s alpha. International Journal of Medical
Education, 2, 53-55. https://doi.org/10.5116/ijme.4dfb.8dfd
Tossell, C., Kortum, P., Shepard, C., Rahmati, A., & Zhong, L. (2015). Exploring smartphone addiction:
insights from long-term telemetric behavioral measures. International Journal of Interactive
Mobile Technolgies, 9(2), 37-43. https://doi.org/10.3991/ijim.v9i2.4300
Verma, R. K., Rajiah, K., Cheang, C., & Barua, A. (2014). Textaphrenia: An emerging silent pandemic.
African Journal of Psychiatry, 17, 510-511. http://dx.doi.org/10.4172/1994-8220.1000e103
Whiteside, S.O., & Lynam, D. R. (2001). The Five Factor Model and impulsivity: using a structural
model of personality to understand impulsivity. Personality and Individual Differences, 30(4),
669-689. https://doi.org/10.1016/S0191-8869(00)00064-7
Wolniewicz, C. A., Tiamiyu, M. F., Weeks, J. W., & Elhai, J. D. (2018). Problematic smartphone use and
relations with negative affect, fear of missing out, and fear of negative and positive evaluation.
Psychiatry Research, 262, 618-623, https://doi.org/10.1016/j.psychres.2017.09.058
Young, K. S. (1998). Internet addiction: The emergence of a new clinic disorder. Cyberpsychology and
Behavior, 1(3), 237-244. https://doi.org/10.1089/cpb.1998.1.237
39
APPENDIX A
SMARTPHONE ADDICTION MEASURE
No. Question M(SD) Factor
Salience Mood
Modification
Withdrawal Conflict
1 I enjoy using my phone. 4.76(1.09) .542
2 I feel anxious when I do
not have my phone.
2.89(1.42) .756
3 I feel anxious if my
phone is taken away.
3.14(1.57) .718
4 I feel anxious if my
phone is not in the same
room as me.
2.54(1.25) .730
5 I feel inadequate when I
am without my phone.
2.40(1.34) .687
6 I feel comforted when I
have my phone.
3.71(1.46) .593
7 I am bored when I am
without my phone.
3.39(1.32) .628
8 I feel lost when I do not
have my phone.
2.74(1.43) .695
9 I fear my phone battery
dying.
2.80(1.41) .659
10 I feel I cannot live
without my phone.
2.79(1.53) .508
11 I think about checking
notifications on my
phone.
3.67(1.28) .600
12 I check my phone for
new notifications.
4.20(1.21) .561
13 I am unable to be
separated from my
phone.
2.22(1.27) .670
14 I feel insecure when I
am without my phone.
2.25(1.27) .678
15 I think about the battery
life on my phone.
3.19(1.40) .682
16 My phone use impairs
my daily life (e.g., work
and school).
2.62(1.38) .676
17 I procrastinate
important events
because of my phone.
3.09(1.45) .668

40
18 I am unable to interact
with others while using
my phone.
2.07(1.07) .645
19 I feel irritable when I do
not have my phone.
2.39(1.27) .619
20 I feel a loss of power
when I do not have my
phone.
2.38(1.34) .636
21 I worry about what I
would do if I could not
use my phone.
2.42(1.28) .520
22 I do not accomplish
what I should when I
am at work, school, or
home because of my
phone.
2.61(1.27) .761
23 I would panic if I did
not have my phone.
4.49(2.06) .637
24 I would feel anxious if I
was without my phone.
4.56(1.94) .758
25 I would be afraid that I
am missing out if I was
without my phone.
4.31(1.88) .505
26 I would be bored if I did
not have my phone.
5.38(1.68) .731
27 I would feel anxious if
my phone was not in the
same room as me.
4.31(1.89) .666

41
APPENDIX B
SMARTPHONE ADDICTION SCALE
Instructions: Indicate the degree to which you agree with the following using this scale: 1 = strongly
disagree, 2 = disagree, 3 = weakly disagree, 4 = weakly agree, 5 = agree, 6 = strongly agree.
1. Missing planned work due to smartphone use
2. Having a hard time concentrating in class, while doing assignments, or while working due to
smartphone use
3. Experiencing lightheadedness or blurred vision due to excessive smartphone use
4. Feeling pain in the wrists or at the back of the neck while using a smartphone
5. Feeling tired and lacking adequate sleep due to excessive smartphone use
6. Feeling calm or cozy while using a smartphone
7. Feeling pleasant or excited while using a smartphone
8. Feeling confident while using a smartphone
9. Being able to get rid of stress with a smartphone
10. There is nothing more fun to do than using my smartphone.
11. My life would be empty without my smartphone.
12. Feeling most liberal while using a smartphone
13. Using a smartphone is the most fun thing to do.
14. Won’t be able to stand not having a smartphone
15. Feeling impatient and fretful when I am not holding my smartphone
16. Having my smartphone in my mind even when I’m not using it
17. I will never give up using my smartphone even when my daily life is already greatly affected by it.
18. Getting irritated when bothered while using my smartphone
19. Bringing my smartphone to the toilet even when I am in a hurry to get there
20. Feeling great meeting more people via smartphone use
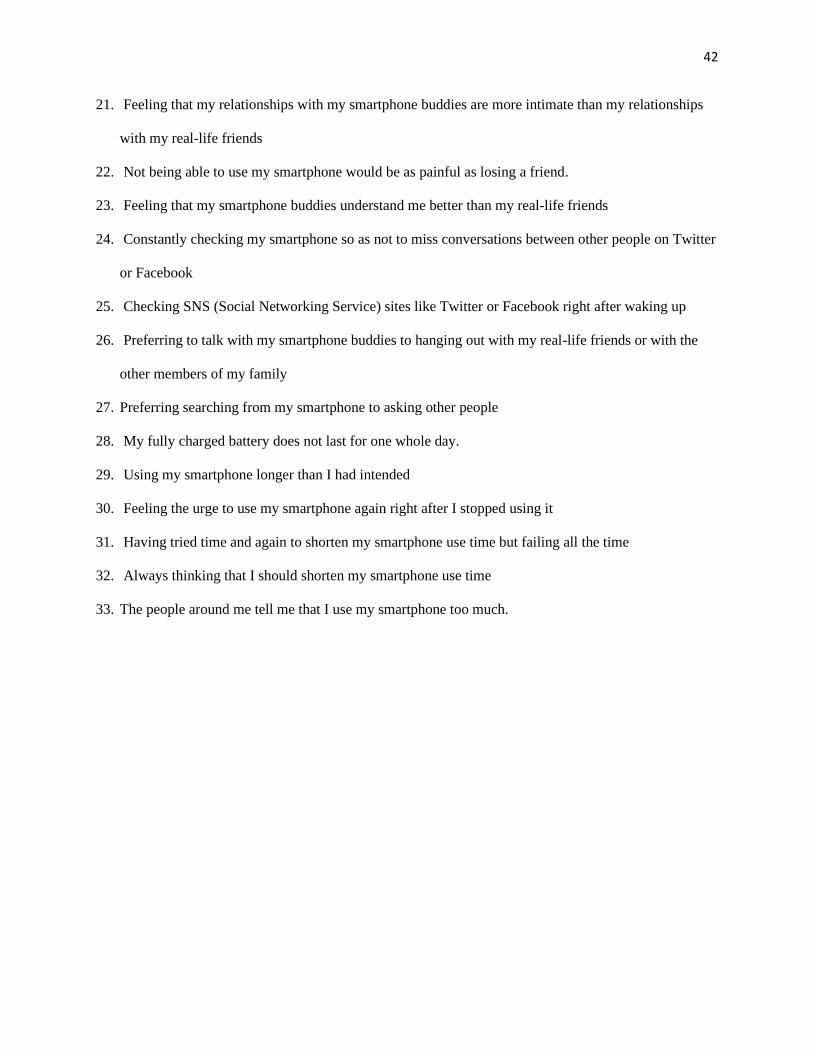
42
21. Feeling that my relationships with my smartphone buddies are more intimate than my relationships
with my real-life friends
22. Not being able to use my smartphone would be as painful as losing a friend.
23. Feeling that my smartphone buddies understand me better than my real-life friends
24. Constantly checking my smartphone so as not to miss conversations between other people on Twitter
or Facebook
25. Checking SNS (Social Networking Service) sites like Twitter or Facebook right after waking up
26. Preferring to talk with my smartphone buddies to hanging out with my real-life friends or with the
other members of my family
27. Preferring searching from my smartphone to asking other people
28. My fully charged battery does not last for one whole day.
29. Using my smartphone longer than I had intended
30. Feeling the urge to use my smartphone again right after I stopped using it
31. Having tried time and again to shorten my smartphone use time but failing all the time
32. Always thinking that I should shorten my smartphone use time
33. The people around me tell me that I use my smartphone too much.

43
APPENDIX C
INTERNET ADDICTION TEST
Instructions: This questionnaire consists of 20 statements. After reading each statement carefully, based
upon the 5-point Likert scale, please select the response (0, 1, 2, 3, 4 or 5) which best describes you. If
two choices seem to apply equally well, circle the choice that best represents how you are most of the
time during the past month. Be sure to read all the statements carefully before making your choice. The
statements refer to offline situations or actions unless otherwise specified. 0 = Not Applicable 1 = Rarely
2 = Occasionally 3 = Frequently 4 = Often 5 = Always
1. Do you feel that you stay online longer than you intend?
2. Do you neglect household chores to spend more time online?
3. Do you prefer the excitement of the Internet to intimacy with your partner?
4. Do you form new relationships with fellow online users?
5. Do others in your life complain to you about the amount of time you spend online?
6. Does your work suffer because of the amount of time you spend online?
7. Do you check your email before something else that you need to do?
8. Does your job performance or productivity suffer because of the Internet?
9. Do you become defensive or secretive when someone asks what you do online?
10. Do you block disturbing thoughts about your life with soothing thoughts of the Internet?
11. Do you find yourself anticipating when you go online again?
12. Do you feel that life without the Internet would be boring, empty, and joyless?
13. Do you snap, yell, or act annoyed if someone bothers you while you are online?
14. Do you lose sleep due to late night log-ins?
15. Do you feel preoccupied with the Internet when offline or fantasize about being online?
16. Do you find yourself saying “just a few more minutes” when online?
17. Do you try to cut down the amount of time you spend online and fail?
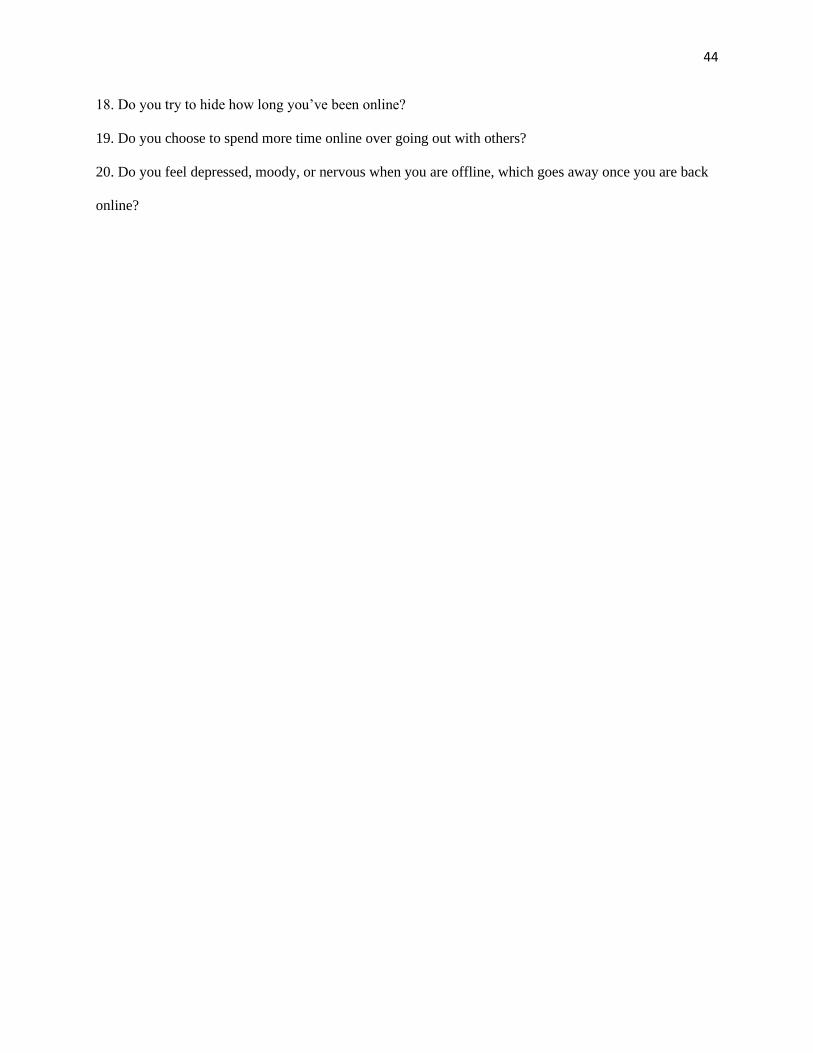
44
18. Do you try to hide how long you’ve been online?
19. Do you choose to spend more time online over going out with others?
20. Do you feel depressed, moody, or nervous when you are offline, which goes away once you are back
online?
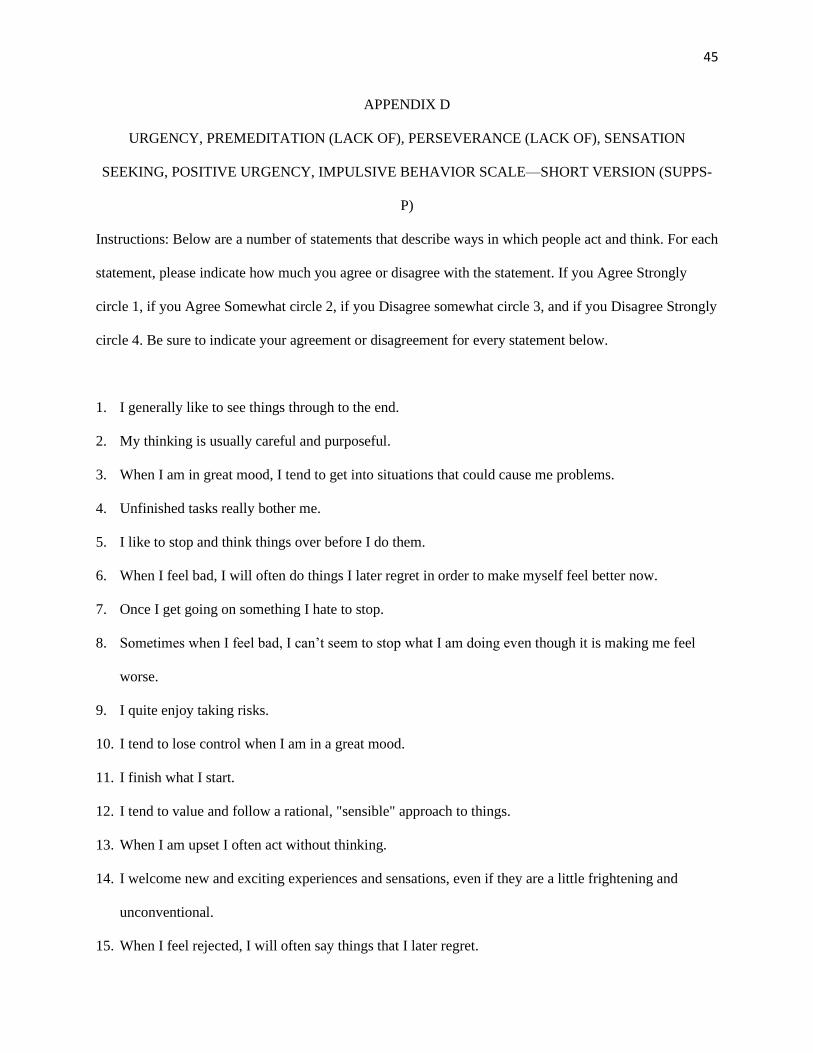
45
APPENDIX D
URGENCY, PREMEDITATION (LACK OF), PERSEVERANCE (LACK OF), SENSATION
SEEKING, POSITIVE URGENCY, IMPULSIVE BEHAVIOR SCALE—SHORT VERSION (SUPPS-
P)
Instructions: Below are a number of statements that describe ways in which people act and think. For each
statement, please indicate how much you agree or disagree with the statement. If you Agree Strongly
circle 1, if you Agree Somewhat circle 2, if you Disagree somewhat circle 3, and if you Disagree Strongly
circle 4. Be sure to indicate your agreement or disagreement for every statement below.
1. I generally like to see things through to the end.
2. My thinking is usually careful and purposeful.
3. When I am in great mood, I tend to get into situations that could cause me problems.
4. Unfinished tasks really bother me.
5. I like to stop and think things over before I do them.
6. When I feel bad, I will often do things I later regret in order to make myself feel better now.
7. Once I get going on something I hate to stop.
8. Sometimes when I feel bad, I can’t seem to stop what I am doing even though it is making me feel
worse.
9. I quite enjoy taking risks.
10. I tend to lose control when I am in a great mood.
11. I finish what I start.
12. I tend to value and follow a rational, "sensible" approach to things.
13. When I am upset I often act without thinking.
14. I welcome new and exciting experiences and sensations, even if they are a little frightening and
unconventional.
15. When I feel rejected, I will often say things that I later regret.
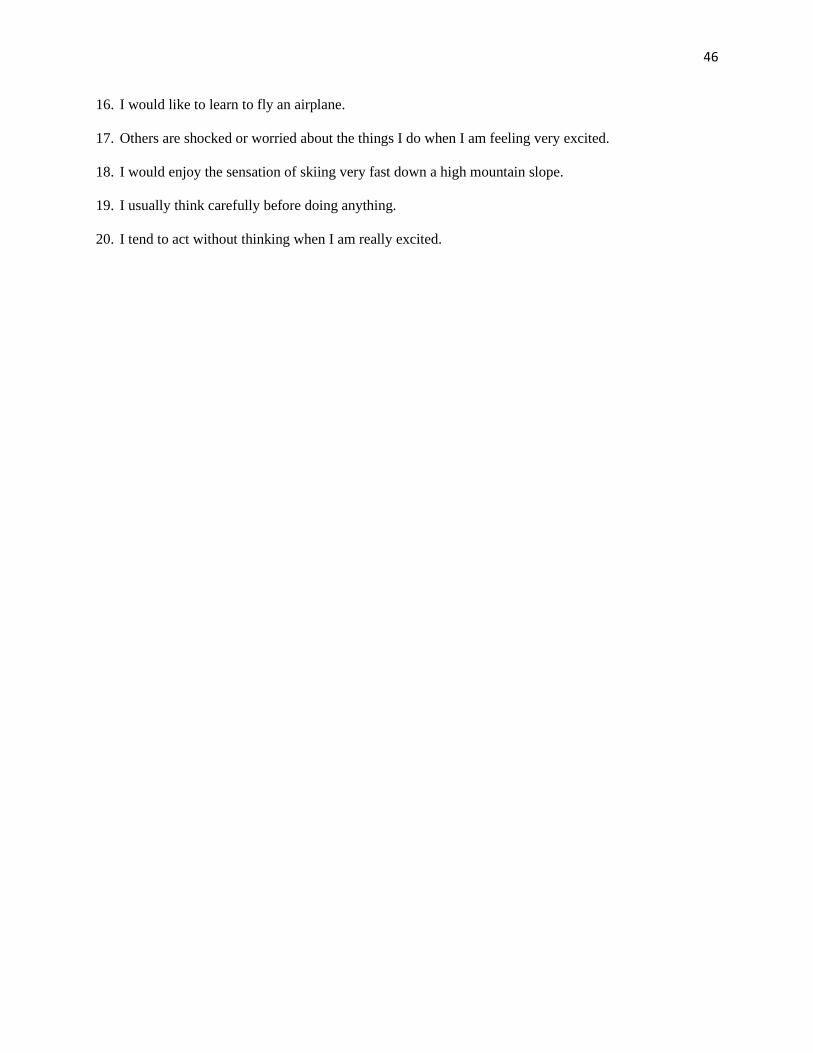
46
16. I would like to learn to fly an airplane.
17. Others are shocked or worried about the things I do when I am feeling very excited.
18. I would enjoy the sensation of skiing very fast down a high mountain slope.
19. I usually think carefully before doing anything.
20. I tend to act without thinking when I am really excited.
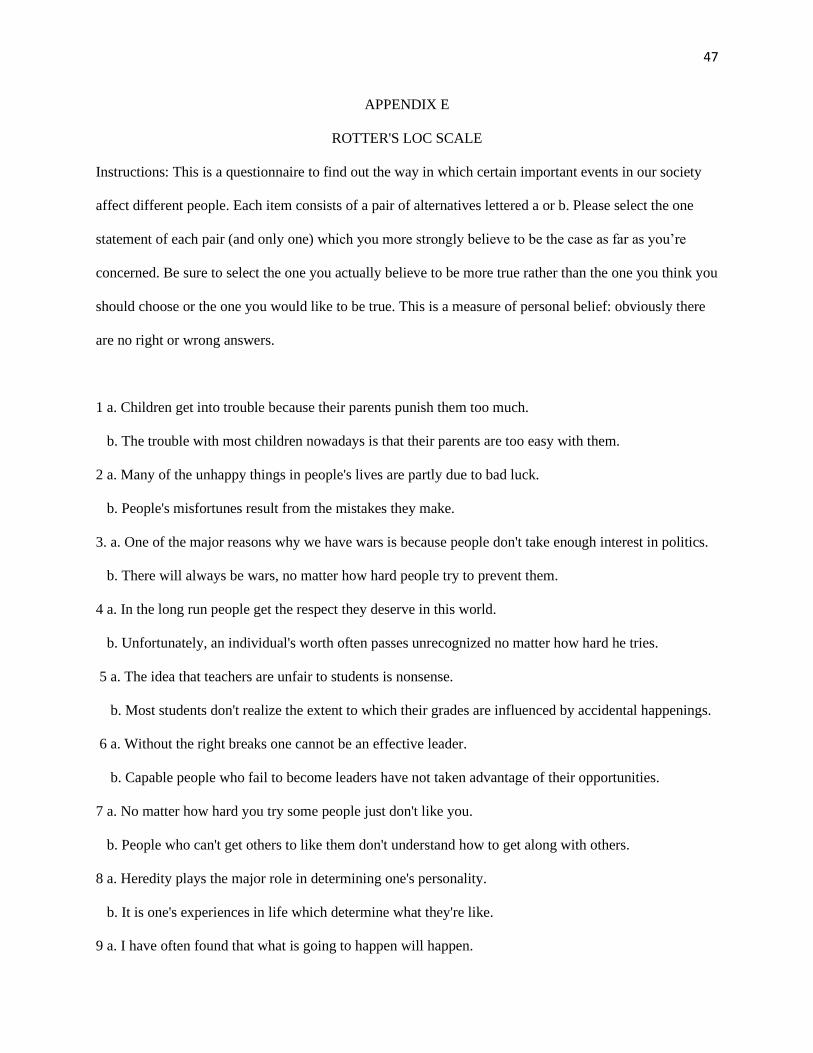
47
APPENDIX E
ROTTER'S LOC SCALE
Instructions: This is a questionnaire to find out the way in which certain important events in our society
affect different people. Each item consists of a pair of alternatives lettered a or b. Please select the one
statement of each pair (and only one) which you more strongly believe to be the case as far as you’re
concerned. Be sure to select the one you actually believe to be more true rather than the one you think you
should choose or the one you would like to be true. This is a measure of personal belief: obviously there
are no right or wrong answers.
1 a. Children get into trouble because their parents punish them too much.
b. The trouble with most children nowadays is that their parents are too easy with them.
2 a. Many of the unhappy things in people's lives are partly due to bad luck.
b. People's misfortunes result from the mistakes they make.
3. a. One of the major reasons why we have wars is because people don't take enough interest in politics.
b. There will always be wars, no matter how hard people try to prevent them.
4 a. In the long run people get the respect they deserve in this world.
b. Unfortunately, an individual's worth often passes unrecognized no matter how hard he tries.
5 a. The idea that teachers are unfair to students is nonsense.
b. Most students don't realize the extent to which their grades are influenced by accidental happenings.
6 a. Without the right breaks one cannot be an effective leader.
b. Capable people who fail to become leaders have not taken advantage of their opportunities.
7 a. No matter how hard you try some people just don't like you.
b. People who can't get others to like them don't understand how to get along with others.
8 a. Heredity plays the major role in determining one's personality.
b. It is one's experiences in life which determine what they're like.
9 a. I have often found that what is going to happen will happen.
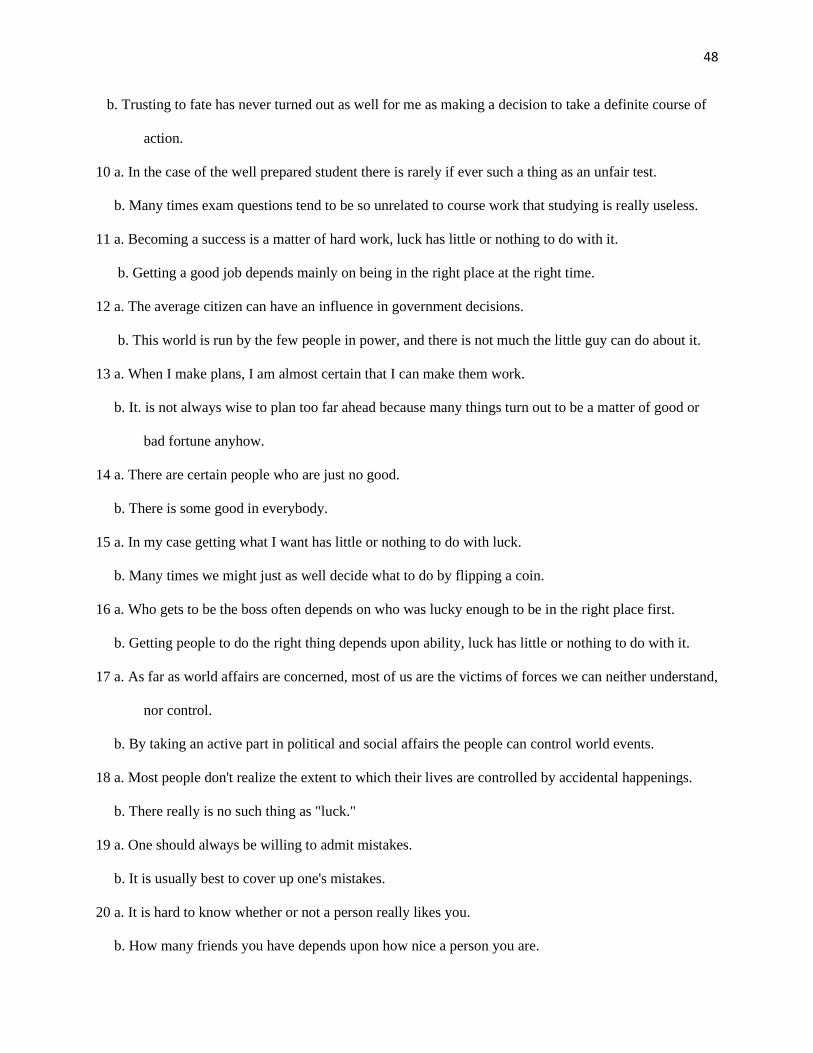
48
b. Trusting to fate has never turned out as well for me as making a decision to take a definite course of
action.
10 a. In the case of the well prepared student there is rarely if ever such a thing as an unfair test.
b. Many times exam questions tend to be so unrelated to course work that studying is really useless.
11 a. Becoming a success is a matter of hard work, luck has little or nothing to do with it.
b. Getting a good job depends mainly on being in the right place at the right time.
12 a. The average citizen can have an influence in government decisions.
b. This world is run by the few people in power, and there is not much the little guy can do about it.
13 a. When I make plans, I am almost certain that I can make them work.
b. It. is not always wise to plan too far ahead because many things turn out to be a matter of good or
bad fortune anyhow.
14 a. There are certain people who are just no good.
b. There is some good in everybody.
15 a. In my case getting what I want has little or nothing to do with luck.
b. Many times we might just as well decide what to do by flipping a coin.
16 a. Who gets to be the boss often depends on who was lucky enough to be in the right place first.
b. Getting people to do the right thing depends upon ability, luck has little or nothing to do with it.
17 a. As far as world affairs are concerned, most of us are the victims of forces we can neither understand,
nor control.
b. By taking an active part in political and social affairs the people can control world events.
18 a. Most people don't realize the extent to which their lives are controlled by accidental happenings.
b. There really is no such thing as "luck."
19 a. One should always be willing to admit mistakes.
b. It is usually best to cover up one's mistakes.
20 a. It is hard to know whether or not a person really likes you.
b. How many friends you have depends upon how nice a person you are.
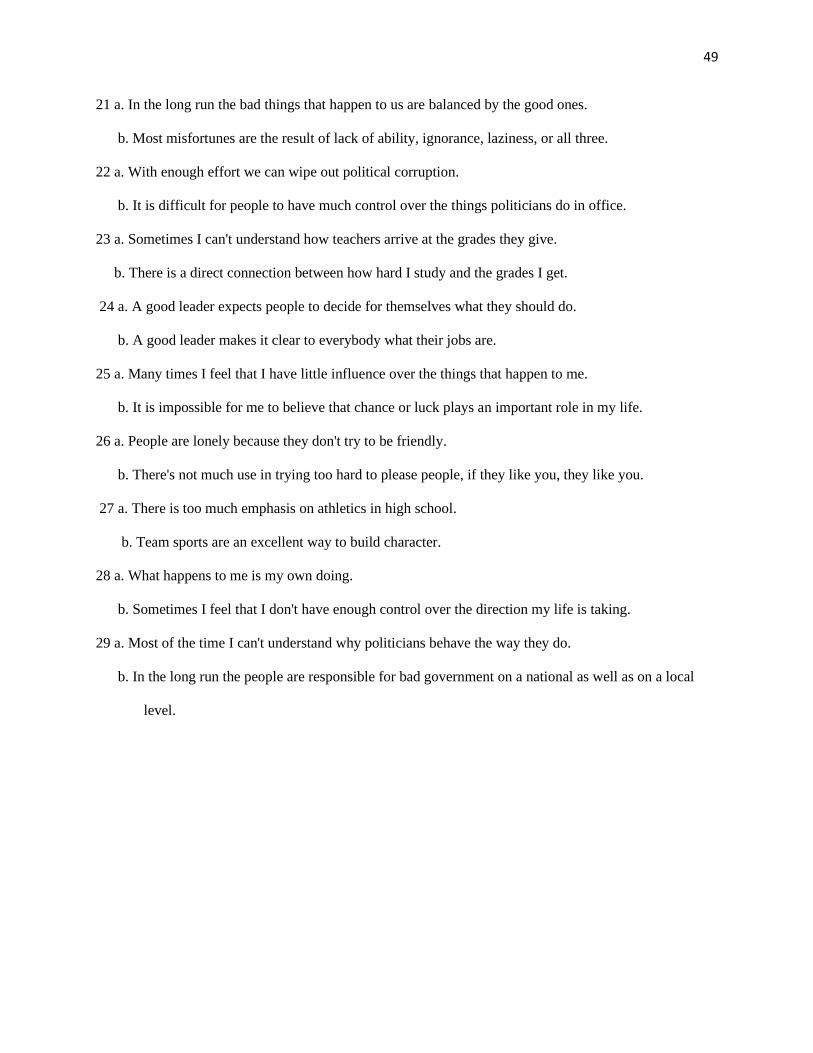
49
21 a. In the long run the bad things that happen to us are balanced by the good ones.
b. Most misfortunes are the result of lack of ability, ignorance, laziness, or all three.
22 a. With enough effort we can wipe out political corruption.
b. It is difficult for people to have much control over the things politicians do in office.
23 a. Sometimes I can't understand how teachers arrive at the grades they give.
b. There is a direct connection between how hard I study and the grades I get.
24 a. A good leader expects people to decide for themselves what they should do.
b. A good leader makes it clear to everybody what their jobs are.
25 a. Many times I feel that I have little influence over the things that happen to me.
b. It is impossible for me to believe that chance or luck plays an important role in my life.
26 a. People are lonely because they don't try to be friendly.
b. There's not much use in trying too hard to please people, if they like you, they like you.
27 a. There is too much emphasis on athletics in high school.
b. Team sports are an excellent way to build character.
28 a. What happens to me is my own doing.
b. Sometimes I feel that I don't have enough control over the direction my life is taking.
29 a. Most of the time I can't understand why politicians behave the way they do.
b. In the long run the people are responsible for bad government on a national as well as on a local
level.
50
APPENDIX F
CONNECTEDNESS TO NATURE SCALE (CNS)
Instructions: Please answer each of these questions in terms of the way you generally feel. There are
no right or wrong answers. Using the following scale, in the space provided next to each question
simply state as honestly and candidly as you can what you are presently experiencing. 1 = Strongly
Disgree, 2, 3 = Neutral, 4, 5 = Strongly Agree.
1. I often feel a sense of oneness with the natural world around me.
2. I think of the natural world as a community to which I belong.
3. I recognize and appreciate the intelligence of other living organisms.
4. I often feel disconnected from nature.
5. When I think of my life, I imagine myself to be part of a larger cyclical process of living.
6. I often feel a kinship with animals and plants.
7. I feel as though I belong to the Earth as equally as it belongs to me.
8. I have a deep understanding of how my actions affect the natural world.
9. I often feel part of the web of life.
10. I feel that all inhabitants of Earth, human, and nonhuman, share a common ‘life force’.
11. Like a tree can be part of a forest, I feel embedded within the broader natural world.
12. When I think of my place on Earth, I consider myself to be a top member of a hierarchy that
exists in nature.
13. I often feel like I am only a small part of the natural world around me, and that I am no more
important than the grass on the ground or the birds in the trees.
14. My personal welfare is independent of the welfare of the natural world.
51
APPENDIX G
THE BIG FIVE INVENTORY
Here are a number of characteristics that may or may not apply to you. For example, do you agree that
you are someone who likes to spend time with others? Please write a number next to each statement to
indicate the extent to which you agree or disagree with that statement. 1 = Disagree Strongly 2 = Disagree
a little 3 = Neither agree nor disagree 4 = Agree a little 5 = Agree Strongly.
1. Is talkative
2. Tends to find fault with others
3. Does a thorough job
4. Is depressed, blue
5. Is original, comes up with new ideas
6. Is reserved
7. Is helpful and unselfish with others
8. Can be somewhat careless
9. Is relaxed, handles stress well
10. Is curious about many different things
11. Is full of energy
12. Starts quarrels with others
13. Is a reliable worker
14. Can be tense
15. Is ingenious, a deep thinker
16. Generates a lot of enthusiasm
17. Has a forgiving nature
18. Tends to be disorganized
19. Worries a lot

52
20. Has an active imagination
21. Tends to be quiet
22. Is generally trusting
23. Tends to be lazy
24. Is emotionally stable, not easily upset
25. Is inventive
26. Has an assertive personality
27. Can be cold and aloof
28. Perseveres until the task is finished
29. Can be moody
30. Values artistic, aesthetic experiences
31. Is sometimes shy, inhibited
32. Is considerate and kind to almost everyone
33. Does things efficiently
34. Remains calm in tense situations
35. Prefers work that is routine
36. Is outgoing, sociable
37. Is sometimes rude to others
38. Makes plans and follows through with them
39. Gets nervous easily
40. Likes to reflect, play with ideas
41. Has few artistic interests
42. Likes to cooperate with others
43. Is easily distracted
44. Is sophisticated in art, music, or literature