Embed Size (px)
Citation preview

Astronomy & Astrophysics manuscript no. DR14Q_v1 c©ESO 2018January 16, 2018
The Sloan Digital Sky Survey Quasar Catalog: Fourteenth DataRelease?
Isabelle Pâris1, Patrick Petitjean2, Éric Aubourg3, Adam D. Myers4, Alina Streblyanska5, 6, Brad W. Lyke4, Scott F.Anderson7, Éric Armengaud8, Julian Bautista9, Michael R. Blanton10, Michael Blomqvist1, Jonathan Brinkmann11,Joel R. Brownstein9, William Nielsen Brandt12, 13, 14, Étienne Burtin8, Kyle Dawson9, Sylvain de la Torre1, Antonis
Georgakakis15, Héctor Gil-Marín16, 17, Paul J. Green18, Patrick B. Hall19, Jean-Paul Kneib20, Stephanie M. LaMassa21,Jean-Marc Le Goff8, Chelsea MacLeod18, Vivek Mariappan9, Ian D. McGreer22, Andrea Merloni15, Pasquier
Noterdaeme2, Nathalie Palanque-Delabrouille8, Will J. Percival23, Ashley J. Ross24, Graziano Rossi25, Donald P.Schneider12, 13, Hee-Jong Seo26, Rita Tojeiro27, Benjamin A. Weaver28, Anne-Marie Weijmans27, Christophe Yèche8,
Pauline Zarrouk8, and Gong-Bo Zhao29, 23
(Affiliations can be found after the references)
Received January 16, 2018; accepted XXX
ABSTRACT
We present the Data Release 14 Quasar catalog (DR14Q) from the extended Baryon Oscillation Spectroscopic Survey (eBOSS) ofthe Sloan Digital Sky Survey IV (SDSS-IV). This catalog includes all SDSS-IV/eBOSS objects that were spectroscopically targetedas quasar candidates and that are confirmed as quasars via a new automated procedure combined with a partial visual inspection ofspectra, have luminosities Mi [z = 2] < −20.5 (in a ΛCDM cosmology with H0 = 70 km s−1 Mpc−1, ΩM = 0.3, and ΩΛ = 0.7),and either display at least one emission line with a full width at half maximum (FWHM) larger than 500 km s−1 or, if not, haveinteresting/complex absorption features. The catalog also includes previously spectroscopically-confirmed quasars from SDSS-I, IIand III. The catalog contains 526 356 quasars (144 046 are new discoveries since the beginning of SDSS-IV) detected over 9 376 deg2
(2 044 deg2 having new spectroscopic data available) with robust identification and redshift measured by a combination of principalcomponent eigenspectra. The catalog is estimated to have about 0.5% contamination. Redshifts are provided for the Mg ii emissionline. The catalog identifies 21 877 broad absorption line quasars and lists their characteristics. For each object, the catalog presentsfive-band (u, g, r, i, z) CCD-based photometry with typical accuracy of 0.03 mag. The catalog also contains X-ray, ultraviolet, near-infrared, and radio emission properties of the quasars, when available, from other large-area surveys. The calibrated digital spectra,covering the wavelength region 3 610–10 140 Å at a spectral resolution in the range 1 300< R < 2 500, can be retrieved from the SDSSScience Archiver Server.
Key words. catalogs – surveys – quasars: general
1. Introduction
Since the identification of the first quasar redshift by Schmidt(1963), each generation of spectroscopic surveys has enlargedthe number of known quasars by roughly an order of magnitude:the Bright Quasar Survey (Schmidt & Green 1983) reached the100 discoveries milestone, followed by the Large Bright QuasarSurvey (LBQS; Hewett et al. 1995) and its 1 000 objects, thenthe ∼25 000 quasars from the 2dF Quasar Redshift Survey (2QZ;Croom et al. 2004), and the Sloan Digital Sky Survey (SDSS;York et al. 2000) with over 100 000 new quasars (Schneider et al.2010). Many other surveys have also significantly contributedto increase the number of known quasars (e.g. Osmer & Smith1980; Boyle et al. 1988; Storrie-Lombardi et al. 1996).
Each iteration of SDSS has pursued different science goals,and hence set different requirements for their associated quasartarget selection.SDSS-I/II (York et al. 2000) aimed to observe ∼ 105 quasars;The final quasar list was presented in the SDSS Data Release 7
? http://www.sdss.org/dr14/algorithms/qso_catalog
(DR7) quasar catalog (Schneider et al. 2010). The main sciencedriver was studies of the quasar population through the measure-ment of their luminosity function (e.g. Richards et al. 2006)and clustering properties (e.g. Hennawi et al. 2006; Shen et al.2007). The quasar program of SDSS-I/II also led to the discov-ery of a significant sample of z > 5 quasars (e.g. Fan et al. 2006;Jiang et al. 2008), large samples of broad absorption line (BAL)quasars (e.g. Reichard et al. 2003; Trump et al. 2006; Gibsonet al. 2008), type 2 candidates (Reyes et al. 2008) or samplesof objects with peculiar properties such as weak emission lines(Diamond-Stanic et al. 2009). Quasar target selection algorithmsfor SDSS-I/II are fully detailed in Richards et al. (2002) andSchneider et al. (2010).
The main motivation to observe quasars with SDSS-III/BOSS (Eisenstein et al. 2011; Dawson et al. 2013) wasto constrain the Baryon Acoustic Oscillation (BAO) scale atz ∼ 2.5 using the H i located in the intergalactic medium (IGM)as a tracer of large scale structures. About 270 000 quasars,mostly in the redshift range 2.15–3.5 for which at least partof the Lyman-α forest lies in the spectral range, have beendiscovered by SDSS-III/BOSS. The measurement of the auto-
Article number, page 1 of 16
arX
iv:1
712.
0502
9v2
[as
tro-
ph.G
A]
14
Jan
2018

A&A proofs: manuscript no. DR14Q_v1
correlation function of the Lyman-α forest (e.g. Bautista et al.2017) and the cross-correlation of quasars and the Lyman-αforest (e.g. du Mas des Bourboux et al. 2017) have providedunprecedented cosmological constraints at z ∼ 2.5. This samplewas also used to study the luminosity function of quasars (Rosset al. 2013; Palanque-Delabrouille et al. 2013), moderate-scaleclustering of z ∼ 2.5 quasars (e.g. Eftekharzadeh et al. 2015).Repeat spectroscopic observations of BAL quasars have beenperformed to constrain the scale and dynamics of quasaroutflows (Filiz Ak et al. 2012, 2013, 2014). Peculiar populationof quasars have been also identified in this enormous samplesuch as z > 2 type 2 quasar candidates (Alexandroff et al. 2013)or extremely red quasars (Ross et al. 2015; Hamann et al. 2017).In order to maximize the number of z > 2 quasars, the targetselection for SDSS-III/BOSS used a variety of target selectionalgorithms (Bovy et al. 2011, 2012; Kirkpatrick et al. 2011;Yèche et al. 2010; Palanque-Delabrouille et al. 2011; Richardset al. 2004). The overall quasar target selection strategy isdescribed in Ross et al. (2012).
Quasar observation in SDSS-IV is driven by multiple scien-tific goals such as cosmology, understanding the physical natureof X-ray sources and variable sources.
SDSS-IV/eBOSS aims to constrain the angular-diameter dis-tance dA (z) and the Hubble parameter H (z) in the redshift range0.6–3.5 using four different tracers of the underlying densityfield over 7 500 deg2: 250 000 new luminous red galaxies (LRG)at 0.6 < z < 1.0, 195 000 new emission line galaxies (ELG) at0.7 < z < 1.1, 450 000 new quasars at 0.9 < z < 2.2, and theLyman-α forest of 60 000 new z > 2.2 quasars.
SDSS-IV/SPIDERS (SPectroscopic IDentification ofERosita Sources) investigates the nature of X-ray emittingsources, including active galactic nuclei (Dwelly et al. 2017)and galaxy clusters (Clerc et al. 2016). Initially, SPIDERStargets X-ray sources detected mainly in the ROSAT All SkySurvey (Voges et al. 1999, 2000) which has recently beenreprocessed (Boller et al. 2016). In late 2018, SPIDERS plans tobegin targeting sources from the eROSITA instrument on boardthe Spectrum Roentgen Gamma satellite (Predehl et al. 2010;Merloni et al. 2012). About 5% of eBOSS fibers are allocatedto SPIDERS targets. A total of 22 000 spectra of active galacticnuclei are expected by the end of the survey, about 5 000 ofthem being also targeted by SDSS-IV/eBOSS.
Finally, SDSS-IV/TDSS (Time Domain Spectroscopic Sur-vey) that aims to characterize the physical nature of time-variable sources, primarily on sources detected to be variablein Pan-STARRS1 data (PS1; Kaiser et al. 2010) or betweenSDSS and PS1 imaging, has been allocated about 5% of eBOSSfibers (Morganson et al. 2015; MacLeod et al. 2017). The targetsidentified in PS1 are a mix of quasars (about 60%) and stellarvariables (about 40%). It will lead to the observation of about120 000 quasars with a majority of them also targeted by SDSS-IV/eBOSS.
This paper presents the SDSS-IV/eBOSS quasar catalog, de-noted DR14Q, that compiles all the spectroscopically-confirmedquasars identified in the course of any of the SDSS iterationsand released as part of the SDSS Fourteenth Data Release (Abol-fathi et al. 2017). The bulk of the newly discovered quasars con-tained in DR14Q arise from the main SDSS-IV/eBOSS quasartarget selection (Myers et al. 2015). The rest were observed byancillary programs (83 430 quasars not targeted by the SDSS-IV/eBOSS main quasar survey; see Dawson et al. 2013; Ahnet al. 2014; Alam et al. 2015), and TDSS and SPIDERS (27 547and 1 090, respectively).
We summarize the target selection and observations in Sec-tion 2. We describe the visual inspection process and describethe definition of the DR14Q parent sample in Section 3. We dis-cuss the accuracy of redshift estimates in Section 4 and presentour automated detection of BAL quasars in Section 5. Generalproperties of the DR14Q sample are reviewed in Section 6 andSection 7, and the format of the catalog is described in Section 8.Finally, we conclude in Section 9.
In the following, we will use a ΛCDM cosmology withH0 = 70 km s−1 Mpc−1, ΩM = 0.3, ΩΛ = 0.7 (Spergel et al.2003). We define a quasar as an object with a luminosityMi [z = 2] < −20.5 and either displaying at least one emis-sion line with FWHM > 500 kms−1 or, if not, having interest-ing/complex absorption features. Indeed, a few tens of objectshave weak emission lines but the Lyman-α forest is clearly vis-ible in their spectra (Diamond-Stanic et al. 2009), and thus theyare included in the DR14Q catalog. About 200 quasars withunusual broad absorption lines are also included in our cata-log (Hall et al. 2002) even though they do not formally meetthe requirement on emission-line width. All magnitudes quotedhere are Point Spread Function (PSF) magnitudes (Stoughtonet al. 2002) and are corrected for Galactic extinction (Schlafly& Finkbeiner 2011).
2. Survey outline
In this Section, we focus on imaging data used to perform thetarget selection of SDSS-IV quasar programs and new spectro-scopic data obtained since August 2014.
2.1. Imaging data
Three sources of imaging data have been used to target quasarsin SDSS-IV/eBOSS (full details can be found in Myers et al.2015): updated calibrations of SDSS imaging, the Wide-FieldInfrared Survey (WISE; Wright et al. 2010), and the PalomarTransient Factory (PTF; Rau et al. 2009; Law et al. 2009).
SDSS Imaging data were gathered using the 2.5m wide-fieldSloan telescope (Gunn et al. 2006) to collect light for a camerawith 30 2k×2k CCDs (Gunn et al. 1998) over five broad bands- ugriz (Fukugita et al. 1996). A total of 14 555 unique squaredegrees of the sky were imaged by this camera, including con-tiguous areas of ∼7 500 deg2 in the North Galactic Cap (NGC)and ∼3 100 deg2 in the SGC that comprise the uniform “Legacy”areas of the SDSS (Aihara et al. 2011). These data were acquiredon dark photometric nights of good seeing (Hogg et al. 2001).Objects were detected and their properties were measured bythe photometric pipeline (Lupton et al. 2001; Stoughton et al.2002) and calibrated photometrically (Smith et al. 2002; Ivezicet al. 2004; Tucker et al. 2006; Padmanabhan et al. 2008), andastrometrically (Pier et al. 2003). Targeting for eBOSS is con-ducted using SDSS imaging that is calibrated to the Schlaflyet al. (2012) Pan-STARRS solution (Finkbeiner et al. 2016).These imaging data were publicly released as part of SDSS-DR13 (Albareti et al. 2016).
The quasar target selection for SDSS-IV/eBOSS also makesuse of the W1 and W2 WISE bands centered on 3.4 and 4.6 µm.The “unWISE” coadded photometry is applied to sources de-tected in the SDSS imaging data as described in Lang (2014).This approach produces photometry of custom coadds of theWISE imaging at the position of all SDSS primary sources.
Imaging data from PTF is also used to target quasars usingvariability in SDSS-IV/eBOSS. Starting from the individual cali-
Article number, page 2 of 16
Isabelle Pâris et al.: The Sloan Digital Sky Survey Quasar Catalog: Fourteenth Data Release
brated frames available from IPAC (Infrared Processing & Anal-ysis Center; Laher et al. 2014), a customized pipeline is appliedto build coadded PTF images on a timescale adapted to quasartargeting, i.e. typically 1–4 epochs per year, depending on thecadence and total exposure time within each field. A stack ofall PTF imaging epochs is also constructed to create a catalogof PTF sources. Finally, light curves are created using coaddedPTF images to perform the selection of quasar candidates.
2.2. Target Selection
In order to achieve a precision of 2.8% on dA (z) and 4.2% onH (z) measurement with the quasar sample, it is necessary toachieve a surface density of at least 58 quasars with 0.9 < z < 2.2per square degree (Dawson et al. 2016). The SDSS-IV/eBOSS“CORE” sample is intended to recover sufficient quasars in thisspecific redshift range and additional quasars at z > 2.2 to sup-plement SDSS-III/BOSS. The CORE sample homogeneouslytargets quasars at all redshifts z > 0.9 based on the XDQSOzmethod (Bovy et al. 2012) in the optical and a WISE-opticalcolor cut. To be selected, it is required that point sources have aXDQSOz probability to be a z > 0.9 quasar larger than 0.2 andpass the color cut mopt − mWISE ≥ (g − i) + 3, where mopt is aweighted stacked magnitude in the g, r and i bands and mWISE isa weighted stacked magnitude in the W1 and W2 bands. Quasarcandidates have g < 22 or r < 22 with a surface density ofconfirmed new quasars (at any redshifts) of ∼ 70 deg−2.
SDSS-IV/eBOSS also selects quasar candidates over a widerange of redshifts using their photometric variability measuredfrom the PTF. In the following we will refer to this sample asthe “PTF” sample. These targets have r > 19 and g < 22.5 andprovide an additional 3-4 z > 2.1 quasars per deg2.
In addition, known quasars with low quality SDSS-III/BOSSspectra (0.75 < S/N per pixel < 3)1 or with bad spectra are re-observed.
Finally, quasars within 1′′of a radio detection in the FIRSTpoint source catalog (Becker et al. 1995) are targeted.
A fully detailed description of the quasar target selection inSDSS-IV/eBOSS and a discussion of its performance can befound in Myers et al. (2015).
TDSS targets point sources that are selected to be variablein the g, r and i bands using the SDSS-DR9 imaging data (Ahnet al. 2012) and the multi-epoch Pan-STARRS1 (PS1) photom-etry (Kaiser et al. 2002, 2010). The survey does not specificallytarget quasars in general but a significant fraction of targets be-long to this class (Morganson et al. 2015). Furthermore, thereare smaller sub-programs (comprising 10% of the main TDSSsurvey) that target quasars specifically (MacLeod et al. 2017).Therefore, these quasars are included in the parent sample forthe quasar catalog.
Finally, the AGN component of SPIDERS targets X-raysources detected in the concatenation of the Bright and FaintROSAT All Sky Survey (RASS) catalogs (Voges et al. 1999,2000) and that have an optical counterpart detected in the DR9imaging data (Ahn et al. 2012). Objects with 17 < r < 22 that liewithin 1′ of a RASS source are targeted. Details about the AGNtarget selection are available in Dwelly et al. (2017).
1 This measurement refers to the standard SDSS spectroscopic sam-pling of 69km s−1 per pixel.
2.3. Spectroscopy
Spectroscopic data for SDSS-IV are acquired in a similar manneras for SDSS-III (Dawson et al. 2016). Targets identified by thevarious selection algorithms are observed with the BOSS spec-trographs whose resolution varies from ∼1 300 at 3 600 Å to2 500 at 10 000 Å (Smee et al. 2013). Spectroscopic observa-tions are obtained in a series of at least three 15-minute expo-sures. Additional exposures are taken until the squared signal-to-noise ratio per pixel, (S/N)2, reaches the survey-quality thresholdfor each CCD. These thresholds are (S/N)2 ≥ 22 at i-band mag-nitude for the red camera and (S/N)2 ≥ 10 at g-band magnitudefor the blue camera (Galactic extinction-corrected magnitudes).The spectroscopic reduction pipeline for the BOSS spectra is de-scribed in Bolton et al. (2012). SDSS-IV uses plates covered by1 000 fibers that have a field of view of approximately 7 deg2.The plates are tiled in a manner which allows them to overlap(Dawson et al. 2016). Fig. 1 shows the locations of observedplates. The total area covered by the Data Release 14 of SDSS-IV/eBOSS is 2 044 deg2. Fig. 2 presents the number of spectro-scopically confirmed quasars with respect to their observationdate.
240 180 120 60 0 300
-15
0
+15
+30
+45
+60
SDSS-I/IISDSS-IIISDSS-IV
0200400600800
0100200300400500600
Fig. 1. Distribution on the sky of the SDSS-DR14/eBOSS spectroscopyin J2000 equatorial coordinates (expressed in decimal degrees). Cyandots correspond to the 1 462 plates observed as part of SDSS-I/II.The purple area indicates the 2 587 plates observed as part of SDSS-III/BOSS. The red area represents to the 496 new plates observed aspart of SDSS-IV (i.e. with MJD ≥ 56898).
3. Construction of the DR14Q catalog
Unlike the SDSS-III/BOSS quasar catalogs (Pâris et al. 2012,2014, 2017), the SDSS-IV quasar catalog also contains all thequasars observed as part of SDSS-I/II/III. This decision is drivenby one of the scientific goals of SDSS-IV/eBOSS to use quasarsas the tracers of large scale structures at z ∼ 1.5 (see Dawsonet al. 2016; Blanton et al. 2017): quasars observed as part of thefirst two iterations of SDSS with a high-quality spectrum, i.e. aspectrum from which one can measure a redshift, were not re-observed as part of SDSS-IV (see Myers et al. 2015, for furtherdetails).
3.1. Definition of the superset
The ultimate goal of the SDSS quasar catalog is to gather all thequasars observed as part of any of the stages of SDSS (York et al.2000; Eisenstein et al. 2011; Blanton et al. 2017). To do so, weneed to create a list of quasar targets as complete as possible thatwe refer to as the superset. Its definition for the DR14Q catalog
Article number, page 3 of 16

A&A proofs: manuscript no. DR14Q_v1
52000 53000 54000 55000 56000 57000Modified Julian Date
0
1
2
3
4
5
Cum
ula
tive n
um
ber
of
quasa
rs
1e5
1st
Jan
uary
20
15
1st
Jan
uary
20
10
1st
Jan
uary
20
05
1st
Jan
uary
20
01
SDSS-I/IISDSS-IIISDSS-IV
Fig. 2. Cumulative number of quasars as a function of observationdate during all the iterations of SDSS (York et al. 2000; Eisensteinet al. 2011; Blanton et al. 2017). Vertical lines show the equivalence be-tween modified Julian dates and usual calendar dates. A total of 526 356quasars have been spectroscopically confirmed. The “flat portions” inthis figure correspond to annual summer shutdown for the telescopemaintenance.
depends on the iteration of the SDSS during which a quasar wasobserved:
– SDSS-I/II: we use the list of confirmed quasars in the SDSS-DR7 quasar catalog that contains all spectroscopically con-firmed quasars from SDSS-I/II (Schneider et al. 2010). A to-tal of 79 487 quasars with no re-observation in SDSS-III/IVare included in the superset for DR14Q.
– SDSS-III/IV: we follow the definition of the superset as inPâris et al. (2017). Our input list of quasar targets is com-posed of all quasar targets as defined by their target selectionbits. The full list of programs targeting quasars and associ-ated references is given in Table 1. This set contains objectstargeted as part of the legacy programs but also all the an-cillary programs that targeted quasars for specific projects(see e.g., Dawson et al. 2013, for examples of ancillary pro-grams). A total of 819 611 quasar targets are identified usingtarget selection bits described in Table 1.
The superset we obtain contains 899 098 objects to be classified.
3.2. Automated classification
Given the increase of the number of quasar targets in SDSS-IV, the systematic visual inspection we performed in SDSS-III/BOSS (e.g. Pâris et al. 2012) is no longer feasible. Since theoutput of the SDSS pipeline (Bolton et al. 2012) cannot be fullyefficient to classify quasar targets, we adopt an alternate strat-egy: starting from the output of the SDSS pipeline, we identifySDSS-IV quasar targets for which it is likely the identificationand redshifts are inaccurate. This set of objects is visually in-spected following the procedure described in Section 3.3.
The spectra of quasar candidates are reduced by the SDSSpipeline2, which provides a classification (QSO, STAR or GALAXY)
2 The software used to reduce SDSS data is called idlspec2d. Its DR14version is v5_10_0.
and a redshift. This task is accomplished using a library of stellartemplates and a principal component analysis (PCA) decompo-sition of galaxy and quasar spectra are fitted to each spectrum.Each class of templates is fitted in a given range of redshift:galaxies from z = −0.01 to 1.00, quasars from z = 0.0033 to7.00, and stars from z = −0.004 to 0.004 (±1 200 km s−1). Foreach spectrum, the fits are ordered by increasing reduced χ2; theoverall best fit is the fit with the lowest reduced χ2.
We start with the first five identifications, i.e. identifica-tions corresponding to the five lowest reduced χ2, redshifts andZWARNING. The latter is a quality flag. Whenever it is set to 0, itsclassification and redshift are considered reliable. We then applythe following algorithm:1. If the first SDSS pipeline identification is STAR, then the re-
sulting classification is STAR;2. If the first SDSS pipeline identification is GALAXY with
zpipeline < 1, then the resulting classification is GALAXY;3. If the first SDSS pipeline identification is GALAXY with
zpipeline ≤ 1 and at least two other SDSS pipeline identifica-tions are GALAXY, then the resulting classification is GALAXY;
4. If the first SDSS pipeline identification is QSO withZWARNING = 0, then the resulting classification is QSO, ex-cept if at least two other SDSS pipeline identifications areSTAR. In such a case, the resulting identification is STAR;
5. If the first pipeline identification is QSO with ZWARNING> 0and at least two alternate SDSS pipeline identifications areSTAR, then the resulting identification is STAR.
At this stage, the redshift measurement we consider for au-tomatically classified objects is the redshift estimate of theoverall best fit of the SDSS pipeline, except if the automatedidentification is STAR. In that case, we set the redshift to 0. Ifan object does not pass any of these conditions, the resultingclassification is UNKNOWN and it is added to the list of objectsthat require visual inspection (see Section 3.3).
In order to achieve the expected precision on the dA (z) andH (z) measurements, it is required (i) to have less than 1% ofactual quasars lost in the classification process and (ii) to haveless than 1% of contaminants in the quasar catalog. We testedthis algorithm against the result of the full visual inspection ofthe “SEQUELS” pilot survey of SDSS-IV/eBOSS that containsa total of 36 489 objects (see Myers et al. 2015; Pâris et al. 2017,for details) to ensure that these requirements are fulfilled.
Out of these 36 489 objects, 2 393 (6.6% of the whole sam-ple) cannot be classified by the automated procedure, 18 799 areclassified as QSO, 10 001 as STAR, and 5 288 as GALAXY. For ob-jects identified as QSO by the algorithm, 98 are wrongly clas-sified. This represents a contamination of the quasar sample of0.5%. A total of 158 actual quasars, i.e. identified in the courseof the full visual inspection, are lost which represents 0.8% ofthe whole quasar sample. The latter number includes 12 objectsidentified as QSO_Z? by visual inspection because their identi-fication is not ambiguous. Detailed results for the comparisonwith the fully visually inspected sample are provided in Table 2.
The performance of this algorithm depends on the SDSSpipeline version and the overall data quality. To ensure that thisperformance does not change significantly, we fully visually in-spect randomly picked plates regularly and test the quality of theoutput.
3.3. Visual inspection process
Depending on the iteration of SDSS, different visual inspectionstrategies have been applied.
Article number, page 4 of 16

Isabelle Pâris et al.: The Sloan Digital Sky Survey Quasar Catalog: Fourteenth Data Release
Bit Selection Bit Selection Bit Selection Bit SelectionBOSS_TARGET110 QSO_CORE (1) 11 QSO_BONUS (1) 12 QSO_KNOWN_MIDZ (1) 13 QSO_KNOWN_LOHIZ (1)
14 QSO_NN (1) 15 QSO_UKIDSS (1) 16 QSO_LIKE_COADD (1) 17 QSO_LIKE (1)
18 QSO_FIRST_BOSS (1) 19 QSO_KDE (1) 40 QSO_CORE_MAIN (1) 41 QSO_BONUS_MAIN (1)
42 QSO_CORE_ED (1) 43 QSO_CORE_LIKE (1) 44 QSO_KNOWN_SUPPZ (1)
ANCILLARY_TARGET16 BLAZGVAR (2) 7 BLAZR (2) 8 BLAZXR (2) 9 BLAZXRSAL (2)
10 BLAZXRVAR (2) 11 XMMBRIGHT (2) 12 XMMGRIZ (2) 13 XMMHR (2)
14 XMMRED (2) 15 FBQSBAL (2) 16 LBQSBAL (2) 17 ODDBAL (2)
18 OTBAL (2) 19 PREVBAL (2) 20 VARBAL (2) 22 QSO_AAL (2)
23 QSO_AALS (2) 24 QSO_IAL (2) 25 QSO_RADIO (2) 26 QSO_RADIO_AAL (2)
27 QSO_RADIO_IAL (2) 28 QSO_NOAALS (2) 29 QSO_GRI (2) 30 QSO_HIZ (2)
31 QSO_RIZ (2) 50 BLAZGRFLAT (2) 51 BLAZGRQSO (2) 52 BLAZGX (2)
53 BLAZGXQSO (2) 54 BLAZGXR (2) 55 BLAZXR (2) 58 CXOBRIGHT (2)
59 CXORED (2)
ANCILLARY_TARGET20 HIZQSO82 (2) 1 HIZQSOIR (2) 2 KQSO_BOSS (2) 3 QSO_VAR (2)
4 QSO_VAR_FPG (2) 5 RADIO_2LOBE_QSO (2) 7 QSO_SUPPZ (2) 8 QSO_VAR_SDSS (2)
9 QSO_WISE_SUPP (3) 10 QSO_WISE_FULL_SKY (4) 13 DISKEMITTER_REPEAT (4) 14 WISE_BOSS_QSO (4)
15 QSO_XD_KDE_PAIR (4) 24 TDSS_PILOT (4) 25 SPIDERS_PILOT (4) 26 TDSS_SPIDERS_PILOT (4)
27 QSO_VAR_LF (4) 31 QSO_EBOSS_W3_ADM (4) 32 XMM_PRIME (4) 33 XMM_SECOND (4)
53 SEQUELS_TARGET (4) 54 RM_TILE1 (4) 55 RM_TILE2 (4) 56 QSO_DEEP (4)
EBOSS_TARGET010 QSO_EBOSS_CORE (5) 11 QSO_PTF (5) 12 QSO_REOBS (5) 13 QSO_EBOSS_KDE (5)
14 QSO_EBOSS_FIRST (5) 15 QSO_BAD_BOSS (5) 16 QSO_BOSS_TARGET (5) 17 QSO_SDSS_TARGET (5)
18 QSO_KNOWN (5) 20 SPIDERS_RASS_AGN (6) 22 SPIDERS_ERASS_AGN (6) 30 TDSS_A (7)
31 TDSS_FES_DE (8) 33 TDSS_FES_NQHISN (8) 34 TDSS_FES_MGII (8) 35 TDSS_FES_VARBAL (8)
40 SEQUELS_PTF_VARIABLEEBOSS_TARGET19 QSO1_VAR_S82 (9) 10 QSO1_EBOSS_CORE (5) 11 QSO1_PTF (5) 12 QSO1_REOBS (5)
13 QSO1_EBOSS_KDE (5) 14 QSO1_EBOSS_FIRST (5) 15 QSO1_BAD_BOSS (5) 16 QSO_BOSS_TARGET (5)
17 QSO_SDSS_TARGET (5) 18 QSO_KNOWN (5) 30 TDSS_TARGET (7,8,10) 31 SPIDERS_TARGET (6,10)
EBOSS_TARGET20 SPIDERS_RASS_AGN (6) 2 SPIDERS_ERASS_ANG (6) 4 SPIDERS_XMMSL_AGN (6) 20 TDSS_A (7)
21 TDSS_FES_DE (8) 23 TDSS_FES_NQHISN (8) 24 TDSS_FES_MGII (8) 25 TDSS_FES_VARBAL (8)
26 TDSS_B (7) 27 TDSS_FES_HYPQSO (8) 31 TDSS_CP (8) 32 S82X_TILE1 (10)
33 S82X_TILE2 (10) 34 S82X_TILE3 (10) 50 S82X_BRIGHT_TARGET (10) 51 S82X_XMM_TARGET (10)
52 S82X_WISE_TARGET (10) 53 S82X_SACLAY_VAR_TARGET (10)
54 S82X_SACLAY_BDT_TARGET (10) 55 S82X_SACLAY_HIZ_TARGET (10)
56 S82X_RICHARDS15_PHOTOQSO_TARGET (10) 57 S82X_PETERS15_COLORVAR_TARGET (10)
58 S82X_LSSTZ4_TARGET (10) 59 S82X_UNWISE_TARGET (10)
60 S82X_GTRADMZ4_TARGET (10) 61 S82X_CLAGN1_TARGET (10)
62 S82X_CLAGN2_TARGET (10)
(1) Ross et al. (2012) – (2) Dawson et al. (2013) – (3) Ahn et al. (2014) – (4) Alam et al. (2015) – (5) Myers et al. (2015)(6) Dwelly et al. (2017) – (7) Morganson et al. (2015) – (8) MacLeod et al. (2017) – (9) Palanque-Delabrouille et al. (2016)(10) Abolfathi et al. (2017)
Table 1. List of programs from SDSS-III/BOSS (Eisenstein et al. 2011; Dawson et al. 2013) and SDSS-IV (Dawson et al. 2016; Blanton et al.2017) targeting quasars and taken as inputs to build up the SDSS-DR14 quasar catalog.
3.3.1. Systematic visual inspection of SDSS-III quasarcandidates
As described in Pâris et al. (2012), we visually inspected allquasar targets observed in SDSS-III/BOSS (Eisenstein et al.2011; Dawson et al. 2013). The idea was to construct a quasarcatalog as complete and pure as possible (this was also theapproach adopted by SDSS-I/II catalogs). Several checks dur-ing the SDSS-III/BOSS survey have shown that completeness
(within the given target selection) and purity are larger than99.5%.
After their observation, all the spectra are automatically clas-sified by the SDSS pipeline (Bolton et al. 2012). Spectra aredivided into four categories based on their initial classificationby the SDSS pipeline: low-redshift quasars (i.e. z < 2), high-redshift quasars (i.e. z ≥ 2), stars and others. We perform thevisual inspection plate by plate through a dedicated website: allspectra for a given category can be validated at once if their iden-
Article number, page 5 of 16

A&A proofs: manuscript no. DR14Q_v1
Automated classificationUNKNOWN QSO STAR GALAXY
Visual inspectionQSO 1 418 17 687 27 107QSO_BAL 144 946 4 8QSO_? 79 27 6 26QSO_Z? 120 41 5 7Star 213 11 9 804 189Star_? 61 5 54 29Galaxy 74 37 23 4 623? 115 15 34 95Bad 169 30 44 204
Table 2. Comparison between the automated classification scheme based on the output of the SDSS pipeline (Bolton et al. 2012) and visualinspection of our training set.
tification and redshift are correct. If an object requires furtherinspection or a change in its redshift, we have the option to goto a detailed page on which not only the identification can bechanged but also BALs and DLAs can be flagged and the red-shift can be adjusted. When possible the peak of the Mg ii emis-sion line was used as an estimator of the redshift (see Pâris et al.2012), otherwise the peak of C iv was taken as the indicator incase the redshift given by the pipeline was obviously in error.
3.3.2. Residual visual inspection of SDSS-IV quasarcandidates
For SDSS-IV/eBOSS, we visually inspect only the objects theautomated procedure considers ill-identified. Most of the corre-sponding spectra are, unsurprisingly, of low S/N. A number ofill-identified sources have good S/N but show strong absorptionlines which confuse the pipeline. These objects can be strongBALs but also spectra with a strong DLA at the emission redshift(Finley et al. 2013; Fathivavsari et al. 2017). A few objects havevery unusual continua. The visual inspection itself proceeds asfor the SDSS-III/BOSS survey. However, we no longer visuallyflag BALs and we change redshifts only in case of catastrophicfailures of the SDSS pipeline.
3.4. Classification result
Starting from the 899 098 unique objects included in the DR14Qsuperset, we run the automated procedure described in Sec-tion 3.2. A total of 42 729 quasar candidates are classified asUNKNOWN by the algorithm. Identification from the full visual in-spection of SDSS-I/II/III quasar targets was already available for625 432 objects, including 32 621 identified as UNKNOWN by theautomated procedure. The remaining 10 108 quasar candidateswith no previous identification from SDSS-I/II/III have been vi-sually inspected. After merging all the already existing identifi-cations, 635 540 objects are identified through visual inspectionand 263 558 are identified by the automated procedure.
A total of 526 356 quasars are identified, 387 223 from vi-sual inspection and 139 133 from the automated classification.Results are summarized in Table 3.
4. Redshift estimate
Despite the presence of large and prominent emission lines, itis frequently difficult to estimate accurate redshifts for quasars.Indeed, the existence of quasar outflows create systematic shifts
in the location of broad emission lines leading to not fully con-trolled errors in the measurement of redshifts (e.g. Shen et al.2016). Accuracy in this measurement is crucial to achieve thescientific goals of SDSS-IV/eBOSS. As stated in the Sec. 5.2of Dawson et al. (2016), we mitigate this problem by using twodifferent types of redshift estimates: one based on the result of aprincipal component analysis and another one based on the loca-tion of the maximum of the peak of the Mg ii emission line.
4.1. Automated redshift estimates
Various studies have shown that the Mg ii emission line isthe quasar broad emission line that is the least affected bysystematic shifts (e.g. Hewett & Wild 2010; Shen et al. 2016).In the BOSS spectral range, this feature is available in theredshift range 0.3–2.5, which covers most of our sample.
To measure the Mg ii redshift (Z_MGII), we first perform aprincipal component analysis (PCA) on a sample of 8 986 SDSS-DR7 quasars (Schneider et al. 2010) using input redshifts fromHewett & Wild (2010). The detailed selection of this sample isexplained in Sec. 4 of Pâris et al. (2012). With the resulting set ofeigenspectra, we fit a linear combination of five principal com-ponents and measure the location of the maximum of the Mg iiemission line. This first step produces a new redshift measure-ment that can be used to re-calibrate our reference sample. Wethen perform another PCA with Z_MGII and derive a new set ofprincipal components. In this second step it is not necessary tohave Z_MGII but this step is mandatory to derive PCA redshiftscalibrated to use the Mg ii emission as a reference.
Finally, to measure Z_PCA, we fit a linear combination offour eigenspectra to all DR14Q spectra. The redshift estimate isan additional free parameter in the fit. During the fitting process,there is an iterative removal of absorption lines in order to limittheir impact on redshift measurements; Details are given in Pâriset al. (2012).
4.2. Comparison of redshift estimates provided in DR14Q
In the present catalog, we release four redshift estimates:Z_PIPE, Z_VI, Z_PCA, and Z_MGII. As explained in the previ-ous section, the Mg ii emission line is the least affected broademission line in quasar spectra. In addition, this emission lineis available for most of our sample. We use it as the referenceredshift to test the accuracy of our three other redshift estimates.For this test, we select all the DR14Q quasars for which we have
Article number, page 6 of 16

Isabelle Pâris et al.: The Sloan Digital Sky Survey Quasar Catalog: Fourteenth Data Release
Number of quasar targets in SDSS-III/IV 819 611Number of quasars from SDSS-I/II only 79 487Total number of objects in DR14Q superset 899 098Number of targets with automated classification 263 558Number of targets with visual inspection classification 635 540Number of quasars from automated classification 139 133Number of quasars from visual inspection classification 387 223Total number of DR14Q quasars 526 356
Table 3. Result of our classification process, split between automated and visual inspection classifications.
the four redshift estimates. Among these 178 981 objects, wealso select 151 701 CORE quasars only to test the behavior of ourestimates on this sample for which redshift accuracy is crucial.Fig. 3 displays the distribution of the velocity differencesbetween Z_VI, Z_PIPE, Z_PCA and Z_MGII for the full samplehaving the four redshift estimates available (left panel) and COREquasars only (right panel). Table 4 gives the systematic shift foreach of the distributions and the dispersion of these quantities,expressed in km s−1, for both samples.
As explained in Section 3.3, the visual inspection redshiftZ_VI is set to be at the location of the maximum of the Mg iiemission line when this line is available. With this strategy, thesystematic shift with respect to the Mg ii emission line is lim-ited by the accuracy of the visual inspection. Although it is atime-consuming approach, this redshift estimate produces an ex-tremely low number of redshift failures (less than 0.5%), leadingto a low dispersion around this systematic shift.
The SDSS pipeline redshift estimate, Z_PIPE, is the resultof a principal component analysis performed on a sample ofvisually-inspected quasars. Hence, Z_PIPE is expected to havea similar systematic shift as Z_VI. On the other hand, Z_PIPE issubject to more redshift failures due to peculiar objects or lowS/N spectra and thus the larger dispersion of the velocity differ-ence distribution seen in Fig. 3 and Table 4.
Z_PCA is also the result of a principal component analysisbut, unlike Z_PIPE, the reference sample has been carefullychosen to have an automated redshift corresponding to thelocation of the maximum of the Mg ii emission line. Therefore,a systematic shift smaller than 10 km s−1 was expected whencompared to Z_MGII. In addition, Z_PCA takes into accountthe possible presence of absorption lines, even broad ones,and it is trained to ignore them. Z_PCA is thus less sensitiveto peculiarities in quasar spectra, which explains the reduceddispersion of redshift errors when compared to Z_PIPE.
A similar analysis performed on a sample of 151 701 COREquasars for which we have the four redshift estimates leads tosimilar results for redshift estimates. These exercises demon-strate that there is no additional and significant systematics forthe redshift estimate of the CORE quasar sample.
5. Broad Absorption Line quasars
In SDSS-III/BOSS, we performed a full visual inspection of allquasar targets. During this process, we visually flagged spectradisplaying broad absorption lines (BAL). With this catalog, it isno longer possible to visually inspect all BALs and we now relyon a fully automated detection of BALs.
As for the previous SDSS quasar catalogs, we automaticallysearch for BAL features and report metrics of common use in the
Median ∆v σ∆v(km s−1) (km s−1)
Full sample (178 981 quasars)zVI − zMgII -59.7 585.9zPIPE − zMgII -54.8 697.2zPCA − zMgII -8.8 586.9CORE sample (151 701 quasars)zVI − zMgII -61.7 581.0zPIPE − zMgII -57.9 692.1zPCA − zMgII -9.3 577.4
Table 4. Median shift and dispersion of velocity differences betweenZ_VI, Z_PIPE, Z_PCA and Z_MGII for the full DR14Q sample and theCORE sample only. These numbers are derived from a subsample of178 981 quasars from DR14Q for which we have the four redshift esti-mates available. We also restrict this analysis to 151 701 CORE quasarsfor which we also have the four different redshift estimates. See Fig. 3for the full distributions.
community: the BALnicity Index (BI; Weymann et al. 1991) ofthe C iv absorption troughs. We restrict the automatic search toquasars with z ≥ 1.57 in order to have the full spectral coverageof C iv absorption troughs. The BALnicity index (Col. #32) iscomputed bluewards of the C iv emission line and is defined as:
BI = −
∫ 3000
25000
[1 −
f (v)0.9
]C (v) dv, (1)
where f (v) is the normalized flux density as a function of veloc-ity displacement from the emission-line center. The quasar con-tinuum is estimated using the linear combination of four princi-pal components as described in Section 4.1. C (v) is initially setto 0 and can take only two values, 1 or 0. It is set to 1 when-ever the quantity 1 − f (v) /0.9 is continuously positive over aninterval of at least 2 000 km s−1. It is reset to 0 whenever thisquantity becomes negative. C iv absorption troughs wider than2 000 km s−1 are detected in the spectra of 21 877 quasars.
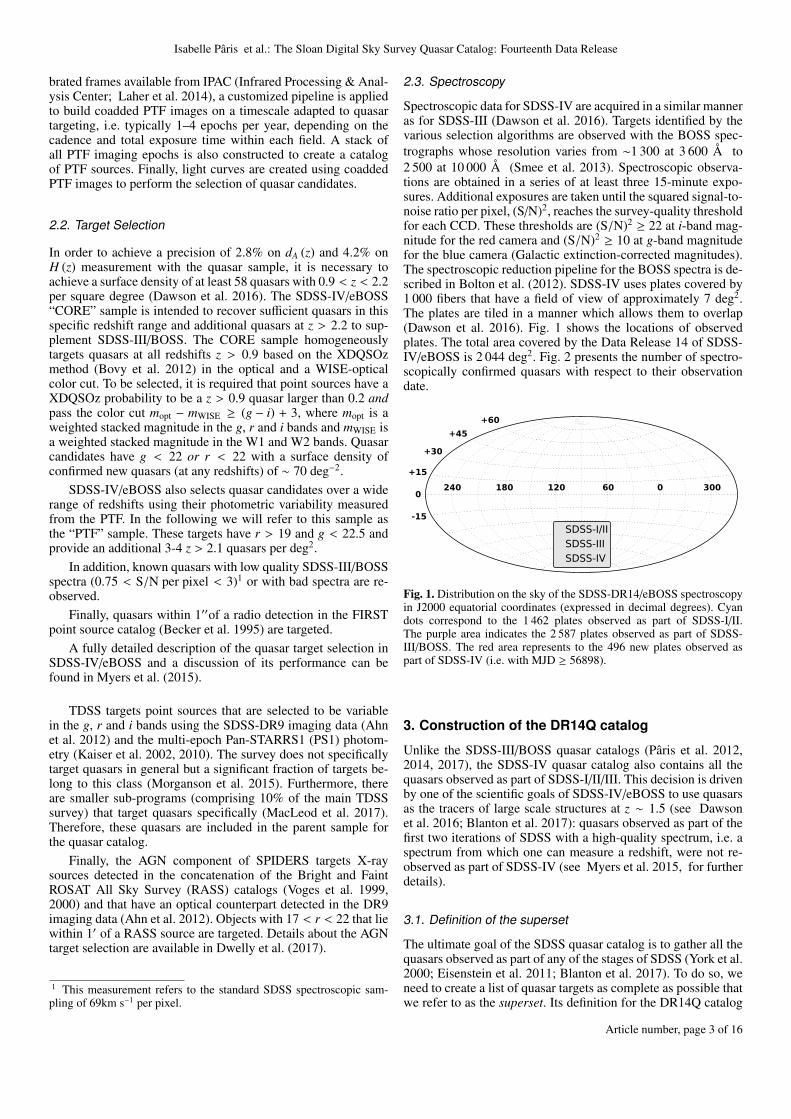
The distribution of BI for C iv troughs from DR14Q is pre-sented in Fig. 4 (black histogram) and is compared to previousworks by Gibson et al. (2009, purple histogram) performed onDR5Q (Schneider et al. 2007) and by Allen et al. (2011, orangehistogram) who searched for BAL quasars in quasar spectra re-leased as part of SDSS-DR6 (Adelman-McCarthy et al. 2008).The three distributions are normalized to have their sum equalto one. The overall shapes of the three distributions are similar.The BI distribution from Gibson et al. (2009) exhibits a slightexcess of low-BI values (log BICIV < 2) compared to Allen et al.(2011) and this work. The most likely explanation is the differ-ence in the quasar emission modeling. Allen et al. (2011) useda non-negative matrix factorization (NMF) to estimate the unab-sorbed flux, which produces a quasar emission line shape akinto the one we obtain with PCA. Gibson et al. (2009) modeled
Article number, page 7 of 16

A&A proofs: manuscript no. DR14Q_v1
2000 1000 0 1000 2000
∆v (km s−1 )
0.0
0.2
0.4
0.6
0.8
1.0
1.2
1.4
Num
ber
of
quasa
rs
1e4
Full SamplezVI-zMgII
zPCA-zMgII
zPIPE-zMgII
2000 1000 0 1000 2000
∆v (km s−1 )
0.0
0.2
0.4
0.6
0.8
1.0
1.2
1.41e4
CORE onlyzVI-zMgII
zPCA-zMgII
zPIPE-zMgII
Fig. 3. Left Panel: Distribution of velocity differences between Z_VI (magenta histogram), Z_PIPE (brown histogram), Z_PCA (dark cyanhistogram) and Z_MGII. These histograms are computed using 178 981 quasars that have all the four redshift estimates available in DR14Q. RightPanel: Same as left panel restricted to the 151 701 CORE quasars for which we have the four redshift estimates available in DR14Q. In both panels,the histograms are computed in bins of ∆v = 50 km s−1 and the vertical grey line marks ∆v = 0 km s−1.
their quasar continuum with a reddened power-law and strongemission lines with Voigt profiles. Power-law like continua tendto underestimate the actual quasar emission and hence, the re-sulting BI values tend to be lower than the one computed whenthe quasar emission is modeled with NMF or PCA methods.
0.0 0.5 1.0 1.5 2.0 2.5 3.0 3.5 4.0 4.5
log(BICIV) [km s−1 ]
0.0
0.1
0.2
0.3
0.4
0.5
0.6
0.7
Frequency
Gibson et al. (2009)Allen et al. (2011)DR14Q
Fig. 4. Distribution of the logarithm of the C iv BALnicity index forBAL quasars in DR14Q (black histogram), (Gibson et al. 2009, vio-let histogram) and (Allen et al. 2011, orange histogram). All the his-tograms are normalized to have their sum equal to one. Histograms havebin widths of log BICIV = 0.1.
6. Summary of the sample
The DR14Q catalog contains 526 356 unique quasars, of which144 046 are new discoveries since the previous release. Thisdataset represents an increase of about 40% in the number ofSDSS quasars since the beginning of SDSS-IV. Spectroscopic
observations of quasars were performed over 9 376 deg2 forSDSS-I/II/III. New SDSS-IV spectroscopic data are availableover 2 044 deg2. The average surface density of 0.9 < z < 2.2quasars prior to the beginning of SDSS-IV is 13.27 deg−2, andreaches 80.24 deg−2 in regions for which SDSS-IV spectroscopyis available. The overall quasar surface density in regions withSDSS-IV spectroscopy is 125.03 deg−2, which corresponds toan increase by a factor of 2.4 times compared to the previousquasar catalog release.
The redshift distribution of the full sample is shown in Fig. 5(left panel; black histogram). Redshift distributions of quasarsobserved by each phase of SDSS are also presented in the leftpanel of Fig. 5: SDSS-I/II in cyan, SDSS-III in purple and SDSS-IV in red. SDSS-I/II has observed quasars in the redshift range0–5.4 with an almost flat distribution up to z ∼ 2.5, and thena steep decrease. SDSS-III has focused on z ≥ 2.15 quasars inorder to access the Lyman-α forest. The two peaks at z ∼ 0.8and z ∼ 1.6 are due to known degeneracies in the associatedquasar target selection (see Ross et al. 2012, for more de-tails). SDSS-IV/eBOSS mostly aims to fill in the gap betweenz ∼ 0.8 and z ∼ 2. It should be noted that some quasars havebeen observed multiple times throughout the 16 years of the sur-vey, thus the cumulative number in each redshift bin is largerthan the number of objects in each redshift bin for the full sam-ple. The right panel of Fig. 5 shows the redshift distributions foreach of the sub-programs using different target selection crite-ria (Myers et al. 2015). The thick blue histogram indicates theredshift distribution of the CORE sample taking into account pre-vious spectroscopic observations from SDSS-I/II/III. The lightblue histogram is the redshift distribution of new SDSS-IV COREquasars, i.e. those that have been observed later than July 2014.The thick brown histogram displays the redshift distribution ofall the variability-selected quasars, i.e. including quasars thatwere spectroscopically confirmed in SDSS-I/II/III. The orangehistogram represents the redshift distribution of newly confirmedvariability-selected quasars by SDSS-IV. The green histogramrepresents the redshift distribution of quasars that were targetedfor recent spectra as TDSS variables (Morganson et al. 2015;
Article number, page 8 of 16

Isabelle Pâris et al.: The Sloan Digital Sky Survey Quasar Catalog: Fourteenth Data Release
MacLeod et al. 2017). Further discussion of the redshift distri-bution of TDSS-selected quasars can be found in Ruan et al.(2016) All the quasars selected by other programs, such as an-cillary programs in SDSS-III or special plates, have their redshiftdistribution indicated in pink.
A similar comparison is done for the Galactic-extinction cor-rected r-band magnitudes of DR14Q quasars in Fig. 6 using thesame color code as in Fig. 5. The left panel of Fig. 6 shows the r-band magnitude (corrected for Galactic extinction) distributionsof quasars observed by each iteration of SDSS. The right panelof Fig. 6 displays the r-band magnitude distribution for each ofthe subsamples (CORE, variability-selected quasars, TDSS andancillary programs).
Finally, we present a density map of the DR14Q quasars inthe L − z plane in Fig. 7. The area covered in this plane by eachphase of SDSS is also displayed. SDSS-I/II (cyan contour) hasobserved the brighest quasars at all redshifts. SDSS-III (purplecontour) has observed up to two magnitudes deeper than SDSS-I/II, mostly at z > 2. SDSS-IV (red contour) is observing at thesame depth as for SDSS-III but at lower redshift, i.e. focusing onthe redshift range 0.8–2.2.
7. Multiwavelength cross-correlation
We provide multi-wavelength matching of DR14Q quasars toseveral surveys: the FIRST radio survey (Becker et al. 1995), theGalaxy Evolution Explorer (GALEX, Martin et al. 2005) surveyin the UV, the Two Micron All Sky Survey (2MASS, Cutri et al.2003; Skrutskie et al. 2006), the UKIRT Infrared Deep Sky Sur-vey (UKIDSS; Lawrence et al. 2007), the Wide-Field InfraredSurvey (WISE, Wright et al. 2010), the ROSAT All-Sky Survey(RASS; Voges et al. 1999, 2000), and the seventh data release ofthe Third XMM-Newton Serendipitous Source Catalog (Rosenet al. 2016).
7.1. FIRST
As for the previous SDSS-III/BOSS quasar catalogs, wematched the DR14Q quasars to the latest FIRST catalog (De-cember 2014; Becker et al. 1995) using a 2′′ matching radius.We report the flux peak density at 20 cm and the signal-to-noiseratio of the detection. Among the DR14Q quasars, 73 126 lieoutside of the FIRST footprint and have their FIRST_MATCHEDflag set to -1.
A total of 18 273 quasars have FIRST counterparts inDR14Q. We estimate the fraction of chance superpositions byoffsetting the declination of DR14Q quasars by 200′′. We thenre-match to the FIRST source catalog. We conclude that there areabout 0.2% of false positives in the DR14Q-FIRST matching.
7.2. GALEX
As for DR12Q, GALEX (Martin et al. 2005) images are force-photometered (from GALEX Data Release 5) at the SDSS-DR8centroids (Aihara et al. 2011), such that low S/N point-spreadfunction fluxes of objects not detected by GALEX are recov-ered, for both the FUV (1 350-1 750 Å) and NUV (1 750-2 750Å) bands when available. A total of 382 838 quasars are detectedin the NUV band, 304 705 in the FUV band and 515 728 havenon-zero fluxes in both bands.
7.3. 2MASS
We cross-correlate DR14Q with the All-Sky Data Release PointSource catalog (Skrutskie et al. 2006) using a matching radiusof 2′′. We report the Vega-based magnitudes in the J, H and K-bands and their error together with the signal-to-noise ratio ofthe detections. We also provide the value of the 2MASS flagrd_flg[1], which defines the peculiar values of the magnitude andits error for each band3.
There are 16 427 matches in the catalog. This number is quitesmall compared with the number of DR14Q quasars because thesensitivity of 2MASS is much less than that of SDSS. Applyingthe same method as described in Section 7.1, we estimate that0.8% of the matches are false positives.
7.4. WISE
We matched the DR14Q to the AllWISE Source Catalog4
(Wright et al. 2010; Mainzer et al. 2011). Our procedure is thesame as in DR12Q, with a matching radius of 2.0′′. There are401 980 matches from the AllWISE Source Catalog. Followingthe procedure described in Section 7.1, we estimate the rate offalse positive matches to be about 2%, which is consistent withthe findings of Krawczyk et al. (2013).
We report the magnitudes, their associated errors, the S/Nof the detection and reduced χ2 of the profile-fitting in the fourWISE bands centered at wavelengths of 3.4, 4.6, 12 and 22 µm.These magnitudes are in the Vega system, and are measured withprofile-fitting photometry. We also report the WISE catalog con-tamination and confusion flag, cc_flags, and their photomet-ric quality flag, ph_qual. As suggested on the WISE “Caution-ary Notes" page5, we recommend using only those matches withcc_flags = “0000” to exclude objects that are flagged as spuri-ous detections of image artifacts in any band. Full details aboutquantities provided in the AllWISE Source Catalog can be foundon their online documentation6.
7.5. UKIDSS
As for DR12Q, near infrared images from the UKIRT InfraredDeep Sky Survey (UKIDSS; Lawrence et al. 2007) are force-photometered.
We provide the fluxes and their associated errors, expressedin W m−2 Hz−1, in the Y, J, H and K bands. The conversion to theVega magnitudes, as used in 2MASS, is given by the formula:
magX = −2.5 × logfX
f0,X × 10−26 , (2)
where X denotes the filter and the zero-point values f0,X are2026, 1530, 1019 and 631 for the Y, J, H and K bands respec-tively.
A total of 112 012 quasars are detected in at least one of thefour bands Y, J, H or K. 111 083 objects are detected in the Yband, 110 691 in the J band, 110 630 in H band, 111 245 in theK band and 108 392 objects have non-zero fluxes in the fourbands. Objects with zero fluxes lie outside the UKIDSS foot-print. The UKIDSS limiting magnitude is K ∼ 18 (for the Large3 see http://www.ipac.caltech.edu/2mass/releases/allsky/doc/explsup.htmlfor more details4 http://wise2.ipac.caltech.edu/docs/release/allwise/5 http://wise2.ipac.caltech.edu/docs/release/allsky/expsup/sec1_4b.html#unreliab6 http://wise2.ipac.caltech.edu/docs/release/allsky/expsup/sec2_2a.html
Article number, page 9 of 16

A&A proofs: manuscript no. DR14Q_v1
0.0 0.2 0.4 0.6 0.8 1.0Quasar Redshift
0.0
0.2
0.4
0.6
0.8
1.0
0 1 2 3 4 50.00.20.40.60.81.01.21.41.61.8
Num
ber
of
quasa
rs
1e4
SDSS-I/II
SDSS-III
SDSS-IV
0 1 2 3 4 50.0
0.2
0.4
0.6
0.8
1.0
1.2
1.4
1.61e4
CORE
CORE (new)
PTF
PTF (new)
TDSS
Other
Fig. 5. Left Panel: Redshift distribution of DR14Q quasars (black thick histogram) in the range 0 ≤ z ≤ 5. The redshift distribution of quasarsobserved as part of SDSS-I/II is shown with a cyan histogram. The redshift distributions of quasars observed as part of SDSS-III (purple histogram)and SDSS-IV (red histogram) are also displayed. Right Panel: Redshift distributions of all CORE quasars that are part of DR14Q (dark bluehistogram), CORE quasars observed as part of SDSS-IV/eBOSS (light blue histogram), all PTF quasars (brown histogram), PTF quasars observedas part of SDSS-IV/eBOSS (orange histogram), SDSS-IV/TDSS quasars (green histogram) and quasars observed as part of ancillary programs(pink histogram). Some quasars can be selected by several target selection algorithms, hence the cumulative number of quasars in a single redshiftbin can exceed the total number in that bin. The bin size for both panels is ∆z = 0.05.
0.0 0.2 0.4 0.6 0.8 1.0r-mag (corrected for Galactic extinction)
0.0
0.2
0.4
0.6
0.8
1.0
16 17 18 19 20 21 22 230.0
0.5
1.0
1.5
2.0
Num
ber
of
quasa
rs
1e4
SDSS-I/II
SDSS-III
SDSS-IV
All
16 17 18 19 20 21 22 230.00.20.40.60.81.01.21.41.61.81e4
CORE
CORE (new)
PTF
PTF (new)
TDSS
Other
Fig. 6. Left Panel: Distribution of r-band magnitude corrected for Galactic extinction using the Schlafly & Finkbeiner (2011) dust maps for allDR14Q quasars (thick black histogram), quasars observed during SDSS-I/II (cyan histogram), SDSS-III (purple histogram) and SDSS-IV (redhistogram). Right Panel: Distribution of r-band magnitude corrected for Galactic extinction for all CORE quasars (dark blue histogram), COREquasars observed as part of SDSS-IV only (light blue histogram), all PTF quasars (brown histogram), PTF quasars observed as part of SDSS-IVonly (orange histogram), SDSS-IV/TDSS quasars (green histogram), and quasars selected as part of ancillary programs (pink histogram). A givenquasar can be selected by several target selection algorithms, hence the cumulative number of quasars in a r-band magnitude bin can exceed thetotal number of objects in it. The bin size for both panels is ∆r = 0.1.
Area Survey) while the 2MASS limiting magnitude in the sameband is ∼ 15.3. This difference in depth between the two sur-veys explains the large difference in the numbers of matches withDR14Q.
7.6. ROSAT
As was done for the previous SDSS-III/BOSS quasar catalogs,we matched the DR14Q quasars to the ROSAT all sky surveyFaint (Voges et al. 2000) and Bright (Voges et al. 1999) sourcecatalogues with a matching radius of 30′′. Only the most reliabledetections are included in our catalog: when the quality detec-tion is flagged as potentially problematic, we do not include the
Article number, page 10 of 16

Isabelle Pâris et al.: The Sloan Digital Sky Survey Quasar Catalog: Fourteenth Data Release
0.0 0.5 1.0 1.5 2.0 2.5 3.0 3.5 4.0 4.5Redshift
30
28
26
24
22
20
Mi[
z=2
]
SDSS-I/IISDSS-IIISDSS-IV
8
16
24
32
40
48
56
64
72
Num
ber
of
quasa
rs in b
ins
of
∆z=
0.1
and ∆
Mi=
0.1
Fig. 7. Density map of the DR14Q quasars in the L− z plane. The colormap indicates the number of DR14Q quasars in bins of ∆z = 0.1 and∆Mi [z = 2] = 0.1. Colored contours correspond to the envelope in theL−z plane for each iteration of SDSS. The absolute magnitudes assumeH0 = 70 km s−1 Mpc−1 and the K-correction is given by Richards et al.(2006), who define K (z = 2) = 0.
match. A total of 8 655 quasars are detected in one of the RASScatalogs. As for the cross-correlations described above, we esti-mate that 2.1% of the RASS-DR14Q matches are due to chancesuperposition.
7.7. XMM-Newton
DR14Q was cross-correlated with the seventh data release ofthe Third XMM-Newton Serendipitous Source Catalog (Rosenet al. 2016)7 (3XMM-DR7) using a standard 5.0′′ matching ra-dius. For each of the 14 736 DR14Q quasars with XMM-Newtoncounterparts, we report the soft (0.2–2 keV), hard (4.5–12 keV)and total (0.2–12 keV) fluxes, and associated errors, that werecomputed as the weighted average of all the detections in thethree XMM-Newton cameras (MOS1, MOS2, PN). Correspond-ing observed X-ray luminosities are computed in each band andare not absorption corrected. All fluxes and errors are expressedin erg cm−2 s−1 and luminosities are computed using the redshiftvalue Z from the present catalog.
8. Description of the DR14Q catalog
The DR14Q catalog is publicly available on the SDSS publicwebsite8 as a binary FITS table file. All the required documen-tation (format, name, unit for each column) is provided in theFITS header. It is also summarized in Table 5.
Notes on the catalog columns:1. The DR14 object designation, given by the formatSDSS Jhhmmss.ss+ddmmss.s; only the final 18 characters arelisted in the catalog (i.e., the character string "SDSS J" isdropped). The coordinates in the object name follow IAU con-vention and are truncated, not rounded.7 http://xmmssc.irap.omp.eu/Catalogue/3XMM-DR7/3XMM_DR7.html8 http://www.sdss.org/dr14/algorithms/qso_catalog
2-3. The J2000 coordinates (Right Ascension and Declination) indecimal degrees. The astrometry is from SDSS-DR14 (Abolfathiet al. 2017).4. The 64-bit integer that uniquely describes the objects thatare listed in the SDSS (photometric and spectroscopic) catalogs(THING_ID).5-7. Information about the spectroscopic observation (Spectro-scopic plate number, Modified Julian Date, and spectroscopicfiber number) used to determine the characteristics of the spec-trum. These three numbers are unique for each spectrum, andcan be used to retrieve the digital spectra from the public SDSSdatabase. When an object has been observed more than once,we selected the best quality spectrum as defined by the SDSSpipeline (Bolton et al. 2012), i.e. with SPECPRIMARY = 1.8. DR14Q compiles all spectroscopic observations of quasars,including SDSS-I/II spectra taken with a different spectrograph.For spectra taken with the SDSS spectrographs, i.e. spectra re-leased prior to SDSS-DR8 (Aihara et al. 2011), SPECTRO is set to”SDSS”. For spectra taken with the BOSS spectrographs (Smeeet al. 2013), SPECTRO is set to ”BOSS”.9-11. Quasar redshift (col. #9) and associated error (col. #10).This redshift estimate is the most robust for quasar catalogingpurposes and it is used as a prior for refined redshift measure-ments. Values reported in col. #9 are from different sources: theoutcome of the automated procedure described in Section 3.2,visual inspection or the BOSS pipeline (Bolton et al. 2012). Theorigin of the redshift value is given in col. #11 (AUTO, VI andPIPE respectively).12. Redshift from the visual inspection, Z_VI, when available.All SDSS-I/II/III quasars have been visually inspected. About7% of SDSS-IV quasars have been through this process (see Sec-tion 3.2 for more details).13-15. Redshift (Z_PIPE, col. #13), associated error(Z_PIPE_ERR, col. #14) and quality flag (ZWARNING, col.#15) from the BOSS pipeline (Bolton et al. 2012). ZWARN-ING > 0 indicates uncertain results in the redshift-fittingcode.16-17. Automatic redshift estimate (Z_PCA, col. #16) and asso-ciated error (Z_PCA_ERR, col. #17) using a linear combinationof four principal components (see Section 4 for details). Whenthe velocity difference between the automatic PCA and visual in-spection redshift estimates is larger than 5 000 km s−1, this PCAredshift and error are set to −1.18. Redshifts measured from the Mg ii emission line from a lin-ear combination of five principal components (see Pâris et al.2012). The line redshift is estimated using the position of themaximum of each emission line, contrary to Z_PCA (column#16) which is a global estimate using all the information avail-able in a given spectrum.19-24. The main target selection information for SDSS-III/BOSS quasars is tracked with the BOSS_TARGET1 flag bits(col #19; see Table 2 in Ross et al. 2012, for a full descrip-tion). SDSS-III ancillary program target selection is tracked withthe ANCILLARY_TARGET1 (col. #20) and ANCILLARY_TARGET2(col. #21) flag bits. The bit values and the corresponding pro-gram names are listed in Dawson et al. (2013), and Alamet al. (2015). Target selection information for the SDSS-IV pi-lot survey (SEQUELS; Dawson et al. 2016; Myers et al. 2015)is tracked with the EBOSS_TARGET0 flag bits (col. #22). Fi-nally, target selection information for SDSS-IV/eBOSS, SDSS-IV/TDSS and SDSS-IV/SPIDERS quasars is tracked with theEBOSS_TARGET1 and EBOSS_TARGET2 flag bits. All the targetselection bits, program names and associated references are sum-marized in Table 1.
Article number, page 11 of 16

A&A proofs: manuscript no. DR14Q_v1
25-31. If a quasar in DR14Q was observed more than onceby SDSS-I/II/III/IV, the number of additional SDSS-I/II spec-tra is given by N_SPEC_SDSS (col. #25), the number ofadditional SDSS-III/IV spectra by N_SPEC_BOSS (col. #26),and the total number by N_SPEC (col. #27). The associ-ated plate (PLATE_DUPLICATE, MJD (MJD_DUPLICATE), fiber(FIBERID_DUPLICATE) numbers, and spectrograph informa-tion (SPECTRO_DUPLICATE) are given in Col. #28, 29, 30and 31 respectively. If a quasar was observed N times intotal, the best spectrum is identified in Col. #5-7, the cor-responding N_SPEC is N-1, and the first N-1 columns ofPLATE_DUPLICATE, MJD_DUPLICATE, FIBERID_DUPLICATE,and SPECTRO_DUPLICATE are filled with relevant information.Remaining columns are set to -1.32-33. Balnicity index (BI; Weymann et al. 1991, ; col. #32)for C iv troughs, and associated error (col. #33), expressed inkm s−1. See definition in Section 5. The Balnicity index is mea-sured for quasars with z > 1.57 only, so that the trough entersinto the BOSS wavelength region. In cases with poor fits to thecontinuum, the balnicity index and its error are set to −1.34. The SDSS Imaging Run number (RUN_NUMBER) of the pho-tometric observation used in the catalog.35-38. Additional SDSS processing information: the photo-metric processing rerun number (RERUN_NUMBER, col. #35);the camera column (1–6) containing the image of the object(COL_NUMBER, col. #36), the field number of the run containingthe object (FIELD_NUMBER, col. #37), and the object identifica-tion number (OBJ_ID, col. #38; see Stoughton et al. 2002, fordescriptions of these parameters).39-40. DR14 PSF fluxes, expressed in nanomaggies9, and in-verse variances (not corrected for Galactic extinction) in the fiveSDSS filters.41-42. DR14 PSF AB magnitudes (Oke & Gunn 1983) and er-rors (not corrected for Galactic extinction) in the five SDSS fil-ters. These magnitudes are Asinh magnitudes as defined in Lup-ton et al. (1999).43. The absolute magnitude in the i band at z = 2 calculatedusing a power-law (frequency) continuum index of −0.5. The K-correction is computed using Table 4 from Richards et al. (2006).We use the SDSS primary photometry to compute this value.44. Galactic extinction in the five SDSS bands based on Schlafly& Finkbeiner (2011).45. The logarithm of the vignetting-corrected count rate (photonss−1) in the broad energy band (0.1–2.4 keV) from the ROSATAll-Sky Survey Faint Source Catalog (Voges et al. 2000) andthe ROSAT All-Sky Survey Bright Source Catalog (Voges et al.1999). The matching radius was set to 30′′ (see Section 7.6).46. The S/N of the ROSAT measurement.47. Angular separation between the SDSS and ROSAT All-SkySurvey locations (in arcseconds).48-49. Soft X-ray flux (0.2–2 keV) from XMM-Newton match-ing, expressed in erg cm−2 s−1, and its error. In the case of mul-tiple observations, the values reported here are the weighted av-erage of all the XMM-Newton detections in this band.50-51. Hard X-ray flux (4.5–12 keV) from XMM-Newtonmatching, expressed in erg cm−2 s−1, and its error. In the caseof multiple observations, the reported values are the weightedaverage of all the XMM-Newton detections in this band.52-53. Total X-ray flux (0.2–12 keV) from the threeXMM-Newton CCDs (MOS1, MOS2 and PN), expressed inerg cm−2 s−1, and its error. In the case of multiple XMM-Newton
9 See http://www.sdss.org/dr14/algorithms/magnitudes/#nmgy
observations, only the longest exposure was used to compute thereported flux.54. Total X-ray luminosity (0.2–12 keV) derived from the fluxcomputed in Col. #52, expressed in erg s−1. This value is com-puted using the redshift value reported in col. #9 and is not ab-sorption corrected.55. Angular separation between the XMM-Newton and SDSS-DR14 locations, expressed in arcsec.56. If a SDSS-DR14 quasar matches with GALEX pho-tometring, GALEX_MATCHED is set to 1, 0 if no GALEX match.57-60. UV fluxes and inverse variances from GALEX, aperture-photometered from the original GALEX images in the two bandsFUV and NUV. The fluxes are expressed in nanomaggies.61-62. The J magnitude and error from the Two Micron All SkySurvey All-Sky Data Release Point Source Catalog (Cutri et al.2003) using a matching radius of 2.0′′ (see Section 7.3). A non-detection by 2MASS is indicated by a "0.000" in these columns.The 2MASS measurements are in Vega, not AB, magnitudes.63-64. Signal-to-noise ratio in the J band and corresponding2MASS jr_d flag that gives the meaning of the peculiar valuesof the magnitude and its error10.65-68. Same as 61-64 for the H-band.69-72. Same as 61-64 for the K-band.73. Angular separation between the SDSS-DR14 and 2MASSpositions (in arcsec).74-75. The w1 magnitude and error from the Wide-field InfraredSurvey Explorer (WISE; Wright et al. 2010) AllWISE Data Re-lease Point Source Catalog using a matching radius of 2′′.76-77. Signal-to-noise ratio and χ2 in the WISE w1 band.78-81. Same as 74-77 for the w2-band.82-85. Same as 74-77 for the w3-band.86-89. Same as 74-77 for the w4-band.90. WISE contamination and confusion flag.91. WISE photometric quality flag.92. Angular separation between SDSS-DR14 and WISE posi-tions (in arcsec).93. If a SDSS-DR14 quasar matches UKIDSS aperture-photometering data, UKIDSS_MATCHED is set to 1, it is set to 0if UKIDSS match.94-101. Flux density and error from UKIDSS, aperture-photometered from the original UKIDSS images in the fourbands Y (Col. #94-95), J (Col. #96-97), H (Col. #98-99) andK (Col. #100-101). The fluxes and errors are expressed inW m−2 Hz−1.102. If there is a source in the FIRST radio catalog (ver-sion December 2014) within 2.0′′ of the quasar position, theFIRST_MATCHED flag provided in this column is set to 1, 0 ifnot. If the quasar lies outside of the FIRST footprint, it is set to-1.103. The FIRST peak flux density, expressed in mJy.104. The signal-to-noise ratio of the FIRST source whose flux isgiven in Col. #103.105. Angular separation between the SDSS-DR14 and FIRSTpositions (in arcsec).
9. Conclusion
We have presented the quasar catalog of the SDSS-IV/eBOSSsurvey corresponding to Data Release 14 of SDSS and result-ing from the first two years of SDSS-IV observations. The cat-alog, DR14Q, contains 526 356 quasars, 144 046 of which are
10 see http://www.ipac.caltech.edu/2mass/releases/allsky/doc/ ex-plsup.html
Article number, page 12 of 16

Isabelle Pâris et al.: The Sloan Digital Sky Survey Quasar Catalog: Fourteenth Data Release
new discoveries. We provide robust identification from the ap-plication of an automated procedure and partial visual inspec-tion of about 10% of the sample (likely ill-identified targets bythe automated procedure). Refined redshift measurements basedon the result of a principal component analysis of the spectraare also given. The present catalog contains about 80% morequasars at z < 2 than our previous release (Pâris et al. 2017). Aspart of DR14Q, we also provide a catalog of 21 877 BAL quasarsand their properties. Multi-wavelength matching with GALEX,2MASS, UKIDSS, WISE, FIRST, RASS and XMM-Newton ob-servations is also provided as part of DR14Q.The next SDSS public release containing new eBOSS data isscheduled for the summer of 2019 and will contain spectroscopicdata after four years of observations, which should representmore than 700 000 quasars.Acknowledgements. IP acknowledges the support of the OCEVU Labex (ANR-11-LABX-0060) and the A*MIDEX project (ANR-11-IDEX-0001-02) fundedby the “Investissements d’Avenir” French government program managed by theANR. The French Participation Group to SDSS-IV was supported by the AgenceNationale de la Recherche under contracts ANR-16-CE31-0021.AW acknowledges support from a Leverhulme Trust Early Career Fellowship.ADM and BWL acknowledge support from National Science Foundation grants1515404 and 1616168.IP thanks warmly the Great and Extremely COol team, especially SamuelBoissier, Jean-Claude Bouret, Sylvain de la Torre, Audrey Delsanti, OlivierGroussin, Olivier Perfect Ilbert, Éric Jullo, Vincent Le Brun, and SébastienVives, for encouraging creativity and for dealing with its unexpected conse-quences.This research has made use of data obtained from the 3XMM XMM-Newtonserendipitous source catalogue compiled by the 10 institutes of the XMM-Newton Survey Science Centre selected by ESA. Funding for the Sloan DigitalSky Survey IV has been provided by the Alfred P. Sloan Foundation, the U.S. De-partment of Energy Office of Science, and the Participating Institutions. SDSS-IV acknowledges support and resources from the Center for High-PerformanceComputing at the University of Utah. The SDSS web site is www.sdss.org.SDSS-IV is managed by the Astrophysical Research Consortium for the Par-ticipating Institutions of the SDSS Collaboration including the Brazilian Partic-ipation Group, the Carnegie Institution for Science, Carnegie Mellon Univer-sity, the Chilean Participation Group, the French Participation Group, Harvard-Smithsonian Center for Astrophysics, Instituto de Astrofísica de Canarias, TheJohns Hopkins University, Kavli Institute for the Physics and Mathematics ofthe Universe (IPMU) / University of Tokyo, Lawrence Berkeley National Lab-oratory, Leibniz Institut für Astrophysik Potsdam (AIP), Max-Planck-Institutfür Astronomie (MPIA Heidelberg), Max-Planck-Institut für Astrophysik (MPAGarching), Max-Planck-Institut für Extraterrestrische Physik (MPE), NationalAstronomical Observatory of China, New Mexico State University, New YorkUniversity, University of Notre Dame, Observatário Nacional / MCTI, The OhioState University, Pennsylvania State University, Shanghai Astronomical Obser-vatory, United Kingdom Participation Group, Universidad Nacional Autónomade México, University of Arizona, University of Colorado Boulder, Universityof Oxford, University of Portsmouth, University of Utah, University of Virginia,University of Washington, University of Wisconsin, Vanderbilt University, andYale University.
ReferencesAbolfathi, B., Aguado, D. S., Aguilar, G., et al. 2017, ArXiv:1707.09322
[arXiv:1707.09322]Adelman-McCarthy, J. K., Agüeros, M. A., Allam, S. S., et al. 2008, ApJS, 175,
297Ahn, C. P., Alexandroff, R., Allende Prieto, C., et al. 2014, ApJS, 211, 17Ahn, C. P., Alexandroff, R., Allende Prieto, C., et al. 2012, ApJS, 203, 21Aihara, H., Allende Prieto, C., An, D., et al. 2011, ApJS, 193, 29Alam, S., Albareti, F. D., Allende Prieto, C., et al. 2015, ApJS, 219, 12Albareti, F. D., Allende Prieto, C., Almeida, A., et al. 2016, ArXiv:1608.02013
[arXiv:1608.02013]Alexandroff, R., Strauss, M. A., Greene, J. E., et al. 2013, MNRAS, 435, 3306Allen, J. T., Hewett, P. C., Maddox, N., Richards, G. T., & Belokurov, V. 2011,
MNRAS, 410, 860Bautista, J. E., Busca, N. G., Guy, J., et al. 2017, A&A, 603, A12Becker, R. H., White, R. L., & Helfand, D. J. 1995, ApJ, 450, 559Blanton, M. R., Bershady, M. A., Abolfathi, B., et al. 2017, AJ, 154, 28Boller, T., Freyberg, M. J., Trümper, J., et al. 2016, A&A, 588, A103
Bolton, A. S., Schlegel, D. J., Aubourg, É., et al. 2012, AJ, 144, 144Bovy, J., Hennawi, J. F., Hogg, D. W., et al. 2011, ApJ, 729, 141Bovy, J., Myers, A. D., Hennawi, J. F., et al. 2012, ApJ, 749, 41Boyle, B. J., Shanks, T., & Peterson, B. A. 1988, MNRAS, 235, 935Clerc, N., Merloni, A., Zhang, Y.-Y., et al. 2016, MNRAS, 463, 4490Croom, S. M., Smith, R. J., Boyle, B. J., et al. 2004, MNRAS, 349, 1397Cutri, R. M., Skrutskie, M. F., van Dyk, S., et al. 2003, VizieR Online Data
Catalog, 2246, 0Dawson, K. S., Kneib, J.-P., Percival, W. J., et al. 2016, AJ, 151, 44Dawson, K. S., Schlegel, D. J., Ahn, C. P., et al. 2013, AJ, 145, 10Diamond-Stanic, A. M., Fan, X., Brandt, W. N., & et al. 2009, ApJ, 699, 782du Mas des Bourboux, H., Le Goff, J.-M., Blomqvist, M., et al. 2017,
ArXiv:1708.02225 [arXiv:1708.02225]Dwelly, T., Salvato, M., Merloni, A., et al. 2017, MNRAS, 469, 1065Eftekharzadeh, S., Myers, A. D., White, M., et al. 2015, ArXiv:1507.08380
[arXiv:1507.08380]Eisenstein, D. J., Weinberg, D. H., Agol, E., et al. 2011, AJ, 142, 72Fan, X., Strauss, M. A., Richards, G. T., et al. 2006, AJ, 131, 1203Fathivavsari, H., Petitjean, P., Zou, S., et al. 2017, MNRAS, 466, L58Filiz Ak, N., Brandt, W. N., Hall, P. B., et al. 2012, ApJ, 757, 114Filiz Ak, N., Brandt, W. N., Hall, P. B., et al. 2013, ApJ, 777, 168Filiz Ak, N., Brandt, W. N., Hall, P. B., et al. 2014, ApJ, 791, 88Finkbeiner, D. P., Schlafly, E. F., Schlegel, D. J., et al. 2016, ApJ, 822, 66Finley, H., Petitjean, P., Pâris, I., et al. 2013, A&A, 558, A111Fukugita, M., Ichikawa, T., Gunn, J. E., et al. 1996, AJ, 111, 1748Gibson, R. R., Brandt, W. N., Schneider, D. P., & Gallagher, S. C. 2008, ApJ,
675, 985Gibson, R. R., Jiang, L., Brandt, W. N., et al. 2009, ApJ, 692, 758Gunn, J. E., Carr, M., Rockosi, C., et al. 1998, AJ, 116, 3040Gunn, J. E., Siegmund, W. A., Mannery, E. J., et al. 2006, AJ, 131, 2332Hall, P. B., Anderson, S. F., Strauss, M. A., et al. 2002, ApJS, 141, 267Hamann, F., Zakamska, N. L., Ross, N., et al. 2017, MNRAS, 464, 3431Hennawi, J. F., Strauss, M. A., Oguri, M., et al. 2006, AJ, 131, 1Hewett, P. C., Foltz, C. B., & Chaffee, F. H. 1995, AJ, 109, 1498Hewett, P. C. & Wild, V. 2010, MNRAS, 405, 2302(HW10)Hogg, D. W., Finkbeiner, D. P., Schlegel, D. J., & Gunn, J. E. 2001, AJ, 122,
2129Ivezic, Ž., Lupton, R. H., Schlegel, D., et al. 2004, Astronomische Nachrichten,
325, 583Jiang, L., Fan, X., Annis, J., et al. 2008, AJ, 135, 1057Kaiser, N., Aussel, H., Burke, B. E., et al. 2002, in Society of Photo-Optical
Instrumentation Engineers (SPIE) Conference Series, Vol. 4836, Survey andOther Telescope Technologies and Discoveries, ed. J. A. Tyson & S. Wolff,154–164
Kaiser, N., Burgett, W., Chambers, K., et al. 2010, in Society of Photo-OpticalInstrumentation Engineers (SPIE) Conference Series, Vol. 7733, Society ofPhoto-Optical Instrumentation Engineers (SPIE) Conference Series, 0
Kirkpatrick, J. A., Schlegel, D. J., Ross, N. P., et al. 2011, ApJ, 743, 125Krawczyk, C. M., Richards, G. T., Mehta, S. S., et al. 2013, ApJS, 206, 4Laher, R. R., Surace, J., Grillmair, C. J., et al. 2014, PASP, 126, 674Lang, D. 2014, AJ, 147, 108Law, N. M., Kulkarni, S. R., Dekany, R. G., et al. 2009, PASP, 121, 1395Lawrence, A., Warren, S. J., Almaini, O., et al. 2007, MNRAS, 379, 1599Lupton, R., Gunn, J. E., Ivezic, Z., et al. 2001, in Astronomical Society of the
Pacific Conference Series, Vol. 238, Astronomical Data Analysis Softwareand Systems X, ed. F. R. Harnden Jr., F. A. Primini, & H. E. Payne, 269
Lupton, R. H., Gunn, J. E., & Szalay, A. S. 1999, AJ, 118, 1406MacLeod, C. L., Green, P. J., Anderson, S. F., et al. 2017, ArXiv:1706.04240
[arXiv:1706.04240]Mainzer, A., Bauer, J., Grav, T., et al. 2011, ApJ, 731, 53Martin, D. C., Fanson, J., Schiminovich, D., et al. 2005, ApJ, 619, L1Merloni, A., Predehl, P., Becker, W., et al. 2012, ArXiv e-prints
[arXiv:1209.3114]Morganson, E., Green, P. J., Anderson, S. F., et al. 2015, ApJ, 806, 244Myers, A. D., Palanque-Delabrouille, N., Prakash, A., et al. 2015, ApJS, 221, 27Oke, J. B. & Gunn, J. E. 1983, ApJ, 266, 713Osmer, P. S. & Smith, M. G. 1980, ApJS, 42, 333Padmanabhan, N., Schlegel, D. J., Finkbeiner, D. P., et al. 2008, ApJ, 674, 1217Palanque-Delabrouille, N., Magneville, C., Yèche, C., et al. 2013, A&A, 551,
A29Palanque-Delabrouille, N., Magneville, C., Yèche, C., et al. 2016, A&A, 587,
A41Palanque-Delabrouille, N., Yèche, C., Myers, A. D., et al. 2011, A&A, 530,
A122Pâris, I., Petitjean, P., Aubourg, É., et al. 2012, A&A, 548, A66Pâris, I., Petitjean, P., Aubourg, É., et al. 2014, A&A, 563, A54Pâris, I., Petitjean, P., Ross, N. P., et al. 2017, A&A, 597, A79Pier, J. R., Munn, J. A., Hindsley, R. B., et al. 2003, AJ, 125, 1559
Article number, page 13 of 16

A&A proofs: manuscript no. DR14Q_v1
Predehl, P., Andritschke, R., Böhringer, H., et al. 2010, in Proc. SPIE, Vol.7732, Space Telescopes and Instrumentation 2010: Ultraviolet to GammaRay, 77320U
Rau, A., Kulkarni, S. R., Law, N. M., et al. 2009, PASP, 121, 1334
Reichard, T. A., Richards, G. T., Schneider, D. P., et al. 2003, AJ, 125, 1711
Reyes, R., Zakamska, N. L., Strauss, M. A., et al. 2008, AJ, 136, 2373
Richards, G. T., Fan, X., Newberg, H. J., et al. 2002, AJ, 123, 2945
Richards, G. T., Nichol, R. C., Gray, A. G., et al. 2004, ApJS, 155, 257
Richards, G. T., Strauss, M. A., Fan, X., et al. 2006, AJ, 131, 2766
Rosen, S. R., Webb, N. A., Watson, M. G., et al. 2016, A&A, 590, A1
Ross, N. P., Hamann, F., Zakamska, N. L., et al. 2015, MNRAS, 453, 3932
Ross, N. P., McGreer, I. D., White, M., et al. 2013, ApJ, 773, 14
Ross, N. P., Myers, A. D., Sheldon, E. S., et al. 2012, ApJS, 199, 3
Ruan, J. J., Anderson, S. F., Green, P. J., et al. 2016, ApJ, 825, 137
Schlafly, E. F. & Finkbeiner, D. P. 2011, ApJ, 737, 103
Schlafly, E. F., Finkbeiner, D. P., Juric, M., et al. 2012, ApJ, 756, 158
Schmidt, M. 1963, Nature, 197, 1040
Schmidt, M. & Green, R. F. 1983, ApJ, 269, 352
Schneider, D. P., Hall, P. B., Richards, G. T., et al. 2007, AJ, 134, 102
Schneider, D. P., Richards, G. T., Hall, P. B., et al. 2010, AJ, 139, 2360
Shen, Y., Brandt, W. N., Denney, K. D., et al. 2016, ArXiv:1602.03894[arXiv:1602.03894]
Shen, Y., Strauss, M. A., Oguri, M., et al. 2007, AJ, 133, 2222
Skrutskie, M. F., Cutri, R. M., Stiening, R., et al. 2006, AJ, 131, 1163
Smee, S. A., Gunn, J. E., Uomoto, A., et al. 2013, AJ, 146, 32
Smith, J. A., Tucker, D. L., Kent, S., et al. 2002, AJ, 123, 2121
Spergel, D. N., Verde, L., Peiris, H. V., & et al. 2003, ApJS, 148, 175
Storrie-Lombardi, L. J., McMahon, R. G., Irwin, M. J., & Hazard, C. 1996, ApJ,468, 121
Stoughton, C., Lupton, R. H., Bernardi, M., et al. 2002, AJ, 123, 485
Trump, J. R., Hall, P. B., Reichard, T. A., et al. 2006, ApJS, 165, 1
Tucker, D. L., Kent, S., Richmond, M. W., et al. 2006, AstronomischeNachrichten, 327, 821
Voges, W., Aschenbach, B., Boller, T., et al. 1999, A&A, 349, 389
Voges, W., Aschenbach, B., Boller, T., et al. 2000, IAU Circ., 7432, 3
Weymann, R. J., Morris, S. L., Foltz, C. B., & Hewett, P. C. 1991, ApJ, 373, 23
Wright, E. L., Eisenhardt, P. R. M., Mainzer, A. K., et al. 2010, AJ, 140, 1868
Yèche, C., Petitjean, P., Rich, J., et al. 2010, A&A, 523, A14
York, D. G., Adelman, J., Anderson, Jr., J. E., et al. 2000, AJ, 120, 1579
1 Aix Marseille Univ, CNRS, LAM, Laboratoire d’Astrophysique deMarseille, Marseille, Francee-mail: [email protected]
2 Institut d‘Astropysique de Paris, UMR 7095, CNRS-UPMC, 98bisbd Arago, 75014 Paris, Francee-mail: [email protected]
3 APC, University of Paris Diderot, CNRS/IN2P3, CEA/IRFU, Ob-servatoire de Paris, Sorbonne Paris Cite, France
4 Department of Physics and Astronomy, University of Wyoming,Laramie, WY 82071, USA
5 Instituto de Astrofísica de Canarias, E-38205 La Laguna, Tenerife,Spain
6 Departamento de Astrofísica, Universidad de La Laguna (ULL), E-38206 La Laguna, Tenerife, Spain
7 Department of Astronomy, Box 351580, University of Washington,Seattle, WA 98195, USA
8 CEA, Centre de Saclay, IRFU, F-91191, Gif-sur-Yvette, France9 Department of Physics and Astronomy, University of Utah, 115 S.
1400 E., Salt Lake City, UT 84112, USA10 Center for Cosmology and Particle Physics, Department of Physics,
New York University, 726 Broadway, Room 1005, New York, NY10003, USA
11 Apache Point Observatory, P.O. Box 59, Sunspot, NM 88349, USA12 Department of Astronomy and Astrophysics, Eberly College of Sci-
ence, The Pennsylvania State University, 525 Davey Laboratory,University Park, PA 16802, USA
13 Institute for Gravitation and the Cosmos, The Pennsylvania StateUniversity, University Park, PA 16802, USA
14 Department of Physics, The Pennsylvania State University, Univer-sity Park, PA 16802, USA
15 Max-Planck-Institut für Extraterrestrische Physik, Gießenbachstr. 1,D-85748 Garching, Germany
16 Sorbonne Universités, Institut Lagrange de Paris (ILP), 98 bisBoulevard Arago, 75014 Paris, France
17 Laboratoire de Physique Nucléaire et de Hautes Energies, UniversitéPierre et Marie Curie, 4 Place Jussieu, 75005 Paris, France
18 Harvard-Smithsonian Center for Astrophysics, 60 Garden St., Cam-bridge, MA 02138, USA
19 Department of Physics and Astronomy, York University, 4700 KeeleSt., Toronto, ON, M3J 1P3, Canada
20 Institute of Physics, Laboratory of Astrophysics, Ecole Polytech-nique Fédérale de Lausanne (EPFL), Observatoire de Sauverny,1290 Versoix, Switzerland
21 Space Telescope Science Institute, 3700 San Martin Drive, Balti-more, MD 21218, USA
22 Steward Observatory, The University of Arizona, 933 North CherryAvenue, Tucson, AZ 85721–0065, USA
23 Institute of Cosmology& Gravitation, University of Portsmouth,Dennis Sciama Building, Portsmouth, PO1 3FX, UK
24 Center for Cosmology and AstroParticle Physics, The Ohio StateUniversity, 191 W. Woodruff Ave., Columbus, OH 43210, USA
25 Department of Physics and Astronomy, Sejong University, Seoul,143-747, Korea
26 Department of Physics and Astronomy, Ohio University, ClippingerLabs, Athens, OH 45701
27 School of Physics and Astronomy, University of St Andrews, NorthHaugh, St Andrews, KY16 9SS
28 National Optical Astronomy Observatory, 950 North Cherry Av-enue, Tucson, AZ 85719, USA
29 National Astronomical Observatories, Chinese Academy of Sci-ences, 20A Datun Road, Chaoyang District, Beijing 100012, China
Article number, page 14 of 16

Isabelle Pâris et al.: The Sloan Digital Sky Survey Quasar Catalog: Fourteenth Data Release
Table 5. Format of the binary FITS table containing DR14Q.
Column Name Format Description1 SDSS_NAME STRING SDSS-DR14 designation – hhmmss.ss+ddmmss.s (J2000)2 RA DOUBLE Right Ascension in decimal degrees (J2000)3 DEC DOUBLE Declination in decimal degrees (J2000)4 THING_ID INT32 Unique SDSS source identifier5 PLATE INT32 Spectroscopic plate number6 MJD INT32 Modified Julian Day of the spectroscopic
observation7 FIBERID INT32 Spectroscopic fiber number8 SPECTRO STRING SDSS or BOSS9 Z DOUBLE Redshift (most robust estimate for each quasar)
10 Z_ERR DOUBLE Error on redshift given in Col. #911 SOURCE_Z STRING Origin of the redshift measurement in Col. #9
(VI, PIPE, AUTO, OTHER)12 Z_VI DOUBLE Redshift based on visual inspection (when
available)13 Z_PIPE DOUBLE SDSS pipeline redshift estimate14 Z_PIPE_ERR DOUBLE Error on SDSS pipeline redshift estimate15 ZWARNING INT32 Quality flag on SDSS pipeline redshift estimate16 Z_PCA DOUBLE PCA redshift (homogeneous over the full sample)17 Z_PCA_ERR DOUBLE Error on PCA redshift18 Z_MGII DOUBLE Redshift of the Mg ii emission line19 BOSS_TARGET1 INT64 BOSS target selection flag for main survey20 ANCILLARY_TARGET1 INT64 BOSS target selection flag for ancillary programs21 ANCILLARY_TARGET2 INT64 BOSS target selection flag for ancillary programs22 EBOSS_TARGET0 INT64 Target selection flag for the eBOSS pilot survey23 EBOSS_TARGET1 INT64 eBOSS target selection flag24 EBOSS_TARGET2 INT64 eBOSS target selection flag25 N_SPEC_SDSS INT32 Number of additional SDSS spectra26 N_SPEC_BOSS INT32 Number of additional BOSS spectra27 N_SPEC INT32 Number of additional spectra (SDSS and BOSS)28 PLATE_DUPLICATE INT32[51] Spectroscopic plate number for each duplicate
spectrum29 MJD_DUPLICATE INT32[51] Spectroscopic MJD for each duplicate spectrum30 FIBERID_DUPLICATE INT32[51] Fiber number for each duplicate spectrum31 SPECTRO_DUPLICATE STRING[51] SDSS or BOSS for each duplicate spectrum32 BI_CIV FLOAT BALnicity Index of C iv absorption trough (in km s−1)33 ERR_BI_CIV FLOAT Error on the BALnicity index of C iv trough (in km s−1)34 RUN_NUMBER INT32 SDSS Imaging Run Number of photometric measurements35 RERUN_NUMBER STRING SDSS Photometric Processing Rerun Number36 COL_NUMBER INT32 SDSS Camera Column Number (1-6)37 FIELD_NUMBER INT32 SDSS Field Number38 OBJ_ID STRING SDSS Object Identification Number39 PSFFLUX FLOAT[5] Flux in the u, g, r, i and z bands40 IVAR_IVAR FLOAT[5] Inverse variance of the u, g, r, i and z fluxes41 PSFMAG FLOAT[5] PSF magnitudes in u, g, r, i and z bands42 ERR_PSFMAG FLOAT[5] Error on PSF magnitudes43 MI FLOAT Absolute magnitude in i band Mi [z = 2] with
H0 = 70 km s−1 Mpc−1, ΩM = 0.3, ΩΛ = 0.7,αν = −0.5
44 GAL_EXT FLOAT[5] Galactic extinction in the five SDSS bands(Schlafly et al., 2011)
45 RASS_COUNTS DOUBLE log RASS full band count rate (counts s−1)46 RASS_COUNTS_SNR FLOAT S/N of the RASS count rate47 SDSS2ROSAT_SEP DOUBLE SDSS-RASS separation in arcsec48 FLUX_0.2_2.0keV FLOAT Soft (0.2–2.0 keV) X-ray flux from XMM-Newton
expressed in erg s−1 cm−2
49 FLUX_0.2_2.0keV_ERR FLOAT Error on soft X-ray flux from XMM-Newton(in erg s−1 cm−2)
50 FLUX_2.0_12.0keV FLOAT Hard (4.5–12.0 keV) X-ray flux from XMM-Newton
Article number, page 15 of 16

A&A proofs: manuscript no. DR14Q_v1
Table 5. continued.
Column Name Format Descriptionexpressed in erg s−1 cm−2
51 FLUX_2.0_12.0keV_ERR FLOAT Error on hard X-ray flux from XMM-Newton(in erg s−1 cm−2)
52 FLUX_0.2_12.0keV FLOAT Total (0.2–12.0 keV) X-ray flux from XMM-Newtonexpressed in erg s−1 cm−2
53 FLUX_0.2_12.0keV_ERR FLOAT Error on total X-ray flux from XMM-Newton(in erg s−1 cm−2)
54 LUM_0.2_12.0keV FLOAT Total (0.2–12.0 keV) X-ray luminosity from XMM-Newtonexpressed in erg s−1
55 SDSS2XMM_SEP DOUBLE SDSS-XMM-Newton separation in arcsec56 GALEX_MATCHED SHORT GALEX match flag57 FUV DOUBLE f uv flux (GALEX)58 FUV_IVAR DOUBLE Inverse variance of f uv flux59 NUV DOUBLE nuv flux (GALEX)60 NUV_IVAR DOUBLE Inverse variance of nuv flux61 JMAG DOUBLE J magnitude (Vega, 2MASS)62 ERR_JMAG DOUBLE Error in J magnitude63 JSNR DOUBLE J-band S/N64 JRDFLAG INT32 J-band photometry flag65 HMAG DOUBLE H magnitude (Vega, 2MASS)66 ERR_HMAG DOUBLE Error in H magnitude67 HSNR DOUBLE H-band S/N68 HRDFLAG INT32 H-band photometry flag69 KMAG DOUBLE K magnitude (Vega, 2MASS)70 ERR_KMAG DOUBLE Error in K magnitude71 KSNR DOUBLE K-band S/N72 KRDFLAG INT32 K-band photometry flag73 SDSS2MASS_SEP DOUBLE SDSS-2MASS separation in arcsec74 W1MAG DOUBLE w1 magnitude (Vega, WISE)75 ERR_W1MAG DOUBLE Error in w1 magnitude76 W1SNR DOUBLE S/N in w1 band77 W1CHI2 DOUBLE χ2 in w1 band78 W2MAG DOUBLE w2 magnitude (Vega, WISE)79 ERR_W2MAG DOUBLE Error in w2 magnitude80 W2SNR DOUBLE S/N in w2 band81 W2CHI2 DOUBLE χ2 in w2 band82 W3MAG DOUBLE w3 magnitude (Vega, WISE)83 ERR_W3MAG DOUBLE Error in w3 magnitude84 W3SNR DOUBLE S/N in w3 band85 W3CHI2 DOUBLE χ2 in w3 band86 W4MAG DOUBLE w4 magnitude (Vega, WISE)87 ERR_W4MAG DOUBLE Error in w4 magnitude88 W4SNR DOUBLE S/N in w4 band89 W4CHI2 DOUBLE χ2 in w4 band90 CC_FLAGS STRING WISE contamination and confusion flag91 PH_FLAG STRING WISE photometric quality flag92 SDSS2WISE_SEP DOUBLE SDSS-WISE separation in arcsec93 UKIDSS_MATCHED SHORT UKIDSS Matched94 YFLUX DOUBLE Y-band flux density from UKIDSS (in W m−2 Hz−1)95 YFLUX_ERR DOUBLE Error in Y-band density flux from UKIDSS (in W m−2 Hz−1)96 JFLUX DOUBLE J-band flux density from UKIDSS (in W m−2 Hz−1)97 JFLUX_ERR DOUBLE Error in J-band flux density from UKIDSS (in W m−2 Hz−1)98 HFLUX DOUBLE H-band flux density from UKIDSS (in W m−2 Hz−1)99 HFLUX_ERR DOUBLE Error in H-band flux density from UKIDSS (in W m−2 Hz−1)100 KFLUX DOUBLE K-band flux density from UKIDSS (in W m−2 Hz−1)101 KFLUX_ERR DOUBLE Error in K-band flux density from UKIDSS (in W m−2 Hz−1)102 FIRST_MATCHED INT FIRST matched103 FIRST_FLUX DOUBLE FIRST peak flux density at 20 cm expressed in mJy104 FIRST_SNR DOUBLE S/N of the FIRST flux density105 SDSS2FIRST_SEP DOUBLE SDSS-FIRST separation in arcsec
Article number, page 16 of 16