Embed Size (px)
Citation preview
Journal of Geographic Information System, 2013, 5, 40-53 http://dx.doi.org/10.4236/jgis.2013.51005 Published Online February 2013 (http://www.scirp.org/journal/jgis)
The Site of Biological and Ecological Interest (SBEI) of Ain Asmama: 20 Years Later, What Are Changes?
Labbaci Adnane, Kabbachi Belkacem Geomaterials Laboratory, Geology Departement, Faculty of Sciences of Ibn Zohr, Ibn Zohr University, Agadir, Morocco
Email: [email protected], [email protected]
Received December 4, 2012; revised January 5, 2013; accepted February 6, 2013
ABSTRACT
Concerning this big SBEI (West of Morocco), its bioecological qualities especially its very specific and original flora has attracted naturalists for a long time. This region seems to be relatively preserved still despite the erosion and an- thropogenic advanced threats. The most effective method to evaluate the degree of environmental’s change caused by anthropogenic activity and climatic conditions is the multi-date study of land cover. For this, the purpose of this work is to analyze the land cover’s changes evolution in this SBEI from remote sensing technics. Concerning that, we did a tri-achronical approach on data from 1988 to 2000 and from 2000 to 2010 (LANDSAT imagery). The land cover’s maps that we got were produced from a supervised classification. The analysis of time series of LANDSAT images has shown that, during the period 1988-2000, the forests area decreased to the benefit of cultural practices (period before the creation of the SBEI), while the shrub strata distribution area has clearly increased during the period 2000-2010. Keywords: SBEI; Ain Asmama; LANDSAT; Supervised Classification; Land Cover; Morocco
1. Introduction
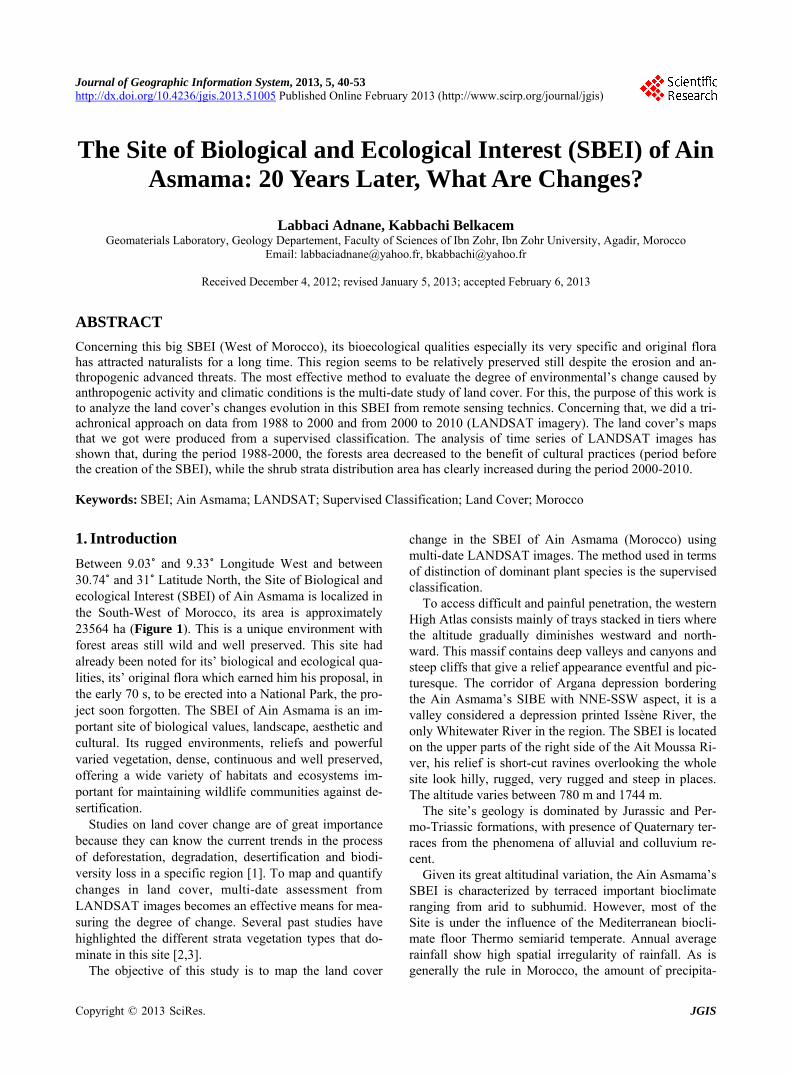
Between 9.03˚ and 9.33˚ Longitude West and between 30.74˚ and 31˚ Latitude North, the Site of Biological and ecological Interest (SBEI) of Ain Asmama is localized in the South-West of Morocco, its area is approximately 23564 ha (Figure 1). This is a unique environment with forest areas still wild and well preserved. This site had already been noted for its’ biological and ecological qua- lities, its’ original flora which earned him his proposal, in the early 70 s, to be erected into a National Park, the pro- ject soon forgotten. The SBEI of Ain Asmama is an im- portant site of biological values, landscape, aesthetic and cultural. Its rugged environments, reliefs and powerful varied vegetation, dense, continuous and well preserved, offering a wide variety of habitats and ecosystems im- portant for maintaining wildlife communities against de- sertification.
Studies on land cover change are of great importance because they can know the current trends in the process of deforestation, degradation, desertification and biodi- versity loss in a specific region [1]. To map and quantify changes in land cover, multi-date assessment from LANDSAT images becomes an effective means for mea- suring the degree of change. Several past studies have highlighted the different strata vegetation types that do- minate in this site [2,3].
The objective of this study is to map the land cover
change in the SBEI of Ain Asmama (Morocco) using multi-date LANDSAT images. The method used in terms of distinction of dominant plant species is the supervised classification.
To access difficult and painful penetration, the western High Atlas consists mainly of trays stacked in tiers where the altitude gradually diminishes westward and north- ward. This massif contains deep valleys and canyons and steep cliffs that give a relief appearance eventful and pic- turesque. The corridor of Argana depression bordering the Ain Asmama’s SIBE with NNE-SSW aspect, it is a valley considered a depression printed Issène River, the only Whitewater River in the region. The SBEI is located on the upper parts of the right side of the Ait Moussa Ri- ver, his relief is short-cut ravines overlooking the whole site look hilly, rugged, very rugged and steep in places. The altitude varies between 780 m and 1744 m.
The site’s geology is dominated by Jurassic and Per- mo-Triassic formations, with presence of Quaternary ter- races from the phenomena of alluvial and colluvium re- cent.
Given its great altitudinal variation, the Ain Asmama’s SBEI is characterized by terraced important bioclimate ranging from arid to subhumid. However, most of the Site is under the influence of the Mediterranean biocli- mate floor Thermo semiarid temperate. Annual average rainfall show high spatial irregularity of rainfall. As is generally the rule in Morocco, the amount of precipita-
Copyright © 2013 SciRes. JGIS
L. ADNANE, K. BELKACEM 41
15°0′W 10°0′W 5°0′W 0°0′W
40°0′N
35
°0′N
30
°0′N
25
°0′N
20
°0′N
Figure 1. Location map of Ain Asmama’s SBEI.
Copyright © 2013 SciRes. JGIS
L. ADNANE, K. BELKACEM 42
tion increases with altitude. The average annual rainfall varies between 220 mm and 548 mm. The maximum rainfall is recorded in the period from November to Feb- ruary. The driest period occurs during the months from June to September. Given the importance of altitudinal range in the region of SBEI, reliefs high altitudes are cool and well watered, including disturbances of Atlantic origin (from Northwest). The sides exposed to the south- east are largely immune to these disturbances, although they are strongly influenced by the hot dry winds from the South and Southeast (Chergui).
Spatial variations of temperature are influenced by two main factors: Continentally: the amplitude of thermal variations is
milder on the coast (Tamri: Mm = 11˚C), while the contrasts between the means of maxima and minima are increasing progressively as we advance towards inside (Argana Mm = 22˚C). Indeed, the Atlantic Ocean exerts a soothing effect on extreme tempera-tures in summer by reducing: M = 27˚C in Agadir; Tamri at 28˚C and 41˚C to Argana.
Terrain: given the available mountains and highlands of Ida Outanane Haha, summer temperatures decrease with altitude which would result in attenuation of the effect of continentality and softens the heat of the was (M = Argana 41˚C; or Ida ou Tanane M = 34˚C).
2. Methods
2.1. Determining the Scenes Making Changes to the Mapping of Land
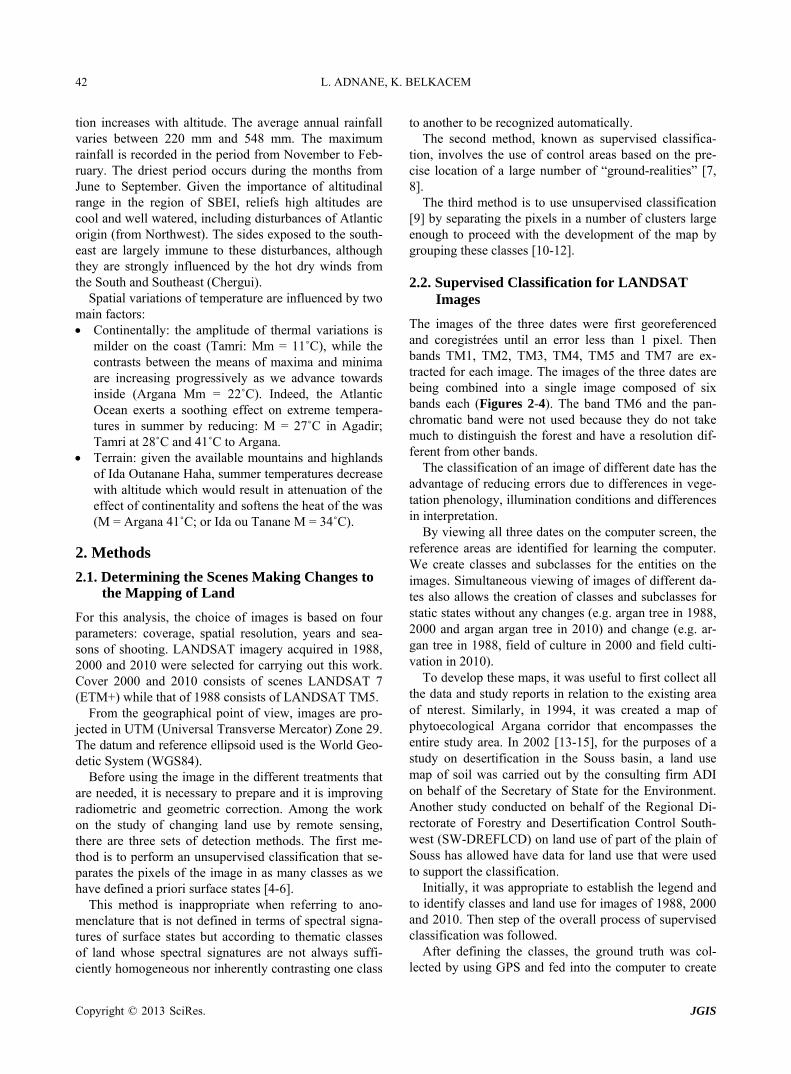
For this analysis, the choice of images is based on four parameters: coverage, spatial resolution, years and sea- sons of shooting. LANDSAT imagery acquired in 1988, 2000 and 2010 were selected for carrying out this work. Cover 2000 and 2010 consists of scenes LANDSAT 7 (ETM+) while that of 1988 consists of LANDSAT TM5.
From the geographical point of view, images are pro- jected in UTM (Universal Transverse Mercator) Zone 29. The datum and reference ellipsoid used is the World Geo- detic System (WGS84).
Before using the image in the different treatments that are needed, it is necessary to prepare and it is improving radiometric and geometric correction. Among the work on the study of changing land use by remote sensing, there are three sets of detection methods. The first me- thod is to perform an unsupervised classification that se- parates the pixels of the image in as many classes as we have defined a priori surface states [4-6].
This method is inappropriate when referring to ano- menclature that is not defined in terms of spectral signa- tures of surface states but according to thematic classes of land whose spectral signatures are not always suffi- ciently homogeneous nor inherently contrasting one class
to another to be recognized automatically. The second method, known as supervised classifica-
tion, involves the use of control areas based on the pre- cise location of a large number of “ground-realities” [7, 8].
The third method is to use unsupervised classification [9] by separating the pixels in a number of clusters large enough to proceed with the development of the map by grouping these classes [10-12].
2.2. Supervised Classification for LANDSAT Images
The images of the three dates were first georeferenced and coregistrées until an error less than 1 pixel. Then bands TM1, TM2, TM3, TM4, TM5 and TM7 are ex- tracted for each image. The images of the three dates are being combined into a single image composed of six bands each (Figures 2-4). The band TM6 and the pan- chromatic band were not used because they do not take much to distinguish the forest and have a resolution dif- ferent from other bands.
The classification of an image of different date has the advantage of reducing errors due to differences in vege- tation phenology, illumination conditions and differences in interpretation.
By viewing all three dates on the computer screen, the reference areas are identified for learning the computer. We create classes and subclasses for the entities on the images. Simultaneous viewing of images of different da- tes also allows the creation of classes and subclasses for static states without any changes (e.g. argan tree in 1988, 2000 and argan argan tree in 2010) and change (e.g. ar-gan tree in 1988, field of culture in 2000 and field culti- vation in 2010).
To develop these maps, it was useful to first collect all the data and study reports in relation to the existing area of nterest. Similarly, in 1994, it was created a map of phytoecological Argana corridor that encompasses the entire study area. In 2002 [13-15], for the purposes of a study on desertification in the Souss basin, a land use map of soil was carried out by the consulting firm ADI on behalf of the Secretary of State for the Environment. Another study conducted on behalf of the Regional Di- rectorate of Forestry and Desertification Control South- west (SW-DREFLCD) on land use of part of the plain of Souss has allowed have data for land use that were used to support the classification.
Initially, it was appropriate to establish the legend and to identify classes and land use for images of 1988, 2000 and 2010. Then step of the overall process of supervised classification was followed.
After defining the classes, the ground truth was col- ected by using GPS and fed into the computer to create l
Copyright © 2013 SciRes. JGIS
L. ADNANE, K. BELKACEM 43
125,000 130,000 135,000 140,000 145,000 150,000
125,000 130,000 135,000 140,000 145,000 150,
000
,00
0
455
,00
0
450
000
4
45,
,00
0
435
,000
440
,00
0
430
,00
0
425
,42
0
000
0 1 2 3 4 Km
S
E W
N
420,
000
425
,000
430
,000
4
35,0
00
44
0,00
0
44
5,00
0
450
,000
4
55,0
00
Figure 2. LANDSAT imagery TM5 acquired in 1988 (Bands 4, 5 and 3).
Copyright © 2013 SciRes. JGIS

L. ADNANE, K. BELKACEM 44
125,000 130,000 135,000 140,000 145,000 150,000
125,000 130,000 135,000 140,000 145,000 150,000
420,
000
4
25,0
00
430
,000
435,
000
4
40,0
00
44
5,00
0
450
,000
0 1 2 3 4 Km
S
E W
N
420,
000
42
5,00
0
430
,000
435
,000
440,
000
4
45,0
00
4
50,0
00
Figure 3. LANDSAT imagery ETM+ acquired in 2000 (Bands 4, 5 and 3).
Copyright © 2013 SciRes. JGIS
L. ADNANE, K. BELKACEM 45
125,000 130,000 135,000 140,000 145,000 150,000
125,000 130,000 135,000 140,000 145,000 150,000
420,
000
4
25,0
00
430
,000
4
35,0
00
4
40,0
00
44
5,00
0
4
50,0
00
45
5,00
0
0 1 2 3 4 Km
S
E W
N
420,
000
42
5,00
0
430
,000
435,
000
4
40,0
00
445
,000
450,
000
45
5,00
0
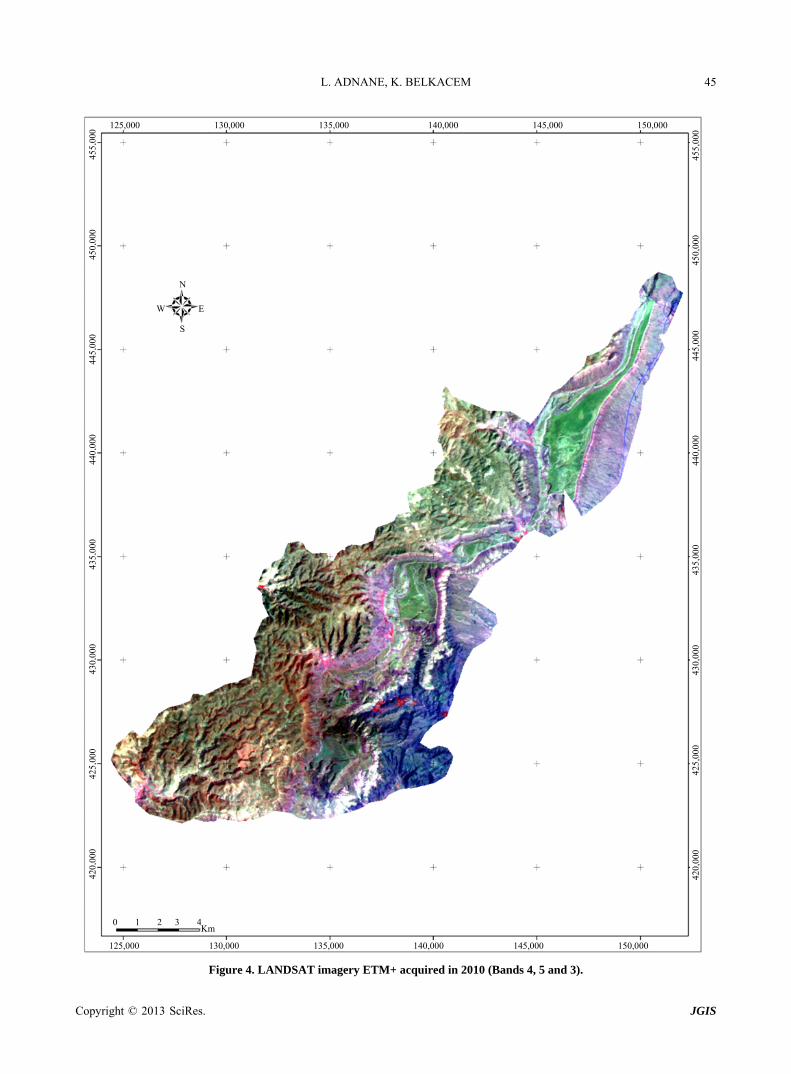
Figure 4. LANDSAT imagery ETM+ acquired in 2010 (Bands 4, 5 and 3).
Copyright © 2013 SciRes. JGIS

L. ADNANE, K. BELKACEM
Copyright © 2013 SciRes. JGIS
46
spectral signatures. During this stage, it was found that six bands taken together give the best result. After this phase, the maximum likelihood algorithm was applied. The final result is then smoothed by applying a filter of 3 × 3 pixels for a pleasing result to see.
The Red Juniper: We find this species with holm oak and Thuja.
Thuja: It succeeds downward the Holm oak. In low height, it
shares the same space as the argan but populates hillsides exposed generally to the North. In high height, it occu- pies the facing east hillsides. The thuja encircles in a way the area of the argan tree. The Thuja zone show several facies; the best preserved is present at the level of the central valley of the oriental part of the SBEI.
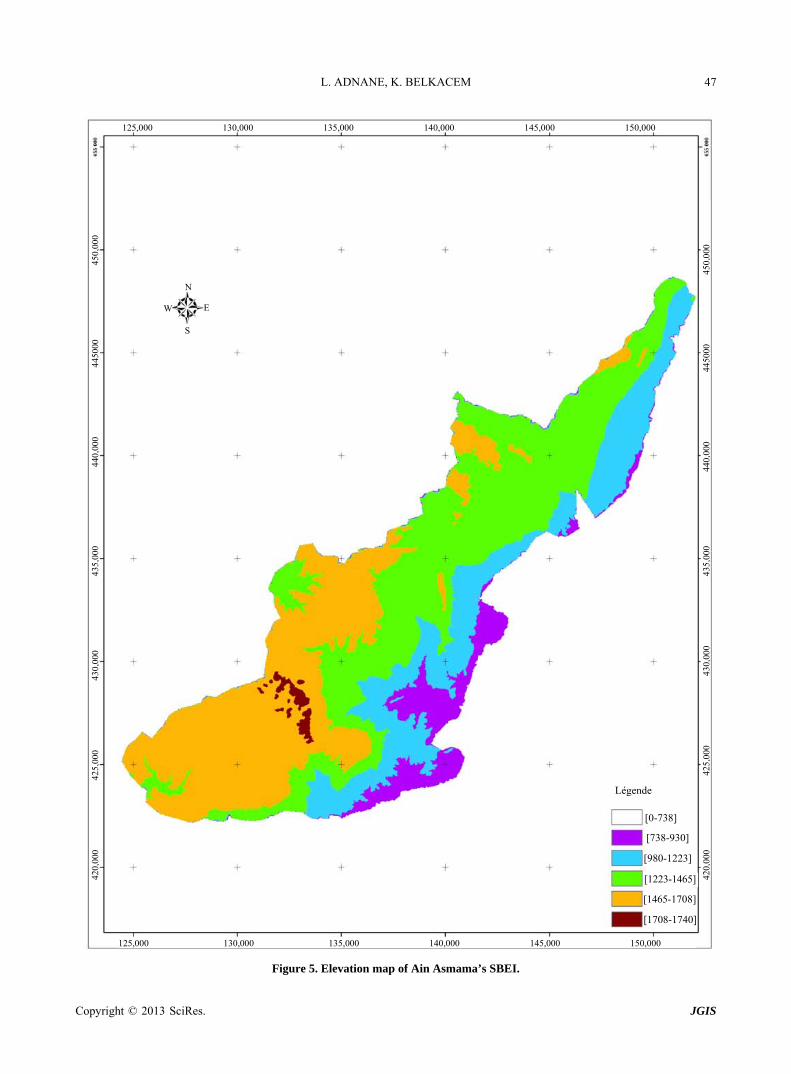
Because argan exists only at altitudes below 1400 m, the Digital Terrain Model (DTM) was created for this requirement (Figure 5). The results of the classification in 1988, 2000 and 2010 have been refined to transform the two classes of argan forests in the corresponding clas- ses.
For quantification and differentiation of plant canopies (including other elements: soil, water, snow, clouds ...), several indices have been developed vegetation [16,17]. The most popular and most used is the normalized dif- ference index (Normalized Difference Vegetation Index or NDVI), developed by Rouse et al. (1974):
–NDVI ETM4 ETM3 ETM 4 ETM 3
Secondary gasolines and high way. We can see that the classes are the most common clas-
ses in the stratum of forest that occupied more than 80% of the total area, while the classes that have the smallest proportions are: the class of that of crops and species secondary. Both represent to 20% of total area. Visual analysis of these three maps we can see that the area is quite SBEI preserved and that the trend of expanding cultivation is decreasing with the rural exodus to the city of Agadir and the scarcity of resources water. The class seems to be the most stable during the period 1988 to 2010, is the high forest, which occupies about 55% of the surface for the three dates analyzed.
The most anthopogenic activities in the area of Ain Asmama’s SBEI is agriculture, beekeeping and over- grazing. Most part of the agricultural land is related with argan zone, beekeeping and overgrazing are practiced in holm oak, Thuja and Juniper areas.
In this research, this index was chosen for the space quantization of green vegetation. The NDVI’s calculation was done with the ERDAS software.
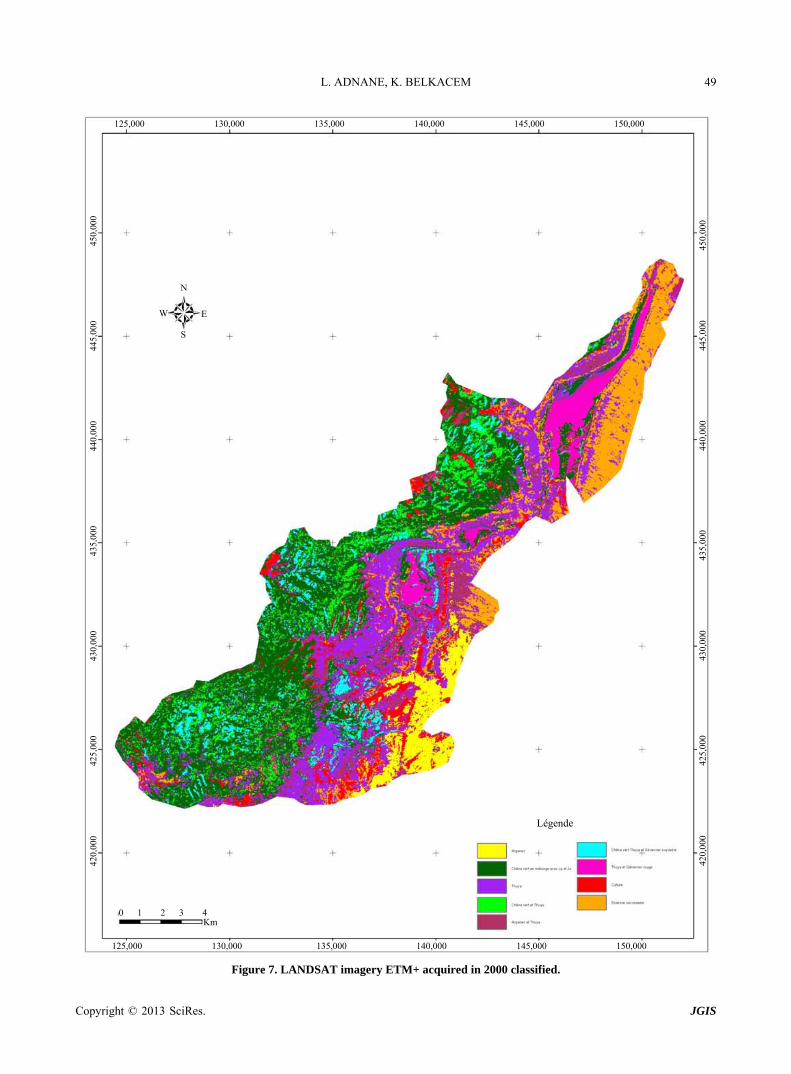
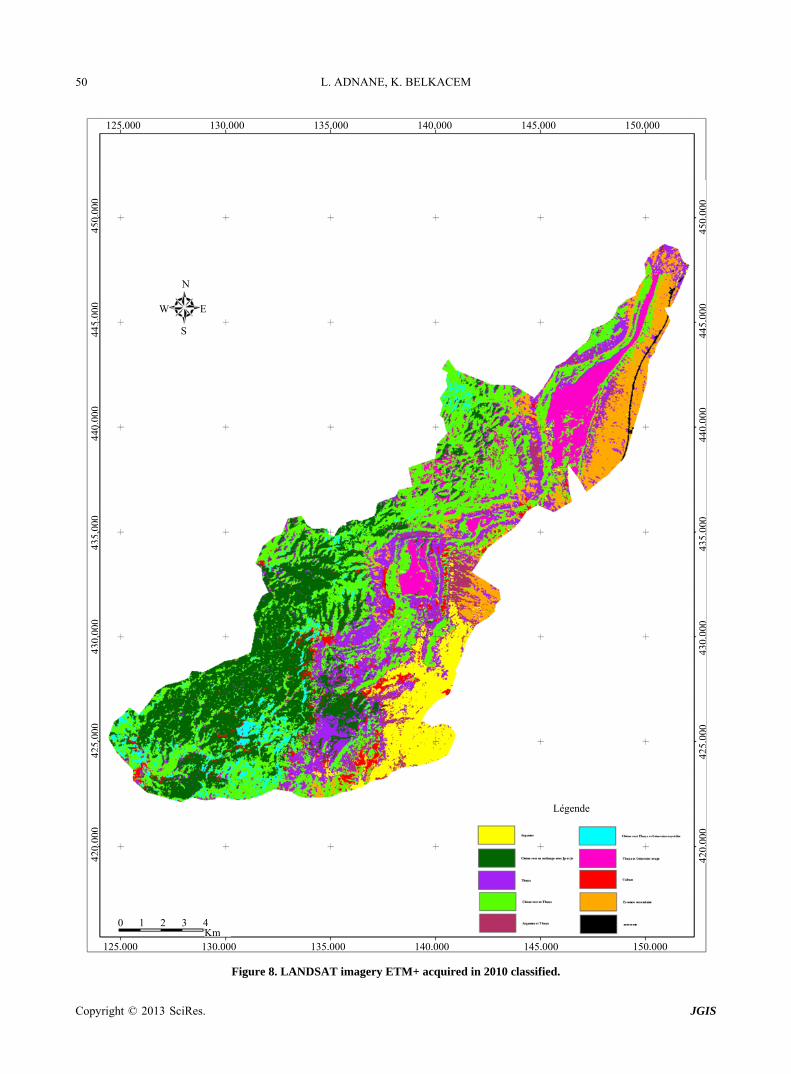
3. Results
Figures 6-8 represent the different strata from the super- vised classification of Landsat images in 1988, 2000 and 2010.
This classification shows the following classes: Cultural lands:
It includes the cereals cultivation, we also note the pre- sence of bean, pea, and lens. It occupies 2.83% of the SBEI’s surface and it’s mainly situated among villages.
4. Discussion
The evaluation of our results from the confusion matrices, we can see that the Kappa indices (0.84 for 1988 Landsat image, the image with 0.78 and 0.82 for 2000 LAND-SAT image LANDSAT 2010) and the measurement ac-curacy (87.5%, 81.82% and 92.31%) for the three maps, indicate that the classifications are of good quality.
The Argan: The argan trees occupy the Argana corridor, in pure for-
mations, and go up at high altitude. Generally, we find ar- gan in mixture with Thuja but especially in south aspect.
It is the tree of the infra-Mediterranean and the ther- mo-Mediterranean climate, under an arid climate to se- mi-arid climate warm to moderate. The argan is kept pre- served well by places, but often rather strongly degraded.
In order to show the evolution of each class of land use over time, we used a series of transformations of sets, the relationship between the same classes on two different dates, we can extract the areas “stable”, of “regression” and “progression” of this class. It is considered that T1 is the set of pixels of the date 1 and T2 is the set of pixels for the date 2.
The Holm Oak: It’s present everywhere on the summit of mountains.
With the favorable weather conditions, it represents es- pecially the meso-Mediterraneen climate and the ceiling of the thermo-Mediterranean, under a bioclimate subhu- mide and semi-arid moderate. This formation is essen- tially preserved well in the highest parts or in the zones with high slope but it’s especially more degraded near villages.
After the establishment of different types of links be- tween the three dates, we calculated the rate of change between the surfaces of classes of land between the dates 1988 - 2000 (T2 - T1), dates from 2000 to 2010 (T3 - T2) and dates from 1988 to 2010 (T3 - T1).
Tables 1-3 show the results obtained: Juniper oxycedar:
The Juniper oxycedar shares the same space and gen- to populate the facing south hillsides where dominate dominate projecting ledges.
The results of calculating the rate of change between 1988 and 2000 show that the class “Cultures” presents an increase of about 40.37%, more than 490 ha for a period of 12 years. These results show also rely regression clas-
L. ADNANE, K. BELKACEM 47
125,000 130,000 135,000 140,000 145,000 150,000
125,000 130,000 135,000 140,000 145,000 150,000
420,
000
42
5,00
0
430,
000
4
35,0
00
4
40,0
00
445
000
4
50,0
00
420,
000
4
25,0
00
430
,000
4
35,0
00
44
0,00
0
4450
00
450
,000
S
E W
N
Légende
[0-738]
[738-930]
[980-1223]
[1223-1465]
[1465-1708]
[1708-1740]
Figure 5. Elevation map of Ain Asmama’s SBEI.
Copyright © 2013 SciRes. JGIS

L. ADNANE, K. BELKACEM 48
125,000 130,000 135,000 140,000 1450,00 150,000
125,000 130,000 135,000 140,000 145,000 150,000
420,
000
4
25,0
00
43
0 00
0
435
,000
440,
000
4
45,0
00
45
0,00
0
0 0.9 1.8 2.7 3.6 Km
S
E W
N
Légende
420,
000
42
5,00
0
430
,000
435,
000
4
40,0
00
4
45,0
00
45
0,00
0
Figure 6. LANDSAT imagery TM5 acquired in 1988 classified.
Copyright © 2013 SciRes. JGIS
L. ADNANE, K. BELKACEM 49
125,000 130,000 135,000 140,000 145,000 150,000
125,000 130,000 135,000 140,000 145,000 150,000
420,
000
42
5,00
0
430
,000
435,
000
4
40,0
00
445
,000
450,
000
420 ,
000
42
5,00
0
430
,000
4
35,0
00
4
40,0
00
445
,000
4
50,0
00
0 1 2 3 4 Km
S
E W
N
Légende
Figure 7. LANDSAT imagery ETM+ acquired in 2000 classified.
Copyright © 2013 SciRes. JGIS
L. ADNANE, K. BELKACEM 50
125,000 130,000 135,000 140,000 145,000 150,000
125,000 130,000 135,000 140,000 145,000 150,000
420,
000
425,
000
430,
000
435,
000
440,
000
445,
000
450,
000
,000
450
000
445,
420,
000
425,
000
430,
000
435,
000
440,
000
0 1 2 3 4 Km
S
E W
N
Légende
Figure 8. LANDSAT imagery ETM+ acquired in 2010 classified.
Copyright © 2013 SciRes. JGIS
L. ADNANE, K. BELKACEM
Copyright © 2013 SciRes. JGIS
51
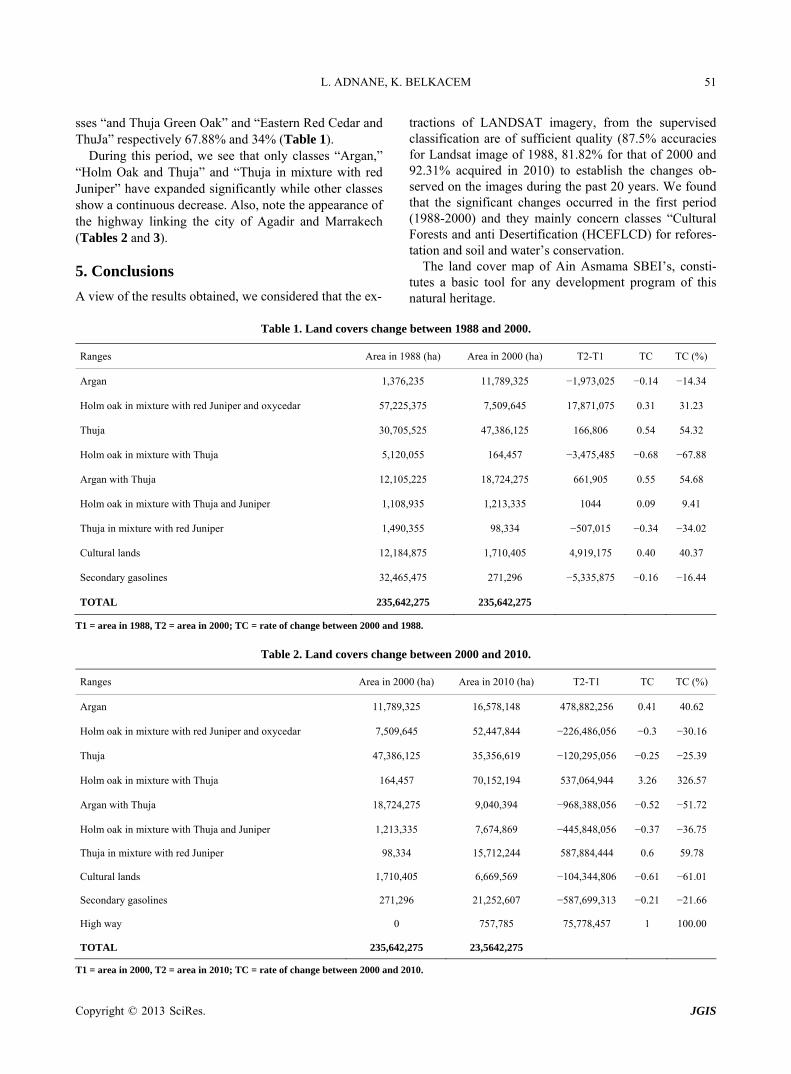
sses “and Thuja Green Oak” and “Eastern Red Cedar and ThuJa” respectively 67.88% and 34% (Table 1).
During this period, we see that only classes “Argan,” “Holm Oak and Thuja” and “Thuja in mixture with red Juniper” have expanded significantly while other classes show a continuous decrease. Also, note the appearance of the highway linking the city of Agadir and Marrakech (Tables 2 and 3).
5. Conclusions
A view of the results obtained, we considered that the ex-
tractions of LANDSAT imagery, from the supervised classification are of sufficient quality (87.5% accuracies for Landsat image of 1988, 81.82% for that of 2000 and 92.31% acquired in 2010) to establish the changes ob- served on the images during the past 20 years. We found that the significant changes occurred in the first period (1988-2000) and they mainly concern classes “Cultural Forests and anti Desertification (HCEFLCD) for refores- tation and soil and water’s conservation.
The land cover map of Ain Asmama SBEI’s, consti-tutes a basic tool for any development program of this natural heritage.
Table 1. Land covers change between 1988 and 2000.
Ranges Area in 1988 (ha) Area in 2000 (ha) T2-T1 TC TC (%)
Argan 1,376,235 11,789,325 −1,973,025 −0.14 −14.34
Holm oak in mixture with red Juniper and oxycedar 57,225,375 7,509,645 17,871,075 0.31 31.23
Thuja 30,705,525 47,386,125 166,806 0.54 54.32
Holm oak in mixture with Thuja 5,120,055 164,457 −3,475,485 −0.68 −67.88
Argan with Thuja 12,105,225 18,724,275 661,905 0.55 54.68
Holm oak in mixture with Thuja and Juniper 1,108,935 1,213,335 1044 0.09 9.41
Thuja in mixture with red Juniper 1,490,355 98,334 −507,015 −0.34 −34.02
Cultural lands 12,184,875 1,710,405 4,919,175 0.40 40.37
Secondary gasolines 32,465,475 271,296 −5,335,875 −0.16 −16.44
TOTAL 235,642,275 235,642,275
T1 = area in 1988, T2 = area in 2000; TC = rate of change between 2000 and 1988.
Table 2. Land covers change between 2000 and 2010.
Ranges Area in 2000 (ha) Area in 2010 (ha) T2-T1 TC TC (%)
Argan 11,789,325 16,578,148 478,882,256 0.41 40.62
Holm oak in mixture with red Juniper and oxycedar 7,509,645 52,447,844 −226,486,056 −0.3 −30.16
Thuja 47,386,125 35,356,619 −120,295,056 −0.25 −25.39
Holm oak in mixture with Thuja 164,457 70,152,194 537,064,944 3.26 326.57
Argan with Thuja 18,724,275 9,040,394 −968,388,056 −0.52 −51.72
Holm oak in mixture with Thuja and Juniper 1,213,335 7,674,869 −445,848,056 −0.37 −36.75
Thuja in mixture with red Juniper 98,334 15,712,244 587,884,444 0.6 59.78
Cultural lands 1,710,405 6,669,569 −104,344,806 −0.61 −61.01
Secondary gasolines 271,296 21,252,607 −587,699,313 −0.21 −21.66
High way 0 757,785 75,778,457 1 100.00
TOTAL 235,642,275 23,5642,275
T1 = area in 2000, T2 = area in 2010; TC = rate of change between 2000 and 2010.

L. ADNANE, K. BELKACEM 52
Table 3. Land cover change between 1988 and 2010.
Ranges Area in 1988 (ha) Area in 2010 (ha) T1-T2 TC TC (%)
Argan 1,376,235 16,578,148 2,815,798 0.20 20.46
Holm oak in mixture with red Juniper and oxycedar 57,225,375 52,447,844 −4,777,531 −0.08 −8.35
Thuja 30,705,525 35,356,619 4,651,094 0.15 15.15
Holm oak in mixture with Thuja 5,120,055 70,152,194 18,951,644 0.37 37.01
Argan with Thuja 12,105,225 9,040,394 −3,064,831 −0.25 −25.32
Holm oak in mixture with Thuja and Juniper 1,108,935 7,674,869 −3,414,481 −0.31 −30.79
Thuja in mixture with red Juniper 1,490,355 15,712,244 808,694 0.05 5.43
Cultural lands 12,184,875 6,669,569 −5,515,306 −0.45 −45.26
Secondary gasolines 32,465,475 21,252,607 −11,212,868 −0.34 −34.54
High way 0 757,785 757,785 1 100.00
TOTAL 235,642,275 235,642,275
T1 = area in 1988, T2 = area in 2010; TC = rate of change between 1988 and 2010.
To preserve this area, the local people must adhere to a
sustainable development of this region by creating an as- sociation to exploit with rationalization the naturals re- sources for the future regeneration.
6. Acknowledgements
The authors of this article would like to thanks all the staff of the Laboratory of the Science Ibn Zohr’s Faculty in Agadir (Morocco).
REFERENCES
[1] E. F. Lambin, et al., “The Causes of Land-Use and Land- Cover Change: Moving beyond the Myths,” Global Envi- ronmental Change, Vol. 11, No. 4, 2001, pp. 261-269. doi:10.1016/S0959-3780(01)00007-3
[2] European Commission, “The MEDALUS Project: Medi- terranean Desertification and Land Use. Manual on Key Indicators of Desertification and Mapping Environmen- tally Sensitive Areas to Desertification (EUR 18882),” European Commission, Brussels, 1999.
[3] B. Jaafar, “Study Phytoecological Morphobotanique and an Enclave of Dry Moroccan Western High Atlas (Arga- na Corridor),” Ph.D. Thesis, University Cadi Ayyad, Mar- rakech, 1994.
[4] R. R. Chowdhury, “Landscape Change in the Calakmul Biosphere Reserve, Mexico: Modeling the Driving Forces of Smalholder Deforestation in Land Parcels,” Applied Geography, Vol. 26, No. 2, 2006, pp. 129-152. doi:10.1016/j.apgeog.2005.11.004
[5] R. H. Fraser, A. Abuelgasim and R. Latifovic “A Method for Detecting Large-Scale Forest Cover Change Using Coarse Spatial Resolution Imagery,” Remote Sensing of Environment, Vol. 95, No. 4, 2005, pp. 414-427.
doi:10.1016/j.rse.2004.12.014
[6] M. N. Siddiqui, Z. Jamil and J. Afsar, “Monitoring Chan- ges in Riverine Forests of Sindh Pakistan Using Remote Sensing and GIS Techniques,” Advances in Space Re-search, Vol. 33, No. 3, 2004, pp. 333-337. doi:10.1016/S0273-1177(03)00469-1
[7] A. A.Masoud and K. Koike, “Arid Land Salinization Detected by Remotely-Sensed Landcover Changes: A Case Study in the Siwa region, NW Egypt,” Journal of Arid Environments, Vol. 66, No. 1, 2006, pp. 151-167.
[8] H. Nagendra, S. Pareeth and R. Ghate, “People within Parks-Forest Villages, Land-Cover Change and Landscape Fragmentation in the Tadoba Andhari Tiger Reserve, In- dia,” Applied Geography, Vol. 26, No. 2, 2006, pp. 96- 112. doi:10.1016/j.apgeog.2005.11.002
[9] M. R. Murray, S. A. Zisman, P. A. Furley, D. M. Munro, J. Gibson, J. Ratter, S. Bridgewater, C. D. Minty and C. J. Place, “The Mangroves of Belize: Part 1. Distribution, Com- position and Classification,” Forest Ecology and Mana- gement, Vol. 174, No. 1-3, 2003, pp. 265-279.
[10] G. Ackermann, F. Alexander, J. Andrieu, C. Mering and Olivier, “Payasages Dynamics and Prospects for Sus- tainable Development on the Small Coast and in the Delta of the Sine-Saloum (Senegal),” VertigO, Vol. 7, No. 2, 2007, Article ID: 16.
[11] N. Moreau, “Identification and Mapping of Mangrove Forest’s Evolution in the Saloum Islands during the Last Three Decades (1972-2001),” Photo-Interpretation, 2004, pp. 23-55.
[12] U. Thampanya, J. E. Vermaat, S. Sinsakul and N. Pana- pitukkul, “Coastal Erosion and Mangrove Progradation of Southern Thailand,” Estuarine, Coastral and Shelf Sci- ence, Vol. 68, No. 1-2, 2006, pp. 75-85.
[13] M. Badraoui and S. Aziki, “Analysis of the National Ac- tion Program Anti-Desertification in Morocco,” Réseau
Copyright © 2013 SciRes. JGIS

L. ADNANE, K. BELKACEM 53
des Associations de la Réserve de Biosphère Arganer, Ra- bat, 2003.
[14] M. Badraoui, R. Bouabid and M. Rouchdi, “Development of a Program Anti-Desertification in Souss Basin by Ana- lysis of Satellite Images. PhaseⅠ Study Contracted be- tween the Ministry of Physical Planning, Water and En- vironment Society and ADI, Rabat,” Development of the Database and Deriving Map of Susceptibility to Deserti- fication, Rabat, 2003.
[15] M. Badraoui, R. Bouabid and M. Rouchdi, “Development of a Program Anti-Desertification in Souss Basin by Ana- lysis of Satellite Images. Phase Ⅱ Study Contracted be- tween the Ministry of Physical Planning, Water and En- vironment Society and ADI, Rabat,” Development of the
Database and Deriving Map of Susceptibility to Deserti- fication, Rabat, 2003.
[16] A. Bannari, A. R. Huete, D. Morin and F. Bonn, “A Re- view of Vegetation Indices,” Remote Sensing Reviews,Vol. 13, No. 1-2, 1995, pp. 95-120. doi:10.1080/02757259509532298
[17] I. M. Hasmadi, H. Z. Pakhriazad and M. F. Shahrin, “Evaluating Supervised and Unsupervised Techniques for Land Cover Mapping Using Remote Sensing Data,” Ma-laysian Journal of Society and Space, Vol. 5, No. 1, 2009, pp. 1-10.
Copyright © 2013 SciRes. JGIS


![Muluki Ain, 2020 · Muluki Ain, 2020 ... ug]{](https://img.dokumen.tips/doc/110x75/5e6d5ee8c3f7654a8b0ac192/muluki-ain-2020-muluki-ain-2020-ug.jpg)


![[in] [ain] [aim] [ein]. in ain aim [ann] Alain [ann]](https://img.dokumen.tips/doc/110x75/551d9db7497959293b8dbf14/in-ain-aim-ein-in-ain-aim-ann-alain-ann.jpg)