Embed Size (px)
Citation preview

R E P R O D U C T I V E & D E V E L O P M E N T A L T O X I C I T Y O F S T Y R E N E
National Toxicology ProgramCenter for the Evaluation of Risks to Human Reproduction
NTP Brief: Monograph on the Potential Human Reproductionand Developmental Effects of Styrene
Two Generation Reproduction Study of Styrene by Inhalation in Crl-CD Rats
Developmental Neurotoxicity Study of Styrene by Inhalationin Crl-CD Rats
N E U R O T O X I C I T Y O F S T Y R E N E
Olfactory Function in Workers Exposed to Styrene in the Reinforced-Plastics Industry
Exposure Assessment for Study of Olfactory Function in Workers Exposed to Styrene in the Reinforced-Plastics Industry
Neuropsychological Effects of Styrene Exposure: Review of Literature Published 1990 – 2003
The Effect of Styrene Exposure on Color Vision: A Review
Quality of Life and Color Vision: The Significance of Acquired Dyschromatopsias
REVIEWTHE SIRC
RESEARCH • TECHNOLOGY • PUBLIC POLICY
Vol. 10, No. 1


The SIRC Review is published by
Styrene Information and Research Center1300 Wilson Boulevard, Suite 1200, Arlington, Virginia 22209
www.styrene.org
EditorMaria J. Tort, PhD, DABT
Production EditorJack Snyder
Production CoordinatorMatt Howe
Copyright 2006 Styrene Information and Research Center.Quotes for bulk orders available upon request.
Editorial Offices at 1300 Wilson Boulevard, Suite 1200, Arlington, Virginia 22209
THESIRCxREVIEWx
RESEARCH • TECHNOLOGY • PUBLIC POLICY


5Introduction
Maria J. Tort
REPRODUCTIVE & DEVELOPMENTAL
TOXICITY OF STYRENE
7National Toxicology Program
Center for the Evaluation of Risks to Human Reproduction
NTP Brief: Monograph on the Potential HumanReproduction and Developmental Effects of Styrene
13Two Generation Reproduction Study of Styrene by
Inhalation in Crl-CD Rats
George Cruzan, Willem D. Faber, Keith A. Johnson, Linda S. Roberts,
Juergen Hellwig, Ed Carney, John T. Yarrington, Donald G. Stump
27Developmental Neurotoxicity Study of Styrene by
Inhalation in Crl-CD rats
George Cruzan, Willem D. Faber, Keith A. Johnson, Linda S. Roberts, Juergen
Hellwig, Jacques Maurissen, Melissa J. Beck, Ann Radovsky and Donald G. Stump
CONTINUES
THE SIRC
REVIEW
RESEARCH • TECHNOLOGY • PUBLIC POLICY
November 2006 • Vol. 10, No. 1

4
NEUROTOXICITY OF STYRENE
43Olfactory Function in Workers Exposed to Styrene in
the Reinforced-Plastics Industry
Pamela Dalton, Beverly Cowart, Daniel Dilks, Michele Gould, Peter S.J. Lees,
Aleksandr Stefaniak, and Edward Emmett
57Exposure Assessment for Study of Olfactory Function
in Workers Exposed to Styrene in the Reinforced-Plastics Industry
Peter S.J. Lees, Aleksandr Stefaniak, Edward A. Emmett, and Pamela Dalton
70Neuropsychological Effects of Styrene Exposure:
Review of Literature Published 1990 – 2003
Leyla Bagirzadeh, Jeremy Beach, Nicola Cherry
101The Effect of Styrene Exposure on Color Vision:
A Review
Gregory W. Good, Jason J. Nichols
146Quality of Life and Color Vision: The Significance of
Acquired Dyschromatopsias
Gregory W. Good, Jason J. Nichols

The SIRC Review November 2006 5
The Styrene Information and Research Center
(SIRC) is pleased to present this 10th volume of
its journal, The SIRC Review. Since producing
our first issue in 1990, SIRC has periodically published
The SIRC Review to serve as a compendium of recent
research on styrene, bringing together the best science on
the chemical. The readership of The SIRC Review includes
persons with interests in styrene from many sectors – reg-
ulators, scientists, industry, academia, and communica-
tions. It is SIRC’s hope that this journal continues to aid
these people in assessing the potential health and envi-
ronmental effects of styrene.
Since our last issue, SIRC has continued its active
research program on the health effects of styrene, and this
new volume reflects SIRC’s ongoing mission to expand
styrene’s already substantial scientific database.
Following our past efforts to assemble commonly-
themed reports, Volume 10 focuses on two key areas of
research – reproductive and developmental toxicity in
section one, and neurobehavioral effects in section two.
Of particular note in the first section is the executive
summary of an important monograph from the National
Toxicology Program’s Center for the Evaluation of Risks to
Human Reproduction (CERHR). The CERHR recently
issued its final report on an expert panel review it spon-
sored on the potential reproductive and developmental
toxicity effects of styrene. The CERHR review, which SIRC
followed with great interest, provided a thorough assess-
ment of the available data on styrene, and offers a sound,
independent conclusion on its potential to cause human
reproductive effects. The report’s summary conclusion,
with which SIRC concurs, noted that “NTP judges the total
scientific evidence sufficient to conclude that it is unlikely
that styrene exposures to the general population or to
styrene-exposed workers in the United States will adverse-
ly affect human development or reproduction.”
We have included the NTP report summary as a pref-
ace to two articles, both originally published in Birth
Defects Research, on which much of the CERHR’s delibera-
tions were based: “Developmental Neurotoxicity Study
of Styrene by Inhalation in Crl-CD Rats” and “Two
Generation Reproduction Study of Styrene by Inhalation
in Crl-CD Rats,” both by Cruzan et al. These two studies,
conducted by WIL Laboratories of Ashland, Ohio, repre-
sent the most sophisticated data to date on styrene repro-
ductive and developmental toxicity effects. The develop-
mental neurotoxicity study concluded that there is no
specific effect on nervous system development observ-
able at styrene exposures up to 500 ppm. The reproduc-
tive study confirmed previous observations of slight
body weight effects of styrene exposure at 500 ppm or
greater in rats and further demonstrated a lack of styrene
effects on gonadal function, reproductive performance,
and offspring survival. This enhanced the conclusions of
an earlier 3-generation reproduction study of styrene in
drinking water. SIRC provided funding for these studies,
along with the Styrenics Steering Committee in Europe
and the Japan Styrene Industry Association.
In the second section are two articles reprinted from
the American Journal of Industrial Medicine: “Olfactory
Function in Workers Exposed to Styrene in the
Reinforced-Plastics Industry” by Dalton et al., and
“Exposure Assessment for Study of Olfactory Function in
Workers Exposed to Styrene in the Reinforced-Plastics
Industry” by Lees et al. These studies addressed previous
data that suggested a potential for styrene exposure to
affect the sense of smell. Working with a cohort in the
comparatively highly-exposed reinforced plastics indus-
try, Dalton et al concluded that there was no evidence to
suggest that styrene is an olfactory toxicant in humans.
In addition to the reprinted articles, the second section
also includes three original articles that are being pub-
lished for the first time in The SIRC Review. These articles
reflect SIRC’s efforts to better understand the potential
neurotoxicolgical effects of styrene, in particular on
workers exposed to styrene. Bagirzadeh et al.’s review of
the neuropsychological effects data updates earlier
reviews, including those published previously in this
journal. Drs. Good and Nichols of Ohio State University
have provided two articles on potential color vision
Introduction

effects. In the review article “The Effect of Styrene
Exposure on Color Vision,” Good concludes that expo-
sure to styrene at high levels can be associated with color
vision deficiency but that the magnitude of such deficien-
cies is relatively minor, and that it is unlikely that the
level of defect would have much functional significance.
To further address this conclusion, Nichols and Good
assess “Quality of Life and Color Vision: The Significance
of Acquired Dyschromatopsias.” Noting that there cur-
rently is not an appropriate color vision-specific quality
of life survey instrument available, they suggest “that a
study that assessed the significance of styrene-induced
color vision deficiency might show little-to-no impair-
ments in quality of life and functional ability.”
Volume 10 of The SIRC Review does represent one sig-
nificant change from the several previous issues, in that
the journal’s editor of many years, Dr. Keith Johnson, for-
merly with The Dow Chemical Company, has retired and
relinquished his oversight of this publication. Dr.
Johnson served as editor for five of the ten volumes of
this journal, beginning in 1997, and was an invaluable
asset to SIRC, its members, and the scientific community.
I would like to thank Dr. Johnson for his dedicated ser-
vice to SIRC, and to The SIRC Review, and wish him well
in his future endeavors.
Lastly, I also would like to acknowledge SIRC’s
administrative manager, Matt Howe, who serves as pro-
duction coordinator for The SIRC Review, for his able
assistance in managing the generation of this publication
from start to finish. His help at all stages of the produc-
tion of this journal greatly simplifies my job as editor, and
his efforts are appreciated by both members and staff.
As in-coming editor, I offer this 10th volume of The
SIRC Review for your review and reference, and trust that
it continues SIRC’s mission to identify the most current
and scientifically-sound data on styrene.
Maria J. Tort, PhD, DABT
Editor
Maria J. Tort has been a corporate toxicologist for the Chevron
Phillips Chemical Company since April 2001. Reflecting her
dual interests and education in toxicology and business
management, she recently took on the role of Styrenics
Business Analyst in CP Chem’s Styrenics business unit. Dr.
Tort is the chairperson of SIRC’s Science and Technology Task
Group, of which she has been a member since 2001, and as
such serves as the editor of THE SIRC REVIEW.
6
INTRODUCTION

The SIRC Review November 2006 7
National Toxicology Program (NTP)
Center for the Evaluation of Risks to Human Reproduction (CERHR)
Monograph on the Potential Human Reproduction and
Developmental Effects of Styrene
The NTP concurs with
the CERhR Styrene
Expert Panel that there
is negligible concern for
adverse developmental
and reproductive effects
in humans exposed to
styrene, including
exposures to the general
population and
exposures in the
workplace.
This conclusion is based
on the low levels of
estimated human
exposures to styrene in
the general population
and in the workplace.
No clear evidence of
developmental or
reproductive toxicity
effects in experimental
animals has been
reported, even at
comparatively high
doses of styrene.
smoke. It is estimated that 30% of styrene
in the air originates from motor vehicle
exhaust, 40% from composite materials and
boat building industries, and 30% from all
other sources.
Styrene is manufactured from ethylben-
zene primarily by two methods. In the
most common method, ethylbenzene is
dehydrogenated using steam and an
iron/zinc/magnesium oxide catalyst. The
resulting styrene is purified using vacuum
distillation. In the second method, ethyl-
benzene is oxidized to ethylbenzene
hydroperoxide, which is reacted with
propylene to yield propylene oxide and
methyl phenyl carbinol.
The carbinol is dehydrated to styrene
using an acid catalyst.
Styrene production in the United States
was reported at 10.58 billion pounds in
1999 and 10.79 billion pounds in 2000. The
volume of styrene imported to the United
States was 1.038 million pounds in 1999
and 1.265 million pounds in 2000. The
amount exported from the United States
was 2.552 billion pounds in 1999 and 2.730
billion pounds in 2000.
Styrene can be released into the environ-
ment directly or as a result of applications
using polystyrene. According to the EPA’s
Toxics Release Inventory database, total
environmental release of styrene in 2002
was 47.7 million pounds, with releases of
47.3 million pounds to air, 6000 pounds to
water, 160,000 pounds to underground
injection, and 207,000 pounds to land.
NTP BRIEF
WhAT IS STYRENE?
Styrene is an aromatic
hydrocarbon with a mol -
ecular formula of C8H
8
and molecular weight of
104.16. The structure is
shown in Figure 1.
Styrene is principally
used in the production of
polystyrene and copoly-
mers that may contain
trace levels of styrene
monomer. Polystyrene,
the polymerized form of
styrene, has a variety of
uses including food con-
tainers, boat building and
repair, construction mate-
rials, automobile parts, and backing for
carpets and upholstery. Styrene is present
in the environment as a result of direct
releases from industrial sources and auto-
mobile exhaust and indirectly from prod-
ucts or applications involving polystyrene.
The public can also be exposed to styrene
by ingesting food or drink that has been in
contact with styrene polymers or through
inhalation of polluted air and cigarette
FIGURE 1
Chemical
structure of
styrene
CH
February 2006
NIH Publication No. 06-4475
Full Publication available at
http://cerhr.niehs.nih.gov
MONOGRAPh BRIEF ON ThE POTENTIAL hUMAN REPRODUCTION AND DEVELOPMENTAL EFFECTS OF STYRENE
ARE PEOPLE EXPOSED TO STYRENE?*
Yes. People are exposed to styrene by breathing cigarette
smoke and outdoor or indoor air, eating food that con-
tains styrene as an additive or a contaminant, using con-
sumer products that contain styrene, and by occupational
exposure to styrene vapors. Sources of styrene in the air
are industrial releases and exhaust from gasoline-pow-
ered motor vehicles. The primary source of styrene expo-
sure to the general public is indoor air. Cigarette smoke
and release of styrene from household products such as
carpet glues, construction adhesives, and polyester-con-
taining flooring materials contribute to styrene in indoor
air. In the general population, exposure of non-smokers
to styrene is estimated to be less than 0.3 µg/kg body
weight/day; smokers are exposed to about 3 µg/kg body
weight/day. These exposures are 1 million-fold and
100,000-fold less, respectively, than doses that show no
adverse reproductive or developmental effect in laborato-
ry animals. Styrene may
be present in food as a
natural component of the
food, as a food additive,
or from contact with
styrene-containing mate-
rials. Average dietary
intake of styrene is esti-
mated to be equal to or
less than 0.2 µg/kg body
weight/day. Styrene is
not usually found in
drinking water and
reported levels are less
than 1 µg/L or are not
detectable. Occupational
exposures to styrene are
considerably higher than
exposures of the general
public. Average occupa-
tional exposures are esti-
mated to range from
1,400—52,000 µg/kg body
weight/day with an
upper estimate of 90,000
µg/kg body weight/day.
Occupation al exposure is primarily by breathing styrene
vapor. Occupa tional exposure through the skin is
believed to be minimal.
CAN STYRENE AFFECT hUMAN DEVELOPMENT
OR REPRODUCTION?
Probably Not. Results from studies in experimental ani-
mals indicate little or no potential for styrene exposure to
produce developmental or reproductive toxicity. Some
developmental delays and growth effects were observed
in styrene-exposed rat pups before and after birth. These
effects occurred at styrene doses that also caused the
pregnant dams to eat less food resulting in lower body
weights than unexposed dams. Because the developmen-
tal effects observed in pups were consistent with the
effects observed in the dams, the expert panel could not
determine if the effects observed in the offspring were
due directly to their styrene exposure or due indirectly to
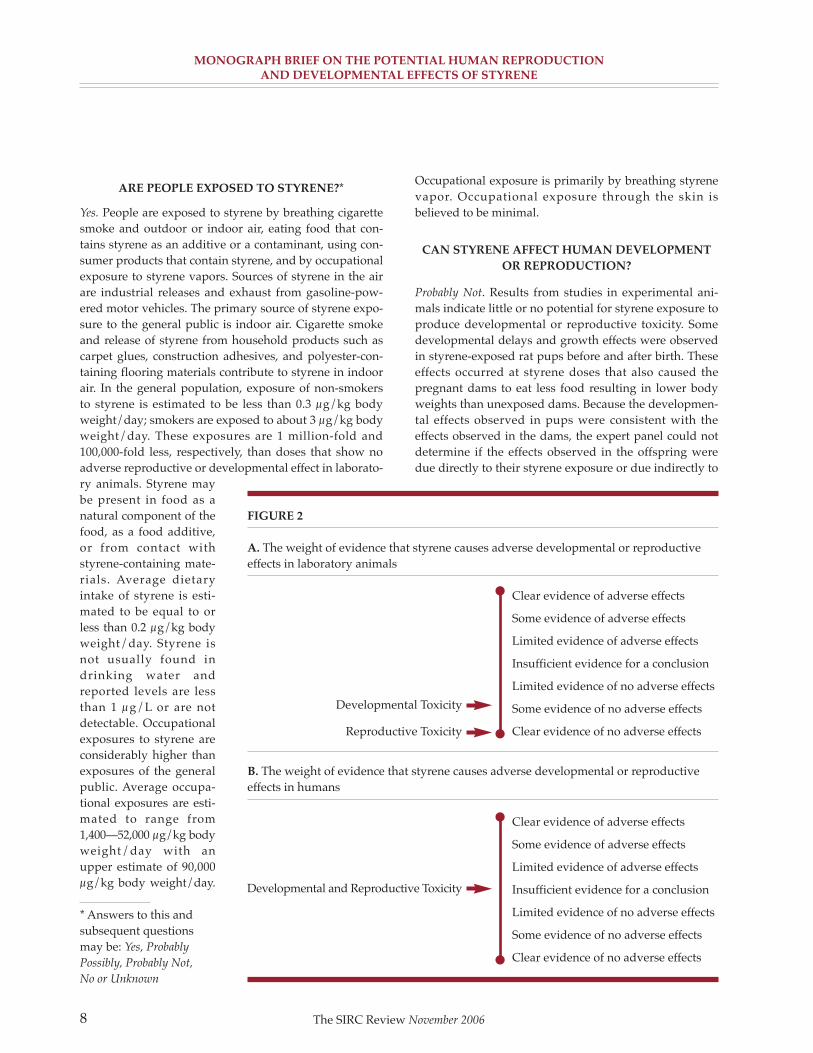
FIGURE 2
A. The weight of evidence that styrene causes adverse developmental or reproductive
effects in laboratory animals
B. The weight of evidence that styrene causes adverse developmental or reproductive
effects in humans
Clear evidence of adverse effects
Some evidence of adverse effects
Limited evidence of adverse effects
Insufficient evidence for a conclusion
Limited evidence of no adverse effects
Some evidence of no adverse effects
Clear evidence of no adverse effects
Developmental Toxicity
Reproductive Toxicity
Clear evidence of adverse effects
Some evidence of adverse effects
Limited evidence of adverse effects
Insufficient evidence for a conclusion
Limited evidence of no adverse effects
Some evidence of no adverse effects
Clear evidence of no adverse effects
Developmental and Reproductive Toxicity
8 The SIRC Review November 2006
* Answers to this and
subsequent questions
may be: Yes, Probably
Possibly, Probably Not,
No or Unknown

MONOGRAPh BRIEF ON ThE POTENTIAL hUMAN REPRODUCTION AND DEVELOPMENTAL EFFECTS OF STYRENE
The SIRC Review November 2006 9
toxic effects of styrene on the dams. Multi-generation
reproductive toxicity studies in rats exposed to styrene
throughout their lifetimes showed no evidence of repro-
ductive toxicity.
Scientific decisions concerning health risks are gener-
ally based on what is known as the “weight-of-evidence”
approach. In the case of styrene, no convincing evidence
of adverse developmental effects were observed in labo-
ratory animal studies (see Figure 2a). Further, no evi-
dence of reproductive toxicity was observed in multi-
generation reproductive toxicity studies in rodents.
Evidence from studies in humans exposed to styrene
were not sufficient to reach conclusions regarding possi-
ble developmental or reproductive effects (see Figure 2b).
The NTP judges the total scientific evidence sufficient to
conclude that it is unlikely that styrene exposures to the
general population or to styrene-exposed workers in the
United States will adversely affect human development
or reproduction.
SUPPORTING EVIDENCE
As presented in the NTP-CERHR Expert Panel Report on
the Reproductive and Developmental Toxicity of Styrene
(see Appendix II for details and literature citations, avail-
able at http://cerhr.niehs.nih.gov), the expert panel con-
cluded that styrene does not cause developmental or
reproductive toxicity in experimental animals. Key stud-
ies considered by the expert panel are summarized here.
In developmental toxicity studies in rats and rabbits,
the highest exposure concentrations tested (600 ppm by
inhalation or 300 mg/kg body weight/ day by oral dos-
ing to rats) showed no observable adverse effects on
fetuses. Effects of exposure to styrene on reproduction
and post-natal development were assessed in two multi-
generation studies in rats. Neither study showed an effect
of styrene on reproduction, even at the highest dose test-
ed. However, one study noted decreased birth weight
and delays in postnatal development in the pups of par-
ents exposed by inhalation to 500 ppm styrene. This dose
of styrene also caused a significantly reduced body
weight gain in the dams. Therefore, the expert panel con-
cluded that it was not possible to separate the observed
effects in the offspring from the effects on maternal
weight. No adverse effects were observed for develop-
mental neurotoxicity at this dose. In the second study,
styrene was delivered in drinking water at concentrations
up to 250 ppm (estimated intake 18 mg/kg body
weight/day for males and 23 mg/kg body weight/ day
for females). There were no treatment-related effects on
maternal food consumption or weight gain and no signif-
icant developmental effects on the pups. The expert panel
judged these data relevant for the assessment of potential
human hazard.
The expert panel noted that there was insufficient
information available to reach conclusions on reproduc-
tive and developmental outcomes from studies of
humans exposed to styrene. Evidence from studies con-
ducted in occupational settings suggest that exposure of
women to styrene is associated with slightly increased
levels of prolactin in blood serum and possible depletion
of peripheral blood dopamine metabolizing enzyme
activities when compared to levels in women not occupa-
tionally exposed to styrene. However, the clinical rele-
vance of these effects is uncertain because: (1) the average
elevation in prolactin concentrations in blood serum was
small and within the normal range of blood serum values
and (2) menstrual function and other reproductive end-
points were not evaluated in these studies. The Styrene
Information and Research Center submitted written com-
ments and proposed that these findings are of no rele-
vance to human health (see Public Comments in
Appendix III, available at http://cerhr.niehs.nih.gov).
Two studies in rats failed to find any effect of exposure to
styrene on prolactin concentrations in serum. Maximum
exposure levels of styrene used in the rat studies were
1500 ppm by inhalation for 5 days and 200 mg/kg body
weight/day injected subcutaneously for 7 days.
Studies show that styrene oxide, a metabolite of
styrene, binds to DNA in blood cells of humans and
experimental animals. In workers exposed to styrene,
studies have reported both DNA adducts and breaks in
strands of DNA in blood cells, most likely caused by
styrene oxide. Three papers on DNA damage in styrene-
exposed workers that were not considered by the expert
panel report are summarized here.
Migliore et al. (2002) reported a significant increase in
DNA strand breaks in sperm from styrene-exposed work-
ers. However, they found no association between the
extent of DNA damage and either years of styrene expo-
sure or concentration of styrene metabolites in urine. In
another study, Vodicka et al. (2004) assessed chromoso-
mal damage, DNA strand breaks, and DNA repair capac-
ity in lymphocytes from styrene-exposed lamination
workers. They found no clear relationship between chro-
mosome abnormalities and styrene exposure. DNA single
strand breaks in the lymphocytes were significantly
lower in styrene-exposed workers and DNA repair capac-
ity was increased when compared to workers not
exposed to styrene. Although these measurements indi-

MONOGRAPh BRIEF ON ThE POTENTIAL hUMAN REPRODUCTION AND DEVELOPMENTAL EFFECTS OF STYRENE
cate that exposure to styrene can cause some types of
DNA damage, it is uncertain whether genetic mutations
are induced. In a recent review of the effects of styrene on
DNA, Henderson and Speit (2005) concluded that there is
no clear evidence that gene mutations result from worker
exposures to styrene. Therefore, it is unlikely that occupa-
tional styrene exposures would lead to infertility or
genetic disorders in subsequent generations.
ARE CURRENT STYRENE EXPOSURES IN ThE U.S.
GENERAL POPULATION hIGh ENOUGh TO
CAUSE CONCERN?
Probably Not. It is estimated that styrene exposure in non-
smokers is less than 0.3 µg/kg body weight/day.
Smokers are estimated to be exposed to 3 µg/kg body
weight/day. These exposures are approximately 1 mil-
lion-fold and 100,000-fold less, respectively, than doses
that showed no adverse reproductive or developmental
effects in laboratory animals.
ARE CURRENT U.S. OCCUPATIONAL EXPOSURES
TO STYRENE hIGh ENOUGh TO CAUSE
CONCERN?
Probably Not. Occupational exposures to styrene can be
considerably higher than exposures to the general popu-
lation. However, in animal studies, doses of 600 ppm by
inhalation or 300 mg/kg body weight/day by oral gav-
age did not result in developmental toxicity. In reproduc-
tive studies, doses of 500 ppm by inhalation or 250 ppm
in drinking water did not result in reproductive toxicity.
These styrene doses are approximately 6-fold to 200-fold
greater than the averages for occupational exposures in
the United States.
The NTP reached the following conclusions based on
estimates of general population exposure, information on
occupational exposures, and studies in laboratory ani-
mals (Figure 3).
The NTP concurs with the CERHR Styrene Expert
Panel that there is negligible concern for adverse devel-
opmental and reproductive effects in humans exposed to
styrene, including exposures to the general population
and exposures in the workplace.
This conclusion is based on the low levels of estimated
human exposures to styrene in the general population
and in the workplace. No clear evidence of developmen-
tal or reproductive toxicity effects in experimental ani-
mals has been reported, even at comparatively high
doses of styrene. Further, there have been no reports of an
association between styrene exposures and developmen-
tal or reproductive toxicity in humans.
These conclusions are based on the information avail-
able at the time this brief was prepared. As new infor-
mation on toxicity and exposure accumulate, it may
form the basis for either lowering or raising the levels
of concern expressed in the conclusions.
The SIRC Review November 200610
FIGURE 3
NTP conclusions regarding the possibilities that human development or reproduction
might he adversely affected by exposure to styrene
Serious concern for adverse effects
Concern for adverse effects
Some concern for adverse effects
Minimal concern for adverse effects
Negligible concern for adverse effects
Insufficient hazard and/or exposure data
Developmental and Reproductive Toxicity

The SIRC Review November 2006 11
MONOGRAPh BRIEF ON ThE POTENTIAL hUMAN REPRODUCTION AND DEVELOPMENTAL EFFECTS OF STYRENE
REFERENCES
Henderson LM and Speit G (2005) Review of the genotox-
icity of styrene in humans. Mutation Research 589:158-191.
Migliore L, Naccarati A, Zanello A, Scarpato R, Bramanti
L, and Mariani M (2002) Assessment of sperm DNA
integrity in workers exposed to styrene. Human
Reproduction 17:2912-2918.
Vodicka P, Tuimala J, Stetina R, Kumar R, Manini P,
Naccarati A, Maestri L., Vodickova L., Kuricova M,
Järventaus H, Majvaldova Z, Hirvonen A, Imbriani M,
Mutti A, Migliore L, Norppa H, and Hemminki K (2004)
Cytogenetic markers, DNA single-strand breaks, urinary
metabolites, and DNA repair rates in styrene-exposed
lamination workers. Environmental Health Perspectives
112:867–871.

MONOGRAPh BRIEF ON ThE POTENTIAL hUMAN REPRODUCTION AND DEVELOPMENTAL EFFECTS OF STYRENE
The SIRC Review November 200612
NTP-CERhR STYRENE EXPERT PANEL
A 10-member panel of scientists covering disciplines such as toxicology, occupational exposure, and epidemiology,
was recommended by the Core Committee and approved by the Associate Director of the National Toxicology
Program. Prior to the expert panel meeting, the panelists critically reviewed articles from the scientific literature, as
well as a variety of other relevant documents. Based on this material they identified key studies and issues for
panel discussions. At a public meeting held June 1-3, 2005, the expert panel discussed these studies, the adequacy
of available data, and identified data needed to improve future assessments. The expert panel reached conclusions
on whether estimated exposures to styrene might result in adverse effects on human reproduction or development.
Panel conclusions were based on the scientific evidence available at the time of the meeting. The expert panel
report was made available for public comment on July 18, 2005, and the deadline for public comments was
September 1, 2005 (Federal Register Vol. 70, Number 139, pp 42064-42065). The Expert Panel Report on Styrene is
provided in Appendix II and the public comments received on the report are in Appendix III. Input from the public
and interested groups throughout the panel’s deliberations was invaluable in helping to ensure completeness and
accuracy of the report. The Expert Panel Report on Styrene is available on the CERhR website
<http://cerhr.niehs.nih.gov>.
CERhR STYRENE EXPERT PANEL:
Ulrike Luderer, PhD, MD, MPH, Chair University of California-Irvine
Thomas F.X. Collins, PhD US Food and Drug Administration
George P. Daston, PhD The Procter & Gamble Company
Lawrence J. Fischer, PhD Michigan State University
Ronald H. Gray, MD Johns Hopkins University
Franklin E. Mirer, PhD, CIH International Union, United Auto Workers
Andrew F. Olshan, PhD University of North Carolina
R. Woodrow Setzer, PhD US Environmental Protection Agency
Kimberley A. Treinen, PhD Schering-Plough Research Institute
Roel Vermeulen, PhD National Cancer Institute
With the Support of CERHR Staff:
NTP/NIEhS
Michael Shelby, PhD Director, CERHR
Christopher Portier, PhD Associate Director, National Toxicology Program
Sciences International, Inc.
Anthony Scialli, MD Principal Scientist
Annette Iannucci, MS Toxicologist
Gloria Jahnke, DVM Toxicologist
Jessie Poulin Analyst
A P P E N D I X I

The SIRC Review November 2006 13
Two Generation Reproduction Study ofStyrene by Inhalation in Crl-CD rats
George Cruzan1 *, Willem D. Faber2, Keith A. Johnson3, Linda S. Roberts4, Juergen Hellwig5,Ed Carney3, John T. Yarrington6, Donald G. Stump6
Reproductive
performance and
offspring postnatal
survival prior to
weaning were not
adversely affected
by styrene exposure.
Pre-weaning pup
weights were unaffected
by styrene exposure for
the F1generation.
1ToxWorks, Bridgeton, New Jersey2Willem Faber Consulting, Victor, NewYork3The Dow Chemical Company, Midland,Michigan4ChevronTexaco on behalf of ChevronPhillips Chemical Company LP,Richmond, California5BASF Aktiengesellschaft, Ludwigshafen,Germany6WIL Research Laboratories, LLC, Ashland,Ohio
Reprinted with permission from BirthDefects Research (Part B) 74:221-232
*Correspondence to George Cruzan,ToxWorks, 1153 Roadstown Road,Bridgeton, New Jersey 08302
Funded by: Styrene Information andResearch Center (SIRC), Arlington, VA
least 70 consecutive days prior to matingfor the F
0and F
1generations. Inhalation
exposure for the F0
and F1
females contin-ued throughout mating and gestationthrough gestation day 20. Inhalation expo-sure of the F
0and F
1females was suspend-
ed from gestation day 21 through lactationday 4. On lactation days 1 through 4, the F
0
and F1
females received styrene in virginolive oil via oral gavage at dose levels of 66,117, and 300 mg/kg/day (divided intothree equal doses, approximately 2 hrapart). These oral dosages were calculatedto provide similar maternal blood peakconcentrations as provided by the inhala-tion exposures. Inhalation exposure of theF
0and F
1females was re-initiated on lacta-
tion day 5. Styrene exposure did not affectsurvival or clinical observations. Rats inthe 150- and 500-ppm groups in bothparental generations gained weight moreslowly than the controls. There were noindications of adverse effects on reproduc-tive performance in either the F
0or F
1gen-
eration. Male and female mating and fertil-ity indices, pre-coital intervals,spermatogenic endpoints, reproductiveorgan weights, lengths of estrous cycle andgestation, live litter size and postnatal sur-vival were similar in all exposure groups.Additionally, ovarian follicle counts andcorpora lutea counts for the F
1females in
the high-exposure group were similar tothe control values. No adverse exposure-related macroscopic pathology was notedat any exposure level in the F
0and F
1gener-
ations. A previously characterized pattern
This study was conducted to evaluate thepotential adverse effects of styrene onreproductive capability from whole-bodyinhalation exposure of F
0and F
1parental
animals. Assessments included gonadalfunction, estrous cyclicity, mating behav-ior, conception rate, gestation, parturition,lactation, and weaning in the F
0and F
1gen-
erations, and F1
generation offspringgrowth and development. Four groups ofmale and female Crl:CD(SD)IGS BR rats(25/sex/group) were exposed to 0, 50, 150,and 500 ppm styrene for 6 hr daily for at

TwO gENERATION REPRODUCTION STUDy OF STyRENE by INHALATION IN CRL-CD RATS
of degeneration of the olfactory epithelium that lines thedorsal septum and dorsal and medial aspects of the nasalturbinates occurred in the F
0and F
1generation animals
from the 500-ppm group. In the 500-ppm group, F2
birth-weights were reduced compared to the control and F
2off-
spring from both the 150- and 500-ppm exposure groupsgained weight more slowly than the controls. Based onthe results of this study, an exposure level of 50 ppm wasconsidered to be the NOAEL for F
0and F
1parental sys-
temic toxicity; the NOAEL for F0and F
1reproductive toxi-
city was 500 ppm or greater. Birth Defects Res B 74:211-220, 2005 ©2005 Wiley-Liss, Inc.
INTRODUCTION
Styrene (CAS no. 100-42-5) is a commercially importantmonomer, which is used in the manufacture of poly-styrene products (packaging, insulation, etc.), acryloni-trile-butadiene-styrene (ABS) products (appliance cases,automotive parts, etc.), synthetic rubber, and reinforcedplastics. Exposure to the general population occurs at lev-els of micrograms per day from ambient air and intake offood (IARC, 2002).
The reproductive and developmental effects of styrenehave been extensively reviewed by Brown et al. (2000).Reports of styrene-related effects on human reproductionare limited and conflicting. A large study of US womenconcluded that styrene exposure did not affect menstrualcycle (Lemasters et al., 1985); however, Cho et al. (2001)concluded that exposure to styrene increased the risk ofmenstrual cycles longer than 35 days. One study (Jelnes,1988) suggested increased sperm abnormalities in work-ers exposed to high levels of styrene in the reinforcedplastics industry. A later study of 23 workers (Kolstad etal., 1999) found no effect on sperm abnormalities, butreported a decrease in sperm density during the first 6months of exposure to styrene in the reinforced plasticsindustry. In a study of 220 male reinforced plastics work-ers exposed to high levels of styrene, there was no rela-tionship between exposure and time to pregnancy of theirpartners (Kolstad et al., 2000). A study of female rein-forced plastics workers reported a possible decrease (4%)in birth weight of offspring of mothers exposed to styreneabove 80 ppm and other solvents (Lemasters, 1989). Birthweights were taken from mothers’ memory, not birthrecords, and the difference was not statistically significant.
No effects on fertility or reproduction were found inthree generations of male and female Sprague-Dawleyrats exposed to 125 or 250 ppm styrene in their drinkingwater (Beliles et al., 1985). The concentration was limitedby the solubility of styrene in water (approximately 300
ppm). Water consumption was significantly reduced inboth groups compared to controls, indicating taste aver-sion. While this study demonstrated no effects on fertility,gestation, or reproduction, its value for risk assessment islimited due to the low doses achieved (<25 mg/kg/day).
No effects on ovarian or testicular pathology havebeen reported in several of the subchronic or chronic tox-icity studies in rats (500 to 2,000 mg/kg/day gavage, 50-1,500 ppm inhalation) and mice (150-300 mg/kg/daygavage, 20 to 200 ppm inhalation) (NCI, 1979; Cruzan etal., 1997, 1998, 2001; Roycroft et al., 1995). On the otherhand, testicular pathology and decreases in sperm countwere reported in rats treated with 400 mg/kg/daystyrene by gavage for 60 days (Srivastava et al., 1989).Decreased free testosterone in plasma was reported inpre-pubertal male C57BL/6 mice exposed to 50 mg/lstyrene in drinking water for 4 weeks (12 mg/kg/day).There were no effects on body weight, testis weight, plas-ma cortisone, or plasma luteinizing hormone (Takao etal., 2000).
Because data on the reproductive effects of styrenewere limited, a two-generation reproduction study wasconducted via whole-body inhalation according to cur-rent regulatory guidelines. Developmental neurotoxicityevaluation of selected offspring from the second genera-tion are reported in an accompanying article (Cruzan etal., 2005, this issue). In most reproduction studies con-ducted by inhalation, exposure is stopped on day 20 ofgestation and reinstated on lactation day 5 to minimizestress on the offspring from the more than 6-hr separationthat would occur during inhalation exposure of the dam.Because high concentrations of styrene may cause centralnervous system (CNS) depression and significant devel-opment of the CNS occurs during the first few days afterbirth in rats, F
0and F
1dams were treated orally during
lactation days 1-4 at doses estimated by physiologicallybased pharmacokinetic (PBPK) modeling to mimic a 6-hrinhalation exposure.
MATERIALS AND METHODS
Study Design
Four groups of male and female Crl:CD rats(25/sex/group) were exposed to vapor atmospheres ofstyrene at 0, 50, 150, or 500 ppm for 6 hr daily for at least70 consecutive days prior to mating. Daily vaginalsmears were performed for assessment of estrous cyclici-ty, beginning 21 days prior to pairing. Females werepaired with males on a 1:1 basis for 14 days or until evi-dence of mating was observed. The F
0and F
1females con-
tinued inhalation exposure throughout mating and gesta-
The SIRC Review November 200614

TwO gENERATION REPRODUCTION STUDy OF STyRENE by INHALATION IN CRL-CD RATS
tion through gestation day 20. On lactation days 1through 4, the F
0and F
1females received styrene in virgin
olive oil via oral gavage at dose levels of 66, 117, and 300mg/kg/day (divided into three equal doses, approxi-mately 2 hr apart) at a dose volume of 1 ml/kg/dose. Thedoses were calculated to mimic the peak maternal bloodlevel of styrene during a 6-hr inhalation exposure at thetarget concentration based on the PBPK model ofSarangapani et al. (2002). Inhalation exposure of the F
0
and F1
females was re-initiated on lactation day 5 andcontinued through the day prior to euthanasia. Offspringwere weaned on lactation day 21; exposure of F
1pups
began on postnatal day (PND) 22. Inhalation exposure ofthe F
0and F
1males continued throughout mating, and
through the day prior to euthanasia. Spermatogenic end-points were recorded for all F
0and F
1males. Ovarian pri-
mordial follicle counts and the corpora lutea counts wererecorded for all F
1females in both the control and high-
exposure groups and for F1
females in the other exposuregroups that did not mate or produce offspring.
Test Material
Styrene monomer (inhibited from self-reaction by 10 ppmt-butylcatechol), CAS No. 100-42-5, was provided byChevron Phillips Chemical Company LLP, St. James, LA.The purity and stability of the styrene were verified bygas chromotography with flame ionization detection.When present in the chromatograms, the percentage ofbenzene, ethylbenzene, styrene oxide, and styrene dimerswas also determined. Results obtained indicated thestyrene was at least 99.9% pure.
Animals and Animal Husbandry
One hundred fifteen male and 116 femaleCrl:CD®(SD)IGS BR rats from different colonies (to avoidsibling matings) were received from Charles RiverLaboratories, Inc. (Raleigh, NC) on July 24, 2001. The ani-mals were 37 and 38 days old upon receipt, respectively.At the conclusion of the acclimation period, all availableF
0animals were weighed and examined in detail for
physical abnormalities. Animals judged to be in goodhealth and meeting acceptable body weight requirementswere randomized into treatment groups by a computer-ized program to ensure homogeneity of treatmentgroups.
Until pairing, all F0
and F1
parental test animals wereindividually housed in clean, wire-mesh cages suspend-ed above cage-board. During cohabitation, the animalswere paired for mating in the home cage of the male.Following positive evidence of mating, the males werehoused in suspended wire-mesh cages until the sched-
uled necropsy of the parental generations, and thefemales were transferred to plastic maternity cages withnesting material (Bed-O’Cobs®; The Andersons,Industrial Products Division, Maumee, Ohio). The damswere housed in these cages until weaning on lactationday 21. Animals were housed in accordance with theGuide for the Care and Use of Laboratory Animals. Theanimal care program including animal facilities areaccredited by the Association for Assessment andAccreditation of Laboratory Animal Care International(AAALAC International).
Animals were fed PMI Nutrition International, Inc.,Certified Rodent LabDiet® 5002 ad libitum. Municipalwater was reverse-osmosis-treated (on-site) and deliv-ered by an automatic watering system to individual cagesad libitum, except by water bottles when water consump-tion was measured during gestation and lactation. Nowater was available during inhalation exposure. Animalswere housed throughout the acclimation period and dur-ing the study in an environmentally controlled room.
Parental Observations
All animals were observed twice daily (at least 7 hr apart)for moribundity and mortality, appearance, behavior, andpharmacotoxic signs (prior to exposure/gavage dosingfor the F
0and F
1animals). During inhalation exposures,
approximately 50% of the F0and F
1animals in each group
were visible through the chamber windows; the visibleanimals were observed for appearance and behavior atthe mid-point of exposure. The F
0and F
1animals were
also observed within 1 hr following exposure/gavage dos-ing. Detailed physical examinations were recorded week-ly for all F
0and F
1parental animals throughout the study
period. F0
and F1
females expected to deliver were alsoobserved twice daily during the period of expected par-turition and at parturition for dystocia or other difficulties.
Individual F0
and F1
male body weights were recordedweekly throughout the study and prior to the schedulednecropsy. Individual F
0and F
1female body weights were
recorded weekly until evidence of copulation wasobserved. Once evidence of mating was observed, femalebody weights were recorded on gestation days 0, 4, 7, 11,14, and 20 and on lactation days 1, 4, 5 (pre-exposure), 7,14, and 21.
Individual F0
and F1
male food consumption was mea-sured on a weekly basis (except during the mating peri-od) until the scheduled necropsy. Individual F
0and F
1
female food consumption was measured on a weeklybasis until the start of the mating period. Female foodconsumption was recorded on gestation days 0, 4, 7, 11,14, and 20 and lactation days 1, 4, 5, 7, 14, and 21. Water
The SIRC Review November 2006 15

TwO gENERATION REPRODUCTION STUDy OF STyRENE by INHALATION IN CRL-CD RATS
consumption was recorded daily during gestation andlactation for the F
0and F
1females.
Assessment of Reproductive Performance
Vaginal smears were prepared daily to determine thestage of estrus for each female, beginning 21 days prior topairing and continuing until evidence of mating wasobserved. For females with no evidence of mating,smearing was continued until termination of the matingperiod. The average cycle length was calculated for com-plete estrous cycles.
After a minimum of 70 days of exposure, each femalewas housed overnight in the home cage of a randomlychosen male from the same exposure group, avoiding sib-ling matings. Each mating pair was examined daily forthe presence of a copulatory plug or the presence ofsperm in a vaginal smear. The day when evidence of mat-ing was identified was termed day 0 of gestation. Theanimals were then separated and the female was housedin an individual plastic cage with nesting material. Whenevidence of mating was not apparent after 14 days, thefemale was placed for an additional 7 days with anothermale of the same exposure group that had successfullymated. If no evidence of copulation was obtained after 21days, the animals were separated without further oppor-tunity for mating, and the female was placed in a plasticcage containing nesting material. Following the secondmating period, the females were euthanized on gestationday 15 (females that mated with the second male) or post-cohabitation day 15 (females that did not mate with thesecond male). Pre-coital intervals were calculated accord-ing to the number of 12-hr dark cycles prior to evidenceof mating.
All females were allowed to deliver naturally and reartheir young to weaning (PND 21). During the period ofexpected parturition, the females were observed twicedaily for initiation and completion of parturition and forsigns of dystocia. On the day parturition was judgedcomplete (PND 0), the sex of each pup was determinedand each was examined for gross malformations; thenumbers of stillborn and live pups were recorded.Individual gestation lengths were calculated using thedate delivery started.
Offspring Evaluations
All pups were individually identified by application oftattoo markings on the digits on PND 0. Each litter wasexamined twice daily for survival and signs of toxicity.Intact offspring dying from PND 0 to 4 were necropsiedusing a fresh dissection technique (Stuckhardt andPoppe, 1984). A detailed gross necropsy was performed
on any pup dying after postnatal day 4 and prior toweaning and for all F
1pups dying between PND 22 and 28.
To reduce variability among litter size, 10 F1
and F2
pups from each litter were randomly selected of equal sexdistribution, if possible, on PND 4. The remaining F
1and
F2
offspring were weighed, euthanized by intraperitonealinjection of sodium pentobarbital, and discarded on PND 4.
Pups were individually sexed on PND 0, 4, 7, 14, and21. F
1pups were individually weighed on PND 1, 4, 7, 14,
and 21; F2
pups were individually weighed on PND 1, 4,7, 11, 13, 17, and 21. The following investigations wereused to assess the maturation of the selected F
1and F
2
pups: pinna detachment, surface righting response, hairgrowth, incisor eruption, eye opening, balanopreputialseparation, and vaginal patency. Individual pups wereweighed on the day of sexual maturation. These data arepresented in the companion developmental neurotoxicitystudy (Cruzan et al., 2005, this issue).
Weaning and Selection for F1
Each F0
dam and its litter remained housed together(except during inhalation exposures of the dams 6hr/day on lactation days 5-20) until weaning on lactationday 21. On PND 21, a computerized randomization pro-cedure was used to select two F
1male and two F
1female
weanlings per litter. These pups were exposed to the testarticle for 6 hr per day beginning on PND 22. BetweenPND 22 and 28, 6 male and 6 female control pups died; 0from the 50-ppm group; 1 male and 2 females from the150-ppm group, and 1 male and 2 females from the 500-ppm group died. One male and one female from each lit-ter, when available, were randomly selected on PND 28to comprise the F
1generation (16, 23, 23, and 22 males
and females for 0, 50, 150, and 500 ppm, respectively).Additional rats (9, 2, 2, and 3 males and females for 0, 50,150, and 500 ppm) were randomly chosen from theremaining male and female from each litter to make 25male and 25 female in each F
1exposure group (0, 50, 150,
and 500 ppm). The remaining pups were euthanized onPND 28.
Ovarian and Spermatogenic Endpoint Evaluations
A bilateral evaluation of one section of each ovary wasperformed for F
0females. A quantitative histologic evalu-
ation of five sections (at least 100 µm apart) from theinner third of each ovary was conducted on all F
1females
in the control and high-dose group. This examinationincluded enumeration of the total number of primordialfollicles and corpora lutea according to the methods ofBolon et al. (1997) and Bucci et al. (1997). The primordialfollicles were defined as small oocyte with a nucleus sur-
The SIRC Review November 200616

TwO gENERATION REPRODUCTION STUDy OF STyRENE by INHALATION IN CRL-CD RATS
rounded by a partial or unbroken single layer of flattenedto cuboidal follicular/granulosa cells. Due to the size ofcorpora lutea (much larger than primordial follicles),each corpus luteum was possibly sectioned and countedmultiple times, resulting in a value that was larger thanwould be expected.
Spermatogenic endpoints were evaluated using themethods described by Nemec et al. (2004). Immediatelyupon euthanasia, the right epididymis of each F
0and F
1
male was exposed, excised, and weighed. Sperm motilitywas assessed using the Hamilton-Thorne HTM-IVOSVersion 10 (Beverly, MA) computer-assisted sperm analy-sis (CASA) system. Sperm morphology was evaluated bylight microscopy via a modification of the wet-mountevaluation technique (Linder et al., 1992).
The left testis and cauda epididymis from all F0
and F1
males from all exposure groups were weighed and storedfrozen (approximately -20°C). These tissues from the con-trol and 500-ppm groups were then thawed, homoge-nized, and a sample was evaluated for determination ofhomogenization-resistant spermatid count and spermproduction rate (Blazak et al., 1985).
PathologyAll F
0and F
1adult animals were euthanized by isoflurane
inhalation and exsanguination. Vaginal smears were per-formed on all females on the day of euthanasia to deter-mine the stage of estrous cycle. All surviving males wereeuthanized approximately 3 weeks following completionof the parturition period. All surviving females thatdelivered were euthanized between 6 and 10 days afterweaning of their litters. Females that mated but did notgive birth were euthanized on presumed gestation day25. Females that experienced total litter loss were eutha-nized within 24 hr. All surviving F
1weanlings not select-
ed for styrene exposure were euthanized on PND 21. AllF
1weanlings exposed to styrene PND 22-27 but not cho-
sen to become F1
parents, were euthanized on PND 28.All F
2weanlings not selected for behavioral evaluation
were euthanized on PND 21. A complete necropsy wasconducted, selected organs were weighed, and selectivehistopathologic examination was performed.
Statistical Methods
Analyses were conducted using two-tailed tests (exceptas noted otherwise) for a minimum significance level of5%, comparing each test article-treated group to the dif-ferences. Parental mating and fertility indices were ana-lyzed using the Chi-square test with Yates’ correction fac-tor (Hollander and Wolfe, 1999). Mean parental (weekly,gestation and lactation) and F
2offspring body weight
data, food consumption and food efficiency data, organweight data, maternal estrous cycle data, pre-coital inter-vals, gestation lengths, implantation sites, unaccountedsites, ovarian primordial follicle counts, mean number ofpups born, live litter size, epididymal and testicularsperm numbers, and sperm production rates were ana-lyzed for heterogeneity of variance (Levene, 1960) andnormality (Royston, 1982). If the data were homogeneousand normal, a parametric one-way analysis of variance(ANOVA) was used to determine intergroup differences(Snedecor and Cochran, 1980). If the results of theANOVA were significant (p<0.05), Dunnett’s (1964) testwas applied to compare the control group versus alltreatment groups. If the data were not homogeneous andnormal, the data were analyzed by the Kruskal-Wallis(1952) nonparametric ANOVA test to determine the inter-group differences. If the ANOVA revealed statistical sig-nificance (p<0.05), the Mann-Whitney U-test (Kruskaland Wallis, 1952) was used to compare the test article-treated groups to the control group. Pup weights throughweaning were analyzed separately by sex by a nestedanalysis of covariance (ANCOVA). The number of pupsborn was used as the covariate. The following assump-tions were made regarding the ANCOVA: homogeneityof regression slopes, linear relationship between the pupweights and number of pups born, and additive groupand regression effects. Histopathologic findings in thetest article-treated groups were compared to the controlgroup using a two-tailed Fisher’s Exact test (Steel andTorrie, 1980).
RESULTS
Exposures
Gas chromatographic analyses of chamber atmospheresdemonstrated mean daily styrene exposure concentra-tions of 0, 50, 151, and 499 ppm for F
0generation and 0,
50, 153, and 501 ppm for F1
generation. Standard devia-tion/mean concentration never exceeded 3.5%. Low lev-els of styrene oxide were detected in exposure chamberson nearly 50% of analyses. Except for 5 occasions, thestyrene oxide level was less than 1 ppm, was nevergreater than 2.3 ppm, and was not proportional to thechamber styrene concentration. Styrene dimer wasdetected in chamber atmospheres of ~20% of the samplestested; levels were less than 2 ppm.
Analyses of the oral dosing formulations used duringlactation days 1-4 showed homogeneity and stability;analyzed concentrations were within 12% of target.
The SIRC Review November 2006 17

TwO gENERATION REPRODUCTION STUDy OF STyRENE by INHALATION IN CRL-CD RATS
Parental Evaluations
No exposure-related clinical findings were noted at theweekly detailed physical examinations or at the observa-tions made prior to, at the midpoint, or 1 hr followingexposure in either F
0or F
1animals. Findings noted in the
treated groups occurred infrequently, at similar frequen-cies in the control group, and/or in a manner that wasnot exposure-related.
Body weight gain was slightly reduced in F0males and
females at 500 ppm as evidenced by decreased meanbody weights during premating weeks 3-10 (Table 1). InF
0males exposed at 150 ppm, mean weight gain was
reduced during the first week (31 vs. 39 g in the controlgroup); body weight was significantly reduced at week 7.Body weights of F
1males and females at 150 and 500 ppm
were reduced compared to controls after exposure onPND 22-27 and remained reduced through the F
1expo-
sure period (Table 1). There was no effect on bodyweight
The SIRC Review November 200618
TAbLE 1
Mean Body Weights (g) of F0and F
1Rats During Premating, Gestation, and Lactation
Exposure conc. (ppm)Males Females
0 50 150 500 0 50 150 500F
0
Week0 266 263 264 263 190 190 190 1891 305 301 295 287 215 210 208 2033 378 347 359 353* 251 246 243 231*5 437 419 413 404* 273 269 262 252*7 483 455 454* 443* 290 288 279 269*10 530 503 503 494 306 303 296 282*
F0gestation
Day0 302 300 298 2857 330 323 325 31214 362 354 357 34620 427 424 428 418
F1males
Week0 110 112 103 97 97 104 93 901 173 173 162 151* 141 147 135 1333 292 285 272* 262* 196 199 187 1875 375 369 349* 336* 240 242 227 224*7 429 421 399* 393* 267 268 253 249*10 481 468 448 443* 293 293 278 269*
F1gestation
Day0 296 295 279 274*7 325 324 308 3074 356 354 340 334* 20 428 431 410 402
* Statistically significantly different from control, p<0.05.

TwO gENERATION REPRODUCTION STUDy OF STyRENE by INHALATION IN CRL-CD RATS
or bodyweight gain at 50 ppm in either the F0
or F1
expo-sure periods.
Only very minor differences in food consumptionbetween exposed and control groups were reported (datanot shown).
Gestation
Styrene exposure had no effect on body weight gain orfood consumption during gestation in either the F
0or F
1
dams (Table 1). Mean body weight reductions observedin the 500-ppm group F
1females during gestation were
attributed to the reduced body weight gain observed dur-ing the pre-mating period. At 500 ppm, water consump-tion during gestation was increased slightly, but statisti-cally significantly, in both F
0and F
1dams (Fig. 1). There
was no effect at 150 or 50 ppm.The mean lengths of gestation were unaffected by test
article exposure in the F0(Table 2) and F
1(Table 3) treated rats.
No signs of dystocia were noted at any exposure level.
Lactation
There was no effect of styrene exposure on body weightgain or food consumption during lactation in either the F
0
or F1
dams (data not shown). Water consumptionincreased during lactation days 5-14 in F
0dams exposed
to 150 or 500 ppm, but not in F1
dams. No effect wasnoted in F
0or F
1dams at 50 ppm.
Reproductive Performance
Exposure of F0
females had no effect on mean estrouscycle length (Table 2). The means for all treated groups(4.2 to 5.1 days) were within the historical range (4.1 to5.1 days), while the mean for the control females (5.8days) was abnormally high due to 3 control females withabnormally long estrous cycles. Exposure of F
1females
had no effect on mean estrous cycle length (Table 3). Noeffects from exposure of F
0or F
1rats were observed on the
mean numbers of days between pairing and coitus.Styrene exposure had no effects on F
0or F
1spermatogenic
endpoints (Table 4). Exposure to styrene did not affect F0
or F1male or female mating index, male or female fertility
index, mean number of pups born, the number of formerimplantation sites, or the number of unaccounted sites(Tables 2, 3).
Pathology
At the scheduled F0
and F1
male and female necropsies,no macroscopic findings attributed to styrene wereobserved. Increases in relative (to final body weight) liverweights were observed in the 150- and 500-ppm group F
0
and F1
males (data not shown). Other organ weights(absolute and relative to final body weight) were unaf-fected by the test article at all exposure levels.
Microscopic evaluations were performed only on tis-sues from all F
0and F
1parental animals in the 0- and 500-
ppm groups and for those adult animals in the 50- and
The SIRC Review November 2006 19
FIgURE 1
Mean water consumption of F0(A) and F
1(B) females during gestation.
120
100
80
60
40
20
0
0 PPM
50 PPM
150 PPM
500 PPM
0-4 4-7 7-11 11-14 14-20
Interval (days)
Wat
er C
on
sum
pti
on
(g
/an
imal
/d
ay)
120
100
80
60
40
20
0
0 PPM
50 PPM
150 PPM
500 PPM
1-4 4-5 5-7 7-14 14-21
Interval (days)
Wat
er C
on
sum
pti
on
(g
/an
imal
/d
ay)
A. b.

TwO gENERATION REPRODUCTION STUDy OF STyRENE by INHALATION IN CRL-CD RATS
TAbLE 2
Reproductive and Offspring Parameters for F0Generation Rats Exposed to Styrene
Parental exposure level (ppm)
0 50 150 500Reproduction parameters (mean±SD)No. F
0males/females assigned 25/25 25/25 25/25 25/25
Males/females died 0/0 0/0 0/0 0/0Males/females euthanizeda 0/7 0/2 0/2 0/3Males/females completing study 25/18 25/23 25/23 25/22
Estrous cycle length (days) 5.8 ± 3.1 5.1 ± 2.0 5.1 ± 2.2 4.2 ± 0.5*Male mating index (%)b 23/25 (92) 25/25 (100) 25/25 (100) 23/25 (92)Female mating index (%)b 25/25 (100) 25/25 (100) 25/25 (100) 25/25 (100)Pre-coital interval (days) 3.8 ± 3.9 2.0 ± 1.0 2.5±1.3 3.6 ± 3.5Male fertility index (%)c 21/25 (84) 24/25 (96) 24/25 (96) 23/25 (92)Female fertility index (%)c 22/25 (88) 24/25 (96) 24/25 (96) 25/25 (100)
Fertility determined via 2nd male 2 0 0 2Females delivering litters 20 23 24 23Gestation length (days) 21.9 ± 0.3 21.9 ± 0.5 21.8 ± 0.6 22.0 ± 0.3Implantation sites 15.2 ± 1.8 14.8 ± 3.6 15.8 ± 1.8 15.3 ± 1.8Number born/litter 14.5 ± 1.9 13.8 ± 3.2 14.9 ± 1.8 14.3 ± 1.6Live litter size 14.3 ± 1.8 13.5 ± 3.3 14.3 ± 2.0 14.1 ± 1.6Live birth index (%)d 99.0 ± 2.5 97.6 ± 4.5 96.1 ± 6.2 98.2 ± 3.5Females with surviving 18 23 23 22
pups at weaning (PND 21)
F1offspring parameters (mean±SD)
Sex distribution at birth (% Males) 46.6 ± 14.9 51.0 ± 11.6 46.8 ± 12.1 48.9 ± 11.8Survival (%)
Birth to PND 4 (pre-culling) 98.7 ± 2.8 96.1 ± 5.9 94.5 ± 8.2 92.7 ± 17.1PND 4-21 (post-culling) 91.1 ± 23.6 98.6 ± 4.7 98.3 ± 5.8 93.5 ± 20.8
Body weight gain (g)Males PND 1-4 (pre-culling) 2.6 ± 0.6 3.0 ± 1.1 2.9 ± 0.6 2.7 ± 1.1Females PND 1-4 (pre-culling) 2.5 ± 0.6 3.0 ± 1.3 2.7 ± 0.8 2.5 ± 1.0
PND 21 body weight (g)Males 38.4 ± 6.3 41.4 ± 5.5 39.1 ± 5.2 38.5 ± 3.8Females 37.6 ± 5.8 40.7 ± 7.1 37.1 ± 5.4 37.3 ± 3.9
aOne female each from the control and 150-ppm groups were euthanized in extremis after the mating trial; one femaleeach from the control and 500-ppm groups were euthanized during lactation due to total litter loss; all others wereeuthanized for pregnancy determination after no evidence of mating.bMating Index: Proportion of males/females showing evidence of mating relative to the number cohabited x 100;positive evidence of mating included vaginal sperm, copulatory plug, and or/pregnancy.cFertility Index: Proportion of pregnancies relative to the number showing evidence of mating x 100; males wereconsidered to have sired a litter if the paired female was gravid, regardless of delivery status. Females that did not showevidence of mating during cohabitation with the first male were paired with a second male; these outcome data wereused only for calculating fertility indices.dLive Birth Index: Number born live relative to the total number born x 100.*Dunnett’s Test, significantly different from control, p≤0.05. No other significantly different effects.
The SIRC Review November 200620

TwO gENERATION REPRODUCTION STUDy OF STyRENE by INHALATION IN CRL-CD RATS
The SIRC Review November 2006 21
TAbLE 3
Reproductive and Offspring Parameters for F1Generation Rats Exposed to Styrene
Parental exposure level (ppm)0 50 150 500
Reproduction parameters (mean±SD)F
1Males/females assigned (PND28) 25/25 25/25 25/25 25/25Males/females died 0/1 0/0 0/0 0/0Males/females euthanizeda 0/3 0/1 0/4 0/3Males/females completing study 25/21 25/24 25/21 25/22
Estrous cycle length (days) 4.9 ± 1.1 4.9 ± 1.4 4.8 ± 1.4 4.5 ± 0.8Male mating index (%)b 23/25 (92) 25/25 (100) 22/25 (88) 24/25 (96)Female mating index (%)b 24/25 (96) 25/25 (100) 24/25 (96) 25/25 (100)Pre-coital interval (days) 4.7 ± 3.3 3.4 ± 1.7 4.6 ± 4.2 3.3 ± 3.5Male fertility index (%)c 23/25 (92) 24/25 (96) 21/25 (84) 24/25 (96)Female fertility index (%)c 23/25 (92) 24/25 (96) 23/25 (92) 25/25 (100)
Fertility determined via 2nd male 2 0 3 1Females delivering litters 23 24 21 24Gestation length (days) 22.0 ± 0.6 22.0 ± 0.4 22.1 ± 0.2 21.9 ± 0.5Implantation sites/litter 14.3 ± 2.6 14.6 ± 2.2 14.8 ± 2.3 14.3 ± 4.4Number born/litter 13.6 ± 2.5 14.1 ± 2.4 13.8 ± 2.2 13.4 ± 4.7Live litter size 12.7 ± 3.6 13.7 ± 2.5 13.8 ± 2.2 13.1 ± 5.0Live birth index (%)d 93.3 ± 21.3 97.1 ± 5.9 99.7 ± 1.4 95.0 ± 20.4Females with surviving pups 21 24 21 22
pups at weaning (PND 21)
F2Offspring parameters (mean±SD)
Sex distribution at birth (% males) 47.1 ± 14.5 51.2 ± 12.2 47.9 ± 15.6 55.2 ± 13.8Survival (%)
Birth to PND 4 (pre-culling) 92.7 ± 21.5 91.2 ± 16.0 96.9 ± 7.7 89.2 ± 28.0PND 4-21 (post-culling) 99.5 ± 2.2 96.9 ± 6.2 99.5 ± 2.2 97.7 ± 5.3
Body weight gain (g)Males PND 1-4 (pre-culling) 3.3 ± 0.9 3.0 ± 1.0 3.3 ± 0.7 2.9 ± 1.0Females PND 1-4 (pre-culling) 3.0 ± 0.9 2.9 ± 0.8 3.1 ± 0.7 2.6 ± 0.7
PND 21 body weight (g)Males 42.6 ± 5.3 40.3 ± 5.2 38.2 ± 5.1* 38.0 ± 6.2*Females 40.5 ± 4.7 39.1 ± 5.0 37.4 ± 4.8 35.4 ± 5.7*
aOne female from the control group and two females from the 500-ppm group were euthanized during the lactationperiod due to total litter loss; all others were euthanized for pregnancy determination after no evidence of mating.bMating Index: Proportion of males/females showing evidence of mating relative to the number cohabited x 100;positive evidence of mating included vaginal sperm, copulatory plug and or/pregnancy.cFertility Index: Proportion of pregnancies relative to the number showing evidence of mating x 100; males wereconsidered to have sired a litter if the paired female was gravid, regardless of delivery status. Females that did not showevidence of mating during cohabitation with the first male were paired with a second male; these outcome data wereused only for calculating fertility indices.dLive Birth Index: Number born live relative to the total number born x 100.*Dunnett’s Test: significantly different from control; p≤0.05. No other significantly different effects.

TwO gENERATION REPRODUCTION STUDy OF STyRENE by INHALATION IN CRL-CD RATS
150-ppm exposure groups that were found dead or wereeuthanized in extremis. In the 500-ppm males andfemales, exposure-related microscopic findings were con-fined to the nasal cavity. Increased occurrences of mini-mal to mild degeneration of the olfactory epithelium thatlined the dorsal septum and dorsal medial aspects of thedorsal turbinates (ethmoturbinates) primarily at nasallevels II, III, and IV (Young, 1981) were found comparedto the control group. The olfactory epithelial degenera-tion was characterized by disorganization and generallyone or more of the following features: regenerativehyperplasia, individual cell necrosis, atrophy, andincreased presence of Bowman’s glandular elements andcysts within olfactory epithelium. Despite these olfactoryepithelial changes, the exposure-induced lesions did nothave any inflammatory response. The incidence of nasallesions was less in high-exposure F
1rats than in F
0rats.
No other exposure-related microscopic findings werenoted in the 500-ppm group.
At the scheduled necropsy of the F1
females, meannumbers of primordial follicles per section (Bolon et al.,1997) were 5.0 and 5.1 for females in the control and 500-ppm groups, respectively. The mean numbers of corporalutea per section (Bucci et al., 1997) were 9.2 and 10.1 forfemales in the same respective groups. The mean num-bers of primordial follicles and corpora lutea for all exam-ined animals were unaffected by test article exposure.
In addition, reproductive tract organs for low- andmid-exposure group adult animals that did not mate orproduce offspring were examined microscopically. Notreatment-related effects were found.
Offspring Evaluations (Tables 2, 3)
The mean number of F1
and F2
pups born, live litter size,percentage of males per litter at birth, and postnatal sur-vival between PND 0 (relative to number born), 0-1, 1-4(pre-selection), PND 4 (post-selection) to 7, 7-14, 14-21,and from birth to PND 4 (pre-selection) and PND 4 (post-
The SIRC Review November 200622
TAbLE 4
Spermatogenic Endpoints of F0and F
1Malesa
Group (ppm)
0 50 150 500F
0males
Sperm number (millions/g tissue)Left testis 79.1 ± 17.0 ND ND 78.6 ± 11.2Left cauda epididymis 739 ± 148 ND ND 727 ± 157
Motile sperm (%) 88.6 ± 7.5 87.6 ± 8.1 87.5 ± 9.0 91.5 ± 4.1Progressive motile sperm (%) 75.6 ± 9.9 72.4 ± 11.3 74.8 ± 12.1 78.4 ± 5.7Sperm morphology (%)
Normal 99.5 99.1 98.5 99.6Normal head separated from flagellum 0.3 0.6 1.0 0.3Head absent, normal flagellum 0.2 0.3 0.5 0.1
F1males
Sperm number (millions/g tissue)Left testis 96.6 ± 42.9 ND ND 106.9 ± 39.9Left cauda epididymis 619 ± 148 ND ND 639 ± 171
Motile sperm (%) 84.3 ± 12.7 80.6 ± 19.9 76.7 ± 25.8 86.4 ± 8.7Progressive motile sperm (%) 73.0 ± 15.9 69.4 ± 20.5 65.9 ± 23.2 75.0 ± 10.7Sperm morphology (%)
Normal 99.3 98.3 98.0 98.7Normal head separated from flagellum 0.4 1.1 1.4 0.6Head absent, normal flagellum 0.2 0.6 0.6 0.6
aND=Not determined. No values were statistically significantly different from control.

TwO gENERATION REPRODUCTION STUDy OF STyRENE by INHALATION IN CRL-CD RATS
selection) to PND 21 were unaffected by styrene expo-sure. The numbers of F
1and F
2pups found dead, eutha-
nized in extremis, and/or missing, as well as the generalphysical condition of all F
1pups in this study, were unaf-
fected by styrene exposure.Mean F
1male and female pup body weights were
unaffected by parental exposure to styrene. Mean F2
pupbody weight gains and mean body weights in the 500-ppm group were decreased (6.8-13.3%) throughout thepre-weaning period (PND 0-21). The mean male andfemale F
2pup body weight changes in the 150-ppm
group were similar to the control group during PND 1-4,but decreased PND 4-21 (only males significantly differ-ent from control). Mean body weights and mean bodyweight gains in the 50-ppm group F
2males and females
were unaffected by maternal exposure to styrene (Fig. 2).
Offspring Pathology
No macroscopic findings that could be attributed toparental exposure with the test article were noted at thescheduled necropsy of F
1or F
2pups euthanized on PND
21. Mean organ weights (absolute and relative to finalbody weight) in the styrene-exposed F
1males and
females examined at the PND 21 necropsy were similar tothe control group.
Statistically significant (p<0.01) reductions in meanabsolute pituitary, thymus, and uterine weight occurredin F
2female offspring of dams exposed to 500 ppm.
Because these pups had reduced body weight, comparedto controls, and the relative organ weights were notreduced, the reductions in female pituitary, thymus, anduterine weight were attributed to growth retardation, notto direct effects on these organs. Similarly, a reduction inabsolute, but not relative, pituitary weight in F
2female
offspring of dams exposed to 150-ppm styrene was con-sidered due to growth retardation. Statistically significant(p<0.01) reductions in mean absolute and relative pitu-itary weight occurred in F
2male offspring of dams
exposed to 500 ppm (Table 5). Because the relative pitu-itary weight was decreased in males, this was attributedto a test article effect on the pituitary, not just growthretardation.
DISCUSSION
The parental systemic toxicity of styrene reported in thisstudy was similar to that previously reported in rats fol-lowing long-term inhalation exposure (Cruzan et al.,1997, 1998). Findings included degeneration of the olfac-tory epithelium that lines the dorsal septum and dorsaland medial aspects of the nasal turbinates of F
0and F
1
animals in the high-exposure group (500 ppm; nasal tis-sue was not examined in the low- and mid-exposuregroups), decreased mean body weights in the mid-expo-sure group (F
0and F
1males and F
1females) and high-
exposure group (F0
and F1
males and females), and
The SIRC Review November 2006 23
FIgURE 2
Mean bodyweights of male (A) and female (B) F2offspring through weaning.
50
45
40
35
30
25
20
15
10
5
0
0 PPM
50 PPM
150 PPM
500 PPM
0 3 6 9 12 15 18 21
Postnatal Day
Bo
dy
Wei
gh
t (g
)
50
45
40
35
30
25
20
15
10
5
0
0 PPM
50 PPM
150 PPM
500 PPM
0 3 6 9 12 15 18 21
Postnatal Day
Bo
dy
Wei
gh
t (g
)
A. b.

TwO gENERATION REPRODUCTION STUDy OF STyRENE by INHALATION IN CRL-CD RATS
increased water consumption during gestation in thehigh-exposure group (F
0and F
1females) and during lacta-
tion in the mid- and high-exposure groups (F0
females).In the previous chronic study, nasal lesions increased inincidence and severity with dose. A NOAEL was notfound, but effects at 50 ppm were slight and not all ani-mals were affected even after 24 months. Decreased bodyweight and increased water consumption were found at500 and 1,000 ppm for 2 years.
Reproductive performance and offspring postnatalsurvival prior to weaning were not adversely affected bystyrene exposure. Pre-weaning pup weights were unaf-fected by styrene exposure for the F
1generation.
Following direct exposure of the F1weanlings on PND 22,
body weight reductions were observed in the 500-ppmgroup that led to the reduced mean body weights in thisgroup throughout the generation. In contrast to the F
1
generation, pre-weaning F2
pup weights were reduced inboth the 150- and 500-ppm groups (approximately 10 to13% on PND 21). The weights of the F
2pups continued to
be reduced following weaning in the 150- and 500-ppmgroups selected for neurobehavioral evaluation in thedevelopmental neurotoxicity component (Cruzan et al.,2005, this issue). In addition, there were slight delays(generally not statistically significant) in the acquisitionof developmental landmarks (Cruzan et al., 2005, thisissue) that were suggestive of an overall pattern of slightdevelopmental delay in the 500-ppm group. These pre-weaning developmental endpoints are highly correlatedwith pup body weight (Lochry, 1987) and are consistentwith the reduced body weights seen in this group. Effectsmay have been greater in the F
2offspring than the F
1
because exposure of the F1
parents was started at ayounger age (PND 21 vs. PND 50) and pre-mating toxici-ty was more evident in F
1parents than F
0parents.
This study confirmed previous observations of slightbody weight effects of styrene exposure at 500 ppm orgreater in rats and degeneration of nasal olfactory epithe-lium (Cruzan et al., 1997, 1998). It further demonstrated alack of styrene effects on gonadal function, reproductiveperformance, and offspring survival. This enhances theconclusions of the previous 3-generation reproductionstudy of styrene in drinking water (Beliles et al., 1985). Inaddition, it supports the lack of effects on testes andovaries reported in the subchronic studies of styrene(Cruzan et al., 1997, 1998, 2001; NCI, 1979; Roycroft et al.,1992), and disagrees with testicular pathology anddecreased sperm counts reported by Srivastava et al.(1989).
The No-Observed-Adverse-Effect Level (NOAEL) forparental toxicity in this study was 50 ppm and theNOAEL for reproductive toxicity was ≥ 500 ppm.
Uncited References
Adams, 1986; Ashby and Lefevre, 2000; Jelnes, 1988;Kallman, 1994; Roycroft et al., 1992
ACkNOwLEDgEMENTS
This study was sponsored by the Styrene Informationand Research Center (SIRC), Arlington, VA. Dr. Cruzanprovides science consulting to SIRC; Drs. Faber, Johnson,Roberts, Hellwig, and Carney are employed by or pro-
The SIRC Review November 200624
TAbLE 5
Organ Weights of F2Offspring Not Chosen for
Neurotoxicity Evaluationa
Group (ppm)0 50 150 500
MalesBrain (g) 1.441 1.418 1.376 1.378(g/100 g BW) 3.427 3.507 3.557 3.671
Spleen (g) 0.180 0.180 0.169 0.158(g/100 g BW) 0.418 0.432 0.426 0.406
Testis, Right (g) 0.093 0.096 0.086 0.087(g/100 g BW) 0.220 0.232 0.230 0.226
Testis, Left (g) 0.094 0.095 0.088 0.086(g/100 g BW) 0.221 0.231 0.226 0.221
Thymus (g) 0.193 0.182 0.163 0.169(g/100 g BW) 0.452 0.441 0.411 0.436
Pituitary (g) 0.0038 0.0037 0.0034 0.0025(g/100 g BW) 0.009 0.009 0.009 0.007*
FemalesBrain (g) 1.393 1.365 1.360 1.331
(g/100 g BW) 3.461 3.568 3.660 3.863*Spleen (g) 0.173 0.176 0.165 0.149
(g/100 g BW) 0.419 0.440 0.427 0.412Uterus (g) 0.057 0.050* 0.050 0.047*
(g/100 g BW) 0.140 0.131 0.133 0.134Thymus (g) 0.197 0.180 0.172 0.161*
(g/100 g BW) 0.480 0.459 0.452 0.451Pituitary (g) 0.0041 0.0039 0.0033* 0.0031*
(g/100 g BW) 0.0109 0.010 0.009 0.009
aTerminated PND 21, litter as experimental unit.*Significantly different from control, p<0.05

TwO gENERATION REPRODUCTION STUDy OF STyRENE by INHALATION IN CRL-CD RATS
vide consulting to SIRC member companies.Appreciation is expressed to Judy Buelke-Sam for assis-tance in designing, monitoring, and interpreting thisstudy. Appreciation is expressed to the technical staff atWIL Research Laboratories for the conduct of this study.
REFERENCES
Beliles RP, Butala JH, Stock CR, Makris S. 1985. Chronictoxicity and three-generation reproduction study ofstyrene monomer in the drinking water of rats. FundAppl Toxicol 5: 855-868.
Blazak WF, Ernst TL, Stewart BE. 1985. Potential indica-tors of reproductive toxicity: testicular sperm productionand epididymal sperm number, transit time and motilityin Fischer 344 rats. Fundam Appl Toxicol 5: 1097-1103.
Bolon B, Bucci TJ, Warbritton AR, Chen JJ, Mattison DR,Heindel JJ. 1997. Differential follicle counts as a screen forchemically induced ovarian toxicity in mice: results fromcontinuous breeding bioassays. Fundam Appl Toxicol 39:1-10.
Brown NA, Lamb JC, Brown SM, Neal BH. 2000. A reviewof the developmental and reproductive toxicity ofstyrene. Regul Toxicol Pharmacol 32: 228-247.
Bucci TJ, Bolon B, Warbritton AR, Chen JJ, Heindel JJ.1997. Influence of sampling on the reproducibility ofovarian follicle counts in mouse toxicity studies. ReprodToxicol 11: 659-696.
Cho SI, Damokosh AI, Ryan LM, Chen D, Hu YA, SmithTJ, Christiani DC, Xu X. 2001. Effects of exposure toorganic solvents on menstrual cycle length. J OccupEnviron Med 43: 567-575.
Cruzan G, Cushman JR, Andrews LS, Granville GC,Miller RR, Hardy CJ, Combs DW, Mullins PA. 1997.Subchronic inhalation studies of styrene in CD rats andCD-1 mice. Fundam Appl Toxicol 35: 152-165.
Cruzan G, Cushman JR, Andrews LS, Granville GC,Johnson KA, Hardy C, Combs DW, Mullins PA, BrownWR. 1998. Chronic toxicity/oncogenicity study of styrenein CD rats by inhalation exposure for 104 weeks. ToxicolSci 46: 266-281.
Cruzan G, Cushman JR, Andrews LS, Granville GC,Johnson KA, Bevan C, Hardy CJ, Coombes DW, MullinsPA, Brown WR. 2001. Chronic toxicity/oncogenicitystudy of styrene in CD-1 mice by inhalation exposure for104 weeks. J Appl Toxicol 21: 185-198.
Cruzan G, Faber WD, Johnson KA, Roberts LS, Hellwig J,Maurissen J, Beck MJ, Radovsky A, Stump DG. 2005.Developmental neurotoxicity study of styrene by inhala-tion in Crl-CD rats. Birth Defects Res B 74: 221-232 (thisissue).
Dunnett CW. 1964. New tables for multiple comparisonswith a control. Biometrics 20: 482-491.
Hollander M, Wolfe DA. 1999. Nonparametric statisticalmethods, 2nd ed. New York: John Wiley and Sons, Inc.p 468.
IARC (International Agency for Research on Cancer).2002. IARC monographs on the evaluation of carcino-genic risks to humans. Vol 82. Some traditional herbalmedicines, some mycotoxins, naphthalene, and styrene.Lyon, France: IARC Press. p 437-550.
Jelnes JE. 1988. Semen quality in workers producing rein-forced plastic. Reprod Toxicol 2: 209-212.
Kolstad HA, Bonde JP, Spano M, Giwercman A,Zschiesche W, Kaae D, Larsen SB, Roeleveld N. 1999.Change in semen quality and sperm chromatin structurefollowing occupational styrene exposure. Int Arch OccupEnviron Health 72: 135-141.
Kolstad HA, Bisanti L, Roeleveld N, Baldi R, Bonde JP,Joffe M. 2000. Time to pregnancy among male workers ofthe reinforced plastics industry in Denmark, Italy and theNetherlands. Scand J Work Environ Health 26: 353-358.
Kruskal WH, Wallis WA. 1952. Use of ranks in one-criteri-on variance analysis. J Am Stat Assoc 47: 583-621.
Lemasters GK, Hagen A, Samuels SJ. 1985. Reproductiveoutcomes in women exposed to solvents in 36 reinforcedplastics companies. I. Menstrual dysfunction. J OccupMed 27: 490-494.
Lemasters GK. 1989. Reproductive outcomes of pregnantworkers employed at 36 reinforced plastics companies II.Lowered birth weight. J Occup Med 31: 115-120.
The SIRC Review November 2006 25

TwO gENERATION REPRODUCTION STUDy OF STyRENE by INHALATION IN CRL-CD RATS
Levene H. 1960. Robust tests for equality of variances. In:Contributions to probability and statistics. Palo Alto, CA:Stanford University Press. p 278-292.
Linder RE, Strader LF, Slott VL, Suarez JD. 1992.Endpoints of spermatotoxicity in the rat after short dura-tion exposures to fourteen reproductive toxicants.Reprod Toxicol 6: 491-505.
Lochry EA. 1987. Concurrent use of behavioral/function-al testing in existing reproductive and developmentaltoxicity screens: practical considerations. J Am CollToxicol 6: 433-439.
National Cancer Institute (NCI). 1979. Bioassay of styrenefor possible carcinogenicity. NCI Technical Report no.185.
Nemec MD, Pitt JA, Topping DC, Gingell R, Pavkov KL,Rauckman EJ, Harris SB. 2004. Inhalation two-generationreproductive toxicity study of methyl isobutyl ketone inrats. Int J Toxicol 23: 127-143.
Roycroft JH, Mast TJ, Ragan HA, Grumbein SL, MillerRA, Chou BJ. 1992. Toxicological effects of inhalationexposure to styrene in rats and mice. Toxicologist 12: 397.
Royston JP. 1982. An extension of Shapiro and Wilk’s wtest for normality to large samples. Appl Stat 31: 115-124.
Sarangapani R, Teeguarden JG, Cruzan G, Clewell HJ,Andersen ME. 2002. Physiologically based pharmacoki-netic modeling of styrene and styrene oxide respiratorytract dosimetry in rodents and humans. Inhal Toxicol 14:789-834.
Snedecor GW, Cochran WG. 1980. One way classifica-tions; analysis of variance. In: Statistical methods, 7th ed.Ames, IA: The Iowa State University Press. p 215-237.
Srivastava S, Seth PK, Srivastava SP. 1989. Effect ofstyrene administration on rat testis. Arch Toxicol 63: 43-46.
Steel RGD, Torrie JH. 1980. Principles and procedures ofstatistics: a biometrical approach, 2nd ed. New York, NY:McGraw-Hill Book Company. p 504-506.
Stuckhardt JL, Poppe SM. 1984. Fresh visceral examina-tion of rat and rabbit fetuses used in teratogenicity test-ing. Teratogen Carcinogen Mutagen 4: 181-188.
Takao T, Nanamiya W, Nazarloo HP, Asaba K, HashimotoK. 2000. Possible reproductive toxicity of styrene inperipubertal male mice. Endocr J 47: 343-347.
Young JT. 1981. Histologic examination of the rat nasalcavity. Fundam Appl Toxicol 1: 309-312.
The SIRC Review November 200626
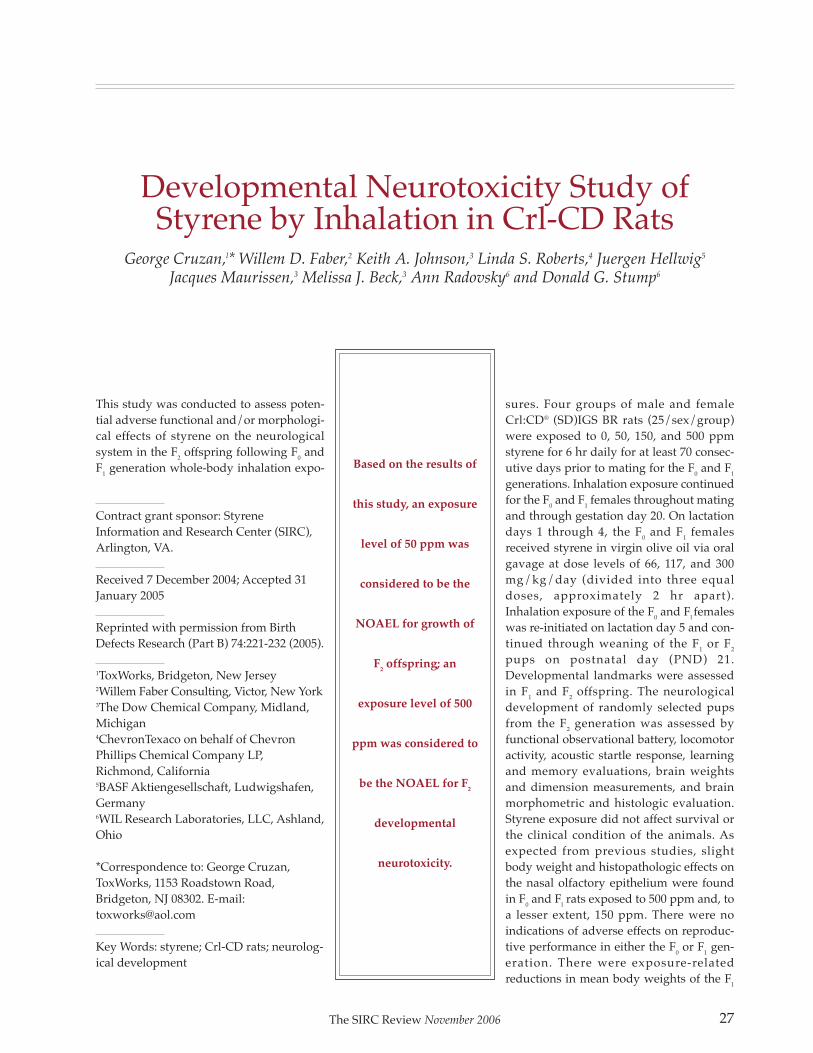
The SIRC Review November 2006 27
Developmental Neurotoxicity Study ofStyrene by Inhalation in Crl-CD Rats
George Cruzan,l* Willem D. Faber,2 Keith A. Johnson,3 Linda S. Roberts,4 Juergen Hellwig5
Jacques Maurissen,3 Melissa J. Beck,3 Ann Radovsky6 and Donald G. Stump6
Based on the results of
this study, an exposure
level of 50 ppm was
considered to be the
NOAEL for growth of
F2offspring; an
exposure level of 500
ppm was considered to
be the NOAEL for F2
developmental
neurotoxicity.
This study was conducted to assess poten-tial adverse functional and/or morphologi-cal effects of styrene on the neurologicalsystem in the F
2offspring following F
0and
F1
generation whole-body inhalation expo-
sures. Four groups of male and femaleCrl:CD® (SD)IGS BR rats (25/sex/group)were exposed to 0, 50, 150, and 500 ppmstyrene for 6 hr daily for at least 70 consec-utive days prior to mating for the F
0and F
1
generations. Inhalation exposure continuedfor the F
0and F
1females throughout mating
and through gestation day 20. On lactationdays 1 through 4, the F
0and F
1females
received styrene in virgin olive oil via oralgavage at dose levels of 66, 117, and 300mg/kg/day (divided into three equaldoses, approximately 2 hr apart).Inhalation exposure of the F
0and F
l females
was re-initiated on lactation day 5 and con-tinued through weaning of the F
1or F
2
pups on postnatal day (PND) 21.Developmental landmarks were assessedin F
1and F
2offspring. The neurological
development of randomly selected pupsfrom the F
2generation was assessed by
functional observational battery, locomotoractivity, acoustic startle response, learningand memory evaluations, brain weightsand dimension measurements, and brainmorphometric and histologic evaluation.Styrene exposure did not affect survival orthe clinical condition of the animals. Asexpected from previous studies, slightbody weight and histopathologic effects onthe nasal olfactory epithelium were foundin F
0and F
lrats exposed to 500 ppm and, to
a lesser extent, 150 ppm. There were noindications of adverse effects on reproduc-tive performance in either the F
0or F
1gen-
eration. There were exposure-relatedreductions in mean body weights of the F
1
Contract grant sponsor: StyreneInformation and Research Center (SIRC),Arlington, VA.
Received 7 December 2004; Accepted 31January 2005
Reprinted with permission from BirthDefects Research (Part B) 74:221-232 (2005).
1ToxWorks, Bridgeton, New Jersey2Willem Faber Consulting, Victor, New York3The Dow Chemical Company, Midland,Michigan4ChevronTexaco on behalf of ChevronPhillips Chemical Company LP,Richmond, California5BASF Aktiengesellschaft, Ludwigshafen,Germany6WIL Research Laboratories, LLC, Ashland,Ohio
*Correspondence to: George Cruzan,ToxWorks, 1153 Roadstown Road,Bridgeton, NJ 08302. E-mail:[email protected]
Key Words: styrene; Crl-CD rats; neurolog-ical development

DEvELOpmENTAL NEUROTOxICITy STUDy OF STyRENE By INhALATION IN CRL-CD RATS
and F2
offspring from the mid and high-exposure groupsand an overall pattern of slightly delayed developmentevident in the F
2offspring only from the 500-ppm group.
This developmental delay included reduced body weight(which continued through day 70) and slightly delayedacquisition of some physical landmarks of development.Styrene exposure of the F
0and F
lanimals had no effect on
survival, the clinical condition or necropsy findings of theF
2animals. Functional observational battery evaluations
conducted for all F1
dams during the gestation and lacta-tion periods and for the F
2offspring were unaffected by
styrene exposure. Swimming ability as determined bystraight channel escape times measured on PND 24 wereincreased, and reduced grip strength values were evidentfor both sexes on PND 45 and 60 in the 500-ppm groupcompared to controls. There were no other parental expo-sure-related findings in the F
2pre-weaning and post-wean-
ing functional observational battery assessments, thePND 20 and PND 60 auditory startle habituation parame-ters, in endpoints of learning and memory performance(escape times and errors) in the Biel water maze task ateither testing age, or in activity levels measured on PND61 in the 500-ppm group. Taken together, the exposure-related developmental and neuromotor changes identi-fied in F
2pups from dams exposed to 500 ppm occurred
in endpoints known to be both age- and weight-sensitiveparameters, and were observed in the absence of anyother remarkable indicators of neurobehavioral toxicity.Based on the results of this study, an exposure level of 50ppm was considered to be the NOAEL for growth of F
2
offspring; an exposure level of 500 ppm was consideredto be the NOAEL for F
2developmental neurotoxicity.
Birth Defects Res B 74:221-232, 2005. ©2005 Wiley-Liss, Inc.
INTRODUCTION
The reproductive and developmental effects of styrene(CAS no. 100-42-5) have been extensively reviewed byBrown et al. (2000). Although few details are provided,Vergieva et al. (1979) reported no dose-related effects onbody weights or offspring behavior when rat dams wereexposed via inhalation to 163 ppm styrene 4 hr/day 5days/week on gestational days 2–16 or to 47 ppm on ges-tational days 2–21. Zaidi et al. (1985) reported that gavagetreatment of rat dams with 200 mg/kg/day styrenethroughout gestation had no effect on the number ofpups born per litter, pup body weight, protein content ofthe brain, or striatal dopamine receptors of pups. In con-trast, Kishi and coworkers have conducted two studieson the effects of prenatal styrene exposure. In the firststudy (Kishi et al., 1992, 1995), pregnant Wistar rats were
exposed via inhalation to 0 (14 litters), 60 (3 litters), or 293ppm (7 litters) styrene 6 hr/day on gestation days 7 to 21.There was no effect on gestation length or average littersize, but pup weights in both styrene-exposed groupswere reduced compared to the controls. Neurobehavioralevaluation was conducted on 5 control litters, 2 littersexposed at 60 ppm and 5 litters exposed at 293 ppm. Theyreported differences in a number of developmental land-marks, as well as differen ces in open field activity, rota-rod activity, and operant conditioning response for somebut not all tested intervals. In the second study (Katakuraet al., 1999, 2001), pregnant female rats were exposed to 0(ad libitum feed, 14 litters), 0 (pair-fed to 300 ppm group,12 litters), 50 (9 litters), or 300 (14 litters) ppm styrene by astatic inhalation system. Compared to the pair-fed con-trols, exposure to 300 ppm styrene resulted in increasedneonatal death, decreased pup weight on PND 21,increased time to lower, but not upper, incisor eruption,an increased time to development of air righting reflex,and decreased homovanillic acid in the cerebrum.
Effects on the nervous system have been reported forworkers in the reinforced plastics industry. Neither thepresence of effects nor the level at which the effects wereobserved have been reported consistently. Effects report-ed in some studies include central nervous system (CNS)depression, slower nerve conduction velocity, anddecreased color discrimination. Some studies reporteffects at concentrations as low as 10 ppm, while othersclaim no effects at concentrations as high as 100 ppm(reviewed in IARC, 2002). In laboratory animals, CNSdepression was reported following single exposures to1,300 ppm for 4 hr. Changes in dopamine and relatedmetabolites have been reported in the brain of ratsexposed to 750 ppm styrene for 3 days. Increases in glialfibrillary acidic protein in the sensorimotor cortex andhippocampus were reported in rats exposed via inhala -tion to 320 ppm styrene continuously for 3 months(reviewed in IARC, 2002).
Because of the conflicting and limited animal data onthe effects of styrene on development of the neurologicalsystem, a developmental neurotoxicity study was con-ducted via whole-body inhalation exposure using currentregulatory guidelines. This was accomplished by evaluat-ing dams from the F
lgeneration and F
2offspring from a
two-generation reproduction study (Cruzan et al., 2005,this issue). In most reproduction studies conducted bythe inhalation route, exposure is stopped on day 20 ofgestation and not reinstated until lactation day 5 to mini-mize stress on the offspring from the more than 6-hr sep-aration that would occur during the inhalation exposureof the dam. Because high concentrations of styrene affect
The SIRC Review November 200628

DEvELOpmENTAL NEUROTOxICITy STUDy OF STyRENE By INhALATION IN CRL-CD RATS
the CNS and significant development of the CNS occursduring the first few days after birth in rats, dams weretreated orally during lactation days 1–4 at doses estimatedby PBPK modeling to mimic a 6-hr inhalation exposure.
mATERIALS AND mEThODS
Study Design
Four groups of F0
and Fl
male and female Crl:CD rats(25/sex/group) were exposed to vapor atmospheres ofstyrene at 0, 50, 150, or 500 ppm for 6 hr daily (7 days/week) for at least 70 consecutive days prior to mating.Females were paired with males on a 1:1 basis for 14 daysor until evidence of mating was observed. The F
0and F
l
females continued inhalation exposure throughout mat -ing and gestation through gestation day 20. On lactationdays 1 through 4, the F
0and F
lfemales received styrene in
virgin olive oil via oral gavage at dose levels of 66, 117,and 300 mg/kg/day (divided into three equal doses,administered approximately 2 hr apart). The doses werecalculated to mimic the blood level of styrene at 2, 4, and6 hr in a 6-hr inhalation exposure at the target concentra -tion based on the PBPK model of Sarangapani et al.(2002). Inhalation exposure of the F
0and F
1females was
re-initiated on lactation day 5 and continued through theday prior to euthanasia. Offspring were weaned on lacta-tion day 21; exposure of F
lpups began on PND 22. F
2
pups were weaned on PND 21 and not directly exposedto styrene. Neurobehavioral and neuropatholo gical eval-uations were conducted in F
2offspring through PND 72.
The details of the two-generation study have been pub-lished in the accompanying reproductive toxicity report(Cruzan et al., 2005, this issue).
Test Material
Styrene monomer (inhibited), CAS No. 100-42-5, was pro-vided by Chevron Phillips Chemical Company LLP, St.James, LA. The purity and stability of the styrene wereverified by gas chromotography with flame ionizationdetection. When present in the chromatograms, the per-centage of benzene, ethylbenzene, styrene oxide, andstyrene dimers was also determined. Results obtainedindicated the styrene was at least 99.9% pure.
Exposures
Gas chromatographic analyses of chamber atmospheresdemonstrated average exposures of 0, 50, 151, and 499ppm for F
0styrene concentrations and 0, 50, 153, and 501
ppm for F1styrene concentrations.
Animals and Animal Husbandry
Male and female Crl:CD® (SD)IGS BR rats from differentbarrier colonies were received from Charles RiverLaboratories, Inc., Raleigh, North Carolina, on July 24,2001. The methods for acclimation, assignment to treat-ment groups, animal husbandry, and animal welfare aredescribed in the accompanying two-generation reproduc-tive toxicity study (Cruzan et al., 2005, this issue).
Reproduction Study
All animals were observed twice daily (at least 7 hr apart)for moribundity and mortality, appearance, behavior, andpharmacotoxic signs (prior to exposure/gavage dosingfor the F
0and F
lanimals). Individual F
0and F
lmale body
weights were recorded throughout the study. Furtherdetails are provided in the two-generation study (Cruzanet al., 2005, this issue). After a minimum of 70 days ofexposure, each female was housed overnight in the homecage of a randomly chosen male for up to 14 days. Aftermating, the animals were separated and the female washoused in an individual plastic cage with nesting materi-al. All females were allowed to deliver naturally and reartheir young to weaning (PND 21). To reduce variabilityamong litter size, 10 F
land F
2pups of equal sex distribu-
tion, if possible, were randomly selected from each litteron PND 4. Pups were individually sexed on PND 0, 4, 7,14, and 21. F
lpups were individually weighed on PND 1,
4, 7, 14, and 21; F2
pups were individually weighed onPND 1, 4, 7, 11, 13, 17, and 21. The following investiga-tions were used to assess the maturation of the selected F
l
and F2
pups: pinna detachment, surface rightingresponse, hair growth, incisor eruption, eye opening,balanopre putial separation, and vaginal patency (Adams,1986). After litter standardization, one F
2pup/sex/litter
(total of 20 pups/sex/group) was assigned to one of twosubsets (Subset A and B) for neurobehavioral and neu-ropathological assessments, and an additional one F
2
pup/litter (total of 10 pups/sex/group) was assigned toSubset C for neuropathological assessment.
Neurobehavioral Testing
Functional Observational Battery (FOB) (Moser, 1991;Irwin, 1968; Gad, 1982; Moser et al., 1988; Haggerty, 1989;O’Donoghue, 1989) testing was performed on all F
ldams
on gestation days 6 and 12 and on lactation days 10 and21; FOB testing was performed on 20 F
2pups/sex/group
(Subset A) on PND 4, 11, 22, 45, and 60. Testing (Table 1)was performed by the same trained technicians, when-ever possible, who did not know the animal’s groupassignment. Chatillon Model DPP-1.0 kg or DPP-2.5 kg(as appropriate for the age of the animal) pull-push strain
The SIRC Review November 2006 29

DEvELOpmENTAL NEUROTOxICITy STUDy OF STyRENE By INhALATION IN CRL-CD RATS
gauges (AMETEK Test and Calibration InstrumentsDivision, Largo, FL) were used for testing fore- andhindlimb grip strength during post-weaning FOB ses -sions. The test was conducted such that animals wereallowed to grasp the pull strain gauge with theirforepaws. The observer then pulled the animal until thegrip was lost and the hindpaws grasped the push straingauge and then let go with the continued movement. Onepull and push was considered a single trial, and threeconsecutive trials were conducted on each testing day.The group mean of the averaged trials was reported ingrams.
The locomotor activity of the same 20 pups/sex/group assigned to FOB asessments (Subset A) was moni-tored on PND 13, 17, 21, and 61. Locomotor activity wasmeasured using the SDI Photobeam Activity System (SanDiego Instruments, San Diego, California) in a roomequipped with a white noise generation system set tooperate at approximately 70 dB(A). Each chamber con -sisted of a series of infrared photobeams surrounding aclear plastic, rectangular cage. Four-sided black enclo -
sures surrounded the clear plastic boxes and decreasedthe potential for distraction by extraneous environmentalstimuli. Each chamber was calibrated before each testingsession. The testing of treatment groups was doneaccording to replicate sequence; no more than 24 animalswere tested during a single session. Each test session was60 min in duration and consisted of 12 5-min intervals.Each session recorded ambulatory (sequential interrup -tion of two or more photobeams) and total (interruptionof a photobeam) activity.
An acoustic startle response test was performed on thesame 20 rats/sex/group (Subset A) on PND 20 and 60using the SR-Lab Startle Response System (San DiegoInstruments, San Diego, CS) in a room equipped with awhite-noise generation system set to operate at approxi -mately 70 dB(A). Each isolation chamber was composedof a wood core covered with a laboratory-grade plasticlaminate and measured 15 x 16 x 23 inches. Each cabinetwas equipped with an internal light, a fan, two viewinglenses, and a complete white-noise generation system.The animal was placed in a cylindrical enclosure ofappropriate size, which was then placed into the isolationcabinet. Each enclosure was equipped with a motion sen-sor, which was calibrated prior to each day’s testing. Thetesting of treatment groups was done according to repli-cate sequence; no more than 8 animals were tested duringa single session. Each test session consisted of a 5-minacclimation period with an approximate 65 dB(A) broad-band background white noise. The startle stimulus foreach trial was an approximate 115 dB(A) mixed-frequen-cy noise burst stimulus, approximately 20 msec in dura-tion. Each test session consisted of 50 trials, with an 8-secintertrial interval. Startle response data were analyzed infive blocks of 10 trials each. Concurrent with the onset ofthe startle burst, force data were collected every millisec-ond for 100 msec. The greatest force data recorded duringthat 100 msec was considered the maximum responseamplitude (V
MAX) and was reported in mV. The time at
which the VMAX
was observed was considered the latency(from the onset of the startle burst) to the maximumresponse amplitude (T
MAX) and was reported in msec. The
average of all 100 response recordings was considered theaverage response amplitude (V
AVE) and was reported in mV.
Swimming ability and learning and memory wereassessed for 20 rats/sex/group using a water-filled eight-unit T-maze similar to that described by Biel (1940).Those animals tested on PND 62 were the same as usedabove (Subset A), while those animals tested on PND 24were used for this test only (Subset B). Animals wereplaced in the maze and were required to traverse themaze and escape by locating a platform that was hidden
The SIRC Review November 200630
TABLE 1
Parameters of Functional Observational Battery
Ease of removal from cage Ease of handlinganimal in hand
Lacrimation / Salivationchromodacryorrhea
Piloerectiona Fur appearancea
Palpebral closurea,b Respiratory rate/character
Red/crusty deposits Mucous membranes/eyea,b/skin color
Eye prominencea, b Muscle Tone
Mobilitya General body posture
Convulsions/tremors Gaita
Groominga Arousal
Bizarre/stereotypic behavior Urination /defecation
Pupillary responsea, b Backing
Forelimb/hindlimb grip strengthc
a Not assessed on PND 4 due to stage of development.b Not assessed on PND 11 due to stage of development.cAssessed on PND 22, 45, and 60 only.

DEvELOpmENTAL NEUROTOxICITy STUDy OF STyRENE By INhALATION IN CRL-CD RATS
2 cm (adjusted before each trial) beneath the surface ofthe water. The amount of time required to traverse themaze and the number of errors for all learning and mem-ory trials were recorded. Each testing interval consistedof three phases that were conducted over 7 consecutivedays. Phase one was an evaluation of swimming abilityand motivation to escape from the maze and was per-formed in four consecutive trials on the first day of theBiel maze procedure by measuring the time required forthe rat to swim the length of a straight channel. Phasetwo of the Biel maze procedure evaluated sequentiallearning on days 2–6. Animals were allowed two trialsper day for two days to solve the maze in path A.Animals were then allowed two trials per day for threeconsecutive days to solve the maze in path B, which wasthe reverse of path A. For Phases two and three, the mini-mum intertrial interval was 1 hr. Phase three, day 7,probed the animal for its memory to solve the maze whenchallenged in path A. Each animal was allowed two trialsto solve the maze in path A. Biel maze data were evaluat-ed as the mean time to escape over all trials for each ofthe three phases (i.e., swimming ability and motivation,sequential learning and memory) of the Biel maze proce-dure. Also, the numbers of errors committed were evalu-ated for phases two and three.
Neuropathology
On PND 21, 10 F2
pups/sex/group (Subset C) were per-fused in situ and the brains processed for microscopicexamination. On PND 72, 10 F
2pups/sex/ group (select-
ed from Subset A) were perfused in situ and central andperipheral nervous system tissues were processed formicroscopic examination. The brain and central nervoussystem tissues were embedded into paraffin; peripheralnervous system tissues were embedded into plastic. Atminimum, four coronal sections of the cerebrum and amid-sagittal section of the cerebellum/pons/medullaand two transverse sections of the remaining half of thecerebellum/pons were prepared. The prepared tissueswere sectioned at 4–8 µm, mounted on glass microscopeslides and stained with hematoxylin and eosin. A simple,non-blinded morpho metric analysis of the brains fromthese offspring was performed. Two coronal sections of thecerebrum and one midsagittal section of the cerebellum/pons/medulla were used for morphometry. Sectionswere homolo gous between animals. Specific levels ana-lyzed were defined as follows: Level 1 was a coronal sec-tion taken approximately halfway between the base ofthe olfactory bulbs and the optic chiasm. This level wasjust rostral to the point where the corpus callosumbridges across the hemispheres and was characterized by
a good represen tation of the caudoputamen and the pres-ence of the opening of the rostral medial aspect of the lat-eral ventricle. Level 3 was a coronal section taken just ros-tral to the attachment of the pituitary gland (infundibularstalk) characterized by a slight separation between thehemispheres of the rostral hippocampus such that CA1pyramidal neurons from each hemisphere formed only aslight depression before meeting medially. Rostrally therewas no depression, and posteriorly there was a more pro-nounced depression of the medial lines of CA1 neuronsbetween hemispheres. Level 5 was a midsagittal sectionof the cerebellum and brainstem. Levels 1, 3, and 5 corre-spond to figures 11, 32, and 79 of the adult rat brain asdepicted by Paxinos and Watson (1998). Measure mentswere as follows:
� Level 1: Total bilateral height of the hemispheremeasured just at the beginning of the lateral ventricle,and bilateral vertical thickness of the hemispheremeasured at the apex of the corpus callosum and parallelto the height of the hemisphere.� Level 3: Bilateral radial thickness of the frontopar ietalcortex; bilateral vertical height of the hemi spherebetween the layers of hippocampal pyramidal neuronsmeasured along a line that passed through thetermination of the dorsal limb of the medial dentatehilus; bilateral height of the medial dentate hilusmeasured between the termi nation of the ventral limbperpendicular to the layer of pyramidal neurons, andbilateral length of the ventral limb of the dentate hilus.� Level 5: Thickness of the caudal brainstem, towardlobule no. 9 (caudal to the cerebellar peduncle),measured at the stalk of the cerebellum andperpendicular to the ventral border of the pons, anddistance across the base of cerebellar lobule no. 9,measured perpendicular to the white matter tractthrough the middle of the lobule.
These linear measurements were made using a com-puter imaging system (Pax-It™, Midwest ImagingSystems, Inc., Fraklin Park, IL). The average from the twohemispheres of the coronal sections, and single measure -ments from the mid-sagittal section of the cerebellum andbrainstem, were used in calculations. All brain sectionswere also examined by light microscopy for any qualita-tive changes.
Statistical Methods
Analyses were conducted using two-tailed tests (exceptas noted otherwise) for a minimum significance level of5%, comparing each test article-treated group to the con-
The SIRC Review November 2006 31

DEvELOpmENTAL NEUROTOxICITy STUDy OF STyRENE By INhALATION IN CRL-CD RATS
trol group. Statistical procedures used in the reproductivephase are covered in detail in the accom panying reportand are not described here (Cruzan et al., 2005, thisissue). F
2mean day of acquisition of pre weaning/post-
weaning developmental landmarks data were analyzedfor heterogeneity of variance (Levene, 1960) and normali-ty (Royston, 1982). If the data were homogeneous andnormal, a parametric one-way analy sis of variance(ANOVA) was used to determine intergroup differences(Snedecor and Cochran, 1980). If the results of theANOVA were significant (p<0.05), Dunnett‘s (1964) testwas applied to compare the control group versus alltreatment groups. If the data were not homogeneous andnormal, the data were analyzed by the Kruskal-Wallis(1952) nonparametric ANOVA test to determine the inter-group differences. If the ANOVA revealed statistical sig-nificance (p<0.05), the Mann-Whitney U-test (Kruskaland Wallis, 1952) was used to compare the test article-treated groups to the control group.
Pup weights through weaning were analyzed sepa -rately by sex by analysis of covariance (ANCOVA), withpups weights nested within the litter, with the litter sizeas the covariate. The number of pups born was used asthe covariate. The following assumptions were maderegarding the ANCOVA: homogeneity of regressionslopes, linear relationship between the pup weights andnumber of pups born, and additive group and regressioneffects. Histopathologic findings in the test article-treatedgroups were compared to the control group using a two-tailed Fisher’s Exact test (Steel and Torrie, 1980). The fol-lowing FOB data: group mean counts of backings,groomings, urinations and defecations and group meansof forelimb and hindlimb grip strength, along with ambu-latory counts measured in the locomo tor activity assess-ment, average response in the acoustic startle assessmentand Biel maze data (mean times to escape in the straightchannel, learning and memory phases and the meanerrors in the learning and memory phases) were subject-ed to a parametric one-way analysis of variance(ANOVA) to determine intergroup differ ences. If statisti-cally significant differences were indi cated by theANOVA, Dunnett’s test was used to compare the controland treated groups. FOB parameters, which yieldedscalar and descriptive data, were analyzed by Fisher’sExact Test (Steel and Torrie, 1980). Intrases sion totalcounts measured in the locomotor activity assessmentand intrasession peak response and latency to peakresponse measured in the acoustic startle assessmentwere analyzed by the univariate repeated measuresANOVA (ReMANOVA, SAS, 1999-2001) to determine thepresence of an interaction effect of treatment group by
time using a Geisser-Greenhouse adjusted F-statistic. If asignificant interaction effect of treatment group by timewas indicated by the ReMA NOVA, Dunnett’s test wasused to compare the control and treated groups at eachwithin-session interval. In addition, the ReMANOVA wasused to determine the presence of a main effect of treat-ment. If a significant main effect of treatment was indicat-ed by the ReMA NOVA, Dunnett’s test was used to com-pare the control and treated groups. Repeated measuresstatistical ana lyses were performed by BioSTATConsultants, Inc., Portage, MI. All analyses performed byBioSTAT Con sultants, Inc. were conducted with the SASSystem software (version 8.2).
RESULTS
Parental and Reproduction Effects
Briefly (see Cruzan et al., 2005, this issue), body weightgain was slightly reduced in F
0males and females at 500
ppm, and F1
males and females at 150 and 500 ppm dur-ing the premating exposure periods. There was no effecton bodyweight or bodyweight gain at 50 ppm in eitherthe F
0or F
1exposure periods. There was no effect of
styrene at any exposure level on body weight gain or feedconsumption during gestation in either the F
0or F
1dams.
At 500 ppm, there was increased water consump tion dur-ing gestation in both F
0and F
1dams. There was no effect
at 150 or 50 ppm. There was no effect of styrene exposureon body weight gain or food consumption during lacta-tion in either the F
0or F
1dams. Exposure of F
0and F
l
females had no effect on mean estrous cycle length or themean numbers of days between pairing and coitus.Styrene exposure had no effects on F
0or F
1spermatogenic
endpoints (mean testicular and epididy mal sperm num-bers, sperm production rate, sperm motility, and spermmorphology). The mean lengths of gestation were unaf-fected by styrene exposure. Exposure to styrene did notaffect F
0or F
1male or female mating index, male or
female fertility index, mean number of pups born, thenumber of former implantation sites, or the number ofunaccounted sites. At the scheduled necropsy of the F
1
females, the mean numbers of primordial follicles andcorpora lutea were unaffected in females exposed to 500ppm of styrene. The mean number of F
1and F
2pups born,
live litter size, percentage of males per litter at birth andpostnatal survival were unaffected by styrene at all expo-sure levels evaluated. Mean F
1male and female pup body
weights were unaffected by parental exposure to styrene.The No-Observed-Adverse-Effect Level (NOAEL) forparental toxicity was 50 ppm and for effects on reproduc-tion was 500 ppm.
The SIRC Review November 200632
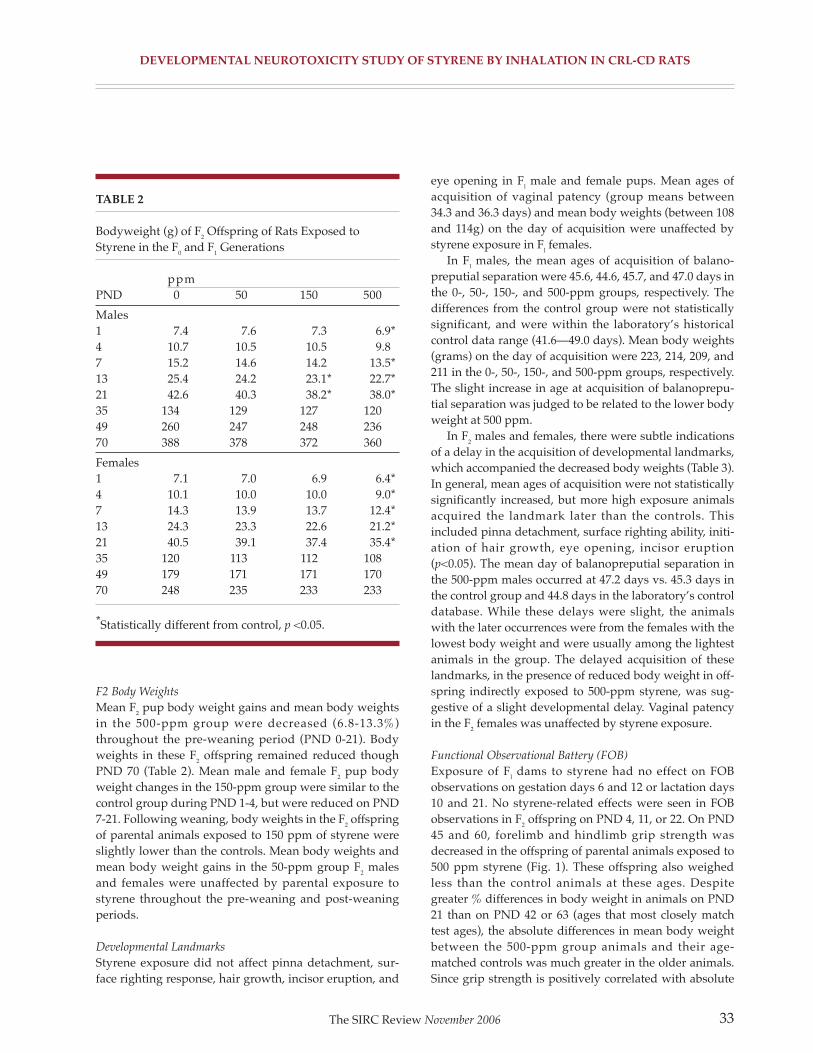
DEvELOpmENTAL NEUROTOxICITy STUDy OF STyRENE By INhALATION IN CRL-CD RATS
F2 Body Weights
Mean F2
pup body weight gains and mean body weightsin the 500-ppm group were decreased (6.8-13.3%)throughout the pre-weaning period (PND 0-21). Bodyweights in these F
2offspring remained reduced though
PND 70 (Table 2). Mean male and female F2
pup bodyweight changes in the 150-ppm group were similar to thecontrol group during PND 1-4, but were reduced on PND7-21. Following weaning, body weights in the F
2offspring
of parental animals exposed to 150 ppm of styrene wereslightly lower than the controls. Mean body weights andmean body weight gains in the 50-ppm group F
2males
and females were unaffected by parental exposure tostyrene throughout the pre-weaning and post-weaningperiods.
Developmental Landmarks
Styrene exposure did not affect pinna detachment, sur-face righting response, hair growth, incisor eruption, and
eye opening in Fl
male and female pups. Mean ages ofacquisition of vaginal patency (group means between34.3 and 36.3 days) and mean body weights (between 108and 114g) on the day of acquisition were unaffected bystyrene exposure in F
lfemales.
In Fl
males, the mean ages of acquisition of balano -preputial separation were 45.6, 44.6, 45.7, and 47.0 days inthe 0-, 50-, 150-, and 500-ppm groups, respectively. Thedifferences from the control group were not statisticallysignificant, and were within the laboratory’s historicalcontrol data range (41.6—49.0 days). Mean body weights(grams) on the day of acquisition were 223, 214, 209, and211 in the 0-, 50-, 150-, and 500-ppm groups, respectively.The slight increase in age at acquisition of balanoprepu -tial separation was judged to be related to the lower bodyweight at 500 ppm.
In F2
males and females, there were subtle indicationsof a delay in the acquisition of developmental landmarks,which accompanied the decreased body weights (Table 3).In general, mean ages of acquisition were not statisticallysignificantly increased, but more high exposure animalsacquired the landmark later than the controls. Thisincluded pinna detachment, surface right ing ability, initi-ation of hair growth, eye opening, incisor eruption(p<0.05). The mean day of balanopreputial separation inthe 500-ppm males occurred at 47.2 days vs. 45.3 days inthe control group and 44.8 days in the laboratory’s controldatabase. While these delays were slight, the animalswith the later occurrences were from the females with thelowest body weight and were usually among the lightestanimals in the group. The delayed acquisition of theselandmarks, in the presence of reduced body weight in off-spring indirectly exposed to 500-ppm styrene, was sug-gestive of a slight developmental delay. Vaginal patencyin the F
2females was unaffected by styrene exposure.
Functional Observational Battery (FOB)
Exposure of Fl
dams to styrene had no effect on FOBobservations on gestation days 6 and 12 or lactation days10 and 21. No styrene-related effects were seen in FOBobservations in F
2offspring on PND 4, 11, or 22. On PND
45 and 60, forelimb and hindlimb grip strength wasdecreased in the offspring of parental animals exposed to500 ppm styrene (Fig. 1). These offspring also weighedless than the control animals at these ages. Despitegreater % differences in body weight in animals on PND21 than on PND 42 or 63 (ages that most closely matchtest ages), the absolute differences in mean body weightbetween the 500-ppm group animals and their age-matched controls was much greater in the older animals.Since grip strength is positively correlated with absolute
The SIRC Review November 2006 33
TABLE 2
Bodyweight (g) of F2Offspring of Rats Exposed to
Styrene in the F0and F
1Generations
ppmPND 0 50 150 500
Males1 7.4 7.6 7.3 6.9*4 10.7 10.5 10.5 9.87 15.2 14.6 14.2 13.5*13 25.4 24.2 23.1* 22.7*21 42.6 40.3 38.2* 38.0*35 134 129 127 12049 260 247 248 23670 388 378 372 360
Females1 7.1 7.0 6.9 6.4*4 10.1 10.0 10.0 9.0*7 14.3 13.9 13.7 12.4*13 24.3 23.3 22.6 21.2*21 40.5 39.1 37.4 35.4*35 120 113 112 10849 179 171 171 17070 248 235 233 233
*Statistically different from control, p <0.05.

DEvELOpmENTAL NEUROTOxICITy STUDy OF STyRENE By INhALATION IN CRL-CD RATS
body weight (Maurissen et al., 2003) and given the slightdelays in the acquisition of several developmental land-marks in this group, the decreased forelimb and hindlimbgrip strength was a further indication of a slight develop-mental delay. No other FOB parameters were affected onPND 45 or 60.
Locomotor Activity
Although there were no statistically significant differ -ences from the control group within the activity sessionsconducted on PND 13, 17, and 21 (Fig. 2A,B), there was aslight shift in the ontogeny of locomotor activity in F
2
males and females in the 500-ppm group that, in the pres-ence of reduced mean body weights in this group, wassuggestive of an exposure-related developmental delay.Campbell et al. (1969) characterized the ontogeny of loco-motor activity in the rat and showed that activity typical-
ly increases between PND 13 and 17 and then decreasesbetween PND 17 and 21. Cumulative total and ambulato-ry locomotor activity in the 500-ppm group males andfemales were decreased slightly on PND 13. Cumulativetotal and ambulatory motor activity were increased in themale group on PND 17, but were decreased in the femalegroup. By PND 21, mean motor activity in both sexes wasincreased slightly compared to the controls. On PND 61,motor activity in both sexes in the 500-ppm group wassimilar to the control group (Fig. 2C,D). Locomotor activ-ity was similar to the control group for males and femalesin the 50- and 150-ppm groups at all ages tested. Nochanges in the distribution of within-session activitycounts were apparent when the exposure groups werecompared with the control group.
The SIRC Review November 200634
TABLE 3
Days of Acquisition of Developmental Landmarks of F2Offspring of Rats Exposed to Styrene in the F
0and F
1
Generations: Males and Females Combineda
Landmark
Pinna detachment Surface righting Incisor eruption Hair growth
Treatment % on Mean age % on Mean age % on Mean age % on Mean age(ppm) pnd4 (s.d.) pnd5 (s.d.) pnd10 (s.d.) pnd13 (s.d.)
0 98 4.0 (0.07) 90 5.1 (0.10) 97 9.3 (0.30) 92 11.8 (0.82)
50 99 4.0 (0.03) 94 5.1 (0.11) 99 9.4 (0.38) 89 12.2 (1.31)
150 98 4.0 (0.07) 91 5.1 (0.14) 95 9.5 (0.42) 99 11.9 (0.83)
500 92 4.1 (0.22) 82 5.2 (0.18) 81 9.8 (0.57)* 81 12.5 (1.12)
Landmark
Eye opening Vaginal opening Preputial separation
Treatment % on Mean age % on Mean age % on Mean age(ppm) pnd17 (s.d.) pnd36 (s.d.) BW pnd5l (s.d.) BW
0 100 15.1 (0.95) 100 33.5 (1.26) 109.3 100 45.3 (1.48) 222.3
50 99 15.6 (0.72) 80 34.2 (2.72) 106.4 95 46.1 (3.73) 219.6
150 100 15.4 (0.68) 90 34.0 (2.29) 104.9 89 46.1 (3.06) 217.4
500 98 15.5 (0.98) 89 34.1 (2.48) 100.7 90 47.2 (4.07) 216.9
a For each landmark, the first column is the percent of animals in the group that have developed that landmark on the ageindicated; the second column is the mean (s.d.) days for development of the landmark in the group. For vaginal openingand balanopreputial separation, the mean body weight at the age of acquisition of the landmark is also included.* Statistically significantly different from control, p<0.05.

FIGURE 1
Grip strength (g)±SEM of F2offspring of rats exposed to styrene in the F
0and F
1generations. A: Males: forelimb.
B: Females: forelimb. C: Males: Hindlimb. D: Females: hindlimb. Statistically different from control, p<0.05; *parametrictest, +non-parametric test.
DEvELOpmENTAL NEUROTOxICITy STUDy OF STyRENE By INhALATION IN CRL-CD RATS
Auditory Startle
No statistically significant differences or exposure-relatedtrends were apparent in the 50-, 150-, and 500-ppm groupF
2males and females on performance measured in the
auditory startle test (Table 4). No changes in the ontogenyand distribution of within-session responses were appar-ent when compared with the control group.
Memory and Learning: Biel Maze Swimming Trials
On PND 24, swimming ability, as evidenced by anincrease in the mean time to escape for the straight chan-nel on the first day of Biel maze assessment, was slightly
decreased in the 500-ppm exposure group males (10.58sec vs. 7.53 sec for control group) and females (11.43 secvs. 7.81 sec for control group) (Fig. 3). The increasedescape times were suggestive of a slight exposure-relateddevelopmental neuromotor delay and were consistentwith the reduced pre-weaning body weights, slightincreases in the ages of acquisition of pre-weaning devel-opmental landmarks, and the slight shift in the ontogenyof normal pre-weaning locomotor activity. There were noobvious changes in mean escape times during the swimtest for animals of either sex in the 50- or 150-ppm groupson PND 24, or in any animals on PND 62.
The SIRC Review November 2006 35
22 45 60
Postnatal Day
Gri
pst
ren
gth
(g)
700
600
500
400
300
200
100
0
� 0 PPM
� 50 PPM
� 150 PPM
� 500 PPM** *
22 45 60
Postnatal Day
Gri
pst
ren
gth
(g)
700
600
500
400
300
200
100
0
� 0 PPM
� 50 PPM
� 150 PPM
� 500 PPM
22 45 60
Postnatal Day
Gri
pst
ren
gth
(g)
700
600
500
400
300
200
100
0
� 0 PPM
� 50 PPM
� 150 PPM
� 500 PPM
+ +
22 45 60
Postnatal Day
Gri
pst
ren
gth
(g)
700
600
500
400
300
200
100
0
� 0 PPM
� 50 PPM
� 150 PPM
� 500 PPM
A. B.
C. D.

DEvELOpmENTAL NEUROTOxICITy STUDy OF STyRENE By INhALATION IN CRL-CD RATS
Trials 1–4 (conducted on assessment days 2 and 3;PND 25–26 or PND 63–64) of the Biel maze weredesigned to measure learning and shorter-term memoryof Path A, designated the forward path. Trials 5-10 (con-ducted on assessment days 4-6; PND 27-29 or PND 65-67)were designed to measure learning and shorter-termmemory of Path B, designated the reverse path (the exactopposite of Path A). For all treatment groups testedbeginning on either PND 24 or PND 62, the mean time toescape was relatively high in Trial 1 and decreasedthroughout repeated testing in the forward path. For thefirst trial in the reverse path (Trial 5), mean time to escapewas much longer than for the first trial in the forward
path but decreased throughout testing in the reversepath. No treatment-related effects on learning in eitherpath direction were noted.
Trials 11 and 12 (conducted on assessment day 7; PND30 or PND 68) were designed to measure long-term mem-ory of Path A, the forward path, which was interruptedby trials 5-10 (Path B). For all exposure groups, the meantime to escape in Trial 11 was generally similar to trial 1(the first trial of Path A) but relatively longer than Trial 4(the last trial in the forward path during the learning por-tion of testing). For all exposure groups, mean time toescape for trial 12 was typically similar to Trials 3 and/or4. As expected, since animals had already experienced
The SIRC Review November 200636
FIGURE 2
Locomotor activity of F2offspring of rats exposed to styrene in the F
0and F
lgenerations; total counts in 60-min session.
A: Males: PND 13, 17, 21. B: Females: PND 13, 17, 21. C: Males: PND 61. D: Females: PND 61.
13 17 21
Postnatal Day
Tota
l Cou
nts
in S
essi
on
3000
2500
2000
1500
1000
500
0
� 0 PPM
� 50 PPM
� 150 PPM
� 500 PPM
A.
61
Postnatal Day
Tota
l Cou
nts
in S
essi
on
3000
2500
2000
1500
1000
500
0
� 0 PPM
� 50 PPM
� 150 PPM
� 500 PPM
8.
13 17 21
Postnatal Day
Tota
l Cou
nts
in S
essi
on
3000
2500
2000
1500
1000
500
0
� 0 PPM
� 50 PPM
� 150 PPM
� 500 PPM
C.
61
Postnatal Day
Tota
l Cou
nts
in S
essi
on
3000
2500
2000
1500
1000
500
0
� 0 PPM
� 50 PPM
� 150 PPM
� 500 PPM
D.

DEvELOpmENTAL NEUROTOxICITy STUDy OF STyRENE By INhALATION IN CRL-CD RATS
The SIRC Review November 2006 37
TABLE 4
Startle Response of F2Offspring of Rats Exposed to Styrene in the F
0and F
lGenerations a
Vmax
(mV) Vave
(mV) Tmax
(msec)
F0and F
lexposure Males Females Males Females Males Females
PND 20
0 97.3 ± 46.0 102.8 ± 58.5 20.3 ± 8.8 21.6 ± 11.8 27.2 ± 5.7 25.4 ± 3.7
50 86.0 ± 31.3 98.9 ± 52.8 18.0 ± 6.7 20.8 ± 10.7 28.8 ± 5.9 27.5 ± 5.5
150 85.7 ± 36.2 88.8 ± 40.0 18.5 ± 7.3 18.7 ± 8.3 28.0 ± 3.8 25.4 ± 4.1
500 92.9 ± 32.2 95.9 ± 39.5 19.4 ± 6.8 20.5 ± 7.8 27.4 ± 6.0 26.8 ± 4.0
PND 60
0 134.0 ± 101.9 75.1 ± 41.6 29.2 ± 20.7 15.8 ± 8.4 34.4 ± 5.7 34.4 ± 4.5
50 171.7 ± 164.0 85.3 ± 49.9 38.0 ± 35.1 17.3 ± 8.5 33.0 ± 5.4 34.2 ± 5.0
150 159.7 ± 94.5 62.6 ± 34.0 34.7 ± 20.6 13.8 ± 6.9 31.1 ± 4.9 35.5 ± 4.2
500 128.5 ± 99.0 83.0 ± 46.6 27.8 ± 20.3 17.3 ± 8.7 32.9 ± 5.9 33.6 ± 4.3
a Vmax is the maximum response to the startle stimulus. Vave is the average response to the startle stimulus. Tmax is thelatency to the maximum response.
FIGURE 3
PND 24 Learning and memory (Biel Maze) of F2offspring of rats exposed to styrene in the F0 and F
1generations.
A: Males. B: Females. Trial indicates the session trial (Swim represents the swimming ability testing conducted on thefirst day of evaluation). Trials 1—4 were conducted in the forward direction (Path A), Trials 5—10 were conducted in thereverse direction (Path B; exact opposite of the forward direction), and Trials 11—12 were conducted in the forwarddirection (Path A). Trials 1—10 tested learning and Trials 11—12 tested memory. **Statistically different from control,p <0.01.
Trial
Tim
e (s
ec)
180
160
140
120
100
80
60
40
20
0
0 PPM
50 PPM
150 PPM
500 PPM
A.
Swim 3 6 8 10 111
Trial
Tim
e (s
ec)
180
160
140
120
100
80
60
40
20
0
B.
Swim 3 6 8 10 111
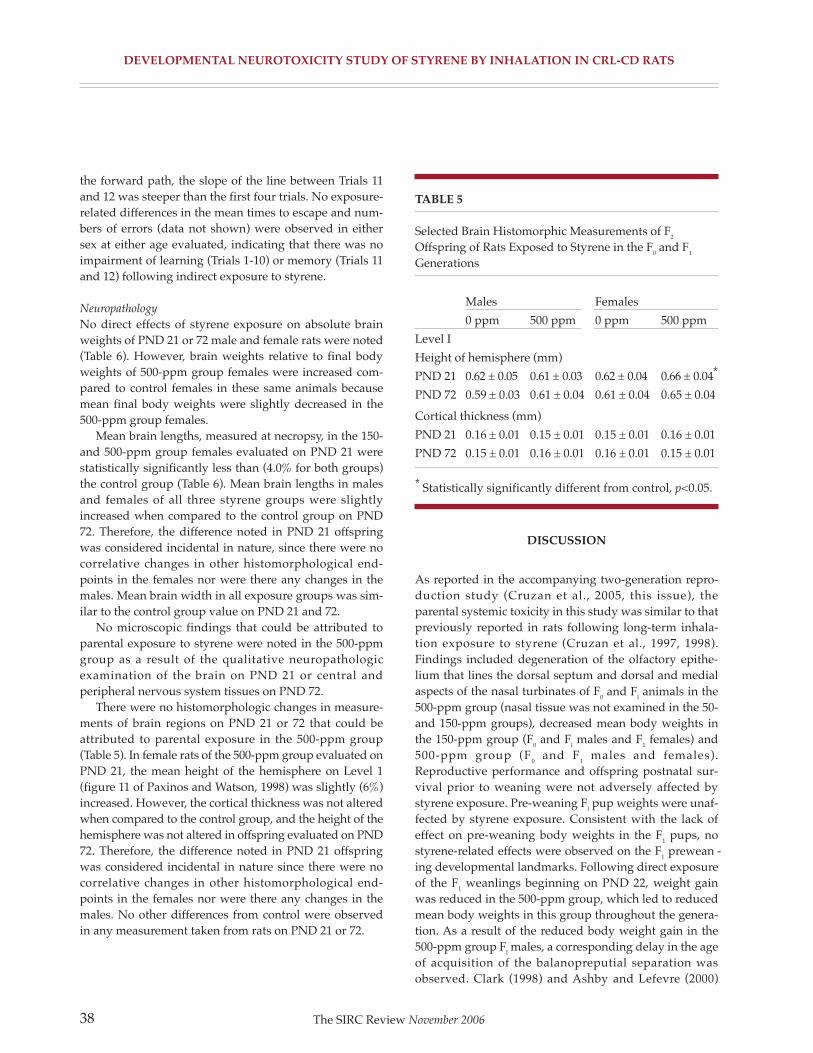
DEvELOpmENTAL NEUROTOxICITy STUDy OF STyRENE By INhALATION IN CRL-CD RATS
the forward path, the slope of the line between Trials 11and 12 was steeper than the first four trials. No exposure-related differences in the mean times to escape and num-bers of errors (data not shown) were observed in eithersex at either age evaluated, indicating that there was noimpairment of learning (Trials 1-10) or memory (Trials 11and 12) following indirect exposure to styrene.
Neuropathology
No direct effects of styrene exposure on absolute brainweights of PND 21 or 72 male and female rats were noted(Table 6). However, brain weights relative to final bodyweights of 500-ppm group females were increased com-pared to control females in these same animals becausemean final body weights were slightly decreased in the500-ppm group females.
Mean brain lengths, measured at necropsy, in the 150-and 500-ppm group females evaluated on PND 21 werestatistically significantly less than (4.0% for both groups)the control group (Table 6). Mean brain lengths in malesand females of all three styrene groups were slightlyincreased when compared to the control group on PND72. Therefore, the difference noted in PND 21 offspringwas considered incidental in nature, since there were nocorrelative changes in other histomorphological end-points in the females nor were there any changes in themales. Mean brain width in all exposure groups was sim-ilar to the control group value on PND 21 and 72.
No microscopic findings that could be attributed toparental exposure to styrene were noted in the 500-ppmgroup as a result of the qualitative neuropathologicexamination of the brain on PND 21 or central andperipheral nervous system tissues on PND 72.
There were no histomorphologic changes in measure -ments of brain regions on PND 21 or 72 that could beattributed to parental exposure in the 500-ppm group(Table 5). In female rats of the 500-ppm group evaluated onPND 21, the mean height of the hemisphere on Level 1(figure 11 of Paxinos and Watson, 1998) was slightly (6%)increased. However, the cortical thickness was not alteredwhen compared to the control group, and the height of thehemisphere was not altered in offspring evaluated on PND72. Therefore, the difference noted in PND 21 offspringwas considered incidental in nature since there were nocorrelative changes in other histomorphological end-points in the females nor were there any changes in themales. No other differences from control were observedin any measurement taken from rats on PND 21 or 72.
DISCUSSION
As reported in the accompanying two-generation repro-duction study (Cruzan et al., 2005, this issue), theparental systemic toxicity in this study was similar to thatpreviously reported in rats following long-term inhala-tion exposure to styrene (Cruzan et al., 1997, 1998).Findings included degeneration of the olfactory epithe -lium that lines the dorsal septum and dorsal and medialaspects of the nasal turbinates of F
0and F
lanimals in the
500-ppm group (nasal tissue was not examined in the 50-and 150-ppm groups), decreased mean body weights inthe 150-ppm group (F
0and F
lmales and F
1females) and
500-ppm group (F0
and F1
males and females).Reproductive performance and offspring postnatal sur-vival prior to weaning were not adversely affected bystyrene exposure. Pre-weaning F
lpup weights were unaf-
fected by styrene exposure. Consistent with the lack ofeffect on pre-weaning body weights in the F
1pups, no
styrene-related effects were observed on the F1
prewean -ing developmental landmarks. Following direct exposureof the F
1weanlings beginning on PND 22, weight gain
was reduced in the 500-ppm group, which led to reducedmean body weights in this group throughout the genera-tion. As a result of the reduced body weight gain in the500-ppm group F
lmales, a corresponding delay in the age
of acquisition of the balanopreputial separation wasobserved. Clark (1998) and Ashby and Lefevre (2000)
The SIRC Review November 200638
TABLE 5
Selected Brain Histomorphic Measurements of F2
Offspring of Rats Exposed to Styrene in the F0and F
1
Generations
Males Females
0 ppm 500 ppm 0 ppm 500 ppm
Level I
Height of hemisphere (mm)
PND 21 0.62 ± 0.05 0.61 ± 0.03 0.62 ± 0.04 0.66 ± 0.04*
PND 72 0.59 ± 0.03 0.61 ± 0.04 0.61 ± 0.04 0.65 ± 0.04
Cortical thickness (mm)
PND 21 0.16 ± 0.01 0.15 ± 0.01 0.15 ± 0.01 0.16 ± 0.01
PND 72 0.15 ± 0.01 0.16 ± 0.01 0.16 ± 0.01 0.15 ± 0.01
* Statistically significantly different from control, p<0.05.

DEvELOpmENTAL NEUROTOxICITy STUDy OF STyRENE By INhALATION IN CRL-CD RATS
have previously reported that delays in this endpoint areobserved in the presence of significant body weightreductions. Therefore, the delay in acquisition of bala -nopreputial separation was attributed to the reducedmale body weight.
As direct exposure to styrene had a greater effect on Fl
rats than on F0rats, styrene had a more pronounced effect
on the F2
pups than on the F1
pups. In contrast to the F1
generation, pre-weaning F2
pup weights were reduced inboth the 150- and 500-ppm groups (approxi mately 10 to13% on PND 21). The weights of the F
2pups selected for
neurobehavioral evaluation in the developmental neuro-toxicity phase continued to be reduced following wean-ing in the 150- and 500-ppm groups. A statistically signif-icant delay (approximately 1/2 day) in the mean age ofacquisition of incisor eruption was observed for the F
2
pups in the 500-ppm group. Slight delays (not statistical-ly significant) in pinna detachment, surface righting, hairappearance, eye opening, and balanopreputial separationwere also noted in this group. The magnitude of thedelays in each of these endpoints was slight and if they
had occurred in isolation, the delays would have beenattributed to biological variability.
There is not a one-to-one relationship between bodyweight and these values. However, on an indivi dual ani-mal/litter basis, there is a pattern that relates litters andweights relative to the group mean value. For example,one 500-ppm group female, which is the lightest animalin that group on PND 63, weighed 157g, 27% below thegroup mean of 213g and 31% below the control groupmean of 227g. This female and her male sibling had meanhindlimb grip strength values that were 35-37% lowerthan the group means (187g vs. 286g for the female and200g vs. 320g for the male) and 48-50% below the controlgroup means (357g for females and 397g for males). Theforelimb grip strength values for these animals were notdrama tically different from the group means. However,siblings of these rats showed delayed pinnal detachment(3 of 9 on PND 5 or 6 were from this litter), surface right-ing (3 of 22 on PND 5 or 6 were from this litter), incisoreruption and eye opening (3 from this litter were amongthe last with open eyes), as well as a female PND 24 swim
The SIRC Review November 2006 39
TABLE 6
Brain Weight, Length, and Width of F2Offspring of Rats Exposed to Styrene in the F
0and F
lGenerations
Males Females
0 50 150 500 0 50 150 500
Body weight (g)
PND 21 43 41 40 39 41 39 36 36*
PND 72 385 377 372 360* 248 235 233 233
Brain weight (g)
PND 21 1.55 1.64 1.62 1.59 1.54 1.56 1.52 1.57
PND 72 1.98 1.89 1.93 1.87 1.83 1.84 1.80 1.78
Brain Weight/ 100g body weight
PND 21 3.86 3.91 4.23 4.02 3.88 4.08 4.14 4.65*
PND 72 0.49 0.50 0.49 0.53 0.73 0.77 0.79 0.79
Brain length (mm)
PND 21 17.6 17.9 17.2 17.6 17.6 17.5 16.9* 16.9*
PND 72 22.6 24.2 25.4 25.6 22.2 23.8 23.6 24.4
Brain width (mm)
PND 21 14.6 14.6 14.0 14.5 14.0 13.9 13.9 13.6
PND 72 15.1 14.9 15.2 14.8 14.9 14.7 14.5 14.6
* Statistically significantly different from control, p<0.05.

DEvELOpmENTAL NEUROTOxICITy STUDy OF STyRENE By INhALATION IN CRL-CD RATS
time of 16.96 sec (compared to 11.43 sec for the group and7.81 sec for control females), acquisition of bal-anopreputial separation on PND 51, and acquisition ofvaginal patency on PND 42. From a locomotor activitystandpoint, this female and her male sibling showed asignificant delay in development, with activity that wasnearly nonexistent (and the lowest for the females) onPND 13 and that peaked on PND 21 rather than PND 17.So, both male and female pups from this litter contributeto the delay in several of the endpoints monitored, andthis litter is just one example from the group as a whole.
Thus, when evaluated in toto, the slight delays inthe acquisition of these parameters were suggestive ofan overall pattern of slight developmental delay in the500-ppm group. These pre-weaning developmentalend-points are highly correlated with pup body weight(Clark, 1998; Lochry, 1987), and the delays in theseendpoints were consistent with the reduced bodyweights observed in this group. Based on this profile,the effects of styrene on the growth and developmentof the F
2pups were somewhat greater than those
effects observed on the Flpups.
Further evidence of a slight developmental delay inthe F
2offspring included an apparent shift in the
ontogeny of normal locomotor activity from PND 13through 21, the reduced swimming ability (presentedas longer straight channel escape times) in the watermaze on PND 24, and reduced grip strength on bothPND 45 and 60 in F
2offspring of F
0and F
lrats exposed
to 500 ppm styrene. The ontogeny of swimming ability,the pre-weaning locomotor activity profile, and thecorrelation of body weight with grip strength in ratshave been well characterized (Adams, 1986; Kallman,1994). The general developmental profile in this groupdemonstrated a pattern of delay that included changesonly in age- and weight-sensitive endpoints through-out the entire F
2generation; there were no indications
of functional or morphologic effects suggestive ofselective neurotoxicity. Therefore, based on the knowncorrelation between body weight and these endpoints,the profile of changes observed in the 500-ppm groupof the F
2generation was attributed to a slight develop-
mental delay as a result of parental styrene exposure.The NOAEL for growth of F
2offspring was 50 ppm.
Kishi and coworkers, using a few litters of rats, con-cluded that styrene exposure of parents caused deficitsin neurological development. The current study, per-formed according to accepted guidelines with greater
statistical power to detect effects, confirms some oftheir observations, but does not support their conclu-sions of a direct effect on neurological development. Inthe first study (Kishi et al., 1992, 1995), they reported(using 5 control and 5 exposed litters) that inhalationexposure of pregnant Wistar rats at 293 ppm styrene ongestation days 7–21 resulted in offspring withdecreased open field activity, rota-rod activity, andoperant conditioning response. The study reportedherein found no significant effects on locomotor activi-ty or learning and memory in offspring followingdirect exposure of the F
0and F
lgenerations to 500 ppm
styrene throughout growth, mating, gestation, and lac-tation. In a second study, Katakura et al. (1999, 2001)reported increased neonatal mortality, delayed incisoreruption and delayed air righting reflex in offspring ofdams that had been exposed to 300 ppm on gestationdays 7 to 21. The authors did not indicate whetherthere were body weight differences from control at thetime these endpoints were determined. In the studyreported herein, styrene exposure had no effect onneonatal survival. Surface righting and incisor erup-tion in off-spring of the 500-ppm group were slightlydelayed, as noted above, but were judged to be sec-ondary to reduced body weight.
Based on the guideline study reported herein, nospecific effect on nervous system development wasobserved at exposures up to 500 ppm styrene.
ACKNOWLEDGmENTS
This study was sponsored by the Styrene Informationand Research Center (SIRC), Arlington, VA. Dr. Cruzanprovides science consulting to SIRC; Drs. Faber,Johnson, Roberts, Hellwig, and Maurissen areemployed by or provide consulting to SIRC membercompanies. Appre ciation is expressed to Judy Buelke-Sam for assistance in designing, monitoring, and inter-preting this study. Appreciation is expressed to thetechnical staff at WIL Research Laboratories for theconduct of this study.
REFERENCES
Adams J. 1986. Methods in behavioral teratology. In:Riley EP, Vorhees CV, editors. Handbook of behav-ioral teratology. New York: Plenum Press. p 67-97.
The SIRC Review November 200640

DEvELOpmENTAL NEUROTOxICITy STUDy OF STyRENE By INhALATION IN CRL-CD RATS
Ashby J, Lefevre PA. 2000. The peripubertal male ratassay as an alternative to the Hershberger castratedmale rat assay for the detection of anti-androgens,oestrogens and metabolic modulators. J Appl Toxicol20:35-47.
Biel WC. 1940. Early age differences in maze perfor-mance in the albino rat. J Gen Psychol 56:439-453.
Brown NA, Lamb JC, Brown SM, Neal BH. 2000. Areview of the developmental and reproductive toxici-ty of styrene. Regul Toxicol Pharmacol 32:228-247.
Campbell BA, Lytle LD, Fibiger HC. 1969. Ontogenyof adrenergic arousal and cholinergic inhibitorymechanisms in the rat. Science 166:635-637.
Clark RL. 1998. Endpoints of reproductive systemdevelopment. In: Daston G, Kimmel CA, editors. Anevaluation and interpretation of reproductive end-points for human health risk assessment. Washington,DC: ILSI Press. p 10-27.
Cruzan G, Cushman JR, Andrews LS, Granville GC,Miller RR, Hardy CJ, Combs DW, Mullins PA. 1997.Subchronic inhalation studies of styrene in CD rats andCD-1 mice. Fundam Appl Toxicol 35:152-165.
Cruzan G, Cushman JR, Andrews LS, Granville GC,Johnson KA, Hardy C, Combs DW, Mullins PA,Brown WR.1998. Chronic toxicity/ oncogenicitystudy of styrene in CD rats by inhalation exposure for104 weeks. Toxicol Sci 46:266–281.
Cruzan G, Faber WD, Johnson KA, Roberts LS,Hellwig J, Carney E, Yarrington JT, Stump DG. 2005.Two generation reproduction study of styrene byinhalation in CrL-CD rats. Birth Defects Res B 74:211–220 (this issue).
Dunnett CW. 1964. New tables for multiple compar-isons with a control. Biometrics 20:482-491.
Gad SC. 1982. A neuromuscular screen for use inindustrial toxicology. J Toxicol Environ Health9:691–704.
Haggerty GC. 1989. Development of tier 1 neurobe-havioral testing capabilities for incorporation intopivotal rodent safety assessment studies. J Am CollToxicol 8:53-69.
IARC (International Agency for Research on Cancer).2002. IARC monographs on the evaluation of carcino-genic risks to humans, Vol. 82. Some traditionalherbal medicines, some mycotoxins, naphthalene, andstyrene. Lyon, France: IARC Press. p 437–550.
Irwin SC. 1968. Comprehensive observational assess-ment: Ia. A systema tic quantitative procedure forassessing the behavioral physiological state of themouse. Psychophamacologia 13:222-256.
Kallman MJ. 1994. Assessment of motoric effects. In:Harry GJ, editor. Developmental neurotoxicology. BocaRaton, FL: CRC Press. p 103-122.
Katakura Y, Kishi R, Ikeda T, Miyake H. 1999. Effects ofprenatal exposure to styrene on neurochemical levelsin the rat brain. Toxicol Lett 105:239–249.
Katakura Y, Kishi R, Ikeda T, Miyake H. 2001. Effects ofprenatal exposure to styrene on postnatal developmentand brain serotonin and catecholamine levels in therat brain. Environ Res Sec A 85:41-47.
Kishi R, Katakura Y, Ikeda T, Chen BQ, Miyake H. 1992.Neurochemical effects in rats following gestational expo-sure to styrene. Toxicol Lett 63:141–146.
Kishi R, Chen BQ, Katakura Y, Ikeda T, Miyake H 1995.Effect of prenatal exposure to styrene on the neurobe-havioral development, activity, motor coordination,and learning behavior of rats. Neurotoxicol Teratol17:121–130.
Kruskal WH, Wallis WA. 1952. Use of ranks in one-cri-terion variance analysis. J Am Stat Assoc 47:583-621.
Levene H. 1960. Contributions to probability and sta-tistics: robust tests for equality of variances. PaloAlto, CA: Stanford University Press, p 278-292.
Lochry EA. 1987. Concurrent use of behavioral/function-al testing in existing reproductive and developmentaltoxicity screens: practical considerations. J Am CollToxicol 6:433-439.
Maurissen JPJ, Marable BR, Andrus AK, Stebbins KE.2003. Factors affecting grip strength testing. NeurotoxicolTeratol 25:543-553.
The SIRC Review November 2006 41

DEvELOpmENTAL NEUROTOxICITy STUDy OF STyRENE By INhALATION IN CRL-CD RATS
Moser VC. 1991. Applications of a neurobehavioralscreening battery. J Am Coll Toxicol 10:661-669.
Moser VC, McCormick JP, Creason JP, MacPhail RC.1988. Comparison of chlordimeform and carbaryl using afunctional observational battery. Fund Appl Toxicol11:189-206.
O’Donoghue JL. 1989. Screening for neurotoxicity using aneurologi cally based examination and neuropathology. JAm Coll Toxicol 8: 97-116.
Paxinos G, Watson C. 1998. The rat brain in stereotaxiccoordinates, 4th ed. San Diego: Academic Press. 237 pages.
Royston JP. 1982. An extension of Shapiro and Wilk’s wtest for normality to large samples. Appl Statist 31:115-124.
Sarangapani R, Teeguarden JG, Cruzan G, Clewell HJ,Andersen ME. 2002. Physiologically based pharmacoki-netic modeling of styrene and styrene oxide respiratorytract dosimetry in rodents and humans. Inhal Toxicol14:789-834.
SAS Institute, Inc. 1999-2001. SAS Proprietary SoftwareRelease, Version 8.2. Cary, NC: SAS Institute, Inc.
Snedecor GW, Cochran WG. 1980. One way classifica-tions, analysis of variance. Statistical Methods, 7th ed.Ames, IA: The Iowa State University Press. p 215-237.
Steel RGD, Torrie JH. 1980. Principles and procedures ofstatistics, a biometrical approach, 2nd ed. New York:McGraw-Hill Book Company. p 504-506.
Vergieva T, Zaykov K, Palatov S. 1979. A study of theembryonic effects of styrene. Khig Zdraveopazvane22:39-43.
Zaidi NF, Agrawal AK, Srivastava SP, Seth PK. 1985.Effect of gestational and neonatal styrene exposure ondopamine receptors. Neurobehav Toxicol Teratol 7:23-28.
The SIRC Review November 200642

The SIRC Review November 2006 43
Olfactory Function in Workers Exposed toStyrene in the Reinforced-Plastics Industry
Pamela Dalton, PhD,1* Beverly Cowart, PhD,1 Daniel Dilks, MS,1 Michele Gould, BA,1
Peter S.J. Lees, PhD, CIH,2 Aleksandr Stefaniak, MS,2 and Edward Emmett, MD3
The present study
found no evidence
among a cross-section of
reinforced plastics
industry workers that
current or historical
exposure to styrene was
associated with
impairment of olfactory
function. Taken together
with anatomical
differences between
rodent and human
airways and the lack of
evidence for styrene
metabolism in human
nasal tissue, the results
strongly suggest that at
these concentrations,
styrene is not an
olfactory toxicant in
humans.
Background
Impairment of olfactory function inhumans has been associated with occupa-tional exposure to volatile chemicals. To
investigate whether exposure to styrenewas associated with olfactory impairment,olfactory function was examined in work-ers with a minimum of 4 years exposure tostyrene in the reinforced-plastics industry(current mean exposure: 26 ppm, range: 10-60 ppm; historic mean dose: 156 ppm-years, range: 13.8-328 ppm-years) and in agroup of age- and gender-matched, unex-posed controls.
Methods
Olfactory function was assessed using astandardized battery that included testsof threshold sensitivity for phenylethylalcohol (PEA), odor identification ability,and retronasal odor perception. Odordetection thresholds for styrene were alsoobtained as a measure of specific adapta-tion to the work environment.
Results
No differences were observed betweenexposed workers and controls on tests ofolfactory function. Elevation of styrene odordetection thresholds among exposed work-ers indicated exposure-induced adaptation.
Conclusions
The present study found no evidenceamong a cross-section of reinforced plasticsindustry workers that current or historicalexposure to styrene was associated withimpairment of olfactory function. Takentogether with anatomical differencesbetween rodent and human airways and thelack of evidence for styrene metabolism in
1Monell Chemical Senses Center,Philadelphia, Pennsylvania2Johns Hopkins University, BloombergSchool of Public Health, Baltimore, MD3University of Pennsylvania, School ofMedicine, Pennsylvania
The work was performed at MonellChemical Senses Center, Philadelphia,Pennsylvania.
Reprinted with permission from AmericanJournal of Industrial Medicine 44: 1-11.
Contract grant sponsor: StyreneInformation & Research Center; Contractgrant number: 000109 (SIRC to P.H.D.);Contract grant sponsor: National Institutesof Health; Contract grant number: P50-DC00214 (NIH to P.H.D., B.J.C.).
*Correspondence to: Pamela Dalton,Monell Chemical Senses Center, 3500Market Street Philadelphia, PA 19104-3308.E-mail: [email protected]
Accepted 1 May 2002
Key words: olfactory function; styrene;occupational exposure; nasal effects;adaptation

OLFACTORy FUNCTION IN WORKERS ExpOSED TO STyRENE IN ThE REINFORCED-pLASTICS INDUSTRy
human nasal tissue, the results strongly suggest that at theseconcentrations, styrene is not an olfactory toxicant inhumans. Am. J. Ind. Med. 44:1-11, 2003 ©2003 Wiley-Liss, Inc.
INTRODUCTION
One of the potential consequences of occupational expo-sure to respirable chemicals, the impairment of olfactoryfunction, has been noted in the medical literature formore than 100 years [Mackenzie, 1984]. Because the func-tion of the olfactory system is to detect ambient chemi-cals, the receptors must constantly interact with chemicalstimuli, some of which are potentially toxic. Olfactoryreceptors are located on specialized neurons that extendinto the nasal cavity and are therefore uniquely and con-sistently exposed to the external environment. Numerousanimal studies have shown that olfactory neurons are theonly CNS neurons that are continuously replacedthroughout the adult vertebrate lifespan, even in healthyanimals housed in clean environments [e.g., Loo et al.,1996], suggesting that normal olfactory function is inher-ently damaging to the neurons. Exposure to higher levelsof pollutants, such as can be found in some industrialenvironments, might therefore be hypothesized to sur-pass the regenerative capacity of the olfactory system andlead to dysfunction.
While not, by itself, life-threatening, olfactory dys-function can have serious consequences for the detectionof many olfactory warning signals (e.g., smoke, spoiledfood and gas leaks) [Cowart et al., 1997] and can have sig-nificant impact on nutritional status, eating satisfaction,and many other issues related to quality of life [Breslin etal., 1997]. In addition, a worker whose olfactory abilitiesare impaired may be at greater risk from exposure-relatedinjuries due to the loss of an early warning system forchemical exposure.
Two lines of evidence suggest that occupational chem-ical exposure may impair olfactory function. First, animaltoxicological studies have demonstrated selective anddose-dependent histopathologic alterations in the nasalcavity from experimental exposures to a diverse range ofchemical substances, (e.g., methyl bromide, chlorine,isobutyraldehyde, formaldehyde) [Jiang et al., 1983;Hurtt et al., 1988; Monticello et al., 1991; Abdo et al.,1998]. The precise nature and distribution of these chemi-cally induced nasal lesions can vary considerably as afunction of regional deposition of the inhaled substanceand the local susceptibility of the nasal tissue. However,inhalation exposure studies suggest that the olfactoryepithelium is particularly vulnerable to damage by
inhaled compounds [Jiang et al., 1983; Genter et al., 1998]with a variety of non-neoplastic lesions of the olfactoryneuroepithelium and damage to central olfactory struc-tures, such as the olfactory bulb, associated with chronicexposure to a variety of chemicals [Ekblom et al., 1984;Odkvist et al., 1985; Feron et al., 1986; Rose et al., 1992].
Second, a number of studies of individuals and/orpopulations occupationally exposed to various chemicalshave reported problems with their sense of smell orapparent decrements on certain measures of olfactoryfunction. For example, an analysis of work history andolfactory ability among the 712,000 (20-79 year old) USand Canadian respondents to the National GeographicSmell Survey revealed that factory workers reportedpoorer senses of smell and demonstrated objective evi-dence of poorer odor detection ability, although this effectwas pronounced among elderly individuals [Corwin etal., 1995]. Notably, among this sample, factory workersreported the highest rates of olfactory decrements sec-ondary to chemical exposure and head injury.
Amoore [1986] identified more than 100 airborne sub-stances that were reported to disrupt olfactory functionfollowing either acute or chronic exposures, includingorganic solvents, metals, inorganic non-metallic com-pounds, and dusts. Much of this evidence is based on sin-gle case studies or anecdotal observations in occupationalenvironments [Emmett, 1976; Amoore, 1986; Prudhommeet al., 1998], and relies on subjective reports of olfactoryfunction or limited olfactory testing. Although severalinvestigators have examined olfactory function in largergroups of chemically exposed workers and reportedassociations between exposure and olfactory function,the relationship is far from straightforward. For example,decrements in performance on the University ofPennsylvania Smell Identification Test (UPSIT), a 40-itemtest of olfactory identification ability, have been observedamong some, but by no means all, workers exposed toorganic solvents [Sandmark et al., 1989; Schwartz et al.,1990, 1991]; among workers exposed to acrylate andmethacrylate vapors, small decrements in function wereonly observed for non-smokers [Schwartz et al., 1989]. Inbrief, although many chemicals have been implicated ascausative agents in olfactory dysfunction [Amoore, 1986],considerable variation has been observed both in the typeand degree of impairment associated with occupationalexposures. Moreover, in the case of the few publishedepidemiological studies, well-matched control groupsand/or assessments of current and historical chemicalexposures are largely lacking.
Recent inhalation studies in animals have found thatexposure to as little as 20-50 ppm styrene results in non-
The SIRC Review November 200644

OLFACTORy FUNCTION IN WORKERS ExpOSED TO STyRENE IN ThE REINFORCED-pLASTICS INDUSTRy
neoplastic, histopathological changes in the olfactoryepithelium of rodents [Cruzan et al., 1997, 1998].However, because of structural differences in the nasalpassages between rodents and humans, and differencesin the biochemistry of the nasal/olfactory tissue, andbecause the most common laboratory animals models areobligate nasal breathers, these changes might not occur inhumans in comparable environments. Moreover, becauseanimal toxicological studies have rarely incorporatedfunctional measures, very little is known about the rela-tionship between the type and severity of olfactoryepithelial damage and the extent to which olfactory func-tion is altered. Thus, the question of how to relate theobserved structural damage in rodent olfactory epitheli-um to humans, and the functional consequences of suchdamage for either species, remains unknown. The goal ofthis study was to examine the effect of exposure to styreneunder conditions that permitted a careful assessment ofthe olfactory function of both occupationally exposedworkers and of a matched group of unexposed controls.
Styrene is a clear colorless liquid with a characteristicpungent odor. The primary use of styrene is in the pro-duction of polymers and copolymers, including poly-styrene, styrene-butadiene-rubber, styrene-butadiene-latex, and a variety of different resins. Styrene monomeris combined with polyester resins and serves as a cross-linking agent in the manufacture of numerous fiberglass-reinforced products (bathtub and shower enclosures,boats, tanks, panels, etc.). The most significant occupa-tional exposure to styrene vapor occurs in the reinforced-plastics industry, where exposure can occur both byinhalation and direct skin contact [Lemasters et al., 1985].However, inhalation of styrene vapor is the major routeof occupational exposure to styrene [Brooks et al., 1980]with the nasal epithelium as a point of entry. Thus, thereis potential for adverse effects of occupational styreneexposure on nasal histopathology and olfactory function.
Our study was designed to evaluate whether repetitiveexposure to styrene vapor at the upper range of concen-trations likely to be encountered in the workplace[American Conference of Government IndustrialHygienists, 1998; Morgan, 1997] is associated with clini-cally significant olfactory dysfunction. To evaluate this,we measured olfactory function among workers whowere occupationally exposed to styrene in the reinforcedplastics industry, using a comprehensive battery of objec-tive tests of olfactory function, developed and validated atthe Monell-Jefferson Chemosensory Clinical ResearchCenter. In addition to the potential for causing general-ized olfactory dysfunction, continued or repetitive expo-sure to any odorous chemical will lead to olfactory adap-
tation, a compound-specific reduction in olfactory sensi-tivity to that chemical. As a measure of specific adaptationto the ambient chemical environment, we tested olfactorysensitivity to styrene vapor. All olfactory assessmentswere coupled with current and retrospective determina-tions of airborne styrene exposure for the workers [fordetails see Lees et al., 2003 (this issue)] and were com-pared with olfactory assessments performed on age- andgender-matched, non-exposed controls at each site, andwith normative data obtained from healthy individuals.
mATERIALS AND mEThODS
Overview of Olfactory Testing
We measured olfactory detection thresholds to two chem-icals (styrene and phenylethyl alcohol) and odor identifi-cation ability using twenty chemicals in order to providea comprehensive evaluation of olfactory function, similarto the clinical assessment used at the Monell-JeffersonChemosensory Clinical Research Center. Each type of testcan reveal a different component of olfactory function:detection thresholds can provide assessments of periph-eral olfactory function, whereas tests of odor identifica-tion are assumed to tap more central components ofolfaction as well. Because performance on both types oftests of olfactory ability can be influenced by a variety ofdemographic factors, (e.g., age, gender, and education)and dysfunction can arise from a variety of non-toxic eti-ologies [e.g., nasal-sinus disease or head injury; Cowartet al., 1993], it is essential to compare the performance ofthe exposed cohort with the performance of a suitablymatched control or referent group.
There are compelling reasons to include comprehen-sive olfactory evaluations and appropriately matchedcontrol groups into occupational evaluations. In studiesthat measured both peripheral (odor detection) and cen-tral (odor identification) olfactory function within thesame exposed individuals, occupational exposure to cad-mium was shown to impair both the detection and theidentification component of olfactory function[Rydzewski et al., 1998]. It is instructive to note that whenolfactory function in a similar group of cadmium-exposed workers was compared with a group of age- andgender-matched controls, only detection sensitivity dif-fered between the two groups [Rose et al., 1992]. The pre-sent study, therefore, attempted to address previousshortcomings in the characterization of chemical-expo-sure effects on olfaction by coupling a thorough evalua-tion of past and present styrene exposures with a batteryof clinical tests that included an assessment of bothperipheral and central components of general olfactory
The SIRC Review November 2006 45

OLFACTORy FUNCTION IN WORKERS ExpOSED TO STyRENE IN ThE REINFORCED-pLASTICS INDUSTRy
function (odor detection thresholds and odor identifica-tion tests, respectively) and a specific test of exposure-induced adaptation (detection thresholds for styrene).
If either historic or current exposure to styrene pro-duced generalized olfactory damage, we would expect tofind that the prevalence of olfactory dysfunction wouldbe greater among workers with exposure to styrene thanin the general population, as measured by our normativeclinical database. However, due to the potential con-founding effects of a variety of geographic, local environ-mental, and lifestyle factors, we also recruited and exam-ined olfactory function in a group of referents who weresimilar to the workers with respect to socio-economic sta-tus, geographic location, and matched for age and gen-der. Comparisons between these groups were expected toreveal whether occupational exposure to styrene pro-duces any olfactory loss or dysfunction above andbeyond age- or health-associated effects found amongworkers of this socio-economic status, generally.
Site Selection
Workers in the reinforced-plastics industry were selectedas the study group because the highest occupational expo-sures to styrene are reported to occur in this industry[Lemasters et al., 1985]. Solicitation letters were sent toapproximately 30 candidate companies that manufac-tured reinforced-plastics and composite products, invitingthem to participate in the study. Of those indicating inter-est in participating, we determined eligibility according tocriteria described by Lees et al. [2002]. Based on these cri-teria, four facilities were selected to participate in thestudy: two factories engaged in the manufacture of fiber-glass-reinforced shower and tub enclosures using anopen-mold process, one factory that manufactured rein-forced-fiberglass paneling, and one factory that produceda variety of reinforced-plastic products, including truckparts, sinks, and fan blades, using a closed-mold process.
Subjects
At each site, potentially eligible workers and controlswere individually identified and recruited following areview of: (1) industrial hygiene surveys that indicatedambient styrene concentrations for each job title and (2)personnel records identifying individual work histories.Through the company’s personnel office, pre-screenedworkers were notified of their potential eligibility for thestudy and invited to fill out a medical and occupationalhistory questionnaire, the answers to which were used todetermine their suitability for the olfactory study.
To adjust for the potentially confounding effects of awide range of social, economic, and environmental factors,
we also tested a comparison worker group, comprised ofworkers from the same geographical region and havingsimilar socio-economic status but no chemical exposure.
All medical/occupational questionnaire responseswere masked with respect to cohort/control group mem-bership and reviewed by the director of the chemosenso-ry disorders clinic and the occupational physician toscreen for medical conditions and prior exposure to envi-ronmental agents or chemicals, other than styrene, thatwere known or suspected to affect olfactory function.Respondents were sorted into three categories: (1) eligi-ble, (2) eligible but requiring additional clarification oncertain aspects of their medical/exposure history, and (3)ineligible. Workers in the first two categories were theninvited to participate in the study, with 94% of the eligibleworkers agreeing to participate.
All workers and control subjects provided informedconsent for their participation in the study using the formthat was approved by the Committee for StudiesInvolving Human Beings of the Institutional ReviewBoard at the University of Pennsylvania. Volunteers wereadvised that they were free to withdraw at any time.Workers continued to receive full wages during the 1-2 hrof data collection. The control subjects who participated ontheir own time were compensated for their participation.
Sixty-two exposed workers and sixty-seven controlswere tested in the study. On the basis of follow-up ques-tions at the time of test, eight of the exposed workers andthree control subjects were excluded because of pre-exist-ing medical conditions or exposure to other chemicalspotentially causative of olfactory dysfunction. Two moreworkers were excluded based on age and failure tounderstand/comply with test instructions. To match thenumber, gender, and age of subjects in the worker-group,fifteen control subjects were dropped from the analysis,resulting in fifty-two subjects in each group. The selectionprocedure for dropping control subjects was blind withrespect to olfactory performance; at each site, subjectswere included in the order of testing until the controlgroup was matched to the workers on age (within onedecade) and gender.
Odor Stimulus Preparation
Styrene monomer (Sigma-Aldrich) and phenylethyl alco-hol (Sigma-Aldrich) were used as stimuli in the odordetection tests. Styrene was diluted into odorless, light,white mineral oil in an 18-step binary dilution series,beginning with a concentration of 20% v/v. Prior to use,the mineral oil was filtered through a column of silica gelto remove odorous contaminants. Phenylethyl alcoholwas diluted into glycerol (Sigma) in a 19-step semi-log
The SIRC Review November 200646

OLFACTORy FUNCTION IN WORKERS ExpOSED TO STyRENE IN ThE REINFORCED-pLASTICS INDUSTRy
dilution series, starting with a concentration of 100% v/v.The dilutions were placed into clean, 280 ml glass bottles,fitted with a flip-top cap into which a Teflon nosepiecewas inserted. Each bottle contained 10 ml of the stimulus.For each subject, a fresh set of bottles, containing 10 ml ofdiluent only, served as blanks. When volunteers inhaledfrom the sniffing port, they sampled from the headspaceinside two bottles (one sniffing port per nostril). In a typi-cal sniff by adult males at rest, 500 ml of air is drawnthrough the nostrils. Thus, drawing the headspace fromthe two glass bottles (total volume 540 ml) should haveprovided an adequate volume of stimulus, undiluted byincoming air.
Banana, butterscotch, coffee, lemon, and peppermint,alcohol-free extracts (Frontier) were used as stimuli in theretronasal olfactory assessment. One-half milliliter ofeach extract was pipetted onto a cleaned, black, polyeth-ylene snap cap (Wheaton) and covered with parafilmuntil ready for testing. One set of odorants was preparedfor each participant and discarded after use.
The stimuli for the odor identification test consisted oftwenty odorants that were presented in cleaned, boiled,250 ml polypropylene squeeze bottles with flip caps(Wheaton). Each bottle contained a total of 5 ml of odor-ant or odorant and diluent combined. Table 1 lists theodorants used and presents the correct odor label foreach stimulus.
New threshold series and odor identification stim-uli were prepared for each week of testing and analyzedvia gas chromatography immediately after the series wasprepared to ensure reliability across and within series.
Testing Procedure
All olfactory tests wereadministered in a styrene-free environment (as estab-lished by area samples usingactive-sampling technologyto be below the analyticallimit of detection, <1 ppmstyrene). All exposed work-ers were tested during theirregular 8- or 10-hr work-shift (day, evening, or night).Workers assumed their reg-ular duties for a minimumof 1 hr and a maximum of 6hr prior to the test. Exceptfor workers at one site, allhad worked full shifts on atleast the two days immedi-ately prior to their olfactory
test. Scheduling constraints at one site meant that someworkers had only worked one consecutive day prior totheir test. Testing of controls and workers was alternatedas much as possible during each day of testing.
All volunteers were tested individually in a single ses-sion that lasted approximately 11⁄2 hr. Subjects were askedto refrain from smoking, eating, chewing candy, or drink-ing a beverage in the hour prior to the test. The sessionconsisted of multiple assessments. First, odor detectionthresholds were obtained for two compounds,phenylethyl alcohol—a measure of general olfactoryfunction, and styrene—a measure of specific adaptationto the work environment. Next, a retronasal odor identifi-cation test was administered followed by an odor identi-fication assessment.
Medical History and Screening Questionnaire
Prior to the olfactory evaluation, each volunteer ’sresponses to the medical history questionnaire wereagain reviewed with the tester; when necessary, follow-up questions elicited additional information about specif-ic nasal, allergy or sinus problems, head or facial injuriesand surgeries, exposures to environmental agents, andmedications used that may contribute to or cause olfacto-ry dysfunction.
Olfactory Detection Thresholds
Olfactory detection thresholds were obtained by using anobjective, two alternative, forced choice, modified stair-case method, a procedure that is the method of choice formost clinical and experimental applications, since it pro-
The SIRC Review November 2006 47
TABLE 1
Stimuli Used in Odor Identification Test
Identification Chemical/odorant Identification Chemical/odorant
Menthol L-Menthol Cloves Eugenol
Rye bread D-Carvone Licorice Anethol
Turpentine Terpinolene Spearmint L-Carvone
Banana Amyl acetate Smoke Guaiaicol
Almond Benzaldehyde Wintergreen Methyl salicylate
Strong cheese Butyric acid Cinnamon Cinnamaldehyde
Fish Triethylamine Coconut Octalactone
Peanut butter Ethylpyrazine Root beer Safrol
Vinegar Acetic acid Rose Phenylethyl alcohol
Vanilla Vanillin Strawberry C-16 Aldehyde

OLFACTORy FUNCTION IN WORKERS ExpOSED TO STyRENE IN ThE REINFORCED-pLASTICS INDUSTRy
vides a reliable threshold measure with a relatively smallnumber of trials [Wetherill and Levitt, 1965; Dalton andWysocki, 1996]. Thresholds for styrene and PEA wereobtained sequentially, with the order of test counter-bal-anced across subjects. On each trial, the subject was pre-sented with two pairs of bottles. One pair consisted oftwo blanks and the other pair consisted of one blank andthe appropriate dilution step of styrene or PEA. As deter-mined from a pilot study, the starting dilution step forstyrene was step 8 and for PEA was step 11.
On receiving the set of bottles, volunteers inserted thenosepieces into each nostril and took a normal sniff fromthe air in the headspace. After sniffing from both pairs,volunteers were asked to identify which pair containedthe odorants. Presentation of increasing or decreasingconcentrations continued until the individual hadachieved five reversals (a reversal is defined as two cor-rect identifications followed by one incorrect one, or oneincorrect identification followed by two correct ones, at agiven concentration step).
Retronasal Odor Identification
Each of the five stimuli (peppermint, lemon, coffee,banana, and butterscotch) was presented twiceretronasally and twice orthonasally in a pre-determined,semi-random order, as described by [Pierce and Halpern,1996]. On each trial, the subject chose one of the five stim-ulus names from a given list.
Odor Identification Test
Each odorant was presented twice resulting in a forty-item test in which each presentation was associated witha choice of four labels. Each odorant name appearedtwice as a correct response, twice as a near-miss, and fourtimes as a far-miss. For example, amyl acetate (bananaodor) was presented with the following labels: banana(correct), cloves (incorrect), strawberry (near-miss),smoke (incorrect). The volunteer was required to snifffrom the bottle and choose from among the four options,the label that best fit the odor. Due to the inherent diffi-culty in the task, subjects were permitted to take morethan one sniff prior to choosing the answer.
Criteria for Clinical Abnormality
The classification of olfactory dysfunction or loss amongthe workers tested was based upon previously establishedclinical criteria for the diagnosis of olfactory disorders[Cowart et al., 1997]. Each of the odor threshold measuresand the identification tests were examined separately andin combination. Among the exposed workers, elevation ofthe styrene threshold (relative to the controls) when the
PEA threshold and odor identification tests fell withinnormal limits was regarded as a measure of occupationaladaptation to styrene, but not a clinical abnormality perse. If subjects reported odor quality distortions on thequestionnaire, a primary diagnosis of dysosmia (distor-tions in odor quality) was assigned when (1) the PEAthreshold fell within normal limits and (2) the odor identi-fication score fell below criterion performance. A primarydiagnosis of hyposmia was assigned when PEA thresholdfell above the concentration step of 0.01% v/v (step 7) andan odor identification score below 31/40 for males and34/40 for females (reflecting a gender difference in thenormative sample). These test scores were used as thebasis for a diagnosis of hyposmia or anosmia. Generally,the upper (or lower) 2.5th percentile is regarded as thecutoff point for chemosensory abnormality [Feinstein,1985]. Due to age-related declines in olfactory sensitivityobserved among normative subjects beginning in thesixth or seventh decade, these criteria are based on scoresobtained by subjects under 50 years of age; to avoid thenecessity of age-adjusting scores in this study, the majori-ty of our study group was comprised of individualsbetween 21-50 with only 5 individuals in each group whowere between 50 and 60 years of age.
The retronasal odor identification test provided anoth-er unique measure of olfactory dysfunction, likely to befunctionally evident in the diminished perception ofeveryday food flavor. Based on the limited normativesample, an identification score less than 8 out of 10 oneither orthonasal or retronasal presentation was indica-tive of clinical abnormality.
Assessment of Current and Past Occupational Exposure to Styrene
Establishment of a relationship between occupationalexposure to styrene and any observed olfactory dysfunc-tion rests critically on the estimates and assessments ofcurrent and historical exposure to styrene among theexposed workers. Thus, personal exposure profiles werecreated for each of the styrene-exposed workers who par-ticipated in this study based on individual or surrogatesampling data from the facility, where available [fordetails about exposure reconstruction see Lees et al.,2003]. Current exposures to styrene were determined byfull-shift, personal air sampling, and biological monitor-ing of each enrolled worker.
Since any effect of styrene on the human olfactory sys-tem might result either from the direct local effect of theair concentration acting on the nasal epithelium or fromthe effect of absorbed styrene, carried by the blood stream,we also evaluated current styrene exposures through uri-nalysis for metabolites of styrene (mandelic acid and
The SIRC Review November 200648
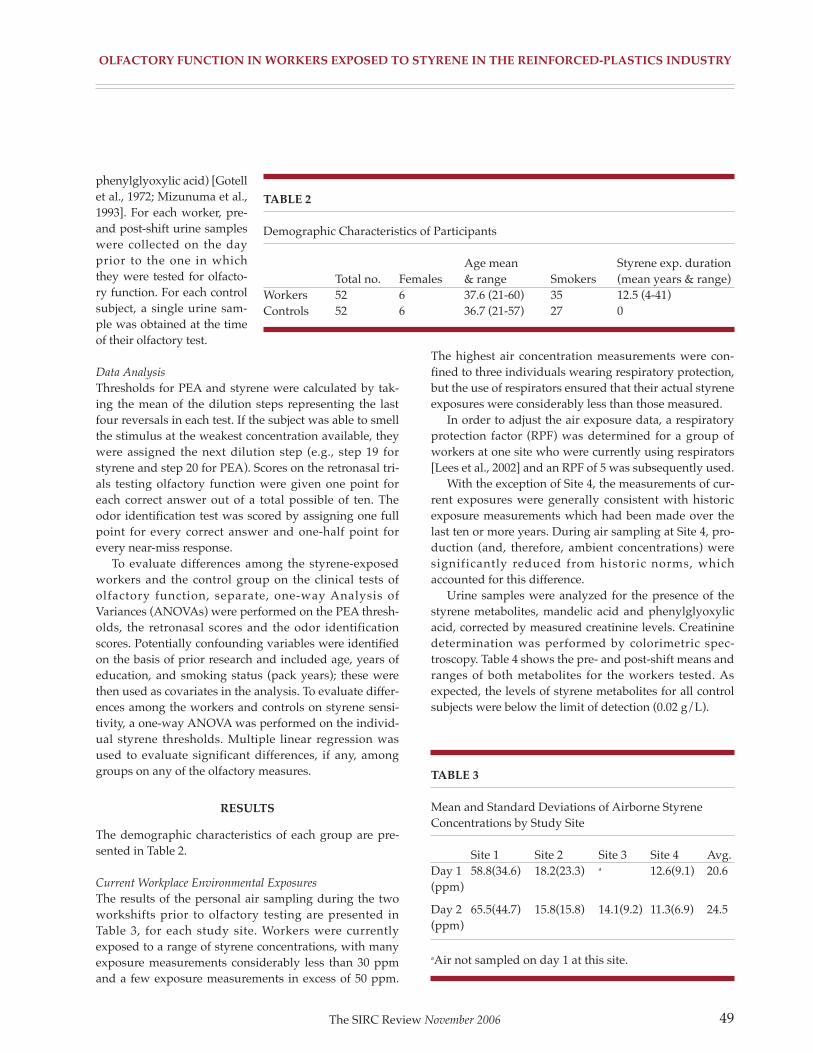
OLFACTORy FUNCTION IN WORKERS ExpOSED TO STyRENE IN ThE REINFORCED-pLASTICS INDUSTRy
phenylglyoxylic acid) [Gotellet al., 1972; Mizunuma et al.,1993]. For each worker, pre-and post-shift urine sampleswere collected on the dayprior to the one in whichthey were tested for olfacto-ry function. For each controlsubject, a single urine sam-ple was obtained at the timeof their olfactory test.
Data Analysis
Thresholds for PEA and styrene were calculated by tak-ing the mean of the dilution steps representing the lastfour reversals in each test. If the subject was able to smellthe stimulus at the weakest concentration available, theywere assigned the next dilution step (e.g., step 19 forstyrene and step 20 for PEA). Scores on the retronasal tri-als testing olfactory function were given one point foreach correct answer out of a total possible of ten. Theodor identification test was scored by assigning one fullpoint for every correct answer and one-half point forevery near-miss response.
To evaluate differences among the styrene-exposedworkers and the control group on the clinical tests ofolfactory function, separate, one-way Analysis ofVariances (ANOVAs) were performed on the PEA thresh-olds, the retronasal scores and the odor identificationscores. Potentially confounding variables were identifiedon the basis of prior research and included age, years ofeducation, and smoking status (pack years); these werethen used as covariates in the analysis. To evaluate differ-ences among the workers and controls on styrene sensi-tivity, a one-way ANOVA was performed on the individ-ual styrene thresholds. Multiple linear regression wasused to evaluate significant differences, if any, amonggroups on any of the olfactory measures.
RESULTS
The demographic characteristics of each group are pre-sented in Table 2.
Current Workplace Environmental Exposures
The results of the personal air sampling during the twoworkshifts prior to olfactory testing are presented inTable 3, for each study site. Workers were currentlyexposed to a range of styrene concentrations, with manyexposure measurements considerably less than 30 ppmand a few exposure measurements in excess of 50 ppm.
The highest air concentration measurements were con-fined to three individuals wearing respiratory protection,but the use of respirators ensured that their actual styreneexposures were considerably less than those measured.
In order to adjust the air exposure data, a respiratoryprotection factor (RPF) was determined for a group ofworkers at one site who were currently using respirators[Lees et al., 2002] and an RPF of 5 was subsequently used.
With the exception of Site 4, the measurements of cur-rent exposures were generally consistent with historicexposure measurements which had been made over thelast ten or more years. During air sampling at Site 4, pro-duction (and, therefore, ambient concentrations) weresignificantly reduced from historic norms, whichaccounted for this difference.
Urine samples were analyzed for the presence of thestyrene metabolites, mandelic acid and phenylglyoxylicacid, corrected by measured creatinine levels. Creatininedetermination was performed by colorimetric spec-troscopy. Table 4 shows the pre- and post-shift means andranges of both metabolites for the workers tested. Asexpected, the levels of styrene metabolites for all controlsubjects were below the limit of detection (0.02 g/L).
49
TABLE 2
Demographic Characteristics of Participants
Age mean Styrene exp. durationTotal no. Females & range Smokers (mean years & range)
Workers 52 6 37.6 (21-60) 35 12.5 (4-41)Controls 52 6 36.7 (21-57) 27 0
TABLE 3
Mean and Standard Deviations of Airborne StyreneConcentrations by Study Site
Site 1 Site 2 Site 3 Site 4 Avg.Day 1 58.8(34.6) 18.2(23.3) a 12.6(9.1) 20.6(ppm)
Day 2 65.5(44.7) 15.8(15.8) 14.1(9.2) 11.3(6.9) 24.5(ppm)
aAir not sampled on day 1 at this site.
The SIRC Review November 2006

OLFACTORy FUNCTION IN WORKERS ExpOSED TO STyRENE IN ThE REINFORCED-pLASTICS INDUSTRy
Historic Workplace Environmental Exposures
Individual historic styrene exposure profiles were devel-oped for every study participant using job title-based esti-mates of annual average styrene exposure for each year ofemployment. After accounting for respirator use, a cumu-lative “effective” estimate of styrene dose (calculated asthe sum of annual average exposures and expressed interms of ppm-years) was also established. Annual averageexposures for workers at the individual sites basicallymirrored styrene in air concentrations reported in the pre-vious section except that the calculation of effective expo-sures (to account for the historic use of respirators by asmall number of individuals), dramatically reduced theupper end of the exposure distribution (see Table 5).
While both current andhistoric exposure measure-ments focused on styrene, asubset of workers in some ofthese facilities were exposedto a variety of other chemi-cals. In addition to a widerange of catalysts and otheradditives to the styreneresins (e.g., brominatedflame retardants) used overthe last two decades, lami-nators (gunners and rollers)
historically used large quan-tities of acetone to cleanrollers and chopper guns.Although the level of expo-sure to acetone is unknown,its use has been discontin-ued within the last 5 years atall sites studied except Site3. In addition, Site 3 uses asmall amount of methylmethacrylate in the produc-tion of panels. Air concen-trations of methyl methacry-late ranged from 0 to 28 ppm(mean = 6.7 ppm) whenmeasured in the late 1980s.More recent measurementsare not available.
Evaluation of Olfactory
Function: Exposed Workers Vs.
Controls
The group means, standarddeviations and ranges of
scores for the three clinical tests of olfactory function arepresented in Table 6. Separate, one-way ANOVAs per-formed on the phenylethyl alcohol thresholds, theretronasal test and the odor identification scores showedno significant differences between the performance of thestyrene-exposed workers and the matched controls onany of the tests of olfactory function.
In marked contrast to the performance on the clinicalolfactory assessments, odor detection thresholds forstyrene were significantly different among the exposedand unexposed groups, F (1,100) = 16.69, P = 0.00001. Onan average, the styrene threshold for exposed workers wasalmost four dilution steps (i.e., 32-fold) higher than for theunexposed control subjects (10.6 vs. 14.3, workers and con-
The SIRC Review November 200650
TABLE 4
Means and Ranges of Urinary Metabolites of Styrene
MA Pre-shift MA Post-shift PGA Pre-shift PGA Post-shift
Workers 0.10(0.0-0.51) 0.62 (0.0-6.98) 0.07(0.0-0.47) 0.17 (0.0-2.25)
All values for mandelic acid (MA) and phenylglyoxylic acid (PGA) are g/g creatininecorrected.
TABLE 5
Means and Ranges of Historic Exposures to Airborne Styrene for Individual Workers(n = 52)(in ppm)
Cumulative Peak YearMean exposure mean exposure exposure
Workers (all sites) 13.25(3.5-31) 156(13.8-328) 26(5.2-76.5)
TABLE 6
Performance on the clinical tests of olfactory function
Workers Controls
Test Mean (s.d.) Range Mean (s.d.) Range
PEA threshold (dilution step 0-20) 16.67 (4.5) 5.5-20.0 16.66 (4.8) 1.5-20.0
Retronasal ID (number correct of 10) 8.11 (1.8) 2.0-10.0 8.05 (2.0) 1.0-10.0
Odor ID (number correct of 40) 34.80 (2.6) 27.0-39.5 35.75 (3.0) 23.0-40.0
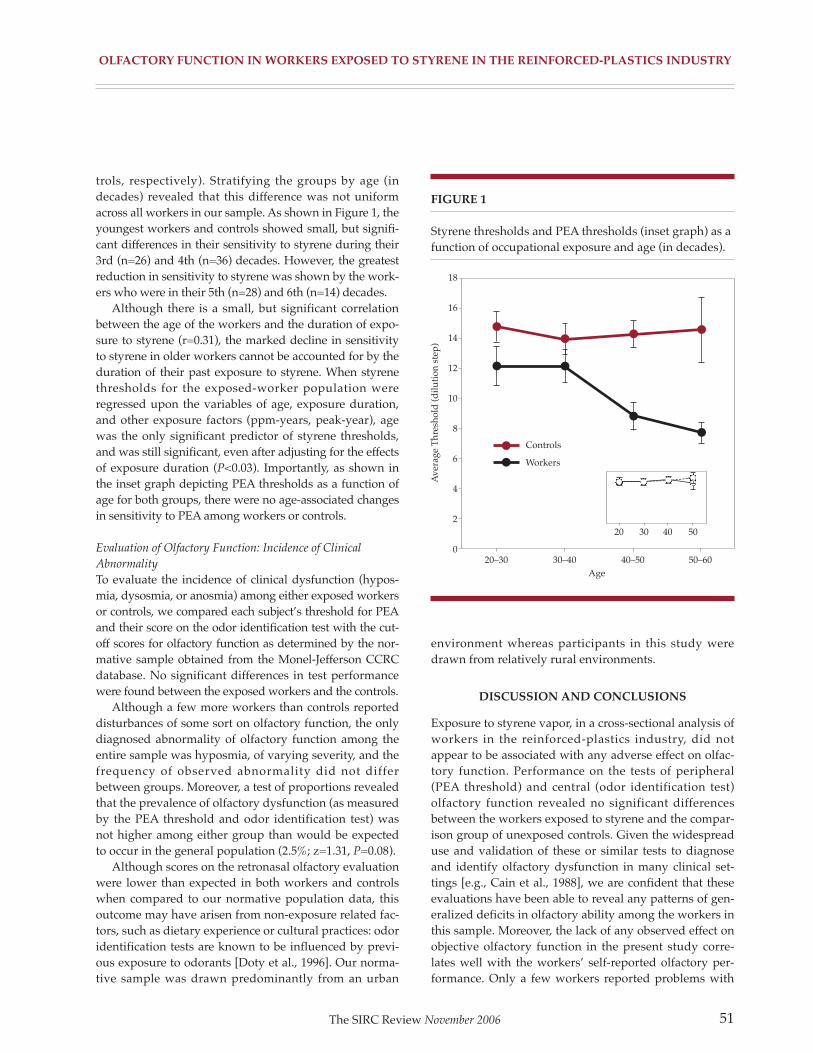
OLFACTORy FUNCTION IN WORKERS ExpOSED TO STyRENE IN ThE REINFORCED-pLASTICS INDUSTRy
trols, respectively). Stratifying the groups by age (indecades) revealed that this difference was not uniformacross all workers in our sample. As shown in Figure 1, theyoungest workers and controls showed small, but signifi-cant differences in their sensitivity to styrene during their3rd (n=26) and 4th (n=36) decades. However, the greatestreduction in sensitivity to styrene was shown by the work-ers who were in their 5th (n=28) and 6th (n=14) decades.
Although there is a small, but significant correlationbetween the age of the workers and the duration of expo-sure to styrene (r=0.31), the marked decline in sensitivityto styrene in older workers cannot be accounted for by theduration of their past exposure to styrene. When styrenethresholds for the exposed-worker population wereregressed upon the variables of age, exposure duration,and other exposure factors (ppm-years, peak-year), agewas the only significant predictor of styrene thresholds,and was still significant, even after adjusting for the effectsof exposure duration (P<0.03). Importantly, as shown inthe inset graph depicting PEA thresholds as a function ofage for both groups, there were no age-associated changesin sensitivity to PEA among workers or controls.
Evaluation of Olfactory Function: Incidence of Clinical
Abnormality
To evaluate the incidence of clinical dysfunction (hypos-mia, dysosmia, or anosmia) among either exposed workersor controls, we compared each subject’s threshold for PEAand their score on the odor identification test with the cut-off scores for olfactory function as determined by the nor-mative sample obtained from the Monel-Jefferson CCRCdatabase. No significant differences in test performancewere found between the exposed workers and the controls.
Although a few more workers than controls reporteddisturbances of some sort on olfactory function, the onlydiagnosed abnormality of olfactory function among theentire sample was hyposmia, of varying severity, and thefrequency of observed abnormality did not differbetween groups. Moreover, a test of proportions revealedthat the prevalence of olfactory dysfunction (as measuredby the PEA threshold and odor identification test) wasnot higher among either group than would be expectedto occur in the general population (2.5%; z=1.31, P=0.08).
Although scores on the retronasal olfactory evaluationwere lower than expected in both workers and controlswhen compared to our normative population data, thisoutcome may have arisen from non-exposure related fac-tors, such as dietary experience or cultural practices: odoridentification tests are known to be influenced by previ-ous exposure to odorants [Doty et al., 1996]. Our norma-tive sample was drawn predominantly from an urban
environment whereas participants in this study weredrawn from relatively rural environments.
DISCUSSION AND CONCLUSIONS
Exposure to styrene vapor, in a cross-sectional analysis ofworkers in the reinforced-plastics industry, did notappear to be associated with any adverse effect on olfac-tory function. Performance on the tests of peripheral(PEA threshold) and central (odor identification test)olfactory function revealed no significant differencesbetween the workers exposed to styrene and the compar-ison group of unexposed controls. Given the widespreaduse and validation of these or similar tests to diagnoseand identify olfactory dysfunction in many clinical set-tings [e.g., Cain et al., 1988], we are confident that theseevaluations have been able to reveal any patterns of gen-eralized deficits in olfactory ability among the workers inthis sample. Moreover, the lack of any observed effect onobjective olfactory function in the present study corre-lates well with the workers’ self-reported olfactory per-formance. Only a few workers reported problems with
The SIRC Review November 2006 51
FIGURE 1
Styrene thresholds and PEA thresholds (inset graph) as afunction of occupational exposure and age (in decades).
18
16
14
12
10
8
6
4
2
0
Controls
Workers
20–30 30–40 40–50 50–60
Age
Ave
rage
Th
resh
old
(d
ilu
tion
ste
p)
20 30 40 50

OLFACTORy FUNCTION IN WORKERS ExpOSED TO STyRENE IN ThE REINFORCED-pLASTICS INDUSTRy
their sense of smell and of these complainants, only oneindividual showed evidence of any abnormality on objec-tive olfactory evaluation.
Occupational exposure to styrene affected sensitivityto styrene, but this effect is expected and consistent withspecific, exposure-induced effect of adaptation—whichcan be observed in a variety of field settings and also inthe laboratory following even brief exposures to volatilechemicals [Ählstrom et al., 1986; Dalton and Wysocki,1996; Wysocki et al., 1997]. The present study revealed,however, that this exposure-related decrement was morepronounced among older workers than younger ones.Given that (1) all workers had been working in their reg-ular position (and exposed to styrene vapor) for a mini-mum of one hour prior to olfactory testing and that (2)neither age nor exposure duration were significant pre-dictors of variation in any of the other olfactory mea-sures, a plausible explanation for the age-related effect onstyrene thresholds among the workers is that occupation-al olfactory adaptation (in this case to styrene) is bothmore profound and more persistent among older work-ers than younger ones. Age-related differences in thekinetics of olfactory adaptation have been noted previ-ously when Stevens et al. found that the rate and degreeof adaptation accelerated while recovery deceleratedwith age [Stevens et al., 1989]. Although exposure-induced adaptation effects appear attenuated orreversible following cessation of exposure [Ählstrom etal., 1986; Gagnon et al., 1994; Mergler and Beauvais,1992], the time course of recovery after long-term expo-sure is unknown. The more pronounced decrement instyrene sensitivity shown by the older workers may needto be taken into account in any situations where earlydetection of the ambient chemical is critical (i.e., detectionof respirator failure).
Although there is recent evidence of histopathologiclesions in olfactory epithelium of rodents following expo-sure to styrene at levels similar to those experienced bymany of the workers in this study, we found no evidencethat such exposures in humans produced impairments inolfactory function. Since we did not examine the nasal orolfactory epithelium of the worker participants, we can-not determine from the present study whether exposureto styrene in humans results in changes in the nasalepithelium that are similar to those observed in animaltoxicological studies. However, if such changes are pre-sent, they do not appear to have a functional impact onany aspect of olfactory ability as measured in this study.
How can we reconcile the failure to observe a relation-ship between long-term styrene exposure and adverseeffects on olfactory function as demonstrated by the cur-
rent study with the presence of significant olfactorylesions in experimental animals exposed at similar con-centrations? Comparative studies of nasal uptake andmetabolism in rodents and humans have identified sever-al factors to account for discrepancies, and suggest thatestimates of olfactory risks based on exposures to rodentsmay not be relevant to humans.
The first factor is the presence of significant anatomi-cal differences between the nasal passages of rats, mice,and humans that result in alterations in the volume andpatterns of airflow. Thus, one explanation for the discrep-ancy between animal studies and the current functionalassessment is that the inhaled styrene vapor may depositin the nasal passages of humans, but unlike in rodents,high levels of deposition do not occur in areas that sub-serve olfaction. Evidence for this possibility comes fromexperimental data [Morgan and Monticello, 1990] andtransport models of airflow that have been used to pre-dict and model the deposition of inhaled chemicals in thenasal cavities of rodents [Kimbell et al., 1997] andhumans [Keyhani et al., 1997]. Based on anatomical castsof the upper airways in both species, computer modelsreveal strikingly different patterns of airflow through thenasal compartment that result in substantial differencesin chemical deposition and concentration in the olfactoryregions [Morgan and Monticello, 1990]. Taken togetherwith the fact that rodents are obligate nose breathers,these differences in structure and airflow would meanthat exposure to the same airborne concentration ofstyrene would result in different doses and patterns ofnasal deposition for humans and rodents.
Alternatively (or additionally), biochemical differ-ences in the nasal tissue of rodents and humans couldaccount for the disparity between the olfactory damageseen in styrene-exposed rodents and the lack of function-al effects on humans exposed to styrene vapor. In the caseof styrene, the primary metabolic pathway is the oxida-tion by cytochromes P-450 to two enantiomeric forms ofstyrene oxide [Bond, 1989]. When this metabolic processis prevented by pre-exposure to the cytochrome P-450enzyme inhibitor (5-phenyl-1-pentyne), the developmentof olfactory lesions in rodents following exposure tostyrene does not occur [Green et al., 2001]. This stronglysuggests that the lesions found in rodent olfactory tissueare induced by the primary metabolite of styrene, styreneoxide, and not by exposure to styrene per se.
Evidence that this metabolite may not be present inhuman nasal epithelium exposed to styrene comes from arecent investigation that compared metabolic activity ofstyrene in vitro in rat, mouse, and human nasal respirato-ry tissue and found important differences in the metabol-
The SIRC Review November 200652

OLFACTORy FUNCTION IN WORKERS ExpOSED TO STyRENE IN ThE REINFORCED-pLASTICS INDUSTRy
ic activity of styrene across these species [Green et al.,2001]. Specifically, rat and mouse nasal respiratory frac-tions were found to contain high concentrations of thetwo cytochrome P-450 isoforms necessary for the conver-sion of styrene into styrene oxide, whereas human nasalfractions did not. Species differences in the nasal metabo-lism of other chemicals that produce rat nasal tumorshave been recently reported as well [Green et al., 2000],suggesting that the relevance of nasal tumorigenesisstudies in rodents for human risk prediction may need tobe evaluated on a chemical-by-chemical basis. Bothanatomical and metabolic differences could explain dif-ferences in the toxic effects of styrene on the olfactoryepithelium in man and rodents.
One limitation of the present study is the potentialself-selection bias of the workers that were tested.Classically, it is held that workers with perceived expo-sure-related health effects select out of high-exposure jobsand are thus unavailable for study. Evaluation of theremaining participants in a cross-sectional study maylead to serious underestimation of the effects understudy. In the present study, however, it is equally possiblethat olfactory dysfunction status had an effect on expo-sure status, but in an opposite direction. That is, in areversal of the ‘healthy worker effect’, workers withpoorer olfactory ability may be more likely to remain inhigh-exposure job positions than workers with goodolfactory ability. If this were the case, although workercomplaints about chemical odor/irritation have beenreduced, we would have also expected to find a higherprevalence of olfactory dysfunction/lowered sensitivityamong the worker population than the unexposed con-trols, which we did not observe.
Another limitation of a cross-sectional study is theinability to measure changes in olfaction from a pre-expo-sure or baseline level. We cannot, for example, rule outthe possibility that the styrene-exposed workers, we test-ed, had better-than-average olfactory ability prior tostyrene exposure. If this were the case, however, the com-parison of the performance of the styrene-exposed work-ers with a carefully matched control group and the nor-mative sample from our database strongly suggests that(1) both the exposed workers and the control group hadroughly equivalent olfactory ability prior to workplaceexposure, and the exposed workers gradually lost sensi-tivity to styrene alone and (2) exposure to styrene doesnot have effects on general olfactory function.Nevertheless, there may be subtle changes that occur inany chemically exposed population that could only beobserved in undertaking a longitudinal study whereworkers who exhibit normal olfactory ability were
enrolled prior to any exposure and, serving as their owncontrols, are assessed periodically across the course oftheir occupational exposure.
Much of the prior evidence for olfactory dysfunctionsubsequent to chemical exposure has been derived fromanecdotal reports and case studies [Emmett, 1976;Prudhomme et al., 1998]. In the present study, each work-er’s personal exposure history was developed and docu-mented through careful examination of work records,industrial hygiene surveys, plant records, and personalmedical/occupational history interviews. Moreover, theperformance of styrene-exposed workers was comparedwith the performance of an appropriately matched refer-ent group and with the normative measures of perfor-mance from our clinical database. Equally important, theolfactory assessments used in the current study were log-ical, comprehensive, and known to be capable of detect-ing even subtle forms of olfactory dysfunction.
In summary, despite observations in animal studiesthat exposure to styrene at or below currently acceptableworkplace limits produced lesions in the olfactory epithe-lium of rodents, the present study found no evidenceamong a cross-section of reinforced-plastics workers thatcurrent or historical exposure to styrene was associatedwith impairment of general olfactory function. Takentogether with animal and human anatomical and meta-bolic data, the current results strongly suggest thatstyrene at these exposure levels is not an olfactory toxi-cant in humans.
ACKNOWLEDGMENTS
The authors thank Nadine Doolittle for assistance withthis study.
REFERENCES
Abdo KM, Haseman JK, Nyska A. 1998.Isobutyraldehyde administered by inhalation (wholebody exposure) for up to thirteen weeks or two years wasa respiratory tract toxicant, but was not carcinogenic inF344/N rats and B6C3F1 mice. Tox Sciences 42:136-151.
Ählstrom R, Berglund B, Berglund U, Lindvall T,Wennberg A. 1986. Impaired odor perception in tankcleaners. Scand J Work Environ Health 12:574-581.
American Conference of Governmental IndustrialHygienists. Threshold limit values for chemical sub-stances and physical agents. 1998. Cincinnati, AmericanConference of Governmental Industrial Hygienists.
The SIRC Review November 2006 53

OLFACTORy FUNCTION IN WORKERS ExpOSED TO STyRENE IN ThE REINFORCED-pLASTICS INDUSTRy
Amoore JE. 1986. Effects of chemical exposure on olfac-tion in humans. In: Barrow CS, editor. Toxicology of thenasal passages. Washington, DC: Hemisphere PublishingCorporation. p 155-190.
Bond JA. 1989. Review of the toxicology of styrene. CRCCrit Rev Toxicol 19:227-249.
Breslin P, Chapman GB, Mattes RD, Beauchamp GK,Cowart BJ. 1997. Quality of life for patients with chemicalsenses disorders. Chem Senses 22:650.
Brooks SM, Anderson L, Emmett E, Carson A, Tsay J, EliaV, Buncher R, Karbowsky R. 1980. The effects of protec-tive equipment on styrene exposure in workers in thereinforced plastics industry. Arch Environ Health 35:287-294.
Cain WS, Krause J. 1979. Olfactory testing: Rules for odoridentification. Neurol Res 1:1-19.
Cain WS, Gent JF, Goodspeed RB, Leonard G. 1988.Evaluation of olfactory dysfunction in the ConnecticutChemosensory Clinical Research Center. Laryngoscope98:83-88.
Coren S, Girgus JS, Schiano D. 1986. Is adaptation of ori-entation-specified cortical cells a plausible explanation ofillusion decrement. Bull Psychon Soc 24:207-210.
Corwin J, Loury M, Gilbert AN. 1995. Workplace, age,and sex as mediators of olfactory function: Data from theNational Geographic Smell Survey. J Gerontol B: PsycholSciences Soc Scinces 50B:179-186.
Cowart BJ, Flynn-Rodden K, McGeady SJ, Lowry LD. 1993. Hyposmia in allergic rhinitis. J Allergy Clin Immunol 91:747-751.
Cowart BJ, Young IM, Feldman RS, Lowry LD. 1997.Clinical disorders of smell and taste. Occupational medi-cine: State of the Art Reviews. Philadelphia: Hanley &Belfus, Inc. p 465-483.
Cruzan G, Cushman JR, Andrews LS, Granville GC,Miller RR, Hardy CJ, Coombs DW, Mullins PA. 1997.Subchronic inhalation studies of styrene in CD rats andCD-1 mice. Fund Appl Toxicol 35:152-165.
Cruzan G, Cushman JR, Andrews LS, Granville GC,Johnson KA, Hardy CJ, Coombs DW, Mullins PA, BrownWR. 1998. Chronic toxicity/oncogenicity study of styrenein CD rats by inhalation exposure for 104 weeks. ToxSciences 46:266-281.
Dalton P, Wysocki CJ. 1996. The nature and duration ofadaptation following long-term exposure to odors.Percep Psychophys 58:781-792.
Doty RL, Shaman P, Dann M. 1984. Development of theUniversity of Pennsylvania smell identification test: Astandardized microencapsulated test of olfactory func-tion. Physiol Behav 32:489-502.
Doty RL, Marcus A, Lee WW. 1996. Development of the12-item cross-cultural smell identification test (CC-SIT).Laryngoscope 106:353-356.
Ekblom A, Flock A, Hansson P, Ottoson D. 1984.Ultrastructural and electrophysiological changes in theolfactory epithelium following exposure to organic sol-vents. Acta Oto-Laryngol 98:351-361.
Emmett EA. 1976. Parosmia and hyposmia induced bysolvent exposure. Br J Ind Med 33:196-198.
Feinstein AR. 1985. Clinical epidemiology: The architec-ture of clinical research. Philadelphia: WB Saunders Co.etc. p 43-47.
Feron VJ, Woutersen RA, Spit BJ. 1986. Pathology ofchronic nasal toxic responses including cancer. In: BarrowCS, editor. Toxicology of the nasal passages. Washington,DC: Hemisphere Publishing Corporation. p 67-89.
Gagnon P, Mergler D, Lapare S. 1994. Olfactory adapta-tion, threshold shift and recovery at low levels of expo-sure to methyl isobutyl ketone (MIBK). Neurotoxicol15:637-642.
Gent J.F, Goodspeed RT, Zagraniski RT, Catalanotto FA.1987. Taste and smell problems:Validation of questionsfor the clinical history.Yale J Biol Med 60:27-35.
Genter MB, Deamer-Melia NJ, Wermore BA, Morgan KT,Meyer SA. 1998. Herbicides and olfactory/neurotoxicityresponses. Rev Toxicol 2:93-112.
Gotell P, Axelson O, Lindelof B. 1972. Field studies onhuman styrene exposure. Work Env Health 9:76-83.
The SIRC Review November 200654

OLFACTORy FUNCTION IN WORKERS ExpOSED TO STyRENE IN ThE REINFORCED-pLASTICS INDUSTRy
Green T, Lee R, Moore RB, Ashby J, Willis GA, Lund VJ,Clapp MJ. 2000. Acetochlor-induced rat nasal tumors:further studies on the mode of action and relevance tohumans. Regul Toxicol Pharmacol 32:127-133.
Green T, Lee R, Toghill A, Meadowcroft S, Lund V, FosterJ. 2001. The toxicity of styrene to the nasal epithelium ofmice and rats: Studies on the mode of action and rele-vance to humans. Chem Biol Interact 137:185-202.
Hurtt ME, Thomas DA, Working PK, Monticello TM,Morgan KT. 1988. Degeneration and regeneration of theolfactory epithelium following inhaltion exposure tomethyl bromide: Pathology, cell kinetics, and olfactoryfunction. Toxicol Appl Pharmacol 94:311-328.
Jiang XZ, Buckley LA, Morgan KT. 1983. Pathology oftoxic responses to the RD50 concentration of chlorine gasin the nasal passages of rats and mice. Toxicol ApplPharmacol 71:225-236.
Keyhani K, Scherer PW, Mozell MM. 1997. A numericalmodel of nasal odorant transport for the analysis ofhuman olfaction. J Theor Biol 186:279-301.
Kimbell JS, Godo MN, Gross EA, Joyner DR, RichardsonRB, Morgan KT. 1997. Computer simulation of inspirato-ry airflow in all regions of the F344 rat nasal passages.Toxicol Appl Pharmacol 145:388-398.
Lees PSJ, Stefaniak A, Emmett E, Dalton P. 2002. Exposureassessment for the study of olfactory function in workersexposed to styrene in the reinforced-plastics industry.Amer J Ind Med 44:12-23 (this issue).
Lemasters GK, Carson A, Samuels SJ. 1985. Occupationalstyrene exposure for twelve product categories in thereinforced-plastics industry. Am Ind Hyg Assoc J 46:434-441.
Loo AT, Youngentob SL, Kent PF, Schwob JE. 1996. Theaging olfactory epithelium: Neurogenesis, response todamage, and odorant-induced activity. Dev Neurosci14:881-900.
Mackenzie M. 1984. A manual of diseases of the throatand nose:Vol. II: Diseases of the oesophagus, nose, andnaso-pharynx. New York: Wood.
Mergler D, Beauvais B. 1992. Olfactory threshold shift fol-lowing controlled 7-hour exposure to toluene and/orxylene. Neurotoxicol 13:211-216.
Mizunuma K, Yasugi T, Kawai T, Horiguchi S, Ikeda M.1993. Exposure-excretion relationship of styrene and ace-tone in factory workers: A comparison of a lipophilic sol-vent and a hydrophilic solvent. Arch Environ ContamToxicol 25:129-133.
Monticello TM, Miller FJ, Morgan KT. 1991. Regionalincreases in rat nasal epithelial cell proliferation follow-ing acute and sub-chronic inhalation of formaldehyde.Toxicol Appl Pharmacol 111:409-421.
Morgan MS. 1997. The biological exposure indices: A keycomponent in protecting workers from toxic chemicals.Environ Health Perspect 105:105-115.
Morgan KT, Monticello TM. 1990. Airflow, gas deposi-tion, and lesion distribution in the nasal passages.Environ Health Perspect 88: 209-218.
Odkvist LM, Edling C, Hellquist H. 1985. Influence ofvapors on the nasal mucosa among industry workers.Rhinology 23:121-127.
Pierce J, Halpern BP. 1996. Orthonasal and retronasalodorant identification based upon vapor phase inputfrom common substances. Chem Senses 21:529-543.
Prudhomme JC, Shusterman D, Blanc PD. 1998. Acute-onset persistent olfactory deficit resulting from multipleoverexposures to ammonia vapor at work. J Am BoardFam Pract 11:66-69.
Rose CS, Heywood PG, Costanzo RM. 1992. Olfactoryimpairment after chronic occupational cadmium expo-sure. J Occup Med 34:600-605.
Rydzewski B, Sulkowski W, Miarzynska M. 1998.Olfactory disorders induced by cadmium exposure: Aclinical study. Int J Occup Med Environ Health 11:235-245.
Sandmark B, Broms I, Löfgren L, Ohlson C. 1989.Olfactory function in painters exposed to organic sol-vents. Scand J Work Environ Health 15:60-63.
The SIRC Review November 2006 55

OLFACTORy FUNCTION IN WORKERS ExpOSED TO STyRENE IN ThE REINFORCED-pLASTICS INDUSTRy
Schwartz BS, Doty RL, Monroe C, Frye R, Barker S. 1989.Olfactory function in chemical workers exposed to acry-late and methacrylate vapors. Am J Public Health 79:613-618.
Schwartz BS, Ford DP, Bolla KI, Agnew J, Rothman N,Bleecker ML. 1990. Solvent-associated decrements inolfactory function in paint manufacturing workers. Am JInd Med 18:697-706.
Schwartz BS, Ford DP, Bolla KI, Agnew J, Bleeker ML.1991. Solvent-associated olfactory dysfunction: Not a pre-dictor of deficits in learning and memory. Am JPsychiatry 148:751-756.
Stevens JC, Cain WS, Schiet FT, Oatley MW. 1989.Olfactory adaptation and recovery in old age. Perception18:265-276.
Wetherill GB, Levitt H. 1965. Sequential estimation ofpoints on a psychometric function. Br J Math Stat Psychol18:1-10.
Wysocki CJ, Dalton P, Brody MJ, Lawley HJ. 1997.Acetone odor and irritation thresholds obtained fromacetone-exposed factory workers and from control (occu-pationally non-exposed) subjects. Am Ind Hyg Assoc J58:704-712.
The SIRC Review November 200656

57
Exposure Assessment for Study of OlfactoryFunction in Workers Exposed to Styrene in
the Reinforced-Plastics IndustryPeter S.J. Lees, PhD, CIH,1 Aleksandr Stefaniak, MHS,1 Edward A. Emmett, MD,2
and Pamela Dalton, PhD3
Without quantitative
measures of exposure,
findings and
conclusions are of
limited usefulness. The
use of exposure
information in this
manner is critical for the
development of
defensible assessments
of the risk of exposure
to occupational and
environmental agents
and, in turn, to the
standards setting
process.
Background
This study was undertaken in conjunctionwith an evaluation of the olfactory functionof 52 persons exposed to styrene vapors toprovide quantitative styrene exposure his-tories of each subject for use in the interpre-
tation of the results of olfactory functiontesting.
Methods
Current and historic exposures were investi-gated. Historic exposures were reconstruct-ed from employment records and measure-ments of styrene exposure made in thesubject facilities over the last 15 years.Current exposures were estimated for everyexposed subject though personal air sam-pling and through pre- and post-shift mea-surements of urinary metabolites of styrene.
Results
The study population had been employedin the reinforced-plastics industry for anaverage of 12.2 ± 7.4 years. Their mean 8-hrtime weighted average (TWA) respirator-corrected annual average styrene exposurewas 12.6 ± 10.4 ppm; mean cumulativeexposure was 156 ± 80 ppm-years. The cur-rent respirator-corrected 8-hr TWA averageexposure was 15.1 ± 12.0 ppm. The meanpost-shift urinary mandelic and phenylgly-oxylic acid (PGA) concentrations were 580± 1,300 and 170 ± 360 mg/g creatinine,respectively and were highly correlatedwith air concentrations of styrene.
Conclusions
This quantitative exposure evaluation hasprovided a well-characterized population,with documented exposure histories stableover time and in the range suitable for thepurposes of the associated study of olfacto-ry function.
1Johns Hopkins University BloombergSchool of Public Health, Department ofEnvironmental Health Sciences,Baltimore,Maryland2Hospital of the University ofPennsylvania, Philadelphia, Pennsylvania3Monell Chemical Senses Center,Philadelphia, Pennsylvania
Reprinted with permission from AmericanJournal of Industrial Medicine 44:12-23.
Work was performed at Johns HopkinsUniversity, Bloomberg School of PublicHealth, Baltimore, MD. Project wassponsored by Styrene Information andResearch Center, 1300 Wilson Blvd.,Arlington,VA 22209.
*Correspondence to: Peter S.J. Lees, JohnsHopkins University, Bloomberg School ofPublic Health, Department ofEnvironmental Health Sciences, 615N.Wolfe Street, Baltimore, MD 21205.E-mail: [email protected] 3 February 2003
Key Words: styrene; olfaction; exposureassessment; exposure reconstruction
The SIRC Review November 2006

ExpOSURE ASSESSmENT FOR STUDy OF OLFACTORy FUNCTION IN WORKERS ExpOSED TO STyRENE
IN ThE REINFORCED-pLASTICS INDUSTRy
INTRODUCTION
The establishment of a relationship useful for quantita-tive risk assessment between occupational exposure to achemical and any observed health effect rests critically onthe estimates of exposure to that chemical among theexposed workers. This study was conducted to providequantitative styrene exposure information for a group ofworkers who were the subjects of a simultaneous studyexamining the possible olfactory dysfunction resultingfrom this exposure [Dalton et al., 2003]. As the olfactorystudy was designed to differentiate between the olfactoryeffects of chronic and acute exposures, accurate estima-tion of short- and long-term exposures was of concern.Short-term (current) exposures were estimated throughmeasurement of the concentration of styrene in air in theworkers’ breathing zones during the two shifts immedi-ately prior to olfactory testing and through the concur-rent measurement of urinary biomarkers of exposure.Chronic exposures over the subjects’ employment histo-ries were reconstructed from job histories and historicexposure-monitoring records. For subsequent analyticalpurposes, the short-term exposure measurements wereunique to the subject; historically reconstructed chronicexposures were, of necessity, based on a population (jobtitle) pooling of exposure information and were unique toa job title. In all cases, data used for historic exposurereconstruction were restricted to the facility of origin.
BACKGROUND
Styrene is a clear colorless liquid with a highly characteris-tic pungent odor, detectable at concentrations >0.32 ppm[Amoore and Hautala, 1983] and highly irritating at con-centrations >100 ppm [Stewart et al., 1968]. Recent produc-tion data indicate that 11.9 billion pounds of styrene wereproduced in the US in 1999 [Chemical and EngineeringNews, 2000]. The primary use of styrene is in the produc-tion of polymers and copolymers, including polystyrene,styrene–butadiene-rubber, styrene–butadiene-latex, and avariety of different resins. Styrene monomer is combinedwith polyester resins and serves as a cross-linking agent inthe manufacture of numerous fiber-reinforced products.Except for those products requiring special performancecharacteristics, for example, impact resistance, fiberglass isthe reinforcement of choice. Although many productionprocesses are enclosed and worker exposure to styrene islow, workers involved in open production processes suchas the manufacture of bathtub and shower enclosures,boats, tanks, and panels experience substantially higherexposures [LeMasters et al., 1985].
Although animal data and human laboratory data[Berode et al., 1985; Pezzagno et al., 1985; Wieczorek,1985; Petreas et al., 1995; Nylander-French et al., 1999]suggest that styrene may be readily absorbed through theskin, in the workplace exposure to styrene is primarilyvia inhalation. Brooks et al. [1980] suggest that the poly-ester resin/styrene complex is sufficiently different frompure styrene test exposures ‘‘that percutaneous absorp-tion of styrene is not an important route of exposure inthe reinforcedplastics industry’’ [Brooks et al., 1980].
Reinforced plastics are produced by a variety of manu-facturing methods using open, semi-open, and closed pro-duction processes. Because they produce vapor exposuresin the range of interest for the study of olfactory effects,the open production processes are of particular impor-tance to this study. Exposures related to two open produc-tion methods (manual spray-up and lay-up methods), onesemi-open method (panel production), and one closedproduction method (matched die molding) were studied.
The spray-up manufacturing method often entails thehighest exposures [LeMasters et al., 1985]. In this method,a pigmented gel coat of styrene–polyester resin is initiallysprayed onto an open mold (male or female). The gel coatrepresents the finished side of the product. Next, astyrene–polyester resin, an initiator, and short (5–8 cm)strands of fiberglass fibers (roving) are sprayed simultane-ously onto the mold through the use of a hand-held chop-per gun. The components mix in the air; on the mold, themixture is hand rolled to consolidate the material (elimi-nate voids), to ensure conformance with the mold, and toprovide for complete wetting of the fibers [Strong, 1989].Excess material is trimmed from the product by handbefore it is allowed to cure, usually at room temperature.
Manual lay-up methods may also entail high exposuresto styrene [LeMasters et al., 1985]. In this method, succes-sive layers of a woven reinforcing fabric, frequently fiber-glass, are placed on a mold; each layer is manually saturat-ed with resin as the item is fabricated. The manual lay-upoperations included in this study were limited to the fabri-cation of large fan blades using sheet molding compound(SMC) ‘‘pre-pregs;’’ wet or in-process impregnation meth-ods were not used in any of the facilities studied. Pre-pregsare fibrous materials, usually woven fabrics, that havebeen saturated or pre-impregnated with resin and allowedto cure slightly at a location remote from the manufactur-ing process. They are transported to the fabrication site (inthis case elsewhere in the manufacturing facility) wherethey are manually cut and applied to a mold in sequentiallayers to build up the item being fabricated. After fabrica-tion is complete, the piece is allowed to cure in an auto-clave at elevated pressure and elevated temperature.
The SIRC Review November 200658

ExpOSURE ASSESSmENT FOR STUDy OF OLFACTORy FUNCTION IN WORKERS ExpOSED TO STyRENE
IN ThE REINFORCED-pLASTICS INDUSTRy
The semi-open production process studied involvedthe production of fiberglass-reinforced styrene polyesterpanels. In this continuous highly automated process,styrene resin is spread to the appropriate thickness onto asheet of cellophane unwound from a large roll. Choppedfiberglass fibers are allowed to fall onto the resin beforethe mixture is passed between sets of rollers, which com-press the mixture and apply a top (finish) cellophanelaminate to the sheet. The product is then passed throughan oven where it is cured. The resulting continuoussheets, up to thousands of feet in length, are eitherwound into rolls or cut to convenient lengths.
The closed production process studied involvedmatched die molding of bulk molding compound (BMC).In this process, chopped fibers, resin, initiators, and fillersare combined to form a dough-like mixture called a pre-mix. A weighed amount of pre-mix is manually placed inthe lower half of a matched die mold. The upper portionof the mold is then pressed against the BMC, forcing it tospread in conformance with the cavity between the dies.The pressure, temperature, and time the dies are togetherare specified for the subsequent curing process.
There is a modest literature summarizing workerstyrene exposures in the reinforced-plastics industry[Schumacher et al., 1981; Ikeda et al., 1982; Crandall andHartle, 1985; LeMasters et al., 1985; Andersson et al.,1994]. Little additional information has appeared in thepublished literature in the last decade. In one of the mostextensive reports, summarizing approximately 1,500exposure measurements collected between 1974 and 1981at 36 facilities, styrene exposures were grouped by indus-try product category [Lemasters et al., 1985]. As expected,fabrication processes involving open methods (primarilyhand lay-up and chopper gun application) were found tohave the highest exposures. Other methods were foundto be associated with substantially lower exposures.Mean styrene exposure (time not specified but assumedfrom context to be 8-hr time weighted average [TWA]) inboat fabrication was estimated to be 82 ppm, that in truckpart fabrication was 61 ppm, that in tub and shower fab-rication was 47 ppm, that in yacht fabrication was 47ppm, and that in tank and pipe fabrication was 24 ppm.All other process/product exposures, with the exceptionof die molded truck and automobile parts were associat-ed with mean exposures less than 20 ppm. Chopper gunoperators were consistently among the most highlyexposed across all studies.
Interestingly, historical exposures (20 years ago)reported in the literature did not seem to vary substan-tially from those concentrations measured as a part ofthis study. An additional historical perspective, primarily
from the boat fabrication industry, indicated that only alittle more than a third of the exposed employees woreapproved respiratory protective equipment (RPE)[Schumacher et al., 1981].
US and international exposure limits for styrene haveundergone a steady decline over the last 30 years. In theUS, the threshold limit value (TLV®) for styrene, a guide-line published by the American Conference ofGovernmental Industrial Hygienists (ACGIH), hasdeclined from 100 ppm as an 8-hr TWA prior to 1975, to 50ppm in 1975, and finally to 20 ppm in 1997 [AmericanConference of Governmental Industrial Hygienists, 1997].The permissible exposure limit (PEL), a regulatory limitpromulgated by the US Occupational Safety and HealthAdministration (OSHA), officially remains at 100 ppm[Occupational Safety and Health Administration, 2000],although memoranda of understanding have been signedwith the major users of styrene, voluntarily reducing thePEL to 50 ppm [Occupational Safety and HealthAdministration, 1996]. The most recent TLV reductionwas adopted based on evidence related to the preventionof peripheral and central nervous system effects and tofurther minimize the potential for irritation [AmericanConference of Governmental Industrial Hygienists, 1997].
In addition to exposure limits based on air concentra-tions of styrene, ACGIH has developed recommendedmaximum concentrations of urinary metabolites ofstyrene, termed biological exposure indices (BEI)[American Conference of Governmental IndustrialHygienists, 1996]. The recommended post-shift BEI formandelic acid (MA) concentration is 800 mg/g creatinineand that for phenylglyoxylic acid (PGA) is 240 mg/g cre-atinine. (Note that these BEI’s were adopted in 1986 andhave not been revised to reflect reduction of the TLV in1997.) MA represents approximately 85% and PGAapproximately 10% of the styrene excreted [AmericanConference of Governmental Industrial Hygienists,1996]. Although both metabolites appear in the urineshortly after the start of exposure, an examination of thekinetics of metabolism suggests that the MA valuereflects a rapid metabolic pathway (t 1⁄ 2
≈4–8 hr) and thePGA value reflects a somewhat slower pathway(t 1⁄ 2
≈8–16 hr) [American Conference of GovernmentalIndustrial Hygienists, 1996]. For this reason, the Germanpractice is to sum these components with a combined(MA+PGA) recommended value of 600 mg/g creatinine,termed the Biologischer Arbietsstoff-Toleranz Wert (BAT)[Deutsche Forschungsgemeinschaft Commission for theInvestigation of Health Hazards of ChemicalCompounds in the Work Area, 2000].
The SIRC Review November 2006 59
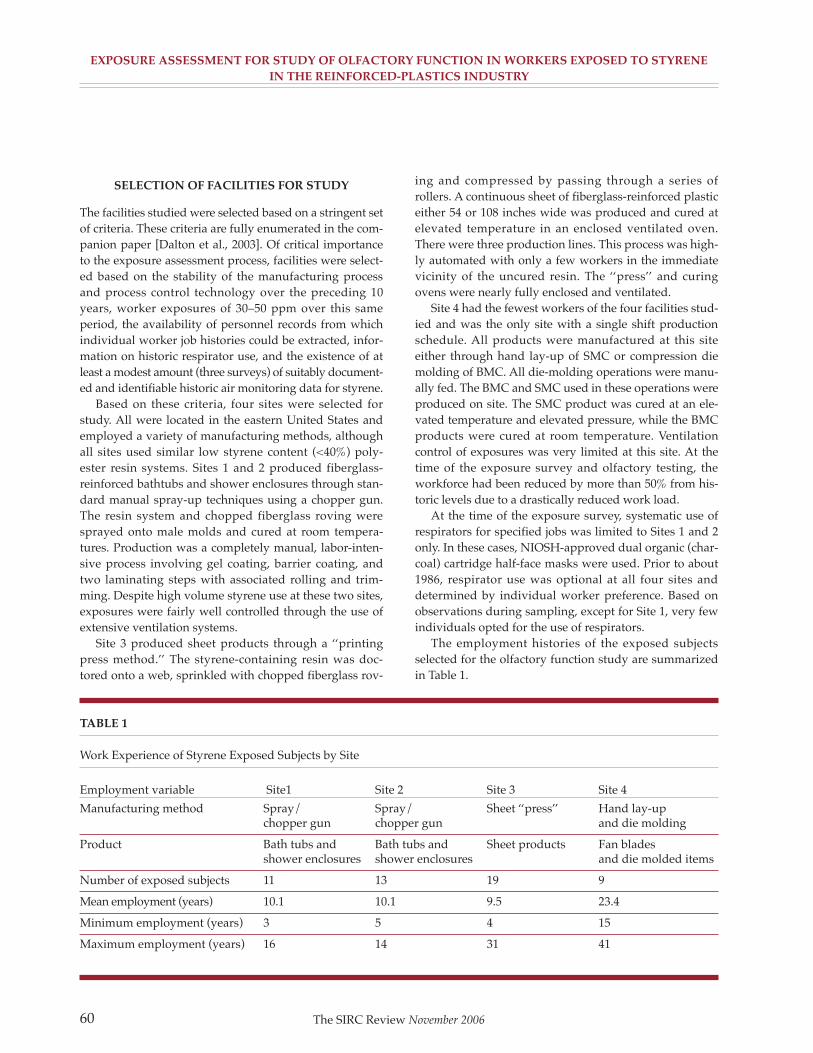
ExpOSURE ASSESSmENT FOR STUDy OF OLFACTORy FUNCTION IN WORKERS ExpOSED TO STyRENE
IN ThE REINFORCED-pLASTICS INDUSTRy
SELECTION OF FACILITIES FOR STUDy
The facilities studied were selected based on a stringent setof criteria. These criteria are fully enumerated in the com-panion paper [Dalton et al., 2003]. Of critical importanceto the exposure assessment process, facilities were select-ed based on the stability of the manufacturing processand process control technology over the preceding 10years, worker exposures of 30–50 ppm over this sameperiod, the availability of personnel records from whichindividual worker job histories could be extracted, infor-mation on historic respirator use, and the existence of atleast a modest amount (three surveys) of suitably document-ed and identifiable historic air monitoring data for styrene.
Based on these criteria, four sites were selected forstudy. All were located in the eastern United States andemployed a variety of manufacturing methods, althoughall sites used similar low styrene content (<40%) poly-ester resin systems. Sites 1 and 2 produced fiberglass-reinforced bathtubs and shower enclosures through stan-dard manual spray-up techniques using a chopper gun.The resin system and chopped fiberglass roving weresprayed onto male molds and cured at room tempera-tures. Production was a completely manual, labor-inten-sive process involving gel coating, barrier coating, andtwo laminating steps with associated rolling and trim-ming. Despite high volume styrene use at these two sites,exposures were fairly well controlled through the use ofextensive ventilation systems.
Site 3 produced sheet products through a ‘‘printingpress method.’’ The styrene-containing resin was doc-tored onto a web, sprinkled with chopped fiberglass rov-
ing and compressed by passing through a series ofrollers. A continuous sheet of fiberglass-reinforced plasticeither 54 or 108 inches wide was produced and cured atelevated temperature in an enclosed ventilated oven.There were three production lines. This process was high-ly automated with only a few workers in the immediatevicinity of the uncured resin. The ‘‘press’’ and curingovens were nearly fully enclosed and ventilated.
Site 4 had the fewest workers of the four facilities stud-ied and was the only site with a single shift productionschedule. All products were manufactured at this siteeither through hand lay-up of SMC or compression diemolding of BMC. All die-molding operations were manu-ally fed. The BMC and SMC used in these operations wereproduced on site. The SMC product was cured at an ele-vated temperature and elevated pressure, while the BMCproducts were cured at room temperature. Ventilationcontrol of exposures was very limited at this site. At thetime of the exposure survey and olfactory testing, theworkforce had been reduced by more than 50% from his-toric levels due to a drastically reduced work load.
At the time of the exposure survey, systematic use ofrespirators for specified jobs was limited to Sites 1 and 2only. In these cases, NIOSH-approved dual organic (char-coal) cartridge half-face masks were used. Prior to about1986, respirator use was optional at all four sites anddetermined by individual worker preference. Based onobservations during sampling, except for Site 1, very fewindividuals opted for the use of respirators.
The employment histories of the exposed subjectsselected for the olfactory function study are summarizedin Table 1.
The SIRC Review November 200660
TABLE 1
Work Experience of Styrene Exposed Subjects by Site
Employment variable Site1 Site 2 Site 3 Site 4
Manufacturing method Spray/ Spray/ Sheet ‘‘press’’ Hand lay-up chopper gun chopper gun and die molding
Product Bath tubs and Bath tubs and Sheet products Fan blades shower enclosures shower enclosures and die molded items
Number of exposed subjects 11 13 19 9
Mean employment (years) 10.1 10.1 9.5 23.4
Minimum employment (years) 3 5 4 15
Maximum employment (years) 16 14 31 41

ExpOSURE ASSESSmENT FOR STUDy OF OLFACTORy FUNCTION IN WORKERS ExpOSED TO STyRENE
IN ThE REINFORCED-pLASTICS INDUSTRy
ASSESSmENT OF hISTORIC ExpOSURES
MethodsAll sites selected for inclusion in the study had records ofa series of personal measurements of worker styreneexposures covering a period of time roughly contempo-rary with the employment of the study subjects. All esti-mates of historic exposure were derived from these dataand from the exposure measurements collected as part ofthis study immediately preceding the olfactory functionevaluations. All reconstructions of worker exposureswere site-specific, i.e., only data from that facility wereutilized and there was no assumed relationship in expo-sures between the sites.
Control subjects were selected from manufacturinglocations which did not use styrene or other known orsuspected olfactory toxicants and were located nearby forthree of the four study sites. Historic exposure recon-struction for the control subjects was limited to question-naire responses concerning past employment and paststyrene exposure; anyone indicating a history of styreneor other olfactory toxicant exposure was excluded fromthe study. Those not indicating such a history wereassumed to have no historic styrene exposure. At Site 2,control subjects were selected from persons employed bythe same company, but working at a location remote fromoperations involving styrene. Air monitoring was con-ducted and urine samples collected at Site 2 to confirmthe non-exposure status of the control population (seebelow).
For exposed subjects, styrene exposure reconstructionwas accomplished through the integration of personnelrecords indicating job history at the facility and historicexposure measurements from the same facility. A proto-col for the utilization of the existing data was developedand followed to provide a uniform approach to estimat-ing historic exposures. Historic exposure estimates werebased on historic measurements for the specified job titleand year. The arithmetic means of the air concentrationmeasurements fitting the specified facility-job title-yearcriteria were calculated and the arithmetic mean 8-hrTWA calculated. (Both 8-hr TWA samples and 4-hr TWAsamples, treated as an 8-hr TWA, were used to calculatehistoric exposures; the small number of 15 min peak sam-ples collected at two facilities were not used for this pur-pose.) Exposure estimates for facility-job title-year combi-nations without directly corresponding exposure datawere calculated according to the protocol using otherspecified similar job titles and/or exposure data fromother specified years, as appropriate. Similar job titleswere defined based on similarity of exposure levels and
were derived from exposure measurements, from inter-views with facility personnel, and from researcher obser-vations.
An exposure matrix based on job title and year wasdeveloped directly from the styrene monitoring data andfrom exposure estimates derived from the monitoringdata. A separate exposure matrix was developed for eachfacility.
Historic styrene exposures of the study subjects wereestimated by combining information from the exposurematrices and individual work histories derived fromemployment records. Based on a study subject’s job titlesand years of employment, annual average exposure esti-mates were selected from the appropriate cells of thefacility exposure matrix. If a worker changed job titleswithin a year, a weighted annual average exposure wascalculated based on the exposure estimates for those jobsheld during the year and the portion of the year that theywere held. In addition to estimates of annual meanstyrene exposure, lifetime cumulative styrene exposures(ppm-years) were calculated for each exposed subject bysumming the annual average exposure estimates over allyears exposed to styrene.
Although an attempt was made to avoid selecting sub-jects with a history of respirator use, 13 subjects who hadused respirators at some point in their employment histo-ry were included in the study population. Some of theseindividuals had ceased using respiratory protection priorto this study; several subjects were currently using respi-ratory protection. Since the overall purpose of the expo-sure assessment effort was to provide information for theevaluation of olfactory function tests on the workers, itwas necessary to determine the actual concentrations ofstyrene inhaled by the workers. It was, therefore, neces-sary to account for the (presumed) reduction in inhala-tion exposure while respiratory protection was in use.Exposures for job titles that were known to be associatedwith respirator use were calculated by dividing the mea-sured concentration of styrene in air by an arbitrary fac-tor of five to derive an ‘‘effective exposure’’ estimate.Although the respirator customarily used by this popula-tion has an assigned protection factor of ten, a protectionfactor of five was selected for the purposes of this studyto account for poorer fit due to assumed more lax historicfit-testing procedures and to account for work periodswhen the respirator was not worn.
The SIRC Review November 2006 61

ExpOSURE ASSESSmENT FOR STUDy OF OLFACTORy FUNCTION IN WORKERS ExpOSED TO STyRENE
IN ThE REINFORCED-pLASTICS INDUSTRy
RESULTS
Key descriptors of the exposure data used to reconstructhistoric exposures are presented in Table 2. Exposure-monitoring programs have been in place at Sites 1 and 2since the mid- to late-1980s. As a part of these programs,the exposures of individuals employed in higher expo-sure jobs are measured on an ongoing basis. The datafrom these sites consist primarily of 4- and 8-hr air sam-ples, which are statistically indistinguishable by job title,
and a limited number of 15 min samples (not used for cal-culations, but indicating higher peak concentrations).Data from Site 3 were also derived from a formal expo-sure-monitoring program similar to that in place in Sites1 and 2, but of smaller scale. Exposure data known tohave been collected between 1990 and 1996 at Site 3 couldnot be located. Exposures at Site 4 were estimated fromthe results of four plant-wide sampling surveys (threeconducted by the facility’s insurance carrier and one con-ducted by OSHA).
As described, these exposure data were consolidated
TABLE 2
Summary of Historic Exposure Measurements by Site
Measurement Parameter Site1 Site 2 Site 3 Site 4
Manufacturing method Spray/ Spray/ Sheet ‘‘press’’ Hand lay-up chopper gun chopper gun and die molding
Date of earliest measurement 5/25/1988 7/30/1987 7/19/1988 6/14/1994
Number of days with 579 472 41 4measurement
Total number of measurements 753a 644a 68 22
aIncludes 8-hr, 4-hr, and 15-min samples.
FIGURE 1
Frequency distribution of historic annual averageeffective styrene exposures of US study population(n=604*); *excludes values for three subjects withunclear dates in job history.
FIGURE 2
Frequency distribution of cumulative effective styreneexposures of US study population (n=49*); *excludes val-ues for three subjects with unclear dates in job history.
0 10 20 30 40 50 60 70 80
Annual Average Styrene Concentration (8 hour TWA; ppm)
Nu
mbe
r of
Per
son
-Yea
rs
200
150
100
50
0
1
0.8
0.6
0.4
0.2
0
mean = 12.6 ppmmedian = 12.0 ppm
Cu
mu
lati
ve P
rop
orti
on
The SIRC Review November 2006
0 50 100 150 200 250 300 350
Cumulative Styrene Exposure (8-hour TWA; ppm-years)
Nu
mbe
r of
Per
son
-Yea
rs
Cu
mu
lati
ve P
rop
orti
on
10
8
6
4
2
0
1
0.8
0.6
0.4
0.2
0
mean = 156 ppm-yearsmedian = 145 ppm-years

ExpOSURE ASSESSmENT FOR STUDy OF OLFACTORy FUNCTION IN WORKERS ExpOSED TO STyRENE
IN ThE REINFORCED-pLASTICS INDUSTRy
in exposure matrices developed for each facility andspecifying annual mean 8-hr TWA exposure by job titleand year. A summary of the exposure metrics used tointerpret the olfactory function findings [Dalton et al.,2003] is presented by site as Table 3. In addition, the dis-tribution of annual average historic exposures and thedistribution of cumulative historic exposures are present-ed as Figures 1 and 2, respectively.
ASSESSmENT OF CURRENT ExpOSURES
Methods
AirPersonal air samples were collected for each exposed sub-ject during the two shifts (one shift at Site 3) immediatelyprior to olfactory assessment. Personal and/or area sam-ples were collected for control subjects at Site 2 wheresubject proximity to manufacturing processes involvingstyrene, i.e., with a potential for inadvertent exposure,indicated a need to confirm their non-exposure status.Because olfactory testing was conducted at or near thefacilities studied, area samples were also collected in each
of the rooms used for olfactory assessment during test-ing. Duplicate air samples and field blanks were collectedthroughout the course of the exposure evaluation forquality control purposes.
Air samples were collected and analyzed in confor-mance with the National Institute for OccupationalSafety and Health (NIOSH) Method 1501 [NationalInstitute for Occupational Safety and Health, 1994] usingcoconut shell charcoal sorbent tubes and personal sam-pling pumps calibrated to a flow rate of 50–75 ml/min,depending on the anticipated concentration of styreneand shift length. After collection, sample tubes werecapped and stored in a cool environment prior to shipping.The samples were shipped and analyzed as a single batchusing gas chromatography with a flame ionization detec-tor. All chemical analyses were conducted by ClaytonEnvironmental Consultants (Novi, MI). This commerciallaboratory is fully accredited under the AmericanIndustrial Hygiene Association’s Industrial HygieneLaboratory Accreditation Program (IHLAP) for the gaschromatographic method used for analysis of thesestyrene samples.
The SIRC Review November 2006 63
TABLE 3
Summary of Respirator-Corrected Historic Exposure Estimates Used for Styrene Exposed Subjects by Study Site,
8-hr TWA*
Exposure parameter Site1 Site 2 Site 3 Site 4
Manufacturing method Spray/ Spray/ Sheet Hand lay-upchopper gun chopper gun ‘‘press’’ and die molding
Number of exposed subjects 11 13 16a 9
Person-years of observation 111 130 153 210
Number of job titles (total) 9 12 6 5
Mean annual exposure, all jobs (ppm) 17 13 16 7
Median annual exposure, all jobs (ppm) 16 12 16 7
Maximum annual exposure, all jobs (ppm) 55 41 77 18
Minimum annual exposure, all jobs (ppm) <1 <1 <1 <1
Mean cumulative exposure, all jobs (ppm-years) 170 132 157 170
Median cumulative exposure, all jobs (ppm-years) 145 122 131 176
Maximum cumulative exposure, all jobs (ppm-years) 313 289 310 328
Minimum cumulative exposure, all jobs (ppm-years) 20 30 52 52
*TWA, time weighted average.aThree exposed subjects (30 person-years) excluded from these analyses due to indeterminant job change dates.

ExpOSURE ASSESSmENT FOR STUDy OF OLFACTORy FUNCTION IN WORKERS ExpOSED TO STyRENE
IN ThE REINFORCED-pLASTICS INDUSTRy
Biological Pre- and post-shift urine samples were collected in con-junction with air sampling on the day before the olfactoryassessment. Paired urine samples were collected from allexposed study subjects. Urine samples were not collectedfrom unexposed controls with the exception of four con-trol subjects at Site 2 whose proximity to the manufactur-ing process suggested the need to confirm their non-exposed status. All samples were collected in 40-ml vialsand immediately frozen on dry ice. The samples wereshipped at the end of each week to the laboratory wherethey were kept frozen at –10˚C until analyzed. MA andPGA were analyzed by a method employing anionexchange chromatography with suppressed conductivitydetection derived from Murer et al. [1994]; creatinine wasanalyzed by a standard test kit based on a colorimetricspectroscopic method (IL Test Creatinine;Instrumentation Laboratory Company, Lexington, MA).All MA and PGA concentrations are reported as creati-nine-corrected concentrations. Approximately 20% of theurine samples were split for subsequent blinded dupli-cate analysis. All samples were analyzed as a single batchby National Medical Laboratories (Willow Grove, PA).
All exposed workers and control subjects providedinformed consent for their participation using a form that
was approved by the Committee on Human Research of theJohns Hopkins University School of Hygiene and PublicHealth (now the JHU Bloomberg School of Public Health)and by the Committee for Studies Involving Human Beingsof the University of Pennsylvania. Volunteers were advised
The SIRC Review November 200664
TABLE 4
Summary of Actual and RPE-Corrected Estimates of Styrene Exposure, 8-hr TWA
Parameter Site1 Site 2 Site 3 Site 4
Manufacturing method Spray/chopper Spray/chopper gun Sheet ‘‘press’’ Hand lay-up
and gun die molding
Samples (n) 22 31 24 22
Samples with RPE (n)a
10 2 3 0
Job titles (n) 9 12 6 5
Mean time (hr:min) 7:25 8:08 10:18 7:13
Concentration Actual Effectb Actual Effectb
Actual Effectb Actual Effectb
Mean (ppm) 55.0 24.1 18.2 13.9 16.8 14.8 9.2 9.2
Median (ppm) 35.2 24.8 7.4 7.4 13.5 12.0 6.4 6.4
Minimum (ppm) 11.6 4.9 0.1 0.1 3.4 2.7 3.9 3.9
Maximum (ppm) 140.3 45.1 92.7 45.1 50.9 50.9 28.1 28.12
aSamples collected on persons wearing respiratory protective equipment (RPE).bEffective exposure calculated by dividing air concentration by five for persons wearing RPE.
FIGURE 3
Distribution of current measured 8-hr time weightedaverage (TWA) effective styrene concentrations for USstudy population (n=99).
0 10 20 30 40 50
Styrene Concentration (8 hour TWA; ppm)
Nu
mbe
r of
Sam
ple
s
30
20
10
0
1
0.8
0.6
0.4
0.2
0
mean = 15.1 ppmmedian = 12.1 ppm
Cu
mu
lati
ve P
rop
orti
on

ExpOSURE ASSESSmENT FOR STUDy OF OLFACTORy FUNCTION IN WORKERS ExpOSED TO STyRENE
IN ThE REINFORCED-pLASTICS INDUSTRy
that they were free to withdraw at any time. Workers con-tinued to receive full wages during the period of data col-lection. The control subjects who participated on theirown time were compensated for their participation.
RESULTS
Air
The results of air sampling are summarized in Table 4 andthe distribution of air sampling results is presented asFigure 3. Note that in addition to all exposed subjects, theexposures of several additional persons are included ateach site. These samples were collected from persons whowere subsequently disqualified or otherwise excludedfrom olfactory portion of the study, but still representvalid measures to characterize the population’s exposure.Concentrations of styrene in air are presented as 8-hr timeweighted averages. Samples were collected over the entireworking period. At Sites 1, 2, and 4, the working periodcorresponded closely to 8 hr and the resulting TWA’s arenearly identical to actual measured concentrations. At Site3, the sampling and work period averaged approximately10 hr; the resulting 8-hr TWA is, therefore, proportionallylarger than the actual measured styrene concentrations.
Table 4 illustrates the effect of adjusting individualinhalation exposures to account for use of RPE. Asexplained earlier, this adjustment was required for inter-pretation of the olfactory testing results. For the mostpart, this adjustment affected only persons with the high-est exposures (more likely to wear RPE), but this was notalways so. At Site 1, styrene air concentrations were high-est, but RPE use was also greater than at other sites.Adjustment of air concentrations lowered ‘‘effective’’exposure most dramatically at Site 1, with smaller adjust-ments at Sites 2 and 3. Adjustment made mean and medi-an exposures more comparable across the sites.
Between-day variability of styrene concentrations wasmoderate. Although the data are not presented, the meanabsolute value of the differences in paired (same worker,same job) styrene air concentrations between day 1 andday 2 was 35.8%. On the other hand, the differencebetween the overall mean styrene concentrations for day1 and day 2 was only 1%. These differences indicate avery stable population mean exposure, while the variabil-ity in styrene exposure for an individual worker is mod-erate. Although not statistically significant, there was aslight tendency for day 2 concentrations to be higher thanday 1 concentrations.
Consistent with reports in the published literature,exposure of sprayers (Sites 1 and 2) was highest across alljob titles and sites, averaging approximately 100 ppm (job
title-specific exposure estimates not presented). Personswith this job title, however, were most likely to wear RPE,substantially reducing actual inhalation of styrene. AtSites 1 and 2 there was a wide range of air concentrationsof styrene across jobs; adjustment of exposures to accountfor RPE use made the range of exposures at these sitesmore homogeneous. Exposures at Site 3 were relativelyhomogeneous, averaging about 20 ppm, largely becausethe production process at this site was highly automated,eliminating the intense contact with styrene present in themore manual processes. At Site 4, exposures were uni-formly lower than at other sites, probably because ofgreatly reduced production, but still ranged up to 28 ppm.
Nineteen duplicate air samples collected at the foursites had a mean difference of 2.1% and a mean absolutedifference of 5.0%. This variability is well within the pub-lished expected variability of the sampling and analyticalmethod. A paired t-test showed means of the duplicatesnot to be statistically different.
Urinary Biomarkers of Exposure
Pre- and post-shift urine samples were collected from allof the exposed subjects on the day prior to olfactory test-ing; the results of urinalysis of the exposed workers aresummarized in Table 5. Urine samples were also collectedfrom the unexposed control subjects at Site 2. Con -centrations of styrene metabolites in all urine samplesfrom these control subjects were below the analytical limitsof detection (generally approximately 10–20 mg/g creati-nine for both MA and PGA, depending on the creatinineconcentration), confirming their non-exposure status.
Twenty-nine urine samples were split immediatelyafter collection and submitted for blinded analysis ofMA, PGA, and creatinine. Overall results showed excel-lent reproducibility. Examination of the creatinine con-centrations, however, showed clear outlier values for twoof the duplicate samples (423 vs. 3,238 and 1,000 vs. 1,803mg/ml). These values, in turn, affected the calculation ofcreatinine-corrected MA and PGA concentrations.Excluding these two outlier values, the mean absolutevalue of the differences between duplicate creatinineanalyses was 3.0%. The mean difference for MA analyseswas 4.1% and for PGA was 5.7%. Correlation coefficientsfor duplicate MA, PGA, and creatinine analyses werer2=0.99, 0.99, and 0.98, respectively. For both samplesexcluded from these analyses, the apparent outlier valueswere for the duplicate analyses. The primary samplesused for statistical analyses elsewhere were consistentwith the other primary samples for the study subjects.
The SIRC Review November 2006 65

ExpOSURE ASSESSmENT FOR STUDy OF OLFACTORy FUNCTION IN WORKERS ExpOSED TO STyRENE
IN ThE REINFORCED-pLASTICS INDUSTRy
DISCUSSION
Historic Exposures
Historic worker exposures reconstructed from plantrecords are fairly consistent with the results of previouslypublished studies, both in the magnitude of exposure andin the patterns of exposure between jobs. This strength-ens confidence in the methods used to estimate historicexposures and, importantly for the general applicabilityof the olfactory study, indicates that the sites chosen forstudy are fairly representative of the reinforced-plasticsindustry as a whole.
Both mean historic annual exposures and cumulativehistoric exposures conformed generally to the expectedlog-normal distribution. The mean annual respirator-cor-rected historic exposure of the 52 study subjects encom-passing 634 person-years of exposure, was 12.6 ± 10.4ppm, expressed as an 8-hr TWA. Mean exposures werevery consistent between Sites 1, 2, and 3, while the meanhistoric exposure at Site 4 was approximately half that ofthe other sites. Maximum exposures at Sites 1, 2, and 3were also similar, with Site 4 having a maximum exposureconcentration substantially less than half of that for theother sites. Mean cumulative exposures over the studysubjects’ working histories was 156 ± 80 ppm-years. As
opposed to the annual mean exposures, cumulative expo-sures were highly consistent across all sites. This resultedlargely from the coincidence of longer exposure durationat the site with the lowest exposure and vice versa. Whencompared to olfactory testing results, however, this differ-ence better allowed for the examination of a possible dose-rate effect.
Current Exposures The results of air sampling undertaken immediately priorto testing of subjects’ olfactory function indicate styreneexposures generally consistent with those estimated fromhistoric records. Taken as a whole, the exposure measuresand estimates indicate fairly consistent exposure overtime, at least for the last 15 years. Because an estimate ofactual inhalation exposure was required for the purposesof the olfactory testing, for the several subjects who worerespirators during air sampling, exposures presented inthis paper are reduced to account for the reduction inexposure attributable to the respirator. The mean expo-sure reported in this paper, 15.1 ppm, therefore, under-states actual air concentrations of styrene. Actual styreneconcentrations measured (n=99) exceeded the current 20ppm TLV in 39% of the samples, exceeded the current 50ppm OSHA consent level in 11% of the samples, and
The SIRC Review November 200666
TABLE 5
Summary of Pre- and Post-Shift Creatinine-Corrected Urinary Metabolite Concentrations (mg/g creatinine) in Styrene
Exposed Workers
Site1 Site 2 Site 3 Site 4
Analyte and concentration Pre Post Pre Post Pre Post Pre Post
Samples (n) 11 11 13 13 19 19 9 9
MA (mean) 210 1,740 90 320 80 260 30 190
MA (median) 190 670 40 100 60 210 30 150
MA (min) 20 200 <10 <10 <10 <10 <10 50
MA (max) 510 6,980 390 1,020 170 1,040 90 350
PGA (mean) 130 490 60 90 60 80 30 90
PGA (median) 90 160 50 60 40 60 30 70
PGA (min) 40 80 <10 <10 <10 <10 <10 20
PGA (max) 470 2,250 270 290 210 370 120 210
Manufacturing method Spray/chopper gun Spray/chopper gun Sheet ‘‘press’’ Hand lay-up and die molding
MA, mandelic acid; PGA, phenylglyoxylic acid.

ExpOSURE ASSESSmENT FOR STUDy OF OLFACTORy FUNCTION IN WORKERS ExpOSED TO STyRENE
IN ThE REINFORCED-pLASTICS INDUSTRy
exceeded the current 100 ppm PEL in 4% of the samples.As expected, urinary metabolite concentrations showed
a consistent increase between pre-shift and post-shiftsamples. In all cases, mean MA and PGA concentrationswere substantially higher than the corresponding medianvalue, indicating a skewed distribution with high valuescharacteristic of the expected log-normal distribution.Measures of urinary metabolite concentration indicateroughly comparable styrene exposures at Sites 2, 3, and 4.Based on urinary metabolite measures, exposures at Site1 appear to be substantially higher than at the other sites.At Site 1, the mean and median metabolite values arestrongly influenced by a substantial number of very highvalues. Mean post-shift MA and PGA concentrations atSite 1 exceed the recommended BEI’s; the correspondingvalues at Sites 2, 3, and 4 are well below the BEI’s,although single maximum values at Sites 2 and 3 exceedthe BEI’s. Combined urinary metabolite concentrations(MA+PGA) exceeded the BAT at Site 1 only.
MA and PGA urinary biomarkers of exposure werefound to be highly correlated with measured air concen-trations (r2=0.78 for log MA concentration vs. log styreneconcentration and r2=0.51 for log PGA concentration vs.log styrene concentration). Persons wearing RPE were
omitted from this analy-sis. These correlationsconfirm for this popula-tion the previouslyreported conclusion[Ramsay et al., 1980;Pezzagno et al., 1985;Guillemin and Berode,1988] that MA and PGAare good predictors ofrecent exposure as mea-sured by air concentra-tion of styrene. There is,unfortunately, no bio-marker of long-term(months or years) styreneexposure.
Figure 4 presents therelationship between(log) air styrene concen-tration and (log) sum ofurinary MA and PGAconcentrations. As above,the four persons wearingRPE are excluded fromthe calculation of theregression coefficient.
The correlation coefficient (r2=0.75) for this analysis iscomparable to that for MA and substantially better thanthat for PGA individually. This difference may be a func-tion of the different kinetics of metabolism for MA andPGA and the timing of sample collection. In addition,Figure 4 presents the data points representing the fourpersons wearing RPE. As expected, the points for two ofthese individuals fall below the regression line, indicatingthe protective effect (i.e., metabolite concentration lessthan expected for a given air concentration of styrene) ofwearing RPE. Interestingly, the MA+PGA concentrationfalls on the regression line for the other two individuals,indicating little, if any, protective effect from wearingRPE.
The use of respirators was not a major factor in expo-sure measurement or estimation except for Site 1. Becauseof a variety of factors, nearly half of the workers tested atSite 1 wore RPE during their work shift. Actual inhalationexposures were estimated for use in interpretation of theolfactory test results based on the division of styrene airconcentrations by an arbitrary factor of five. The appar-ent disparity between estimated RPE-corrected exposuresand metabolite concentrations at Site 1 suggests that, onaverage, the respiratory protection factor may not be as
The SIRC Review November 2006 67
FIGURE 4
Relationship between airborne styrene and post-shift urinary metabolite concentrationsby worker respirator use status for US study population.
0 0.5 1.0 1.5 2.0 2.5
log (8-hour TWA styrene concentration): ppm
log
(MA
+P
GA
con
cs.)
; mg/
g cr
eati
nin
e
4
3
2
1
Workers without respirators (n’=48)Workers with respirators (n’=4)Linear (Workers without respirators (n’=48))

ExpOSURE ASSESSmENT FOR STUDy OF OLFACTORy FUNCTION IN WORKERS ExpOSED TO STyRENE
IN ThE REINFORCED-pLASTICS INDUSTRy
high as assumed. At the very least, it is apparent thatthere may be a wide range of respiratory protection factors(and resultant effective exposures) across individuals,suggesting possible mis-assignment of effective expo-sures for at least a few workers.
CONCLUSIONS
The historic and current estimates of styrene exposurewere consistent with each other and consistent with otherpublished reports. Historic exposures were generallyconsistent across the four study sites, while there wereindications from both air sampling and urinary metabo-lite measures that current exposures at Site 1 are some-what higher than at the other three sites. While the respi-rator-adjusted population mean exposure wasapproximately 13 ppm, the overall range of exposuresstudied (1–28 ppm) was consistent with the primaryobjectives of population selection for the olfactory studyand provided a range of current and historic exposuresagainst which the olfactory function testing results couldbe evaluated.
A thorough understanding of subject exposure is cru-cial to the interpretation and understanding of observedhealth outcomes in general, and specifically with referenceto this study, to the interpretation of olfactory function.The addition of quantitative measures of exposure allowsthe quantitative determination of an exposure–responserelationship between exposure and disease. This is animportant addition in that, unlike other measures ofexposure common to epidemiologic studies, it is directlyuseful for risk analysis and regulatory purposes.Quantitative assessment of subject exposure is essentialto this understanding and should be a standard part ofsuch studies.Without quantitative measures of exposure,findings and conclusions are of limited usefulness. Theuse of exposure information in this manner is critical forthe development of defensible assessments of the risk ofexposure to occupational and environmental agents and,in turn, to the standards setting process.
REFERENCES
American Conference of Governmental IndustrialHygienists. 1996. Supplements to the sixth edition of doc-umentation of threshold limit values and biological expo-sure indices: BEI for styrene. American Conference ofGovernmental Industrial Hygienists.Cincinnati, OH.
American Conference of Governmental IndustrialHygienists. 1997. Documentation of threshold limit val-ues and biological exposure indices: TLV for styrene.American Conference of Governmental IndustrialHygienists. Cincinnati, OH.
Amoore JE, Hautala E. 1983. Odor as an aid to chemicalsafety: Odor thresholds compared with threshold limitvalues and volatilities for 214 industrial chemicals in airand water dilution. J Appl Toxicol 3(6): 272–290.
Andersson IM, Rosen G, Sturm M,Wielaard P. 1994.Styrene emission and occupational exposure in hand lay-up moulding of glass fibre using two types of polyester.Occup Hyg 1:207–217.
Berode M, Droz P-O, Guillemin M. 1985. Human expo-sure to styrene; VI. Percutaneous absorption in humanvolunteers. Int Arch Occup Environ Health 55:331–336.
Brooks SM, Anderson L, Emmett E, Carson A, Tsay JY,Elia V, Buncher R, Karbowsky R. 1980. The effects of pro-tective equipment on styrene exposure in workers in thereinforced plastics industry. Arch Environ Health35(5):287–294.
Chemical and Engineering News. 2000. Production:Gains beat losses p 50–56.
Crandall MD, Hartle RW. 1985. An analysis of exposureto styrene in the reinforced plastics boat-making industry.Am J Ind Med 8:183–192.
Dalton P, Cowart B, Dilks D, Gould M, Lees P, StefaniakA, Emmett E. 2003. Olfactory function in workersexposed to styrene in the reinforced-plastics industry. AmJ Ind Med 44:1–11 (this issue).
Deutsche Forschungsgemeinschaft Commission for theInvestigation of Health Hazards of ChemicalCompounds in the Work Area. 2000.
List of MAK and BAT values: Maximum concentrationsand biological tolerance values at the workplace. ReportNo. 36. Weinheim: Wiley–VCH.
Guillemin MP, Berode M. 1988. Biological monitoring ofstyrene: A review. Am Ind Hyg Assoc J 49(10):497–505.
The SIRC Review November 200668

ExpOSURE ASSESSmENT FOR STUDy OF OLFACTORy FUNCTION IN WORKERS ExpOSED TO STyRENE
IN ThE REINFORCED-pLASTICS INDUSTRy
Ikeda M, Koizumi A, Miyasaka M, Watanabe T. 1982.Styrene exposure and biologic monitoring in FRP boatproduction plants. Int Arch Occup Environ Health49:325–339.
LeMasters GK, Carson A, Samuels SJ. 1985. Occupationalstyrene exposure for twelve product categories in thereinforced-plastics industry. Am Ind Hyg Assoc J46(8):434–441.
Murer AJ, Christenson JM, Midtgaard T. 1994.Determination of the urinary metabolites of styrene:Estimation of the method evaluation function and evalu-ation of reference values in Danish subjects. Int ArchOccup Environ Health 65(5):313–318.
National Institute for Occupational Safety and Health.1994. NIOSH manual of analytical methods. 4th edition.DHHS (NIOSH) Publication No. 94–113.
Nylander-French LA, Kupper KK, Rappaport SM. 1999.An investigation of factors contributing to styrene andstyrene-7,8-oxide exposures in the reinforced-plasticsindustry. Ann Occup Hyg 43(2):99–109.
Occupational Safety and Health Administration. 1996.New Release USDL. 96-77.
Occupational Safety and Health Administration. 2000. 29CFR 1910.1000, Table Z-2.
Petreas MX, Woodlee J, Becker CE, Rappaport SM. 1995.Retention of styrene following controlled exposure toconstant and fluctuating air concentrations. Int ArchOccup Environ Health 67: 27–34.
Pezzagno G, Ghittori G, Imbriani M, Capodaglio E. 1985.Urinary elimination of styrene in experimental and occu-pational exposure. Scand J Work Environ Health11:371–379.
Ramsay JC, Young JD, Karbowski RJ, Chenweth MB,McCarthy LP, Braun WH. 1980. Pharmokinetics ofinhaled styrene in human volunteers. Tox Applied Pharm53:54–63.
Schumacher RL, Breysse PA, Carlyon WR, Hibbard RP,Kleinman GD. 1981. Styrene exposure in the fiberglassfabrication industry in Washington state. Am Ind HygAssoc J 42(2):143–149.
Stewart RD, Dodd HC, Baretta ED, Schaffer AW. 1968.Human exposure to styrene vapor. Arch Environ Health16:656–662.
Strong AB. 1989. Fundamentals of composites manufac-turing; materials, methods, and applications. Dearborn,MI: Society of Manufacturing Engineers.
Wieczorek H. 1985. Evaluation of low exposure tostyrene; II. Dermal absorption of styrene vapours inhumans under experimental conditions. Int Arch OccupEnviron Health 57:71–75.
The SIRC Review November 2006 69

PART 2

The SIrc review November 200670
Neuropsychological Effects of Styrene Exposure:
review of Literature Published 1990 – 2003rEPorT To THE STyrENE INForMATIoN ANd rESEArcH cENTEr
Leyla Bagirzadeh, Jeremy Beach, Nicola Cherry, Department of Public Health Sciences, University of Alberta.
Studies published since
1990 are, in general, of
high quality and avoid
many of the pitfalls of
the earlier studies of
neurobehavioral effects.
the conclusions drawn
by the authors are
usually appropriately
modest and point to the
relatively slight effects
that can be attributed to
styrene in the
populations studied.
PA r T I
Critical Review of Studiessince 1990
IntRoduCtIon
Following a literature search conducted byLeyla Bagirzadeh, 20 papers relevant to theeffects of styrene on the human nervoussystem and published since 1990 werelocated. These excluded effects on the visu-al and auditory systems as these were to becovered in other reviews, but includedstudies of mortality from diseases of thenervous system (3) and of neurochemicalfunctioning (3). The remaining 14 papershad as outcomes neurophysiological mea-sures, including EEG, somatosensoryevoked potentials and nerve conductionstudies (4), neurobehavioural testing (8) orsymptoms only (2). Two studies reportedresults in more than 1 paper and these areconsidered together in the reviewsattached.
The format of each review reflects somecommon difficulties in interpreting thesestudies. Having described the aim, design,subjects and outcome measures in eachstudy, the question of exposure then meritsa separate paragraph. This is for at least 3reasons. First, given that the main interestof the review is the effects of styrene at thelower levels found since 1990, it is impor-tant to recognise that many of the studies
include workers exposed in previousdecades when exposures will have beenmuch higher. Second, for all studies exceptperhaps for mortality and neurophysiolog-ical changes, it is important to distinguishbetween effects resulting from acute expo-sure (which may not reverse completelyduring a weekend break) and those thatmay be attributed to repeated exposureover many years (and which may not bereversible). Third, studies differ in theirascertainment of exposure. While urinarymetabolites will reflect individual workhabits and exposures and as such are idealfor investigation of dose-response relation-ships, if there are important differences inmetabolism then results from such analysismay be difficult to extrapolate to exposurestandards expressed in respirable concen-trations. The role of PPE, important inexposure assessment, is only mentioned(and then in passing) in a handful of thesepapers. Although efforts are made in Part 1of this report to interpret the data in termsof a ‘no effect’ level, only one paper explic-itly analyses data in this way.
The paragraph on exposure is immedi-ately followed by ones outlining the statis-tical methods used and the broad resultsobtained. This is followed by a paragraphon confounding and on the extent to whichattempts have been made — and with whatsuccess — to allow for this. Many of theearly studies, and some included here,gave inadequate thought to issues of studydesign that would increase the internalvalidity of the report. The final two para-

neuRopSyChologICal effeCtS of StyRene expoSuRe:
RevIew of lIteRatuRe publIShed 1990 – 2003
graphs of each review report briefly the authors’ mainconclusions and those of the reviewers.
Although there are issues of validity and interpreta-tion that are common to most of the studies reviewed,their relative importance differs with the design and out-come used. The overview that follows considers in turnthe 4 main outcomes outlined above. Within each sectionstudies are considered in order of publication date, theearliest study being discussed first.
1.0 MoRtalIty
1.1 Three studies have been reported, from denmark(Kolstad et al. 1995), from the European styrene cohort(Welp et al. 1996) and from the US cohort (Wong andTrent, 1999). This review considers only deaths from dis-eases of the nervous system, although each of the 3papers considered other outcomes also.
The pattern of results from the papers is inconclusive.The danish study, published first, drew appropriateattention to an apparent increased risk of neurodegenera-tive diseases, based on a small number of deaths.Subsequent analysis of the European cohort producedresults that were consistent with the danish study but itis not clear that the 2 were independent. The danishstudy was based on workers from 386 reinforced plasticcompanies. The European cohort included 287 danishplants. In discussion of this latter paper, Wong and Trentreport that the excess of deaths from nervous system dis-ease was seen particularly in the danish workers and wasnot evident in those from the UK, the next largest groupin this European cohort. The analysis of the US cohortshowed no evidence of any excess although little detailwas given of the internal analysis which had proved par-ticularly useful in the danish and European cohorts. Ineach of the 3 reports, no excess of nervous system diseasewas seen in comparison to external referent groups.
A number of comments can be made about the ade-quacy of these 3 studies to identify any underlying risk ofdegenerative nervous system disease associated withstyrene exposure. First, all 3 cohorts are young, with fewdeaths reported. It remains plausible that exposure tostyrene, as with other solvents, may contribute to disor-ders of the central nervous system that become apparentmuch later in life. Second, mortality is a very crude indi-cation of nervous system degeneration. Third, shouldfurther follow-up be carried out on 1 or more of thesecohorts, and an excess of degenerative disease of the ner-vous system found, the absence of information onlifestyle confounders, particularly alcohol, may compli-cate interpretation.
1.2 Implications for Assessment of “No Effect”All 3 cohorts included subjects who were employed dur-ing periods (certainly before 1970 and perhaps later)where exposures may well have exceeded current limitvalues. Given that no consistent effect has been observed,extrapolation is difficult.
2.0 neuRophySIologICal MeaSuReS
2.1 Five papers were reviewed under this heading. 1)Matikainen et al. (1993) examined EEG, 2) Murata et al(1991) and Stetkarova et al. (1993) used somatosensoryevoked potentials, 3) Pierce et al. (1998) measured theP300 auditory event related evoked potential and 4)Murata et al. (1991) and yuasa et al. (1993) measuredperipheral nerve conduction parameters. Murata et al.(1991) also interpreted variation in r-r interval from elec-trocardiograph traces as a measure of autonomic nervoussystem function.
This group of studies is somewhat difficult to review.The approach is valuable, in that it provides measures ofnervous system function that are independent of the levelof collaboration of the subject. The body of evidence onneurotoxicity also suggest that, with the possible excep-tion of EEG recordings, any effects seen are not likely torepresent simply acute effects that may be reversiblewithin hours. The five groups reporting, two from Japan,and one each from Finland, czechoslovakia and theUnited States, come from institutes with a good experi-ence in work of this sort.
The results, however, give a mixed picture of the toxic-ity of styrene. The evaluation of EEG in a group of 100workers, chosen in ways not specified, found no excess ofabnormal EEG on visual assessment but, using an auto-mated analysis, found that the group with the highestcumulative exposure had an excess of recordings judgedabnormal and an increase in total EEG power in the a andb bands, particularly in the frontal and temporal regionsof the brain.
Two studies measured somato-sensory evoked poten-tials. The results reported by Murata et al. (1991) showedno significant differences in somato-sensory evokedpotentials between the exposed and comparison groups.In contrast, the results from Stetkarova et al. (1993)appeared to show slowing in central conduction time andprolonged latency of cortical evoked potentials in thestyrene exposed group. Pierce et al. (1998) found nochange in auditory evoked potential in 44 healthy volun-teers exposed to styrene in an exposure chamber.
The study by Murata et al. (1991) reported a reducedr-r coefficient of variation in the exposed, which they
The SIrc review November 2006 71

neuRopSyChologICal effeCtS of StyRene expoSuRe:
RevIew of lIteRatuRe publIShed 1990 – 2003
interpreted as a significant change in the autonomic ner-vous system in the styrene exposed group.
A number of studies have also measured peripheralnerve conduction as a possible marker of styrene toxicity.Murata et al. (1991) reported significant slowing of senso-ry conduction velocity but not of motor conduction in themedian nerve. In contrast, yuasa et al. (1996) reported agreater (and significant) slowing of motor rather than sen-sory conduction in the ulnar nerve, with significant slow-ing also in the peroneal (motor) nerves but not in the sural(sensory) nerve. Stetkarova et al. (1993) also reported thatperipheral conduction velocity was slower in styreneexposed workers compared to a comparison group onstimulation of both the median and tibial nerves.
on balance, the results of these studies do suggestsome minor electro-physiological differences between theexposed and comparison groups. While it might be thatmeasurement of confounders was imperfect or incom-plete, this seems unlikely to fully explain the differencesand bias, in selection of subjects or in observation orreporting, also seems an insufficient explanation. A realdifficulty does arise from the number of measures taken,which might be expected to lead to some positive resultsfrom chance variation. In addition there may also be adegree of publication bias in that papers without at leastone positive finding fail to reach the journals. However,although effects are probably real, they are not entirelyconsistent and the clinical significance is questionable.All subjects appeared to be healthy workers.
2.2 Implication for Assessment of “No Effects”The results discussed here may be of little clinical signifi-cance but, particularly in relation to nerve conductionstudies, are consistent with some earlier observations. Allthe studies, however, contain subjects with a history ofhigh past exposures. Since effects on the peripheral ner-vous system are assumed to reflect chronic exposures,with uncertain reversibility in the absence of completecessation of exposure, the relation of these studies to cur-rent low exposures is unclear.
3.0 behavIouRal teStIng
3.1.1 cross shift design (acute effects)Two studies involving exposure of subjects under experi-mental conditions were identified. Pierce et al. (1998)observed no effect of styrene exposure on a digit recogni-tion test. Ska et al. (2003) similarly reported no effect on anumber of tests including simple reaction time and sym-bol digit matching.
Three studies considered cross shift (acute) effects.
Letz and colleagues (1990) found no relation betweenexposure during the shift and scores on the continuousperformance test (of complex reaction time) or on a test ofhand-eye performance. Scores on the symbol digit test atend of shift were related to styrene in air corrected forrespirator use (by a method not specified) and to urinarymandelic acid. Although the data are not presented, itappears that those exposed to >50 ppm have the lowestsymbol digit scores. Jegaden and colleagues (1993) con-ducted a similar study in a French naval shipyard. Theanalysis across shift was not reported adequately butthere appears to have been no significant differencebetween changes across the shift in the exposed and com-parison groups. Significant pre (and post) shift differ-ences were observed which the authors interpret aschronic effects but could equally reflect either inadequateadjustment for confounding or incomplete clearance ofstyrene and its metabolites from the previous day’s expo-sure. Edling and colleagues (1993) found no change intest score over shift between the exposed and comparisongroups but within the exposed group there was a relationbetween complex reaction time and various measures ofexposure during the shift including eight hour timeweighted average. No effect was seen on the symbol digittest, the only test found by Letz and colleagues (1990) tohave an exposure-related cross shift change.
on balance, and in light of previous studies, it seemslikely that small differences are detectable across shift intest scores of workers exposed to styrene at levels found10-15 years ago. Such changes are not seen with experi-mental short exposures to relatively low concentrations.
3.1.2 Implications for Assessment of “No Effect” Letz explicitly says that most of the effects are found inthose exposed to more than 50 ppm on the day (this datais not presented). Jegaden and colleagues measuredexposure on the day of testing and the highest level ofconcentration was 55 ppm with a mean of 23 ppm; nonotable cross shift effects were found. Edling’s exposureswere very low (8.6 ppm on average and nobody exposedto more than 15.4 ppm). He was, however, able to measureexcursions greater than 50 ppm and found that greaternumber and duration of excursions above 50 ppm wererelated to poor scores on the complex reaction time test.Taken together these three surveys do suggest that at theexposures below 50 ppm, and without excursions abovethis level, cross shift change in test score may not bedetectable using current techniques.
3.2.1 reversibility on reduction or removal of Exposureonly two studies reported the effects of reducing or
The SIrc review November 200672

neuRopSyChologICal effeCtS of StyRene expoSuRe:
RevIew of lIteRatuRe publIShed 1990 – 2003
removing exposure on behavioural test scores. These wereMergler et al. (1996) and, debatably, Viaene et al. (1998and 2001). The study reported by Mergler and colleaguesis particularly interesting. In this, three workplaces wereassessed and baseline measurements made of scores ofperformance on neurobehavioural tests. Two years laterthe exposure and neurobehavioural tests were repeated,following interventions at one of the three companies toimprove working conditions. The overall exposures werelow and did not change essentially but it appears thatthose whose mandelic acid concentrations increased overtime did worse on the second occasions, and importantly,those whose mandelic acid concentrations were reduceddid better on at least some tests. This study has a numberof weaknesses (see the detailed comments in Part II) butthe design is extremely attractive. In contrast the studyreported by Viaene and colleagues (1988 and 2001) hassuch a weak design that it is not possible to draw anyconclusions about the reversibility of effects. The authorswould appear to deduce that the better test scores seenfor people laid off three years earlier would reflect such areversal, but no baseline data are available.
3.2.2 Implications for Assessment of “No Effect”Both these studies involve workers exposed to relativelylow levels of styrene, certainly less, on average, than 50ppm. For different reasons, discussed in the detailedcomments, neither can provide good data on which toreach conclusions.
3.3.1 cross Sectional Studies of Neurobehavioural Effectsonly one study, that of Tsai and chen (1990) fromTaiwan, was found that presented simply cross sectionaldata comparing behavioural tests in an exposed groupand a non-exposed comparison group. This study usedan internal comparison group of workers from within thesame six manufacturing plants in Taiwan and informa-tion given on potential confounders suggesting they werein fact very well matched. This rather thorough study, inplants where the mean concentration was 22 ppm, foundworse performance on the continuous performance test(of complex reaction time test) and on vibration percep-tion where the threshold was high in both the hand andfoot for the exposed. The duration of employment was8.3 years and it is not clear whether high levels of expo-sure had pertained in the past.
Three studies already mentioned could also be inter-preted as contributing to this design. In the study of neu-rophysiological changes reported by Murata there was asecond paper, by yokoyama and colleagues (1992), whichincluded information on neurobehavioural testing. In this
study of 12 styrene exposed workers and 11 non-exposedsteel workers, the exposed workers had a mean durationof exposure of 5 years and current exposure of around 26ppm with a maximum eight hour TWA of 77 ppm. It isnot known whether there had been higher exposures inthe past. In comparison to the comparison group theexposed workers did less well on the picture completiontest but there was no difference in scores on the digitsymbol test. It does not appear that the comparisongroup was particularly well matched, but statisticaladjustment for confounders was attempted. The Jegadenstudy (1993) has been discussed. Here the exposed groupdid significantly worse than the comparison group on atest of simple reaction time, complex reaction time anddigit span. The authors suggest this was likely a result ofchronic exposure. In the preceding year, mean exposureshad been approximately 30 ppm with perhaps 20% ofexposures more than 50 ppm. There are, however, a num-ber of difficulties in interpretation of this study. Finally inthis section, Viaene and colleagues (2001) comparedscores of the currently exposed and the previouslyexposed with a comparison group of never exposed. Thescores on the symbol digit substitution and digit span for-ward test appeared to be worse than those who had beenexposed to styrene.
3.2.2 Implications for Assessment of “No Effect”Because of the difficulties in interpreting such studies ofchronic effects with an external comparison group, rigor-ously conducted negative studies are likely to be moreconvincing of a “no effect” level than positive studieswhere the adequacy of adjustment for confounding orresidual effects are in question. of these four studies. theTsai and chen (1996) study is perhaps most convincingbut it is impossible to say whether the observed effects onthe continuous performance test and on vibration percep-tion threshold reflect current exposures of around 22 pmor past exposures that may have been considerably higher.
4.1 neuRoCheMICal funCtIonIng
Three studies have been published. checkoway et al.(1992), Bergamaschi et al. (1996) and Bergamaschi et al.(1997) looked at the interrelationship between styreneexposure, markers of neurochemical function, particular-ly Type B monoamine oxidase (MAo-B), dopamine-b-hydroxylase (dBH) and prolactin. checkoway et al. (1992)looked also at serotonin and sigma receptor activity andconcluded that monoamine oxidase B might be a usefulmarker or even an intermediate step between styreneexposure and cNS neurotoxicity. In this study MAo-B
The SIrc review November 2006 73

neuRopSyChologICal effeCtS of StyRene expoSuRe:
RevIew of lIteRatuRe publIShed 1990 – 2003
activity and cNS symptoms were correlated.Bergamaschi and colleagues in a first study published in1996 attempted to reproduce the MAo-B effect and alsomeasured dBH and prolactin. They failed to demonstrateany very convincing differences between exposed work-ers and the comparison group on MAo-B, although thiswas significantly depressed in those with higher expo-sure (>25 ppm). dBH activity was decreased in thestyrene exposed and prolactin increased in both men andwomen. A second paper by this group, Bergamaschi et al.(1997), presumably—but not certainly—had no overlapin subjects with those in the earlier paper. They found nodifference between exposed workers and the comparisongroup on either dBH or MAo-B although prolactin levelswere higher in styrene exposed workers. reported symp-toms were similar in the exposed and non-exposedgroups but within the exposed group dBH was negative-ly related to the number of reported symptoms.
These studies are all interesting but interpretation ofresults is difficult and their importance in the under-standing of styrene neurotoxicity has yet to be estab-lished. In comparing exposed to a non-exposed compari-son group the problems of unmeasured confounding issubstantial because the relevant confounders areunknown.
4.2 Implications for Assessment of “No Effect”These studies do not, in their measurement of neuro-chemicals, contribute yet to this discussion.
5.1 StudIeS of SyMptoMS
Two studies, those of Geuskens et al. (1992) andchallenor and Wright (2000) use symptoms as the onlyoutcome considered. Many of the other papers, however,also report symptom data and the most relevant of theseare included in this discussion.
Geuskens et al. (1992) carried out a study to assess fac-tors affecting exposure levels in large and small factoriesusing styrene in the Netherlands. As part of that investi-gation, they included a symptom questionnaire whichthey had also used with a non-exposed population foranother study. details of this comparison group are notgiven. The hygiene assessment suggested that althoughthe daily concentrations of styrene measured did notexceed 100 ppm generally, there was a substantial risk ofdoing so during some of the processes and peak expo-sures up to 1200 mg/m3 were seen. In the comparison ofsymptoms a group which they labeled as “irritation”,including outcomes such as feelings of depression, andone labeled “pre-narcotic” were higher in the exposed
The SIrc review November 200674
workers. This study was not reported in sufficient detailto allow conclusions to be drawn about the validity ofascribing the excess symptoms to exposure.
challenor and Wright (2000) chose to look only at theaggression scale of the Profile of Mood States. They com-pared exposed workers with an internal group of unex-posed workers. With exposures up to about 66 ppm,styrene exposed workers, particularly those in the firstfew years at work, were more likely to have higheraggression scores than the comparison group.
Ten of the other studies report symptom data. of thesesome were little more than clinical reports on the exposedworkers while others used inappropriate measures (forexample a measure of long standing personality ratherthan present state). Amongst those using appropriate andestablished questionnaires, the most frequent were theSwedish Q16 solvent questionnaire and the Profile ofMood States. In general the data are more convincing ifthey relate to changes within individual across time(Edling et al. (1993) Mergler et al. (1996)) or in a dose-response analysis comparing less exposed to the morehighly exposed such as those of Matikainen et al. (1993)and checkoway et al. (1992). No study in this groupattempted to use questions designed to look at subtlechanges over the course of a shift. Edling et al. (1993) didlook at questions of acute irritation and found them relat-ed to exposure parameters but with no difference in thebefore and after shift responses. Ska et al. (2003) reportedno change in mood or symptoms following experimentalexposure with peaks to 100 ppm.
Although there is some variability in results, almostall the field studies did find a relation between exposureand symptoms. Three are of particular interest in dis-cussing a “no effect” level. Edling et al. (1993) examined agroup for whom the eight hour time weighted averagewas 8.6 ppm and found that exposed men reported moreacute symptoms and more symptoms using the Q16questionnaire, particularly of tiredness and headache. Healso noted that the number of symptoms reported by theexposed men reduced when the Q16 was repeated after abreak for the summer holiday, although this differencewas not statistically significant. The change in number ofsymptoms between the beginning and end of shift wasrelated to the 8 hr TWA for styrene. The authors conclud-ed, and this seems reasonable, that exposures below 20ppm produced, in their sample, an increased number ofsymptoms.
Tsai and chen (1996), however, using Q16 and the pro-file of mood states in a cross sectional study, but withwell matched internal controls, found no acute or chronicsymptom significantly affected by exposure to styrene in

neuRopSyChologICal effeCtS of StyRene expoSuRe:
RevIew of lIteRatuRe publIShed 1990 – 2003
a study where the mean concentration was 22 ppm. Therange of concentrations included values of up to 181 ppmas an 8 hr TWA. This study adapted the profile of moodstates to be more relevant to the chinese culture and onthe three scales used no difference was seen. other stud-ies demonstrating a dose response relationship includedMatikainen et al. (1993), Mergler et al. (1990) andBergamaschi et al. (1997). Negative results were found byyuasa et al. (1993) and Viaene et al. (2001).
on balance, the stronger study designs did tend tofind that symptom reporting was related to exposureeven at relatively low levels.
5.2 Implications for Assessment of “No Effect”In the studies reported here many of the exposed subjectshad worked at much higher levels than those measuredon the day of testing. It is frequently not clear whetherthe worker is reporting current symptoms or symptomsever experienced. In assessing the studies with clearlydescribed methods, the study of Edling et al. (1993) isparticularly of interest. It demonstrated a higher numberof symptoms with higher concentration of styrene in thebreathing zone (driven in part by two high symptomscores at around 12 ppm of exposure) but also data onexcursions above 50 ppm related to skin irritation andunpleasant taste. These findings suggest that althoughTWA exposures may be kept below levels at which symp-toms generally occur, peak exposures may still contributeto discomfort, if not necessarily to long term changes inneuropsychological health.
oveRall ConCluSIon
Studies published since 1990 are, in general, of high qual-ity and avoid many of the pitfalls of the earlier studies ofneurobehavioral effects. The conclusions drawn by theauthors are usually appropriately modest and point tothe relatively slight effects that can be attributed tostyrene in the populations studied. Nevertheless the con-clusion is unavoidable that styrene has the potential tocause unpleasant symptoms, and probably changes intest performance, at levels of exposure close to 50ppmand that it should be treated as a potentially harmful sub-stance that merits best preventative practice. None of thestudies reviewed adequately addresses the question ofdebilitating illness in the elderly population of workersexposed to styrene over many years and this importantquestion—for public health if not for regulatory and com-pensation agencies—remains to be answered.
PA r T I I
Review of Individual Studies
Bergamaschi E, Mutti A, Cavazzini S. et al.
Peripheral markers ofneurochemical effects among
styrene-exposed workers. Neurotoxicology 1996; 17:753-760.
aIM
MAo-B, dopamine-b-hydroxolase (dBH) and prolactin(PrL) were measured to evaluate possible changes in bio-chemical events in the central nervous system in workersoccupationally exposed to styrene.
deSIgn
This was a cross-sectional study using 53 workers from anumber of factories manufacturing fibreglass and rein-forced plastics and a comparison group of 60 non-exposed workers from other industries in the same area.
expoSuRe
Ambient monitoring suggested exposure from 5 to 100ppm in exposed groups. Exposed workers had beenemployed for an average of 9.3 years (range from 1-22years). Urinary metabolites (mandelic acid and phenyl-glyoxidic acid) were measured in a spot urine sample col-lected 15 hours after last exposure.
outCoMe
A blood sample was drawn 15 hours after last exposureand used to determine dBH activity, MAo-B activity, andprolactin. These assessments were made for both exposedand comparison subjects.
analySIS
Means were compared using Students t-test, analysis ofvariance and correlations to evaluate association betweenvariables. cut-off values were calculated as the 5th and95th percentile of the comparison group and the proba-bility of abnormally high values evaluated using a coxregression analysis.
The SIrc review November 2006 75

neuRopSyChologICal effeCtS of StyRene expoSuRe:
RevIew of lIteRatuRe publIShed 1990 – 2003
rESULTS
Styrene exposed workers had lower dBH activity andhigher prolactin (in both men and women) than the com-parison group. Mean MAo-B activity was somewhathigher in the comparison group. dBH activity was nega-tively correlated with the sum of the urinary metabolites(MA + PGA). No correlation was reported between theother biomarkers and these metabolites. The group ofworkers with the higher urinary metabolites had signifi-cantly lower MAo-B activity than the controls. Extremevalues were then examined, with significantly more ofthose in the higher exposure group having abnormallylow dBH activity and abnormally high values of pro-lactin. No abnormal values of dBH were found in thosewith the sum of metabolites (MA + PGA) less than 200 butthe cox’s regression model showed increasing risk withhigher values. In the analysis of prolactin, men andwomen were considered separately and women appearedto have changes at a lower exposure level than males.
ConfoundIng
The analysis was stratified by gender for the prolactinanalysis. Age, smoking and alcohol use were comparedbetween exposed and comparison group and no differ-ence found but they were not obviously included in theanalysis. Though there was a wide range in duration ofexposure (1-22 years) no account appears to have beentaken of this in the analysis.
authoRS’ ConCluSIonS
dBH activity was significantly decreased amongststyrene exposed subjects but the reason for this is unclear.Most likely the decreased serum dBH activity could bean adaptive mechanism to a reduced turnover rate ofdopamine at the neuronal level. Prolactin was increasedamongst styrene exposed workers with a greater sensitivityof female workers, showing an increased risk for abnor-mally high prolactin at relatively low exposure levels.
RevIeweR’S ConCluSIonS
The study does appear to show negative relation betweenexposure and dBH and a positive one with prolactin. Therelation to MAo-B is weak.
Bergamaschi E, Smargiassi A, Mutti A, et al.
Peripheral markers ofcatecholaminergic dysfunction andsymptoms of neurotoxicity among
styrene-exposed workers. Int Arch Occup Environ Health 1997; 69:209-214.
aIM
To investigate the inverse association of platelet andMAo-B with symptoms, to assess the relation betweenperipheral markers of catecholaminergic dysfunction andthe relation to exposure and to compare prolactin withother markers of catecholamine metabolism.
deSIgn
This was a cross-sectional study using an external non-exposed comparison group
SubjeCtS
46 styrene-exposed male workers from a number of facto-ries manufacturing reinforced plastics were recruitedtogether with a comparison group of 30 blue collar work-ers, with no history of exposure to chemicals, from localindustries.
expoSuRe
Exposed workers had been employed for 0.2-29 yearswith a median of 6 years. Styrene exposure by ambientmonitoring ranged from 5 to 120 ppm as a TWA with amedian level 25 ppm. Urinary spot samples were collect-ed on a Friday morning 15 hours after last exposure andanalyzed for mandelic acid and phenylglyoxidic acid.
outCoMe
The Swedish Q16 symptom questionnaire was completedon the Friday morning on which blood was drawn. Theblood was analyzed for prolactin, MAo-B and dopamineb hydroxylase (dBH).
The SIrc review November 200676
neuRopSyChologICal effeCtS of StyRene expoSuRe:
RevIew of lIteRatuRe publIShed 1990 – 2003
analySIS
results presented appeared to depend on the MannWhitney U test, Fisher’s exact test, linear regression andmultiple logistic regression.
ReSultS
No difference was seen in the mean number of symptomsbetween exposed and control workers but, in the exposedgroup, a relation was found between the number ofsymptoms reported and urinary metabolites, with thosewith higher metabolites reporting more symptoms. Thisresult was not reported in detail. Prolactin was higher inthe exposed group and MAo-B lower. The most exposedhad lower values of dBH than the non-exposed althougha straight comparison of exposed and comparison groupsshowed no difference. When extreme values were calcu-lated, with cut-off at the 5th of 95th percentile in the com-parison group, differences were seen for prolactin; signif-icantly more exposed than controls presented withabnormally high values. In the exposed group dBH wasnegatively correlated with the sum of urinary metabo-lites. No relation was found between any of the peripher-al markers and exposure duration. It is reported, but noare details given, that none of the results was modified byage, drinking or smoking.
ConfoundIng
The comparison group was older and more likely toreport drinking alcohol than the exposed. It was reportedthat the effect of these confounders, together with ciga-rette smoking, were examined but no detail was given.
authoRS’ ConCluSIonS
Plasma prolactin was higher in styrene-exposed workersbut its level was not related to the intensity of exposure tostyrene. Although no difference was seen in dBH levelsbetween exposed and the comparison group, the relationbetween urinary metabolites, symptoms and dBH sug-gests that the change in dBH may contribute to theappearance of the symptoms. The lower platelet MAo-Band plasma dBH might represent an adaptive mecha-nism to a dopamine depletion. of the three peripheralmarkers of catecholaminergic dysfunction, plasma pro-lactin appears to be most sensitive.
RevIeweRS’ ConCluSIonS
The study tends to support the observation that prolactinwas increased and dBH decreased in styrene-exposedworkers and provides modest support for the suggestionthat MAo-B is also reduced. It is not certain that the sam-ple examined in this study is independent of that in thesame authors’ 1996 study and indeed some of the obser-vations made may have been the same in the two reviewstudies. The absence of any difference in symptomsbetween the exposed and comparison series may in partbe due to systematic differences between the two (forexample in age); this interpretation is supported by thepositive relation between urinary metabolites and symp-toms in the exposed group. The levels of exposure wererelatively low (a median of 25ppm) but included someworkers exposed as high as 120 ppm.
Challenor J, Wright D.
Aggression in boat builders: a searchfor altered mood states in boat
builders exposed to styrene. Occup Med (Oxford) 2000; 50:185-92.
aIM
To determine whether builders of glass reinforced plasticboats might be more aggressive or hostile than theircounterparts in areas of a company where volatile organ-ic compounds were not being used.
deSIgn
This was a cross sectional study comparing mood state inexposed and non-exposed personnel in one factory.
SubjeCtS
213 workers exposed to styrene and 114 non-exposedemployees took part.
outCoMe
A profile of mood states was completed, asking the subjectto rate feelings during the past week, “including today”. Asupplementary questionnaire on job satisfaction, lifeevents, stress, smoking and alcohol was also completed.
The SIrc review November 2006 77

neuRopSyChologICal effeCtS of StyRene expoSuRe:
RevIew of lIteRatuRe publIShed 1990 – 2003
expoSuRe
Exposure from records kept by the company between1990 and 1996 gave a range of 4-150 ppm. Passive sam-ples of 23 subjects was carried out two weeks after com-pleting the study. The highest air concentration recordedwas 66 ppm.
analySIS
T-tests, Wilcoxon’s rank sum tests and the Mann-WhitneyU test were used to compare the means of the exposedand non-exposed groups.
ReSultS
The styrene exposed workers had scores on the aggres-sion scale of the profile of mood states that suggestedthey were more aggressive than the non-exposed. Thisdifference was marginally significant at the p=0.5 level.Further analysis suggested that this aggression was mostevident in those who more recently started working withstyrene.
ConfoundIng
The text suggests that the styrene exposed group smokemore but have equivalent alcohol intake, but this infor-mation is not presented.
authoRS’ ConCluSIonS
GrP boat builders were found to have an increase inmood state aggression/hostility. The fact that theincreased score for aggression/hostility is most evidentin the earlier period supports the view that the findingmay reflect a selection phenomenon and not an exposurephenomenon.
RevIeweR’S ConCluSIonS
This study is essentially a descriptive one of a phenome-non noted in a single factory. It is not clear that it can begeneralized to other situations.
Checkoway H, Costa LG, Camp J, Coccini T,Daniell WE, Dills RL.
Peripheral markers ofneurochemical function among
workers exposed to styrene. Br J Ind Med 1992; 49:560-5.
aIM
To evaluate the utility of peripheral blood cell parametersof neurochemical function in styrene-exposed workers.
deSIgn
cross-sectional design with an internal, non-exposed,comparison group.
SaMple
60 exposed workers from 3 fiberglass reinforced plasticsplants in Washington State were studied, together with 18non-exposed workers from one of the plants.
expoSuRe
Exposed workers had been employed for a little under 4years, on average. Exposure measurements were mademid-week, on Wednesday and Thursday, with full-shiftpassive dosimeters, from which 8h TWA were deter-mined. Blood and urine samples appear to have beentaken at an early point in the shift and were analyzed forstyrene concentrations (blood) and urinary metabolites.Exposure groups were defined by blood styrene concen-tration. The mean exposure of the group with highestblood styrene was 58ppm (Sd=11.1).
outCoMe
Blood samples were also analyzed for Type Bmonoaminoxidase (MAo-B), serotonin and sigma recep-tor binder. cNS symptoms were collected by a self-com-pleted questionnaire that is not described in more detail.
analySIS
correlations and comparisons of means between theexposure groups were the main analytical tools althougha multiple logistic regression analysis was apparently
The SIrc review November 200678

neuRopSyChologICal effeCtS of StyRene expoSuRe:
RevIew of lIteRatuRe publIShed 1990 – 2003
carried out (but not reported in detail) to assess possibleconfounding.
ReSultS
Those with higher blood styrene higher concentrationreported a higher total number of symptoms, and a high-er proportion in the middle and high blood styrenegroups reported each of the 7 symptoms listed. The pat-tern apparently did not change after a allowance for age,sex, alcohol, smoking and duration of employment.
The authors report correlation coefficients betweenblood styrene concentration and peripheral markers ofneurochemical function. These showed a significant, neg-ative, relation between MAo-B and blood styrene, whichwas no longer quite statistically significant when adjust-ed for age, race, sex, years of employment, smoking, andalcohol intake. Serotonial uptake had a positive correla-tion which, at least on the rank order correlation,increased slightly after adjustment for confounders andwas then shown as significant (p<0.05). The relationbetween symptoms and neurochemical markers was alsoexamined. No relation was found between symptomsand serotonin or sigma receptor binding but MAo-B wasinversely related to a number of cNS symptoms, havingallowed for age, race, sex, years of employment, alcoholuse and smoking.
ConfoundIng
Key analyses were appropriately adjusted for potentialconfounders. It was notable however that those in themoderate and high blood styrene groups had much higherrates of smoking than in the non-, or low exposed groups.
authoRS’ ConCluSIonS
results from this study indicate that MAo-B activity maybe useful as a marker of effect of occupational exposureto styrene.
RevIeweR’S ConCluSIonS
This appears to be a well-conducted, although essentiallynegative, study. The relatively high rate of symptoms inthe groups with higher exposure is noted but as concen-trations ranged as high as 160ppm it is difficult to general-ize to current exposure levels. The suggestion that MAo-Bmay be involved as an intermediate step in styrene-induced cNS neurotoxicity does not seem well-founded.
Edling C, Anundi H, Johanson G. et al.
Increase in neuropsychiatricsymptoms after occupational
exposure to low levels of styrene. Br J Ind Med 1993; 50:843-850.
aIM
To determine if exposures to low concentrations ofstyrene (below 20 ppm) are related to neurobehaviouraleffects or symptoms.
deSIgn
The assessment of neurobehavioural effects by psycho-metric testing was done using a cross shift design and anexternal non-exposed comparison group. Symptom datawas collected on two occasions, once during the normalworking year with a follow-up some two to five weekssince last exposure, at the end of the summer vacation.
SubjeCtS
The exposed group were 20 men working at a single plas-tics factory. The comparison group were 20 non-exposedmen matched on age, working schedule and physicalworkload. They worked in nearby industries and had notbeen occupationally exposed to solvents.
outCoMe
Three tests were used, a test of simple reaction time, colorword vigilance and the symbol digit test. The color wordvigilance test is a choice reaction time and the symboldigit test is a test of speed of processing. The outcome ofinterest was change in the test during the work shift.Symptoms were recorded using the Swedish 16 questionsolvent questionnaire. At the end of shift testing session acomputerized questionnaire of 17 symptoms of acuteeffects including local irritation and central nervous sys-tem symptoms was completed.
expoSuReS
Workers had been exposed to styrene for between 1-25years (mean 9 years). Exposures were measured at 15 sec-ond intervals throughout the day using a back pack con-taining a mobile photo ionization detector. This was worn
The SIrc review November 2006 79
neuRopSyChologICal effeCtS of StyRene expoSuRe:
RevIew of lIteRatuRe publIShed 1990 – 2003
during one working day, presumably on the day thebehavioural testing was done. Passive air sampling wasperformed on the same day using carbon diffusion sam-plers placed in the breathing zone of each subject. Bloodand urine samples were collected immediately beforeand after the work day.
Using passive dosimetry the mean eight hour timeweighted average was 8.6 ppm (range 0.04-15.4 ppm).From the continuous monitoring device the number ofexcursions greater than 50 ppm could be measured andwere detected for nine of the workers.
ReSultS
Exposed men reported more acute symptoms both at thebeginning and end of shift but there was no changeacross shift. on the first recording of symptoms using theQ16 questionnaire the exposed men reported significant-ly more symptoms, particularly of tiredness andheadache, than the referents. Although the number ofsymptoms reported by the exposed men reduced whenthis was repeated at the end of a break from exposure forthe summer holiday, improvement was statistically notsignificant. The change in the number of symptomsbetween the end and beginning of shift was, in theexposed men, related to the eight hour time weightedaverage for styrene. The total number of excursionsabove 50 ppm was related to reports of skin irritation atthe end of shift and peak exposures were related to sensa-tions of an unpleasant taste.
on the performance test no difference was found onthe test of simple reaction time between the exposed andreferents either before or after the end of shift. on thecolor word vigilance test, a test of complex reaction time,the exposed did worse than the referents both before andafter the test. The exposed did somewhat better, on bothoccasions, on the symbol digit test.
No relation was found between any of the cross shiftexposure measures and simple reaction time or change insimple reaction time. The complex reaction time scoreswere related to time weighted average exposure, thenumber of excursions above 25 ppm and above 50 ppmand to the duration of excursions above 50 ppm withinthe exposed group. No dose-response data is reported forsymbol digit test.
ConfoundIng
The design considered a number of aspects of confound-ing. Half the workers completed the end of shift testbefore the start of shift, to allow for possible effects of
learning. Physical workload was evaluated using a com-puterized electrocardiograph to compare physical work-load between the exposed and referent subjects. otherworkplace contaminants (acetone and toluene) were alsomeasured. The exposed and referent group were thoughtto be similar on age, working schedule and physicalworkload but there is no discussion of other potentialconfounders such as educational level.
authoRS’ ConCluSIonS
This study showed no difference in the psychometrictests when men exposed to 0.4-50.4 ppm of styrene werecompared with non-exposed referents. It suggests how-ever that exposures below 20 ppm produced an increasednumber of neuropsychiatric symptoms.
RevIeweR’S ConCluSIonS
This study is valuable for its investigation of the effects ofvariations during the working day on test score andsymptoms. The cross sectional comparison of symptomsbetween the exposed and unexposed groups in differentworkplaces may have been biased by the knowledge ofthe purpose of the study. However the relation betweenthe change in symptoms and average styrene concentra-tion in the exposed appears to be a sound result.
Geuskens R, Klaauw M, Tuin J. et al.
Exposure to styrene and healthcomplaints in the dutch glass-
reinforced plastics industry. Ann Occup Hyg 1992; 36:47-57.
aIM
To describe exposures and level of health complaints infour large and 12 small plants using styrene.
deSIgn
To compare symptoms reported by workers exposed tostyrene to those reported by a comparison group of unex-posed men who had completed the questionnaire foranother unpublished study.
The SIrc review November 200680

neuRopSyChologICal effeCtS of StyRene expoSuRe:
RevIew of lIteRatuRe publIShed 1990 – 2003
outCoMe
13 questions about health complaints were grouped intothree factors: “irritation,” “pre-narcotic symptoms” and“cognitive/locomotor disabilities.” Irritation symptomsindicated itching of the skin, headache, sniffing and burn-ing eyes and feelings of depression. Pre-narcotic symp-toms included nausea, feeling drunk, dizziness and dis-turbance of equilibrium and cognitive/locomotordisabilities bilateral communication, impaired communi-cation with colleagues and trouble with movement.
expoSuRe
In the four large plants workers were grouped into fourjob categories and styrene concentration in the breathingzone of each worker was measured over three (or four)days in winter. The eight hour time weighted averagewas derived from two consecutive four hour samples.Short term measures were also made to determine peakconcentrations. The geometric mean concentrations of thehighest categories were between 97-212 mg/m3. In thesmall plants walk through surveys were carried out andthe average concentration during moulding was estimat-ed to range from 100-400 mg/m3. Health complaints werenot collected in the smaller factories.
analySIS
The mean score on each of the three grouped factors —irritation, pre-narcotic symptoms and cognitive/locomo-tor disabilities — were compared with those from thenon-exposed comparison group using a student t-test.
ReSultS
The styrene exposed workers were more likely to reportsymptoms grouped by these authors under the title irrita-tion. They were also more likely to complain of pre-nar-cotic symptoms. No difference was found in the categorycognitive/locomotor disabilities.
ConfoundIng
No description is given of the comparability of theexposed and control groups and it is not known to whatextent confounding is a problem. The authors commentthat “none of these differences can be explained by differ-ences in work conditions, work hygiene or health riskfactors between the two groups,” but no data are given. Itis also commented that the exposed workers often men-
tioned styrene and methylene chloride as the cause oftheir complaints but no information is given on the expo-sure to methylene chloride.
authoRS’ ConCluSIonS
The work related differences in irritation and pre-narcoticsymptoms between the exposed and control groups arequite obvious and may be regarded as short term healtheffects. They appear to attribute them to peak levels whichwere observed in the study to be up to 2000 mg/m3.
RevIeweR’S ConCluSIonS
This was essentially a study to determine levels of expo-sure and the symptoms reported are noted but not reallyinterpretable.
Jegaden D, Amann D, Simon JF, Habault M,Legoux B, Galopin P.
Study of the neurobehaviouraltoxicity of styrene at low levels
of exposure. Int Arch Occup Environ Hlth 1993; 64:527-31
aIM
To determine whether neurotoxicity occurs when expo-sure to styrene is less than 50 ppm.
deSIgn
cross shift design of exposed workers and a non-exposedinternal comparison group.
SubjeCtS
30 moulders exposed to styrene in a French naval dock-yard were identified. A non-exposed group from thesame company was chosen, matched on ethnic group,age, sex, and intellectual and social cultural level.
outCoMe
Three tests were used administered by computer andapparently developed for this study. They were tests ofsimple reaction time to a visual stimulus, complex reac-
The SIrc review November 2006 81

neuRopSyChologICal effeCtS of StyRene expoSuRe:
RevIew of lIteRatuRe publIShed 1990 – 2003
tion time to a visual stimulus and a digit span test requir-ing the subject to memorize a list of numbers presentedby the computer.
expoSuRe
The mean duration of exposure to styrene was 5 years(range 1-14 years). Exposure on the day of testing wasmeasured using passive diffusion badges, urinarymetabolites (mandelic acid and phenylglyoxylic acid) atthe beginning and end of shift and area monitoring usingmass spectrometer. Long term exposure in the workplacein general was estimated from urinary samples collectedeach Thursday evening over a 43 week period from sixmen randomly assigned each week.
In this study the mean exposure to styrene was 23ppm on the day of testing (range 4-55 ppm). At the startof shift (on a Monday after two days away from expo-sure) the mean urinary metabolites (mandelic acid andphenylglyoxylic acid) was 37.6 mg/g creatinine in themorning. It was noted only seven of the 30 moulders hadno urinary metabolites at this point. The increase in uri-nary metabolites during the day was strongly related tothe measured level of environmental styrene.
The authors estimate that during the 43 weeks of rou-tine testing the mean exposure had been approximately30 ppm of styrene with 20% of the urinary determina-tions suggesting exposures >50 ppm.
analySIS
Both the between group and within group tests scoreswere compared. An analysis of duration and level ofexposure on the day of tests is also mentioned but nodetails are given of the acute dose response effect.
ReSultS
on the test of simple reaction time exposure subjects per-formed significantly less well than the control group bothin the morning and evening. This was also found for thetest of complex reaction time and on the memorization oflisted numbers (digit span). It appears that no significantdifference in the change over shift was observed. No rela-tion was reported between test scores and length of expo-sure amongst the exposed group.
ConfoundIng
The design included two parallel versions of the tests tominimize any effects of learning but nevertheless the sub-
jects (both exposed and comparison) did better on thetests at the end of the day than in the morning. Althoughthe authors say that they had carefully matched the com-parison group on intellectual and sociocultural level, it isnot explained how they did this and the adequacy ofmatching remains a question. other exposures at workwere determined but the concentration of methylene chlo-ride, the only one mentioned, was said to be insignificant.
authoRS’ ConCluSIonS
The authors conclude that, at the levels investigated,there were no acute signs of neurotoxicity but that thelower performance in the morning on psychometric testsindicated chronic effects of exposure.
RevIeweR’S ConCluSIonS
It appears that no cross shift effect is demonstrated on thethree tests used. However the conclusions to be drawnabout acute effects are limited. First, evidence of changes(or absence of them) in relation to measured exposureduring the day are not given. This seems a strange omis-sion. Second, the poorer test scores in the morning havenot been fully evaluated. It would have been appropriateto report the relation between the start of shift tests andmetabolites measured at the beginning of shift whichwere present for 23 of the 30 moulders, suggesting con-siderable exposure during the previous week. Finally theconclusion of chronic effects is not justified in the absenceof this pre-shift analysis and of good data demonstratingthat the exposed and comparison groups were wellmatched on important confounders.
Kolstad H, Juel K, Olsen J, Elsebeth L.
Exposure to styrene and chronichealth effects: mortality and
incidence of solid cancers in thedanish reinforced plastics industry.
Occup Environ Med 1995; 52:320-327.
aIM
To study the occurrence of non-malignant diseases andsolid cancers in workers exposed to styrene in the danishreinforced plastics industry.
The SIrc review November 200682

neuRopSyChologICal effeCtS of StyRene expoSuRe:
RevIew of lIteRatuRe publIShed 1990 – 2003
deSIgn
cohort mortality study.
SaMple
53,847 male workers employed between 1964-1988 incompanies producing reinforced plastic and alive onJanuary 1, 1970 were found by linkage to a danishnational pension plan. 2,944 workers were in companieswith unknown production and were excluded. 36,610workers from 386 reinforced plastic companies and14,293 workers from 84 companies in similar industriesbut without styrene exposure were included.
expoSuRe
No data on individual exposure or job titles was avail-able. concentrations of styrene exposure within thedanish reinforced plastics industry had been monitoredsince the early 1960’s and was said to be around 180 ppmduring the 1960’s and 54 ppm during subsequentdecades. For this study, 2 dealers of plastic raw materialsreviewed the production and classified the 470 compa-nies into those in which more than 50% of workers in thecompany would have been involved in producing rein-forced plastic, those with less than 50% of workersinvolved in the production and those where no workerwas involved. These were designated as having highexposure probability, low exposure probability or unex-posed. date of first employment in a relevant industryand the duration of employment were estimated frompension fund records.
outCoMe
Vital status was determined from the national populationregistry and underlying cause and up to 2 contributorycauses of death were established from the national causeof death register. degenerative disorders of the nervoussystem were the outcome of interest. This group includedmultiple sclerosis, parkinsonism and motor neuron dis-ease together with other non-malignant diseases of thebrain.
analySIS
years at risk were calculated from the start of employ-ment or from the first year the company produced rein-forced plastic. Standardized mortality ratios were calcu-lated by comparing observed number of deaths with the
expected numbers using age and calendar specificnational rates. Poisson regression was used to estimatemortality rate ratios (Mrr) using internal comparisonswith the rates for workers unexposed to styrene. Thesemodels included, as well as exposure probability, age,year of first employment, duration of employment andtime since first employment.
ReSultS
In all there were 24 cases with an underlying cause ofdeath attributed to degenerative disorders of the nervoussystem, and 60 where there was an underlying or con-tributing cause. of these 60, 7 were multiple sclerosis, 24parkinsonism, 24 other diseases of the brain and 5 motorneuron disease. In comparison with national rates theSMr for degenerative disorders of the nervous system forthose in styrene exposed industries was 0.94 (0.56-1.50)and for the comparison group 0.82 (0.30-1.69). In thePoisson regression those with high exposure probabilityhad a Mrr of 1.8 (compared with the unexposed com-parison group) with a 95% confidence interval 0.8-4.3.The Mrr was higher in those with longer duration ofemployment and greater time since first employment.
ConfoundIng
The Poisson regression was adjusted for age, duration anddate of employment but no information was available onfactors such as alcohol intake that may be an importanteffect modifier. Use of internal controls may have avoidedconfounding by socioeconomic factors. No account wastaken of workplace exposures to other chemicals.
authoRS’ ConCluSIon
degenerative diseases of the nervous system occurredmore often amongst workers with a high probability ofexposure to styrene than in comparable non-exposedworkers. These findings could easily be explained bychance, and the lack of information on exposure was animportant limitation.
RevIeweR’S ConCluSIon
Although the confidence intervals reported do not ruleout a chance finding, the consistency of the pattern ofexcess of degenerative disorders of the nervous systemusing internal comparisons is worthy of comment. Therather crude estimate of exposure by the division of com-
The SIrc review November 2006 83

neuRopSyChologICal effeCtS of StyRene expoSuRe:
RevIew of lIteRatuRe publIShed 1990 – 2003
panies into those with low and high probability of expo-sure will certainly have led to misclassification which mayhave underestimated any true effect. The lack of informa-tion on confounding factors is a concern. The cohort isyoung, with less than 9% mortality, and it may be too soonto detect long term effects on degenerative disorders.
Letz R, Mahoney F, Hershman D, et al.
Neurobehavioral effects of acutestyrene exposure in fiberglass
boatbuilders. Neutoxicology and Teratology 1990; 12: 665-668.
aIM
The study was designed to investigate the acute effects ofstyrene exposure using tests from the computerizedNeurobehavioural Evaluation System.
deSIgn
This was a cross shift design comparing changes withinindividuals in the styrene exposed group with similarchanges in the non-exposed internal comparison group.Testing was carried out at three points during the day,early morning, near mid-day and at the end of the workshift.
SubjeCtS
118 subjects were tested at five fibreglass boat buildingcompanies in New England. The results reported are on105 males with relatively complete data and no history ofhead trauma. All fibreglass laminators in each companywere asked to participate and other workers partiallyexposed or not exposed were also recruited.
outCoMe
Three computerized tests were used, the continuous per-formance test (a measure of reaction time and accuracy),the hand-eye coordination test (evaluating manual dex-terity and coordination) and the symbol digit substitutiontest which is based on the digit symbol test of theWeschler adult intelligence scale and measures speed ofprocessing.
expoSuRe
duration of exposure was, on average, 4.6 (Sd 6.7)years. Personal monitoring pumps were used to measureexposure in the breathing zone over the shift. Urinarymandelic acid was measured from a spot urine sampleobtained near the end of the work shift. The geometricmean of styrene exposure was 13.5 ppm and of mandelicacid 164 mg/g creatinine.
analySIS
regression analyses were carried out to assess the effectof exposure (8 hr time weighted average for styrene),mandelic acid and dichotomized exposure (cut point 50ppm of styrene) on performance on the test at the end ofshift session. Within subject analysis (using the subject’smorning performance as a covariate) was also carried outbut is not reported in detail. The multiple regressionincluded other confounders (age, education and exposureduration).
ReSultS
There was no relation between performance, at the end ofthe day, on the continuous performance test or hand-eyeperformance and exposure indices. The end of shift scoreon the symbol digit test was related to styrene ppm cor-rected for respirator use and to urinary mandelic acidconcentration. The start of shift scores on any test werenot related to duration of exposure.
ConfoundIng
The design and analysis appears to have allowed appro-priately for the main confounders on neurobehaviouraltesting, namely age, education and alcohol use. There isno discussion of other chemical exposures potentiallypresent in the workplace. Learning effects are potentiallya problem in cross shift studies and this question is notaddressed but may be assumed to be the same for bothgroups.
authoRS’ ConCluSIonS
Some disruption of neurobehavioural performance isrelated to styrene exposure, with the bulk of this effectbeing those of exposure to >50 ppm.
The SIrc review November 200684
neuRopSyChologICal effeCtS of StyRene expoSuRe:
RevIew of lIteRatuRe publIShed 1990 – 2003
RevIeweR’S ConCluSIonS
Presentation of the data does not allow us reach any cleardecision about the level at which effects of styrene expo-sure began to appear. It does seem likely, however, thatthe effects seen were indeed acute effects as the morningscores were unrelated to duration of exposure. Little canbe concluded from this study other than that, with ade-quate numbers and an experienced research team acuteexposure may affect performance on some tests.
Matikainen E, Forsman-Gronholm L, Pfaffli P,Juntunen J.
Nervous system effects ofoccupational exposure to styrene:a clinical and neurophysiological
study. Environmental Research 1993; 61:84-92.
aIM
To use quantitative spectral and frequency analysis ofEEG to estimate the effects of styrene on the central ner-vous system.
deSIgn
cross sectional study using internal comparisons andvalues in a normative database.
SubjeCtS
100 male workers were identified from workplaces wherehygiene studies had previously been performed. Thenumber of workplaces is not stated. Workers werebrought to the Institute of occupational Health inHelskinki for testing. It is not clear how recently they hadlast been exposed to styrene.
outCoMe
The study reports results of EEG evaluation and of symp-toms. No information is given for the way in whichsymptom information was collected. EEG was recordedfrom 19 channels and submitted to both visual and quan-titative analyses. The quantitative analysis from eachindividual was compared with a normative database to
determine whether the results were normal, abnormal ornot classifiable.
expoSuReS
The average duration of styrene exposure was 12.6 yearswith a range of 0.5-32 years. Individual measures weremade of styrene concentrations in the breathing zone andof end of shift urinary metabolites. In addition an expo-sure index involving the number of years of exposure, theworking method, the level of daily exposure and the timeweighted mandelic acid levels was used, essentially toestimate cumulative exposure to examine chronic effects.At the time of testing the average eight hour time weight-ed average styrene concentration was 32 ppm but manyof the workers had been exposed to much higher levelsearlier in their employment. Styrene oxide, acetone anddust were also measured but these values are not includ-ed in the analysis.
analySIS
The exposure index was grouped into three categoriescorresponding to low, moderate and high. In some analy-ses (Table 6) all three levels were used, with some onlythe low and high categories were contrasted (Table 4) andin others a different classification was adopted (Table 3).
ReSultS
Headaches, memory disturbance, forgetfulness, sensorysymptoms in the hands and feet and excess sweating werereported more commonly in those with higher exposure.Workers with higher exposure had a higher mean totalEEG power than those with low exposure and this wasmost marked in the frontal and temporal regions. In com-parison to the normative database the quantitative EEGwas classified, in a neurometric analysis, as normal in 28cases, abnormal in 30 cases and not classifiable in 31 cases.Abnormal cases had a somewhat higher level of urinarymandelic acid and environmental styrene concentrationbut levels of statistical significance are not given. Those inthe highest exposure index group appeared less likely tohave a normal EEG using this approach.
ConfoundIng
Age and alcohol consumption were discussed as poten-tial confounders and it was concluded that there was nodifference on these factors in the three exposure groups.No formal adjustment was reported.
The SIrc review November 2006 85

neuRopSyChologICal effeCtS of StyRene expoSuRe:
RevIew of lIteRatuRe publIShed 1990 – 2003
authoRS’ ConCluSIonS
The authors conclude, although the data is not shown inthe paper, that the number of abnormal EEGs was notincreased when visual inspection was used and there wasno correlation between the number of abnormal EEGsand exposure. They conclude that quantitative analysisshowed consistent, although with slight changes in themore highly exposed group, but that the changes founddid not suggest increased cerebral disease in the workers.
RevIeweR’S ConCluSIonS
This paper attempts to measure effects of chronic expo-sure. There are some problems however. The authors con-clude that these effects are seen at relatively low exposurebut many of the workers had been exposed for years andwill have had a history of much higher exposure in thepast. It is not clear how much time had been allowed fromlast exposure, and unless this was several days, the effectsseen might be ones that were acute and reversible. Themarginally positive result depends on comparison ofthese data to a normative database, but there is no evi-dence that the information collected for this study and forthe database was collected in the same way. In particular,it required a technician to determine levels of wakeful-ness and the degree of artefact, and to choose those partsof the EEG that were felt to be non-artifactual. The presen-tation of data by different groupings of the exposureindex (rather than by the three groups initially defined)suggests that any effect was very slight and could only bedemonstrated by careful choice of the way in which datawas presented.
The authors make only very modest claims for therelation between EEG and styrene exposure, and that isappropriate.
Mergler D, Huel G, Belanger S, Bowler RM,Truchon G, Drolet D.
Surveillance of early neurotoxicdysfunction.
Neurotoxicology 1996; 17:803-12.
aIM
The objective was to examine nervous system function-ing prior to and following workplace interventions.
deSIgn
A cohort study in which both workplaces and individualworkers form the unit of analysis. The study wasdesigned to assess the effect of interventions to reduceexposures.
SubjeCtS
Three workplaces involving styrene exposure in the man-ufacture of reinforced plastics were studied twice, twoyears apart. 118 workers completed the neurobehaviouraltest battery and exposure assessment at time 0, and 75 ofthese were still employed at one of the three plants twoyears later. 57 of the 75 agreed to repeat testing althoughenvironmental measures and urine samples wereobtained for all 75.
outCoMeS
A large number of tests were carried out. These wereselected from the neurobehavioural core test battery sup-plemented by three tests of color vision, contrast sensitiv-ity and olfactory threshold selected from a battery of testsdeveloped by the authors. The battery included the pro-file of mood states which gives scores on six dimensionsand a symptom checklist which is not described.
expoSuReS
Exposures were measured at time 0 and time 1 using pas-sive dosimeters for a total of eight hours and an eighthour time weighted average was determined. End of shifturine samples were collected on the same day as the envi-ronmental exposure measurement and mandelic acid cor-rected for creatinine was determined. Workers includedin both assessments had been employed for a mean of 6years at time 0 (8 years at repeat testing). The medianexposure at time 1 was 75 mg/m
3
and at time 2 76 mg/m3
for these 57 workers. It is reported that at one plant (plant3) the levels of styrene and mandelic acid were signifi-cantly reduced between baseline and follow-up but thatthere was no change at the other two plants. Median lev-els broken down by plant are not given in the paper.
analySIS
The analysis focused on changes between baseline andfollow-up for the entire population, for plant 3 (wherethere had been improvements) compared with the othertwo plants and for individual changes in relation to end
The SIrc review November 200686

neuRopSyChologICal effeCtS of StyRene expoSuRe:
RevIew of lIteRatuRe publIShed 1990 – 2003
of shift mandelic acid concentrations. Paired t-tests wereused to compare mood and Spearman’s rho to comparetrends, that is changes in mandelic acid concentrationscompared with changes in test score.
ReSultS
overall the 57 subjects improved their scores on the digitspan and digit symbol tests and did less well on the con-trast sensitivity test. No overall difference was found onany of the other behavioural or mood scales. Workers atthe plant in which improvements had been made did bet-ter than the other two plants on a test of manual dexterity(Santa Ana), on the digit span and digit symbol tests, andwere less likely to report anger and more likely to reportvigor. When the 57 workers were grouped according tochanges in their mandelic acid levels (increased, the sameor decreased) over the two years a significant relationwas found with color vision, simple reaction time, digitsymbol forward and tension and fatigue on the moodscale. There was also some tendency toward an increasein number of reported symptoms for those who mandelicacid concentrations were higher on the second test.
ConfoundIng
With each subject used as their own control in the analy-sis between mandelic acid and performance tests, con-founding is of less importance. The authors suggest thatfor some tests changes in conditions of testing may havebeen important and these would be confounded withtime of testing. If learning is important, that would bedemonstrated by the increase in score over time 2 com-pared with time 1, while the population will, by defini-tion, have aged two years.
authoRS’ ConCluSIonS
The authors conclude the most striking result of thestudy is an association between the differences in man-delic acid and outcomes. They note that on some teststhis was due to deterioration in those whose mandelicacid levels had increased rather than improvement inthose with decreased levels, but nevertheless suggest thaton some functions, particularly color vision, effectsappear to be reversible. They suggest that a protocol ofthis kind may be useful for ongoing surveillance ofgroups of exposed workers as part of a program of pre-ventative intervention.
RevIeweR’S ConCluSIonS
This is an important study in that it appears to show thereversibility of neurobehavioural effects associated withstyrene exposure. As with many papers the informationgiven is not complete and it would have been interestingto know more about those who had left the plant (werethey those with the highest abnormal scores?) and tohave known something about the baseline levels of man-delic acid in these three groups (increased, same anddecreased). Though the illustration of this data in Figure 3is very clear, it would have been useful to have had a morerigorous analysis with initial level of mandelic acid as acovariate. The large number of tests carried out (20 scoresare reported) raises the usual problems of interpretation.Here, for example, improvement was seen on two testsand deterioration on one; it is not clear which of thesemay have been due to chance. The testing was done “atleast 12 hours after last exposure” but probably with tooshort a delay to rule out acute effect of recent exposure.
Murata K, Araki S, Yokoyama K.
Assessment of the peripheral,central and autonomic nervous
system function in styrene workers. Am J Ind Med 1991; 20: 775-784.
Yokoyama K, Araki S, Murata K.
Effects of low level styrene exposureon psychological performance in
FrP boat laminating workers. Neurotoxicology 1992; 13:551-556.
These two papers report results from the same group of12 styrene exposed workers, with Murata et al. givingdetails of neurophysiological measurement andyokoyama et al. of behavioural testing. Although differ-ent comparison groups were used in the two papers, it isappropriate to include them in a single review.
aIM
The study aims to assess the effects of styrene exposureon peripheral, central and autonomic nervous function(Murata et al.) and on performance tests (particularly ona test of picture completion from the Wechsler adult intel-ligence scale) (yokoyama et al.).
The SIrc review November 2006 87

neuRopSyChologICal effeCtS of StyRene expoSuRe:
RevIew of lIteRatuRe publIShed 1990 – 2003
deSIgn
This was a cross sectional study using an external non-exposed comparison group.
SubjeCtS
The study involved all 12 workers from a single rein-forced fibreglass factory manufacturing boats in Japan.one subject, with sinus arrhythmia, was excluded fromthe neurophysiological studies but included in the per-formance testing. For the neurophysiological measures acomparison group was chosen from men seen at a region-al health clinic. They were healthy volunteers matched ±2years to the age of the exposed men. Testing of this groupwas done over a period of two years following the work-place testing of exposed workers. For the behaviouraltesting a comparison group was taken of 11 male workersin a steel factory in the same area.
outCoMeS
Peripheral nerve function was assessed using sensoryand motor nerve conduction velocity, measured in themedian nerve. Using a method developed by this group,the dispersion of conduction velocities was also calculat-ed. This was done by determining, for exposed and con-trol subjects separately, the nerve conduction velocityassociated with successive proportions of active nervefibres. In addition somatosensory evoked potentials weremeasured by stimulating the right median nerve at thewrist and recording latencies at four points, with theinterpeak latencies representing conduction times in thespinal cord and brain (a measure of central nervous sys-tem functioning). Autonomic function was measured bythe coefficient of variation of the r-r interval on EcGrecordings. For the performance testing three measureswere used, the picture completion and digit symbol testsfrom the WAIS and the long form of the MaudsleyPersonnel Inventory, giving scores on scales of extrover-sion and neuroticism and on a lie scale.
expoSuReS
The mean duration of exposed workers was 5 years with arange of 0.5-9 years. Air sampling was carried out threemonths before and two months after the testing, using areasampling. The styrene concentration was estimated to be26 ppm (range 1-77) before and 14 ppm (range 6-46) aftertesting. Urinary metabolites were measured at the end ofthe day on which testing (neurophysiological and neu-
robehavioral) had occurred. Mean concentrations of man-delic acid were 169 mg/g creatinine and phenylglyoxylicacid 277 mg/g creatinine. These were estimated to beequivalent to a mean exposure of 22 ppm of styrene in air.
analySIS
Test results for cases were compared for those with con-trol subjects using paired sample t-tests in the neurophys-iological study and non-paired t-tests for the neurobe-havioral study. Pearson correlations were calculated toexamine whether there was a dose response between uri-nary metabolites and test score.
ReSultS
The distribution of nerve conduction velocities were inter-preted as showing that the distribution of fibres was shift-ed towards the slower velocities in the styrene exposedgroup when compared with the controls. Sensory conduc-tion velocity of the median nerve was slower in theexposed workers and there was less variation in r-r inter-val. No significant difference was found on motor nerveconduction velocity, on somatosensory evoked potentialor on heart rate. It is reported, although no detail is given,that there was no relation between urinary metabolitesand any of the neurophysiological test scores. on thebehavioural measures of styrene workers there were nodifferences between the exposed and comparison groupson the digit symbol test or on the personality inventorybut the exposed group had fewer correct responses on thepicture completion test. No detail was given of the dose-response analysis but it was commented that no signifi-cant correlation was observed between scores on the pic-ture completion test and urinary metabolites.
ConfoundIng
In the neurophysiological study, in which workers werematched on age to non-exposed controls, differencesbetween the groups on height, tobacco, alcohol and agewere reported not to be significant and these factors werenot included in the analysis. In the neurobehavioural test-ing part of the study the controls were somewhat older,less educated and drank less alcohol than the styreneworkers but none of these differences was significant.However the values for age (with styrene workers beingyounger) and length of education (longer in styreneworker) would both have resulted in more favourabletest results and it is of note that adjustment for these fac-tors increased the estimated difference between the two
The SIrc review November 200688
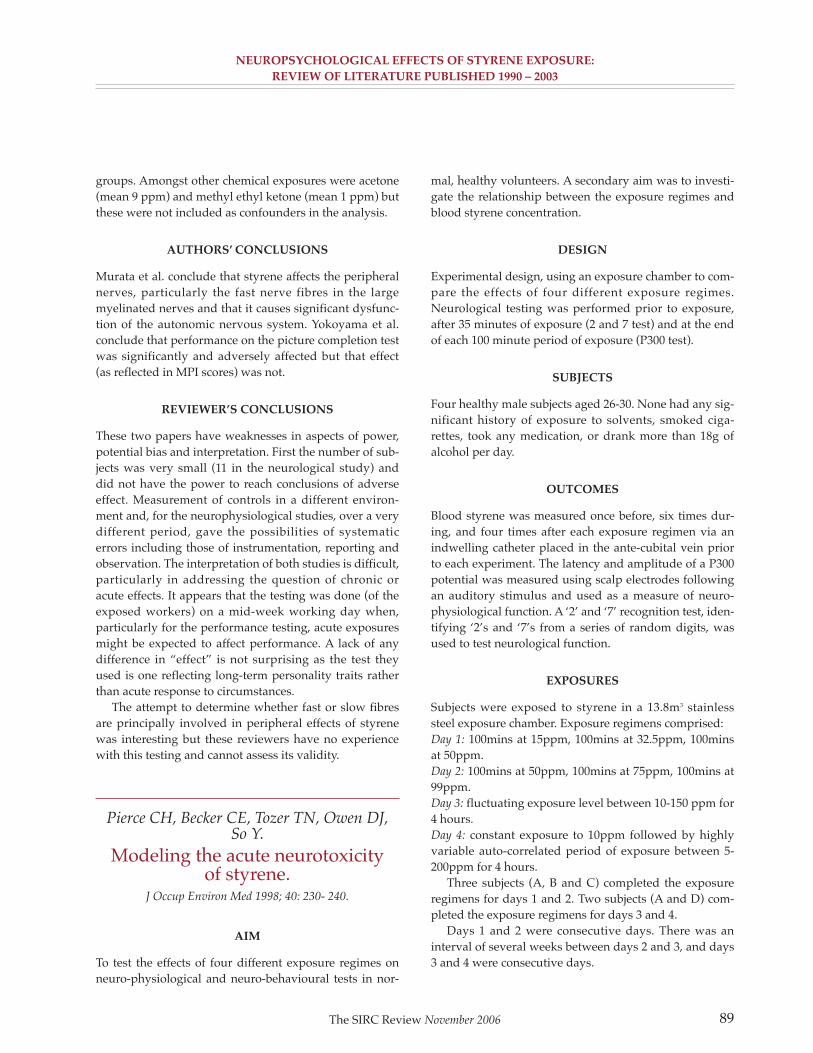
neuRopSyChologICal effeCtS of StyRene expoSuRe:
RevIew of lIteRatuRe publIShed 1990 – 2003
groups. Amongst other chemical exposures were acetone(mean 9 ppm) and methyl ethyl ketone (mean 1 ppm) butthese were not included as confounders in the analysis.
authoRS’ ConCluSIonS
Murata et al. conclude that styrene affects the peripheralnerves, particularly the fast nerve fibres in the largemyelinated nerves and that it causes significant dysfunc-tion of the autonomic nervous system. yokoyama et al.conclude that performance on the picture completion testwas significantly and adversely affected but that effect(as reflected in MPI scores) was not.
RevIeweR’S ConCluSIonS
These two papers have weaknesses in aspects of power,potential bias and interpretation. First the number of sub-jects was very small (11 in the neurological study) anddid not have the power to reach conclusions of adverseeffect. Measurement of controls in a different environ-ment and, for the neurophysiological studies, over a verydifferent period, gave the possibilities of systematicerrors including those of instrumentation, reporting andobservation. The interpretation of both studies is difficult,particularly in addressing the question of chronic oracute effects. It appears that the testing was done (of theexposed workers) on a mid-week working day when,particularly for the performance testing, acute exposuresmight be expected to affect performance. A lack of anydifference in “effect” is not surprising as the test theyused is one reflecting long-term personality traits ratherthan acute response to circumstances.
The attempt to determine whether fast or slow fibresare principally involved in peripheral effects of styrenewas interesting but these reviewers have no experiencewith this testing and cannot assess its validity.
Pierce CH, Becker CE, Tozer TN, Owen DJ,So Y.
Modeling the acute neurotoxicityof styrene.
J Occup Environ Med 1998; 40: 230- 240.
aIM
To test the effects of four different exposure regimes onneuro-physiological and neuro-behavioural tests in nor-
mal, healthy volunteers. A secondary aim was to investi-gate the relationship between the exposure regimes andblood styrene concentration.
deSIgn
Experimental design, using an exposure chamber to com-pare the effects of four different exposure regimes.Neurological testing was performed prior to exposure,after 35 minutes of exposure (2 and 7 test) and at the endof each 100 minute period of exposure (P300 test).
SubjeCtS
Four healthy male subjects aged 26-30. None had any sig-nificant history of exposure to solvents, smoked ciga-rettes, took any medication, or drank more than 18g ofalcohol per day.
outCoMeS
Blood styrene was measured once before, six times dur-ing, and four times after each exposure regimen via anindwelling catheter placed in the ante-cubital vein priorto each experiment. The latency and amplitude of a P300potential was measured using scalp electrodes followingan auditory stimulus and used as a measure of neuro-physiological function. A ‘2’ and ‘7’ recognition test, iden-tifying ‘2’s and ‘7’s from a series of random digits, wasused to test neurological function.
expoSuReS
Subjects were exposed to styrene in a 13.8m3 stainlesssteel exposure chamber. Exposure regimens comprised:Day 1: 100mins at 15ppm, 100mins at 32.5ppm, 100minsat 50ppm.Day 2: 100mins at 50ppm, 100mins at 75ppm, 100mins at99ppm.Day 3: fluctuating exposure level between 10-150 ppm for4 hours.Day 4: constant exposure to 10ppm followed by highlyvariable auto-correlated period of exposure between 5-200ppm for 4 hours.
Three subjects (A, B and c) completed the exposureregimens for days 1 and 2. Two subjects (A and d) com-pleted the exposure regimens for days 3 and 4.
days 1 and 2 were consecutive days. There was aninterval of several weeks between days 2 and 3, and days3 and 4 were consecutive days.
The SIrc review November 2006 89

neuRopSyChologICal effeCtS of StyRene expoSuRe:
RevIew of lIteRatuRe publIShed 1990 – 2003
analySIS
A partial correlation coefficient using a t statistic wasused to measure the association between exposure andthe results of the 2 and 7 recognition test. A test ofKendall rank correlation was used to evaluate the rela-tionship between observed toxicity (presumably the P300test although this is not stated) and four measures ofexposure: peak exposure; duration of exposure; productof average exposure level x duration (i.e. cumulativedose); and modelled peak brain styrene concentration.
ReSultS
No change in the P300 test amplitude or latency wasobserved. Scores for the 2 and 7 recognition testimproved (presumably due to increased familiarity withthe test) between days one and two but showed no othersignificant change.
ConfoundIng
The before/after design reduced the opportunities forconfounding.
authoRS’ ConCluSIonS
The authors conclude that exposure at the AcGIH TLV of20ppm would protect workers from acute styrene toxici-ty, whereas the oSHA PEL of 100ppm would not protectexposed workers.
RevIeweR’S ConCluSIonS
It is difficult to interpret these findings meaningfully interms of workplace exposures. Exposure in an exposurechamber is unlike exposure in a work environment whereexercise and environmental conditions may affect theabsorbed dose. The experimental data for four subjectsprovides no evidence that short exposure to concentrationsup to 150ppm has adverse effects on the nervous system.
Ska B, Vyskocil A, Tardif R, Carrier G, ThuotR, Muray K, Viau C.
Effects of peak concentrations on theneurotoxicity of styrene in
volunteers. Human and Experimental Toxicology 2003; 22: 407-415.
aIM
To identify acute neurotoxic effects associated with shortterm exposure to current occupational exposure limits inQuebec (213mg/m3 (50ppm) 8 hour TWA and 426mg/m3
(100ppm) 15min average)
deSIgn
Experimental design, using an exposure chamber to com-pare the effects of five different exposure regimes.
SubjeCtS
42 healthy men aged 20-50 years. None had previousexposure to styrene or other neurotoxic agents although 5had had occasional exposure to paint solvents. All wereself-reported ‘social’ consumers of alcohol.
outCoMe
Three groups of tests were used to assess neurotoxic out-comes:
� Sensory: colour vision measured using a Lanthony d-15 desaturated panel; a vision contrast test; and an olfac-tory threshold test.
� Neurobehavioural: simple reaction time; colour wordstress test; symbol digit matching test; digit span memorytest; and continuous tracking test.
� A questionnaire to assess mood and symptoms.Symptoms included local irritation and central nervoussystem effects.
expoSuReS
Five exposure regimes each of 6 hours duration were used:
� constant 106mg/m3;� Variable exposure, mean concentration 106 mg/m3 butwith four 15min peaks up to 213mg/m3;� constant 213mg/m3;� Variable exposure, mean concentration 213 mg/m3
The SIrc review November 200690

neuRopSyChologICal effeCtS of StyRene expoSuRe:
RevIew of lIteRatuRe publIShed 1990 – 2003
(50ppm) but with peaks up to 426mg/m3 (100ppm);� Two stable low-level exposure to 5mg/m3. Used as a‘null exposure’ for physiological effects but with adetectable odour.
The test exposures were carried out in a constantsequence.
analySIS
Multivariate analysis of variance techniques were used toevaluate the effects of exposure on outcome measuresincorporating three factors: moment of measurement;type of exposure; and mean styrene concentration.
ReSultS
only results for subjects completing all exposures wereincluded in analyses (24 of 42 initial subjects). No signifi-cant effect of exposure on sensory tests was noted. In theneurobehavioual tests subjects had a faster reaction timeon the colour word stress test at the end of the dayregardless of exposure, although accuracy remainedunchanged; subjects had a faster response time on thesymbol digit matching test after exposure compared withbefore, and as they progressed through sessions; and sub-jects remembered a higher number of digits on the digitspan memory test as they progressed through sessions.No other significant effect was noted. No significanteffect of exposure on mood or symptoms was reported.
ConfoundIng
The before/after design reduced the opportunities forconfounding. There is little comment on the subjects whodid not complete testing. It is not stated why these indi-viduals discontinued their participation and it is notknown whether this might have biased the resultstowards the null. Period and order effects were not con-sidered in the analyses.
authoRS’ ConCluSIonS
Short term exposures up to 213mg/m3 (50ppm) withpeaks up to 426 mg/m3 (100ppm) did not induce neuro-toxic effects. caution should be exercised in extrapolatingthese results to occupational exposure situations.
RevIeweR’S ConCluSIon
This is a relatively large and well conducted experimentbut its extrapolation to the workplace is problematical.
Bio-available doses will have been lower for a given expo-sure in the exposure chamber as subjects were at rest. Inaddition, these exposures were relatively short term.Nonetheless, this study is reassuring about the acuteeffects of these levels of exposure in naïve individuals.
Stetkarova I, Urban P, Prochazka B, Lukas E.
Somatosensory evoked potentials inworkers exposed to toluene and
styrene. Br J Ind Med 1993; 50:520-527
aIM
To detect possible sub-clinical impairment in thesomatosensory pathway in workers exposed to styrene.
deSIgn
cross sectional study with an external non-exposed com-parison group and using normative reference data.
SubjeCtS
20 workers exposed to styrene (5 men and 15 women) ina factory making glass laminates. The comparison groupwas 13 male and 40 female volunteers without anyknown exposure to any neurotoxic agents. No informa-tion is given on how these were identified.
outCoMe
Somatosensory evoked potentials were measured usingelectrical stimuli delivered to the right median nerve atthe wrist and the right tibial nerve at the ankle. Peripheral,cervical and cortical sensory evoked potentials were mea-sured after stimulation at the wrist and spinal and corti-cal SEPs after stimulation to the tibial nerve. results ofthe sensory evoked potential measurements were consid-ered abnormal if any latency conduction time or conduc-tion velocity exceeded the 95% reference range.Abnormal SEPs were divided into three categories,peripheral, central or a combination of the two.
expoSuReS
Exposed subjects had a mean exposure for 11 years with
The SIrc review November 2006 91

neuRopSyChologICal effeCtS of StyRene expoSuRe:
RevIew of lIteRatuRe publIShed 1990 – 2003
85% exposed for more than 5 years with a maximum of22 years. For the period from 1980-1989 the styrene con-centration in air ranged from 140-570 mg/m3.
analySIS
Mean values in the outcome variable in the exposed andcomparison groups were examined using t-tests withmultiple regression to adjust for sex, age and height.
ReSultS
Six women were determined to have abnormal sensoryevoked potentials, two of the peripheral type, two centraland two with impairment on all SEP pathways. In a tableshowing the relation of abnormal SEPs to exposure eightabnormal cases (including males) are included with a dis-proportionately high (not statistically significant) numberin those with longer exposure duration. The 15 womenexposed to styrene had significantly slower peripheralconduction velocity and reduced latencies comparedwith the comparison group.
ConfoundIng
The methods section discusses use of multiple regressionin the examination of latency but it is not clear whetherthese were used in the final analysis. drinking habit wasconsidered but the values in the exposed group werevery similar to those in the comparison.
authoRS’ ConCluSIonS
The study shows evidence of functional impairment of allsomatosensory pathways indicative of potential toxicpolyneuropathy, myelopathy or encephalopathy due tochronic exposure to neurotoxic agents.
RevIeweR’S ConCluSIon
Although there are some problems in understandingsome aspects of this study (for example the choice ofcomparison group or the decision to exclude malestyrene workers from the analysis) it does not appear tobe intrinsically flawed. The use of somatosensory evokedpotentials is not open to manipulation by the subject. Itwould have been helpful however to have had a clearerdescription of how the proportion of abnormal potentialsin the exposed group compared to those in the compari-son group; no data on these differences in the comparisongroup are given.
Tsai S, Chen J.
Neurobehavioral effectsof occupational exposure to
low-level styrene. Neurotoxicology and Teratology 1996; 18:463-469.
aIM
To evaluate possible adverse effects of low level styreneexposure on central and peripheral nervous systems infibreglass reinforced plastics workers.
deSIgn
This was a cross sectional study with an internal non-exposed comparison group.
SubjeCtS
Workers in six manufacturing plants in Taiwan. 86 of 117were found to be eligible, could perform the testing andwere enrolled.
outCoMeS
Symptom information was collected using the SwedishQ16 symptom questionnaire. Tests of vibration and ther-mal threshold were carried out, with vibration measuredon the distal phalanx of the left index finger and the bigtoe, and the thermal test on the left forearm. A number oftests from the neurobehavioural evaluation system wereadapted for the chinese culture and language. Theyincluded the continuous performance test, associate learn-ing, symbol digit test, pattern comparison, pattern memo-ry, visual digit span, switching attention, and associatedelayed recognition. In addition, information on moodscales was collected and a vocabulary test was completed.
expoSuReS
The mean duration of employment was 8.3 years in thosewith direct exposure and 8.4 years in those with low orno exposure. Personal and area sampling was carried outto assess levels of styrene and other chemicals in theworkplace. The styrene measures were used to divide thepopulation into those with none or indirect exposure(mean styrene concentration 1.0 ppm) and those withdirect exposure including layering, cementing and spray-
The SIrc review November 200692

neuRopSyChologICal effeCtS of StyRene expoSuRe:
RevIew of lIteRatuRe publIShed 1990 – 2003
ing for whom the mean styrene concentration was 21.9ppm. Acetone and methyl ethyl acetone were detectedrarely and at very low levels.
analySIS
Multiple regression was used to adjust for possible con-founding and the Bonferroni Inequality used to takeaccount of multiple comparisons.
ReSultS
No difference was found in either acute or chronic symp-toms between the low and higher exposure groups. onbehavioural testing the scores on the continuous perfor-mance test were significantly lower in those with moreexposure, having taken account of the effects of age, sex,educational level and alcohol consumption. The vibrationperception threshold was higher in both the hand and thefoot for the exposed but no significant difference wasseen on the thermal threshold.
authoRS’ ConCluSIonS
The authors conclude that acute symptoms are not foundbelow 25 ppm. They note that chronic symptoms were notsignificantly related to exposure in this study but therewas a tendency for those with high exposure to be morelikely to complain of chronic symptoms. They note thathaving allowed for confounders the continuous perfor-mance test was significantly and adversely affected andfeel this result agrees with a consensus that reaction timeseems to be the most prominent effect of styrene exposure.They interpret the higher threshold for vibration as indi-cating that styrene affects the function of faster myelinat-ed fibers. They conclude by saying that subtle but signifi-cant changes involving neurobehavioural performanceand peripheral nervous function were detected in workersexposed to styrene at a mean dose of 22 ppm.
RevIeweR’S ConCluSIonS
Although workers were tested away from the factory, thetime away from exposure may have been for as little as 16hours and it is not certain that the effects involved, forexample on the continuous performance test, were due tochronic rather than acute effects of the substance. Whilethis paper shows the generally weak design of comparingexposed with unexposed workers, where issues of biasand confounding are difficult to overcome, in this instanceall were working in the fibreglass factories and the table
showing confounding does indeed suggest that theywere rather similar (except, perhaps, for years of educa-tion which is about 10 months longer in the less exposed).There is a comment that when the analyses were repeatedusing the vocabulary test instead of years of education,the results for the continuous performance test was mar-ginally less significant (p=0.06). Vibration perception hasbeen used rather little in styrene workers and has the dis-advantage it may be affected by a low motivation to per-form well. However it is of interest that the vibrationthreshold but not the thermal threshold is considerablydifferent in exposed and non-exposed, suggesting thatsuch motivational factors may not be very important.
Viaene M, Veulemans H, Masschelein R.
Experience with a vocabulary testfor workers previously and still
exposed to styrene. Scand J Work Environ Hlth 1998; 24:308-311.
Viaene M, Pauwels W, Veulemans H, et al.
Neurobehavioral changes andpersistence of complaints in workers
exposed to styrene in a polyesterboat building plant: influence of
exposure characteristics andmicrosomal epoxide hydrolase
phenotype. Occup Environ Med 2001; 58:103-112.
These two papers present data from the same studyand are considered together below.
aIM
The earlier paper seeks to explain, in terms of styreneexposure, an observed difference in vocabulary scorebetween present and current workers. The later paper hasthree aims, to compare symptoms and behavioural testscores in workers who have been exposed to styrene andcomparison workers who have not; to assess the relationbetween symptoms and test scores and industrial hygienedata in the exposed group; to examine whether there wasa link between microsomal epoxide hydrolase (mEH) andtest performance in workers exposed to styrene.
The SIrc review November 2006 93

neuRopSyChologICal effeCtS of StyRene expoSuRe:
RevIew of lIteRatuRe publIShed 1990 – 2003
deSIgn
This was a mixture of a cohort and cross sectionaldesigns. To enter the cohort workers had to have beenemployed in a single boat building plant sometimebetween 1984-1987. A comparison group was chosenfrom amongst people working in another plant, withoutexposure, at the time of follow-up. Although exposuremeasurements had been made in 1984-1987, all outcomedata was collected at a single point, from 1992-1993.Blood for phenotyping was collected in 1994-1995.
SubjeCtS
185 workers who had been previously involved in expo-sure studies of styrene were traced and of these 117 par-ticipated. A comparison group of 64 non-exposed work-ers were recruited from a possible 111.
expoSuRe
detailed hygiene studies had been carried out in plant bythe research group in 1984-1987. Individual records werekept for every worker on the tasks he carried out and thispermitted calculation of the exact number of hours ofexposure to styrene from 1982-1989 for formerly exposedworkers (who were laid off at this point) and to 1993 forcurrent workers. currently exposed workers (n=27) hadan average of 4700 hours of lamination compared with3610 hours of lamination in the formerly exposed (n=90).The mean time weighted exposure for currently exposedworkers was only 68 mg/m3 and for formerly exposed 17mg/m3. concentrations while laminating were 148mg/m3 and 157 mg/m3 respectively.
outCoMe
Behavioural testing included, as reported in the earlierpaper, the dutch version of the vocabulary test of theNeurobehavioural Examination System and, as reportedin the later paper, performance tests from the same bat-tery; namely, hand-eye coordination, simple reactiontime, symbol digit substitution, associated learning, asso-ciated recall, digit span and color word vigilance. Thesubjects completed a 60 item questionnaire (the neurotox-icity symptom checklist) and were interviewed abouttheir memory of complaints while they were at workwith styrene and, if never exposed, in their present job.
analySIS
In the earlier paper, vocabulary score was related to dura-tion of exposure, having adjusted for years of educationand age, in the group as a whole and in those previouslyexposed compared to those currently exposed. In the sec-ond paper, where the comparison group is included,comparisons were made between scores in those current-ly exposed, those formerly exposed and the comparisongroup. The statistical analysis included one-way analysisof variance, Fisher’s exact test, multiple linear regressionand multiple logistic regression.
ReSultS
The earlier paper showed a significant relation betweenvocabulary score and duration of exposure that appearedto be similar for those still employed and those formerlyemployed. No relation was found with level of exposure.The vocabulary score of the still exposed group was sig-nificantly lower than that of those who had been laid offthree years earlier. In the later paper scores on the symboldigit substitution, digit span forward and hand-eye coor-dination (in former employees) appeared to be worsethan those for the comparison group. The informationgiven in the text does not appear to be identical to that inthe tables but the text has been given priority. Theexposed workers (including those currently exposed)remembered having more complaints at work than thecomparison group did, and that diminished taste sensi-tivity persisted to the time at which the inquiry was car-ried out. Full details are not given of the results of the 60item questionnaire but it appears that formerly exposedworkers had worse scores than currently exposed. In amodel including duration of exposure those with highermEH (the faster metabolizers) did worse on the symboldigit substitution test, on the color word vigilance testand on the digit span test.
ConfoundIng
Substantial differences were found in the educationallevel of currently exposed (the lowest), formerly exposed(intermediate) and comparison group (highest) educa-tional level. This is a serious problem (see below). othercomparisons made included alcohol consumption, hoursslept at night, smoking, and motivation. No statisticaldata are given but these appear to be very similar. Nomention is made of any other chemicals that may havebeen present in the work environment.
The SIrc review November 200694

neuRopSyChologICal effeCtS of StyRene expoSuRe:
RevIew of lIteRatuRe publIShed 1990 – 2003
authoRS’ ConCluSIonS
In the earlier paper, the authors conclude that the use ofshort vocabulary tests to estimate pre-morbid capacity(as “hold tests”) may be limited as they are affected byexposure. In the second paper, the authors conclude thatsome subjective symptoms or complaints and neurobe-havioural effects in workers were persistent even at TWAexposure concentrations thought to be safe in the 1980s.The results suggest that less than 10 years of exposure toa mean concentration of styrene of 155 mg/m3 may resultin persistent neurotoxic effects.
RevIeweR’S ConCluSIonS
This study has many problems. First, the design is veryweak. The collection of symptom complaints from agroup of workers who had been laid off for three years,and for whom the method of parting may not have beenideal, raises serious questions of interpretation. As inalmost all symptom studies, the use of an unexposedcomparison group does not permit any firm conclusions.As such, the symptom data in these papers is not veryuseful. The data from behavioural testing is also difficultto interpret. First there is the problem of the earlier paperin which duration of exposure was seen to be associatedwith vocabulary score. As might be expected, vocabularyscore is related to years of education in this study.Amongst the former workers those who agreed to takepart had a higher educational level than those stillemployed, but as is apparent from the second paper,those who refused to participate had a much lower one.years of education was also negatively correlated withduration of exposure (not significantly). In interpretingthis entire study it is critical to decide whether the rela-tion between duration of exposure and vocabulary scoreis due to inadequate adjustment for confounding or is areal effect. The authors conclude it is real, but it is some-what strange that they make no mention in the secondpaper of the fact they have this vocabulary test data. Itwould have been interesting to know if adjusting forvocabulary score would have removed all the neurobe-havioural differences described.
Viaene M, Pauwels W, Veulemans H, et al.
Neurobehavioral changes andpersistence of complaints in workers
exposed to styrene in a polyesterboat building plant: influence of
exposure characteristics andmicrosomal epoxide hydrolase
phenotype. Occup Environ Med 2001; 58:103-112.
See Viaene M, Veulemans H, Masschelein R.
Experience with a vocabulary testfor workers previously and still
exposed to styrene. Scand J Work Environ Hlth 1998; 24:308-311.
Welp E, Kogevinas M, Andersen A, BellanderT, Biocca M, Coggon D, Esteve J, Gennaro V,Kolstad H, Lundberg I, Lynge E, Partanen T,
Spence A, Boffetta P, Ferro G, Saracci R.
Exposure to styrene and mortalityfrom nervous system diseases and
mental disorders. Am J Epidemiol 1996; 144:623-33.
aIM
To examine mortality from diseases of the nervous sys-tem, mental disorders and suicide in relation to styreneexposure.
deSIgn
cohort mortality study.
SaMple
41,167 workers at 660 reinforced plastic plants were iden-tified from 6 European countries. Those with no styreneexposure or with unknown date of birth, date of firstemployment or gender were excluded, leaving 35,443. ofthese 44.8% were from denmark, 20.9% from the UK,15.2% from Italy, 8.5% from Sweden, 5.9% from Finlandand 4.8% from Norway. Most of the workers werebelieved to be in laminating tasks.
The SIrc review November 2006 95

neuRopSyChologICal effeCtS of StyRene expoSuRe:
RevIew of lIteRatuRe publIShed 1990 – 2003
expoSuRe
An exposure matrix was constructed by country and cal-endar period using job title, type of product and methodof production. The methods used were not clearly statedin the paper but it appears that a database was createdusing personal exposure measurement and urinarymetabolites, with extensive data before 1970 only beingavailable for denmark. occupational records wereobtained from payroll data at each plant or, in denmark,from the national pension scheme. Exposure levels werethought to have decreased from around 200 ppm before1970 to around 40 ppm by 1990.
The time from first exposure, cumulative exposure,average exposure, and duration of exposure were calcu-lated.
outCoMeS
No description is given of the method of determiningvital status or cause of death. causes of death of particularinterest were mental disorders, diseases of the nervoussystem and suicide. For internal comparisons a moredetailed examination of cause of death was possible.
analySIS
Standardized mortality ratios were calculated usingnational mortality rates by sex, age and calendar period.The follow-up for the mortality study started at the firstexposure to styrene or the first date from which completepayroll information was available. The period of follow-up differed between countries with the longest being1945-1990 in the UK and the shortest 1970-1990 indenmark. A total of 446,784 person years with an averageof 12.6 years of follow-up was available for the externalanalysis and 405,967 with an average of 12.4 years for theinternal comparisons. Poisson regressions were used forthe internal comparisons with the pattern of the doseresponse for duration and cumulative exposure beingexamined using more complex regression models.
ReSultS
The external comparison showed no excess from all causes(SMr=0.96, 95% cI 0.92-1.00) from mental disorders(SMr=1.01, 95% cI 0.62-1.54) or from disease of the ner-vous system (SMr=0.76, 95% cI 0.51-1.09). There was anexcess of external causes of death (SMr=1.13, 95% cI 1.02-1.25) which was reflected in an increased rate of suicide(1.10) and other violent causes (1.17). For the internal com-
parisons 27 of the 30 deaths from diseases of the nervoussystem were analysed in relation to time since first expo-sure, duration, average exposure and cumulative expo-sure having adjusted for country, age, calendar year andsex. Trends were observed by each of these exposure vari-ables, with significant trends being seen for duration ofexposure and cumulative exposure. consistent trendswith exposure parameters were also seen for sub-groupsof epilepsy (N=7) and for the 11 deaths from degenerativenervous system diseases, of which 7 may have been ALS.Both mental disorders and suicide were more frequentlyseen in those with exposure duration of less than one year.
ConfoundIng
The internal comparisons adjusted for country, age, cal-endar year and sex but no information was available onother workplace or lifestyle confounders.
authoRS’ ConCluSIon
Mortality from central nervous system diseases and espe-cially those from epilepsy increased with exposure tostyrene. They comment that selection out of employmentby sick individuals will have attenuated the dose responserelationships. They also point out that, because of thesmall numbers, the results must be treated with caution.
RevIeweR’S ConCluSIonS
Although the numbers of cases overall, and for epilepsyin particular, are very small, the pattern of increased riskwith duration and cumulative exposure is suggestive ofsome risk associated with styrene. However the estimatesmust be considered very unstable and this follow-up of acohort is probably too soon, with less than 7% of deathswithin the cohort to date, to truly evaluate whetherstyrene was related to degenerative disease of the ner-vous system. In any further follow-up the lack of infor-mation on confounding by lifestyle factors might be animportant limitation.
The SIrc review November 200696

neuRopSyChologICal effeCtS of StyRene expoSuRe:
RevIew of lIteRatuRe publIShed 1990 – 2003
Wong O, Trent LS.
Mortality from nonmalignantdiseases of the respiratory,
genitourinary and nervous systemsamong workers exposed to styrene
in the reinforced plastics andcomposites industry in the United
States. Scand J Work Environ Hlth 1999; 25:317-25.
aIM
To determine mortality from diseases of the nervous sys-tem and other diseases in a US cohort of styrene exposedworkers.
deSIgn
cohort mortality study.
SubjeCtS
The cohort consisted of 15,826 styrene exposed workersin 30 plants with inclusion limited to those who hadworked in areas with styrene exposure for at least sixmonths between 1 January 1948 and 31 december 1977.
expoSuRe
A job exposure matrix had been established by a team ofoccupational hygienists who visited each plant around1980. This was based on job titles (reduced to a list of 19 jobcategories) and history of job functions, work practices,past industrial hygiene measurements, process changes,engineering control and personal protective equipment inuse. Levels of styrene were measured in 1980. These wereused to produce a cumulative exposure in ppm-years. Inaddition 6 process categories were created. Typical expo-sures were low, with the majority of jobs being estimatedto have exposure of 10 ppm or less. Exposure informationwas truncated in 1977, at the end of the initial study.
outCoMe
Vital status at 31 december 1989 was determined by allmeans available. This information was used to obtaindeath certificates from individual state health depart-ments. Analysis against external referents used US
national age-gender-year specific death rates to computecause-specific standardized mortality ratios. Because racewas not generally available, the entire cohort wasassumed to be white. Internal analyses were performedusing cox’s proportional hazards analyses.
ReSultS
In the SMr analysis no excess was found for diseases ofthe nervous system with only 14 (all male) deaths (2 fromepilepsy); indeed the SMr 0.56 (95% cI 0.51-0.95) sug-gested a deficit of such disease. When these 14 cases weredivided into time since first exposure there was anincrease in SMr from 0.10 for those with less than 10years from first exposure to 0.68 for those exposed 10-19years and 1.13 for those exposed for more than 20 years.When a similar analysis was carried out by duration ofexposure the highest SMr (1.03) for diseases of the ner-vous system was seen for deaths in those who had aduration of more than 10 years, the highest exposure cat-egory. For cumulative and average exposure, the highestSMr was for intermediate categories. When the deathswere broken down by industrial process no death fromdiseases of the nervous system was seen for those in theopen mould process or mixed and closed mould process-es, where exposure would be expected to be highest. Acox regression with age and cumulative exposure asindependent variables showed no relation to diseases ofthe nervous system. A further analysis including age,cumulative exposure, duration and average intensity alsoshowed no excess risk for this outcome.
ConfoundIng
The cox regression adjusted for age and gender and theSMr for era. Information was not available for lifestylefactors that may have acted as effect modifiers (particu-larly alcohol). computation of SMrs by major processcategories might have allowed identification of otherworkplace exposures that were acting as confounders.
authoR’S ConCluSIonS
The authors conclude there was no increased mortalityfrom diseases of the nervous system in general or fromepilepsy in particular and that no pattern of mortalitywas found in relation to styrene exposure. They go on tocomment that the levels of exposure in the US cohortwere relatively low and that the number of deaths wassmall. They concluded that the power to detect a modestincrease in risk was low.
The SIrc review November 2006 97

neuRopSyChologICal effeCtS of StyRene expoSuRe:
RevIew of lIteRatuRe publIShed 1990 – 2003
RevIeweR’S ConCluSIonS
With only 14 deaths the opportunities for analysis of thiscohort was limited. However, it would have helped tohave seen more detail of the internal analyses. There issome uncertainty about the interpretation of Table 7 and8 as there may well have been considerable correlationbetween age (measured when?) and cumulative exposureand, in Table 8, cumulative exposure, duration and aver-age intensity. It would have been helpful to have sometabulations of rates by grouped factors from the internalanalysis. While this would have been informative, it isunlikely to detract from the overall conclusion of thepaper that no excess is present.
Yokoyama K, Araki S, Murata K.
Effects of low level styrene exposureon psychological performance in
FrP boat laminating workers. Neurotoxicology 1992; 13:551-556.
See Murata K, Araki S, Yokoyama K.
Assessment of the peripheral,central and autonomic nervous
system function in styrene workers. Am J Ind Med 1991; 20: 775-784.
Yuasa J, Kishi R, Eguchi T, Harabuchi I,Arata Y, Katakura Y, Imai T, Matsumoto H,
Yokoyama H, Miyake H.
Study of urinary mandelic acidconcentration and peripheral nerveconduction among styrene workers.
Am J Ind Med 1996; 30:41-7.
aIM
To determine whether a low level of styrene exposure canaffect the central nervous system and to clarify the para-meter of electrophysiological response is most sensitiveto early change in styrene exposed workers.
deSIgn
cross sectional study with an external comparison groupof unexposed subjects.
SubjeCtS
32 exposed subjects (27 men and 5 women) were identi-fied in three Japanese factories employed in the manufac-ture of plastic materials. The comparison group existed of23 men and 5 women who were clerical workers.
outCoMe
Measures of conduction velocity were made in the ulnarand peroneal nerves and of sensory conduction in theulnar and sural nerves. Latency, amplitude and durationof the action potential were also measured. Six symptomsof peripheral neuropathy were examined.
expoSuReS
Subjects had been exposed for a mean of 11.6 years (range1.3-27 years). They were exposed to styrene for 7 hoursdaily and wore gloves but not masks. End of shift urinesamples were collected on the Monday evening after ashift at work. Mandelic acid concentrations were groupedinto low and high, where “high” was more than 250mg/l. The maximum airborne concentration was 117ppm but levels were usually less than 10 ppm.
analySIS
Paired t-tests and analysis of variance were used to com-pare the nerve conduction parameters between exposedand comparison groups. Pearson correlations were usedto examine the relationship between urinary mandelicacid and nerve conduction. Multiple regression adjustedfor confounding.
ReSultS
Motor distal latencies in the ulnar and peroneal nerveswere longer for the group with the highest mandelic acidthan for those with low exposure or in the comparisongroup. Motor nerve conduction velocity was significantlyslowed in the group with the highest level of mandelicacid and some depression in sensory cV was seen also.There was in general no correlation between mandelicacid and the neurophysiological measures, but there wasa weak relation with peroneal motor distal latency. In a
The SIrc review November 200698

neuRopSyChologICal effeCtS of StyRene expoSuRe:
RevIew of lIteRatuRe publIShed 1990 – 2003
multiple regression analysis, having included estimatesof relevant confounders (age, height, weight, body massindex, number of cigarettes smoked, alcohol consump-tion and skin temperature) urinary mandelic acid concen-tration was significantly related to ulnar and peronealmotor distal latencies. No relation was found betweenreported symptoms and exposure.
ConfoundIng
Information was collected, and included in parts of theanalysis, on height, weight, body mass index, skin tem-perature and alcohol intake. No mention is made of otherchemicals at work that might have acted as confounders.
authoRS’ ConCluSIonS
A low concentration of styrene affected the peripheralnervous system. Motor distal latencies of the upper andlower extremities seem to be sensitive parameters fortoxic neuropathy induced by styrene exposure.
RevIew’S ConCluSIonS
It is not clear that clerical workers are the most appropri-ate comparison group but collection of the informationon some of the more obvious confounders might haveminimized the importance of any unmeasured con-founders. Although the authors make considerable playof the relatively low levels in which they observed effects(most workers currently exposed to 10 ppm for most ofthe time) much higher values may have been encoun-tered in the past and this is not discussed. It should alsobe noted that no overall difference on any neurophysio-logical factor was seen. All the differences reported arewithin sub-group analysis of those of relatively high ver-sus low levels of mandelic acid.
APPENdIx – LIST oF PAPErS
1. Bergamaschi E, Mutti A, cavazzini S. et al. Peripheralmarkers of neurochemical effects among styrene-exposedworkers. Neurotoxicology 1996; 17:753-760.
2. Bergamaschi E, Smargiassi A, Mutti A, et al. Peripheralmarkers of catecholaminergic dysfunction and symptomsof neurotoxicity among styrene-exposed workers. IntArch occup Environ Health 1997; 69:209-214.
3. challenor J, Wright d. Aggression in boat builders: asearch for altered mood states in boat builders exposed tostyrene. occup Med (oxford) 2000; 50:185-92.
4. checkoway H, costa LG, camp J, coccini T, daniellWE, dills rL. Peripheral markers of neurochemical func-tion among workers exposed to styrene. Br J Ind Med1992; 49:560-5.
5. Edling c, Anundi H, Johanson G. et al. Increase in neu-ropsychiatric symptoms after occupational exposure tolow levels of styrene. Br J Ind Med 1993; 50:843-850.
6. Geuskens r, Klaauw M, Tuin J. et al. Exposure tostyrene and health complaints in the dutch glass-rein-forced plastics industry. Ann occup Hyg 1992; 36:47-57.
7. Jegaden d, Amann d, Simon JF, Habault M, Legoux B,Galopin P. Study of the neurobehavioural toxicity ofstyrene at low levels of exposure. Int Arch occup EnvironHlth 1993; 64:527-31.
8. Kolstad H, Juel K, olsen J, Elsebeth L. Exposure tostyrene and chronic health effects: mortality and inci-dence of solid cancers in the danish reinforced plasticsindustry. occup Environ Med 1995; 52:320-327.
9. Letz r, Mahoney F, Hershman d, et al.Neurobehavioral effects of acute styrene exposure infiberglass boatbuilders. Neutoxicology and Teratology1990; 12: 665-668.
10. Matikainen E, Forsman-Gronholm L, Pfaffli P,Juntunen J. Nervous system effects of occupational expo-sure to styrene: a clinical and neurophysiological study.Environmental research 1993; 61:84-92.
11. Mergler d, Huel G, Belanger S, Bowler rM, TruchonG, drolet d. Surveillance of early neurotoxic dysfunction.Neurotoxicology 1996; 17:803-12.
12. Murata K, Araki S, yokoyama K. Assessment of theperipheral, central and autonomic nervous system func-tion in styrene workers. Am J Ind Med 1991; 20: 775-784.
13. Pierce cH, Becker cE, Tozer TN, owen dJ, So y.Modeling the acute neurotoxicity of styrene. J occupEnviron Med 1998; 40: 230-240.
The SIrc review November 2006 99

neuRopSyChologICal effeCtS of StyRene expoSuRe:
RevIew of lIteRatuRe publIShed 1990 – 2003
14. Ska B, Vyskocil A, Tardif r, carrier G, Thuot r, Muray K, Viau c. effects of peak concentrations on the neurotoxicity of styrene in volunteers. Human andExperimental Toxicology 2003; 22: 407-415.
15. Stetkarova I, Urban P, Prochazka B, Lukas E.Somatosensory evoked potentials in workers exposed totoluene and styrene. Br J Ind Med 1993; 50:520-527.
16. Tsai S, chen J. Neurobehavioral effects of occupation-al exposure to low-level styrene. Neurotoxicology andTeratology 1996; 18:463-469.
17. Viaene M, Veulemans H, Masschelein r. Experiencewith a vocabulary test for workers previously and stillexposed to styrene. Scand J Work Environ Hlth 1998;24:308-311.
18. Viaene M, Pauwels W, Veulemans H, et al.Neurobehavioral changes and persistence of complaintsin workers exposed to styrene in a polyester boat build-ing plant: influence of exposure characteristics andmicrosomal epoxide hydrolase phenotype. occupEnviron Med 2001; 58:103-112.
19. Welp E, Kogevinas M, Andersen A, Bellander T,Biocca M, coggon d, Esteve J, Gennaro V, Kolstad H,Lundberg I, Lynge E, Partanen T, Spence A, Boffetta P,Ferro G, Saracci r. Exposure to styrene and mortalityfrom nervous system diseases and mental disorders. AmJ Epidemiol 1996; 144:623-33.
20. Wong o, Trent LS. Mortality from nonmalignant dis-eases of the respiratory, genitourinary and nervous sys-tems among workers exposed to styrene in the reinforcedplastics and composites industry in the United States.Scand J Work Environ Hlth 1999; 25:317-25.
21. yokoyama K, Araki S, Murata K. Effects of low levelstyrene exposure on psychological performance in FrPboat laminating workers. Neurotoxicology 1992; 13:551-556.
22. yuasa J, Kishi r, Eguchi T, Harabuchi I, Arata y,Katakura y, Imai T, Matsumoto H, yokoyama H, MiyakeH. Study of urinary mandelic acid concentration andperipheral nerve conduction among styrene workers. AmJ Ind Med 1996; 30:41-7.
The SIrc review November 2006100

The SIrc review November 2006 101
The Effect of Styrene Exposure oncolor Vision: A review
Gregory W. Good, OD PhD, Jason J. Nichols, OD MS MPH1
Styrene exposure, at
high levels, is associated
with color vision
deficiency. however, the
magnitude of these
deficiencies is relatively
minor, especially
relative to congenital
color vision defects and
it is unlikely that the
level of defect would
have much functional
significance.
ABSTrAcT
Introduction
Styrene (cAS rN 100-42-5) is an organic,lipid soluble chemical that has been report-ed to have several health effects. Inhumans, styrene exposure in the workplacehas been primarily associated with effectson the nervous system. As such, it isthought that color vision assessments mayplay an important role in determining theneurotoxic status of individuals exposed tostyrene. The purpose of this report was toreview the scientific literature in order todetermine the relation between styreneexposure and color vision loss.
Methods
A primary literature search was conductedusing MEdLINE and other scientific jour-nal sources for the terms “styrene” and“color vision,” and 23 articles were identi-fied. However, not all 23 articles identifiedfrom the primary search were reviewed;
three were in a non-English language, andfour were review-type articles or peripher-ally related to the topic.1-7 Two letters to theeditor, 14 original research articles, andthree case series/animal studies wereincluded in the review and assessments.Articles were reviewed generally in termsof their overall study design and epidemio-logical methods, color vision test methods,styrene exposure assessment, sample size,control selection, recruitment procedures,statistical methods, internal and externalgeneralizability, and impact of results onthe workforce/workplace (if applicable).
Results
Most all studies reviewed were cross-sec-tional in nature, whereby individuals weresampled based on styrene exposure withthe assumption that they would havealtered color vision. control groups weregenerally sampled from other manufactur-ing plants, or from other sources (i.e., con-venience samples). Styrene exposures wereassessed by air samples (personal or area)for ambient levels and through urinaryconcentrations of mandelic acid (MA) orphenylglyoxylic acid (PGA), which are themajor urinary metabolites of styrene. Moststudies used the Lanthony desaturated d-15 (dd-15) panel arrangement color test toassess color vision, given its sensitivity tovery mild color vision alterations; the testwas usually scored using the colorconfusion Index (ccI). Seven studiesshowed that, compared to controls,styrene-exposed workers had significantly
1The ohio State University college ofoptometry, columbus, oH
corresponding Author and Addressreprint requests:Gregory W. Good, od Phd, oSU collegeof optometry, 320 West 10th Ave., Po Box182342, columbus, oH 43218, E-mail:[email protected]
Key Words: Styrene, dose response, colorvision, dyschromatopsia, cAS rN 100-42-5

the effeCt of StyRene expoSuRe on ColoR vISIon: a RevIew
higher ccI values where the range of the ccI for the highexposure groups was 1.14 to 1.33, while the range of ccIvalues for the low exposure groups was 1.02 to 1.17.Studies tested for further dose-response type effects ofstyrene exposure by dichotomizing ccI values based onvarious styrene exposure levels, or through correlationand/or preferably, regression analyses in which styreneexposure was used to predict the ccI in the exposedsample. Six studies showed a relation between higherexposures (greater than 20-50 parts per million) and colorvision deficiency, compared to control groups. often, lowexposure groups did not significantly differ from the con-trol group, or population, age-specific normal values forthe test. Two studies were able to show that styrene expo-sure levels were able to predict the ccI. Some prelimi-nary evidence suggests that the mechanism of colorvision loss associated with styrene is retinal, rather thanin the optic nerve or higher processing levels.
Conclusions
Styrene exposure, at high levels, is associated with colorvision deficiency. However, the magnitude of these defi-ciencies is relatively minor, especially relative to congeni-tal color vision defects and it is unlikely that the level ofdefect would have much functional significance. The lit-erature seems to support the notion that styrene levelsabove 50 ppm may lead to alterations in color vision,although the exact exposure dose is unclear. Workers per-forming tasks associated with high styrene exposure lev-els should use precaution and personal protective deviceswhen possible (i.e., respirators). Questions that remainunanswered included the contributing exposure (i.e.,local vs. systemic), the proximate toxicant (styrene or itsmetabolites), functional significance of the color visiondefect, permanency of color vision loss associated withthe exposure, the type of color vision (i.e., red-green vs.blue-yellow), and the exact mechanism of action ofstyrene exposure on color vision loss in the ocular system.
INTrodUcTIoN
Theories of Color Vision and Congenital Color Vision
Deficiencies
Human color vision is possible due to the three compo-nent (trichromatic) color processing system in a normalvisual system.8 The perception of color is based on thedifferential responses across these three systems; i.e., theshort-wavelength (blue), middle-wavelength (green), andlong-wavelength (red) sensitive systems. About 92% ofmales and over 99% of females possess these normal reti-
nal components.9 of the 8% of males and 0.4% of femaleswho have inherited abnormal components, color discrim-ination can vary from near normal to severely inferior.
Many non-human land-animals possess dichromaticvisual systems.10 only the short wavelength-sensitive anda single, medium wavelength-sensitive photopigments arepresent to allow color interpretation. Although somehumans inherit a dichromatic color system, this is anabnormal condition. Normal human color vision is tri -chromatic, arising from the three types of retinal cone cells.
The genes for the middle (green) and long (red) wave-length-sensitive photopigments are carried on the x chro-mosome.11 As the abnormal genes are recessive in nature,red-green color vision deficiencies are therefore inheritedin a sex-linked recessive pattern. The two longer wave-length-sensitive pigments in human photoreceptors areextremely similar in chemical composition (vary at only15 of the 364 amino acid sites). Additionally, the twogenes responsible for their development are in juxtaposi-tion near the distal end of the long arm of the x chromo-some. The close proximity of the two genes and the near-ly identical amino acid sequences suggest that these twophotopigments evolved from a single gene. The presenceof these two photopigments sensitive across the longwavelength end of the spectrum allows for greater dis-crimination of greens from yellows from reds, and thus isthought to provide for better ability to search for ripefruit and vegetables.12
red-green color vision deficiencies affect 8% of malesand 0.4% of females. Approximately 2% of males (and0.05% of women) are limited by a two color system(dichromatic). These individuals must judge all colorsusing only the short wavelength-sensitive and either themiddle or the long wavelength-sensitive systems.Although these individuals are not totally “color-blind,”their color is substantially reduced. colors which are eas-ily perceived as different by color vision normals can lookidentical and be confused by dichromats, and therefore,color naming errors are commonplace.
Six percent of males (and 0.35% of women) have threecomponent systems, however, one of the two longerwavelength-sensitive components (either the middle orthe long wavelength sensitive components) has an abnor-mal sensitivity. The abnormal red-green photopigmentshave sensitivities that are shifted relative to normal suchthat less difference between the middle and long wave-length sensitive photopigments is found. These anomalous
trichromats can have widely varying color discrimina-tion. Mild anomalous trichromats can perform most colordiscrimination tasks as well as those with normal colorvision, while severe anomalous trichromats have very
The SIrc review November 2006102

the effeCt of StyRene expoSuRe on ColoR vISIon: a RevIew
reduced color discrimination and often can not be differ-entiated functionally from dichromats.
The gene for the short wavelength photopigment ispresent on chromosome 7.13 Although a genetic abnormal-ity in the short-wavelength photoreceptor is consideredrare, its inheritance pattern is dominant. The prevalenceof congenital tritanopia is thought to be 1 in 10,000.14
Because of the rarity of the condition, testing for its pres-ence is seldom accomplished in normal clinical practice.
red-green color vision defects in females are relativelyrare due to their sex-linked recessive inheritance pattern.An interesting note is that females that are heterozygousfor color vision defects may show mildly abnormal dis-crimination abilities. This can occur with the inactivationof the dominant gene in a cell of the developing fetus.This process was first described by Lyon and has beentermed “lyonization.”15 Thus, a single cell, and ultimatelyall of its daughter cells, may display a “recessive” charac-teristic in spite of a dominant allele being present.Lyonization occurs in many x-linked conditions of theeye.16 Modern genetic testing has shown that this x-inac-tivation is related to methylation and unmethylation onthe activated x-chromosome and inactivated chromo-some, respectively.17 The process is random, thus, por-tions of the retina will display a color vision defect, whileothers will not.18
Several investigators have described mildly reducedcolor discrimination for female carriers of color visiondefects.18-22 These deficiencies are relatively minor andhave little effect upon everyday activities; however, whenconducting color vision research or when assessing theeffects of toxins and the mild acquired defects they maycause, it is imperative to be aware of this effect.Approximately 15% of females will be heterozygous forcolor vision deficiency. Therefore, care must be takenwhen choosing females for test and/or control subjectsfor color vision testing.
color vision is possible for humans because of thethree cone photopigments present in the normal retina.Very early in the visual pathway, however, opponentneural processing is found.8 This color-opponent process-ing leads to the presence of 4 fundamental colors insteadof 3; red, yellow, green, and blue. The red, green, and bluefundamental colors are typically believed to result fromdirect input from the long (red), middle (green), andshort (blue) wavelength sensitive retinal photopigments.The input for the yellow signal results from the neuraladdition of the middle (green) and long (red) wavelengthsensitive systems. In 1870, Ewald Hering recognized thatcolors had specific opponent colors which lead to variousperceptual effects. This led Hering to propose his “oppo-
nent” color theory. In this theory, red is opposed to green,yellow is opposed to blue, and white is opposed to black.Modern day ‘zone’ theories of color vision describetrichromatic processing at the outer-retinal (receptor)level and opponent processing within the inner retinaand along the visual pathway to within the visual cortex.due to the paired color opponents and the differentialmode of inheritance, color vision defects are often termedas either red-green or blue-yellow.
The SIrc review November 2006 103
fIguRe 1
cIE-xyZ color diagram. The monochromatic spectralcolors are represented as shown. White is at the “middle”of the diagram at x=0.33, y=0.33. colors add in the diagramalong straight lines according to the “center of gravity”principle. If equal amounts of color A and B are added, theresulting color, c, is on a straight line exactly halfwaybetween the two. colors are graphed within this diagramby measuring the relative amount of each of three prima-ry colors (colors x, y, and Z for this standard diagram)which must be mixed in the precise amounts to exactlymatch the color in question. The relative amount of prima-ry x in the mixture is represented along the “x” axis, while
that for primary y is represented along the “y” axis.
0 0.1 0.2 0.3 0.4 0.5 0.6 0.7 0.8
x
y
0.9
0.8
0.7
0.6
0.5
0.4
0.3
0.2
0.1
0.0
520
500
480
380460
540
560
580
B
c
A
+ white
600
620
700

the effeCt of StyRene expoSuRe on ColoR vISIon: a RevIew
Color Space and Color Discrimination Deficits
The “trichromatic” nature of human color vision was firstexpressed in a formal theory by Thomas young around1800.
8
The functional consequence of a three-receptorcolor system is that all colors can be exactly matched bymixing together only three appropriately chosen primarycolors. Precisely mixing three colors to match all possiblecolors allows for color space to be mathematically repre-sented. Figure 1 illustrates the cIE (commissionInternationale de l’Eclairage) xyZ color diagram.8 Thepositions of specific colors are determined by the relativeamounts of each of 3 primary colors (primary x, primaryy, and primary Z) which must be mixed to match a spe-cific color exactly. The relative amount of the x primary isrepresented along the “x” axis, while that for the y prima-ry is represented along the “y” axis. The relative amountof the Z primary required in the mixture of primaries isnot shown on the diagram. This value can be calculated,however, by knowing that within the diagram, the x, yand z coordinates always sum to 1. Using this diagram,the color resulting from a mixture of two colors (color Aand B in Figure 1) is found along a straight line joiningthe two colors at a point determined by the amount ofeach of the two colors in the mixture (center of gravityprinciple).
color vision defectives that have only a two-receptorvisual system (dichromats) do not see the wide range ofcolors seen by color vision normals. The color diagram,therefore, provides excess information for these dichro-mats. Figure 2 illustrates “confusion lines” for the threetypes of dichromats. All colors along a single line will beconfused, i.e., seen as identically matching, for the indi-cated type of defect. These lines of confusion are usedwhen designing color vision tests. For example, colortests using pseudoisochromatic plates will use color “A”in Figure 3 for background dots on plate and use color“B” for the test numeral. For this example, red(protanopic) or green (deuteranopic) dichromatic subjectswill not see the difference in color and will be unable torecognize the numeral. color vision normals will be ableto discriminate the different colors for the backgroundand the test numeral and will see the “hidden” numeral.The background and numeral colors do not lie along thesame confusion line for blue (tritanopic) dichromats.Thus, a tritanopic subject will also be able to see the figure.
Because the protanopic and deuteranopic color confu-sion lines are nearly parallel in most of the color diagram,it is difficult to use many color vision tests to discriminatebetween these types of defects. The tritanopic color confu-sion lines, however, are drastically different than the “red-
The SIrc review November 2006104
fIguRe 2
color confusion Lines on cIE-xyZ diagram. The color confusion lines for the three types of dichromats (A-protanope,B-deuteranope, c-tritanope) with the lines of color confusion radiating from the confusion points. colors which graphalong a confusion line appear identical to the respective type of dichromat.
a. Cb
0 0.1 0.2 0.3 0.4 0.5 0.6 0.7 0.8
x
y
0.9
0.8
0.7
0.6
0.5
0.4
0.3
0.2
0.1
0.0
y
0.9
0.8
0.7
0.6
0.5
0.4
0.3
0.2
0.1
0.0y
0.9
0.8
0.7
0.6
0.5
0.4
0.3
0.2
0.1
0.00 0.1 0.2 0.3 0.4 0.5 0.6 0.7 0.8
x0 0.1 0.2 0.3 0.4 0.5 0.6 0.7 0.8
x
520
500
480
380460
540
560
580
600620
700
+ white
520
500
480
380460
540
560
580
600620
700
+ white
520
500
480
380460
540
560
580
600620
700
+ white

green” confusion lines. When analyzing the results ofcolor vision testing, the “axis” of the color confusions isnoted to help diagnose the type of defect that is present.
coNGENITAL VErSUS AcQUIrEd coLor VISIoNdEFEcTS
deficiencies in color discrimination are frequently causedby genetic abnormalities resulting in congenital colordefects. As mentioned previously, these defects are mostoften confined to the long and middle wavelength sensi-tive photopigments (i.e., the red and green sensitive sys-tems). These defects are combined to comprise inheritedred-green defects. Abnormalities of the short wavelengthsensitive system are also possible, but as previously stat-ed, they are much rarer.
the effeCt of StyRene expoSuRe on ColoR vISIon: a RevIew
Individuals with inherited color abnormalities havestable color discrimination deficiencies which are rela-tively predictable and easy to diagnose.10 The color dis-crimination losses in the two eyes are comparable; there-fore, testing can be done with both eyes viewing. Besidesthe color discrimination deficits, these individuals haveotherwise relatively normal visual functioning.
Individuals with acquired color deficits, however,have less predictable losses which typically progress inseverity over time.10 The two eyes can show very differenteffects; therefore, tests of color discrimination must beperformed monocularly. Very often, acquired defects ini-tially show discrimination loss more typical of blue-yel-low defects. Additionally, as these defects result from“damage” along the visual system, changes in visual acu-ity or other visual measures may accompany the colordiscrimination loss. Although initial damage to the visualsystem may be confined to a single color-processingchannel (for example the blue-yellow system), as the con-dition progresses, more diffuse vision losses result whichare often difficult to categorize.
While many acquired color vision losses begin byaffecting blue-yellow discrimination, some initially affectred-green discrimination. Köllner’s rule10 provides a gen-eral rule to predict the type of color vision loss to be ini-tially present depending upon the location within thevisual system. This rule states that blue-yellow defectsare found with diseases affecting the outer retina, whilered-green defects accompany inner retina and the con-ductive pathways to higher visual levels. Verriest (1963)more thoroughly investigated acquired losses anddescribed Type I, Type II and Type III defects. These class-es are described in Table 1.
EFFEcTS oF dEFEcTS oN EVErydAy AcTIVITIES
The ability to perform everyday activities with mild orsevere color vision defects is highly varied. The effects ofcolor deficiencies on these activities depend upon thedepth of the defect and the types of activities performed.Steward and cole23 surveyed 102 red-green color visiondefectives and 102 color vision normals concerning vari-ous activities and the role color discrimination plays inease of their accomplishments.23 While a reporting bycolor vision normals of having a difficulty with color wasrare, only 7% of the color defective patients reported noproblems at all with color discriminations.
overall, a greater percentage of dichromats reportedhaving some difficulty with everyday activities than didanomalous trichromats; however, even some dichromatsreported having few difficulties related to color discrimi-
The SIrc review November 2006 105
fIguRe 3
color Plate design using color confusion Lines. color Amay be used as the background dots in a color PlateTest, while color B would be used for the “hidden”figure. A red-green color vision defective would not beable to see the “hidden” figure, as both colors lie close toconfusion lines for protan and deutan type defectives.color vision normals would be able to easily see a differ-
ence in color between the background and figure.
0 0.1 0.2 0.3 0.4 0.5 0.6 0.7 0.8
x
y
0.9
0.8
0.7
0.6
0.5
0.4
0.3
0.2
0.1
0.0
520
500
480
380460
540
560
580
B
To deutanconfusion point
Protanconfusion
point
A
600
620
700
+ white

the effeCt of StyRene expoSuRe on ColoR vISIon: a RevIew
nation. Examples of tasks in which the most difficultieswere reported are selecting colors of clothes and otherobjects (automobiles, furniture, carpets, etc.) and distin-guishing colors of wires, threads, and other things withcraft work and hobbies. other tasks to which fewer prob-lems were reported were assessing by color if meat is fullycooked, recognizing when fruit and vegetables are ripe,and recognizing skin conditions such as sunburn. None ofthe control subjects with normal color vision reported anydifficulty with these particular tasks involving color.
In general, the more severe the defect as indicated bycolor vision testing, the greater the number of respon-dents reporting difficulties. It should be noted, however,that some individuals described as having severe defi-ciencies reported no difficulties and some having relativelyminor deficiencies reported several areas of difficulties.24
For example, 1 of 7 anomalous (deuteranomalous) tri -chromats that reported no difficulties judging color failedthe relatively easy Farnsworth d-15 test, and 27 of 44anomalous (deuteranomalous) trichromats that reportedsome difficulties passed the Farnsworth d-15 test. Thereasons for these unexpected responses can be related tothe different types of color discriminations these individ-uals require in their daily lives and individual differencesin their desires for precision.
An additional note reported by Steward and cole wasthat 5% of the dichromats (2 of 37) and 25% of the anom-alous trichromats (16 of 65) were unaware of their colorvision defect at the time of their participation in the study.23
Therefore, when assessing subjects to determine color
vision status (for inclusionor exclusion from a study,for example), it is imperativethat clinical tests be per-formed to ensure diagnosticaccuracy. relying on patientreporting of color vision sta-tus is an inadequate methodto determine color visionnormalcy. This is an impor-tant consideration whenstudying acquired colorvision deficiencies, aspatient-reported history ofcolor vision defects is poor.
Clinical Color Vision Tests
clinical tests of color visionare designed to evaluate dif-ferent aspects of color dis-crimination. For example,
pseudoisochromatic plates are typically designed todetermine if an individual has “normal” color vision.That is, does the individual possess the three, normal reti-nal receptors? other tests are designed to determine colordiscrimination ability regardless of the normalcy status(arrangement tests). It is a basic tenet of color vision test-ing, that when trying to predict the ability to perform avocational color discrimination task, it is best to use a testwhich simulates the vocational task as closely as possible.Therefore, when determining a subject’s overall colorvision aptitude, a battery of tests is typically adminis-tered. Several standardized color vision tests aredescribed along with their vocational uses.
Pseudoisochromatic Plates (PIP). These tests are the mostused tests in clinical practice. Subjects must report whichfigure made from dots or spots is seen against a similarbackground. The tests are typically designed to identifycongenital red-green color defective subjects.10 In thisregard, they usually do an exceptional job. Nearly allcolor vision defectives fail the tests, while nearly all colorvision normals pass. Few false positives or negatives arefound. While, in general, mild defectives make relativelyfew errors and severe defectives make many, the numberof errors made on the tests are not highly correlated withfunctional performance. PIP tests are easy to administer,however, and are frequently used as color vision screen-ing instruments. Individuals that fail the PIP screeningtest are referred for further testing.
The SIrc review November 2006106
table 1
Verriest classifications of Acquired color Vision defects
Name description Examples of causation
Type I (red-Green) Protan type of defect with 1) cone dystrophy
shift of luminous efficiency 2) chloroquine toxicity
from photopic to scotopic
Type II (red-Green) deutan type defect with 1) optic neuropathy
milder blue-yellow loss 2) Ethambutol toxicity
Type III (Blue-yellow) Tritan type defect 1) Glaucoma
2) diabetes
3) Nuclear cataracts
4) Aging
5) Macular degeneration

the effeCt of StyRene expoSuRe on ColoR vISIon: a RevIew
Farnsworth-Munsell (FM) 100 Hue Test. The FM 100-huetest was developed to measure the fine color discrimina-tion in persons with normal color vision and to evaluatelosses in those with defective color vision.10 The test con-sists of 85 caps of color from around the color circle. Thecolors of the caps were chosen so that approximatelyequal perceptual steps of color are represented from onecap to the next. Subjects work with one-fourth of the capsat a time and must replace the caps into a tray in orderaccording to color. The test can be very difficult for a per-son with defective color vision as the difference in colorbetween adjacent caps is very small. The test is not fre-quently used for vocational evaluations due to substan-tial testing time that is required (may take 15 to 20 min-utes per eye for administration).
Farnsworth Panel D-15. The Farnsworth d-15 test is anarrangement test using 16 color caps. one of the caps isaffixed to the test tray.10 The other 15 caps must bereplaced into the tray according to color (similar to theFM 100-hue test). The difference in color between adjacentcaps is much larger than for the FM 100-hue test. The testwas designed for vocational evaluation to fail only thosewith moderate to severe color vision defects. Individualsfail the test when two or more errors (major errors) ofreplacement are shown which demonstrate gross colorconfusions from across the color circle. The test is simpleto administer and typically takes less than five minutesfor administration and grading. Approximately 50% ofcongenital color defectives fail the test.25
Lanthony Desaturated D-15. The Lanthony desaturated d-15 (dd-15) is similar in design and administration to theFarnsworth d-15. The principle differences between thetwo are the boldness of the colored caps and the degree ofcolor difference between adjacent caps. The dd-15 has col-ors which are lighter and less intense than the Farnsworthd-15 colors. It is much more difficult to complete and wasdesigned specifically to evaluate subtle color discrimina-tion changes as a result of acquired color vision defects.The test has been also used as an indicator of fine colordiscrimination. It is quickly administered and the resultsare relatively easy to evaluate. Approximately 20% ofcongenital color defectives pass this test.26
Anomaloscope. An anomaloscope is an instrument designedto diagnose the color vision status of subjects.10 Two spec-tral colors are mixed to exactly match in brightness andcolor a third spectral color. The precise mixture ratio of themixed colors and the range of acceptance of this ratio pro-vide a diagnosis of the exact color vision status. It is the
only clinical test which accurately differentiates normalsfrom mild defectives. Although the test is very useful inclinical practice, the results do not always predict absolutefunctional ability. Therefore, individuals measuringabnormal on the anomaloscope typically are tested usingan arrangement test to determine functional aptitude.
The Color Confusion Index (CCI)
In numerous studies that investigate the toxic effects ofchemicals upon color vision, the dd-15 Panel Test is usedto assess fine color discrimination. Small caps of differentcolors are replaced into a tray according to color. The capsvary gradually in hue from blue around a color circle topurple. The order with which the caps are replaced givesan indication of which colors may be confused.
The dd-15 is similar to the Farnsworth d-15, however,with the Lanthony test, the caps are lighter and possessless color; i.e., they are more white. Figure 4 shows thepositions of the caps for the Farnsworth d-15 and dd-15tests in cIE-LAB color space. The cIE-LAB color space isa transformation of the cIE-xyZ color space (Figure 1).color discrimination across the cIE-LAB diagram ismore uniform than for the xyZ diagram. distances acrossthe cIE-LAB diagram are used to represent measures ofsubjective color differences.8
107
fIguRe 4
Farnsworth d-15 and Lanthony desaturated d-15 Testsgraphed in cIE-LAB color Space.
30 -20 -10 0 10 20 30
A
-
B
30
20
10
0
-10
-20
-30
reference cap
LanthonyFarnsworth
The SIrc review November 2006
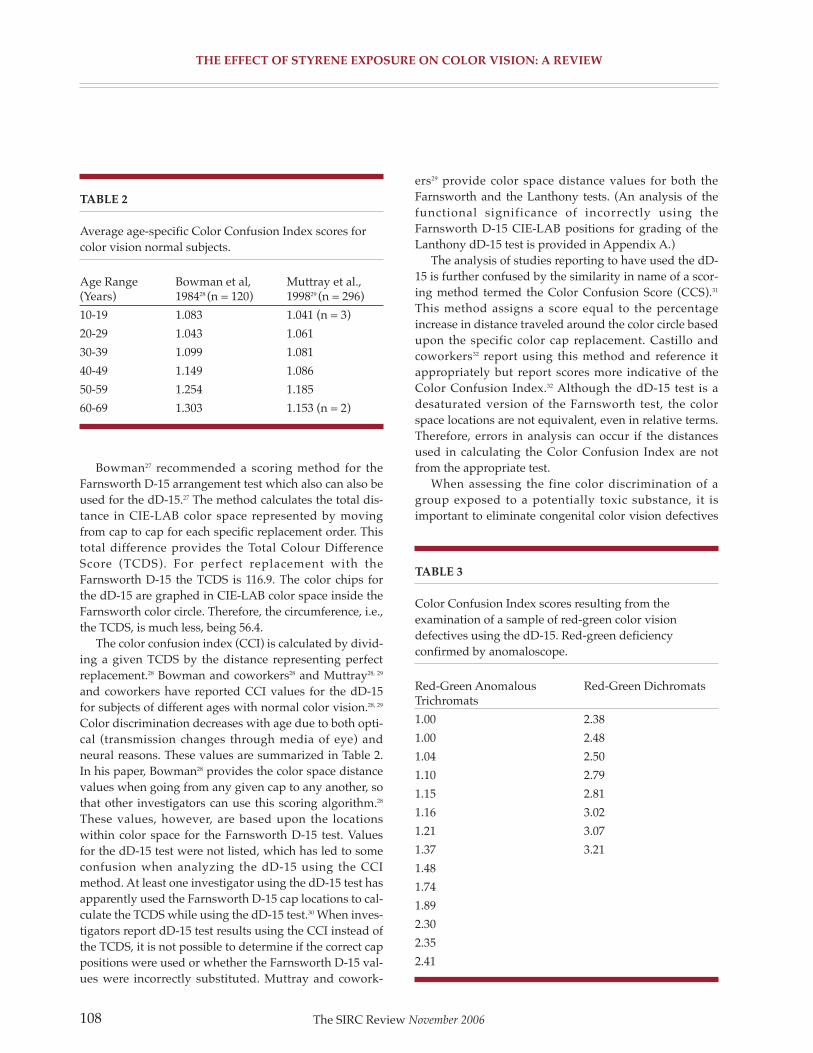
the effeCt of StyRene expoSuRe on ColoR vISIon: a RevIew
Bowman27 recommended a scoring method for theFarnsworth d-15 arrangement test which also can also beused for the dd-15.27 The method calculates the total dis-tance in cIE-LAB color space represented by movingfrom cap to cap for each specific replacement order. Thistotal difference provides the Total colour differenceScore (TcdS). For perfect replacement with theFarnsworth d-15 the TcdS is 116.9. The color chips forthe dd-15 are graphed in cIE-LAB color space inside theFarnsworth color circle. Therefore, the circumference, i.e.,the TcdS, is much less, being 56.4.
The color confusion index (ccI) is calculated by divid-ing a given TcdS by the distance representing perfectreplacement.28 Bowman and coworkers28 and Muttray28, 29
and coworkers have reported ccI values for the dd-15for subjects of different ages with normal color vision.28, 29
color discrimination decreases with age due to both opti-cal (transmission changes through media of eye) andneural reasons. These values are summarized in Table 2.In his paper, Bowman28 provides the color space distancevalues when going from any given cap to any another, sothat other investigators can use this scoring algorithm.28
These values, however, are based upon the locationswithin color space for the Farnsworth d-15 test. Valuesfor the dd-15 test were not listed, which has led to someconfusion when analyzing the dd-15 using the ccImethod. At least one investigator using the dd-15 test hasapparently used the Farnsworth d-15 cap locations to cal-culate the TcdS while using the dd-15 test.30 When inves-tigators report dd-15 test results using the ccI instead ofthe TcdS, it is not possible to determine if the correct cappositions were used or whether the Farnsworth d-15 val-ues were incorrectly substituted. Muttray and cowork-
ers29 provide color space distance values for both theFarnsworth and the Lanthony tests. (An analysis of thefunctional significance of incorrectly using theFarnsworth d-15 cIE-LAB positions for grading of theLanthony dd-15 test is provided in Appendix A.)
The analysis of studies reporting to have used the dd-15 is further confused by the similarity in name of a scor-ing method termed the color confusion Score (ccS).31
This method assigns a score equal to the percentageincrease in distance traveled around the color circle basedupon the specific color cap replacement. castillo andcoworkers32 report using this method and reference itappropriately but report scores more indicative of thecolor confusion Index.32 Although the dd-15 test is adesaturated version of the Farnsworth test, the colorspace locations are not equivalent, even in relative terms.Therefore, errors in analysis can occur if the distancesused in calculating the color confusion Index are notfrom the appropriate test.
When assessing the fine color discrimination of agroup exposed to a potentially toxic substance, it isimportant to eliminate congenital color vision defectives
108
table 2
Average age-specific color confusion Index scores forcolor vision normal subjects.
Age range Bowman et al, Muttray et al., (years) 198428 (n = 120) 199829 (n = 296)
10-19 1.083 1.041 (n = 3)
20-29 1.043 1.061
30-39 1.099 1.081
40-49 1.149 1.086
50-59 1.254 1.185
60-69 1.303 1.153 (n = 2)
table 3
color confusion Index scores resulting from theexamination of a sample of red-green color visiondefectives using the dd-15. red-green deficiencyconfirmed by anomaloscope.
red-Green Anomalous red-Green dichromatsTrichromats
1.00 2.38
1.00 2.48
1.04 2.50
1.10 2.79
1.15 2.81
1.16 3.02
1.21 3.07
1.37 3.21
1.48
1.74
1.89
2.30
2.35
2.41
The SIrc review November 2006

the effeCt of StyRene expoSuRe on ColoR vISIon: a RevIew
from both the test and control population groups. Theeffects of age, alcohol consumption, smoking and variousother known toxins are small compared to the drastic dis-crimination deficits accompanying many congenitaldefects. ccI values for 22 known red-green defectives areshown in Table 3 for comparison.19 Many of the studiesinvestigating the effects of styrene on color vision reportthat potential subjects with congenital dyschromatopsia(color vision deficiency) have been eliminated from thesubject pool. However, as Sheedy has noted, often thesestudies fail to explain how the diagnosis of dyschro-matopsia has been made.33 Steward and cole report thatapproximately 18% of the 102 color vision defective sub-jects they studied were unaware of having a color visiondefect prior to participation in that particular study.23 Thisis important to remember when evaluating the effects oftoxins on color vision. If a color vision defective is erro-neously selected as a test or control subject, a significant-ly high ccI value may bias results. Many of these ccI’sfor color vision defectives shown in Table 3 are well out-side the 95th percentile values of color vision normalsreported by Muttray and coworkers.29
calculating the color confusion Index for arrange-ment color vision tests has often been used to documentfine color discrimination. The method does provide anobjective measure of fine color discrimination. Themethod, however, provides only a measure of the totaldistance around the color circle relative to the specific capreplacement. The specific colors that are confused (i.e.,the axis of the defects) is not mathematically providedand must be evaluated subjectively.
Vingrys and King-Smith34 have described a method ofevaluation for arrangement tests (FM 100 hue,Farnsworth d-15, and dd-15) which provides mathemati-cal measures of both the color discrimination loss and theprimary axis of confusion.34 This method utilizes vectoranalysis of the improper replacements to calculate themagnitude and orientation of the principal color confu-sions. The value of the “c’ index” representing a givencolor deficit is highly correlated with the ccI, and thusprovides the same color discrimination information. Forthe sample values for color vision defectives in Table 3,the correlation coefficient between the c’ index and theccI is 0.976. Therefore, when using the Vingrys/King-Smith method, the same color discrimination informationis provided as when using the color confusion Index.However, the Vingrys/King-Smith method providesadditional information concerning the orientation ofcolor confusions which is not provided by the ccI (i.e.,red-green vs. blue-yellow). A computer program utilizingthe Vingrys/King-Smith method can be obtained from P.
Ewen King-Smith at The ohio State University: [email protected].
Styrene
Background, Sources, and ExposuresStyrene (i.e., vinylbenzene, ethenylbenzene, styrole, cASrN 100-42-5) is a colorless liquid that is often detected byits somewhat sweet odor. It is very lipid soluble but notvery soluble in water, and a volatile liquid at room tem-perature. due to its lipid solubility, it is found in higherconcentrations in animal tissues such as brain, myelin,and adipose, and can impair neural membranes interfer-ing with the propagation of nerve impulses or neuro-transmitters.35-37
Styrene is one of the top 50 chemicals producedworldwide, although it occurs naturally as well (i.e., cin-namic acid containing plants). About 10 billion poundsare produced each year. The major uses of this chemicalinclude plastics, latex paints, synthetic rubbers, and poly-esters. Styrene can be detected in the atmosphere, gener-ally at low levels, which is mainly due to industrial andauto emissions associated with its production and use.Thus, air is the primary exposure route for most individ-uals. one study conducted in canada sampled 18 urbansites not related to styrene manufacture or processing,and showed that the range of ambient styrene exposureswas 0.09 to 2.35 µg/m3 (where 1 part per million (ppm) ofstyrene is equivalent to 4,260 µg/m3).38 Another recentstudy estimated that total daily exposure of individuals isbetween 18.2 to 55.2 µg/person based on a review of theliterature.39 The World Health organization (WHo)reports that general ambient air levels are 0.3 µg/m3 lead-ing to an estimated daily intake of between 6 and 40µg/person for nonsmokers in industrialized nations.40 Ingeneral, typical ambient exposures are thus thought to beless than 1 part per billion. Although it is difficult to esti-mate these exposure levels due to the numerous factorsinvolved, it is generally believed that daily ambientstyrene exposure levels are very small. This is becausestyrene is very reactive in the presence of hydroxyl radi-cals and ozone found in air; thus, much of it is oxidized inthe first two hours after release.
Polluted air and the close physical proximity tostyrene-associated manufacturing plants have beenshown to be associated with higher styrene levels,although ambient styrene levels in the monomer produc-tion and the polystyrene industry are much lower thanthe reinforced plastics industries.
41
This workforceincludes a number of industries including styrene andpolymer production, reinforced plastic/rubber produc-
The SIrc review November 2006 109

the effeCt of StyRene expoSuRe on ColoR vISIon: a RevIew
tion, and other products containing styrene. Typical occu-pations include reinforced plastics workers involved inthe manufacture of boats, automobile parts, pipes, protec-tive coatings, and baths/showers. one study sampled thevicinity of seven reinforced plastics industries in theUnited States showing ambient styrene levels rangingfrom 0.29 to 2934 µg/m3.42 LeMasters and coworkers(1985) examined occupational styrene exposure values (n= 1,500) from 28 reinforced-plastic manufacturers in theUnited States showing that the open mould process (24 to82 ppm) is associated with styrene levels that are two-to-three times greater than the closed mould process (11 to26 ppm).43 The WHo reports ranges between 20 and 30µg/m3 for in Europe, with an estimated intake of 400 to600 Bg/person for individuals involved in this process.
other sources of styrene and routes of exposureinclude automobile emissions, cigarette smoke, food,drinking water, and the elimination (thermal degrada-tion) of styrene-containing materials. cigarette smoke hasbeen reported to contain between 18 and 48 µg/cigaretteof styrene, although the WHo reports that active smok-ing may be associated with styrene exposures levelsbetween 400 and 500 µg/day.44, 45 Small amounts ofstyrene may migrate from polystyrene packaging into thepackaged food; small amounts of styrene may also bepresent in some foods that have not been packaged instyrene-derived materials. Although styrene has beenmeasured in drinking water, it is thought to evaporate toair rather quickly.
Pharmacokinetics
Absorption of airborne styrene occurs primarily throughthe lungs, but also occurs through the dermis and othermucous membranes. Styrene is distributed readilythrough the body, and can accumulate in fatty tissue. Itselimination is linear at low concentrations of ambientstyrene. The main metabolic end products of styreneinclude mandelic acid (MA; 57 to 80% of inhaled styrene)and phenylglyoxylic acid (PGA; 10% of inhaled styrene),which are both found in human urine. Wieczorek andPiotrowski showed that urinary excretion of these twometabolites is biphasic, with the first half-life occurring atabout 2.5 hours and the second occurring at about 30hours.
46
The relation between inhaled styrene and MA islinear up to 150 ppm (639 mg/m3). Some prefer MAassessment over ambient styrene measures as it allowsone to measure the dose of the agent received, althoughboth are generally used together. In general, MA samplecollected at the end of a workshift is indicative of acuteexposures.
Health Effects in Humans
There has been concern about the association betweenstyrene exposure and cancer; studies have shown a rela-tion in mice and humans between styrene exposure andlung cancer.47, 48 However, the International Agency forresearch in cancer (IArc) has concluded that there islimited evidence for carcinogenicity in human.49 otherhealth effects anecdotally reported include symptoms ofirritation of mucosal tissues such as the throat, respirato-ry tract, and eyes, central nervous system depression,ototoxicity, pulmonary toxicity, asthma, and contact der-matitis.5, 50-52 Given styrene’s lipid-soluble characteristic, itis often associated with several neurotoxic effects result-ing from depression of the central nervous system (e.g.,slower reaction times, vestibulomotor alterations, weak-ness, headache, fatigue, malaise, dizziness, and nausea).An additional effect on the nervous system that has beenreported is impairment in color vision discrimination.32, 53-63
Prior to 1997, the American conference ofGovernmental Industrial Hygienists (AcGIH) estab-lished the Threshold Limit Value (TLV) for safe occupa-tion exposure at 50 ppm based on the potential for neuro-toxicity. In a previous literature review on the impact ofstyrene on color vision, Sheedy concluded that “Highexposure levels are associated with color vision deficien-cy, whereas low exposure levels are not.”33 However,since that time, AcGIH has reduced the limit for safeoccupational levels from 50 ppm to 20 ppm, which is pre-sumably based on more recent ‘neurotoxic’ evidence.There have also been several new reports evaluating theimpact of styrene on color vision discrimination, some ofwhich have evaluated the association between lower lev-els of styrene exposure.32, 56, 59-63 The purpose of this reportis to further evaluate the issue of styrene exposure andcolor vision discrimination through a critical assessmentof the literature.
METHodS
A MEdLINE search for “styrene” and “color vision”yielded 23 articles or letters to the editors published priorto June 2003. However, not all 23 articles identified fromthe primary search were reviewed; three were in a non-English language, and four were review-type articles orperipherally related to the topic.1-7 Two letters to the edi-tor, 14 original research articles, and three caseseries/animal studies were included in the review andassessments. Each of these 17 “studies” (non-letters to theeditor) were critically reviewed based on the followingprinciples, and are presented in a temporal sequence:
The SIrc review November 2006110

the effeCt of StyRene expoSuRe on ColoR vISIon: a RevIew
1. overall study design and epidemiological methods2. color vision test methods
a) Appropriate testing conditionsb) Test scored appropriatelyc) Examiners masked in regards to exposure status (when applicable)
3. Styrene exposure assessmenta) Ambient styrene measures (i.e., personal vs. area sampling)b) Biological monitoring (MA or PGA assessments)
4. Sample size and recruitmenta) Inclusion of control groupb) General comparison of the exposed and non-exposed groupsc) Matching conducted
5. Statistical methodsa) Assumptions metb) Sufficient powerc) dose-response analysesd) consideration of interactions between variables andeffect modifiers
6. External generalizability of results7. Impact of results on the workforce/workplace (if applicable)
crITIQUES
Pratt-Johnson (1964)64
The author presents a case of retrobulbar neuritis associ-ated with exposure to styrene. The individual was a 48year old male who had a sudden, painless loss of visionover the course of one week. His history revealed that heworked in the fiberglass industry and he frequently usedstyrene without protection. His medical history wasunremarkable. His examination revealed a visual acuityof 20/400 in each eye, but no refractive error. The anteriorand posterior segments of his eyes were unremarkablefor any disease and his intraocular pressures were nor-mal. However, visual field testing revealed centrocecalscotomas in each eye. Laboratory blood and urine analy-ses were unremarkable. The patient was diagnosed withbilateral toxic retrobulbar neuritis and was treated initial-ly with daily intramuscular injections of vitamin B com-pound, nicotinic acid tablets, and Prednisolone. After 10days, there was no improvement in the patient’s vision orvisual field. The vitamin B and nicotinic acid were contin-ued for 6 months and one year after first presentation, thepatient’s vision and visual field had returned to normal.
AssessmentThis case presentation is notable as it is one of the first
references in the MEdLINE literature regarding the effectof styrene on the visual system. Given what is known atpresent about styrene exposure and vision, this patientmust have been exposed to extremely high levels ofstyrene in order for this to occur. As we know, patientswith retrobulbar optic neuritis experience very earlycolor vision losses associated with parvocellular visualloss, although there is no indication of color vision testingin this patient case report.65, 66 Additionally, there is a goodpossibility that there is a strong nutritional deficiencycomponent to this case.
Kohn (1978)67
In this study, 345 workers (338 men) who were exposedto styrene were questioned via case history and under-went a visual examination. The author reports that theexposure level for these workers averaged 5 ppm; how-ever, the range of exposure levels was wide, and couldhave been up to “a few thousand parts per millionmomentarily during heating of commercial polystyrene.”ophthalmic findings included one individual with anafferent papillary defect, although this was accounted toocular toxoplasmosis. There were “infrequent” reducedvisual acuity findings (< 20/30), and causes associatedwith reduced acuity included macular scars and ambly-opia. conjunctival irritation was noted in 22% of workersby history and was more common in workers exposed tolevels above 50 ppm. By history, several workers reported“styrene beads imbedded in their corneas.” There wereno cases of retrobulbar neuritis or central vein occlusions,which had been suggested in previous reports as an ocu-lar complication associated with styrene. The author con-cludes, however, that exposure to styrene is correlatedwith conjunctival irritation.
AssessmentThis report was important as it was one of the first ‘stud-ies’ to evaluate the ocular effects of styrene. Although noreasonable study design was outlined in the publicationand the methods are insufficient, it was one of the firstmanuscripts to address the impact of styrene on vision.There is no real quantification of exposure assessment.The biological mechanism for conjunctival irritation asso-ciated with styrene exposure is unclear. Unfortunately,there was no indication of an assessment of color visionin this patient sample.
Skoog & Nilsson (1981)68
The authors note that information regarding styreneexposure and central nervous system effects is scarce. Thepurpose of this research was to evaluate the effect of
The SIrc review November 2006 111

the effeCt of StyRene expoSuRe on ColoR vISIon: a RevIew
styrene on the electroretinogram (ErG) and standingpotential (SP) of the eye. The effect of toluene on theseoutcomes was also examined, but is not reported on inthis review. cynomolgus monkeys (two male, and threefemale) were anesthetized and the animals were coupledwith the apparatus. Following baseline recordings, theanimals were infused with styrene by intravenous injec-tion (0.3 to 15 mg/kg body weight). Blood styrene levelswere monitored through venous samples and gas chro-matography. The results indicated that the c-wave ampli-tude nearly doubled about 10 minutes after injection with15 mg/kg. In addition, the standing potential of the eyefollowed with similar changes after these styrene injec-tions, especially with higher doses. The authors concludethat the c-wave and standing potentials evoked areapproximately proportional to the injected styrene, andno apparent changes were seen in the a- or b-waves. Thelowest dose of styrene in these monkeys evoking c-wavechanges was 3 mg/kg which corresponded to about 4ppm in the blood. The authors suggest that it is difficultto relate blood concentrations of styrene with ambientlevels. Finally, they state that “It is not possible to explainthe observed effects on the c-wave and the SP on the basisof the present study” although both potentials are gener-ated primarily in the retinal pigment epithelium.
*Note: The ErG essentially consists of 4 main elements:the a, b, c, and d waves. The a-wave is seen first and isthought to reflect the summed effect of the photoreceptorswithin the retina. Under certain testing conditions, theeffects of rods versus cones can be seen separately. The b-wave is next seen and is thought to be generated withinthe retinal Mueller cells. Although Mueller cells are sup-port cells within the retina and don’t directly participatein the transmission of the visual signal, the b-wave, how-ever, is thought to reflect receptor (rod and cone) activity.The c-wave is the long-standing potential within the ErGand is present as long as the light stimulus is on. It isthought to be generated with the retinal pigment epitheli-um but again to reflect rod and cone activity. The d-wavesignals the end of the light stimulus (off-effect) and alsoreflects post-receptor processing (similarly to the b-wave).The standing potential of the eye is that potential which isused when measuring the electro-oculogram (EoG). It isthe potential difference between the front and the back ofthe eyes. It changes slowly over time and can be reflectiveof the overall integrity of the retina.
AssessmentThis study examined the acute exposure of styrene on thevisual system, thus, it is difficult to draw conclusions
about the effect of styrene in this regard on altered retinalfunction and color vision impairment. Additionally, theroute of administration of styrene in this study was dif-ferent than that for workers exposed on the job. However,this is an interesting article in that it places potential dam-age from styrene to the visual system within the retina.Also, it is interesting to note that the ErG returned tonormal after the styrene blood level dropped.
Gobba and Coworkers (1991)53
This study examined a cross-section of styrene exposedindustrial workers for color-vision deficiencies; compar-isons were made with a group of ‘normal’ subjects. Thestyrene exposed sample included workers from sevensmall fiber-glass plastics factories and there were 34 menand 41 women included in the sample. The 60 normalindividuals (34 men and 26 women) were workers in arock wool plant. There is no discussion of sampling meth-ods used or sample size considerations. Exclusion criteriaincluded the following: 1) congenital dyschromatopsia, 2)a medical history of hypertension, diabetes, or cerebrovas-cular disease, 3) use of medications associated with colorvision loss, 4) alcohol use greater than 250 grams perweek, and 5) poor visual acuity (worse than 20/32).Biological sampling (MA and styrene concentration inurine) was conducted at the end of the workday and envi-ronmental monitoring was conducted via personal pas-sive sampling; both were conducted on a Thursday toallow for workweek accumulation. The primary studyoutcome was acquired dyschromatopsia, assessed by theLanthony dd-15 panel at the beginning of the workdayunder a fluorescent daylight lamp (color temperature5000K). Study subjects were tested monocularly with notime limit. The test was scored using the color confusionIndex (ccI). Visual acuity was measured as well,although the chart type is not specified. A questionnairewas administered which examined work history, occupa-tional and recreational exposure to solvents, and alcoholand drug use. Statistical methods included testing for datanormality (Kolmogorov-Smirnov test), the Mann-WhitneyU test and paired t-tests, Spearman’s correlation coeffi-cient, and multiple linear regression (dependent variablewas the ccI and predictor variables included age, seniori-ty, and exposure levels).
Although the authors stated that they tested their datafor normality, there is no indication that such tests weredone in the results. The mean (± Sd) ambient styrene forthe exposed sample was 69.02 ± 3.6 mg/m3, while themean urinary styrene was 49.5 ± 44.8 µg/L and the meanMA was 342.9 ± 425.3 mg/L . correlation results indicat-ed a significant relation between age and ccI in the
The SIrc review November 2006112

the effeCt of StyRene expoSuRe on ColoR vISIon: a RevIew
exposed (r = 0.44, p < 0.01) and control groups (r = 0.37, p< 0.01). As such, the authors stratified their data by age(Group 1= ≤ 29 years, Group 2 = 30-39 years, and Group 3= ≥ 40 years) and then compared the median ccI for theexposed and unexposed groups. The only difference wasin Group 3, whereby the exposed had a significantlyhigher median ccI value than the control group (1.301vs. 1.203, p < 0.05). Given the smaller sample sizes associ-ated with this subgroup analysis, it is not known whatthe observed power was in any of the group compar-isons. However, in another post-hoc analysis, the authors‘matched’ subjects on age (± 2 years), and then statistical-ly compared ccI values. The results showed that themean ccI for the styrene exposed workers was signifi-cantly higher than in the control group (1.265 vs. 1.151, p< 0.01). Environmental sampling data were used to exam-ine a dose-response effect, whereby subjects exposed tostyrene levels above the ‘threshold limit value’ (i.e., 215mg/m3 = 50 ppm) showed significant increases in ccIvalues when compared to the low-exposure group (p <0.05). There was also a significant relation between uri-nary styrene excretion and ccI in the exposed group (r =0.27, p = 0.02). Although the results are not presented, theauthors state that a similar correlation was found forambient styrene and ccI, but not for MA and ccI.Finally, multiple regression results revealed that age,ambient styrene, and urinary styrene concentration weresignificant predictors of ccI, although self-reportedstyrene exposure duration was not a significant predictor.Twenty styrene-exposed workers underwent dd-15 test-ing on one month later, and although no data are present-ed, the authors state “…no tendency toward a restorationof color vision was observed.” In general, styreneexposed workers showed blue-yellow shifts in colorvision, although it is noted that “in a few styrene work-ers, red-green discrimination also was affected.”There are five general conclusions put forth by theseauthors which include:1) Age is correlated with ccI values in both styrene-exposed workers and normal controls; 2) Blue-yellow discrimination is primarily affected instyrene-exposed workers.3) ccI values are higher in styrene exposed workers thanin age-matched controls;4) ccI values are higher in a high styrene exposure group(> 50 ppm) compared to controls, but the low exposuregroup did not statistically differ from the normal con-trols; and5) ccI values can be predicted in multivariate analysesby age, ambient styrene, or urinary styrene excretion, butnot MA concentrations.
AssessmentAlthough the analyses supporting the conclusions wereappropriate, there are several issues with the study meth-ods and design that should be addressed. First, there isno discussion of the sampling methods used to identifystyrene-exposed subjects within the seven fiberglassplants, nor the control group. It is important to know thetotal number of styrene-exposed workers in all plants,and a random sample could have been taken from thissubject pool eliminating any potential selection bias. Withthe currently described method, it is possible that certainlow-exposure subjects may have been excluded due to thetendency to select those with more severe disease or expo-sures. There is no mention of masking of the examinersperforming the test procedures regarding the exposurestatus of the subjects. Another issue regarding the subjectsis that females were included in the styrene-exposedgroup. This may pose a problem as up to 15% of womenare heterozygous for color vision deficiencies and willshow errors on the dd-15 panel. This could spuriouslyinflate the ccI values associated with the styrene-exposedgroup leading to significant differences from the controlgroup. The styrene-exposed sample should have includ-ed only male subjects free of congenital color vision defi-ciencies. Muttray and coworkers also suggested in a cor-responding letter to the editor that alcohol use shouldhave been controlled for in the analyses even when week-ly consumption values were less than 250 g/week.29 Thistoo could have increased the ccI values; however, alco-hol consumption would have affected the ccI values inboth the styrene-exposed and control groups.
Again, a concern in this study was the apparent lack oftesting data for normality; inspection of the data shows ahighly skewed range of data. This could have accountedfor the significant differences found between age-matched groups. The authors did not perform the appro-priate analysis to derive the fourth conclusion regardinga dose-response effect. Given that three groups were pre-sent in the subgroup analysis, the appropriate statisticalanalysis would have been analysis of variance (ANoVA)with post-hoc testing of groups as necessary. TheANoVA technique would have allowed the authors tocontrol for the effects of age as well. It is unclear whyexcreted MA did not predict ccI values. It is unfortunatethat the authors did not provide any sort of power calcu-lations for their observed findings in this case as itappears as there is much variability in the styrene-exposed group in this outcome (i.e., the standard devia-tion is larger than the associated mean for MA concentra-tion). Also, it is dissatisfying that data and analyses werenot presented regarding the affect of short-term elimina-
The SIrc review November 2006 113

the effeCt of StyRene expoSuRe on ColoR vISIon: a RevIew
tion of styrene exposure (i.e., the 4 week vacation) oncolor discrimination. This is an important outcome thatneeds resolution. overall, this study provides some evi-dence for the impact of styrene on color vision.
Fallas and Coworkers (1992)54
This study examined a cross-section of 60 shipyard work-ers who worked in the construction of glass reinforcedpolyester materials. The sample was composed entirelyof men who ranged in age from 20 to 56 years, and whosestyrene exposures varied from one to 29 years (meanexposure duration = 6.5 years). The workers were placedin four subgroups based on their styrene exposure dura-tion [Group 1 (n = 14) = less than 1 year, Group 2 (n = 18)= 1-5 years, Group 3 (n = 14) = 5-10 years, Group 4 (n =14) = more than 10 years]. Styrene exposure was quanti-fied for a period of three months by gas phase chro-matography and mass spectrometry via 16 samplingunits in the work area. In addition, urinary excretion ofMA and phenylglyoxylic acid (PGA) were measured atthe end-of-shift by high performance liquid chromatogra-phy. A 60 member male control group was assembled,and the controls were additionally matched to thestyrene-exposed workers on age, intellectual level, andethnicity. Members of the control group were unskilledworkers, boilermakers, and warehousemen. Two styrene-exposed workers were excluded for hypertension andalcoholism, and three controls were excluded—“one foreducation and two for psychiatric history.”
color vision was assessed using the Farnsworth 100hue test during working hours and in the daylight. Thetest was scored using the number of errors subjects made,and comparisons of the error scores were made in rela-tion to age. It is unclear what statistical test was used forthis. The chi-square test was used to compare the numberof subjects in the red-green and blue-yellow range for theFarnsworth test results. other outcomes included a psy-chometric examination developed by the World Healthorganization (WHo), which included a social and med-ical history, occupation, drug usage, mood assessment,reaction time, and other neurobehavioral items.
The mean value for MA was 230 mg/g creatinine (range= 2 to 1460) and the mean value for PGA was 57.4 mg/gcreatinine (range = 0.4 to 421.2). The mean Farnsworth100 hue error score for the styrene-exposed workers was259.9 ± 136.9, while the mean for the controls was 262.7 ±114.0; these values did not differ statistically. There were32 workers with red-green and/or blue-yellow ranges inthe styrene-exposed group compared to 20 in the controlgroup (p < 0.05). The authors conclude that exposure tostyrene “may lead to impairment of colour vision in the
form of the anomalies already reported for workersexposed to mixtures of solvents,” and suggest that the 50ppm exposure limit may be too high given this finding.
Assessment There is one general conclusion put forth by theseauthors—that is, styrene exposure leads to impairment ofcolor vision. They go on to speculate that the damageoccurring in the visual system may be either retinaland/or optic nerve. However, this conclusion is less thansubstantiated by the results presented. First, there was nostatistical difference in error scores when comparing thestyrene-exposed workers and the control group. Theauthors did not state whether one orientation of defectclass was more prevalent than the other nor how theydetermined whether a defect was predominantly red-green or blue-yellow. The analyses presented are of poorquality, and there is no mention of controlling for con-founders (i.e., age). It is likely that the analysis of errorscores was probably underpowered to find a differencebetween these two groups given the variability present-ed. Although age-based subgroups are proposed in themethods, there is no indication that statistical analysis ofthese groups was carried out in the results. Further, it isquestionable why there was no attempt to evaluate anyassociation between urinary MA concentration, PGA, andcolor vision test results (i.e., after controlling for age inthe styrene-exposed workers, does MA or PGA predictthe error score). There is lack of sufficient details regard-ing the sampling methods used in order to ascertain anypotential selection bias associated with subject recruit-ment. There is no mention of masking of the examinerswho performed the testing regarding subject exposurestatus. Finally, the styrene exposure sampling methodwas for the workshop rather than through personal mon-itors and there is no indication duration or frequency ofexposure to the peak styrene levels (469 ppm).
Interestingly, the actual error scores presented aremuch higher than what might be expected, both in thestyrene-exposed workers and the control group. Theauthors stated that they used “a specially devised auto-mated procedure for analysis of the results” but do notsufficiently describe the method. Further, the actual test-ing methods used for color vision testing are notdescribed sufficiently. The lighting used is not optimal,and there is no mention of whether testing and scoringwas carried out monocularly or binocularly.
In a subsequent letter to the editor, Muttray (1993) crit-icized this study for several reasons. Muttray andcoworkers concluded that the work by Fallas et al. doesnot provide evidence of an effect of styrene on color
The SIrc review November 2006114
the effeCt of StyRene expoSuRe on ColoR vISIon: a RevIew
vision.54, 69 The criticisms are listed below:1) Improper illumination used for color vision testing.2) Lack of control over subject’s glasses and contact lensstatus (i.e., colored lenses).3) Failure to exclude those with congenital color visiondefects.4) The term “range” was not defined.5) Failure to screen vision or for ophthalmic conditions.6) Skepticism of error score results given their highmeans compared with other studies.7) Testing of subjects during the workshift with concur-rent exposure to styrene. It is suggested that this wouldimpact the ability to differentiate between acute andchronic effects of styrene in terms of color vision.
In response, Fallas and coworkers suggested the fol-lowing:1) They clarify the lighting used by stating that “TheFarnsworth Munsell procedure guidelines indicate that“sunlight” is irrelevant and that “daylight” together withfluorescent lighting is more appropriate. We have there-fore applied the Farnsworth Munsell procedure.”2) They claim that none of the subjects wore coloredglasses or contact lenses.3) They state that acquired and congenital color visiondefects are difficult to differentiate, and state that “it ishard to understand why workers exposed to styreneshould be more affected by congenital defects than thoseof a control population living in the same area andmatched for age, sex, and ethnic origin.”4) The term “range” referred to circumferential errorsassociated with the Farnsworth-Munsell test.5) Screening examination were conducted on an annualbasis by an occupational physician.6) They did not discuss the issue of above average meanerror scores.7) They state that they make no claims as to the chronic oracute effects of styrene on color vision and their studywas not designed to address this issue.
Although some of the criticisms of Muttray andcoworkers (1993) are somewhat artificial, the responsesprovided by Fallas and coworkers are less than reassur-ing.54 It becomes more clear that this group is unfamiliarwith many aspects of color vision, including the diseaseitself and testing methods. The response to the issue oflighting alone leads one to this conclusion, and it is stillunclear exactly what was done in this regard. Further, theuse of the term “range” also suggests the researcher’s lackof familiarity with the testing method used in this study.The lack of details regarding the scoring method used forthe test results does not allow one to determine if improp-er scoring is associated with the high mean error scores.
However, as Sheedy suggests, this is likely the cause ofthe inflated mean.33 He also suggests that the researchersprobably included the base value of “2” for each colorchip in the test.33 correcting for this factor would maketheir mean error scores in line with what might be expect-ed based on the results of other studies. In summary, thedata and analysis presented by Fallas and coworkers(1992) does not substantiate the claim that styrene expo-sure is associated with acquired color vision deficiencies.54
Gobba and Cavalleri (1993)55
This publication represents data presented previously(Gobba, 1991) in addition to some new data.53 Two groupsof subjects from 10 fiberglass reinforced plastics factorieswere included. Seventy-five styrene-exposed workersfrom seven of these plants (Gobba and coworkers, 1991)composed Group A and 40 workers from the remainingthree plants composed Group B. The control group forGroup A included 60 unmatched normals, while the con-trol group for Group B styrene-exposed workers included40 normals that were matched on gender, age (± 3 years),alcohol consumption (± 10 gm/day), and tobacco smok-ing (± 10 cigarettes/day). Further exclusion criteriaincluded alcohol consumption greater than 50 gm perday, congenital color vision deficiencies, diabetes, hyper-tension, cerebrovascular disease, color vision alteringmedications, and visual acuity worse than 20/40.
Ambient styrene exposure was assessed via personalpassive sampling on Thursdays. Urine collection wasused for sampling styrene and MA concentrations atthree time points: prior to the workshift, noon, and end-of-workshift. In addition, blood samples were taken atnoon on Thursdays for styrene determination.
The primary study outcome was color vision discrimi-nation, assessed by the dd-15 panel. Scoring was con-ducted using the method of Bowman (1984), in which theccI is calculated. All color vision testing was conductedprior to beginning the workshift under a daylight fluores-cent lamp (5000K color temperature).28 Testing was con-ducted monocularly, although results presented repre-sent the average of both eyes. Statistical tests used tocompare group data included the paired t-test, Mann-Whitney U test, the Wilcoxon test, the chi-square test, andANoVA. correlations were determined usingSpearman’s method and multiple linear regression wasused to determine predictors (i.e., age, seniority, exposurelevels) of the ccI index.
As discussed in the assessment of Gobba and cowork-ers (1991), there was a significant correlation between ageand ccI in the 75 styrene exposed workers and the con-trol group.53 However, because these groups were not
The SIrc review November 2006 115

the effeCt of StyRene expoSuRe on ColoR vISIon: a RevIew
matched on age, the styrene-exposed workers were sig-nificantly older than the control group (37.6 years vs. 32.0years respectively), which could artificially inflate theccI associated with the styrene-exposed workers. Theauthors state that this is the reason for their assembly of asecond group of styrene-exposed workers—in order tomatch for potential confounder. In this second group, themean ambient styrene exposure was 68.2 mg/m3 whilethe mean urinary styrene was 41.4 µg/L. The averageMA concentration for this new group is not presented.The mean (±Sd) ccI for styrene-exposed workers in thisnew group was 1.206 ± 0.200, while the mean (±Sd) ccIfor the control group was 1.053 ± 0.070 (p < 0.001). Theauthors state that only one styrene-exposed worker couldperform the test perfectly, while 16 controls were able todo so (chi-square test, p < 0.01). In order to assess a dose-response affect of styrene on color vision, subgroupanalysis was performed on styrene-exposed workerswhereby these workers were divided based on ambientstyrene exposures above and below the threshold limit of213 mg/m3 (the American conference of GovernmentalHygienists, 1992). The results indicated that subjectsabove the limit had higher mean ccI values compared tothose below the threshold limit (1.29 vs. 1.11, p < 0.05)respectively. Finally, there was a significant correlationbetween urinary styrene concentrations and ccI (r = 0.27,p = 0.02), and environmental styrene levels and ccI(analysis results not presented), but not between MA andccI (analysis results not presented). The authors statethat “These results were confirmed by applying multipleregression analysis” but the results of the analysis are notpresented. In a small group of styrene-exposed workers,the color vision testing was repeated about one monthlater with interrupted exposure to styrene and the resultswere found to be similar to previous testing.
From these results, the authors draw the followingconclusions:1) Styrene exposure can impair color vision.2) Styrene and age appear to have a “synergistic” impacton color vision impairment.3) There is a dose-response effect of styrene on colorvision.4) Short-term discontinuation of styrene exposure doesnot reduce the color vision impairment.5) Blue-yellow color discrimination is primarily affected(data not presented).
Assessment As mentioned above, some of this work has been previ-ously presented. However, due to potential problemsassociated with the sample of the first group (i.e., no
matching was conducted), a second sample was assem-bled, with age, gender, alcohol, and tobacco matched con-trols. Although this strengthens the study’s validity, thereis still lack of details regarding sampling methods used toassemble the styrene-exposed workers and controls. Withthe new sample, the conclusion that styrene exposure canimpair color vision seems valid. However, the conclusionthat age and styrene exposure have a synergistic effect onimpairment of color vision is not supported. As far as onecan tell, no interaction terms were examined in the multi-ple regression analyses. As such, it is not appropriate tosuggest this relation between these two predictor vari-ables on color vision impairment. The data as presentedsuggest that there is a dose-response affect of styrene oncolor vision when comparing high and low level styreneexposure groups. However, as in their previous work(Gobba and coworkers, 1991), it appears as if the lowexposure ccI mean (1.11) probably does not statisticallydiffer from the control group mean ccI (1.053). This find-ing in a second sample of patients may suggest that lowexposures of styrene (< 50 ppm) do not impair colorvision. In fact, the low exposure group ccI mean (1.11) isactually very similar to the previous control group ccImean (1.151). The conclusion that short-term eliminationsof styrene exposure does not seem to be supported by thedata presented, as only a very small sample of patientsunderwent this test protocol. The authors conclude thatmost color vision discrimination alterations are blue-yel-low in origin, although no data are presented to that end.Finally, it is unfortunate that there is no discussion ofmasking of the examiners who performed testing interms of exposure status of the subjects. overall, this arti-cle provides moderate evidence that styrene exposurealters color vision.
Campagna and Coworkers (1994)70
The authors state that this publication is part of a larger,prospective study examining the reversibility of neuro-toxic effects of styrene. Three reinforced plastics manu-facturing plants were used to sample workers exposed tostyrene. Personal passive sampling was conducted anddata were analyzed using gas chromatography. Urinarysamples were taken after the work-shift and were ana-lyzed for MA concentration, corrected for urinary creati-nine. Workers completed a questionnaire assessing socio-demographic information, work environment andhistory, and medical outcomes including ophthalmicsymptoms (eye irritation, tearing, and blurred vision).color vision was assessed using the dd-15 panel testedmonocularly, and near contrast sensitivity was assessedusing the Vistech 6000 at five spatial frequencies. color
The SIrc review November 2006116

the effeCt of StyRene expoSuRe on ColoR vISIon: a RevIew
vision and contrast sensitivity testing was conducted 12hours after cessation of styrene exposure. Individualswere considered to have acquired color vision deficiencyif the caps were misplaced by at least 2.
Study exclusion criteria included less than six monthsof exposure in the plant, “poor” near visual acuity, ocularinjury, congenital dyschromatopsia, cataracts, diabetes,ophthalmotoxic medications, and incomplete exposure.one hundred fifty one individuals were eligible to partic-ipate in the study, 128 agreed to participate, and this pub-lication represents the data from 88 individuals. No infor-mation is presented on statistical procedures used ormodel parameters.
The mean (±Sd) age of the sample was 29 ± 8 yearsand the mean (±Sd) time on the job was 5 ± 4 years. Theaverage education level was 11 ± 1.7 years. The averagealcohol consumption was 160 gm/week. Some descrip-tive results from this study can be found in Table 4.
Workers with styrene levels above 213 mg/m3 report-ed eye irritation more frequently than those below thatlevel (chi-square, p < 0.01). Similarly workers with MAconcentrations greater than or equal to 0.6 mmol/mmolcreatinine reported eye irritation, blurred vision, andtearing more commonly than those below that level (chi-square, all p < 0.05). of the 88 workers, 34.1% were foundto have acquired dyschromatopsia, and workers withMA concentrations at or above 0.6 mmol/mmol creati-nine were more likely to be those with acquired dyschro-matopsia than those lower than this level (57% vs. 27%respectively, chi-square, p < 0.05). There was no relationbetween ambient styrene and acquired dyschromatopsia(33% vs. 36%, chi-square, p = not significant) or symptomreporting and acquired dyschromatopsia (data not
reported). regression models showed that age and alco-hol consumption were associated with color vision loss;as such, models were adjusted for these factors. The finalmodels showed that the adjusted ccI was predicted bylog of the MA concentration (F = 5.95, p < 0.05) and thelog of ambient styrene for those not wearing masks (F =9.39, p < 0.01). There was no relation reported by styreneexposure and contrast sensitivity. The authors concludethat color vision losses occur with styrene exposure athigher levels, and the fact that no relation was observedbetween exposure and contrast sensitivity or symptomsindicates very early impairment.
Assessment Although this is a somewhat short, technical publication,it does provide evidence of the fact that styrene exposuredoes impact color vision, especially at higher levels. Thestudy’s validity would have been strengthened by theinclusion of a control group of individuals not exposed tostyrene. This is particularly important in this regard asexaminers are not masked regarding exposure status inthe current design. Additionally, there is no mention of thedistribution of men and women in this patient sample. Itwould have been appropriate to exclude women fromthese analyses given their possible heterozygous geneticcolor vision status. As such, the inclusion of women in thissample could have spuriously inflated the ccI valuesreported. overall, this article provides moderate evidencethat styrene is associated with color vision deficiency.
Chia and Coworkers (1994)30
The purpose of this study was to evaluate the effect ofstyrene exposure on color discrimination, as well as toevaluate the effect of styrene exposure on neurobehav-ioral function. Included in the study sample were 21workers (out of a population of 70 workers) from a fiber-reinforced plastic boat manufacturing facility. Subjectswere only included in the sample if they had at least 5years of work experience and if they did not have centralor peripheral nervous system diseases. Medical examina-tions were used to screen for these illnesses. Workers gen-erally wore gloves, but not masks, during the workshift.A control group of 21 workers was also assembled fromthe same factory (the carpentry division), and the authorsstate that “their workplace was inspected to ensure thatthere was no exposure to any neurotoxic chemicals.”However, ambient sampling does not appear to havebeen completed in the carpentry area. control group sub-jects were matched on age, years of education, andsocioeconomic status to the styrene-exposed group sub-jects. However, it is also stated in the methods that the
The SIrc review November 2006 117
table 4
descriptive results from campagna and coworkers,1994.70
outcome Mean Percent
Workers with Environmental Styrene 31.8%Above AcGIH limit of 213 mg/m3
Urinary MA concentration Above 23.9%0.6 mmol/mmol creatinine
Eye Irritation 37.5%
Blurred Vision 33.0%
Tearing 23.9%

the effeCt of StyRene expoSuRe on ColoR vISIon: a RevIew
styrene-exposed workers and the control group did notdiffer on smoking and drinking history as well—on aver-age, neither group reported drinking more than 50 gramsof alcohol per day. The workers were also asked torestrain from alcohol use for the three days prior to test-ing. It is stated that none of the workers used any long-term medications that might affect their test results.
Urine collection was completed at the end of theworkshift on the day of color vision testing for determi-nation of MA and PGA concentrations. Personal, ambientstyrene sampling was not determined in this study.However, they estimated that the workers were exposedto less than 10ppm from previous studies conducted inthe factory.
Testing was conducted on Monday mornings, and onetrained worker who was masked to exposure status com-pleted all testing. color vision testing was conducted bythe dd-15 panel under a daylight fluorescent lamp pro-viding 1,000 lux. All subjects wore their habitual visualcorrection, and it is not stated if the test was conductedmonocularly or binocularly. The authors state that scor-ing was conducted via the method of Bowman, althougha total color difference score is reported. Statistical analy-sis of the data was conducted using log transformations.The chi-square test, Fisher’s exact test, correlations, andANoVA were used to examine the data. As an additionalprecaution, age, years of education, and alcohol use werecontrolled for in the ANoVA models.
The mean styrene exposure duration was a period of18.8 years (range: five to 23 years), although 18 workershad more than 15 years of exposure. The mean MA con-centration in the styrene-exposed group was 84.0 mg/gcreatinine (median = 21.4 mg/g creatinine, range = 1.3 to504.1 mg/g creatinine), and in the control group was 3.3mg/g creatinine (median = 2.9 mg/g creatinine, range =1.6 to 9.6 mg/g creatinine). The mean concentration ofPGA in the styrene-exposed group was 66.0 mg/g creati-nine (median = 30.1 mg/g creatinine, range = 0.3 to 297.4mg/g creatinine), while in the controls, the mean concen-tration of PGA was 0.7 mg/g creatinine (median = 0.58mg/g creatinine, range = 0.3 to 1.9 mg/g creatinine).
The total color difference score for the dd-15 panel inthe styrene-exposed group was 164 (standard error =0.04) and was 131.8 in the control group (standard error =0.04); these values were reported to differ statistically (p =0.0006). They report that there was not a significant corre-lation between the total color differences score and MA (r= 0.33, p = ns) or GA concentrations.
The authors conclude that styrene exposure canimpair color vision. Secondarily, they conclude that mostcolor discrimination errors in that group are “in the blue-
yellow and red-green ranges.” Finally, they suggest thateven though these workers were exposed to low levels ofstyrene (less than an estimated 10 ppm), their long-termexposure to the chemical may be associated with theircolor vision deficiencies.
Assessment Unfortunately, the conclusions made by the authors areobscured by several factors. First, the total color differ-ence scores reported by the authors do not appear consis-tent with the scoring mechanism proposed by Bowmanand coworkers (1982). The ccI value associated with thecase group (≈ 1.40) appears to be quite large, and mayreflect the inclusion of individuals with congenital colorvision deficiencies (there was no mention of exclusion ofcongenital deficiencies and with a sample size that is sosmall, the inclusion of just one individual in this groupcould skew this mean). This significantly impacts thevalidity of this study. Another factor of concern is the lackof personal air sampling for styrene. We believe that noconclusions can be drawn regarding the effect of styreneexposure on color vision from the data and results associ-ated with this study.
Campagna and Coworkers (1995)58
The purpose of this work was to examine the relationbetween “internal and external” styrene exposure factorswith color vision discrimination and contrast sensitivityat near. A sampling frame of 151 workers was composedfrom three canadian reinforced plastics factories, andfrom this, 128 volunteered to participate in the study. Anadditional 49 workers were excluded for the followingreasons: “poor” near visual acuity (n = 11), additional sol-vent exposures (n = 1), medications affecting vision (n =2), acute styrene exposures (< 6 months, n = 8), incom-plete background data (n = 12), and “diabetes, colorblindness, ocular disorders and injuries” (n = 13). In sum-mary, a total of 81 final subjects were included (79 male, 2female) with a mean age of 29 ± 8 years and an average of5 ± 4 years of seniority on the job.
Styrene sampling was conducted via personal passivesampling monitors worn for about 4 hours during theworkshift. End-of-shift urine was collected to determineMA concentration and were analyzed using HPLc (cor-rected for urinary creatinine). outcomes assessed includ-ed sociodemographic information, work condition, workhistory, and general and ocular symptoms (i.e., eye irrita-tion, tearing, and blurred vision). Near visual acuity wastested monocularly with habitual correction using theNational optical Visual chart at 0.4 meters. color visionwas assessed monocularly using the dd-15 panel, and
The SIrc review November 2006118

the effeCt of StyRene expoSuRe on ColoR vISIon: a RevIew
subjects were classified with either a blue-yellow or red-green loss. Scores for subjects were used to calculate ccIvalues according the Bowman’s method, with an averagepresented from both eyes. Subjects were further classifiedfor color vision deficiencies if he or she misplaced a colorcap by 2 in the following categories: type III blue-yellowloss, type II red-green with concurrent blue-yellow loss,and type I red-green loss. one cap misplaced was consid-ered normal. The Vistech chart (VcTS 6000) was used toassess near contrast sensitivity at 0.4 meters monocularly.There is no statement about the use of habitual visual cor-rection during this test. Five spatial frequencies were test-ed and the data are presented as a mean of both eyes.
Statistical analyses included the log transformation ofsome data due to non-normal distributions includingalcohol consumption, seniority, ambient styrene, and MAconcentrations. Paired t-tests and Spearman’s correlationcoefficients were used to examine the relation betweenvariables. Multiple linear regression was used to examinepredictors (i.e., age, seniority, alcohol use, mask use, andMA) of either the ccI or contrast sensitivity. Logisticregression was used to examine predictors (those afore-mentioned) of either one subjectively reported symptomor “qualitative dyschromatopsia.”
The average self-reported alcohol intake was 160 ± 181grams per week. The average MA concentration of thegroup was 0.36 ± 0.52 mmol/mmol creatinine and theaverage ambient styrene concentration was 205.78 ±262.35 mg/m3. For the group, there was a significant dif-ference between the two eyes on the ccI (1.20 ± 0.22 vs.1.09 ± 0.12, p < 0.0001) and contrast sensitivity, althoughthe spatial frequency for this difference in contrast sensi-tivity between the eyes is not reported. The between-eyeaverage ccI was 1.14 ± 0.16. Investigation of the datashows that the difference between eyes in contrast sensi-tivity may apply to all spatial frequencies. Linear regres-sion models show that both age (95% confidence interval[cI] for β = 0.003 to 0.013) and urinary MA (95% cI= 0.052to 0.263) predicted the ccI. contrast sensitivity at 12 and18 cycles/degree) were associated with age, while at 6and 12 cycles/degree, it was associated with MA. In sep-arate regression models, mask use and ambient styrenewere used as predictors of the ccI and contrast sensitivi-ty. In general, mask use was associated with reduced ccIvalues, while ambient styrene was associated withincreased ccI values. However, when controlling formask use in the day of exposure assessment, ambientstyrene was no longer significantly associated withincreased ccI values. In general, mask use and ambientstyrene was not associated with contrast sensitivity loss.
of the 81 styrene-exposed subjects, 25 (30.9%) were
considered to have the “profile of acquired dyschro-matopsia.” of these, 22 had blue-yellow defects, one hada red-green defect, and two had mixed defects. They alsostate that six other workers had defects with nonspecificaxes. Logistic regression was used to predict acquireddyschromatopsia, and after controlling for age, alcoholconsumption, and mask use, neither MA concentrationnor ambient styrene were significant.
Eye irritation was reported by 35 subjects, followed byblurred vision (n = 31), and tearing (n = 23). Logisticregression was used to examine predictors associatedwith symptom reported. MA significantly predicted eyeirritation (or = 5.50, 95% cI = 1.28 to 23.67), tear (or =4.73, 95% cI = 1.07 to 20.87), and blurred vision (or =6.47, 95% cI = 1.43 to 29.28), after controlling for age andalcohol consumption. Ambient styrene predicted eye irri-tation (or = 1.53, 95% cI = 1.09 to 2.14), but not tearing(or = 1.36, 95% cI = 0.95 to 1.95) or blurred vision (or =1.37, 95% cI = 0.98 to 1.93).
The authors make several conclusions from this workincluding:1) color vision loss occurs during 8 hour exposures tostyrene in workers who do not wear masks;2) The effect occurs through respiratory absorption ratherthan through the mucous membranes of the eyes;3) Styrene exposure induces blue-yellow defects;4) The effect may be due to an alteration of the liposolu-ble fraction of the cones or through altered dopaminergicmodulation in the horizontal cells;5) MA concentration is associated with altered high spa-tial frequency contrast sensitivity caused by “changes inneurooptic transmission rather than ocular defects;” and6) These workers reported visual symptoms “more fre-quently than others” caused by a local effect on the eye.
Assessment This study was generally well-conducted and the analy-ses and results were carefully described. Unfortunately,the major criticism associated with this study however, isthe lack of a control group in order for comparisons to bemade. Although inferences can be made from the presentstudy, a control group would have improved the validityof the results. That being said, the study does provideconvincing evidence of color vision loss associated withboth ambient styrene and MA. In terms of the contrastsensitivity, especially as the testing is down at nearpoint,the losses at the higher spatial frequencies could be dueto refractive error and optical blurring. This fact greatlylimits their findings relative to contrast sensitivity testing.optical blurring would have little effect upon colorvision testing.
The SIrc review November 2006 119

the effeCt of StyRene expoSuRe on ColoR vISIon: a RevIew
Eguchi and Coworkers (1995)57
The purpose of this research was to examine the effect oflow-dose styrene exposure (< 20 ppm) on color vision ina sample of Japanese workers. The original styrene-exposed sampling frame included 69 workers (fivewomen) from six reinforced plastics factories, and thecontrol group included 84 workers (15 women) fromthose same factories in addition to others. Patients wereexcluded if they had a congenital color vision defect,hypertension, poor vision (< 6/10), high alcohol use (>250 g/week, were female, or used color vision-alteringmedications). Thus, the final sample included only 64styrene-exposed men and 69 controls (all men).
Ambient styrene exposure was monitored by areasampling rather than personal passive sampling. Urinewas collected at the end of the workshift on the day ofcolor vision testing for MA concentration determinationby HPLc. The dd-15 panel was used to assess colorvision on Mondays at the beginning of the workday. Thetest was performed monocularly under a daylight fluo-rescent lamp providing 1,000 lux and habitual glasseswere used. If subjects scored two or more errors, theywere classified as red-green or blue-yellow as appropri-ate. Further, the total color difference score (TcdS) andccI values were calculated. Pearson’s correlation wasused to evaluate the relation between ccI and age, whileSpearman’s correlation was used to evaluate the associa-tion between ccI and MA concentration. In addition, theMann-Whitney U and Wilcoxon signed rank tests wereused to make group comparisons. Multiple linear regres-sion was used evaluate the relation between ambientstyrene and ccI using a backward selection technique.
Ambient styrene was 18.5 ppm (range 6.6 to 36.4ppm). In general, MA concentrations were low with amean concentration of 0.22 g/l (range of 0 to 48 g/l).About 56.3% of workers had MA concentrations < 0.3 g/l,34.4% had concentrations 0.3 to 1.0 g/l, and 9.4% hadconcentrations > 1.0 g/l. There was a significant correla-tion between TcdS and age in both styrene-exposedworkers (r = 0.39, p< 0.01) and the control group (r = 0.48,p < 0.01). Following this analyses, post-hoc matching wasconducted based on age (± 3 years). The average ccI inthe styrene-exposed workers was 1.220 ± 0.235 while inthe age-matched controls, the average ccI was 1.120 ±0.128 (Wilcoxon signed rank test, p < 0.01). Styrene-exposed workers were subdivided based on MA concen-trations (Group 1 < 0.42 g/l and Group 2 ≥ 0.42 g/l,where 0.42 g/l N 30 ppm), resulting in a reduction to 57individuals in each group. The mean MA concentrationin Group 1 (n = 40) was 0.20 g/l (≈ 8 ppm) and in Group 2(n = 17) the mean MA concentration was 1.06 g/l (N 93
ppm). These two groups were then compared with theage-matched control group in terms of the average ccIand the results showed that only Group 2 differed statis-tically (Wilcoxon signed rank test, p = 0.12 and p < 0.01for Groups 1 and 2 vs. controls respectively). However,for both of these groups, there was not a significant corre-lation between MA concentration and ccI values (Group1 r = – 0.24, p = 0.12 and Group 2 r = 0.32, p = 0.18).
The stepwise multiple regression analysis showed thatage (β – 0.007, p < 0.01), smoking (β = – 0.006, p < 0.05),and urinary MA (v = 0.16, p < 0.01) were significant pre-dictors of the ccI in the styrene-exposed workers.Insignificant outcomes included volume of alcohol con-sumption, frequency of alcohol consumption, education,exposure duration, and the interaction of exposure dura-tion and urinary MA. The adjusted r2 for the model was0.328. Finally, the authors state that most of the defectsfound in this sample were blue-yellow, although someshowed “complex loss.”The authors conclude from the results that:1) ccI values of styrene-exposed workers were signifi-cantly higher than controls;2) Urinary MA is a predictor of color vision loss;3) There is a dose-response function whereby those with-er higher MA concentrations have more significant colorvision losses; and4) duration of styrene exposure is not related to colorvision loss.
Assessment This study was conducted in a similar fashion to that ofGobba and coworkers (1991) including the design andanalysis of the results (i.e., post-hoc data matching). Itwas appropriate to exclude women from the analyses aspreviously discussed, although the authors do not recog-nize the heterozygous deficits associated with females asthe reason for their exclusion. The study does seem toprovide evidence for the conclusions that ccI values ofstyrene-exposed workers are higher than controls, espe-cially in higher styrene exposure levels measuredthrough urinary MA concentrations. This was not thecase for the low styrene exposure group, which did notstatistically differ from the control group. A limitation ofthis study included area rather than personal ambientstyrene sampling; this may be why the authors chose notto evaluate this variable as a predictor of color vision loss.An additional limitation of this study was that there is nomention of masking patient identifiers regarding theirstatus as a styrene-exposed worker or a member of thecontrol group. overall, this study provides moderate evi-dence regarding the impact of styrene on color vision.
The SIrc review November 2006120

the effeCt of StyRene expoSuRe on ColoR vISIon: a RevIew
Mergler and Coworkers (1996)61
The purpose of this report was to examine the effect of astyrene-reduction intervention on neurotoxic effects asso-ciated with this chemical. The study design included alongitudinally-assessed cohort of styrene-exposed work-ers. A battery of neurofunctional tests was administeredto will participants mainly composed of the Neurobehav -ioral core Test Battery (NcTB) and the Field AssessmentUsing Sensory Tests (FAST) battery. The dd-15 and nearcontrast sensitivity (Vistech 6000) are the two compo-nents in the FAST battery. In addition, self-administeredquestionnaires including sociodemographic information,work and medical history, and drug, smoking, and alco-hol use were administered. Styrene exposure measureswere made by personal passive sampling and end-shifturinary MA concentrations were measured. A daily time-weighted average was used for each of these outcomes.Following baseline measures, styrene reduction recom-mendations were made to the plants which included theinstallation of local ventilation systems and personal pro-tective device reinforcement. one plant heeded the rec-ommendations, while the other two plants did not.Baseline outcomes were compared following two years ofadditional exposure in the three reinforced plastics plantsusing paired t-tests, Mann-Whitney U tests, or paired t-tests depending on the nature and distribution of the data.
At baseline, 118 workers completed the testing proto-col, although only 75 were still employed 2 years laterand 57 of these workers agreed to participate again (18refused participation). No information regarding genderis provided in this study. At the 2-year follow-up, the 18workers who refused to participate did not statisticallydiffer from participants in terms age (29.0 vs. 32.3 yearsrespectively) or years of education (10.7 vs. 10.7 yearsrespectively). The participants were, however, moreexperienced than non-participants (6.0 years vs. 3.7 years,p < 0.05). At baseline, the participants had higher ambi-ent styrene exposures (75 mg/m3 vs. 18 mg/m3, p < 0.01)and urinary MA concentrations (0.11 mmol/mmol creati-nine vs. 0.05 mmol/mmol creatinine, p < 0.01), althoughthey did not statistically differ in these two outcomes attheir 2-year follow-up.
At the 2-year follow-up, there were significant reduc-tions in ambient styrene (p < 0.05) and urinary MA con-centration (p < 0.001) compared with baseline at Plant 3.This was not the case at the other two plants. of the final57 workers completing both phases of the study, therewas no difference in their average ccI score when com-paring baseline (mean ± Sd = 1.18 ± 0.20) to the 2-yearfollow-up (1.19 ± 0.35). However, the authors found thatcontrast sensitivity (averaged over six spatial frequen-
cies) was significantly reduced two years later (mean ±Sd baseline 69.5 ± 20.8 to 62.1 ± 20.6, p < 0.01). Whenworkers data was stratified by plant (i.e., plants 1 and 2compared to plant 3), their mean differences in ccIscores (baseline – follow-up) were not significantly differ-ent from zero. The mean difference in ccI score for plants1 and 2 was –0.12 ± 1.17 and for plant 3 it was 0.20 ± 0.78.contrast sensitivity was reduced only in plant 3 (meandifference – 0.62 ± 1.05, p < 0.01).
Longitudinal changes associated with styrene expo-sure were examined by separating workers on the basisof their change in MA concentration (baseline – follow-up). The workers were grouped as follows: those with anincrease ≥ 0.1 mmol/mmol creatinine (n = 17), those whoremained within ± 0.1 mmol/mmol creatinine (n = 22),and those who had decreased by ≥ 0.1 mmol/mmol crea-tinine. The authors state that there was a strong correla-tion (p < 0.001) between increase in MA concentrationover the two years and an increase in the ccI index,although they do not provide the actual correlation coef-ficient. data for contrast sensitivity are not provided.
Based on these results, the authors make the followingconclusion. differences in neuro-outcomes were associat-ed with changes in MA concentrations—“the strongestrelation is with color vision which may be particularlysensitive on a short term basis to increases and decreasesin exposure.”
Assessment overall, the results supporting the relation betweenstyrene exposure and color vision loss associated with thisstudy are not substantial, although it is notable that thisstudy represents the first full-scale longitudinal evalua-tion of exposure and color vision loss. For most neuro-functional outcomes, including color vision, there was nodifference between baseline and the 2-year follow-up,although there were measured reductions in ambientstyrene and MA levels (Plant 3). This is also somewhattrue for Plants 1 and 2, who showed changes in styreneand MA levels, although workers showed no change intheir ccI values. There is no mention of the sample’s gen-der in the manuscript; thus, it is not possible to determinethe percent of females. This might be problematic if ccIcomparisons from this patient sample were made withnormal individuals from other studies as the index maybe slightly inflated. Finally, there was no control groupused for statistical comparisons and changes in outcomesover time limiting the interpretation of the results.
Campagna and Coworkers (1996)59
The purpose of this work was to specifically evaluate the
The SIrc review November 2006 121

the effeCt of StyRene expoSuRe on ColoR vISIon: a RevIew
potential dose-response effect associated with styreneexposure and color vision loss. data that were used forthese analyses included that collected and analyzed intwo previous reports by campagna and coworkers (1995)and by Gobba and coworkers (1991). For these analyses,subjects were excluded if they had medically confound-ing conditions (i.e., diabetes, hypertension, or cerebrovas-cular disease, cataracts), were taking ophthalmotoxicmedications, and those with a history of poor near visualacuity, eye trauma, congenital dyschromatopsia, voca-tional exposure to other solvents, and those with incom-plete data. Subjects were also excluded if they wore pro-tective masks on the job, consumed alcohol more than200 gm/week. No control subjects were included in theseanalyses, although data were collected on control subjectsby Gobba and coworkers, 1991. The final sample thusincluded 118 individuals.
Individuals were assessed throughout the workshiftfor environmental styrene via passive dosimeters. colorvision discrimination was assessed using the dd-15panel, and ccI values were used to quantify the data.The authors state that the test was administered in thesame format and conditions across both study samples.Multiple linear regression was used to first examine theeffects of age and alcohol use on color vision discrimina-tion, which were both found to be associated withincreased ccI values. As such, the ccI was then adjustedin further analyses by “adding the mean score to theresidual.” Spearman’s correlation was then used to exam-ine the relation between the adjusted ccI and styreneexposure. A maximum likelihood technique was thenused to determine the threshold styrene exposure associ-ated with color vision abnormalities.
There were no statistical differences in the patientsamples from each of the two studies in terms of averageage, alcohol consumption, work seniority, styrene expo-sure, or ccI values. The average adjusted ccI valueswere 1.14 ± 0.14 from the canadian sample and 1.18 ±0.16 from the Italian sample (p = not significant). Theadjusted ccI showed a positive relation with styreneexposure (Spearman’s r = 0.246, p < 0.01, n = 118). Themaximum likelihood value was 3.8 ppm, where the chisquare value was 6.8. The upper bound for the 95% confi-dence interval associated with this styrene level was 25.7ppm (lower limit could not be determined).
The authors conclude with the following points:1) There is an association between styrene exposure andcolor vision discrimination loss across studies.2) The threshold limit associated with color vision loss isabout 4ppm, which is much lower than many currentthreshold limits for styrene exposure.
AssessmentThere are two novel aspects associated with this manu-script. First, the data used for these analyses representedtwo distinctly separate patient samples (although theywere shown to be very similar in terms of their respectivedemographics). In general, we would expect this toimprove the generalizability of any results identified, aswe have included a more diverse sample of patients andexposures. It does appear, however, that as this wassomewhat of a post-hoc analysis, this may be problematicas the one cannot be entirely sure that the methods usedwere the same for both studies. The second novel aspectof this work is the specific dose-response analysis con-ducted from the overall data set. This method is based ona change point, which assumes no relation between expo-sure and the outcome of interest for low levels of expo-sure, but a relation for higher levels (i.e., where a dose-response may exist). However, the threshold of 4 ppm forcolor vision impairment is a bit surprising. other studieshave found no relation between styrene exposure andccI for such low levels.53, 57 The upper limit associatedwith this threshold value was 26 ppm, although the cor-relation coefficient associated with this limit was only0.21. Typical ambient concentrations are around 1 partper billion (ppb) and 20 ppm in fiberglass-reinforcedplastics plants today.
Given that this work represents the re-analysis of pre-viously reviewed studies, many of the same previouslyidentified problems still exist. These problems includethe lack of masking examiners in terms of case (or controlstatus) and the potential inclusion of females in the sam-ples, who may give spuriously higher ccI valuesdepending on their genetic status.
Gobba and Cavalleri (2000)56
The purpose of this report was to investigate changes incolor vision associated with continued styrene exposureover a period of time. Although not relevant to thisreport, the investigators also examined the effects of per-cholorethylene (PcE) and metallic mercury on colorvision in two separate samples of individuals. Two sam-ples of styrene-exposed workers were examiner (n
1= 39
and n2
= 30). The authors indicate that styrene exposurewas assessed by biological monitoring or personal pas-sive sampling, although they are not specific. A question-naire assessed work and medical history, exposure toother toxic solvents, alcohol and smoking habits, andophthalmotoxic medication usage. Subjects were exclud-ed if they used more than 50 g of alcohol per day, smokedgreater than 30 cigarettes per day, and had visual acuityworese than 20/32. controls were used for comparisons
The SIrc review November 2006122

the effeCt of StyRene expoSuRe on ColoR vISIon: a RevIew
in outcomes (with equal participants as the case samples)and were matched to the cases on gender, age, and alco-hol and cigarette use.
color vision was assessed using the dd-15 panel andexpressed using the ccI. Each eye was tested individually,and testing was conducted in the morning before expo-sure under a daylight fluorescent lamp (1200 lux). Theexaminers were “unaware of exposure levels of work-ers.” Statistical assessments were made after first testingdata normality. The paired t-test was used for compar-isons between groups on ccI data, and correlations wereassessed using Spearman’s correlation coefficient.
First, 41 styrene-exposed workers were assessed forcolor vision deficiencies “during the last weeks beforesummer holidays.” The mean ccI from this group was1.25 ± 0.22, which was significantly higher than controls(1.15 ± 0.14, p < 0.01). color vision was then assessed themorning of the first day returning to work (30 days with-out work-related styrene exposure) in 39 of these sameindividuals. The mean ccI was 1.23 ± 0.19, which did notstatistically differ from the baseline ccI value for thesesame workers (1.20 ± 0.21, p > 0.05). Styrene exposurelevels were not reported for this analysis.
In a second group of 30 styrene-exposed workers(mean exposure = 13 ppm), the average baseline ccI was1.24 ± 0.21 which was significantly higher than controls(1.14 ± 0.14, p < 0.01). This group was then assessed again12 months later. Exposure levels were increased in 10 ofthe 30 workers, although this increase was not statistical-ly significant (time 1 = 10.9 ppm vs. time 2 = 16.2 ppm, p> 0.05). The exposure levels were slightly reduced in 20members of this sample, although this reduction was notstatistically significant (time 1 = 14.1 ppm vs. time 2 =10.2 ppm, p > 0.05). The authors suggest that the ccI val-ues increased in the workers with increased styrene expo-sures, although the analysis did not show significance inthis group (time 1 = 1.18 ± 0.16 vs. time 2 = 1.29 ± 0.21, p =0.08). The workers with slightly reduced exposuresshowed no difference in ccI values over this 12 monthinterval (time 1 = 1.27 ± 0.18 vs. time 2 = 1.29 ± 0.16, p >0.05). The authors conclude that the increased exposurelevel in the 10 workers was associated with increasingerrors in color discrimination.
Assessment
Although the Methods section of this article is well orga-nized and presented, the results and conclusions are lessthan satisfying. There is adequate discussion regardingcontrolling for potential confounders (i.e., age, alcoholuse), although it does not appear that individuals with acongenital color vision deficiency were excluded from
participation. The assessment of urinary MA concentra-tions would have also been a nice supplement to the dataand comparisons. The authors do not discuss gender intheir sample, which is problematic as the inclusion offemales could have spuriously increased any ccI valuesreported. This may not be problematic if both the caseand control groups have equal number of females,although we cannot be sure of this as the data was pre-sented. Further, there is inadequate discussion regardingthe control group, including it selection, demographics,and work history. Given the nature of the research, theselection of the control group could have just as muchimpact on the outcomes of interest as the selection of thecases. The statistical analyses as presented are appropri-ate given the desired comparisons, yet the actual resultsof the study do not correspond with the conclusionsdrawn by the authors. For the first group including 41styrene-exposed workers, there was a significant differ-ence as compared to the control group in terms of ccIvalues. However, there was no statistical difference inccI values after 30 days without styrene exposure in thecontrol group. Again, in the second group of 30 styreneexposed workers, there was a difference in ccI valueswhen compared to a control group at baseline. However,there was not a statistical increase in styrene exposureover the twelve month period nor was there a statisticalchange in ccI values. No data were reported for the con-trol group over this same time period. This draws intoquestion the conclusion that any changes in color visionoccur over time with changing levels of styrene exposure.
Kishi and Coworkers (2001)60
The purpose of this report was to supplement previouswork conducted to assess a dose-response relationbetween styrene exposure and color vision loss. Theauthors specifically state the need for a larger sample sizein order to achieve this aim relative to their previousstudy including 69 exposed workers.57 In this study, 105male subjects from seven reinforced plastics factories wereincluded in the styrene-exposed group. A control group of117 males was also assembled from the same and otherfactories; however, none of the controls reported anyexposure to styrene or other solvents. A questionnaire wasused to assess work history, solvent exposure, and alcoholand drug use. Subjects were excluded from participationfor the following reasons: congenital dyschromatopsia,hypertension, ophthalmotoxic drug use, poor visual acu-ity (worse than 20/32), and alcohol use greater than 250g/week. collection of urine occurred at the end of the dayof color vision testing for MA concentration determinationand area sampling was used for ambient styrene levels.
The SIrc review November 2006 123

the effeCt of StyRene expoSuRe on ColoR vISIon: a RevIew
color vision was assessed using the dd-15 panel onMondays or Tuesdays at the beginning of the work-shiftunder a daylight lamp (1000 lux). Testing was conductedmonocularly with visual correction. The test was scoredin two ways. First, individuals were categorized asabnormal (blue-yellow or red-green) with two or moreerrors in either eye. Second, a ccI score was calculatedfor each individual. correlation coefficients (Pearson’sand Spearman’s) were used to assess the relation betweenccI and age and ccI and MA concentration, respectively.The Mann-Whitney U test was used to make compar-isons in outcomes between individuals. Multiple linearregression was used to examine the relation betweenstyrene exposure and the ccI, while controlling for age.Finally, the ccI was adjusted for age and cigarette con-sumption and a threshold effect of styrene was deter-mined using the maximum likelihood techniquedescribed by campagna and coworkers(1996).
The average ambient styrene level was 21 ppm (range:6.6 to 36.4 ppm) and the average MA concentration was0.21 ± 0.44 g/L for styrene-exposed workers. The authorsstate that there were “no large difference for age, alcoholconsumption, the number of cigarettes/day, and educa-tional attainment among these workers,” which appearsto be true upon inspection of the data although no statis-tical comparisons were made. It does appear that the con-trol group consumed more alcohol as compared to thestyrene-exposed workers, although no statistical compar-ison was made. There was a significant linear relationbetween the ccI and age for both styrene-exposed work-ers (r = 0.43, p < 0.001) and controls (r = 0.37, p < 0.001).After matching for age (87 pairs for this comparison), it isreported that there was a difference in the mean ccI val-ues when comparing the two groups (Mann Whitney U,p < 0.01) although the data are not presented nor is anindication of which group had larger ccI values.
The styrene-exposed group was categorized based onurinary MA concentrations: Group 1 (< 0.1 g/L N 8 ppmambient styrene), Group 2 (0.1-0.2 g/L N 8 to 16 ppmambient styrene), and Group 3 (> 0.2 g/L N > 16 ppmambient styrene). The mean ccI values for these groupswere 1.21 ± 0.26, 1.23 ± 0.20, and 1.27 ± 0.27, respectively,which did not statistically differ from one another(ANoVA). The ccI values from Group 2 differed fromage-matched controls (1.12 ± 0.12, Wilcoxon signed ranktest, p < 0.05), as did the ccI values from Group 3 com-pared with age-matched controls (1.13 ± 0.14, Wilcoxonsigned rank test, p <0.01).
The results from the multiple regression procedureshowed that age (p < 0.001), urinary MA (p < 0.001), andsmoking (p < 0.05) predicted the ccI in styrene-exposed
workers. Exposure duration, alcohol use, and educationalattainment were not significant predictors of the ccI inthese workers. Using the maximum likelihood analysis, athreshold urinary MA concentration of 0.39 g/L (95% cI= 0.32 g/L to 0.48 g/L). This is equivalent to an ambientstyrene level of about 30 ppm.
The authors conclude that for moderate and highstyrene exposures, ccI values differ from age-matchednormals indicating that there is a dose-response affect.Further, the lowest observed adverse effect level(LoAEL) was 0.39 g/L and most individuals had a blue-yellow defect associated with styrene exposure (no datapresented).
AssessmentThe Introduction and Methods sections associated withthis article are clear and concise. Both the case and controlsamples seem to be appropriately selected, with very lit-tle differences between them other than the exposure ofinterest. No females were included in the analyses, whichis appropriate. However, the authors state in theIntroduction that the purpose of this report was to evalu-ate a dose-response affect of styrene on color vision witha ‘larger sample of patients’; yet only 105 styrene-exposedworkers were included. It is unclear as to how this sam-ple size was determined to be large enough for the analy-ses required. The statistical analyses appear appropriateas they were conducted. The article suggests that colordiscrimination is altered in styrene-exposed individualscompared with age-matched controls, although no dataare presented in this regard. In terms of dose-responseevaluations, it appears that the analyses were underpow-ered to detect a difference between low, moderate, andhigh exposure groups. However, an additional analysiscomparing these groups to age-matched controls showsthat the ccI is significantly higher in the moderate andhigh-exposure groups than the control group. Thus, thereis some evidence of a dose-response affect. The maximumlikelihood threshold analysis shows a LoAEL of about 30ppm, which is much larger than that of campagna andcoworkers.59 The value found in the current work ofabout 30 ppm seems much more reasonable given thefindings of this and other studies that higher levels ofstyrene exposure seem to impact color vision rather thanlow levels. It is unclear why no data were presentedregarding the quantitative analysis of color vision (num-ber of blue-yellow and red-green defects in the sample).In summary, this work does provide evidence that higherstyrene exposures do impact color discrimination greaterthan low levels, which may not impact color vision.
The SIrc review November 2006124

the effeCt of StyRene expoSuRe on ColoR vISIon: a RevIew
Triebig and Coworkers (2001)62
The purpose of this report was to examine how styreneexposure affects color vision and to examine changes incolor vision over time after styrene exposure wasstopped. A sample of thirty male laminators (out of 50styrene-exposed workers) was included in the study;similarly, 27 males from the same company served as areferent group. The exclusion criteria for participationwere as follows: congenital dyschromatopsia, diabetes,hypertension, visual acuity worse than 20/32, alcohol usegreater than 30 g/day, ophthalmotoxic drug use, oph-thalmic or systemic diseases altering color vision, and aMA and PGA sum of greater than 50 mg/g creatinine(control group). Given these restrictions, eight cases and16 controls were eliminated from participation, leavingthe sample with 22 cases and 11 controls. The articlestates that there were no significant differences betweenstyrene-exposed workers and controls in terms of age,alcohol use, cigarette use, and seniority.
The examination included the following procedures:questionnaire, physical examination, Ichikawa color platetest, complete eye examination (including visual acuity,intraocular pressure, fundoscopy, and perimetry), andthe dd-15 panel. The dd-15 was conducted under a day-light lamp (1000 lux) binocularly (“due to time con-straints”). The test was scored using the ccI, and com-parisons to age-dependent referent values were made toa “assess whether the ccI is normal or abnormal.”Styrene exposure was assessed by urinary MA and PGAassessments, which were collected at the end of the work-shift on Thursdays. An intervention was conducted inwhich a ventilation system was installed to reducestyrene levels and subjects were re-tested ten monthslater. The sum of MA and PGA were used as an assess-ment of total styrene exposure. Statistical analysesincluded the use of the U-test, Fisher’s exact test, the
Wilcoxon signed rank test, Spearman’s correlation coeffi-cients, and linear regression.
Following the ventilation intervention, there was asignificant reduction in MA plus PGA levels in styrene-exposed workers (baseline = 472 and 10 months = 273, p= 0.02). This was not the case in the control group whoshowed no statistical change in styrene levels (baseline =15 and 10 months = 24, p = 0.25). ccI data and analysesare presented in Table 5.
Further comparisons were made using these data. Forboth cases and controls, there was no statistical differencewhen comparing the ccI values from Monday morningand Thursday following the work-shift at baseline or atthe assessment following the intervention 10 monthslater. However, there was a significant reduction in theccI values taken Monday morning in the styrene-exposed workers following a 4 week vacation period. Themean baseline ccI was 1.24 compared to 1.11 after vaca-tion (p = 0.01) while the mean ccI ten months later fol-lowing the intervention in these same workers was 1.11compared to 1.05 following the 4 week vacation period (p= 0.01). A categorical analysis is done whereby individu-als were classified on the basis of an abnormal ccI result,although it is unclear how the authors define this term.The analysis suggests that eight styrene-exposed workerscompared with one control worker had an abnormal ccIvalue on Thursday at baseline (p = 0.05); no other com-parisons between styrene-exposed workers and controlswith abnormal ccI values at any test period showed sig-nificance. They also state that “regression analysesrevealed significant and positive correlations between theamount of internal styrene during the first examinationphase and the score of ccI, but not for PGA alone.”However, the regression equation and slope of the linebetween MA prediction of ccI score is actually insignifi-cant (p = 0.07). Spearman’s correlation coefficients are
The SIrc review November 2006 125
table 5
ccI data from Triebig and coworkers (2001).62
ccI Monday Prior ccI Thursday After After 4 weeks Test Period Morning the Workshift Vacation
Baseline cases 1.24 ± 0.25p = 0.11
1.29 ± 0.27p= 0.05
1.11 ± 0.11—
controls 1.10 ± 0.11 1.10 ± 0.09 Not Assessed
10 Months cases 1.11 ± 0.11p = 0.61
1.16 ± 0.14p= 0.18
1.05 ± 0.06p= 0.56Later controls 1.10 ± 0.16 1.08 ± 0.11 1.04 ± 0.06

the effeCt of StyRene expoSuRe on ColoR vISIon: a RevIew
then reported for the relation between MA an ccI (r =0.61, p = 0.01) and between MA plus PGA and ccI (r =0.59, p = 0.01); the correlation coefficient between PGAalone and ccI was not significant (r = 0.28, p = 0.28).
Finally, another attempt was made to examine a possi-ble dose-response affect of styrene on color vision by cate-gorizing styrene-exposed workers on the basis of a normalor abnormal ccI and then evaluating MA plus PGA levelsfor each of these groups. No specific details are givenregarding the ccI cut-point used. The result presented issuch that “MA plus PGA of approximately 500 to 600mg/g creatinine was associated with a normal ccI score.”
The authors make several conclusions based on theresults of the study including:1) Styrene-exposed workers generally have worse colordiscrimination than normal controls.2) MA plus PGA of approximately 500 to 600 mg/g creati-nine (≈ 20 ppm ambient styrene) is associated with theupper, age-normal values for the ccI.3) Styrene-induced color vision deficiencies arereversible, both with complete elimination of styrene fora period of 4 weeks, after an “exposure-free weekend,”and after an intervention to reduce styrene exposures inthose workers.4) There was too much overlap in blue-yellow and red-green errors in the styrene-exposed workers to come toany conclusions regarding discriminatory defects.
AssessmentIn general, this article is well presented, and the methodsand analyses seem to support the conclusions broughtforth by the authors for the most part. color vision test-ing was conducted binocularly rather than monocularly,which was done due to “time constraints.” Unfortunately,this rationale is less than satisfactory as the test takes ingeneral between one and three minutes to conduct.Urinary MA and PGA were sampled on controls in thisresearch, which improves the internal validity of thestudy. Most other studies seem to use a self-reportedassessment from control subjects that they have not beenexposed to styrene. Although subjects were excluded dueto heavy alcohol consumption, it would have been nicefor the investigators to actually examine the affect of low-to-moderate alcohol use in the styrene-exposed workersand referent group, controlling for this as needed. It isstated in the Methods section that “results were consid-ered significant if < 0.05;” however, none of the regres-sion procedures evaluating MA, PGA, or MA plus PGAas predictors of ccI showed significance at this level,although the authors suggest significant positive rela-tions from these analyses. The authors do show signifi-
cant Spearman correlations between ccI and MA andccI and MA plus PGA, although this sort of analysis isless satisfactory. The significance of these nonparametriccorrelation analyses suggest that the variables of interestdid not meet the assumptions required for the linearregression.
From the data and analyses presented, there is no reasonto doubt that styrene-exposed workers have worse colordiscrimination than normal, non-exposed individuals. Wealso believe that although the sample sizes in both thestyrene-exposed and control group in this study weresmall, there is no methodological reason to doubt that thediscrimination losses are reversible both after short-termelimination and long-term reduction in exposure. This dif-fers from the result of Gobba that showed no improvementin color discrimination after a four week vacation period.53
In that study, 20 styrene-exposed workers underwent dd-15 panel testing after one month of reduced exposure.Although no data are presented, the authors stated “…notendency toward a restoration of color vision wasobserved.”53 Triebig and coworkers (2001) explain this dif-ference by suggesting that the stricter alcohol consumptionexclusion criteria employed in the current study may havelead to the finding. Mergler and coworkers (1996) also con-ducted a similar study, reducing ambient styrene levels andMA concentrations in 29 workers in one reinforced plasticsplant did not statistically improve their color discrimina-tion.61 It is unclear why these discrepancies exist, and futurestudies need to address the issue. It is unclear how repeatedapplications of the dd15 panel influence these sorts of out-comes, especially when the test is administered binocularly.overall, this study provides moderate evidence of the rela-tion between styrene exposure and color vision function.
Castillo and Coworkers (2001)32
The purpose of this study was to examine potentialchanges in visual function associated with long-termstyrene exposure in a cohort of workers.58, 61 The investiga-tors hypothesized that cumulative styrene exposurereduces near contrast sensitivity, and current styreneexposure is associated with color vision alterations. Allworkers examined in this study participated in both pre-vious assessments and remained employed at the plant.The plant from which individuals were sampled was ashower and bathtub manufacturers. There were 32 work-ers still employed who participated in the previous fol-low-up assessments, and 24 decided to participate (6 morewere eliminated due to poor near visual acuity). Therewas an intervention in the plant after the first data collec-tion period, in which additional ventilation was installedand respirator use was highly encouraged. Ambient
The SIrc review November 2006126

the effeCt of StyRene expoSuRe on ColoR vISIon: a RevIew
styrene was measured with personal passive devices andurinary MA was measured at the end-of-shift at the end ofthe work-week (corrected for urinary creatinine).
data were corrected for respirator use, and a cumula-tive exposure index (cEI) was determined for each work-er using styrene exposure data. Visual function assess-ments were conducted Saturday mornings, and includednear visual acuity (monocular, habitual correction) andcolor vision (dd-15, monocular). It was reported that thecolor confusion Score (ccS) was used to quantify colorvision test results. All data were log-transformed, andANoVA and two-sample t-tests were used to compareyear-specific data for individuals with each job classifica-tion. Job groups were also compared between years usingFriedman’s ANoVA (nonparametric). data were com-bined when no differences existed.
Average ambient styrene levels ranged up to 600mg/m3 at the first data collection period, 430 mg/m3 atthe second follow-up period, and 300 mg/m3 at the cur-rent follow-up period. Median MA levels ranged from0.25 mmol/mmol creatinine at the first follow-up period,0.1 mmol/mmol creatinine at the second follow-up peri-od, and 0.075 mmol/mmol creatinine at the current fol-low-up period, which represented a significant decreaseover time (p = 0.015). For the 18 workers in this analysis,the range of cEI values was 198 mg/m3 to 6,022 mg/m3.Workers were divided into three exposure groups basedon the cEI: < 1,000 mg/m3 (n = 6), between 1,000 and2,500 mg/m3 (n = 6), and greater than 2,500 mg/m3 (n =6); there was no difference in alcohol intake betweenthese groups (p = 0.42).
The authors examined the influence of age, education,and alcohol as confounders for reduced ccS or contrastsensitivity finding that age was the only factor associatedwith these outcomes. Thus, scores associated with eachoutcome were age-adjusted. The authors made pairedcomparisons using Wilcoxon signed rank test showingsignificant increase in ccS scores between 1990 and 1992(median values of 1.07 vs. 1.045 respectively, p< 0.05), butnot between 1992 and 1999 (median values of 1.045 vs.1.16 respectively, p = not reported). There was no relationbetween the current ccS outcome (1999) and ambientstyrene exposure, MS, or cumulative exposure. There wasa significant difference between years at 3.0 cPd(Friedman’s ANoVA, p < 0.05), but not at 1.5, 6.0, 12.0, or18.0 cPd. Group individuals by the cEI, there was a sig-nificant difference between groups at 3.0, 6.0, and 12.0cPd (p < 0.05). The authors conclude that long-term,cumulative styrene exposure is not related to color visionloss; rather, it is associated with contrast sensitivity loss.Although not addressed in analyses, the group also sug-
gests that as MA levels were low (< 0.25 mmol/mmol cre-atinine) suggesting “These low levels of actual exposureprobably account for the absence of a dose-dependentrelation between color vision loss and exposure.”
AssessmentThis work represents a third follow-up period to the pre-vious two assessments of a group of workers in the rein-forced plastics industry. As with the other studies, theresults here are not all that impressive. The authors founda significant increase in the ccS score between the firsttwo assessment periods, but not between the 1992 and1999 assessments. It is somewhat confusing that theauthors chose to analyze color vision in terms of the ccS,rather than the traditional ccI, which they used in theirprevious reports. The ccS differs from the ccI in that itassigns a score equivalent to the percentage increase indistance traveled around the color circle based upon thespecific color cap replacement. Thus, it makes it difficultto compare across studies, and it is unclear why theauthors chose to analyze data in this manner.
Another cause of concern is the analysis of longitudi-nal data in this study. The statistical models may not beappropriate, as repeated measures ANoVA was not used.repeated measures ANoVA is generally a more powerfuldesign, as it is based on within-subjects variance, provid-ing a more precise estimate of experimental error. Ifrepeated measures ANoVA was used here, it may haveshown a significant difference between the three colorvision assessment periods in terms of the ccS. It wouldhave also allowed the investigators to control for age,although age adjustments appear to have been made.Additionally, when using vision testing at nearpointwithin a longitudinal study, it is extremely important tocontrol refractive status. The normal reduction in uncor-rected near vision seen with age can greatly influencevisual acuity and contrast sensitivity testing.
Gong and Coworkers (2002)63
The purpose of this report was threefold: 1) to determinethe relation between current styrene exposure concentra-tion and color vision, 2) to determine previous/cumula-tive styrene exposure and color vision, and 3) to deter-mine the maximum level of previous styrene exposureand color vision. Patients were excluded from the controlgroup if they had congenital color vision loss, eye disease(not specified), hypertension, diabetes, cerebrovasculardisease, prior head trauma, ophthalmotoxic drug use,poor habitually corrected visual acuity, or alcohol con-sumption greater than 250 gm/week. Thus, a total of 57styrene-exposed workers (all males) from a reinforced
The SIrc review November 2006 127

the effeCt of StyRene expoSuRe on ColoR vISIon: a RevIew
plastic factory and a control group of 69 males wereincluded in analyses. A history was conducted to exam-ine work/lifestyle characteristics, previous solvent expo-sures, alcohol, cigarette, and drug use, and anamnesis.
From 1991 to present, workers were required to obtainphysicals 2 or 3 times per year, and end-shift MA concen-trations were measured during this physical. Thisallowed for the determination of a cumulative ExposureIndex (cEI), which was calculated based on the numberof previous health-related physicals. current exposurewas also assessed by personal passive sampling monitorsand end-shift MA concentration measures on Mondays(subjects were asked to abstain from drinking alcohol onthese days). Urinary MA was corrected for urinary creati-nine concentration. color vision was assessed monocu-larly using the dd-15 test under a 1,200 lux fluorescentdaylight lamp. Although the same examiner performedcolor vision testing to both groups, they were masked inregards to their exposure status. The ccI was used toquantify dd-15 test results. The Wilcoxon signed ranktest, Wilcoxon rank sum test, Shirley-Williams test (a non-parametric test for comparing several dose levels with azero dose control), and general linear model (GLM) wereused to analyze the data.
Urinary MA concentrations were highest early on(≈40-60 ppm between 1991 and 1993), and decreased toabout 25 ppm toward the end of the follow-up in 1998.The average styrene exposure period was 76.6 monthsand the average cEI was 77.1 months. The average cur-rent ambient styrene level in exposed workers was 49.90± 35.90 ppm, while the average MA level was 260 ± 350mg/g creatinine, and the average level of PGA was 0.11mg/g creatinine.
There were significant differences between styrene-exposed workers and controls in terms of age (29.3 vs.38.3 years, p < 0.01), educational status (12.3 vs. 14.0years, p < 0.01), cigarette smoking (11.9 vs. 8.0 ciga-rettes/day, p < 0.05), but not alcohol intake (89.9 vs. 77.6gm/week, p = ns). As such, subjects were matched interms of age (within ± 3 years), and 43 such pairs wereobtained. Even after matching on age, there were still sig-nificant difference between the groups in terms of educa-tion and smoking status. Thus, these were controlled forin the general linear models.
The median ccI values for the age-matched groupswere 1.31 (exposed) and 1.13 (unexposed), which signifi-cantly differed from one another (p < 0.01). No significantrelations were found between the ccI and age, alcoholintake, cigarette use, education, MA plus PGA, or thecEI. In order to examine a possible dose-response effect,the exposed group was divided using a urinary MA plus
PGA cut-point of 240 mg/g creatinine (10 ppm) andmatched on age prior to analyses. The average (±Sd) ccIvalue for the high dose groups was 1.14 ± 0.24, for thelow dose group was 1.09 ± 0.13, and for the control groupwas 1.02 ± 0.04 (Shirley-Williams test, high vs. control p <0.01, low vs. control p < 0.01). Another dose-responseanalysis was conducted in which subjects were catego-rized based on their maximal previous styrene dose.Those with over 0.85 g/g creatinine (> 50 ppm) were con-sidered the high dose group, and the mean age- and alco-hol-adjusted ccI value for this group was 1.00, comparedto 0.95 for the low dose group (p < 0.01).
The authors conclude that styrene does lead to alter-ations in color vision discrimination, and given the some-what low exposure levels in this study, the authors sug-gest that this is a factor in color vision loss. The authorsalso imply that MA plus PGA is a predictor of ccI loss, asit approached significance in the GLM. Finally, theauthors suggest that doses as low as 10 ppm could lead toalterations in color vision compared to normals, and thatone-time doses of greater than 50 ppm styrene could leadto impairments in color vision that do not resolve withtime. In other words, the reversibility of color visionimpairments due to styrene may be related to the maxi-mum exposure dose rather than the cumulative dose.
AssessmentThis article is well-written and the study appears to havebeen conducted in somewhat of a rigorous fashion,although there are several issues that cloud the conclu-sions suggested by the authors. The analyses suggestingthat ccI values for the MA plus PGA group with expo-sures less than 240 gm/gm creatinine (the low exposuregroup) compared to the control group are not convincing.The median ccI value for the low exposure group was1.03 (95% cI = 1.00 to 1.42, n = 29) while the median ccIvalue for the control group was 1.00 (95% cI = 1.00 to1.15, n = 29). Similarly, the mean (± Sd) values for thesegroups were 1.09 ± 0.13 and 1.02 ± 0.04, respectively.These mean ccI values for even the high exposure groupare much lower than those found for the control group inother studies and other ‘normal’ individuals (Tables 12and 14). The authors used the Shirley-Williams test tomake comparisons of the mean ccI values betweengroups, suggesting that there were significant differencesbetween both the high and low exposure groups com-pared to the control group. They base their conclusionsthat 10 ppm may lead to alterations in color vision on thisanalysis, although such current assessments may notreflect previous high-level exposures that may haveinduced permanent color vision defects. The regression
The SIrc review November 2006128

the effeCt of StyRene expoSuRe on ColoR vISIon: a RevIew
analyses showed for the right, left, and average of botheyes that MA plus PGA was not a predictor of colorvision loss (although for the right eye, the p-value was0.058 for this predictor, and the authors imply that this issignificant). There is no real discussion about the discrep-ancy between analyses by the authors, and until suchissues are resolved, one must cautiously interpret theresults from this study. Additionally, we believe that thecontrol group may suffer from somewhat of a selectionbias; in particular, the inclusion of medical students inaddition to employees of other manufacturing processesis not appropriate. The selection of a ‘control’ group inthis type of study is of equal or greater importance whenconducting a study of this nature than selection of the‘case’ group. The control group must be representative ofthe sample from which the cases were derived, havingthe same characteristics as the cases except for the fac-tor(s) of interest.71-73 It is highly unlikely that the styrene-exposed workers were similar to medical students inmany regards. Finally, Viaene has also questioned theresult of Gong and coworkers, and has suggested thattheir calculation of a cumulative Exposure Index isnaïve, and “blurs the relation between cEI and ccI.”74
dISCuSSIon
The Effect of Styrene on Color Vision: General Issues and
Threshold Levels
determining a dose-response relation is a fundamentalconcept in toxicology. As such, it is an important assess-ment that needs to be conducted when evaluating the bio-logical impact of chemicals such as styrene. Knowledge ofa dose-response effect provides evidence of causality interms of its observed effects and determines the lowestdose (i.e., the threshold dose) in which a toxic effect isobserved. In this case, toxicity would be an alteration incolor vision, outside of which is normal for an age-specificrange. consequently, one way to determine a thresholddose is to determine the point at which the body’s normalability to detoxify a chemical has been surpassed. The Noobserved Adverse Effect Level (NoAEL) and Lowobserved Adverse Effect Level (LoAEL) are importantparameters in such analyses as they are associated withrisk assessment. A dose-response curve would be the‘gold standard’ assessment of the impact of styrene oncolor vision; however, an animal model in which variousdoses and a measured effect on color vision would be dif-ficult due to the small, subjectively perceived differencesin color vision that may occur. Therefore, the assessmentof styrene’s impact on color vision is generally performedusing epidemiological study methods. These methods
might include observational studies (i.e., cross-sectional,case-control, and longitudinal cohort studies), as it isprobably not feasible to randomize individuals to a chem-ical such as styrene. Most of the studies of styrene andcolor vision are cross-sectional/case-control in nature,although sampling is generally conducted based onstyrene exposure status with the expectation that thesepeople will be ‘diseased.’ When using this somewhat of ameshed epidemiological design to study styrene’s impacton color vision, a dose-response effect can be assessed inone of two ways. First, styrene-exposed individuals canbe compared to ‘normal’ controls in terms of their colorvision discrimination. Second, the ‘dose’ of styrene withinthe exposed group could be evaluated in relation tochange in color vision. In doing so, the investigator mayselect cut-points for styrene exposure levels and examinecolor vision discrimination across the exposed groups orapply a regression procedure to describe and predict therelation between the variables (clearly, the correlationcoefficient does not perform these functions).
Most studies evaluated in this literature review used acontrol group to compare color vision discriminationagainst the exposed group, and most found a small, butsignificant difference between the two groups (Table12).53, 54, 56, 57, 60, 62, 63 Seven studies showed that, compared tocontrols, styrene-exposed workers had significantly high-er ccI values where the range of the ccI for the highexposure groups was 1.14 to 1.33, while the range of ccIvalues for the low exposure groups was 1.02 to 1.17.Studies tested for further dose-response type effects ofstyrene exposure by dichotomizing ccI values based onvarious styrene exposure levels, or through correlationand/or preferably, regression analyses in which styreneexposure was used to predict the ccI in the exposedsample. Six studies showed a relation between higherexposures (greater than 20-50 parts per million) and colorvision deficiency, compared to control groups. often, lowexposure groups did not significantly differ from the con-trol group, or population, age-specific normal values forthe test. Two studies were able to show that styrene expo-sure levels were able to predict the ccI. Although thiswas the case, there was lack of sufficient detail or issueswith the design in several studies which precludes theirinclusion as evidence that styrene and acquired colorvision deficiency are associated. Evidence for the associa-tion between styrene and color vision loss comes from thefollowing studies: Gobba (1993), campagna (1995),Eguchi (1995), Gobba (2000), Kishi (2001), and Triebig(2001). In particular, most of these studies support thenotion that higher styrene exposure levels are associatedwith color vision discrimination loss.
The SIrc review November 2006 129

the effeCt of StyRene expoSuRe on ColoR vISIon: a RevIew
Two specific studies associated with this literaturereview revealed surprisingly small apparent thresholddoses associated with color vision loss.59, 63 The study ofcampagna and coworkers (1996) suggested that a dose aslow as 4 ppm could induce color vision alterations thatcould be clinically detected, while Gong and coworkers(2002) suggested that a dose as low as 10 ppm was associ-ated with such alterations. Although these levels are sig-nificantly higher than styrene levels found in the atmos-phere, most studies have shown that styrene exposureinduces color vision alterations in ‘high’ dose groups (i.e.,greater than 20 to 50 ppm) compared with low dosegroups.53, 57, 60, 62 Because it is difficult to determine dose-response curves in human subjects, and thus, the thresh-old toxic dose associated with color vision deficiency,suggestions based on analyses like those of Gong andcoworkers might be somewhat inappropriate. The analy-sis of campagna and coworkers (1996) essentially fits twolines through the high and low exposure data, and deter-mines the intersection point. other studies that evaluatedthe low dose group relative to a control group generallyshow no difference in color vision discrimination. Forthese and other reasons discussed in the assessments asso-ciated with the review of these studies, we believe thatthese low limits of styrene exposure are unreasonable.
The question of the actual threshold associated with achange in color vision still remains. Although a cumula-tive review of the relevant literature suggests that athreshold dose of above 20 ppm appears to be associatedwith color vision loss, some might suggest that 50 ppm isa more reasonable estimate. However, one must use cau-tion in suggest these values from a literature review asthey are somewhat arbitrarily defined. A better approachmight be to perform a meta-analysis/meta-regression tothe data abstracted from the higher quality studies todetermine a threshold value.
The application of cross-sectional/case-controlresearch methods in studying occupational styrene expo-sure and color vision is problematic for several reasons,one being the potential measurement bias associated withthe ‘dose’ of styrene received by workers. The dose of asubstance is generally considered the amount of a sub-stance given at any one time. In the case of occupationalstyrene exposures and color vision, there are several fac-tors that need to be considered relating to the doseincluding the average level, peak level, and the durationof the exposure (e.g., work history). Because styrene isfound in the air associated with various manufacturingprocesses, it is important to consider both the exposuredose (ambient styrene) and the absorbed dose (MAand/or PGA); truly, these assessments must be made not
only in the present, but also in the past in order to deter-mine the impact of styrene on color vision. cross-section-al research designs generally address a specific dose (i.e.,the current dose) in terms of the relation between magni-tude of exposure and the outcome, although some inves-tigators have tried to examine cumulative exposures(years or months) of exposure without much success.What cannot be addressed by cross-sectional methodolo-gy is the impact of previous peak doses of styrene onaltered color vision. This seems to be an important part ofthe equation, as a very high peak dose might permanent-ly alter color vision function in an individual, eventhough their current exposure dose is quite low. Thus,well-controlled, longitudinal designs clearly should beconducted in this regard.
cross-sectional research designs also inhibit the inves-tigator from establishing a sequence of events in terms ofstyrene dosing and color vision loss.75 Although moststudies reviewed indicate that they excluded patientswith congenital color vision losses, there is generally nomention of the screening procedure used for such exclu-sion, and the reader is left to presume that this screeningis by self-report. research has shown that up to 18% ofcolor vision defectives may be unaware of their colorvision defect.23 If appropriate screening for congenitaldefects was not conducted, this may have significantimplications on ccI results.
Prospective study designs, which can assess changesin outcomes over time and factors that might explain thatchange, are considered the most rigorous of observation-al studies. The main advantages of using a prospectivedesign to study this issue are that it allows one to ascer-tain incidence of disease, multiple risk factors associatedwith disease (including their interaction), and the abilityto make more accurate measures of potential risk factorsand confounders. For example, the interaction betweensmoking and styrene exposure could be synergistic, andthese factors have not been thoroughly addressed in pre-vious studies. Well-conducted, prospective studies areneeded to help unravel the ‘cause-and-effect’ relationbetween styrene and color vision discrimination, whichcannot be determined in these cross-sectional or case-control studies due to the unknown temporal relationbetween disease and exposures.
Other Substances and Color Vision Deficiency
Numerous substances have been identified through theyears which have detrimental effects upon color discrimi-nation. often substances affect blue-yellow discrimina-tion due partially to the especially vulnerable blue conesin the retina.76 Because blue-yellow discrimination deteri-
The SIrc review November 2006130

the effeCt of StyRene expoSuRe on ColoR vISIon: a RevIew
orates “normally” with age, it is often difficult to docu-ment the toxicity of these agents separately from theaging processes. In addition, many ocular and systemicdisease conditions have color vision deficits associatedwith them.
aging. The measures of numerous visual functions(e.g., visual acuity, flicker fusion frequency, color discrim-ination) show similar age related changes. Sensitivityincreases through the teens to early twenties, remainsfairly stable for perhaps 2 decades, and then graduallydeteriorates. Verriest and coworkers, Bowman andcoworkers, and Muttray and coworkers have document-ed this relation with color vision using arrangement teststhat measure fine color discrimination (see Tables 3 and4).28, 29 The decrease in color discrimination with the elder-ly has been shown to be due primarily to the yellowing ofthe crystalline lens and causes discrimination losses prin-cipally in the blue portion of the spectrum.22, 77 The effectis exaggerated at low to medium light levels as senilemiosis substantially reduces light levels on the retina.78
ocular disease Conditions. Type III color visiondefects are shown for both glaucoma and diabeticretinopathy. Glaucoma color vision loss begins with a tri-tan-type defect that progresses in severe cases to includea red-green loss.10 While the use of color vision tests hasnot proven very beneficial in glaucoma diagnosis, severalstudies have shown that visual field testing with a bluestimulus on a yellow background (Short WavelengthAutomatic Perimetry - SWAP) may help document begin-ning visual loss. In diabetic retinopathy color discrimina-tion loss can be great, again showing predominantly a tri-tan-type loss. As the condition progresses, red-greendefects are found such that red-green pseudoisochromat-ic plates are also failed. The overall discrimination losscan be so great that an averaging technique is requiredwith the FM-100 hue test to identify the blue-yellow con-fusion axis.79
A Type II color vision defect is typically shown forseveral conditions that affect the optic nerve. This is truefor an optic neuritis due to demyelination (multiple scle-rosis), inflammatory disease, or vascular disease.80 A red-green color defect is also seen with Leber’s hereditaryoptic atrophy. This condition is caused from abnormalmitochondria function and resulting degeneration of theoptic nerve fibers. therapeutic drugs. Numerous drugs have been reportedto cause at least small changes in color perception.Because of this color vision testing is often used as anindicator of drug toxicity. Ethambutol is a drug used totreat tuberculosis. With prolonged use (or large doseshort-term use) the optic nerve is affected creating a Type
II red-green color vision defect. digoxin, a cardiac glyco-side, also can produce an optic neuritis and an associatedType II color vision defect. The color vision effects fromboth drugs are reversible after withdrawal from bothagents. Quinoline derivative (e.g., chloroquine, quinine)are used prophylactically against malaria or for treatmentof arthritis. The drug stimulate pigment deposition with-in the retina and initially produce a Type III tritan-typedefect. Viagra is a drug used to treat erectile dysfunction.Transient effects of blue-tint to vision and mildly reducedcolor discrimination have been reported. Long-term oralcontraceptives use has been reported to cause Type III tri-tan defects. An interesting side note is that with evenshort term use, oral contraceptives and caffeine in combi-nation have produced reduced color discrimination.lifestyle. The use of tobacco has long been known tohave toxic effects upon vision. Tobacco amblyopia wasfirst described in 1868.80 It is an optic neuropathy withdemonstrates a central visual field loss and a Type II red-green color defect. The condition is often associated withnutritional deficiencies and responds favorably to vita-min therapy. More recently, tobacco use has been associ-ated with cataracts and age-related macular degeneration(ArMd).81-84 This is significant in that both these condi-tions have associated Type III tritan defects similarly tostyrene toxicity. concerning the ArMd, Hammond andcoworkers has shown that cigarette smoking is associatedwith reduced macular yellow pigment which serves asprotective role to potential hazardous effects of shortwavelength light on the retina.85 Muttray and coworkersshowed an association between cigarette pack years andcolor discrimination loss which they attribute to subclini-cal macular degeneration changes.29 Erb and coworkersnoted an association between heavy smoking (20 or morecigarettes/day) and color vision discrimination loss;however, they were not able to determine the orientationof color vision loss.86
chronic use of alcohol has also been associated withocular changes with resulting color vision loss. In alcoholaddiction malnutrition often plays a major role. Althoughthe color vision findings are somewhat varied, it appearsthat Type II red-green defects are seen with extreme alco-hol abuse. Mergler and coworkers studied the effects ofalcohol consumption on fine color discrimination (dd-15).87 While determination of the relative effects of the ageand alcohol consumption could not be made from thepublished results, it appears that heavy alcohol use (> 750g alcohol/week) significantly reduced color discrimina-tion. 33 Adding to the confusion is that heavy alcohol use isassociated with late ArMd, while moderate use has beenreported to show mild protective effects to both ArMd,
The SIrc review November 2006 131

the effeCt of StyRene expoSuRe on ColoR vISIon: a RevIew
cataract, and diabetic retinopathy. of special note is arecent report that shows a possible interaction with alco-hol and solvents (toluene, xylene, tricholorethylene, tetra-chloroethylene). consumption of more than 250 g alco-hol/week in conjunction with solvent exposure showedsignificant detrimental color discrimination effects.88
occupational exposures. color discrimination losseshave been shown to occur after exposure to several chem-icals used in industry. Iregren and coworkers (2000) pro-vide a comprehensive review of the color vision effectsfor several of these toxins.6
cavalleri and coworkers studied workers exposed tomercury vapor using the dd-15 test.89 Workers with uri-nary mercury levels greater than 50 ug/g creatinine hadsignificantly worse ccI (mean ccI = 1.285) than controls(mean ccI = 1.101). Urinary mercury level was correlatedwith ccI (r=0.448) for exposed subjects. Subjects werematched to controls by age, sex, alcohol, and nicotine.They reported the color confusions were mainly alongthe blue-yellow axis (Type III tritan defects). cavalleriand Gobba (1998) reported that this effect was reversibleafter the occupational exposure was reduced.90 one yearafter conditions had improved, color discriminationimproved such that comparison to a control groupshowed no difference.
The effects of toluene on color vision have beenreported in several recent studies. Zavalic and coworkersused the dd-15 test (ccI) to measure color discriminationin two groups of workers exposed to toluene and a con-trol group.91 one group had a high exposure (132 ppm),while the other had a relatively low exposure (32 ppm).The ccI scores were “corrected” for both age and alcoholconsumption. The results of the study showed that theactual ccI value for the higher exposure group and theage and alcohol corrected ccI values for both exposuregroups were significantly higher for both the high andlow exposure groups than for the controls. The authorsdid not report on the predominant “axis” (i.e., red-greenor blue-yellow) of confusion or even if one existed fortheir subjects. results from this study are shown in Table6. The authors conclude that toluene can impair colorvision even with concentrations below 50 ppm.
Scientific concerns for this study involve the differentgender make-up of the three comparison groups and howcongenital color vision defectives were eliminated fromthe subject pool. The lower exposure group was predom-inantly female (93%). It is estimated that 15% of femalesare heterozygous for congenital red-green color visiondefects and will have reduced color discrimination.19 Thiswould artificially raise the ccI for this group relative tothe control group. Additionally, it is not stated how con-
genital color vision defectives were identified to be elimi-nated from participation. Slightly fewer subjects wereeliminated from the study than is expected from generalpopulation estimates. These concerns create doubt for thesignificance of the toxic effects on color vision for thelower exposure test group.
cavalleri and coworkers also studied toluene effectson color vision as compared against controls and showedsignificant differences between groups in both the ccIand the Total confusion Index.92 It was reported that thetype of color confusions was primarily blue-yellow. Theoverall results are summarized in Table 7. Estimation oftoluene exposure was done by measurement of urinaryexcretion of unmodified toluene. The mean toluene expo-sure was calculated to be 42 ppm. Subjects with highalcohol intake, smoked over 30 cigarettes/day, had poorvisual acuity, or had a congenital color vision defect wereeliminated from the subject pool. In spite of these limita-tions, the test and control subjects did have a significantdifference in alcohol consumption, although as subjectswith high alcohol intake were eliminated from the subjectpool, the authors downplayed this difference.Additionally, no mention was made of the gender of sub-
The SIrc review November 2006132
table 6
Toluene exposure and the ccI (Zavalic and coworkers,1998).91
Exposure Group ccI p value*
High (mean 132 ppm, n = 32) 1.29 < 0.001
Low (mean 32 ppm, n = 41) 1.17 0.205
controls (n = 83) 1.15 —
*p-values determined by comparison of exposed group
with the control group.
table 7
Toluene and ccI and ToTcI (cavalerri and coworkers,
2000).92
Exposure Group ccI ToTcHI p-value
Exposed (n = 33) 1.29 1.49 < 0.01
controls (n = 16) 1.10 1.16 < 0.001

the effeCt of StyRene expoSuRe on ColoR vISIon: a RevIew
ject participants nor was it explained how congenitalcolor vision defectives were identified.
Functional Significance of Color Vision Deficiency
In order to determine the functional significance ofstyrene induced color vision defects, a typical value forthis effect must be specified. Most of the studies in thisarea used the dd-15 test and analyzed results using theccI. For researchers that published mean values, themean ccI for the styrene exposed subject populationsnever exceeded 1.30, even for the high exposure groups.The highest mean values were reported by Gobba (1991,ccI = 1.26), Gobba (2000, ccI = 1.29), Kishi (2001, 1.28),and Triebig (2001, 1.29). chia and coworkers did report amean equivalent ccI of 1.40 for the styrene exposed pop-ulation; however, it was apparent that incorrect methodswere used to calculate the TcdS.30, 33 Therefore, for thisanalysis, those results will not be included.
Table 8 provides ccI scores for several samplereplacements on the Lanthony desaturated d-15 test. Itappears that a ccI score of 1.30 can be achieved by mak-ing at least 1) three one-place replacement errors, 2) onetwo-place replacement error with a one place error, or 3)one major error across the diagram. As noted previously,the ccI scoring calculates the distance in cIE-LAB colorspace that is traversed from the reference cap to the finalcap in the tray after replacement by the subject. cIE-LABcolor space was developed based upon perceptual differ-ences in color. The distance from one cap to the next isproportional to color perceptions by color vision normals.As reported by Sheedy, the total distance traversed withperfect replacement for the Farnsworth d-15 is 2.07 timesthat for the dd-15 test.33 As each test contains 16 totalcaps, the average “distance” between caps in the twotests would also vary by this same ratio.
For the dd-15, if an individual that makes a singlemajor misplacement with return (e.g., from cap 1 to cap15 to cap 2) with perfect replacement following, the ccIwould be approximately 1.3 (see Table 8). As only onemajor error was made, it is expected that the distanceacross the color circle would be near the subject’s just-noticeable-difference (jnd) in color. That is, if the subject’sjnd were much larger than the diameter of the color cir-cle, it would be expected that several major crossingswould be made, for example, from caps 1 to 15 to 2 to 14to 3 etc, resulting in an extremely large ccI. Therefore,along this axis (from cap 1 to 15) the subject’s jnd may beexpected to be approximately the diameter of the colorcircle for the dd-15 in cIE-LAB color space. This individ-ual would not be expected to make a crossing error on theFarnsworth d-15 as its color circle is 2.07 times that of thedd-15. An individual with a 1.30 ccI on the dd-15 wouldnot, therefore, be expected to make crossing errors on theFarnsworth d-15 test. color vision defectives which passthe Farnsworth d-15 are considered mild and would notbe expected to have difficulty with color identifications inan industrial setting.
For the ccI values for the 22 known color visiondefectives listed in Table 3, none of the individuals with accI less than 1.30 failed the Farnsworth d-15. All of theseindividuals were anomalous trichromats and would beconsidered very mild defectives. Additionally, all theseindividuals demonstrated good color discrimination byhaving anomaloscope matching ranges of 10 units or less.
As previously noted, Steward and cole have docu-mented by survey the difficulties encountered by 102color vision defectives.23 For the anomalous trichromatresults (n = 65) mentioned in the study, only 2 items werementioned where over 30% of the participants reportedto have difficulties. These items were 1) selecting colorsof clothes, cars, carpets, etc. and 2) confusing traffic signaltraffic lights with street lights. The color discriminationsituations mentioned by mild anomalous trichromats ofwhich difficulties are found are those where the individu-als cannot see the mild amount of color in a desaturatedstimulus. For example, a green traffic signal may appearwhite, or the green in a grey-green car may not be seen.The significance of the confusion with the green trafficsignal may not be great in most circumstances as posi-tional cues are present to aid in traffic signal color identi-fication.
In summary, the level of color discrimination demon-strated by the styrene exposed individuals showing sta-tistically significant color defects are mild compared tocongenital color vision defectives. The performance ofthese individuals in recognizing color or in making color
133
table 8
Sample ccI score for specific cap replacement sequencesLanthony desaturated d-15.
dd-15 cap replacement order ccI
ref-1-3-2-4-5-6-7-8-9-10-11-12-13-14-15 1.12
ref-1-4-3-2-5-6-7-8-9-10-11-12-13-14-15 1.21
ref-1-4-3-2-5-6-7-8-9-10-11-13-12-14-15 1.30
ref-1-15-2-3-4-5-6-7-8-9-10-11-12-13-14 1.30
ref-1-3-2-4-5-7-6-8-9-10-11-12-13-15-14 1.36
ref-1-15-14-2-3-13-12-4-5-11-10-6-7-9-8 2.35
The SIrc review November 2006

the effeCt of StyRene expoSuRe on ColoR vISIon: a RevIew
decisions in everyday activities would not be expected tobe subnormal in a functional sense.
Recovery from Color Vision Deficiency
There are several types of toxicity that may be associatedwith styrene toxicity as it related to color vision deficits.Acute toxicity generally occurs immediately following anexposure to a toxin (i.e., within hours or days). An acuteexposure is one that is dosed within a relatively short peri-od of time (i.e., one or several doses within a 24 hours peri-od). Subchronic toxic effects result from repeated expo-sures to a toxin over a period of one to several months, andthis is the most common exposure route for environmentaltoxins. Finally, chronic toxicities result from repeated expo-sures to a toxin over a period of several months-to-yearsresulting in cumulative damage to a tissue or organ struc-ture. Although damage from chronic exposures may besub-clinical for an initial period of time, the damage maybecome so severe as toxicity progresses that the tissue ororgan no longer functions normally. It is likely that styreneexposures are somewhat chronic in this regard, although itis not known if the toxicity to the ophthalmic system (colorvision alterations in this case) is permanent or temporary.In other words, the permanency of color vision impair-ment after styrene exposure is still in question.
Gobba and cavalleri (1993) were the first to evaluatethe issue of color vision recovery following styrene expo-sure in a group of workers.55 In their study, a group of 39styrene-exposed workers were examined with the dd-15,showing a mean ccI of 1.23 ± 0.19. one month later withno styrene exposure (they were on summer holiday), theworkers were examined again on the first of returning towork, and their mean ccI was 1.20 ± 0.21. The authorsreport that these values didnot differ.
In another study, Merglerand coworker (1996) alsoevaluated the impact ofstyrene exposure reductionon color vision deficits.61
Baseline measures of styreneand color vision were estab-lished, and local ventilationsystems were established inorder to reduce styreneexposures. reassessment ofthese outcomes was mea-sured again on the samebaseline workers two yearslater. The results from thisstudy can be found in Table 9.
The authors then state that there was a significantreduction in ambient styrene (p < 0.05) and end-shift MA(p < 0.001) after two years of follow-up for workers inplant 3, but not plants 1 or 2 (data are not presented).They then report mean differences in ccI values(Baseline – 2 year follow-up) for plants 1 and 2, and plant3 separately. The mean difference for plants 1 & 2 was–0.12 ± 1.17 (p-value: not significantly different fromzero) and for plant 3 was 0.20 ± 0.78 (p-value: not signifi-cantly different from zero). Finally, the authors stratifiedmean differences in ccI values using the criteria basedon change in MA between baseline and the 2 year follow-up as follows: increase by 0.1 mmol/mmol creatinine,remained within ± 0.1 mmol/mmol creatinine, anddecreased by 0.1 mmol/mmol creatinine. Spearman’scorrelation coefficient was used to examine the relationbetween the respective group and the mean differences.No data are presented other than schematically, but theauthors report a significant correlation (p < 0.001). Thus,the authors conclude that “the strongest relation [associ-ated with styrene reduction] is with color vision.” This issomewhat of a stretch, and the author certainly had tostatistically hunt to find relation between styrene reduc-tion and color vision improvement (i.e., there were nostatistical differences in the mean differences betweenvisits for the ccI). correlation coefficients are particular-ly sensitive to sample size; thus, reporting only a p-valueis inappropriate, as it does not allow the reader to exam-ine the actual magnitude of the correlation.
A study by Gobba and cavalleri (2000) more recentlyaddressed this issue.56 After an initial assessment,styrene-exposed workers were re-examined 12 monthslater. results from this study are found in Table 10.
134
table 9
overall results from Mergler and coworkers (1996).61
outcome Baseline Time 2* p-value
Ambient styrene 75 mg/m3 76 mg/m3 Not Provided
(all 3 plants)
End-Shift MA 0.11 mmol/mmol 0.13 mmol/mmol Not Provided
(all 3 plants) creatinine creatinine
ccI (n = 57) 1.18 ± 0.20 1.19 ± 0.35 ns
*Time 2 is a follow-up assessment performed two years after baseline following
installation of ventilation systems.
The SIrc review November 2006
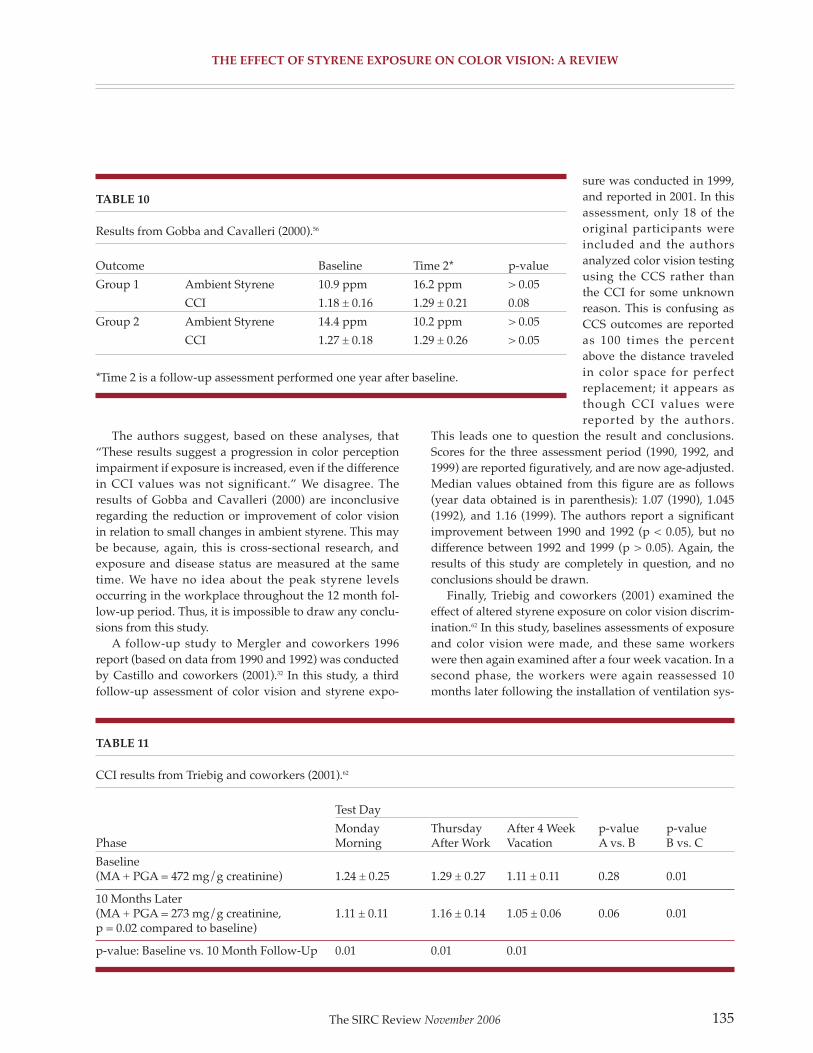
the effeCt of StyRene expoSuRe on ColoR vISIon: a RevIew
The authors suggest, based on these analyses, that“These results suggest a progression in color perceptionimpairment if exposure is increased, even if the differencein ccI values was not significant.” We disagree. Theresults of Gobba and cavalleri (2000) are inconclusiveregarding the reduction or improvement of color visionin relation to small changes in ambient styrene. This maybe because, again, this is cross-sectional research, andexposure and disease status are measured at the sametime. We have no idea about the peak styrene levelsoccurring in the workplace throughout the 12 month fol-low-up period. Thus, it is impossible to draw any conclu-sions from this study.
A follow-up study to Mergler and coworkers 1996report (based on data from 1990 and 1992) was conductedby castillo and coworkers (2001).32 In this study, a thirdfollow-up assessment of color vision and styrene expo-
sure was conducted in 1999,and reported in 2001. In thisassessment, only 18 of theoriginal participants wereincluded and the authorsanalyzed color vision testingusing the ccS rather thanthe ccI for some unknownreason. This is confusing asccS outcomes are reportedas 100 times the percentabove the distance traveledin color space for perfectreplacement; it appears asthough ccI values werereported by the authors.
This leads one to question the result and conclusions.Scores for the three assessment period (1990, 1992, and1999) are reported figuratively, and are now age-adjusted.Median values obtained from this figure are as follows(year data obtained is in parenthesis): 1.07 (1990), 1.045(1992), and 1.16 (1999). The authors report a significantimprovement between 1990 and 1992 (p < 0.05), but nodifference between 1992 and 1999 (p > 0.05). Again, theresults of this study are completely in question, and noconclusions should be drawn.
Finally, Triebig and coworkers (2001) examined theeffect of altered styrene exposure on color vision discrim-ination.62 In this study, baselines assessments of exposureand color vision were made, and these same workerswere then again examined after a four week vacation. In asecond phase, the workers were again reassessed 10months later following the installation of ventilation sys-
135
table 10
results from Gobba and cavalleri (2000).56
outcome Baseline Time 2* p-value
Group 1 Ambient Styrene 10.9 ppm 16.2 ppm > 0.05
ccI 1.18 ± 0.16 1.29 ± 0.21 0.08
Group 2 Ambient Styrene 14.4 ppm 10.2 ppm > 0.05
ccI 1.27 ± 0.18 1.29 ± 0.26 > 0.05
*Time 2 is a follow-up assessment performed one year after baseline.
table 11
ccI results from Triebig and coworkers (2001).62
Test day
Monday Thursday After 4 Week p-value p-valuePhase Morning After Work Vacation A vs. B B vs. c
Baseline(MA + PGA = 472 mg/g creatinine) 1.24 ± 0.25 1.29 ± 0.27 1.11 ± 0.11 0.28 0.01
10 Months Later(MA + PGA = 273 mg/g creatinine, 1.11 ± 0.11 1.16 ± 0.14 1.05 ± 0.06 0.06 0.01p = 0.02 compared to baseline)
p-value: Baseline vs. 10 Month Follow-Up 0.01 0.01 0.01
The SIrc review November 2006
the effeCt of StyRene expoSuRe on ColoR vISIon: a RevIew
tems. A control group was initially included, but notretested after in the follow-up periods. The results fromthis study can be seen in Table 11.
This is the first study to provide substantial evidencethat color vision alterations are associated with reduc-tions in styrene. This indicates that in some regard, thesecolor vision alterations may not be complete. The authorsindicate that the styrene-exposed workers included inthis study had at least 6 months of experience, althoughthey do not report an estimated cumulative work historyassociated with styrene exposure in these workers. Theauthors suggest that the finding here may be differentfrom other studies because stricter alcohol consumptionexclusion criteria were employed. regardless, thereseems to be no methodological or reason otherwise todoubt there finding.
The evidence regarding the recovery of color visionfollowing reductions in exposure is too inconclusive atthis point to make any firm recommendations regardingthe issue. As discussed, several studies have found nega-tive or weak results, although this may have been due tomethodological or other issues. The study by Triebig andcoworkers (2001) does provide evidence for an effect, andother studies need to replicate this finding prior to con-clusions being drawn.
Physiological/Anatomical Basis for Color Vision Deficiency
In his review of the effects of styrene exposure on colordiscrimination, Sheedy makes a compelling case that thesite of initial damage for styrene’s detrimental effectsupon color discrimination to be within the retina.33 Hebases his argument on styrene’s predominantly blue-yel-low nature of the color discrimination loss and that com-ponents of the electroretinogram appear to be affected.The studies which have been performed since his reviewhave strengthened his argument.
Köllner observed early in the 20th century that tritan(blue-yellow) type defects were common with conditionsthat affect the outer portions of the retina, while red-green type defects were common with those affecting thevisual pathway (inner retina and optic nerve). While sev-eral exceptions to this rule have been documented, hisobservations have generally withstood the test of time.93
The reason for this is the relative vulnerabilities of theblue visual mechanism in the retina and the red-greenchromatic processing of the parvocellular system withinthe optic pathway.94
In this regard, studies investigating the initial effectson color vision of styrene exposure on larger number ofsubjects have generally described blue-yellow typedefects. Sheedy reported that campagna and coworkers,
Eguchi and coworkers, Gobba and coworkers (1991), andGobba and cavalleri all found predominantly blue-yel-low type defects.33, 53, 55, 57, 58 He also reported that Merglerand coworkers reported a high incidence of mixeddyschromatopsia (both red-green and blue-yellow) butpredominantly for the highly exposed workers.87 This issomewhat expected as typically acquired color visionlosses begin with confusion along a given axis but as thecondition progresses the orientation of losses become lessdefined. More recently Triebig and coworkers reportedcolor discrimination losses with styrene without a pre-dominant red-green or blue-yellow orientation.62 Itshould be noted, however, that these reports of orienta-tion of color confusion are subjective in nature as the ccIevaluation method of color discrimination provides noobjective measure of predominant color system loss.
The electroretinogram (ErG) has been used to evalua-tion electrical activity in the retina of individuals exposedto styrene. The ErG is a non-invasive method to measurethe relative strength of the visual signal as it progressesthrough the retina. Several studies using the elec-troretinogram have shown abnormal retinal activity afterstyrene exposure. Skoog and Nilsson (1981) studied theacute effects of toluene and styrene on the ErG on anaes-thetized monkeys.68 Both agents affect the c-wave of theErG and the standing potential of the eye. The c-wave isbelieved to be generated by potential changes within thepigment epithelium of the eye. The pigment epithelium isintimately involved in metabolic support of the retinalphotoreceptors. As this study investigated the acuteeffects of styrene and the route of administration wasintravenous, the generalizability of the results to chronicexposure to humans in industry are limited.
Mirzoev and Sultanov (1989) studied the ErGs ofworkers exposed to high levels of styrene.95 Their resultsshowed reduced a-wave and b-wave activity and longlatency. The a-wave is believed to indicate photoreceptoractivity. This is a significant finding to show styrene istoxic to the outer retina. As Sheedy notes, however, thestudy failed to control for alcohol and/or tobacco effects.33
The most compelling evidence to date to implicatechanges in the retina to cause styrene induced colorvision loss is a recent study on changes in amacrine reti-nal cells in rats after styrene exposure.96 Ten rats wereexposed to an atmosphere of 300 ppm styrene for 6hours/day, 5 days/week for 12 weeks. Ten control ratswere exposed to fresh air. Exposed rats showed amacrinecell loss and a related depletion of dopamine. dopaminein inherently involved in the lateral processing of infor-mation across the retina (through horizontal cells) andhas been shown to play a role in color perception.97, 98
The SIrc review November 2006136

the effeCt of StyRene expoSuRe on ColoR vISIon: a RevIew
In summary, evidence continues to mount to implicatethe retina as the site of damage causing the color discrim-ination losses with chronic styrene exposure. Whileamacrine cell loss has been implicated by the Vettori andcoworkers on rats, detrimental effects upon the pigmentepithelium, photoreceptors, and other retinal structurescan not be ruled out.96
SuMMaRy
The impact of styrene on color vision has been assessedby numerous investigators over the past 10-12 years. Thestudies since the report by Sheedy have supported theevidence that exposure to styrene can cause detrimentaleffects upon fine color discrimination. overall, this resultis best supported by the work of Gobba and coworkers(1993), campagna and coworkers (1995), Eguchi andcoworkers (1995), Kishi and coworkers (2001), andTriebig and coworkers (2001).55, 57, 58, 60, 62 Although there isno single, high quality study which confirms a causativeassociation between styrene and acquired color visiondeficits, taken together, these studies provide moderateevidence of the association. However, no study evaluatedwas perfect, and flaws were inherent in all of them.Although studies of this type of occupational exposureand biological effect are not easily conducted, somemethodological, statistical, or other issue precluded theremaining studies from being included among those sup-porting the relation in our opinion.
The new data provide little evidence supporting athreshold effect at exposure levels below 50 ppm. Webelieve that higher doses (i.e., greater than 50 ppm) ofstyrene are associated with alterations in color visioncompared with normal controls. In general, several stud-ies showed a significant difference between the highexposure group relative to the control group or a signifi-cant linear relation between ambient styrene or MA andthe ccI (Table 14). As suggested by others, we believethat the small amount of evidence accumulated to datesuggests that styrene impacts color vision by altering reti-nal function—specifically, the amacrine cells. More recentstudies have supported previous claims that the detri-mental effects on color vision are at least partially causedby changes within the retina and that the detrimentalcolor vision effects of styrene may be temporary.
However, the exact dose and mechanism of colorvision loss associated with styrene is still in question, asis the proximate toxicant (styrene or a metabolite), andthe dose metric (peak vs. metric). other questions alsoremain. It remains uncertain as to the degree of restora-bility of the slight loss in color vision, and if there are
more susceptible subgroups (e.g., elderly, smokers). Also,it is not known what the impact of an acquired colorvision deficit of this magnitude would have on an indi-vidual functional status. Future research is needed toaddress these and other questions raised in this report.
RefeRenCeS
1. Eguchi T, Kishi r, Harabuchi I et al. [color visionamong workers exposed to styrene]. Sangyo Igaku
1994;36:104-5.
2. Alieva ZA, Sultanov M, Mirzoev TA. [Impairment ofcolor perception acuity caused by styrene and tetra-chloroethylene vapors]. Gig Tr Prof Zabol 1985:11-3.
3. Klein o, Kloucek F. [Evaluation of color perception dis-turbances in apprentices in a chemical plant producingbutadiene-styrol-rubber and polysterol]. Z Gesamte Hyg
1971;17:492-6.
4. Gobba F. color vision: a sensitive indicator of exposureto neurotoxins. Neurotoxicology 2000;21:857-62.
5. rebert cS, Hall TA. The neuroepidemiology of styrene:a critical review of representative literature. Crit Rev
Toxicol 1994;24 Suppl:S57-106.
6. Iregren A, Andersson M, Nylen P. color vision andoccupational chemical exposures: I. An overview of testsand effects. Neurotoxicology 2002;23:719-33.
7. Gobba F, cavalleri F, Bontadi d, Torri P, dainese r.Peripheral neuropathy in styrene-exposed workers. Scand
J Work Environ Health 1995;21:517-20.
8. Wyszecki G, Stiles WS. color science : concepts andmethods, quantitative data and formulae. 2nd ed. Newyork: Wiley; 1982.
9. Hurvich LM. color vision. Sunderland, Mass.: SinauerAssociates; 1981.
10. Birch J. diagnosis of defective colour vision. 2nd ed.oxford ; Boston: Butterworth-Heinemann; 2001.
11. Nathans J, Thomas d, Hogness dS. Molecular genet-ics of human color vision: the genes encoding blue, green,and red pigments. Science 1986;232:193-202.
The SIrc review November 2006 137

the effeCt of StyRene expoSuRe on ColoR vISIon: a RevIew
12. Mollon Jd. “Tho’ she kneel’d in that place where theygrew...” The uses and origins of primate colour vision. JExp Biol 1989;146:21-38.
13. Weitz cJ, Miyake y, Shinzato K et al. Human tri-tanopia associated with two amino acid substitutions inthe blue-sensitive opsin. Am J Hum Genet 1992;50:498-507.
14. Kalmus H. The familial distribution of congenital tri-tanopia with some remards on some similar conditions.Ann Hum Genet 1955;20:39-56.
15. Lyon MF. Gene action in the x-chromosome of themouse (Mus musculus L.). Nature 1961;190:372-373.
16. Krill AE. x-chromosomal-linked diseases affecting theeye: status of the heterozygote female. Trans Am
Ophthalmol Soc 1969;67:535-608.
17. Jorgensen AL, Philip J, raskind WH et al. differentpatterns of x inactivation in MZ twins discordant for red-green color-vision deficiency. Am J Hum Genet
1992;51:291-8.
18. Krill AE, Schneiderman A. A hue discriminationdefect in so-called normal carriers of color vision defects.Invest Ophthalmol Vis Sci 1964;3:445-450.
19. Lang A, Good GW. color discrimination in heterozy-gous deutan carriers. Optom Vis Sci 2001;78:584-8.
20. Wieland M. Studies of color deficiencies in female car-riers. Graefe’s Arch Ophthalmol 1933:441-462.
21. crone rE. Spectral sensitivity in color-defective sub-jects and heterozygous carriers. Am J Ophthalmol
1959;41:231-238.
22. Verriest G. chromaticity discrimination in protan anddeutan heterozygotes. Die Farbe 1972;21:7-16.
23. Steward JM, cole BL. What do color vision defectivessay about everyday tasks? Optom Vis Sci 1989;66:288-95.
24. cole BL, Steward JM. Some (But only A Few) colourVision defectives Have No difficulty With colour.London: Taylor & Francis; 1997.
25. roberts dK, Terry JE. ocular disease : diagnosis andtreatment. 2nd ed. Boston: Butterworth-Heinemann;1996.
26. Atchison dA, Bowman KJ, Vingrys AJ. Quantitativescoring methods for d15 panel tests in the diagnosis ofcongenital color vision deficiencies. Optom Vis Sci
1991;68:41-8.
27. Bowman KJ. A method for quantitative scoring of theFarnsworth Panel d-15. Acta Ophthalmol (Copenh)
1982;60:907-16.
28. International research Group on colour Visiondeficiencies. Symposium (7th : 1983 : centre MedicalUniversitaire), Verriest G. colour vision deficiencies VII :proceedings of the Seventh Symposium of theInternational research Group on colour Visiondeficiencies held at centre Médical Universitaire,Geneva, Switzerland, 23-35 June, 1983. Hague ; Boston:W. Junk Publishers; 1984.
29. Muttray A, Unger c, Jung d, Konietzko J. Erworbenefarbensehstorungen in der arbeitswelt. Arbeitsmed
Sozialmed Umweltmed 1998;33:144-152.
30. chia SE, Jeyaratnam J, ong cN, Ng TP, Lee HS.Impairment of color vision among workers exposed tolow concentrations of styrene. Am J Ind Med 1994;26:481-8.
31. Adams AJ, Haegerstrom-Portnoy G. color Vision.Boston: Butterworth; 1987.
32. castillo L, Baldwin M, Sassine MP, Mergler d.cumulative exposure to styrene and visual functions. Am
J Ind Med 2001;39:351-60.
33. Sheedy JE. Styrene exposure and color vision. The
SIRC Review 1997:7-30.
34. Vingrys AJ, King-Smith PE. A quantitative scoringtechnique for panel tests of color vision. Invest Ophthalmol
Vis Sci 1988;29:50-63.
35. yuasa J, Kishi r, Eguchi T et al. Study of urinary man-delic acid concentration and peripheral nerve conductionamong styrene workers. Am J Ind Med 1996;30:41-7.
36. Savolainen H, Vainio H. organ distribution and ner-vous system binding of styrene and styrene oxide.Toxicology 1977;8:135-41.
The SIrc review November 2006138

the effeCt of StyRene expoSuRe on ColoR vISIon: a RevIew
37. Savolainen H, Pfaffli P. Effects of chronic styreneinhalation on rat brain protein metabolism. Acta
Neuropathol (Berl) 1977;40:237-41.
38. Newhook r, caldwell I. Exposure to styrene in thegeneral canadian population. IARC Sci Publ 1993:27-33.
39. Tang W, Hemm I, Eisenbrand G. Estimation of humanexposure to styrene and ethylbenzene. Toxicology
2000;144:39-50.
40. World Health organization. Guidelines for drinking-water quality. 2nd ed. Geneva: World Healthorganization; 1998.
41. cohen JT, carlson G, charnley G et al. A comprehen-sive evaluation of the potential health risks associatedwith occupational and environmental exposure tostyrene. J Toxicol Environ Health B Crit Rev 2002;5:1-265.
42. McKay rT. Ambient air styrene levels in communitiesnear reinforced plastic processors. Environmental Pollution
1982;4:135-141.
43. Lemasters GK, carson A, Samuels SJ. occupationalstyrene exposure for twelve product categories in thereinforced-plastics industry. Am Ind Hyg Assoc J
1985;46:434-41.
44. World Health organization. regional office forEurope. Air quality guidelines for Europe. copenhagen:World Health organization regional office for Europe;1987.
45. Baggett MS, Morie GP, Simmons MW, Lewis JS.Quantitative determination of semivolatile compoundsin cigarette smoke. J Chromatogr 1974;97:79-82.
46. Wieczorek H, Piotrowski JK. Kinetic interpretation ofthe exposure test for styrene. Int Arch Occup Environ
Health 1988;61:107-13.
47. Wong o, Trent LS, Whorton Md. An updated cohortmortality study of workers exposed to styrene in the rein-forced plastics and composites industry. Occup Environ
Med 1994;51:386-96.
48. cruzan G, carlson GP, Johnson KA et al. Styrene res-piratory tract toxicity and mouse lung tumors are mediat-ed by cyP2F-generated metabolites. Regul Toxicol
Pharmacol 2002;35:308-19.
49. Some traditional herbal medicines, some mycotoxins,naphthalene and styrene. IARC Monogr Eval Carcinog
Risks Hum 2002;82:1-556.
50. Pouyatos B, campo P, Lataye r. Use of dPoAEs forassessing hearing loss caused by styrene in the rat. Hear
Res 2002;165:156-64.
51. Bergamaschi E, Smargiassi A, Mutti A et al. Peripheralmarkers of catecholaminergic dysfunction and symptomsof neurotoxicity among styrene-exposed workers. Int
Arch Occup Environ Health 1997;69:209-14.
52. conde-Salazar L, Gonzalez MA, Guimaraens d,romero L. occupational allergic contact dermatitis fromstyrene. Contact Dermatitis 1989;21:112.
53. Gobba F, Galassi c, Imbriani M, Ghittori S, candela S,cavalleri A. Acquired dyschromatopsia among styrene-exposed workers. J Occup Med 1991;33:761-5.
54. Fallas c, Fallas J, Maslard P, dally S. Subclinicalimpairment of colour vision among workers exposed tostyrene. Br J Ind Med 1992;49:679-82.
55. Gobba F, cavalleri A. Kinetics of urinary excretionand effects on colour vision after exposure to styrene.IARC Sci Publ 1993:79-88.
56. Gobba F, cavalleri A. Evolution of color vision lossinduced by occupational exposure to chemicals.Neurotoxicology 2000;21:777-81.
57. Eguchi T, Kishi r, Harabuchi I et al. Impaired colourdiscrimination among workers exposed to styrene: rele-vance of a urinary metabolite. Occup Environ Med
1995;52:534-8.
58. campagna d, Mergler d, Huel G et al. Visual dys-function among styrene-exposed workers. Scand J Work
Environ Health 1995;21:382-90.
59. campagna d, Gobba F, Mergler d et al. color visionloss among styrene-exposed workers neurotoxicologicalthreshold assessment. Neurotoxicology 1996;17:367-73.
60. Kishi r, Eguchi T, yuasa J et al. Effects of low-leveloccupational exposure to styrene on color vision: doserelation with a urinary metabolite. Environ Res
2001;85:25-30.
The SIrc review November 2006 139

the effeCt of StyRene expoSuRe on ColoR vISIon: a RevIew
61. Mergler d, Huel G, Belanger S et al. Surveillance ofearly neurotoxic dysfunction. Neurotoxicology
1996;17:803-12.
62. Triebig G, Stark T, Ihrig A, dietz Mc. Interventionstudy on acquired color vision deficiencies in styrene-exposed workers. J Occup Environ Med 2001;43:494-500.
63. Gong yy, Kishi r, Katakura y et al. relation betweencolour vision loss and occupational styrene exposurelevel. Occup Environ Med 2002;59:824-9.
64. Pratt-Johnson JA. retrobulbar neuritis followingexposure to vinyl benzene (styrene). Canadian Med Assoc
J. 1964;90:975-977.
65. Silverman SE, Hart WM, Jr., Gordon Mo, Kilo c. Thedyschromatopsia of optic neuritis is determined in partby the foveal/perifoveal distribution of visual field dam-age. Invest Ophthalmol Vis Sci 1990;31:1895-902.
66. Schneck ME, Haegerstrom-Portnoy G. color visiondefect type and spatial vision in the optic neuritis treat-ment trial. Invest Ophthalmol Vis Sci 1997;38:2278-89.
67. Kohn AN. ocular toxicity of styrene. Am J Ophthalmol
1978;85:569-70.
68. Skoog Ko, Nilsson SE. changes in the c-wave of theelectroretinogram and in the standing potential of the eyeafter small doses of toluene and styrene. Acta Ophthalmol
(Copenh) 1981;59:71-9.
69. Muttray A, Jung d, Konietzko J. Subclinical impair-ment of colour vision among workers exposed to styrene.Br J Ind Med 1993;50:766-7.
70. campagna d, Mergler d, Huel G et al. Visual dys-function among styrene exposed workers. Proceedings of
the Ninth International Symposium on Epidemiology in
Occupational Health,. cincinnati: International commisionon occupational Health, NIoSH, US department ofHealth and Human Services; 1994.
71. Schlesselman JJ, Stolley Pd. case-control studies :design, conduct, analysis. New york: oxford UniversityPress; 1982.
72. Moy cS. case-control designs for clinical research inophthalmology. Arch Ophthalmol 1998;116:661-4.
73. Miettinen oS. The “case-control” study: valid selec-tion of subjects. J Chronic Dis 1985;38:543-48.
74. Viaene MK. relation between colour vision loss andoccupational styrene exposure. Occup Environ Med
2003;60:222.
75. Horwitz rI, Feinstein Ar, Harvey Mr. case-controlresearch. Temporal precedence and other problems of theexposure-disease relationship. Arch Intern Med
1984;144:1257-9.
76. Sperling HG, Wright AA, Mills SL. color vision fol-lowing intense green light exposure: data and a model.Vision Res 1991;31:1797-812.
77. Lakowski r. Is the deterioration of colour discrimina-tion with age due to lens or retinal changes? Farbe
1962;11:69-86.
78. Weale rA. Notes on the photmetricsignificane of thehuman crystalline lens. Vision Res 1961;1:183-191.
79. Birch J, dain SJ. An averaging method for the inter-pretation of the Farnsworth-Munsell 100-Hue Test—II.colour vision defects acquired in diabetic retinopathy.Ophthalmic Physiol Opt 1987;7:281-91.
80. Pokorny J. congenital and acquired color visiondefects. New york: Grune & Stratton; 1979.
81. Hankinson SE, Willett Wc, colditz GA et al. Aprospective study of cigarette smoking and risk ofcataract surgery in women. Jama 1992;268:994-8.
82. christen WG, Manson JE, Seddon JM et al. A prospec-tive study of cigarette smoking and risk of cataract inmen. Jama 1992;268:989-93.
83. Klein r, Klein BE, Linton KL, deMets dL. The Beaverdam Eye Study: the relation of age-related maculopathyto smoking. Am J Epidemiol 1993;137:190-200.
84. Klein r, Klein BE, Moss SE. relation of smoking to theincidence of age-related maculopathy. The Beaver damEye Study. Am J Epidemiol 1998;147:103-10.
85. Hammond Br, Jr., Wooten Br, Snodderly dM.cigarette smoking and retinal carotenoids: implicationsfor age-related macular degeneration. Vision Res
1996;36:3003-9.
The SIrc review November 2006140

the effeCt of StyRene expoSuRe on ColoR vISIon: a RevIew
86. Erb c, Nicaeus T, Adler M, Isensee J, Zrenner E, ThielHJ. colour vision disturbances in chronic smokers.Graefes Arch Clin Exp Ophthalmol 1999;237:377-80.
87. Mergler d, Blain L, Lemaire J, Lalande F. colourvision impairment and alcohol consumption. Neurotoxicol
Teratol 1988;10:255-60.
88. Valic E, Waldhor T, Konnaris c, Michitsch A, Wolf c.Acquired dyschromatopsia in combined exposure to sol-vents and alcohol. Int Arch Occup Environ Health
1997;70:403-6.
89. cavalleri A, Belotti L, Gobba F, Luzzana G, rosa P,Seghizzi P. colour vision loss in workers exposed to ele-mental mercury vapour. Toxicol Lett 1995;77:351-6.
90. cavalleri A, Gobba F. reversible color vision loss inoccupational exposure to metallic mercury. Environ Res
1998;77:173-7.
91. Zavalic M, Mandic Z, Turk r, Bogadi-Sare A, Plavecd. Quantitative assessment of color vision impairment inworkers exposed to toluene. Am J Ind Med 1998;33:297-304.
92. cavalleri A, Gobba F, Nicali E, Fiocchi V. dose-relatedcolor vision impairment in toluene-exposed workers.Arch Environ Health 2000;55:399-404.
93. Kaiser PK, Boynton rM. Human color vision. 2nd ed.Washington, dc: optical Society of America; 1996.
94. cronly-dillon J. Vision and visual dysfunction. Bocaraton: crc Press; 1991.
95. Mirzoev TA, Sultanov M. [The effect of styrene andtetrachloroethylene on electrical activity of the retina].Oftalmol Zh 1989:262-5.
96. Vettori MV, corradi d, coccini T et al. Styrene-induced changes in amacrine retinal cells: an experimen-tal study in the rat. Neurotoxicology 2000;21:607-14.
97. Ahnelt P, Kolb H. Horizontal cells and cone photore-ceptors in human retina: a Golgi-electron microscopicstudy of spectral connectivity. J Comp Neurol
1994;343:406-27.
98. Huag BA. Predominant affection of the blue conepathway in Parkinson’s disease. Brain 1995;118:771-778.
A P P E N d I x I
Color Confusion Index
In numerous studies which investigate the toxic effects ofchemicals upon color vision, the Lanthony desaturatedd-15 Panel Test is used to assess fine color discrimination.Small caps of different colors are replaced into a trayaccording to color. The colors vary in hue from bluearound the color circle to purple. The order with whichthe caps are replaced gives an indication of which colorsmay be confused.
Bowman (1982) recommended a scoring method forarrangement tests by calculating the total distance incolor space represented by moving from cap to cap foreach specific replacement order. color confusion index(ccI) is than calculated by dividing this total by the dis-tance representing perfect replacement. In his paperBowman provides color space distance values whengoing from any given cap to any another. These values,however, are based upon the locations within color spacefor the Farnsworth d-15 test. Values for the Lanthonydesaturat ed d-15 test were not listed.
The Lanthony desaturat ed d-15 is similar to theFarnsworth d-15, however, with the Lanthony test, thecaps are lighter and possess less color (i.e., more white).Figure 1 shows the Farnsworth d-15 and Lanthonydesaturated d-15 positions in cIE-LAB color space.Although the Lanthony test is a desaturated version ofthe Farnsworth test, the color space locations are notexactly equivalent even in relative terms. Therefore,errors in analysis can occur if the distances used in calcu-lating the color confusion index are not from the appro-priate test.
In order to determine the degree of error which couldbe introduced, color confusion indices were calculatedfor sample Lanthony desaturated d-15 results using theappropriate locations and using the Farnsworth d-15equivalents. results for 25 subjects with varying degreesof color discrimination were analyzed. The ccIs usingthe two methods are presented in Table 1. In general,using the Farnsworth color space positions for each capinstead of the Lanthony color space positions overesti-mates ccI when compared to the actual value and thedegree of overestimation increases with ccI. However,for results showing few errors (i.e., ccI ≈1), theFarnsworth analysis can overestimate or underestimatethe actual value. Figure 2 shows the Farnsworth calculat-ed ccI graphed versus the actual values. Figure 3 showsthe ratio of the two values graphed versus the actualvalue. For low ccIs, there is considerable variability ofestimation shown. overestimated and underestimated
The SIrc review November 2006 141

the effeCt of StyRene expoSuRe on ColoR vISIon: a RevIew
table 12
ccI results from studies assessing impact of styrene on color vision.
Study characteristics Matched or Adjusted ccI ValuesAverage or Median Average or
control Ambient Median MAStudy Group Exposure Level case controls p-value
Gobba, 1991 y 16.2 ppm 0.34 g/L 1.26 ± 0.22 1.15 ± 0.14 < 0.01
Gobba, 1993 y ≈ 34 ppmd ≈ 0.48 g/Ld
1.21 ± 0.20 1.053 ± 0.07 < 0.001
chia, 1994 y Not 84.0 mg/g 1.40 1.13 0.0006Measured creatinine
campagna, 1995 N 48.3 ppm 0.36 1.14 ± 0.16 Not conductedmmol/mmol creatinine
Eguchi, 1995 y 18.5 ppm 0.22 g/l 1.22 ± 0.24 1.12 ± 0.13 < 0.01
Mergler, 1996 y 18 ppmb 0.12 1.18 ± 0.20 Not conductedmmol/mmol creatinine
campagna, 1996 N ≈ 16 ppme Not 1.16e Not conductedMeasured
Gobba, 2000 y 13 ppm 1.24 ± 0.21 1.14 ± 0.14 < 0.01(2 case groups, N T
1: 11ppmf T
1: 1.18
time periods) T2: 16 ppme T
2: 1.29 0.08
n = 10 NotNA
T1: 14 ppmf Measured T
1: 1.27 > 0.05
T2: 10 ppmf T
2: 1.29
n = 20
Kishi, 2001 y Not 0.21 g/L 1.28 ± 0.28 1.18 ± 0.18 < 0.01Measured
Triebig, 2001 y Not MA + PGA: Mon: 1.24 Mon: 1.10 Mon: 0.11(Baseline) Measured 0.472 g/g Thur: 1.29 Thur: 1.10 Thurs: 0.05
creatinine
Triebig, 2001 y Not MA + PGA: Mon: 1.11 Mon: 1.10 Mon: 0.61(10 months Measured 0.273 g/g Thurs: 1.16 Thurs: 1.08 Thurs: 0.18later after creatinineintervention )
Gong, 2002 y Not MA: 0.26 g/g 1.04b 1.00b < 0.01 Measured creatinine
PGA: 0.11 g/gcreatinine
aMean value reported., bMedian value reported., cNot reported., drepresents the average of measures taken from Mondayand Thursday; preshift MA measures., erepresents the average of the two study sample (Italian and canadian)., f T
1and
T2represent baseline and 12 month outcome assessments.
The SIrc review November 2006142

the effeCt of StyRene expoSuRe on ColoR vISIon: a RevIew
table 13
results from studies using alternative methods of assessing color vision tests or scoring algorithms.
Study characteristics Matched or Adjusted color Vision Scores
Average or Median Average
control Ambient or MedianStudy Group Exposure MA Level cases controls p-value
Fallas, y 24.3 ppm MA: 0.23 g/g 259.9 ± 136.9 262.7 ± NS1992 creatinine 114
PGA: .057 Farnsworth 100 Hue Error Scoreg/g creatinine
castillo, N overall 0.08 mmol/ 1.17 Not conducted2001 Not mmol (color confusion Score?)
reported creatinine
table 14
dose-stratified ccI comparisons and regression analyses evaluating the dose-response effect of styrene on color vision.
Low dose /High dose Intervention
Study Group Group control Group p-value criteria
Gobba, 1991 1.27b 1.09b Not compared < 0.05 215 mg/m3
Gobba, 1993 1.29 1.11 Not compared < 0.05 213 mg/m3
chia, 1994 “No Significant Linear correlations were present between TcdS and MA or PGA”
campagna, 1995 “Significant positive relations were found between the internal and external styrene exposuremeasurements and color vision loss adjusted for age, alcohol consumption, and seniority…”
Eguchi, 1995 1.33 ± 0.29 1.17 ± 1.19 1.12 ± 0.13 H vs. c: < 0.01 MA < 0.42 g/lL vs. c: = 0.12H vs. L: < 0.05
Mergler, 1996 1.18 ± 0.20 1.19 ± 0.35 Not compared > 0.05 Intervention group includedoriginal workers after installation of ventilation.
campagna, 1996 “color confusion Index (adjusted for alcohol consumption and age) exhibited positive relationships with environmental styrene exposure (Spearman r = 0.25, p < 0.01)”
Gobba, 2000 “…the exposure was unmodified or slightly decreased in 20 subjects, and d-15 outcomes remained unchanged, while styrene levels had increased and color vision loss progressed in the other 10.”
Kishi, 2001 H: 1.27 ± 0.27 L: 1.21 ± 0.26 L: < 0.10 g/Lc: 1.13 ± 0.14 c: 1.17 ± 0.19 M: 0.1-0.2 g/Lp < 0.01 p > 0.05 H: > 0.2 g/L
Triebig, 2001 1.24 1.11* NA 0.01 *4 week vacation—original cases
Gong, 2002 1.14 ± 0.24a 1.09 ± 0.13a 1.02 ± 0.04a All < 0.01 MA + PGA < 0.24 g/g creatinine
aMean value reported., bMedian value reported.
The SIrc review November 2006 143

the effeCt of StyRene expoSuRe on ColoR vISIon: a RevIew
values are shown depending upon the specific errors ofreplacement which were made. For this sample, once theactual ccI reached 1.25, the ccI using the Farnsworthvalues always overestimated the actual value. For the fewsubjects in this study with ccI below 1.25, the mean dif-ference in the two calculations was only 0.0089 +/- 0.039.For ccI values at 1.25 and above, the mean differencewas 0.12 +/- 0.090.
From this investigation it appears that the error intro-duced by using the Farnsworth test color space positionsinstead of those for the Lanthony test is small; however,the error appears to increase with ccI above ccI = 1.25.How these small errors could affect a study’s results aredifficult to determine without having the actual data toanalyze. However, it is logical to assume that if theexposed group had higher ccI’s, the incorrect calculationcould magnify (slightly) a small difference. Also, forccI’s just above 1 (and below 1.25), the incorrect calcula-tion could add variability and help “hide” a small butsignificant difference between control and exposedgroups.
The SIrc review November 2006144
table 1
Lanthony Based Analysis Farnsworth Based Analysis
“correct” “Incorrect”
1.04 1.05
1.04 1.05
1.10 1.07
1.12 1.10
1.14 1.18
1.15 1.19
1.16 1.15
1.21 1.29
1.22 1.18
1.25 1.32
1.37 1.43
1.48 1.58
1.74 1.76
1.89 1.95
2.30 2.37
2.35 2.51
2.38 2.58
2.41 2.45
2.48 2.57
2.50 2.56
2.79 2.91
2.81 2.87
3.02 3.30
3.07 3.27
3.21 3.54

the effeCt of StyRene expoSuRe on ColoR vISIon: a RevIew
The SIrc review November 2006 145
fIguRe 2
Farnsworth calculated vs. Lanthony calculated ccI.
1.0 1.5 2.0 2.5 3.0 3.5
Lanthony ccI (correct)
Far
nsw
ort
h c
ci
(In
corr
ect) 3
2
1
fIguRe 3
ratio of Farnsworth calculated vs. Lanthony calculatedccI graphed versus the correct (i.e., Lanthonycalculated) ccI.
1 2 3
correct ccI (Lanthony)
Far
nsw
ort
h/
Lan
tho
ny
cal
cula
ted
cc
I 1.10
1.05
1.00
fIguRe 1
Farnsworth d-15 and Lanthony desaturated d-15 Testsgraphed in cIE-LAB color Space.
30 -20 -10 0 10 20 30
A
-
B
30
20
10
0
-10
-20
-30
reference cap
LanthonyFarnsworth

The SIrc review November 2006146
Quality of Life and color Vision: TheSignificance of Acquired dyschromatopsias
Jason J. Nichols, OD MS MPH, Gregory W. Good, OD PhD1
as the color
discrimination losses
accompanying styrene
exposure are relatively
mild, we believe that a
study that assessed the
significance of
styrene-induced color
vision deficiency might
show little-to-no
impairments in quality
of life and functional
ability.
ExEcUTIVE SUMMAry
The effect of styrene exposure on color dis-crimination has been assessed by numer-ous investigators over the past 10-12 years.There is moderate consensus that highdoses of styrene (i.e., greater than 50 ppm)are associated with acquired color visiondeficits. These acquired deficits, however,are mild when compared to the color dis-crimination difficulties exhibited by con-genital color vision defectives. Quality ofLife instruments have been recently devel-oped to help determine not only the func-tional deficits that accompany disease butalso the individual’s general well-being. Assuch, numerous instruments are availablewhich are used to augment the more classicmeasures of individual health. Presently,however, there is no color vision specificquality of life instrument; and, of theinstruments that are presently used, fewquestions relate at all to color discrimina-tion ability. Studies have been done, how-ever, in which individuals with congenitalcolor vision defectives are questioned con-cerning the effects of their defects on lifeactivities. It is only those individuals with
relatively severe deficits, however, thatreport any substantial detrimental effectsin everyday life. In summary, there is lackof information and studies that haveassessed the significance of acquired colorvision deficiencies on quality of life andeveryday tasks. As the color discriminationlosses accompanying styrene exposure arerelatively mild, we believe that a study thatassessed the significance of styrene-induced color vision deficiency mightshow little-to-no impairments in quality oflife and functional ability. At present, thereis not an appropriate color vision-specificquality of life survey instrument that couldbe used for this type study.
INTrodUcTIoN
The effect of styrene exposure on color dis-crimination has been assessed by numer-ous investigators over the past 10-12 years.There is moderate consensus that highdoses of styrene (i.e., greater than 50 ppm)are associated with acquired color visiondeficits.1-5 recent studies have supportedprevious claims that the detrimental effectson color discrimination are at least partiallycaused by changes within the retina, andthat the detrimental color vision effects ofstyrene may be temporary.6 The thresholddose and mechanism of color vision lossassociated with styrene, however, is still inquestion, as is the degree of restorability ofthat loss. Although there are many specificquestions that remain to be answeredregarding the relation between styrene and
1The ohio State University college ofoptometry, columbus, oH
corresponding Author: Jason J. Nichols,od MS MPH, oSU college of optometry,320 West 10th Ave., Po Box 182342,columbus, oH [email protected]

QualIty of lIfe and ColoR vISIon: the SIgnIfICanCe of aCQuIRed dySChRoMatopSIaS
The SIrc review November 2006 147
color vision loss, the actual significance and handicap ofthe associated dyschromatopsia on an individual’s func-tion in society and quality of life has not been considered.The purpose of this report is to examine the scientific lit-erature in order to provide a better understanding of thepotential significance that this and other acquired and/orcongenital color vision deficiencies may have on an indi-vidual’s quality of life.
health, dISeaSe, and QualIty of lIfe
Traditional concepts of health-care generally reflect a“disease-based” model. This is somewhat a medicalapproach whereby pathology is reflected by signs and/orsymptoms of disease. often, ill-health is reflected by asymptom or a change in ‘usual’ function noted by thepatient. There are several traditional measures of healthwhich include population-based outcomes (e.g., mortali-ty and morbidity rates), individual indicators (e.g., labo-ratory/diagnostic tests, patient/clinician judgments,behavioral data), and service utilization rates. Today’sconcept of health and disease, however, has changedsuch that symptom response or survival rates are nolonger enough to describe the health status of an individ-ual or population. With the average life expectancy in theUnited States at 76.2 years, society is faced with chronichealth conditions than ever before.7 These include condi-tions such as cancer, heart disease, stroke, and diabetes;previously, these conditions were associated with signifi-cantly shorter periods of survival.
In 1948, the World Health organization (WHo)defined health to be “a state of complete physical, mentaland social well-being, and not merely the absence of dis-ease.”8 The formation of this organization and its allencompassing definition of health shaped the way viewson health and disease changed through next 50 years.Although the definition guides us in our views of‘health,’ in reality, it is somewhat complex and abstract.For instance, how do you measure such a construct?Typically, scientific measures occur through the applica-tion of a standard scale to some variable of interest. In thecase of ‘health,’ what do we use as the standard scale andwhat variables do we measure? This is not an easy task,and researchers and practitioners have come to rely onthe use of health indicators to make such assessments.These health indicators represent elements of the conceptof overall health, and there has been an evolution in theirdevelopment since 1948. As previously discussed, healthindicators originated as concepts such as survival anddisease, but moved to concepts such as freedom from dis-ease, ability to perform daily activities, and more recently,
positive themes such as happiness, social and emotionalwell-being, and cognitive function. Because many ofthese outcomes are subjective in nature, surveys and self-reported instruments are required in order to makeassessments. The main advantage to using these out-comes when defining health is that they provide insightinto matters of human concern such as pain and suffer-ing, depression, cognition, functional ability, emotion, andmotivation. Because they are subjective, however, there isconcern that they are too reflective of response bias.
The term ‘quality of life’ means many things to manypeople. research in this area spans numerous topicsincluding things like geography, urban planning, adver-tising, social science (e.g., sociology and psychology), andmedical science. It is somewhat of an ill-defined term, asthere is no universally accepted definition. Grant (1990)suggested that quality of life is ‘a personal statement ofthe positivity or negativity of attributes that characterizeone’s life.’9 For instance, general quality of life mayencompass dimensions such as adequacy of housing,income, and perceptions of one’s immediate environ-ment. Those involved in health-care delivery, research, orutilization are typically concerned with ‘health-relatedquality of life.’ In some sense, however, health itself is adimension of quality of life, rather than a overall concept.Again, there is no clear definition of health-related quali-ty of life. one somewhat simplistic way to think abouthealth-related quality of life is that it includes an assess-ment of two things: 1) What the person can do (e.g., func-tional status), and 2) How the patient feels (e.g., well-being). clancy and Eisenberg (1998) provided a moresophisticated and detailed framework outlining four con-cepts associated with health-related quality of life.10 Theseconcepts include health perceptions (an individual’s rat-ing of health or symptoms), functional measures (an indi-vidual’s ability to carry out daily activities), preference-based measures (choosing between two treatments fordisease), and patient satisfaction (with medical care oroutcome of incident). The theoretical structure uponwhich these elements are based is the previouslydescribed WHo definition of health. Finally, Ware (1987)suggests five inherent concepts including physical health,mental health, social functioning, role functioning, andgeneral well-being.11
There are two basic types of instruments that aredeveloped for use in quality of life assessments: generic anddisease-specific.12 Generic instruments generally provideassessments that are irrespective of health or disease status.An example of a generic, health-related quality of lifeinstrument is the Social Function-36 (SF-36) instrument thatwas developed by the rand corporation for use in the

QualIty of lIfe and ColoR vISIon: the SIgnIfICanCe of aCQuIRed dySChRoMatopSIaS
The SIrc review November 2006148
Medical outcomes Study.13 Although this instrument hasbeen used in ophthalmic research, vision researchersmainly use the SF-36 only to show concurrent validitywith a new ophthalmic instrument. The second type ofquality of life instrument that can be used for assessmentis the disease-specific instrument. This type of instrumenttargets ‘domains’ that are thought to be related to a spe-cific disease (or similar diseases). An example of this typeof instrument is the Glaucoma Symptom Scale.14
Quality of life (QoL) instruments should be reliable,valid, sensitive, and responsive if they are to be clinicallyuseful.15 Although these psychometric properties areinterrelated, they are examined in somewhat differentways. For instance, patients whose disease status has notchanged should, theoretically, make similar responses ondisease-specific QoL instruments each time they areassessed. In order to distinguish responsiveness (the abil-ity to detect change in status over time) and sensitivity(the ability to detect differences among different patientgroups) from measurement error, it is important to assessinstrument variability when administered to clinicallynormal patients on repeated occasions.16 Validity assess-ment consists of the accumulation of evidence over timeand across various studies to demonstrate that the scalesare rational and respond as predicted. once psychometricproperties are established, an instrument may be readyfor use in epidemiological studies or clinical trials.17, 18
QualIty of lIfe and ophthalMIC dISeaSe
Quality of life (QoL) assessments have become importantoutcomes in ophthalmic research over the last 10 years.These instruments complement and enhance our under-standing of a patient’s visual status, supplementing thetraditional clinical tests, such as visual acuity, used forpatient assessment. They also supplement our under-standing of how diseases such as cataracts, glaucoma,macular degeneration, and diabetic retinopathy lead tofunctional impairments and disability. Examples of oph-thalmic QoL instruments include the National EyeInstitute Visual Function Questionnaire (NEI-VFQ), theVisual Function-14 (VF-14), the Glaucoma SymptomScale, and the Graves’ ophthalmopathy Quality of LifeSurvey.14, 19-21 recent interest in refractive surgery has alsoled to the development of two refractive error-specificQoL surveys: the National Eye Institute refractive ErrorQuality of Life instrument (NEI-rQL-42) and therefractive Status and Vision Profile (rSVP) Survey.22, 23 ofthe aforementioned instruments, only the NEI-VFQmakes any sort of assessment of the significance of colorvision on quality of life.
ColoR vISIon defICIenCIeS
There are two generally accepted types of color visiondeficiency: congenital and acquired. congenital defectsare usually predictable, stable, symmetric between eyes,and, thus, they are easy to diagnose.24 Patients with a con-genital color vision defect usually have otherwise normalvisual function. congenital color defects are often subdi-vided based on the main axis of color confusion (i.e., red-green versus blue-yellow confusions) and on the mecha-nism of the defect (i.e., a missing cone type within theretina [dichromacy] or an abnormal photopigment sensi-tivity within a single cone type [anomalous trichroma-cy]). The genetic basis and clinical implications of con-genital color vision deficiencies are generally wellunderstood, and when proper test procedures are used,the diagnosis of congenital defects is unequivocal.
damage to the retina or optic nerve from things suchas trauma, inflammation, vascular disease, metabolic dis-orders, or chemical exposures may lead to an acquiredcolor vision deficit. Individuals with acquired dyschro-matopsias have less predictable losses that may progressin severity over time. often, the two eyes are differential-ly affected, and there may be an accompanying loss invisual function (e.g., contrast sensitivity). Additionally, inthe beginning stages of acquired color vision loss, it isoften very difficult to determine if color discriminationhas been affected at all.
There are many classification schemes for individualswith acquired color vision defects. Probably the mostoften used is that from Verriest.25 The classificationscheme is presented in Table 1. As previously stated,recent research has indicated that color discriminationloss from styrene exposure may be due to changes withinthe retina leading initially to alteration in color vision ofthe blue-yellow type.6, 26 This would correspond to a TypeIII defect, similar to other toxic retinopathies and diseaseslike cystoid macular edema, central serous retinopathy,and diabetic retinopathy. While retinal damage from dis-ease certainly affects both blue-yellow and red-greencolor processing, the few short wavelength sensitivecones (i.e., blue cones) present within the retina relativeto the large number of green and red cones makes blue-yellow color processing especially sensitive to retinalinsult. Also, while an initial acquired color vision lossoften demonstrates itself as predominantly a blue-yellowconfusion, red versus green insensitivity is often found,especially as the condition worsens. Although confusionsalong the blue-yellow axis are most typically describedwith styrene exposure, studies have reported confusionsof the red-green type.5, 24

QualIty of lIfe and ColoR vISIon: the SIgnIfICanCe of aCQuIRed dySChRoMatopSIaS
The SIrc review November 2006 149
diabetes is a metabolic disorder exhibiting elevatedblood glucose due to an insufficiency of or insensitivity toinsulin. There is a resultant breakdown of regulatorymechanisms, some of which lead to alterations in thevisual system. In particular, research has shown thatthere are changes in the short wavelength system (blue-cones) leading to alterations in visual function prior toclinically detectable retinal vascular abnormalities.27 Areport from the Early Treatment diabetic retinopathyStudy showed that 50% of its sample (n = 2,701) had colorvision scores worse than 95% of the normal population.28
These are patients with confirmed retinopathy, indicatingthat they are more severe diabetics than the general dia-betic population. The color vision defect that was mostfrequent was of the blue-yellow (tritan) type.
Glaucoma is an ophthalmic disease whereby the opticnerve undergoes changes resulting from high intraocularpressures leading to alterations in the optic nerve fiberbundle. This disease also has an effect on color vision.29-34
Traditionally it was thought that glaucoma leads to ablue-yellow alteration in color vision; however, morerecent research has shown that red-green alterations maybe just as common or likely.35 It was originally suggestedthat short wavelength cones may more susceptible todamage from elevated intraocular pressure.
ColoR vISIon and eveRyday funCtIon
It has been known for well over a century that peoplewho have color vision deficiencies may have occupation-al impairments. Some of the first observations of this
were in transportation—specifically, the railroad andmaritime industries. Thethought is that there is anincreased risk for an acci-dent or crash with the misin-terpretation of a signal light.These industries adoptedcolor vision standards in themid-to-late 1800’s. The air-line industry instituted simi-lar color vision standards inthe early 1900’s. Thereseems to be no broad agree-ment regarding color visionstandards for personal auto-mobile use throughout theworld. In the United States,however, individuals must
be able to discriminate between a green, amber, and redtraffic signal in order to obtain a commercial driver’sLicense. research has shown that a color vision deficien-cy alone is not a danger to safe driving.36
There seems to be even less of a consensus for colorvision standards in other occupations and trades wherecolor vision discrimination may be important. This maybe because many of these trades and industries are self-regulated, and are not equipped to handle such a healthstandard. Nevertheless, color vision discrimination maybe quite important in many occupations, as color is one ofthe most effective means of conveying information.37
However, individuals with color vision deficits oftenengage adaptive behaviors to compensate for theirdeficits in color perception and discrimination.
reports on the significance of color vision on function-al ability are scarce. The best assessment of this issue isthat of Steward and cole.38 In that study, the investigatorssurveyed 102 individuals with congenital color visiondeficits and 102 normal controls. A questionnaire wasadministered which was composed of five sections: colorvision status/perception, everyday difficulties with color,occupational difficulties with color, difficulty with colorsignal (i.e., driving), and reaction to color vision diagno-sis. The results of this study were interesting. Two dichro-mats (5.4% of the dichromats) and 16 anomalous trichro-mats (24.6% of the anomalous trichromats) were unawareprior to the study that they had a color vision deficit. Themajority of dichromats (71%) and a small minority ofanomalous trichromats (27%) reported that they becameaware of their deficit through difficulties with colors (p <0.002). of the 18 individuals not aware of their color
table 1
Verriest classifications of Acquired color Vision defects
Name description Examples of causation
Type I (red-Green) Protan type of defect with 1) cone dystrophyshift of luminous efficiency 2) chloroquine toxicityfrom photopic to scotopic
Type II (red-Green) deutan type defect with 1) optic neuropathymilder blue-yellow loss 2) Ethambutol toxicity
Type III (Blue-yellow) Tritan type defect 1) Glaucoma2) diabetes3) Nuclear cataracts4) Aging5) Macular degeneration

QualIty of lIfe and ColoR vISIon: the SIgnIfICanCe of aCQuIRed dySChRoMatopSIaS
The SIrc review November 2006150
vision deficit prior to this study, the general response ofthe individuals was described as “denial” or “coping.”
The results from questions about difficulties witheveryday activities, driving, and their occupations werealso interesting. In terms of everyday activities, the colorvision defectives reported difficulties with selecting col-ors of cloths, accessories, paints, carpet, furniture, wallpa-per, and cosmetics. They also reported significant diffi-culty with crafts, hobbies, flower identification,determining when fruits/vegetables are ripe, and insporting activities. color vision defectives also reporteddifficulty with traffic signals and sometime confusingtraffic signals with street lights. Finally, between 29 and43% of color vision defectives reported that their alteredcolor vision impacted their career choice, and somereported difficulties with their current, everyday work.
The study of Steward and cole generally showed thatdichromats report more difficulty than anomaloustrichromats with most tasks, and this is expected giventhe nature of these defects. They state, “Most anomaloustrichromats reported their color vision defect to be of nui-sance value rather than a major handicap in their every-day life.” What is not known from this research is how anindividual with an acquired color vision deficit mightrespond to these sorts of questions about functional,everyday impairments associated with his or her colorvision loss. We might speculate that those with an acquiredcolor vision deficit might respond similarly to a mildanomalous trichromat, who may have a deficit similar inmagnitude to that shown by workers exposed to styrene.
ophthalMIC dISeaSeS and QualIty of lIfe
To our knowledge, there have been no studies that havetruly assessed the significance of color vision deficits onquality of life. The National Eye Institute Visual FunctionQuestionnaire (NEI-VFQ) has a color vision ‘scale’ that ismade up of only one question (Question #12: Because ofeyesight, how much difficulty do you have picking outand matching your own clothes?). Surprisingly, there isno color vision-specific quality of life or functional ques-tionnaire that has been standardized in the way in whichthese sorts of instruments generally are. one study of 147glaucoma patients showed no correlation between visualfield loss and the color vision question on the NEI-VFQ;similarly in this same study, there was no difference inthe mean score on this question when comparing nor-mals to glaucoma patients on this question.39 A possibleexplanation is that glaucoma is a disease which mainlyaffects older individuals and blue-yellow color discrimi-nation losses are seen normally with aging. Another
report of diabetic individuals to whom the NEI-VFQinstrument was administered reported that the scores forcolor vision were among the highest (best) reported, andbecause deficits were uncommon, the scale was not usedin predictive analyses (i.e., to answer the question “isretinopathy severity associated with quality of life-relat-ed color vision loss?”).40 This scale is surely limited, andprobably not representative of the ways in which colorvision may affect an individual’s function and health sta-tus. This issue most definitely needs further study.
ConCluSIonS
There is lack of information and studies that haveassessed the significance of acquired color vision defi-ciencies on quality of life and everyday tasks. cole andSteward showed that congenital color vision deficienciesare associated with mild-to-moderate impairments ineveryday tasks and occupations; however, styrene-associ-ated color vision changes are relatively mild compared tocongenital color vision deficits. The significance of achemically-induced color vision alteration on quality oflife is uncertain, but likely less significant than that ofcongenital deficits. We believe that a study that assessedthe significance of styrene-induced color vision deficien-cy on individuals might show little-to-no impairments inquality of life and functional ability. At present, there isnot an appropriate color vision-specific quality of life sur-vey instrument that could be used for this type study.
RefeRenCeS
1. Gobba F, cavalleri A. Kinetics of urinary excretion andeffects on colour vision after exposure to styrene. IARC
Sci Publ 1993:79-88.
2. campagna d, Mergler d, Huel G et al. Visual dysfunc-tion among styrene-exposed workers. Scand J Work
Environ Health 1995;21:382-90.
3. Eguchi T, Kishi r, Harabuchi I et al. Impaired colourdiscrimination among workers exposed to styrene: rele-vance of a urinary metabolite. Occup Environ Med
1995;52:534-8.
4. Kishi r, Eguchi T, yuasa J et al. Effects of low-leveloccupational exposure to styrene on color vision: doserelation with a urinary metabolite. Environ Res
2001;85:25-30.

QualIty of lIfe and ColoR vISIon: the SIgnIfICanCe of aCQuIRed dySChRoMatopSIaS
The SIrc review November 2006 151
5. Triebig G, Stark T, Ihrig A, dietz Mc. Interventionstudy on acquired color vision deficiencies in styrene-exposed workers. J Occup Environ Med 2001;43:494-500.
6. Vettori MV, corradi d, coccini T et al. Styrene-inducedchanges in amacrine retinal cells: an experimental studyin the rat. Neurotoxicology 2000;21:607-14.
7. Pastor PN, National center for Health Statistics (U.S.).Health, United States, 2002. Hyattsville, Md.: departmentof Health and Human Services centers for diseasecontrol and Prevention National center for HealthStatistics; 2002.
8. World Health organization. Manual of the internation-al statistical classification of diseases, injuries and causesof death. Geneva, World Health organization,; 1948.
9. Grant M, Padilla GV, Ferrell Br, rhiner M. Assessmentof quality of life with a single instrument. Semin Oncol
Nurs 1990;6:260-70.
10. clancy cM, Eisenberg JM. outcomes research: measur-ing the end results of health care. Science 1998;282:245-6.
11. Ware JE, Jr. Standards for validating health measures:definition and content. J Chronic Dis 1987;40:473-80.
12. Patrick dL, deyo rA. Generic and disease-specificmeasures in assessing health status and quality of life.Med Care 1989;27:S217-32.
13. Ware JE, Jr., Sherbourne cd. The MoS 36-item short-form health survey (SF-36). I. conceptual framework anditem selection. Med Care 1992;30:473-83.
14. Lee BL, Gutierrez P, Gordon M et al. The GlaucomaSymptom Scale. A brief index of glaucoma-specific symp-toms. Arch Ophthalmol 1998;116:861-6.
15. Guyatt GH, Naylor cd, Juniper E, Heyland dK,Jaeschke r, cook dJ. Users’ guides to the medical litera-ture. xII. How to use articles about health-related qualityof life. Evidence-Based Medicine Working Group. JAMA
1997;277:1232-7.
16. deyo rA, diehr P, Patrick dL. reproducibility andresponsiveness of health status measures. Statistics andstrategies for evaluation. Control Clin Trials 1991;12:142S-158S.
17. Guyatt G, Walter S, Norman G. Measuring changeover time: assessing the usefulness of evaluative instru-ments. J Chronic Dis 1987;40:171-8.
18. Bradford Hill A. The Environment and disease:Association or causation? Proc R Soc Med 1966;58:295-300.
19. Mangione cM, Lee PP, Pitts J, Gutierrez P, Berry S,Hays rd. Psychometric properties of the National EyeInstitute Visual Function Questionnaire (NEI-VFQ). NEI-VFQ Field Test Investigators. Arch Ophthalmol
1998;116:1496-504.
20. Steinberg EP, Tielsch JM, Schein od et al. The VF-14.An index of functional impairment in patients withcataract. Arch Ophthalmol 1994;112:630-8.
21. Terwee cB, Gerding MN, dekker FW, Prummel MF,Wiersinga WM. development of a disease specific qualityof life questionnaire for patients with Graves’ ophthal-mopathy: the Go-QoL. Br J Ophthalmol 1998;82:773-9.
22. Koch dd. Measuring patient outcomes after refractivesurgery. J Cataract Refract Surg 2001;27:645-646.
23. Vitale S, Schein od, Meinert cL, Steinberg EP. Therefractive status and vision profile: a questionnaire tomeasure vision-related quality of life in persons withrefractive error. Ophthalmology 2000;107:1529-39.
24. Hart WM, Jr. Acquired dyschromatopsias. Surv
Ophthalmol 1987;32:10-31.
25. Verriest G. Further studies on acquired deficiency ofcolor discrimination. J Opt Soc Am 1963;53:185-195.
26. Fallas c, Fallas J, Maslard P, dally S. Subclinicalimpairment of colour vision among workers exposed tostyrene. Br J Ind Med 1992;49:679-82.
27. Adams AJ. chromatic and luminosity processing inretinal disease. Am J Optom Physiol Opt 1982;59:954-60.
28. Fong dS, Barton FB, Bresnick GH. Impaired colorvision associated with diabetic retinopathy: EarlyTreatment diabetic retinopathy Study report No. 15. Am
J Ophthalmol 1999;128:612-7.

QualIty of lIfe and ColoR vISIon: the SIgnIfICanCe of aCQuIRed dySChRoMatopSIaS
The SIrc review November 2006152
29. Kalmus H, Luke I, Seedburgh d. Impairment ofcolour vision in patients with ocular hypertension andglaucoma. With special reference to the “d and H color-rule.” Br J Ophthalmol 1974;58:922-6.
30. drance SM, Lakowski r, Schulzer M, douglas Gr.Acquired color vision changes in glaucoma. Use of 100-hue test and Pickford anomaloscope as predictors of glau-comatous field change. Arch Ophthalmol 1981;99:829-31.
31. Hamill Tr, Post rB, Johnson cA, Keltner JL.correlation of color vision deficits and observablechanges in the optic disc in a population of ocular hyper-tensives. Arch Ophthalmol 1984;102:1637-9.
32. Airaksinen PJ, Lakowski r, drance SM, Price M. colorvision and retinal nerve fiber layer in early glaucoma. Am
J Ophthalmol 1986;101:208-13.
33. Sample PA, Boynton rM, Weinreb rN. Isolating thecolor vision loss in primary open-angle glaucoma. Am J
Ophthalmol 1988;106:686-91.
34. yamazaki y, drance SM, Lakowski r, Schulzer M.correlation between color vision and highest intraocularpressure in glaucoma patients. Am J Ophthalmol
1988;106:397-9.
35. Alvarez SL, Pierce GE, Vingrys AJ, Benes Sc, WeberPA, King-Smith PE. comparison of red-green, blue-yel-low and achromatic losses in glaucoma. Vision Res
1997;37:2295-301.
36. owsley c, McGwin G, Jr. Vision impairment and dri-ving. Surv Ophthalmol 1999;43:535-50.
37. Vingrys AJ, cole BL. Are colour vision standards justi-fied for the transport industry? Ophthalmic Physiol Opt
1988;8:257-74.
38. Steward JM, cole BL. What do color vision defectivessay about everyday tasks? Optom Vis Sci 1989;66:288-95.
39. Gutierrez P, Wilson Mr, Johnson c et al. Influence ofglaucomatous visual field loss on health-related qualityof life. Arch Ophthalmol 1997;115:777-84.
40. Klein r, Moss SE, Klein BE, Gutierrez P, MangionecM. The NEI-VFQ-25 in people with long-term type 1diabetes mellitus: the Wisconsin Epidemiologic Study ofdiabetic retinopathy. Arch Ophthalmol 2001;119:733-40.