Embed Size (px)
Citation preview

The DanceTrading Manual
for the M1 Charts
1

Contents
Table of ContentsContents.....................................................................................................................................................2Legal Disclaimer:.......................................................................................................................................3Author's Note:............................................................................................................................................4What this manual DOES NOT cover.........................................................................................................6The Secrets of Trading...............................................................................................................................7Modified for M1 Trading!........................................................................................................................10The Rules:................................................................................................................................................11THE CARDINAL RULE: ......................................................................................................................14Trade Checklist........................................................................................................................................15Additional Considerations and Definitions..............................................................................................16Using Price Action...................................................................................................................................20Chart Setup: Metatrader...........................................................................................................................25Taking The Trade!....................................................................................................................................27The Constrainment Trade.........................................................................................................................29The AAA “Touch” Trade Entry................................................................................................................29How To Let The Market “Show It's Hand”..............................................................................................33Putting It All Together:.............................................................................................................................36A Word About Wicks................................................................................................................................38Stay OUT!................................................................................................................................................38Trade & Risk Management......................................................................................................................40Trailing the SL:........................................................................................................................................43Setting Up The Charts..............................................................................................................................44Using The Profile.....................................................................................................................................48Using The Scripts ....................................................................................................................................49
Copyright Clay Ferrell, 2009 – 2010 any effort to change this basic set of rules of the strategy is strictly forbidden unless prior written permission is granted by the author.
2

Legal Disclaimer:
Trading foreign currencies is an extremely risky activity but is also a potentially profitable opportunity for educated and experienced investors. Before deciding to participate in the Forex market, you should carefully consider your investment objectives, level of experience and risk appetite. Most importantly, do not invest money you cannot afford to lose. Let me put this another way. If you took the money you are considering using in FOREX, lit it on fire and laid it in an ashtray and watched it burn to ashes and cannot live with that result, then you cannot afford to trade FOREX with that money.
There is considerable exposure to risk in any foreign exchange transaction. Any transaction involving currencies involves risks including, but not limited to, the potential for changing political and/or economic conditions that may substantially affect the price or liquidity of a currency, the risk of settlement discrepancies, broker errors and malfeasance, outright fraud and many others.
Moreover, the leveraged nature of FX trading means that any market movement will have an equally proportional effect on your deposited funds. This may work against you as well as for you. The possibility exists that you could sustain a total loss of all initially deposited margin funds and be required to deposit additional funds to maintain your position with any given broker. If you fail to meet any margin calls within the time prescribed, your trading position may be liquidated and you may be responsible for any resulting losses, including amounts potentially more than your deposit.
The content provided herein is put forward in good faith and believed to be accurate and effective, however, there are no explicit or implicit warranties of any kind made in connection with this information. Should you choose to use this strategy, you will be trading exclusively at your own risk of your own free will.
By using this Strategy, the reader (thats you!) agrees not to hold the author of this information, or any of his or hers affiliates, assigns, or heirs liable for and to explicitly hold harmless from any decisions that you make based on information contained in this document, or any information found on any electronic forum or from any email discussing this strategy, no matter where it is or where this strategy was put forward.
If you do not agree with the all of the above, do not trade using any of this information or any part of this strategy.

Author's Note:Learning to trade is a very lonely and personal thing. The journey can be extremely frustrating, is almost always a lonely journey, but is always worth it.
Rule number 1 in learning to trade Forex is that you can get everything you need for free if you are willing to do some research and some work on your own. Paying for “systems” is stupid. They are a dime a dozen and always worth less than you pay for them. Your own mind and the charts is the only thing you really need. Benjamin franklin said, “Empty your purse into your mind and your purse will never be empty!”
That is amazingly good advice. Training is worth paying for, but in Forex, you can get all you could ever want or need mostly for free. With that said, there is something to be said for paid training in that people mostly discount the value of things they receive for free and often walk right past the gold nuggets looking for pyrite (fools gold for the less informed).
For the most part I have found trading to be an arena filled with tons and tons of wannabe gurus, sheister promoters, amazingly worthless and complex strategies, systems and most importantly, “self-fulfilling prophecies.” For example, Fibonacci lines, Elliot Waves, Andrews Pitchforks, Moving Averages, Stochastics and Support/ Resistance levels all work really well because so very, very many people use them, but they often fail as well because some larger player moves the market or some other influence does.
“Round Numbers” also work very well for the same reasons although there is a solid psychological reason for this one. People tend to “round” the numbers in their lives and they do the same in trading. There is nothing magical in any of this, just plain old human psychology at work. Fear keeps people trapped and makes certain levels stronger than others. Greed does much the same just in a different way.
If you watch price action around Andrew's pitchforks, you will see the exact same sort of movement as you do around longer term Moving Averages. Nature loves a balance and people instinctively understand that.
What goes up must come down, everyone knows that! Inertia keeps moving objects in motion and resists objects at rest from movement. Everyone knows that too!
Life is filled with cycles, which scientists now call “circadian rhythm.” Night and day, rise and fall of the tides, sleep and waking, excitement and depression. Everyone knows this too!
Fractal technology is the science of how larger things are built on smaller things. Just look at a tree. One line “branches” into multiple lines and eventually we have the shape we recognize trees to have, both in branches and roots.
People have been trying to apply all these principles in differing methods to the markets from when the first market place was ever created. Just look at how long the Japanese kept records of the rice markets with candlestick charts. The same is true of the grain markets in more European areas, just not with candle sticks.
The whole point in all this is that life is built on self-fulfilling prophecies and expectancies. So are the markets, the same types of personalities that exist and make life in general so unpredictable exist in the markets as well, despite all their supposed education and analysis. It is specifically these items and “self-fulfilling prophecies” that make Forex tradeable and profitable if you learn to understand and use

them effectively. Also, each person is built different and different “self-fulfilling prophecies” will work for them because they have a tendency to see and recognize them based on their own personalites.
Trading is no more difficult than finding one or more of these that you can understand, “see” clearly on a chart and trade effectively. It's really more like a dance, poker or a video game than anyone wants to admit. You can make it a lot more difficult and complex than this, but you do so at your own peril and cost and it WILL slow down your learning curve by years.
There is an old country western song that says, “One step forward and two steps back, no one gets very far like that.” BUT, that is not really true.
In a dance there are two partners. One leads, one follows. For the most part the “male” leads and the “female” follows. She is traveling along in the dance just as fast as he is, only she is doing it backwards! She is also taking all of her “cues” from “him” and doing it in high heels most of the time. Without both partners there would be no dance.
In trading, the market is ALWAYS the “male” and traders are ALL “female” taking their cues from “him” AND, they must do it in response rapidly and backwards.
If one over analyzes a dance technique they mess it up, the “flow” of the dance often suffer because of it and sometimes they even get hurt. If they don't understand the cues the same thing happens, only often it's worse . Trading is no different. So, learn to dance. Learn to take cues from the market and just have fun! If it's too exciting, you're taking far to large of a risk in trading. If it's sort of boring, you probably have it right and you can begin to focus on your “partner” and learn to have fun.
Credit where Credit is Due!
This strategy is a combination of two main strategies that I greatly admire. The first is trading Moving Average bounces which Josh Ford taught me. Second is James16 for his thread on Price Action Bars at ForexFactory. Lastly I learned about “Round Numbers” and their effects reading Jacko's Thread also on FF. Jacko evidently turned out to be a scammer, but his stuff about “Round Numbers” really helped me a lot. If that bothers you, get over it. You can learn as much from a thief as you can from a professor if you're a good student.
All I really did was to listen attentively to what Josh taught me and document many of the “nuances” of trading Moving Averages the way he does it. It is amazingly powerful!
A Word About Idiots and NeanderthalsThis strategy was originally posted to ForexFactory with the intent of it being a “for free” trading strategy. Nothing was ever asked for in return and no offers were ever made in regards to its use, training to use it, and the Author NEVER EVER trades ANY managed accounts for anyone. There is no need to.
Still, for some reason a few decided that the Author's “writing style” was similar to some idiot who supposedly defrauded some on that forum by trading managed accounts. Though I am not familiar with the story, let me say this. ANYONE who EVER gives their hard earned cash to a stranger they meet on an Internet forum for trading or even in the “real world” in “real life”, is as much of an idiot as

the person doing the trading is. BOTH of them are really stupid and both get what they deserve ultimately.
With that said, the Neanderthals on ForexFactory, without any evidence of any kind, and the lame brained site administrator who admitted in his post banning the Author that he had NO hard evidence of ANY kind, still destroyed the teaching of a very solid and free strategy to many who really needed that free teaching.
The strategy is still there in the “Recycle Bin” if you want more information on this basic set of rules at the following link and a trader using the screen name of Kostas1 has taken it upon himself to continue the original work, with this Author's approval. THIS manual is probably posted on his thread to keep my word that I would re-work it a bit and to assist him in his efforts to continue the work teaching The Dance.
The Dance is here: http://www.forexfactory.com/showthread.php?t=224697
Kostas1's “Choros” thread is here: http://www.forexfactory.com/showthread.php?t=236210
Disclaimer: The Author of this manual has no relation to the trader known as Kostas1, and is NOT responsible in ANY WAY for what is taught on that thread and accepts NO liability in any way, shape, form or fashion for what occurs on that thread.
What this manual DOES NOT cover.This manual's purpose is to clean up and simplify a bit some of the rules and the basics of The Dance forex trading strategy. It is NOT a “system” and requires the reader to actually learn to trade. But the rewards for that learning are staggering indeed with an average of +3% to +4% increase daily possible until the account becomes large enough that liquidity becomes an issue. Even then, consistancy is not only possible, it is probable if the rules are followed.
IT DOES NOT include long discussions of “advanced” rules though some are alluded to in the sections where using “Wicks” is mentioned and others.
YOU can also figure out the advanced rules simply by their names IF you are willing to spend some time in the Simulator and in trading Demo for a while
WARNING!!: The “advanced rules” are NOT necessary to make solid and large returns. If you insist on them, you should re-evaluate your reason for wanting them. The basics really are enough.The Advanced Rules, if I ever decide to make them public; after my experience at teaching for free at FF, are Using Daily Wicks (for entries and exits), Using Hourly Wicks and Long Wicks (for entries and exits, Home On The Range (trading ranging markets), Scooped Up (trading strong reversals) and Playing Ping Pong (learning to trade the “ping pong” area on the H1, D1 and very, very rarely the M1 charts.)
There are a few more, but I'm doing THIS revision exclusively to simplify The Dance it's self, make it more easily tradeable and to provide more trading opportunities for those who are a bit more impatient.
I still DO NOT know what I am going to do yet, after the fiasco at FF, but I will just keep mastering my strategy, making money and learning and helping FOR FREE, a few who have asked me to help. I WILL NOT be accepting anyone to mentor (which is also FREE when I do it).

The Secrets of TradingEveryone wants to know the secrets of trading. They are pretty simple really and the true secrets have absolutely NOTHING to do with a particular strategy. They ARE about YOU personally and how YOU operate in life. That is the main reason no one wants to believe them and why they remain “secret.” These secrets are hidden in plain sight for all to see and learn freely. It is other people who want to make money trying to sell you some great system or strategy that supposedly they alone have been able to figure out that cause all the confusion in trading. Supposedly their “system” allows them to unlock the “secrets” of trading consistently and profitably.
So, in this first part of the manual, I'm going to list the most profitable secrets there are anywhere of trading successfully. The secrets are as follows.
Secret #1: Stick to ONE strategy.Find a strategy that makes sense to you and stick to it and it alone like a faithful wife and master it. This is probably the single greatest secret in all of trading. Master ONE strategy. There are no “systems” only strategies that work if you master them. If you jump around from one to another you will never master anything and be forever locked in the sucker's dream of “the system” or the “Holy Grail” of trading. The truth is, all strategies work for the ones using them if they will learn to master them.
“The Dance” is just another strategy. It is not a secret system, it is not a system at all really, but I personally believe it is much simpler to learn and master and that it can, if used properly, work in all markets and on all securities, not just FOREX.
Secret #2: YOU are the main secret in trading.You are the greatest secret in trading. You have been gifted with the fastest computer known to man at your birth and you have the ability to learn, adapt and modify everything you see and come into contact with. The way you “see” things is very different than the way other's “see” things. That is how “The Dance” came to be. I “saw” something in the interplay of some moving averages that I had never read about, but it made sense to me immediately and I began to explore it and practice what I “saw.” It works and it works for anyone and everyone who uses it and the simpler you keep it, the more powerful it is. If you can master “you” and your emotions about trading (talked about in another of the “secrets), you WILL become successful. And that leads us to secret #3.
Secret #3: Simpler is better.Simpler is always better. The more complex a strategy is, the harder to learn it will be and the easier it will be to make mistakes that will shake your confidence, slow you down and cost you, possibly, years in mastering trading. Having more lines on a chart has no more value than having one. Personally I find three optimal to give me all the information I could possibly need to trade with in a visual fashion. All indicators are just more lines displayed differently that re-hash the same basic information found in moving averages. Anyone who says differently probably has a “system” to sell you.
Secret #4: Accept the “numbers game” view of it.Mastering trading is not hard. It's just an issue of accepting the “numbers game” of it all. All things have a “probability” ratio or a “numbers game” that creates the success of the effort. Whether it's sports, industry, sales or trading, there is a “numbers game” behind it all. The more you can find an “edge” something you can exploit, the faster you will become will become consistent at your effort and

that consistency leads to success.
Secret #5: Master yourself, master your trading.Your own emotions are the only real “enemy” in all of trading. Brokers who manipulate price feeds cannot defeat you. Market makers who charge large spreads cannot defeat you. The news cannot defeat you. Changing markets cannot defeat you.
Greed will decimate you accounts, crush your strategies, kill your dreams and add years to your efforts in trading. Greed is extremely deceptive. It's not wanting to have large accounts, it's not wanting to be wealthy. In trading, greed is none of the normal things you are taught it is. In trading, it's wanting to get that next point when the strategy says your done. It's wanting 30 points when the strategy's rules say 15 is enough. It's wanting to swing for the fences on every single trade. Greed is not being willing to take it slow and allow it to grow. It's not allowing compounding to work and wanting to have it “now.”
Fear will kill your trading and add years to your effort of being successful. The rules of any strategy are desined to take the emotions out of your trading. Allowing yourself to “second guess” the rules is fear. Not taking a trade instantly on the signal is fear. Exiting a trade before the rules call for is fear. Anything that keeps you from following your rules is fear and it short circuits all of your efforts and all of your training and adds years to your trading and robs you of success. You must eliminate it from your trading.
Revenge will destroy you as well. You are not the target of any great conspiracy and the market couldn't care less about your trade or your position. The brokers may want you to be a victim, but trading out of a desire for revenge will skew your thought and twist what you “see” on the charts. It will defeat you as will greed and fear.
Arrogance will destroy you just as fast as either of these others. Trading from the perspective of any emotion will kill your trading. Arrogance will do it just as fast as greed, fear or revenge. You are NOT mistake proof. Even IF you believe you have mastered a strategy, any strategy you will still make mistakes. Arrogance will lead you to even bigger mistakes, then to revenge to try to make up for it, then to greed to try to get “just a little more” so you can earn back what you lost.
Secret #6: There are no makeup trades.Trade each trade and each session as if it were the only one. Yesterday is gone and does not deserve to be remembered in trading. The only thing that exists in successful, consistent trading is the trade you are about to place. Make it the best on possible and forget the past so your emotions don't have a place to take hold on you.
Secret #7: Persistence and attitude will overcome everything.If you believe you can do this, you can. If you do not believe that, quit now. Nothing can stop or defeat you but you. That is true of everything in life, not just trading. It does however apply specifically to trading. Never ever listen to anyone who says you can't trade.
Secret #8: If it's not boring, you are NOT trading correctly.Trading is a very lonely business for the most part. People love to do things in groups. Trading is extremely personal. People love excitement and things that are interesting. SOLID trading is exceptionally boring and lonely. One of the hardest battles you will fight is to just trade and not try to “fix it” or “improve it.” This strategy works day in and day out. In fact, if you learn to take only the “perfect” signals, you will make more money in the good points of price movement than you ever

would trying to “fix it.”
If you earned 3% to 10% per day during the SOLID price movements and entries, and avoided the sideways days alone, you could become wealthy in a single year starting with as little as $100.00. The power of compounding, combined with solid entries would take $100.00 to over $600,000.00 in 300 days of trading. This assumes that you make some good trades and some bad trades but average only 3% per day. Averaging 5% per day would take you to over several million.
There are those who would like to try to tell you it's not possible, but it is and the most difficult part is it's boring.
Secret #9: Some days you just have bad days !Every single athlete of any sport in any age has faced the “grimlins” of a bad day when for no apparent reason, someone whose skill and physical prowess are not even close simply trashes them. There are no reasons, to rationales, no analysis that can stop it. It will happen, but you can limit it! Trading is no different.
This is the reason for rules. They are to supersede your mind, instincts, emotions and all of your efforts to overcome it, which runs counter to everything we have ever been taught in life. STOP! Walk away when you start violating ANY rules, ESPECIALLY the 5 trades and STOP or the TWO LOSS and STOP rules!
LEARN to limit your arrogance and pride of how good you have become, or how good your strategy is. LEARN to limit your losses! Follow the RULES!

Modified for M1 Trading!
This manual has been modified to allow for trading on M1. I have left in many of the M15 images for illustration purposes ONLY as I didn't want to waste a lot of time going over ground already covered in previous versions of the strategy.
M1 is a good way to “milk” moves, but it is VERY fast trading and not for the feint of heart. BE CAREFUL.

The Rules:Before we begin the rules section, you need to make some decisions about your trading right now, right here. If what you are looking for is a never fail, point and click, automated, does it all for you sort of thing, please don't trade at all, I'm not saying don't trade The Dance, I'm saying find something else to waste your money on.
If what you want is really, really high pip counts, please move on. That is NOT the purpose of The Dance. If you want to trade every signal you see, move on to some other strategy or system. The Dance is not for you. If you want to double your account every few weeks, please move on.
IF you want to learn to trade a simple system that is fairly easy to learn, make lots of money and never need more than 40 pips a day to do it. Welcome home, this is the place. With time, you will also get to the larger pip counts and to where you can make a lot more trades, but the FIRST thing you have to do is master ONE strategy and no more than two or three types of entries and NEVER vary from them.
THAT is what professional trading is about. A disciplined approach to trading that consistently earns you income and wealth. Here are the rules.
Trading Times:1. Trade ONLY during the London/ NY Overlap for USD and GBP pairs.2. Trade ONLY during the Asian/London Overlap for JPY pairs.3. Obviously some pairs fit more than one session. Look up the times on your own. Do SOME
work! I use Eur/Jpy, Gbp/Usd and Eur/USD but only ONE on a chart at a time. It has my TOTAL attention when I trade, which ever one it is.
Time Frame:1. 1 Minute charts primarily for all entry signals.
1. The other two charts are for determining Trend Of the Moment direction, possible entry and exit LEVELS (not points).
2. The tips of wicks on H1and D1 are great S/R Levels to take trades off and for exits, as are the Dance lines on the higher time frames IF you watch M1 very closely around them.
3. Only “Touch” trades are acceptable on H1 and D1 and should also match P/A on M1 as well as directionality.
Chart setup: 3 charts! M1, H1 and D1 (you can substitute H4 for D1 H3 on Oanda charts)1. No more than ONE “main” chart set to M1 and two smaller charts for each “main” currency.
Smaller charts are set to H1 and one to D1. 2. DO NOT COMPLICATE THE CHARTS with the garbage of more indicators. They just
cloud the issue and the process of deciding to enter a trade and are NOT needed.Entries:
1. Trade WITH the “trend of the moment” and assume the trend will continue from the previous session or the first entry. If you become really proficient, you will learn to trade “ranging” and Scooped Up areas as well, which are discussed later.
2. The 200 EMA and 50 EMA with the 35 SMA moving averages determine the trend of the moment on M1!1. Look for longs ONLY when Price, the 50 EMA/ 35 SMA Lines are above the 200 EMA.

2. Look for shorts ONLY when Price, the 50 EMA/ 35 SMA Lines are below the 200 EMA. 3. NO EXCEPTIONS (especially for beginners)! Price, THE 50EMA/ 35 SMA AND THE
200 EMA MUST AGREE AGREE WITH THE TRADE, PREFERABLY FROM A PULL BACK TO the 50 or 35. It can be a pull back to the 14 ema, but the angle must be EXTREMELY steep (at least 40 degrees or more).
4. “Touch Trade Entries” must be taken off of a steep MA and are only acceptable IF Price has have moved at least 15 pips in the direction of the trade, and opposite pull back that creates the “touch” which is a short, very fast “run back” to the lines “touched”. (explained in the price action sections.)1. Taken off a steep 14 EMA must also be above the 50 EMA/ 35 SMA Lines for longs
and below for shorts.1. ONLY trade the “touch” of the 14 EMA IF it is the FIRST or SECOND bar in the
retrace, it has a VERY STEEP angle (see example later in manual), price has moved a strong “distance” of more than 15 pips and you trade it EXACTLY at the “touch” with no more then 9-11 pips SL. On OANDA, you can use shorter stops often.
2. TWO BAR RULE for 14 EMA “Touch Trades” is simply this. It is a “retrace” trade and normally the EMA is at a “very steep” angle of about 45 degrees or more AND takes no more than TWO large bars to “get there” (to “touch” the 14 MA) and the retrace should be almost vertical or you should pass on the trade and wait for P/A to reveal where Price is really going.
3. On M1, price must ALSO have moved over 15 pips before the retrace to the “touch” entry!
4. “Touch Trades” off the 35 SMA and 50 EMA are also very easy to see but MUST be taken ONLY if the EMAs are parallel (the closer the better, or “on top” of each other) and at a steep angle, say about 25 Degrees or more as shown later in this manual. Be VERY careful if they are nearly horizontal or spread widely as the trade is much much weaker and the farther apart they are, the more likely you are seeing the start of a reversal.
5. Higher Time Frame “touch” trades are VERY powerful. LOOK FOR THEM!6. “Constrainment Trades” are next best signals against the 35 or 50. They can also
happen at the 14 EMA just be more careful with the ones off the 14 EMA and use tighter stops. Often these occur with several smaller bars being “constrained” by the moving average involved and are quite clear to see. Constrainment trades ALWAYS have at least three bars in the setup and often several more. The definition “constrainment” is a series of bars that “respect” a specific moving average in the Strategy. Usually the 35 or 50 but can be the 14.
3. NO LATE ENTRIES! IF YOU MISS ONE, DO NOT chase it or take the entry “late” wait for another one, there are lots of trades to take. Taking late entries will only increase your risk and frustrate you.
4. Counter Trend Entries: NOT RECOMMENDED AND NOT NECESSARY FOR GREAT GAINS!
Maximum Number of Trades!: NO EXCEPTIONS EVER !!!1. Maximum of 5 successful trades. GIVE IT A REST after that and spend some time doing
something else, GET A LIFE apart from trading.2. Maximum of 2 Losing Trades in a row. GET OVER IT and over yourself! LEARN to
stop and get over it! You will make mistakes and this rule will mitigate them. NEVER

VIOLATE THIS RULE. There are tons of trading opportunities and trading days.Stop Loss:
1. Stop Losses need to be “adequate” and that means different SL on different currencies. If you find yourself using more than 15 pips consistently for the SL, you need to practice and refine your entries.
2. Move the SL to BE as soon as you feel the trade will not take out your SL on a “breath.” Definitely after the trade gives you 10 pips or more.
3. A good place to set your original SL is Spread + just a couple of pips below or above the previous bar, “round number” or ema that price touched and moved away from. Be sure to include the spread.
4. KEEP THEM TIGHT!: During a move, keep the SL reasonably tight. Meaning move it to the bottom (or top) of the last bar each time one closes until you get strong with this strategy. This is especially important with ANY sort of P/A bar that might indicate a reversal, Tighten to the close of the P/A Bar immediately!
Number of positions:Never take more than two\ positions EVER. Risk management is a large part of this strategy. Too many positions increases your risk far more than needed.
Profit Targets:1. Though there is no specific TP in this strategy other than taking out the first position at +10 pips
and moving to BE, after that the best way to lock in profits is to move your SL to the extreme of the previous bar + spread and wait for the current bar to close. The only exception to this is when approaching a “round number” level or a stronger EMA like the 50 EMA/ 35 SMA Lines on a retrace. Tighten your stops at those levels as price has a nasty tendency to reverse at them. The other option, with more experience will be to exit and immediately short at that “first touch” of the 50 EMA/ 35 SMA Lines.
2. First Exit should be taken on one position after about 10 pips. If price is literally “racing” in your direction, exit after 10 pips on the first position after it starts to hesitate “too much” for YOUR tastes and move your SL to at least BE or to the bottom of the last bar, which ever is more profit.
3. If it becomes apparent you are in a ranging or choppy market, There really isn't any reason to trade it. With experience you can, but it's not worth it and NOT needed.
4. DO NOT BE AFRAID TO TAKE YOUR PIPS EARLY there will be more trades! You don't have to knock it out of the park every time to be very profitable with this strategy, and it takes experience to master the longer trades. Taking a quick 20 or so on a move is completely acceptable and you WILL get better as time progresses.
5. If P/A indicates a reversal between “round number” levels, get out! There will be more opportunities. Probably at the last RN price has just passed.
News Trading:1. AVOID the news! Normally I ignore the news, but if I can avoid it, I do. So should you and
not trade until after it settles down a bit. WARNING: Spreads WIDEN at news times, especially on OANDA!.
2. NFP DAYS (non farms payroll) and heavy news days can be very unpredictable. Not trading on NFP days is the best option, but lately I have been ignoring the news releases in favor of the “factored in already” approach where I just accept that the “market” has already “factored in”

the news and what it probably will be. With such high probability entries and short SLs News is much less of a concern to me lately.
Locking in Profits:1. Be cautious in moving your SL too aggressively, but keep it no farther back than the bottom (or
top if you're short) of the second bar back from current price action and preferably no farther back than the last bar bottom (or top).
2. If you have an extremely large bar, move the SL to the just below the last “Round Number” it passed land watch price movement very closely. If it hasn't yet passed a Round Number level, move to slightly less than 70% of the bar's total and wait. It will either continue to explode or retrace pretty rapidly and take out your stop. LARGE BARS OFTEN RETRACE QUICKLY, so don't hesitate to take your pips before it hits the SL you are trailing AND USE THE “round number” levels! Remember, the total goal every day is + 40 pips TOTAL (both positions) or 3%, NOT huge pips counts.
3. If a large bar “dead ends” at a stronger EMA, or a “round number” level, move your SL very close to the level. Probably about 2 times Spread or less and wait. If the move is strong, it will continue and blow through pretty quick. If not it will take out your stop and most likely reverse for a while.
Ranging/ Consolidating Markets: NOT NECESSARY FOR LARGE GAINS!1. The 50 EMA/ 35 SMA Lines have a strong tendency to either “wind” around each other or of
“flattening” while sticking close to each other during a period of consolidation or ranging. On “ranging” days you will often see price also wind around them and give you definite opportunities to enter at solid S/R levels or at Round Number levels on either side of the 50 EMA/ 35 SMA Lines.
2. Be very cautious in these markets unless you are experienced with this strategy. Wait for better signals if not experienced.
3. MOST of your entries in a “ranging” market will be against the 14 EMA and the move to BE MUST happen immediately after the first position is closed at the TP of 10 pips! NO EXCEPTIONS!
Compounding:
Increase your risk once a day at the most. Never more than that and use only 2% per trade position, never more. If you increase the risk level slowly, and continue mastering “The Dance” you can gain extremely large amounts of money over the long haul. Trying to compound any faster is greed and will kill your trading and your account. If you trade using Oanda, instant compounding is unavoidable unless you leave the “instant trade” window open the entire session and you need to be extra cautious with it, it bites pretty hard!
THE CARDINAL RULE:
DO NOT ENTER UNLESS THE CANDLE YOU ENTER

ON IS TOUCHING A LINE ! THIS ASSURES THE LOWEST RISK POSSIBLE ON THE TRADE AND THE QUICKEST MOVE TO BE WITH PROFITS!
A word about “flatlined” areas.
There are some who talked about “flatlined” areas as presenting good trading opportunities as price establishes a “channel” of sorts with a high above and a low below the 35/50 lines. While this does happen, and in other strategies where break outs are used, it would be a great place to look for breakouts, The Dance DOES NOT use breakouts and trying to use them when you are starting out will only confuse you. Leave them alone until you have lots and lots of experience. The require MUCH larger SL settings than The Dance uses.
Trade Checklist
The following checklist is intended to assist you in making trade entry decisions. It is not the “holy grail” of this strategy, merely a good tool to help you slow down and analyze the trade a bit less emotionally. The “Scoring” is still under development, so use good judgment !
10 EMA Trades Scoring
Very Steep ? Yes +2 No -1
Less Steep ? Yes +1
Flattening/ Horizontal ? Yes -3 No +1
One Bar Race Back ? Yes +1 No -1
Two Bar Race Back ? Yes +1 No -1
More Than 2 Bars ? Yes -3
First Pull Back ? Yes +2
Second Pull Back ? Yes +1
Third Pull Back ? Yes -2
Total
If the total is less than 3, pass on the trade !
35/50 Trades Scoring
Very Steep ? Yes +2 No -1
Less Steep ? Yes +1
Flattening/ Horizontal ? Yes -3 No +1
One Bar Race Back ? Yes +2 No -1
Two Bar Race Back ? Yes +1 No -1
More Than 2 Bars ? Yes -3
First Pull Back ? Yes +2
Second Pull Back ? Yes +1
Third Pull Back ? Yes -2
Parallel and angled ? Yes +1
Widely Spread? Yes -1
Total
If the total is less than 3, pass on the trade !

Additional Considerations and Definitions
Additional Considerations: Things to learn as you progress and definitions of terms used in this manual.
Currencies:1. Though this document used the Eur/Usd, Gbp/Usd and the Eur/Jpy, any set of currencies you
are comfortable trading is acceptable. Preferably one with lower spreads and certainly nothing with a spread over 5. The larger the spread, the more the trade must move before you reach BE. That increases your risk per trade.
2. Use only two currencies during the learning phase. You may increase the number as you see fit as you gain more experience. But be sure to keep your screen and charts “clean” so you can see clearly as P/A develops.
News: STAY OUT!1. DO NOT trade during News unless you are already in a GOOD trade and have locked in profits
already.2. If you are already IN a trade during the half hour before News, AND in good profits with some
locked in, you might stay in and tighten your stop loss but be careful. NO SL is guaranteed during news.
3. If you are NOT in a trade 30 minutes prior to news, WAIT for the news and then WAIT for Price to “settle down” a bit before you take a trade. That can be as little as 5 minutes after the news, or as long as 30. DON'T RUSH IT!
Fake-outs:1. MOST fakeouts occur because of a violation one of the rules for entering a trade. DO NOT
VIOLATE THE ENTRY, TIME, Session/Currency correlations OR TIME FRAME RULES!2. In addition, this is the purpose of moving the SL to BE ASAP! This strategy provides way
more than enough opportunities to trade. Avoiding the Loss is MORE important than catching the good moves, just don't let “fear” get to you.
3. Fake-outs usually occur around levels of resistance, such as the lower EMAs when they appear to be counter trend and close to Round Numbers where price is slowing, so just watch out for them.
4. DON'T FORCE A TRADE! Wait for a perfect setup and STEEP MA angles to enter!5. NEVER take a price action bar counter-trend by it's self. It MUST also meet all other criteria,
such as appearing at a S/R level, a bounce off an MA or “round number, or appear AFTER a significant move away from the 50 EMA/ 35 SMA or the 200 EMA Lines, often they need another confirming bar, or for the area to be previously proven as an S/R level.
Definitions: Definitions are used on the charts in discussion of Price Movement.1. “Round Numbers” are the lines of S/R drawn on the charts at areas of significance such as
the .00 and .50 levels.2. “Bounce” is where a candle hits and retreats at least 1 pip from an area of Support/ Resistance.
1. Almost always indicates a reversal, even if it is only a few pips if it is also a “dead end” at a

round number or a stronger MA such as the 50 EMA/ 35 SMA Lines.3. “Dead End” is where a candle stops “dead” at a level of Support/ Resistance with no wick
through it.1. Almost always indicates a reversal, even if it is only a few pips.
4. “Constrainment“ is where P/A is limited by and respecting a particular level of resistance such as one of the MAs or a “round number” for more than one bar, especially if there are several smaller bars involved. Often it is a confluence of more than one MA or MA+ round number.1. Almost always indicates a direction of movement, usually a continuation of an existing
Trend Of The Moment.2. The most powerful entries are when Price is Constrained in one direction after a significant
period of being “Flat lined” and the entry is taken off one of the stronger MAs.5. “Trend” is the CURRENT direction of Price above or below the 50 EMA/ 35 SMA Lines and it
can change several times in a day.1. Never violate the Rules of the Trend OR Counter Trend on Entries!
6. “Counter Trend” is the reversal of an immediately previous Trend. It is almost always preceded by either a fairly strong move (80 pips or more) followed by a period of “constrainment” of price at a S/R level and then a reversal of price which may also be a “constrainment” of price by a one of the lower EMAs and a round number level in the opposite direction.1. MOST “counter trend” trade setups will occur AFTER price has moved a fairly long ways
from the 50 EMA/ 35 SMA Lines, usually over 80 pips.7. “Confluence” is where more than one S/R indicator has merged or met at a specific point on
the chart. Usually it is a “round number” and a level of prior resistance from P/A. It can also be where more than one MA has “bunched up against each other and may include a “round number as well. These are GREAT Areas to take a “bounce” or “continuation” trades.
8. “Re-Test” is where Price has already moved past a S/R level and then retraced to that same level AND is rejected there.
9. “Clear Break” is where Price makes a thrust through a S/R level that is “significant,” usually meaning several pips.
10. “First Touch” trades are where price hits either a “round number” level or an MA that has held as S/R strongly before and you trade IMMEDIATELY in the opposite direction moving to BE as quickly as possible to maximize the trade. Often these trades are good for quite a bit of pips, but just as often they are only good for about 12 to 20 pips, so watch them closely for the exit.1. THE BEST “FIRST TOUCH” trades are always at the 35 SMA and can be on ANY of the
four time frames we look at for fine tuning our entries. The higher the time frame is, the more significant the “touch” will be in indicating a reversal.
11. “Flat Lined” is when Price moves in an extremely narrow range, usually less than 20 or 30 pips up or down total. DO NOT TRADE this area of chart activity. The only exception to this is if price is winding around the 50 EMA/ 35 SMA Lines in a wide enough range of at least 50 pips to give you “room” for a trade at the S/R levels.
12. “Moving Average Soup” or “MA Soup.” This is an area where the EMAs are all bunched up together, usually also “stuck” between or very close to the 50 EMA/ 35 SMA Lines and demonstrate no direction for a trade. This is a “STAY OUT” area, do not trade it. Often the lower EMAs get “stuck” between a stronger MA and a round number level.
13. “Price Trap” is when price is “stuck” or “trapped” between two or more areas of S/R as marked by the “Round Numbers” or one of the stronger MAs with a level of S/R indicated by prior P/A. Normally happens between the 35 SMA and the 50 EMA on M1 or H1. Breakouts

tend to be explosive.14. “Wicked” (pronounced “wict”) is an area of the chart where Price bars have “wicks”
everywhere on both sides and it's starting to look like a porcupine. DO NOT TRADE THIS AREA, WAIT for price to settle down, or to start to trend before even considering a currency like this.
15. “COB” is “Close of Bar.” 16. “Washed Out” A prior S/R level represented by a MA or a round number becomes “washed
out” and not immediately usable as S/R when price has crossed it and re-crossed it several times in the immediate past on the chart. “Washed Out” S/R levels should be ignored in this strategy, but they become valid again very, very quickly.
17. “Wick Through” is when price hits a level of S/R and pushed through it but closes on the side of the original move. The Longer the wick, the more cautious you should be about a trade here.
18. “Wick Off” is when a candle hits a S/R level, then retraces from it as in the case of a “pin” bar. A “wick off” is also a “rejection” of price at that level of S/R and often indicates either a continuation of the original “Trend” or a reversal of it, depending on where this happens.
19. “Porcupine” is an area of price where there are lots of fairly long wicks on both sides of the candles. Often the candles have wicks on both side of a single candle. STAY OUT AND DO NOT TRADE THE PORCUPINE.
20. “Triple Top” or “Double Top” is where two or more candles hit and stop at EXACTLY the same price point on a chart one right after another. “Triple Bottoms” and “Double Bottoms” are the same. You may use the standard definition as well, but for this strategy, we are looking for immediate price action, SOMETIMES coupled with prior P/A. These often occur at a Trend of the Moment continuation, or a re-test on a reversal.
21. S/R Levels are most clearly visible by looking at the recent past on the chart and using the bid/ask lines to “see” them more clearly. You may also zoom way out to see and mark one or two from the past two days at the absolute most. DO NOT clutter up your charts with lots of S/R Levels!
22. Exhaustion bars and Squat Bars are very small bars that are usually found at the turning point in a trend or a swing within a trend. Usually they are very few pips, probably no more than about 5 to 10 total. I also call these “tiny bars” in that they can often be even less and look exactly like a “pin” or a doji. When there is a cluster of these “tiny bars” being constrained by one of the higher Moving Averages, the 35/ 50 lines, they almost always indicate a fairly large move in the direction of the constrainment. They are very solid indicators of price reversals.
In later sections we talk of P/A and how to take advantage of it on M1, especially with a bounce off one of the Round Numbers and stronger MAs. Standard P/A bars such as Pin bars, Dojis, Spinning Tops, Hammers/ Hanging Man and Outside Bars work just fine on M1, just don't hang your hat completely on them alone. There must be confirmation of some sort for each P/A bar used. The Trend Of The Moment as defined by the Moving Averages and prior P/A provide that confirmation.
Additional Resources:
If you absolutely must read more, here are some great threads on ForexFactory.com.
James16 Price Action Thread. (huge thread) http://www.forexfactory.com/showthread.php?t=2331

Jacko's Forex House of Pleasure and Pain (trend trading, also a huge thread) http://www.forexfactory.com/showthread.php?t=27286 (good through he evidently turned out to be a scam artist)
No Brainer Trades (support and resistance trading) http://www.forexfactory.com/showthread.php?t=86429
Trade What You See, Not What You Expect (they make huge pips here, but a bit complicated for my taste.) http://www.forexfactory.com/showthread.php?t=121761
There are more, but why confuse yourself with them when the simplest strategies are always the best? These resources should be all you need.
You may also read my original thread at ForexFactory, and I apologize in advance for the way it ended with false accusations from a bunch of Neanderthals and an idiot site admin who never checked out any information, just went along with his cronies accusing me of being some one I'm not.
This manual and the basic strategy is free for all to use and change, adapt or modify as they see fit to help them master their trading. No money is or has ever been asked for it, except by some fraudster on Ebay from an eastern European country. The strategy is and always has been and always will be FREE to all.

Using Price Action
Price Action is used in two ways in this strategy. First are the normal P/A bars described immediately below, which can be used on any time frame, but here we are interested only in the M1 charts. OFTEN on M1, the “price action” is constrainment, not just normal P/A bars, but these help a lot as well.
Price action is the most reliable of all indicators in determining momentum and direction in trading. Price action can indicate reliably price reversals and continuations. All other indicators are based on price action in some form. In this strategy we will be looking primarily at a few standard Price Action setups to assist us in filtering the moves we take. Just keep in mind that on M1 P/A though very strong, can turn literally on a dime and give you change.
The first bars we look for are Pin Bars and Doji Bars, that are according to our definition, then Inside Bars, and Outside Bars, in that order, by the way. These are the primary indicators we will be looking for to determine most entries. LOOK FOR THE P/A! The Moving Averages are for determining if the P/A is valid for a trade. You must have Both P/A in the right direction of the trend and a bounce or constrainment for a trade to be valid!
OUR DEFINITION OF PIN BARS
Pin Bars and Doji Bars are Candlestick bars whose “body” is both inside and smaller than the body of the preceding bar and have a longer “upper wick” than “lower wick.” Often these bars are very small. In addition, it has an area with “room” around it on all sides, meaning that there is lots of empty chart space immediately to the “past” of the bar.
Look at the preceding charts as well as the ones that follow and you can see lots of them at the turning points. BE EXTREMELY CAREFUL of trades using “pin bars” that are not exactly per this definition here.
The following are images of some of the more common versions of Price Action as they appear in real charts.
Pin Bars:
These are bars very similar to the Doji, except that the open and close are at different prices. The correct Pin Bar for our purposes is one where the body of the Pin is inside the body of the previous bar as seen below.
Most often the best trades have the body of the signal Pin Bar closer to the top of the previous bar as seen here below and are fairly short candles over all. Often they are less than 10 pips.

The last image is included to demonstrate that Pin bars may come in multiples. Be sure that when entering on a Pin bar that it agrees with the Trend or a bounce in direction of the trend. One could have entered on either of the two downward pointing red pin bars in the last image. Often these types of Price Action occur at or very, very close to one of the “Round Numbers” and the larger Moving Averages.
Doji Price Action Bars:
Doji Bars also have the feature of not really having a “body” because the open and close of the “Bar” happens at the exact same price level. The following are pictures of some “Pin Bars” according to our definition of them. The second bar is the Doji. Usually Price continues the opposite direction of the Doji. Some say you should take a Doji entry at the top without question, but wait for confirmation of the second bar closing at the bottom. This strategy agrees with that statement. Wait on bottom Doji bars for confirmation bars.
Inside Bars:
Inside bars are often referred to as “squat” bars. They always are contained within the body of the previous bar. The second or third bar is the Inside Bar or IB.
Outside Bars:
These are bars that completely engulf the previous bar. The second or third bar is the Outside Bar, or OB. It should be obvious.

Price Action Bars are NEVER used alone to enter a trade unless you have lots of experience with this strategy. They MUST be confirmed by either resistance levels at a “Round Number,” by resistance as seen by prior P/A, a moving average, or by additional candles in the “right” direction.
Double Tops and Double Bottoms:
The terms “double top” and “double bottom” has a very different meaning in this strategy. You can still look for the “normal” double tops and bottoms where price has moved toward and away form an area of support and resistance over a period of several bars, but for our purposes in this strategy we will further define it as two bars which have exactly the same top or bottom. If the bars are also the same length, it can define an entry point or an exit point depending on it's location on the chart. Both bars MUST have the same EXACT top or bottom, but the can be different in how they achieve that.
For example, in the images below you will see some that are both wicked tops or bottoms, some that are both body tops or bottoms and some that are one of a body and one of a wick. It is the fact that they are EXACTLY the same price point that tends to indicate the reversal of price.
Make sure the signal also agrees with the trend and with the Moving averages to achieve the best results.
The following are double top and double bottoms signals. See if you can find the one not marked.

Double top and double bottom bar sets almost always signal either an entry or an exit point. As long as you are following the rules of trading WITH the trend of the moment, and the Rules of the moving averages you should be fine. Still, this does take some practice to master.
DO NOT TAKE A DOUBLE TOP/BOTTOM SIGNAL THAT CONTRADICTS THE TREND OF THE MOMENT!!!!!!!
Price Constrainment:
In our strategy, we also use “Price Constrainment” trades based on Price Action where Price is “constrained” by a Support/Resistance level. These “levels” can be either a Moving Average, a classical horizontal line of S/R, or (and this is the stronger of them) an area where Price is “constrained by one of the stronger moving averages, such as the 35 SMA or the 50 EMA. This also works with the “Round Numbers” levels very well and often indicates either a strong continuation trade, or an upcoming reversal signal.
The following images are where price is Constrained by either the 5, 10 or 50 EMAs. Pay specificattention to those areas in the images where the Moving Average constrainment is also accompanied byRound Number constrainment. Those areas of “constrainment confluence” and those around the 50 EMA are the strongest entries in the whole strategy we use here and the easiest to see.
Looking for “exhaustion bars” at areas of “constrainment is an extremely strong entry tactic. It allowsfor an entry with an extremely small Stop Loss, often less than 8 or 9 pips, and also indicates a strongmove in the direction of the constrainment that, as you can see is often good for 20 or more pips on themove. I am sure you can see just how powerful this “constrainment” type of entry is. The above

images show some trades where there were several of the very small “exhaustion” bars and any of them would have been a good entry point.
Additionally, often the candle will “wick off” of a “round number” and the body will be constrained by the Moving Average. Sometimes price will also “wick off” of a higher MA and the body be constrained by a lower MA. In both cases THAT IS CONFIRMATION IN ONE BAR of the momentum of the trade as a continuation trade. In some instances it also indicates a reversal area to watch for an entry. In these areas there will be times, as you get more experienced with this strategy and using the Moving Averages with the Round Numbers, where you will be able to enter on the “touch” of a level or a Moving average, further increasing the value of the trade.
That, however takes a bit of experience. At first, you should concentrate ONLY on “seeing” the tradesthat are “constrained” in a particular direction by a CONFLUENCE of the Moving Averages and theLevels as they are the strongest.
Often P/A like shown in this section is used more for finding exit points than entries in this strategy, especially if they happen at or very close to a Round Number. For the most part, stick to “Constrainment” and “Touch Traces,” you'll have a lot more success.
NOTE: All good constrainment trades have MORE than two and often more than three very small bars in the beginning of them! Look at the Sixth, Eighth and Ninth images in the image series above for both MA really strong “lower MA” constrainment trade entries. The others off the 50 are stronger, but sometimes a little more difficult to see for a beginner. “TOUCH TRADES” are ONLY taken if they happen with NO MORE than two bars to “get there.”

Chart Setup: Metatrader
In this strategy there is only ONE chart setup. Four Moving averages, a bar clock with spread, a clock to indicate market times and a “Round Numbers” indicator. There are three time frames used for each currency, two of them used only for confirmation of Trend and the M1 for fine tuning entries. The Moving Averages are for trend determination, as well as to indicate a floating level of Support and Resistance. The Round Numbers indicator places light lines on the chart to show areas of psychological importance for most traders and the Candle Timer is to help you in pinpointing the close of candles for entries. The 14 EMA, the 35 SMA and 50 EMA are use as floating Support and Resistance Levels and to show areas of “Constrainment,” “Confluence” points for S/R and Trend of the Moment for determining entries and exits.. The 200 EMA dictates whether you will be looking for long or short trades in this series of trades.
Adding any more to the charts will only serve to complicate the issue and open the door to confusion and additional opportunities for mistakes.
Below is an image of the Gbp/Usd chart and one from the Eur/Jpy from a normal day's trading. You can see that it quite literally is at the end of the chart, not cherry picked.
Notice how Price respects the round number levels as well as the stronger EMAs on the chart? It is especially apparent on the Eur/Jpy chart above. Most of the time, when you see a reversal, it happened at the 50 EMA, a confluence of Moving Averages or at one of the round number levels. The chart above is clear evidence of that. Price continually respected the 35/50 lines and the 200, up to the point of the reversal. You can also see where price reversed and re-tested the 1.54500 line “round number.”

This works on all time frames on all currencies, but for our purposes though, we will be referring exclusively to the M1 charts, these Moving Averages, and the “Round Number Levels.”
As you can see, with this strategy there are lots of opportunities to trade and to trade successfully.
Template Used: In this strategy includes template titled “The Dance.” Throw it on a chart and have fun. It really IS THAT SIMPLE. KEEP IT THAT WAY! Make sure you set the averages properly and add the 200 EMA as it is not part of the original template.
Don't go getting fancy with ANY other indicators, they just complicate things. If you want to draw the previous day's high resistance of low support that's fine, just don't clutter up the charts! BUT ESPECIALLY AVOID OSCILLATORS, the will lie to you waaaaaaay to often.
Indicators Used: 14 EMA, 35 SMA, 50 EMA and 200 EMA Moving Averages, Round Numbers Beige, Candle Time & Spread, Clock and NOTHING MORE!
DO NOT USE OSCILLATORS, they will only confuse you and cloud the Price Action signals given!

Taking The Trade!
M1 is not only a great chart to trade on, it's a fabulous teacher. If you miss a trade, be patient and you will get another shot in a little while! I have personally had days with several potential trades, watching only a couple of currencies.
The following M1 chart illustrates that exact point very well. The areas circled indicate potential trades over a two day period. Notice that trades around the 50 EMA/ 35 SMA Lines are particularly strong trades when they also are used WITH the trend, with constrainment or P/A bars!
Every area circled in the chart above indicates a perfect “by the rules” potential entry. Throw the template on a chart and scroll back. It should be as plain as the nose on your face how this strategy works. KEEP IT THIS SIMPLE, or don't trade!
Once you enter, move to BE as soon as possible without killing the trade. It will take some time and work to get good at this, but it's better to lose some at the beginning at BE + 1 than to take lots of losses. IF you do take losses, Not even one of them should be more than 11 or so pips, EVER!
Using Price Action, the 200 EMA and the 50 MA/ 35 SMA Lines, the 14 EMA and the Round Number levels to take “bounce” trades against is an extremely awesome strategy with lots of opportunities for trading, as you can see.

Finding entries on those days when price does what I call a “slow burn” in a very, very slow trending movement can be challenging to say the least. On those days, this strategy helps a lot. Look for high percentage entries against the stronger EMAs and then just stick with it as long as it does not reverse. Here are some trade potentials circled on an Eur/Jpy chart from the recent past.
Notice that as you gain experience, you will be able to take some “first touch” entries off the 50!
The second to last entry on the chart is a pure price action entry short. If you look at the chart closely, you can see other potential entries. I have merely indicated the more clear ones. Also, on M1, price action is much more important by “constrainment” than on other time frame charts. Watch it closely and learn to use it and you will find tons of entries you can take advantage of.

The Constrainment Trade
The Constrainment Trade can happen against any of the three Moving Averages in this Strategy. THE STRONGEST of them are always taken against the 200 EMA, or the 35 SMA when it and the 50 EMA are literally “on top” of each other and the 10 is on the side they are 'bending' toward. Usually Price will sort of “bounce along” the 35 for several bars, at least three before you take the trade. It can happen against the 14 EMA as well but these trades are a little “weaker” and you need to keep an eye on them until you get some pips locked in from one.
Constrainment trades often yield 30 to 100 pips or more, so be sure not to choke it out early. Below are some images taken from random areas of recent chart activity. If you scroll back you will see lots and lots of examples of this sort of constrainment where entries were not only possible, but where the trades also yielded large gains. Keep in mind that solid constrainment trades are not as common as “Touch” trades.
The AAA “Touch” Trade Entry“Touch Trades” are almost as strong as the “Constrainment” entries. They are a bit harder to “catch” as they can happen extremely quickly but the gains are normally really good and happen really fast. Remember in “Touch Trades” to pay STRICT attention to the TWO BAR RULE. If you don't, you'll get bit way more often that is necessary. Also remember that on “Touch” trades the SL is NEVER more than 11 pips.

Here are the criteria for strong “touch” trades.
14 EMA “Touch Trades” on M1 Charts:1. Must be at a “very steep” angle of about 45 degrees, or more. Less of an angle weakens the
trade.
2. NO MORE than two bars to “get there.”
3. Stop loss is NO MORE than 12 pips EVER.
4. Confluence of an H1 MA strengthens the signal.
35/ 50 Line “Touch Trades” on M1 Charts:1. A reasonably steep angle of about 20 degrees or more, OR both lines “on top” of each other.
Having both happen is very strong.
5. Stop loss is NO MORE than 12 pips EVER.
6. Confluence of an H1 MA strengthens the signal.
Below are some examples of the “Touch Trade” entries. This one is off the 35/50 lines when “on top” of each other.
A couple of these are off the 14 EMA when at a steep angle. Two of them are also confluence of 14

EMA and 200 EMA shorts.
The Touch Trade and the MT4 angle tool:
Using the “Angle Tool” in MT4 for “Touch Trades.”
In the “line studies” menu of MT4 there is a “trend-line by angle” tool that can be accesses as seen below.
When used on the charts, it creates a trend-line with an area where you can see the “angle” of the line like seen below.
You simply select the tool, then click the chart at the point where you want to start to measure the angle then drag it across the chart for a little bit so the lines and the angle appear. If it is an upward move, the angle will appear in a normal way but if it is a downward move, then you have to do a little mental math to get the angle.
In the example above, the angle on the chart is 311.7 degrees. Remembering there are 360 degrees in a circle, we then subtract this number from 360 to find that we have an angle of 48.3 degrees. This means that a “Touch” of the 35 at this point is more than likely a good short entry as a “touch trade.”
You would do precisely the same for the 50 EMA and the 14 EMA. Keep in mind the whole point is to “measure” the potential strength of a bounce from a “touch” and nothing more. Keep it simple. The sharper the angle, the stronger the trade. Under 20 degrees angle, I would probably pass on a 14 EMA Touch, and under 15 degrees on a 35/50 trade.
Once you let go of it it should stay highlighted so you can hit the “delete” button on the key boars and get rid of it. Once you have measured the angle, you don't need it anymore cluttering up your charts.

NOW, measure the line WHERE IT IS, not from where the move started or you will get a false reading on it's angle. If it has started to “flatten” out a bit, then measure from the last few bars where the “flattening” began.
Next let me show you how to “customize” your tool bar to you don't have to “hunt” for it when you need it.
Setting up the Toolbar:Right click on the tool bar and the menu to modify it appears. As seen here.

Select “Customize” from the list and this next window appears.
Highlight the “Trend-line by Angle” selection then when you click the “Insert” button it will move it to the right side of the list. At that point you can use the “up” of “Down” buttons to place it where you want it in the list so it will show up in the tool bar for easy access as seen below.
How To Let The Market “Show It's Hand”
Most who have traded even a little bit or researched a little bit have heard the term. “let the market show it's hand.” The supposition is that once that has happened, you can take a safe trade with this new information. I struggled for a long time trying to figure out just how this happens and what it means.

It's really pretty simple. Price Action is the best “indicator” of the direction the market will move. The previous section describes some, but by no means all of the ways that Price Action can be used to watch as the market “shows it's hand” so you can trade safely. Even with this arsenal of tools, sometimes, the market will “show it's hand” then just go the other way. It can be very, very schizophrenic at times.
Still, by using price action you can mitigate your risk on the entry extremely well. There are sections later that expand on this to a great degree, even an additional part of this manual that is about the “Three Main Trades” of the Dance Strategy.
Here is a short version of all this.
A Pin Bar, at the top or bottom of a very long run of price movement is a good way the market “shows it's hand” that price has exhausted itself. Often it is also preceded by progressively smaller bars in the direction of the movement. If price is also approaching a S/R level of a Round Number, or a place where Price reversed in the opposite direction previously, or one of the Moving Averages used here, those things ALL can be used to determine if the market is truly “showing it's hand” to the trader who is attentive.
When price is constrained by one or another Moving Average, Round Number, S/R level or a confluence of any of these, that is also how the Market “shows it's hand” to the trader.
Let's take an example. Let's say that price has just dropped 50 pips going short and then retraces a small amount, say 25 pips and in the Drop crossed either the 200 EMA or the 35/50 lines fairly sharply. You might not have had any warning and might have missed the entire move. NOW though, price is in a retrace and heads back to the 35/50 area. If it hits and starts to sort of “bounce along” one of these main averages, that constitutes constrainment and the market is demonstrating a resistance to going up any further. THIS IS ALL THE CONFIRMATION YOU NEED at this point.
After a couple to maybe 3 or 4 bars like this, if you have not already taken a trade back in the original direction of the movement of Price, (short if it was short, long if it was long) then you have probably already missed the best entry point. The market's inability to cross back through a Support or Resistance Level, whatever that may be, is the market “showing it's hand.” If you wait to long, it will more than likely, suddenly move 10 to 20 pips the way it was showing it's move would be, and you have missed the trade's best entry if you are not already in the trade.
The “Touch” trades described in this strategy are much the same. The market often will “hit” or “touch” a significant S/R level or moving average and then literally “RUN” away from it as much as 20 to 50 pips in just a few, often only two bars. If you are not expecting that to happen, you will miss it every time until you learn to trust the signal and use very short stop losses to take advantage of it.
Learn the Price Action bars in this strategy. Learn the power of the 200 EMA and the 35/50 lines, the Round Numbers and learn the power of more traditional S/R patterns as well. Things like double and triple tests, often called “double tops/ bottoms” or triple tops/ bottoms” at an area of S/R can be extremely powerful and often allow you to take basically the exact same trade a couple of times in a session for good pip gains.
The value of learning how price moves around the Moving Averages, Round Numbers and traditional S/R levels cannot be exaggerated. The more you can “see” them, trust what the market is telling you through them, the more successful and the wealthier you will become in trading.
In the rest of this manual we discuss the three main types of trades, we demonstrate what they look like in “real time” through the use of Screen captures at the point of the trade and just after at either the

move to BE, or the exit from the trade.
USE THE SIMULATOR A LOT and pay attention to the examples given and you will do really well. You may even surprise yourself and master this strategy a lot faster than you think.

Putting It All Together:
Screen “Setup” or “real estate” is very important in trading. One must be able to “see at a glance” whether or not a trade is imminent or not and the direction it most likely will go. Most computer screens are not large enough, and most systems to not allow for multiple monitors to allow one to see the charts in the best possible fashion.
This manual was created using a 17 inch monitor, which is pretty standard in today's world. Still, that is pretty small when you need to “see” several charts at a time. The answer to this dilemma is to “stack” the chart windows.
The following is a screen shot of our setup on Metatrader. You will notice that I only monitor three or four currencies at the moment. With a larger screen I would probably monitor more, but I want to see CLEARLY the setups.
HOWEVER, it is possible to trade only ONE currency and make great profits and become extremely successful. Never underestimate the power of simplicity in this area as well! Learning the “personality” of a currency is amazingly powerful as well.
You will notice that this setup leaves room for access to the “Scripts” area of Metatrader. I have discovered that using Scripts to trade with is much faster, more flexible, and in short a lot easier to do.

Entering a trade is as simple as dragging the appropriate script (buy or sell) to the chart you want to execute an order on and letting it drop. The execution should be a LOT faster than using the normal MT Order interface. You could also just click on the chart you want to execute on then double click the script you want to execute. That works even faster.
The Scripts for Buy and Sell orders, have preset SL and TP levels. These scripts access a global variable previously set by the A_SetLotSize script. I suggest setting your trade/risk % once per session at the beginning. That will automatically increment your trades for a bit more aggressive compounding without running the risks of “instant compounding” while trading.
There are other scripts for moving both by simply dragging the appropriate Script to the appropriate chart and dropping it.
The SL or TP scripts will move your SL or TP to the exact spot on the chart where you drop it.
There is even a BE Script for moving to Break Even to mitigate Risk in a trade. We talk about the Scripts later.

A Word About WicksWicks on candles are used lots of ways in all sorts of Strategies. In “The Dance” we use them only for immediate S/R levels from the immediate past two or three days. Longer than that just messes up the charts. Using wicks to set both exit levels and entry levels can be pretty powerful. Just don't get too carried away with them and keep them simple and your charts clean or it gets confusing.
If there are lots of wicks on M1, then move to M15 or use the H1 chart to find the levels you need. If H1 is too “choppy” with too many wicks, use D1. I seriously doubt D1 will ever have “too many” to mess with you.
Below is a chart that shows what I am talking about. There is one from M1, some marked on H1 chart and even a series of them marked on D1 just for emphasis. Trade these like a “normal” S/R Level, when they “get there” take the trade and give it no more than a 19 pip SL. IF they stall within a couple of pips, take them and wait with your SL like you would normally use it.
I don't recommend trading “chop” but as in the chart below where there are clear S/R levels, VERY close to the Round Numbers areas it can be acceptable to take the reverse trade “as if” it touched on a second candle. Just be sure you use a long enough Stop Loss so you don't get taken out in the entry candle.
Enjoy!
Stay OUT!

As with all strategies, there are areas to avoid at all costs. As simple as this may sound, it will vastly increase your profitability and success rate.
1. NEVER TRADE a price action bar by it's self! There MUST be some sort of other reason for the trade such as the bar occurring at a Support or Resistance Level, a “Round Number,” as a bounce off of a Moving Average as a constrainment trade in a counter trend trade ONLY after price has traveled a significant distance away from the 50 and both turned below and retested a lower MA.
2. NEVER FORCE a trade, wait patiently for the “perfect” setups found in this manual.3. NEVER TRADE if you are not 100% “sure” of the trade. But at the same time, don't let fear
stop your trading, you must trade, just be 100% “sure” the trade fits the rules before you do.4. Lastly, NEVER TRADE THE PORCUPINE! The “Porcupine” is an area of price activity
where the price bars have lots of wicks on both sides of them, and those wicks are “significant” in size, meaning more than just a few pips. The “Porcupine” is demonstrated in the examples of “Stay OUT” following this area of definition.
Fakeouts occur often in Forex Trading but there are ways to mitigate them. First, DON'T LET PRICE FOOL YOU! Here are a few examples of what I mean.
REMEMBER, I no longer use the M5, the line colors have changed and I no longer use the purple MA.
In the above chart, the last area in the box is where lots of “fake outs” happen. Things may look good, but any entry in these areas would violate the rules and leave you vulnerable to indecision and many other bad things such as reversals that are too fast, extremely wide SL settings and more.
Avoiding the bad trades is just as important as making the good ones. If you are not “sure” of the trade, STAY OUT and wait for a better setup.

Trade & Risk Management
Risk Management:
Risk is a personal thing and it should be. No one can assess risk the same way you do and no one should. There are many who say never to risk more than 2% on a trade, some say 3% and I have seen traders use as high as 20% on a trade. It all depends on your confidence level and how much you can afford to lose if you do.
Personally, trading with 2 to 2% risk PER POSITION is acceptable to me. What that means is that if I take a position in one currency, usually it's no more than a 3% risk for that currency. Sometimes, I take two positions in a currency and that means that each position is 3% or 6% total risk. Sometimes, I see really good trades in multiple currencies and I can mitigate risk by taking a single position in more than one currency. As long as each position is no more than 2 to 3%, I am personally fine with it.
My suggestion is that you trade with no more than 2% per position to start learning and ONLY one currency when you start. You need some time to learn to trade The Dance and to learn the specific currency you choose. All currencies have a slightly different “personality” because slightly different traders overall trade them.
Trade Management:
Trade management is NOT the same as “risk” management though it can greatly affect and either reduce or increase the risk of your trading. For example, if you trade one lot, or one position, then you need to have a way of trading that allows you to “lock in” as far as that is possible, some pips early on and then try to “let it run” after that. It can be done, but with one position it's a bit harder and some brokers will not let you “scale” out after the entry thus “locking in” some pips early on by actually taking them OFF the table when you do this.
The BEST way, in my humble opinion is to take two positions with less risk each when trading and exit the first position at some point where you have made a solid gain, then move the SL to BE and let the last position “run” and trail the SL “by the rules.” to maximize the last position and your trade.
The scripts included in this strategy will open TWO positions each with 1.5% risk for a total of 3% overall. The first position will have a “take profit” set for +15 pips and the second one for about 100, which you can increase with other TP script if it's really “running” hard your way.
DO NOT change this while you are learning. Taking some of the pips early is EXTREMELY powerful. It all but guarantees winning trades, IF you follow the rules to the letter, AND mitigates or eliminates most of the risk of the trades taken. In addition, it allow you to “let it run” as you have heard so many times and probably struggles with as I did early on.
I never really could figure out how to “let it run” and it always seemed to end up going against me. THIS SOLVES all that. It eliminates, for the most part the possibility it will go against you once you are in profits, AND it allows a 100 pip “breathing space” for the trade to run toward so you can learn to
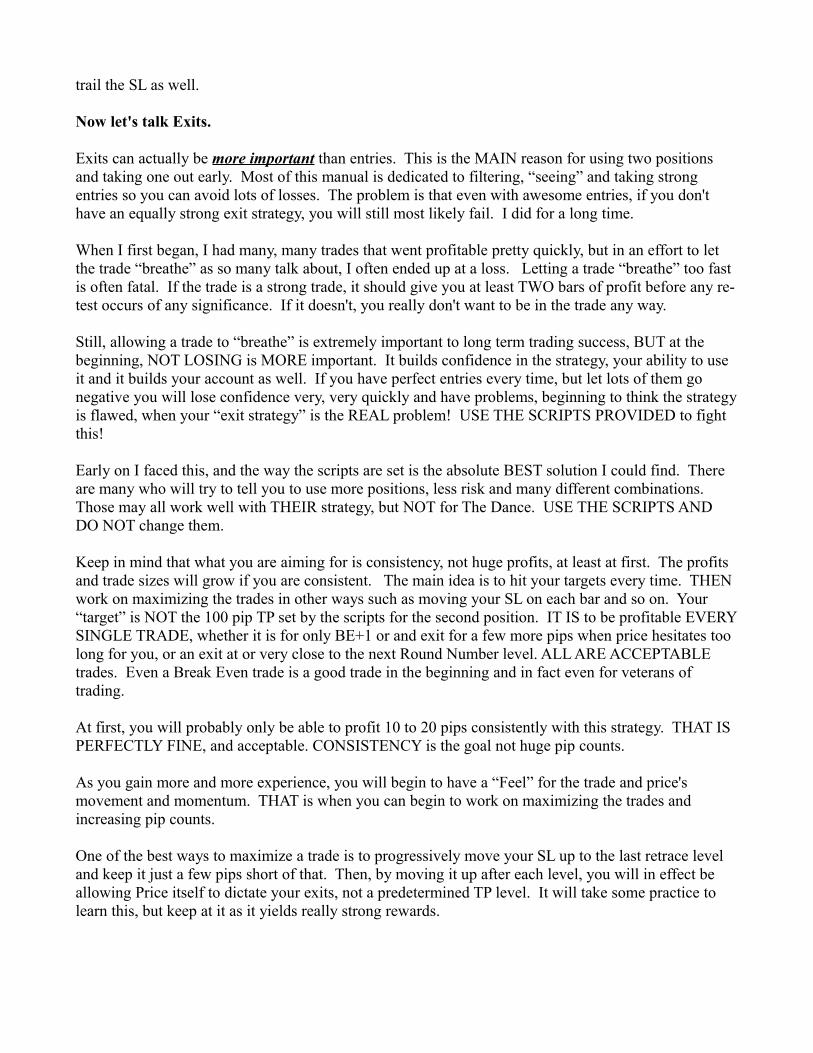
trail the SL as well.
Now let's talk Exits.
Exits can actually be more important than entries. This is the MAIN reason for using two positions and taking one out early. Most of this manual is dedicated to filtering, “seeing” and taking strong entries so you can avoid lots of losses. The problem is that even with awesome entries, if you don't have an equally strong exit strategy, you will still most likely fail. I did for a long time.
When I first began, I had many, many trades that went profitable pretty quickly, but in an effort to let the trade “breathe” as so many talk about, I often ended up at a loss. Letting a trade “breathe” too fast is often fatal. If the trade is a strong trade, it should give you at least TWO bars of profit before any re-test occurs of any significance. If it doesn't, you really don't want to be in the trade any way.
Still, allowing a trade to “breathe” is extremely important to long term trading success, BUT at the beginning, NOT LOSING is MORE important. It builds confidence in the strategy, your ability to use it and it builds your account as well. If you have perfect entries every time, but let lots of them go negative you will lose confidence very, very quickly and have problems, beginning to think the strategy is flawed, when your “exit strategy” is the REAL problem! USE THE SCRIPTS PROVIDED to fight this!
Early on I faced this, and the way the scripts are set is the absolute BEST solution I could find. There are many who will try to tell you to use more positions, less risk and many different combinations. Those may all work well with THEIR strategy, but NOT for The Dance. USE THE SCRIPTS AND DO NOT change them.
Keep in mind that what you are aiming for is consistency, not huge profits, at least at first. The profits and trade sizes will grow if you are consistent. The main idea is to hit your targets every time. THEN work on maximizing the trades in other ways such as moving your SL on each bar and so on. Your “target” is NOT the 100 pip TP set by the scripts for the second position. IT IS to be profitable EVERY SINGLE TRADE, whether it is for only BE+1 or and exit for a few more pips when price hesitates too long for you, or an exit at or very close to the next Round Number level. ALL ARE ACCEPTABLE trades. Even a Break Even trade is a good trade in the beginning and in fact even for veterans of trading.
At first, you will probably only be able to profit 10 to 20 pips consistently with this strategy. THAT IS PERFECTLY FINE, and acceptable. CONSISTENCY is the goal not huge pip counts.
As you gain more and more experience, you will begin to have a “Feel” for the trade and price's movement and momentum. THAT is when you can begin to work on maximizing the trades and increasing pip counts.
One of the best ways to maximize a trade is to progressively move your SL up to the last retrace level and keep it just a few pips short of that. Then, by moving it up after each level, you will in effect be allowing Price itself to dictate your exits, not a predetermined TP level. It will take some practice to learn this, but keep at it as it yields really strong rewards.

NOW, TRAIN YOURSELF TO IGNORE THE $$ IN THE TRADE and your account. FOCUS ON PIPS instead. There are a great many who will argue vehemently that you absolutely, positively must pay attention to the % of risk each trade, the total of the trade and in your account, your exposure and on and on and on. That's all CRAP unless you can first become consistent in your trading. Without consistency, you will never have anything to manage! Besides, using the Scripts described later, you can manage risk really, really well and easily too.
SO, if you really want to grow your new business account and have lots of “inventory” to work with, FOCUS ON GOOD ENTRIES, STRONG EXITS and PIPS ONLY AND EXCLUSIVELY. Let the Scripts do the work of Risk Management for you so you can focus on other things.
Once you are used to focusing on the number of pips, the stress of the $$ fairly disappears. Then you are left with either gaining or losing a few pips, nothing more or less monumental than the points in a video game. THAT is the mindset you absolutely MUST nurture and master to become successful. The more “boring” this becomes, the more successful you will be.
If your trading is more like dancing, or playing a video game to you, the stress and “fear” that so often kills others will have zero affect on you. You will become immune to it and it will become much easier to focus on the actual trading strategy, the price action, and improving your skills.
Exits are acceptable at any point you are in profits. If you have carefully chosen a strong entry, moving to BE +1 fairly quickly, say after about 15 pips or so shouldn't even have any effect on the trade. If you are consistently being stopped at that level, re-read this manual, use the Simulator and fine tune your entries some more.
With the entries mastered, begin mastering the exits next. The more skilled you become at maximizing the trades to preserve the pips already gained, in the trade on the first position and learning to maximize the second position, the faster your account will grow.
That's it. Keep it simple and learn to be consistent FIRST, then move on to longer trades, more positions and staying in to maximize the trade.
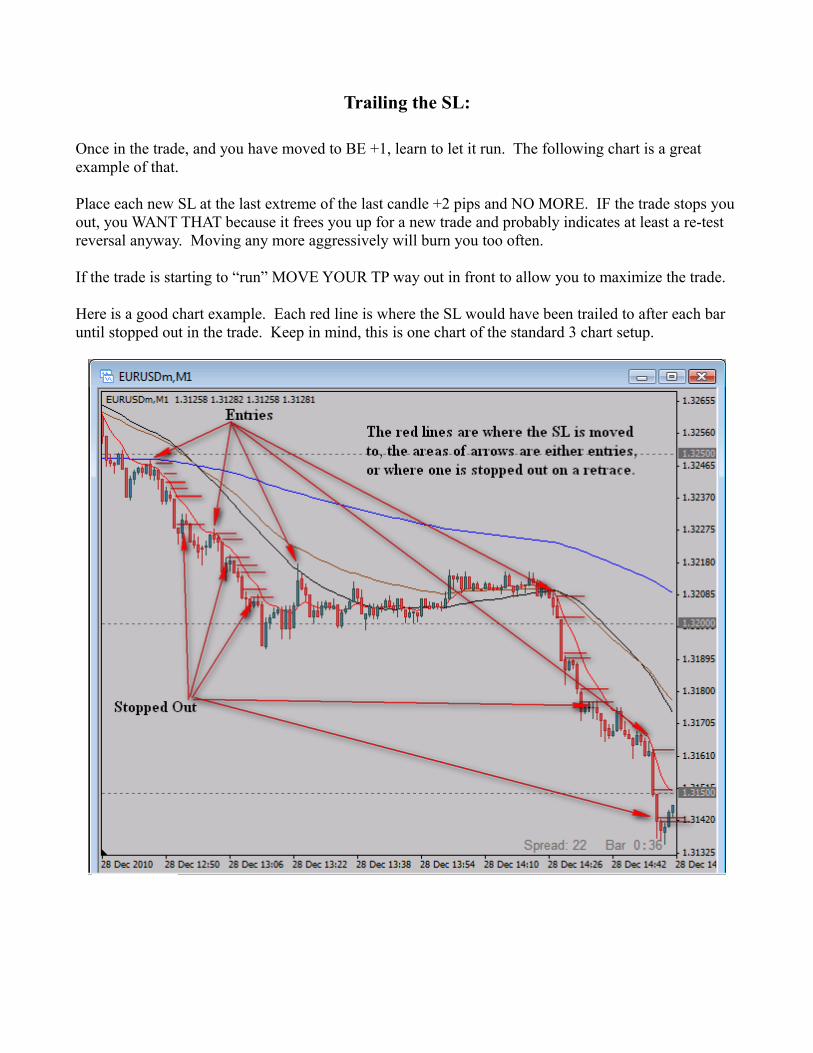
Trailing the SL:
Once in the trade, and you have moved to BE +1, learn to let it run. The following chart is a great example of that.
Place each new SL at the last extreme of the last candle +2 pips and NO MORE. IF the trade stops you out, you WANT THAT because it frees you up for a new trade and probably indicates at least a re-test reversal anyway. Moving any more aggressively will burn you too often.
If the trade is starting to “run” MOVE YOUR TP way out in front to allow you to maximize the trade.
Here is a good chart example. Each red line is where the SL would have been trailed to after each bar until stopped out in the trade. Keep in mind, this is one chart of the standard 3 chart setup.

Setting Up The Charts
1. Find your Metatrader installation on your hard drive.2. Find the Profiles folder and drop in the entire folder titled “The Dance” in it.. 3. Find your Indicators and Scripts folders under “Expert Advisers” and drop the indicators in the
appropriate indicators folder, and the Scripts in the appropriate Scripts folder.4. Find your Templates folder under Expert Advisers and top the included template “The Dance”
in it.5. Start Metatrader and apply the new Profile “The Dance.” Everything should look exactly like
this manual now.
If it doesn't, youtube.com has some great videos and this link on FF might help as well.
http://www.forexfactory.com/showthread.php?t=67529
Here is a short tutorial on it as well.
Right click your “home” button, then select “Explore” from the menu
In the next window that opens find your “Programs” folder, click on the icon next to it and expand it. As seen here. Then in the right window, scroll down to your Metatrader installation. For me that is an IBFX folder. Yours might have the name of your broker on it or it might just have “Metatrader” on it.
Once you find it, click it and expand it.

Once expanded, you will then see folders from Metatrader in the right window. Find “Profiles” and double click it to expand it as well. This is the folder the included profile “The Dance” is dropped into as seen here below.

Expanded view of “Profiles” is below.

Next is to find, click and expand the Templates folder in the left window. Then place the included template “The Dance” in it. Once you have placed the Profile and the Template correctly, then in the left window find and expand “Experts” and in the right window you will then see the Scripts, Indicators folders. Place the scripts and indicators included in the zip file this came in, in those folders and start Metatrader.
If you get the error message “Waiting for Update” in the chart window, just open the “Market Watch” are of your platform and drag the appropriate currency to the proper charts and they will update immediately. This was done with a Standard Account, so if you use a Mini, micro or some other designation from your broker, this error may occur. The solution is explained in the next section.
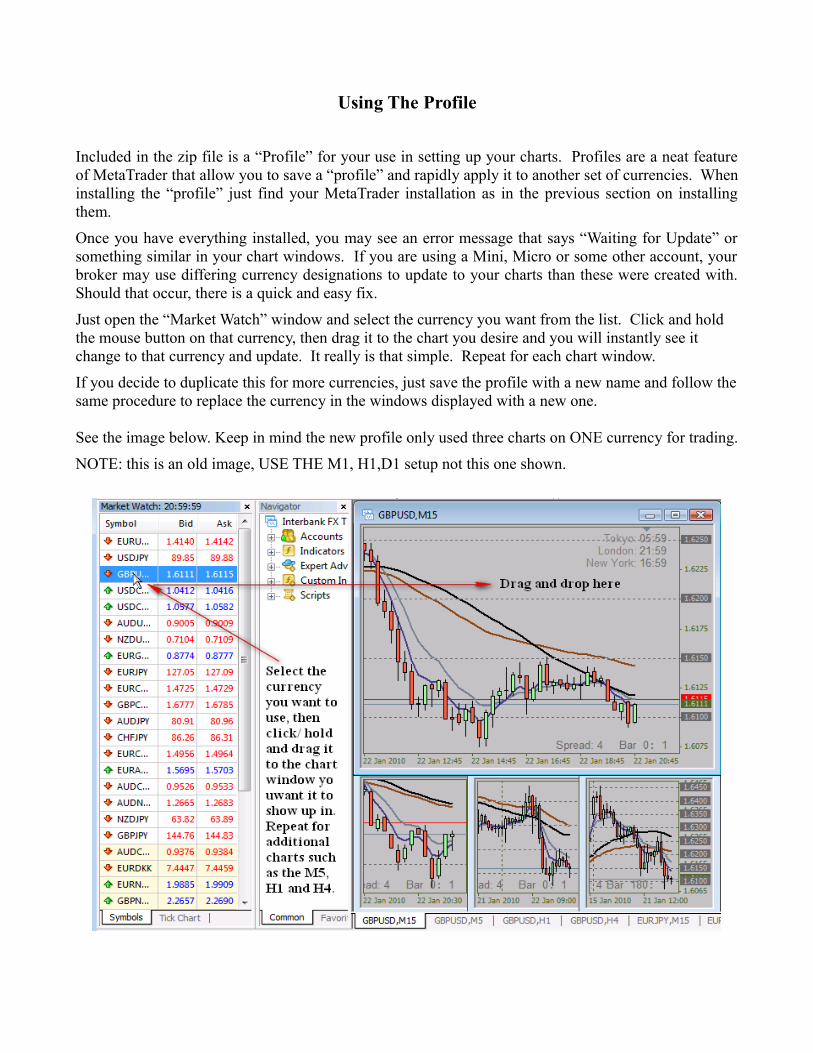
Using The Profile
Included in the zip file is a “Profile” for your use in setting up your charts. Profiles are a neat feature of MetaTrader that allow you to save a “profile” and rapidly apply it to another set of currencies. When installing the “profile” just find your MetaTrader installation as in the previous section on installing them.
Once you have everything installed, you may see an error message that says “Waiting for Update” or something similar in your chart windows. If you are using a Mini, Micro or some other account, your broker may use differing currency designations to update to your charts than these were created with. Should that occur, there is a quick and easy fix.
Just open the “Market Watch” window and select the currency you want from the list. Click and hold the mouse button on that currency, then drag it to the chart you desire and you will instantly see it change to that currency and update. It really is that simple. Repeat for each chart window.
If you decide to duplicate this for more currencies, just save the profile with a new name and follow the same procedure to replace the currency in the windows displayed with a new one.
See the image below. Keep in mind the new profile only used three charts on ONE currency for trading.
NOTE: this is an old image, USE THE M1, H1,D1 setup not this one shown.

Using The Scripts Several “Scripts” are included in this strategy. The intent of these Scripts is to make trading much simpler, quicker and easier to do. PRACTICE IN DEMO before using them so you know what you are doing with them !!!
The Scripts are as listed below. NOTE: Using the “one currency” setup you may simply “double click” the scripts instead of dragging and dropping if you like.
• A_SetLotSize: This script sets the size of Lots you will be trading for each session. IT MUST BE SET FIRST for each session or the next two scripts which execute a buy and a sell WILL NOT work. It is used to set the Lot size based on the account balance and the Stop Loss you choose to use. It is pre-set to a 15 Pip SL but when clicked launches a pop up you can use to change the risk and the SL setting if you want to. That is not recommended.
• A_Buy: This Script executes a single order buy simply by dropping it on the chart. It is preset to enter TWO positions with a SL of 12 pips on each with a TP of 15 and a 100 pips respectively. Once executed you should may decrease the SL if you have the experience to do so. The settings on the first TP is HARD, DO NOT change it. The SL an the second TP are only to give you time to think about where to set it, but still have them in place.
• A_Sell: This Script executes a single order Sell simply by dropping it on the chart. It is preset to enter TWO positions with a SL of 12 pips on each with a TP of 15 and a 100 pips respectively. Once executed you should may decrease the SL if you have the experience to do so. The settings on the first TP is HARD, DO NOT change it. The SL an the second TP are only to give you time to think about where to set it, but still have them in place.
• AClose First 1Pair: This script will close the first open order on a single chart. Simply drag it on the chart and drop it. Thanks to FF's Swingman for the script.
• AClose All 1Pair: This script will close ALL open orders on a single chart. Simply drag it on the chart and drop it. Thanks to FF's Swingman for the script
• AEMERGENCYCloseAll: This Script will close ALL positions on ALL currencies immediately.
• ATP Set-Move: This Script will set or move ALL the Target Profit lines on a specific chart. Simply drag and drop it on the desired chart. If no TP is present, it will create one. Use this to change the TP on a trade.
• ASL Set-Move: This Script will set or move ALL the Stop Loss lines on a specific chart. Simply drag and drop it on the desired chart. If no SL is present, it will create one. Use this to change the SL on a trade.
• Break Even SL: Will move ALL stops to Break Even on a specific chart. Drag and drop on the chart you want.

MAKE SURE YOU HAVE ENABLED BOTH “EXPERT ADVISERS” AND “ALLOW LIVE TRADING” in the “Experts” tab of the “Options” pop up found under “Tools” in the top Menu of your platform. Click “Tools,” then “Options.”
Then enable the boxes shown below.
NOTE: If you have a five digit broker or one that uses more, you MUST open the scripts and add a “0” to the SL and TP setting or the scripts will not execute for you.
SETTING THE STOP LOSS: the purpose of setting the SL to 19 in the scripts is that on Gbp/Usd and Eur/Jpy with 4 pip spreads one needs a bit more “room.” If you decide to trade others, like the Eur/Usd you should drop it immediately to as little as possible with the ASL script. Also, often, once you are a bit more skilled, you may often drop the SL to as little as 7 or 9 pips on an entry even on Gbp/Usd and Eur/Jpy. This 19 pip setting will also allow you to set it where you want it after entry, but avoid you being stopped out prematurely on a price swing within the entry candle.
The other reason for using 19 is that the Risk of each trade is determined by the number of pips use for

the SL in the A_SetLotSize script, which is 15. You will need to decrease the SL almost immediately on entry, but this setting allows you to earn more per trade, while keeping extremely low risk exposure on each trade. The smaller the SL you can learn to manage a trade with, the smaller your risk will be IF you leave the 15 pip in the A_SetLotSize script that sets the trade sizes.
Modifying the Scripts:
First, go to Tools -> MetaQutoes Language Editor and click the link as seen here
Once the Editor opens click “scripts” and find the buy and sell scripts “A_Buy” and “A_Sell.” One at a time, double click then and make the following changes.

Next page please.
Once one of them is open, modify this setting in each.

Once you have done that, then find the “compile” button and click it to activate the new settings and close the editor. YOU MUST CLICK COMPILE OR THEY WILL NOT CHANGE!
If you have special needs or problems, time to do some research and learning on your own for this.