Embed Size (px)
Citation preview
THE SIGNIFICANCE OF RELIGION ON HEALTH FACTORS RELATED TO AGING AMONG AMERICAN ADULTS USING THE NATIONAL SURVEY OF MIDLIFE DEVELOPMENT IN THE UNITED STATES
by
Jeffrey L. Jozwiak
BS, University of Michigan, 1993
MS, University of Pittsburgh, 1995
Submitted to the Graduate Faculty of
Graduate School of Public Health in partial fulliment
of the requirements for the degree of
Doctor of Public Health
University of Pittsburgh
2007
UNIVERISITY OF PITTSBURGH
Graduate School of Public Health
This dissertation was presented
by
Jeffrey L. Jozwiak
It was defended on
August 30, 2007
and approved by
Dissertation Advisor: Ravi K. Sharma, PhD, Assistant Professor,
Department of Behavioral Community Health Sciences Graduate School of Public Health
University of Pittsburgh
Committee Member: Kenneth J. Jaros, PhD, Assistant Professor
Department of Behavioral Community Health Sciences Graduate School of Public Health
University of Pittsburgh
Committee Member: Jonathon Erlen, PhD, Faculty Librarian
Falk Library of the Health Sciences University of Pittsburgh
Committee Member:
Valerie J.M. Watzlaf, PhD, RHIA, FAHIMA, Associate Professor Department of Health Information Management
School of Health and Rehabilitation Sciences University of Pittsburgh
ii
Copyright © by Jeffrey L. Jozwiak, MS, RN, NHA 2007
iii
Ravi K. Sharma, Ph.D.
THE SIGNIFICANCE OF RELIGION ON HEALTH AND BEHAVIOR FACTORS RELATED TO AGING AMONG AMERICAN ADULTS USING THE NATIONAL
SURVEY OF MIDLIFE DEVELOPMENT IN THE UNITED STATES
Jeffrey L. Jozwiak, Dr PH
University of Pittsburgh, 2007
Abstract There is a substantial body of evidence that demonstrates an association between
religiosity and health outcomes in adults of all ages. Many studies have demonstrated that
factors such as religious importance and service attendance may provide social vehicles for
factors such as increased access to health care, better management of chronic diseases, and
increased availability to preventive health services and education. These religious factors may
also influence the way in which a person perceives and copes with his or her health issues.
Successful aging theory is a combination of three factors or characteristics: low risk of
disease and disease-related disability, high mental and physical function, and active engagement
with life. This theory allows for a more holistic approach to aging and health.
The overall goal of this observational study using quantitative data from the 1994/95
National Survey of Midlife Development in the United States (MIDUS) was to analyze whether
any statistically significant relationships exist between religiosity defined as religious devotion,
importance, influence, and service attendance and the three factors of successful aging. The
results demonstrated significant relationships between all religiosity variables and active
engagement in life. Other statistically significant findings were discovered with the factors: self
iv
physical and mental health rating, times in the hospital, routine visits to the doctor, and certain
religiosity variables. Many of the findings still existed when analyzed across demographic co-
variants. Finally, the use of a theoretical model and logistic regression demonstrated that active
engagement in life may be a bridge variable between successful aging health outcomes and
service attendance.
The results don’t show more religion means healthier, but that religion can play an
intricate role in an individual’s own health. The public health relevance of the study is to make
public health professionals aware of the relationships that exist between religiosity and
successful aging health outcomes. Religious venues may provide a good resource for preventive
health services and education. Most importantly, a person’s religious beliefs may affect the way
a person deals with physical or mental illness. Public health professionals should embrace the
religious beliefs of patients regardless of their own beliefs.
v
TABLE OF CONTENTS 1.0 INTRODUCTION……………………………………………...............................................1 2.0 BACKGROUND LITERATURE...........................................................................................3 2.1 UNITED STATES AGING POPULATION AND SIGNIFICANT PUBLIC HEALTH ISSUES…………………………………..3 2.1.1 CURRENT AND FUTURE POPULATION NUMBERS……………….3 2.1.2 ECONOMICS……………………………………………………………...6 2.1.3 HEALTH STATUS………………………………………………………...7 2.1.4 HEALTH CARE………………………………………………………….13 2.2 RELIGION AND THE PUBLIC HEALTH MEANING………………………...15 2.2.1 RESEARCH DEFINITION OF RELIGION…………………………...17 2.2.2 ANALYTICAL MODELS USED FOR RESEARCH ON RELIOGION AND HEALTH…………………………………………19 2.2.3 POPULATION OF ORGANIZED RELIGIOUS PRACTICE………..20 2.3 RELATIONSHIP BETWEEN RELIGION AND AGING………………………22 2.4 RESEARCH ON RELIGION, HEALTH OUTCOMES, AND AGING……………………………………………………………………24 2.4.1 RESEARCH ON RELIGION AND MENTAL HEALTH…………….24 2.4.2 RESEARCH ON RELIGION AND PHYSICAL HEALTH…………..26 2.5 THEORY OF SUCCESSFUL AGING……………………………………………29
vi
3.0 RESEARCH DESIGN, PROBLEM STATEMENT, METHODS………………………………………………………...................................30 3.1 STUDY POPULATION……………………………………………………………31 3.1.1 THE NATIONAL SURVEY OF MIDLIFE DEVELOPMENT IN THE UNITED STATES………………………31 3.1.2 DESCRIPTION AND DEMOGRAPHICS OF STUDY POPULATION……………………………………………31 3.2 STUDY VARIABLES………………………………………………………………32 3.2.1 RELIGIOSITY MEASURES……………………………………………34 3.2.2 SUCCESSFUL AGING…………………………………………………..37 3.3 PROBLEM STATEMENT………………………………………………………...38 3.4 THEORETICAL MODEL…………………………………………………………39 3.5 ANALYSIS STRATEGY…………………………………………………………..40 4.0 ANALYSIS, DISCUSSION, AND CONCLUSION FROM RESULTS………………………………………………………………………42 4.1 DATA ANALYSIS………………………………………………………………….42 4.1.1 ANALYSIS OVERALL………………………………………………….42 4.1.2 ANALYSIS BY AGE, SEX, RACE, EDUCATION, AND MARRIAGE……………………………………………………...46 4.1.3 THEORECTICAL MODEL ANALYSIS………………………………53 4.2 DISCUSSION, SUMMARY, AND CONCLUSIONS………………………………………………………………..71 APPENDIX A: FREQUENCY COMPARISONS OF HEALTH RELIGIOSITY VARIABLES……………………………………………………….75 BIBLIOGRAPHY………………………………………………………………………………82
vii
LIST OF TABLES
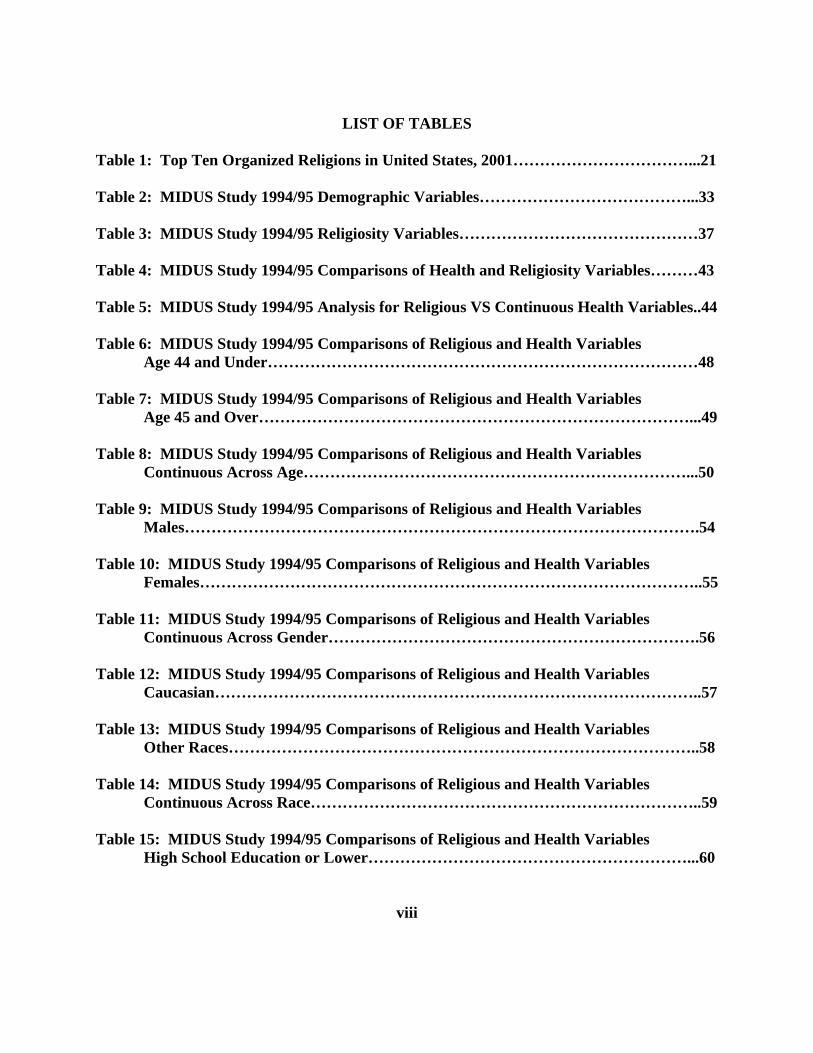
Table 1: Top Ten Organized Religions in United States, 2001……………………………...21 Table 2: MIDUS Study 1994/95 Demographic Variables…………………………………...33 Table 3: MIDUS Study 1994/95 Religiosity Variables………………………………………37 Table 4: MIDUS Study 1994/95 Comparisons of Health and Religiosity Variables………43 Table 5: MIDUS Study 1994/95 Analysis for Religious VS Continuous Health Variables..44 Table 6: MIDUS Study 1994/95 Comparisons of Religious and Health Variables Age 44 and Under………………………………………………………………………48 Table 7: MIDUS Study 1994/95 Comparisons of Religious and Health Variables Age 45 and Over………………………………………………………………………...49 Table 8: MIDUS Study 1994/95 Comparisons of Religious and Health Variables Continuous Across Age………………………………………………………………...50 Table 9: MIDUS Study 1994/95 Comparisons of Religious and Health Variables Males…………………………………………………………………………………….54 Table 10: MIDUS Study 1994/95 Comparisons of Religious and Health Variables Females…………………………………………………………………………………..55 Table 11: MIDUS Study 1994/95 Comparisons of Religious and Health Variables Continuous Across Gender…………………………………………………………….56 Table 12: MIDUS Study 1994/95 Comparisons of Religious and Health Variables Caucasian………………………………………………………………………………..57 Table 13: MIDUS Study 1994/95 Comparisons of Religious and Health Variables Other Races……………………………………………………………………………..58 Table 14: MIDUS Study 1994/95 Comparisons of Religious and Health Variables Continuous Across Race………………………………………………………………..59 Table 15: MIDUS Study 1994/95 Comparisons of Religious and Health Variables High School Education or Lower……………………………………………………...60
viii

Table 16: MIDUS Study 1994/95 Comparisons of Religious and Health Variables Above High School Education…………………………………………………………61 Table 17: MIDUS Study 1994/95 Comparisons of Religious and Health Variables Continuous Across Education………………………………………………………….62 Table 18: MIDUS Study 1994/95 Comparisons of Religious and Health Variables Married………………………………………………………………………………….63 Table 19: MIDUS Study 1994/95 Comparisons of Religious and Health Variables Not Married……………………………………………………………………………..64 Table 20: MIDUS Study 1994/95 Comparisons of Religious and Health Variables Continuous Across Marriage…………………………………………………………..65 Tables 21: MIDUS Study 1994/95 Odds Ratio Analysis of Religiosity and Active Engagement in Life vs. Selected High Mental and Physical Function Variables…..68 Table 22: MIDUS Study 1994/95 Odds Ratio Analysis of Religiosity and Active Engagement in Life vs. Selected Low Risk of Disease and Disease-Related Disability Variables……………………………………………………………………..69 Table 23: MIDUS Study 1994/95 Odds Ratio Analysis of Religiosity and Active Engagement in Life vs. Selected Health Variables with Age………………………...70 APPENDIX A: MIDUS STUDY 1994/95 Comparisons of Health and Religiosity Variables: Table 1: Active Engagement in Life 1.1 Religious Salience………………………………………………………………..….76 1.2 Service Attendance………………………………………………………………….77 1.3 Decisions Based of Religion (Religious Influence)……………………………..…77 Table 2: High Mental and Physical Function 2.1 Religious Salience…………………………………………………………………...78 2.2 Service Attendance……………………………………………………………….....78 2.3 Decisions Based of Religion (Religious Influence)………………………………..79
ix
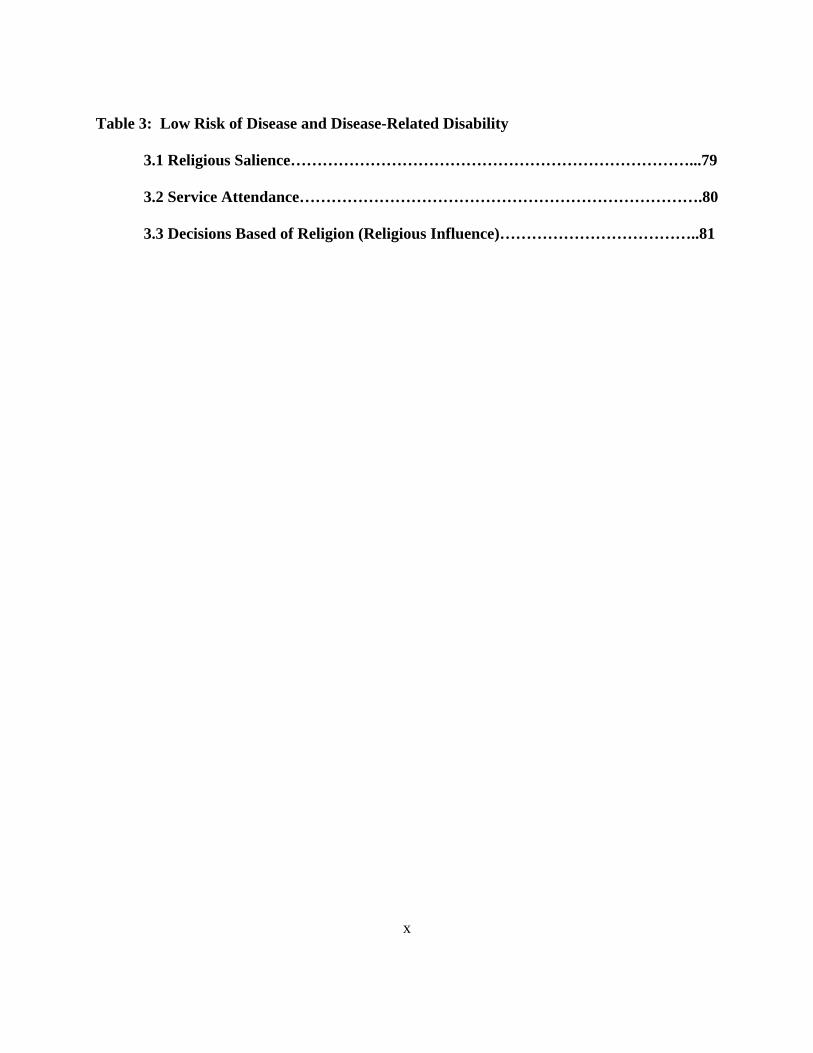
Table 3: Low Risk of Disease and Disease-Related Disability 3.1 Religious Salience…………………………………………………………………...79 3.2 Service Attendance………………………………………………………………….80 3.3 Decisions Based of Religion (Religious Influence)………………………………..81
x
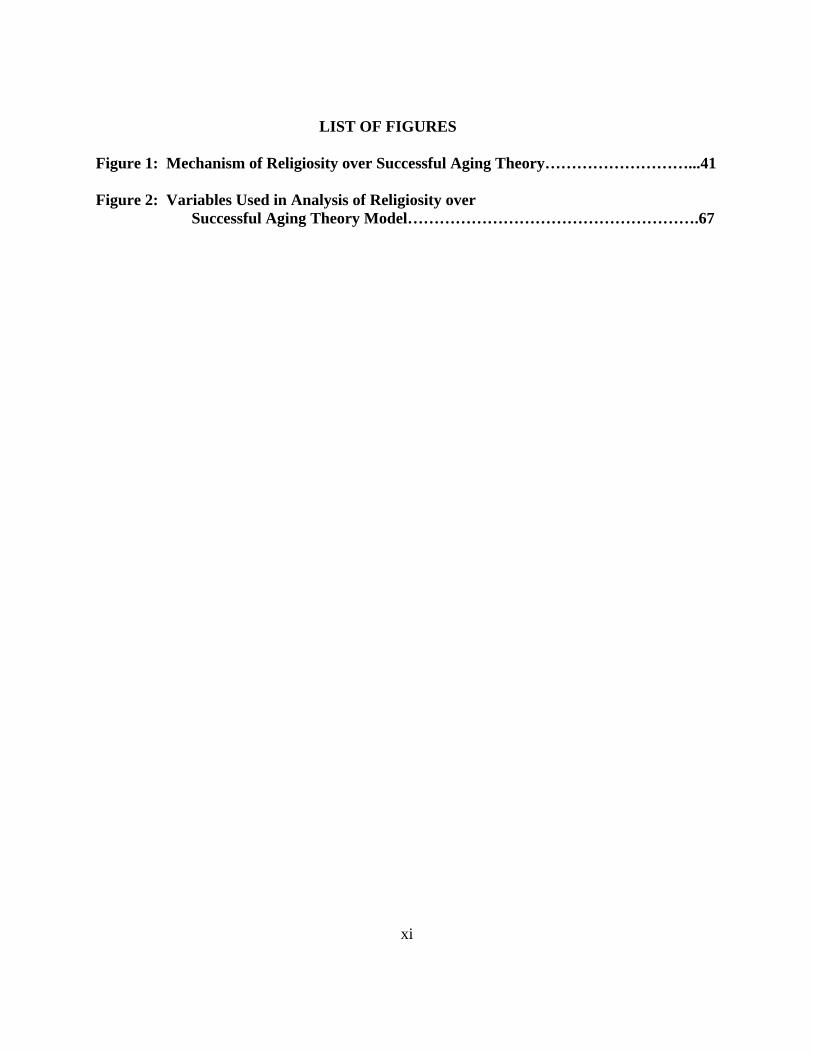
LIST OF FIGURES Figure 1: Mechanism of Religiosity over Successful Aging Theory………………………...41 Figure 2: Variables Used in Analysis of Religiosity over Successful Aging Theory Model……………………………………………….67
xi
1.0 INTRODUCTION On January 30, 2001, President Bush unveiled a plan to dramatically expand the role of
religious organizations in social programs, sending Congress a proposal to open all federal grant
programs to religious groups (NCOA, 2001). This idea brings up some very important issues
(other than the separation of church and state) about the part that religion plays in our society. Its
importance and impact on civilization have been evident throughout history.
Since the beginning of mankind, humans have searched for ways to explain the meaning
of their own existence. A superior power that guides life is often given credit as to why we are
part of the world. The belief in a “God” or “Gods” controlling everything from the weather to
romance has been a common thread of historical civilizations and is widespread even today.
Recent Gallup surveys indicate that 96% of Americans believe in God or a universal spirit, 90%
pray, and 43% attend church weekly or more often (Princeton Religion Research Center, 1996).
This information demonstrates that religion is a universal part of society.
Religion is humanity’s tendency to seek to maximize the meaning and value of our life-
experience by aligning that life-experience with a higher or deeper reality, with “an unseen
order” that somehow transcends ordinary human existence (Kirkland, 2001). This alignment can
serve to integrate diverse aspects of our lives (individually or collectively), and to imbue our
lives with a sense of purpose or direction (Kirkland, 2001). From this general tendency,
religious values (guidelines for thought and action) develop into practices and beliefs.
These religious beliefs and practices may impact on physical and mental health, on the
meaning that illness has for persons, and on decisions that people make about their health care
1
(Koenig, 1997). For many elders, religious faith is a durable source of hope, meaning, and
purpose, particularly during difficult times (Koenig et al., 1998). An increasing number of
studies have reported that those who are more religious experience greater well-being (Ellison,
1991) and life satisfaction (Ellison et al., 1989), less depression (Kendler et al., 1997), less
anxiety (Koenig et al., 1993), cope better with stress (Pargament, 1997), and are less likely to
commit suicide (Martin, 1984). This information and the significant role that experts believe
religion plays in society proves that it is important for public health researchers to analyze the
impact of religion on health outcomes especially through middle to late adulthood.
This dissertation will investigate any significant existing relationships between religiosity
and successful aging. Its goal will be accomplished in two parts. First, there will be a review of
the literature including the following: 1) a description of America’s aging population and the
associated public health issues; 2) a review of religion and what this term means for the purposes
of public health analysis; 3) the relationship that exists between religion and aging; 4) a review
of research that links religion and health outcomes (both mental and physical); 5) a description of
successful aging theory. Second, an observational study using secondary data will determine if
any statistically significant relationship exists between religiosity and successful aging. Upon
conclusion, the dissertation will further solidify a documented religion and health outcomes
relationship which occurs as an individual ages from young adulthood to death and discuss both
the clinical and policy implications of the determined results.
2
2.0 BACKGROUND LITERATURE 2.1 United States Aging Population and Significant Public Health Issues: Many researchers and experts refer to a current phenomenon known as the “Graying of
America”. Americans over the age of 65 years old are becoming an increasing larger and
powerful force. As we prepare to enter the twenty-first century, previously unimagined numbers
of people are growing to be very old in America (Kahn & Rowe, 1999). It is estimated that in the
forty-five hundred years from the Bronze Age to the year 1900, life expectancy increased
twenty-seven years, and that in the short period from 1900 to 1990 it increased by at least that
much. The changes have been so dramatic that it is currently estimated that of all the human
beings who have ever lived to be sixty-five years or older, half are currently alive (Kahn &
Rowe, 1999). Also with the “Baby-Boom” generation moving into this age group, this trend is
likely to continue through the year 2050. This section will describe the current and future
population numbers, economics, health status, and health care of these older Americans. It is
important to look at the older population in America for this dissertation, because the possible
impact that religion can have across the lifespan will affect individuals the most during the later
years of their life. In addition, the specific public health issues posed by this segment of the
population will be identified and discussed throughout.
2.1.1 Current and Future Population Numbers
In 2000, there are estimated 35 million people ages 65 or older in the United States,
accounting for almost 13 percent of the total population (Aging Stats, 2000). This means that
3
about one out of every eight Americans is over the age of 65 years. The number of older
Americans has increased by 3.7 million or 12.0% since 1990. However, the number of
Americans aged 45-64 – who will reach 65 over the next two decades – increased by 34% during
this period (AOA & U.S. Census Bureau, 2001& 2000). In 2011, the “Baby Boom” generation
will begin to turn 65, and by 2030, it is projected that one in five people will be age 65 or older.
The size of the older population is projected to double over the next 30 years, growing to 70
million by 2030 (Aging Stats, 2000).
The population age 85 and older is currently the fastest growing segment of the older
population. In 2000, an estimated 2 percent of the population is age 85 or older (Aging Stats,
2000). By 2050, this segment could account for about 4.8 percent of the total population (U.S.
Census Bureau, 2000). While centenarians were rare in 1900, their numbers swelled to 32,000
by 1982, 61,000 today, and it is projected that by the middle of the next century, there will by
over 600,000 individuals in the United States over the age of 100. Four out of centenarians are
women (Kahn & Rowe, 1999). The size of this age group is especially important for the future
of our health care system, because these individuals tend to be in poorer health and require more
services than younger old.
As the older American population is growing larger, it is also rapidly becoming more
racially diverse. About 16.4% of persons 65+ were minorities in 2000 with the following
representation: 5.6% Hispanic origin, 8.0% African American, 2.4% Asian or Pacific Islander,
and less than 1% American Indian or Native Alaskan. In addition, 0.8% of persons 65+
identified themselves as being of two or more races (AOA & U.S. Census Bureau, 2001 &
2000). By 2050, the percentage of the older population that is non-Hispanic white is expected to
4
decline from 84% to 64%. Hispanic persons are projected to account for 16 % of the older
population; 12 % of the population is projected to be non-Hispanic black; and 7% of the
population is projected to be non-Hispanic Asian and Pacific Islander. However, the Hispanic
older population is expected to increase the most rapidly of all racial and ethic groups. Hispanics
are projected to increase in total number from 2 million in 2000 to over 13 million by 2050
outnumbering African Americans by the year 2028 (Aging Stats, 2000). This means that public
health initiatives for older Americans in the future will have to consider larger and more racially
diverse populations.
Some other important population characteristics of older Americans that can affect public
health are martial status, educational attainment, and living arrangements. In 2000, older men
(74%) were much more likely to married than older women (43%). Almost half of all older
women (45%) were widows compared with 14% of older men (AOA & U.S. Census Bureau,
2001). This is due to a combination of factors, including sex differences in life expectancy
(discussed later), the tendency of women to marry men who are slightly older, and higher
remarriage rates for older widowed men than widowed women (Saluter & Lugaila, 1998).
Divorced and separated older persons represented only 8% of all older persons in 2000; however,
their numbers have been steadily increasing over the last couple of years (AOA & U.S. Census
Bureau, 2001). Educational attainment plays an important role in socioeconomic status and the
well-being of seniors. In 1950, only 18 percent of older Americans finished high school;
however, about 67 percent of people aged 65 or older had completed high school in 1998 (Day &
Curry, 1998). The percentage of this population with a college degree is increasing also, but
there still exists substantial educational differences between men, women, ethic, and racial
5
groups. Like marital status, the living arrangements of seniors are important because they are
closely linked to income, health status, and the availability of caregivers. Over half (55%) of
older non-institutionalized persons lived with their spouse in 2000. The proportion living with
spouse decreased with age, especially for women. Only 28.8% of women 75+ years old lived
with a spouse. About 30% (9.7 million) of this population lived alone in 2000. They represented
40% of older women and 17% of older men. The proportion living alone increases with
advanced age. Among women aged 75 and over, for example, half (49.4%) lived alone (AOA &
U.S. Census Bureau, 2001).
2.1.2 Economics
When considering economics, poverty is an important measure. About 3.4 million
elderly persons (10.2%) were below the poverty level in 2000, which is not much different from
the level reached in 1999. Another 2.2 million or 6.7% of the elderly were classified as “near-
poor” (income between the poverty level and 125% of this level). One of every twelve (8.9%)
elderly Whites was poor in 2000, compared to 22.3% of elderly African Americans and 18.8% of
elderly Hispanics (U.S. Census Bureau, 2001). Also, poverty rates seemed to increase with the
following factors among elderly: living in the central city, living in rural areas, living in the
South, being female, and living alone. Overall, the highest poverty rates (38.8%) were
experienced by older Hispanic women who lived alone or with nonrelatives in 2000 (U.S.
Census Bureau, 2001).
The median income of older persons in 2000 was $19,168 for males and $10,899 for
females. Households containing families headed by persons 65+ reported a median income in
6
2000 of $32,854 ($33,467 for Whites, $27,952 for African-Americans, and $24,330 for
Hispanics) (U.S. Census Bureau, 2001). However, a total of 37.2% of Americans over 65 years
old fell into the low income, poverty, and extreme poverty groups (26.8%, 8.1%, and 2.3%
respectively) in 1998 (Aging Stats, 2000). This statistic indicates that a significant proportion of
the older population has minimal income.
Sources of income are another important economic factor. In 1998, Social Security
benefits provided about two-fifths of the income for older Americans; and asset income,
pensions, and personal earnings each accounted for about one-fifth of the total income. For older
Americans in the lowest fifth of income distribution, Social Security plays a large role
accounting for 82% of income; and public assistance provides another 10% (SSA, 2000). Older
Americans in higher income distribution groups have diverse sources of money with asset
income and earnings accounting each for about 30% of the total income. Finally, people tend to
rely more on Social Security and asset income as they reach the over 85 years old category (SSA,
2000). This information demonstrates the important role Social Security plays in the income of
the older Americans.
2.1.3 Health Status
There are several indicators of health status in the American older population. Each of
these factors impact health outcomes and the delivery of health care services.
Life expectancy, mortality, chronic health conditions, memory impairment, depressive
symptoms, self-rated health statues, and disability are the factors listed below with a brief
description.
7

• Life Expectancy: Americans are living longer now than ever before. Life
expectancy has increased from 49 years in 1900 to 70 years in 1960. Currently in
1997, life expectancy at birth was 79 years for women and 74 years for men
(Aging Stats, 2000). More than 70 percent of people now live to the traditional
retirement are of 65 years old, nearly three times as man as did so at the century
(Kahn & Rowe, 1999). The well-known but still unexplained difference in life
expectancy of men and women continues; however, women live on average 7
years longer than men. There are also striking and disturbing racial differences in
life expectancy. Caucasian women on average, live 6 years longer than women of
African-American descent, and Caucasian men live about 8 years longer than
African-American men (Kahn & Rowe, 1999). Also, the life expectancy for
Americans at the ages of 65 years old and 85 years old has increased. Americans
that reach the age of 65 are expected to live an additional 18 years, and men and
women that reach the age of 85 are expected to live an additional 7 years and 6
years respectively (Aging Stats, 2000). This
information indicates that through public health improves older adults are living
longer and will comprise a larger part of our total population.
• Mortality: As expected with increases in life expectancy, the overall death rates
in the U.S. population have decreased over the last century. The mortality,
however, for some diseases has increased specifically chronic conditions. In
1997, the leading cause of death among persons age 65 or older was heart disease
(1,832 deaths per 100,000 persons), followed by cancer (1,133 per 100,000),
8
stroke (426 per 100,000), chronic obstructive pulmonary diseases (281 per
100,000), pneumonia and influenza (237 per 100,000), and diabetes (141 per
100,000). Among persons age 85 or older, heart disease was responsible for 40%
of all deaths (National Center for Health Statistics, 1999). Although there are
significant differences in these mortality rates when compared on the basis of sex
and race, this information demonstrates that the older population is suffering from
increasing chronic conditions over a longer period that require more health care
and service utilization.
• Chronic Health Conditions: Chronic conditions such as arthritis, diabetes, and
heart disease negatively affect quality of life, contributing to declines in
functioning and the inability to remain in the community (CDC, 1997). Five of
the six leading causes of death among older Americans are chronic diseases. In
1995, about 58 percent of persons age 70 or older reported having arthritis, 45
percent reported having hypertension, and 21 percent reported having heart
disease. Other chronic diseases included cancer (19 percent), diabetes (12
percent), and stroke (9 percent). About 64 percent of older women reported
having arthritis, 48 percent reported having hypertension, and 19 percent reported
having heart disease. Older men were less likely to report having arthritis (50
percent) and hypertension (41 percent), but were more likely to report having
heart disease (25 percent). Men were also more likely to have had cancer (23
percent), compared with women (17 percent) (SOA, 1987 & SOA II, 1995). The
prevalence of chronic conditions also varies by race and ethnicity in the older
9

population. In 1995, 67 percent of non-Hispanic black persons, 58 percent of non-
Hispanic white persons, and 50 percent of Hispanic persons reported arthritis.
Non-Hispanic black persons were also more likely to report having diabetes,
stroke, and hypertension than either non-Hispanic white persons or Hispanic
persons. Cancer was reported by 21 percent of non-Hispanic white persons,
compared with 9 percent of non-Hispanic black persons, and 11 percent of
Hispanic persons (SOA, 1987 & SOA II, 1995). This data indicates that the
management of chronic conditions in older adults is becoming an increasingly
important issue in public health. Also, the prevalence differences on the basis of
ethnicity and race leads to issues of culture and belief when treating chronic
conditions.
• Memory Impairment: The prevalence of moderate or severe memory
impairment is slightly lower among older women than among older men. In 1998,
memory impairment occurred among 35 percent of women age 85 or older,
compared with 37 percent of men in the same age group. In 1998, the percentage
of older adults with moderate or severe memory impairment ranged from about 4
percent among persons ages 65 to 69 to about 36 percent among persons age 85 or
older (HRS, 1998). The loss of memory is an important health factor because low
cognitive functioning is a risk factor for increased health service needs and
entering a nursing home.
• Depressive Symptoms: Higher levels of depressive symptoms are associated
with higher rates of physical illness, greater functional disability, and higher
10
health care resource utilization (Wells, Stewart, Hays, Burman, Rogers, Berry,
Greenfield, & Ware, 1989). In 1998, about 15 percent of persons ages 65 to 69,
70 to 74, and 75 to 79 had severe symptoms of depression, compared with 21
percent of persons ages 80 to 84, and 23 percent of persons age 85 or older (HRS,
1998). This information indicates that a significant proportion of the U.S. older
population suffers from depressive symptoms. Because of this factors influence
on all other aspects of the health, it is an important issue.
• Self-Rated Health Status: This factor represents physical, emotional, and social
aspects of health and well-being. Good to excellent self-reported health correlates
with lower risk of morality (Idler & Benyanini, 1997). During the period 1994 to
1996, 72 percent of older Americans reported their health as good, very good, or
excellent. Women and men reported comparable levels of health status. Positive
health evaluations decline with age. Among non-Hispanic white men ages 65 to
74, 76 percent reported good to excellent health, compared with 67 percent among
non-Hispanic white men age 85 or older. A similar decline with age was reported
by non-Hispanic black and Hispanic older men, and by women, with the
exception of non-Hispanic black women. Among older men and women in every
age group, non-Hispanic black and Hispanic persons were less likely to report
good health than non-Hispanic white persons (NHIS, 1998). This factor can be an
important indication of health care utilization and the extent to which an older
adult is dealing with the onset of a chronic condition.
• Disability: Disability is one of the best functional measures of health status.
Illness, chronic disease, and injuries can limit both mental and physical abilities.
11
Increased disability usually leads to more health care service utilization. In 1998,
among those 65-74 years old, 28.8 percent reported a limitation caused by a
chronic condition. In contrast, over half (50.6%) of those 75 years and over
reported they were limited by chronic conditions (U.S. Census & National Center
for Health Statistics, 2001). In 1997, more than half of the older population
(54.5%) reported having at least one disability of some type (physical or
nonphysical). Over a third (37.7%) reported at least one severe disability. Over
4.5 million (14.2%) had difficulty in carrying out activities of daily living (ADLs)
and 6.9 million (21.6%) reported difficulties with instrumental activities of daily
living (IADLs) (U.S. Census & National Center for Health Statistics, 2001).
Also, disability increases with age. Almost three-fourths (73.6%) of those aged
80+ report at least one disability. Over half (57.6%) of those aged 80+ had one or
more severe disabilities and 34.9% of the 80+ population reported needing
assistance as a result of disability (U.S. Census & National Center for Health
Statistics, 2001). This information indicates that disabilities affect a significant
proportion of the older population.
All this information on health status illustrates some trends in the older population. Older
Americans are living longer, increasing in number, and suffering from more chronic conditions.
Also, memory impairment, depressive symptoms, and disability become increasing prevalent
with age. This means that the older populations more than ever before require increased health
services. Increased consumption of services and chronic health problems for older Americans
12
has created a need for public health professionals to look for other factors such as religion that
can have a positive impact on health status. However, these needs do not develop overnight and
are the accumulation of how an individual lives their life from adulthood to death.
2.1.4 Health Care
For the reasons discussed above, the complexity and amount of health care required is
becoming increasing larger. This statement is demonstrated using several indicators of health
care that will be discussed below. The first indicator is the overall health care expenditures.
Health costs incurred on average by older consumers in 1999 consisted of $1554 (51%) for
insurance, $706 (23%) for drugs, $601 (20%) for medical services, and $158 (5%) for medical
supplies (U.S. Census & National Center for Health Statistics, 2001). Also, increasing years of
age usually indicates increased health care expenditures. In 1996, the average annual
expenditure on health care was $5,864 among persons ages 65 to 69, compared with $9,414
among persons ages 75 to 79, and $16,465 among persons age 85 or older (MCBS, 1996).
Another important indicator is the type of health care services using by older Americans.
The majority of older adults have access to health care through Medicare, which provides a
variety of services. Older people had about four times the number of days of hospitalization (1.6
days) as did the under 65 aged population (0.4 days) in 1999. The average length of a hospital
stay was 6.0 days for older people, compared to only 4.1 days for people under 65. The average
length of stay for older people has decreased 6 days since 1964. Older persons averaged more
contacts with doctors in 1999 than did persons of all ages (6.8 contacts vs. 3.5 contacts) (U.S.
Census & National Center for Health Statistics, 2001). In addition, use of home health services
13
increased substantially from 2,141 home health visits per 1,000 enrollees in 1990 to 8,227 visits
per 1,000 in 1997. Home health care use increased during this period in part because of an
expansion in the coverage criteria for the Medicare home health benefit. However, home health
visits from Medicare claims dropped to 5,058 per 1,000 beneficiaries, following implementation
of the Balanced Budget Act, which changed Medicare payment policies for home health care
services in 1998 (Posial & Chulis, 2000). This information demonstrates that older adults use a
variety of health care services.
Even though all older adults use health services, there were differences in access to health
care by race. In 1996, the percentage of older Americans who reported delays due to cost was
highest among non-Hispanic black persons (10 percent), followed by Hispanic persons (7
percent), and non-Hispanic white persons (5 percent). About 2 percent of non-Hispanic white
persons reported difficulty in obtaining health care, compared with 4 percent of non-Hispanic
black persons and 3 percent of Hispanic persons (MCBS, 1996).
Another important factor of health care besides the total expenditure and access data is
out-of-pocket expense. This expense is the portion that seniors must pay that is not covered by
Medicare, health insurance, etc. In 1999, older consumers averaged $3,019 in out-of-pocket
health care expenditures, an increase of more than a third since 1990. In contrast, the total
population spent considerably less, averaging $1,959 in out-of-pocket costs. Older Americans
spent 11%of their total expenditures on health, more than twice the proportion spent by all
consumers (5%). Health costs incurred on average by older consumers in 1999 consisted of
$1554 (51%) for insurance, $706 (23%) for drugs, $601 (20%) for medical services, and $158
14
(5%) for medical supplies (U.S. Census & National Center for Health Statistics, 2001). This
data illustrates that interventions or factors, which reduce total health care expenditure, can help
the individual senior by reducing the amount that they have to pay out-of-pocket.
In conclusion, older Americans are living longer and increasing in numbers. A
significant proportion of their income is from Social Security and their health care from
Medicare. The information above demonstrates that many seniors live alone, have a low income,
and have significant disability, memory impairment, and depressive symptoms. There are
several differences in both race and sex. However, many older Americas require health services
for the treatment of chronic conditions, which require significant expenditures. This need for
health services is also affected throughout adult life by factors like the number of times an
individual is in the hospital or visits the doctor for routine care. In order to reduce health care
expenditures and assist seniors with management of their chronic conditions, public health
professionals need to investigate other factors that can influence health outcomes such as religion
throughout the lifespan.
2.2 Religion and the Public Health Meaning Religion is defined in Webster’s New World Dictionary as the belief in and worship of
a God or gods (Webster’s, 1990). However, this term means more than just a belief for the
majority of the population. Religion in many cases is both a philosophy and a way of life. As
stated in the introduction, the definition is much more elaborate.
“Religion” is not mere intellectual assent to certain propositions about the nature of
life. Rather, it involves what people do in their lives: “religion” has been called
15
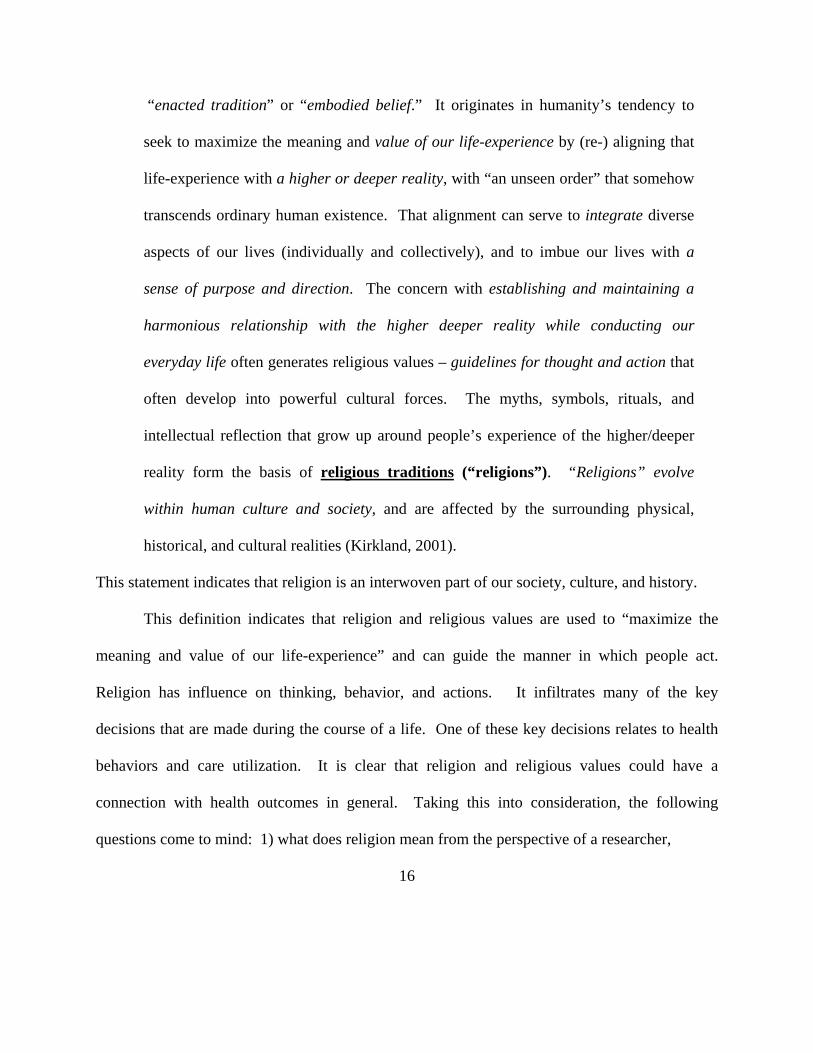
“enacted tradition” or “embodied belief.” It originates in humanity’s tendency to
seek to maximize the meaning and value of our life-experience by (re-) aligning that
life-experience with a higher or deeper reality, with “an unseen order” that somehow
transcends ordinary human existence. That alignment can serve to integrate diverse
aspects of our lives (individually and collectively), and to imbue our lives with a
sense of purpose and direction. The concern with establishing and maintaining a
harmonious relationship with the higher deeper reality while conducting our
everyday life often generates religious values – guidelines for thought and action that
often develop into powerful cultural forces. The myths, symbols, rituals, and
intellectual reflection that grow up around people’s experience of the higher/deeper
reality form the basis of religious traditions (“religions”). “Religions” evolve
within human culture and society, and are affected by the surrounding physical,
historical, and cultural realities (Kirkland, 2001).
This statement indicates that religion is an interwoven part of our society, culture, and history.
This definition indicates that religion and religious values are used to “maximize the
meaning and value of our life-experience” and can guide the manner in which people act.
Religion has influence on thinking, behavior, and actions. It infiltrates many of the key
decisions that are made during the course of a life. One of these key decisions relates to health
behaviors and care utilization. It is clear that religion and religious values could have a
connection with health outcomes in general. Taking this into consideration, the following
questions come to mind: 1) what does religion mean from the perspective of a researcher,
16
2) what are some analytic models that can be used for research on religion and health, and 3)
does enough of the United States population participate in organized religion to make it a
important factor of public health?
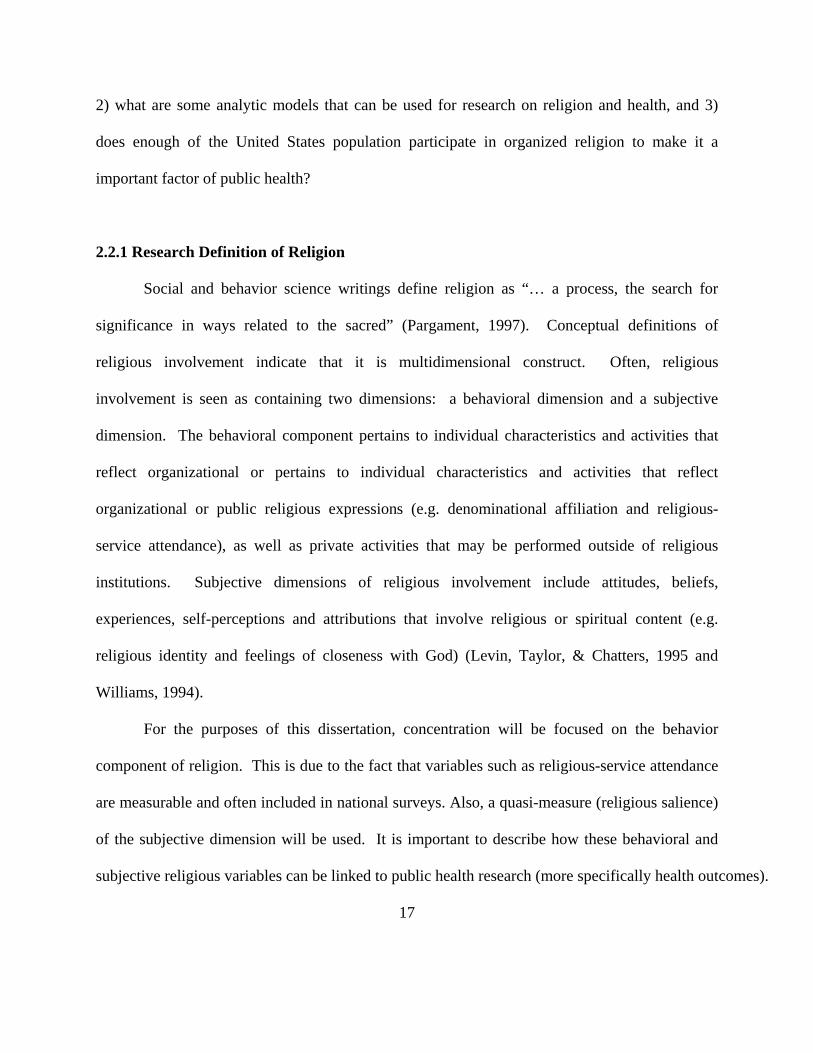
2.2.1 Research Definition of Religion
Social and behavior science writings define religion as “… a process, the search for
significance in ways related to the sacred” (Pargament, 1997). Conceptual definitions of
religious involvement indicate that it is multidimensional construct. Often, religious
involvement is seen as containing two dimensions: a behavioral dimension and a subjective
dimension. The behavioral component pertains to individual characteristics and activities that
reflect organizational or pertains to individual characteristics and activities that reflect
organizational or public religious expressions (e.g. denominational affiliation and religious-
service attendance), as well as private activities that may be performed outside of religious
institutions. Subjective dimensions of religious involvement include attitudes, beliefs,
experiences, self-perceptions and attributions that involve religious or spiritual content (e.g.
religious identity and feelings of closeness with God) (Levin, Taylor, & Chatters, 1995 and
Williams, 1994).
For the purposes of this dissertation, concentration will be focused on the behavior
component of religion. This is due to the fact that variables such as religious-service attendance
are measurable and often included in national surveys. Also, a quasi-measure (religious salience)
of the subjective dimension will be used. It is important to describe how these behavioral and
subjective religious variables can be linked to public health research (more specifically health outcomes).
17
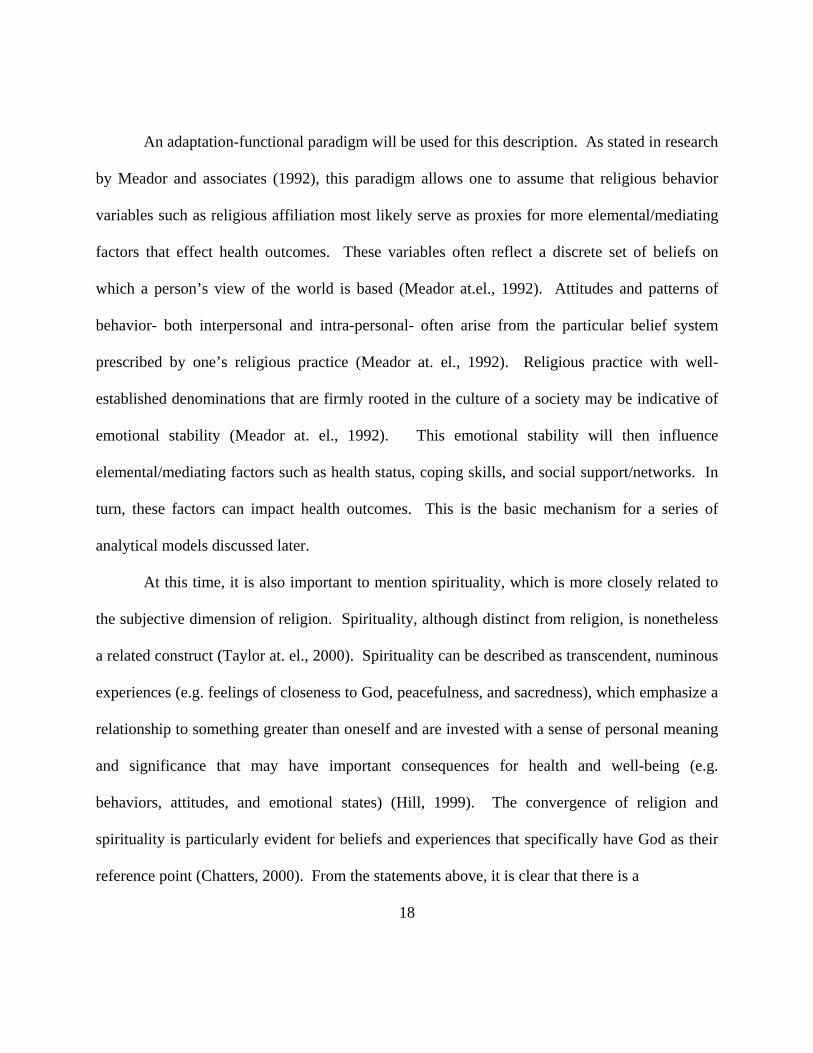
An adaptation-functional paradigm will be used for this description. As stated in research
by Meador and associates (1992), this paradigm allows one to assume that religious behavior
variables such as religious affiliation most likely serve as proxies for more elemental/mediating
factors that effect health outcomes. These variables often reflect a discrete set of beliefs on
which a person’s view of the world is based (Meador at.el., 1992). Attitudes and patterns of
behavior- both interpersonal and intra-personal- often arise from the particular belief system
prescribed by one’s religious practice (Meador at. el., 1992). Religious practice with well-
established denominations that are firmly rooted in the culture of a society may be indicative of
emotional stability (Meador at. el., 1992). This emotional stability will then influence
elemental/mediating factors such as health status, coping skills, and social support/networks. In
turn, these factors can impact health outcomes. This is the basic mechanism for a series of
analytical models discussed later.
At this time, it is also important to mention spirituality, which is more closely related to
the subjective dimension of religion. Spirituality, although distinct from religion, is nonetheless
a related construct (Taylor at. el., 2000). Spirituality can be described as transcendent, numinous
experiences (e.g. feelings of closeness to God, peacefulness, and sacredness), which emphasize a
relationship to something greater than oneself and are invested with a sense of personal meaning
and significance that may have important consequences for health and well-being (e.g.
behaviors, attitudes, and emotional states) (Hill, 1999). The convergence of religion and
spirituality is particularly evident for beliefs and experiences that specifically have God as their
reference point (Chatters, 2000). From the statements above, it is clear that there is a
18
relationship between spirituality, behavioral, and subjective dimensions of religion. The
influence that religion has on health outcomes involves an interwoven participation of these three
concepts.
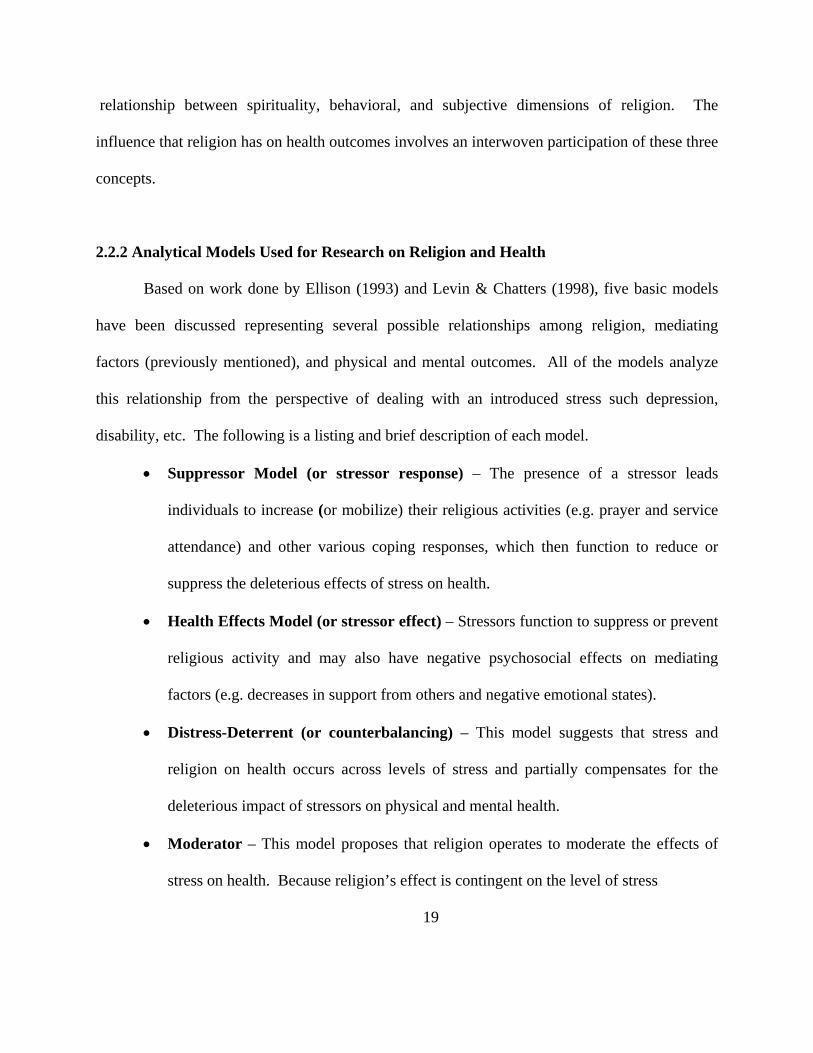
2.2.2 Analytical Models Used for Research on Religion and Health
Based on work done by Ellison (1993) and Levin & Chatters (1998), five basic models
have been discussed representing several possible relationships among religion, mediating
factors (previously mentioned), and physical and mental outcomes. All of the models analyze
this relationship from the perspective of dealing with an introduced stress such depression,
disability, etc. The following is a listing and brief description of each model.
• Suppressor Model (or stressor response) – The presence of a stressor leads
individuals to increase (or mobilize) their religious activities (e.g. prayer and service
attendance) and other various coping responses, which then function to reduce or
suppress the deleterious effects of stress on health.
• Health Effects Model (or stressor effect) – Stressors function to suppress or prevent
religious activity and may also have negative psychosocial effects on mediating
factors (e.g. decreases in support from others and negative emotional states).
• Distress-Deterrent (or counterbalancing) – This model suggests that stress and
religion on health occurs across levels of stress and partially compensates for the
deleterious impact of stressors on physical and mental health.
• Moderator – This model proposes that religion operates to moderate the effects of
stress on health. Because religion’s effect is contingent on the level of stress
19
experienced, it may be particularly useful for individuals who are experiencing
significant stress (e.g. stress derived from health problems).
• Prevention – This model suggests that religion has both direct and indirect protective
effects on health. Religious involvement benefits health indirectly by its influence for
positive lifestyle and health behaviors that result in reductions in risk for particular
health conditions (e.g. via healthy diets), as well as lower exposure to stressful
circumstances (e.g. interpersonal conflicts). In addition, various aspects of religious
involvement may benefit health directly, for example, stress-reducing aspects of
religious devotion and prayer.
Although these models describe the positive relationships between religious involvement and
health, it is important to mention that this relationship can also be a negative one. Some
religious practices in denominations such as the belief that only God heals not modern medicine
can be detrimental to health. Now that there is a workable definition of religion and models that
describe the relationship between religious involvement and health, it is time to determine
whether or not there are enough people involved in organized religion to justify its study in the
public health arena.
2.2.3 Population of Organized Religious Practice
This dissertation will focus on the United States although religious bodies or
denominations flourish throughout the world. America has a greater number of religious groups
than any other country in the world. However, exact numbers can be hard to obtain because the
government does not include a question about religion on its census.
20
This means that the size of religious groups is obtained from the results of national surveys.
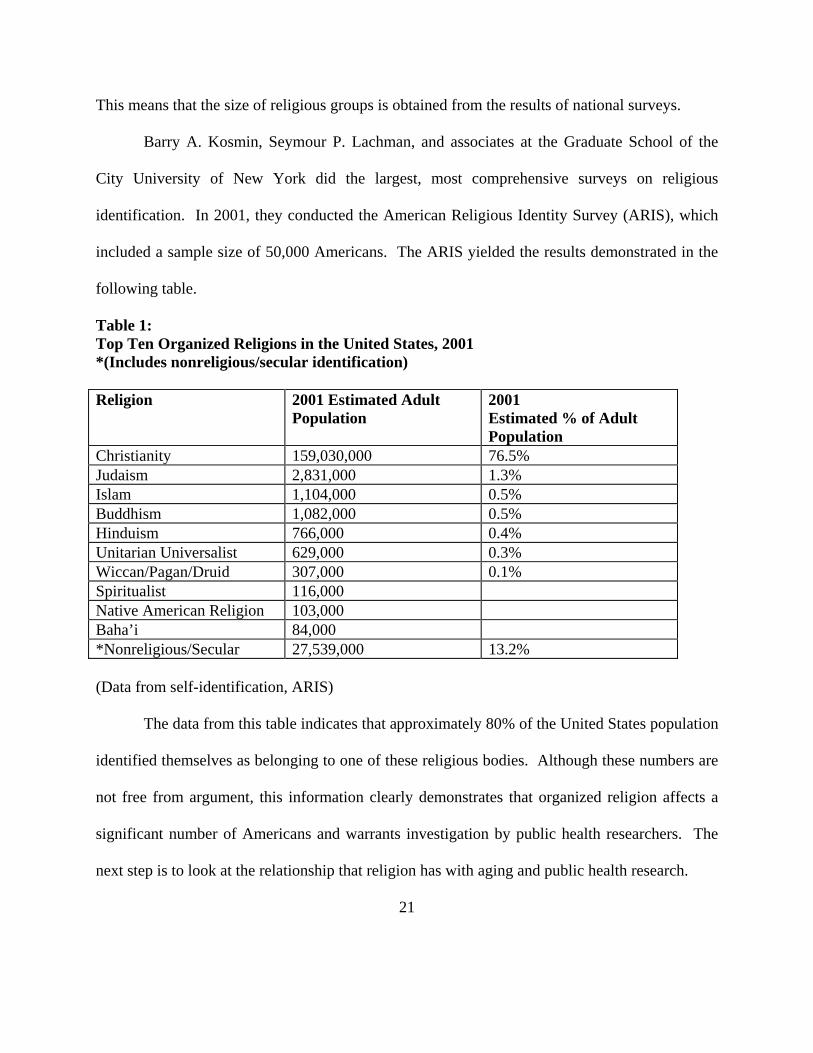
Barry A. Kosmin, Seymour P. Lachman, and associates at the Graduate School of the
City University of New York did the largest, most comprehensive surveys on religious
identification. In 2001, they conducted the American Religious Identity Survey (ARIS), which
included a sample size of 50,000 Americans. The ARIS yielded the results demonstrated in the
following table.
Table 1: Top Ten Organized Religions in the United States, 2001 *(Includes nonreligious/secular identification) Religion 2001 Estimated Adult
Population 2001 Estimated % of Adult Population
Christianity 159,030,000 76.5% Judaism 2,831,000 1.3% Islam 1,104,000 0.5% Buddhism 1,082,000 0.5% Hinduism 766,000 0.4% Unitarian Universalist 629,000 0.3% Wiccan/Pagan/Druid 307,000 0.1% Spiritualist 116,000 Native American Religion 103,000 Baha’i 84,000 *Nonreligious/Secular 27,539,000 13.2% (Data from self-identification, ARIS) The data from this table indicates that approximately 80% of the United States population
identified themselves as belonging to one of these religious bodies. Although these numbers are
not free from argument, this information clearly demonstrates that organized religion affects a
significant number of Americans and warrants investigation by public health researchers. The
next step is to look at the relationship that religion has with aging and public health research.
21
2.3 Relationship Between Religion And Aging
Robert Atchley (1991) has observed that church participation is the number one form of
organizational activity among older persons. This observation raises the following questions: 1)
Is there a change in individual religious involvement as a person grows older and 2) What is the
association between aging and religious involvement?
There have been several studies that have researched the relationship between aging and
religion. In 1987, Glamser examined the mean levels of belief and church attendance during
years before and after retirement. This study concluded that there appears to be more individual
change in religious belief and behavior in late adulthood than previously thought (Glamser,
1987). Another study demonstrated church attendance remained stable over 30 years (1952 to
1982), but the percentage of frequent church attenders increased steadily after age 45 into old age
(Sasaki, 1987). Also, Curtenay and associates (1992) examined the relationship between
religiosity, age, and health in a sample that included centenarians. Their data suggested that
there might be a linear increase in religiosity with age, especially for beliefs, knowledge about
religion, and reliance on religion in daily life (Curtenay et. al., 1992). The information obtained
from these studies would indicate that religiosity or religious influence increases as we become
older.
Although it would appear clear-cut, recent data has suggested that this is not entirely true.
Research in the social sciences has documented that older people do not become more religious
as they age (Nelson, 1981). There are several reasons for this discrepancy. Much of the research
cited above used cross-sectional data as opposed to cohort data. This means that the differences
discovered could have been due to generational variations that will not hold true over time.
22
However, an analysis using data from a cohort of people born in the 1930s demonstrated that
the percentage of individuals reporting to be very religious increased from 37% when in their
thirties to 45% when in their sixties. The largest increase occurred between their forties and
fifties, perhaps corresponding with parental death and full realization of one’s mortality (Social
Gerontology, 2002). This concept is further supported by a study completed in 1992, which
indicated 35% of elders surveyed reported they wished they had spent more time in their life on
religion (Degenova, 1992). Some other reasons would be the use of convenience samples and
the variables used to measure religion. Regardless of the extent, this information has
demonstrated that a significant number of older adults strengthen their religious beliefs as they
age.
What is a reason why this phenomenon occurs? With the diminished role of elderly in
our society, many are affected by the disengagement theory in social science research that
conceptualizes how role loss and increasing preoccupation with self and with death are common
experiences of aging (Hall, 1985). This geographical and emotional isolation in later life,
frequently beyond the complete control of the older person, may lead to emotional disorder
(Hall, 1981). Religion can be thought of as a source of spiritual support and freedom at these
times of difficult adjustment in the life of the elderly, such as approaching death (Kubler-Ross,
1969). Religion can also give direction and provide a social network of critical importance to
older people (Lemke & Redmann, 1984). An older person with the use of religion can begin to
transcend the facts of a situation of loss, for example, by broadening horizons toward a more
universalistic vision (Payne, 1981). Finally, spiritual development and moral virtue enhance the
quality of life and make life more satisfying (Hiltner, 1981). Based on the concepts described
23
above, it is clear that the elderly person can use religion as an important tool while weaving
through the possible emotional distress of aging and combating negative stereotypes associated
with ageism.
Religion or religious influence can impact the quality of life in an elderly person. Quality
of life and emotional stress have been documented to effect health outcomes. Therefore, there is
obviously a possible relationship between aging, religion, and health outcomes. Many
professionals have researched this connection, and the next section will describe the results of
some of this work.
2.4 Research on Religion, Health Outcomes and Aging: 2.4.1 Research on Religion and Mental Health
There have been many studies conducted investigating the relationship between religious
involvement and mental health. The following section will discuss research in the following
areas: 1) Positive associations between mental health and religious involvement and 2) The
relationship between religious involvement and negative mental health states such as depression,
anxiety, and suicide.
Moberg (1956) surveyed persons over the age of 65 in seven old age homes located in
Minneapolis-St. Paul and found that Religious activities were positively related to adjustment.
Singh and Williams (1982) examined the relationship between religious attendance and
“satisfaction with health” among the elderly. Multivariate analysis revealed that the strongest
predictor of health satisfaction among all variables assessed was religious attendance. Doyle and
Forehand (1984) examined data from a national sample of persons aged 46-90 years old. Among
24
persons ages 40-54 years, there was a positive association between importance of religion and
life satisfaction. Among those ages 65 and older, importance of religion was related to life
satisfaction at about the same level as social involvement. Krause (1993) examined the
relationship between religiousness and well being in a sample of 709 persons aged 55 or older.
There was a positive relationship between a second-order religiosity factor (global religious
orientation based on five religious dimensions) and life satisfaction, as well as a positive
relationship between subjective religiosity and life satisfaction.
The information above demonstrates that there is clearly a relationship between religious
involvement and positive mental health (life satisfaction). This is an important link from the
standpoint that religious involvement may be an important way in which older adults cope with
chronic diseases and other health problems. The next paragraphs illustrate the relationship
between religion and several mental health problems like depression, anxiety, and suicide.
Morse and Wisocki (1987) examined the extent to which religious beliefs and church
attendance influence psychological adjustment in later life. Elderly people with higher levels of
religious activity and beliefs show greater psychological health and adjustment. Kennedy,
Wisniewski, Kelman, Thomas, and Metz (1990) examined and compared the prevalence of
depressive symptoms among elderly Jews and Catholics. Symptoms of depression were
significantly less common among Jews than Catholics. Attendance at church services was less
common among Jews than Catholics. Koenig et al. (1992) examined the frequency of religious
coping among older medical inpatients. Findings suggest that religious coping is a common
behavior that inversely related to depression in hospitalized elderly men. Koenig et al. (1998)
examined the effects of religious belief and activity on remission of depression in medically ill
hospitalized older patients. Greater intrinsic religiosity predicted shorted time to remission.
25
Koenig et al. (1993) examined the relationship between religion and anxiety in
community dwelling older adults. This data did not demonstrate an independent relationship
between religion and anxiety in later life, dynamic factors may effectively mask an underlying
association; for example, if older persons turn to religion when excessively anxious, this could
mask a protective or therapeutic effect for religion. Martin (1984) examined the association
between annual variations in suicide rates between 1972 and 1978 as a function of church
attendance. The data supported the notion that religion deters suicide. Lester (1988) examined
relationships between suicide and homicide rates, religious affiliation, and church attendance.
Church attendance is a much stronger predictor of suicide and homicide than is denomination.
Koenig (1994) examined the relationship between religious coping and suicidal thoughts among
physically ill older men. Religious cognitions may help to allay thoughts of suicide in physically
ill older men (the group with the highest suicide rates in the U.S.).
2.4.2 Research on Religion and Physical Health
Researchers have studied links between religion and physical disorders for quite some
time. This section will review literature and research about the influence of religion in the
following areas of physical health: 1) Hypertension; 2) Heart disease; 3) Stroke; 4) General
health and disability; 5) Mortality; and 6) Health care utilization. The results are demonstrated in
the following paragraphs.
Scotch (1963) examined the relationship of hypertension and lifestyle factors among
urban and rural Zulus in South Africa. Among rural dwellers, religious commitment was
26
negatively related to hypertension for both men and women. Among urban dwellers, church
affiliation was negatively correlated with hypertension for women and positively (but weakly)
correlated for men. Graham and colleagues (1978) analyzed data from the Evans County
Cardiovascular Epidemiological Study (ECCPS) in Georgia. Found a consistent association
between frequent church attendance and lower age-standardized systolic and diastolic blood
pressure (included smokers, non-smokers, white-collar, and blue-collar workers. Lapane et al.
(1997) surveyed two large population-based random samples in Rhode Island. After adjusting
for other risk factors, the average diastolic blood pressure of church members was significantly
lower than of non-members. Koenig, George, Cohen, et al. (1998) examined the relationship
between blood pressure and religious activities in participants from Duke EPESE survey. Cross-
sectional analysis revealed small (1-4 mm Hg) but consistent differences in mean systolic and
diastolic blood pressures between frequent and non-frequent church attendees. Lower pressures
were also noted in those who frequently prayed or studied the Bible.
Friedlander et al. (1986) compared a sample of Jews that experienced their first
myocardial infarction (MI) with a control group. The risk of MI among secular men was more
than four times greater than that for religiously orthodox men.
The risk of MI among secular women was more than seven times greater that religiously
orthodox women. Goldbourt, Yaari, et al. (1993) reported the 23-year follow-up results form the
Israeli Ischemic Study. The risk of death from CAD among the most orthodox believers during
the 23-year follow-up was 20% lower than that for less orthodox Jews or nonbelievers. The
results remained significant when controlled for age, systolic BP, cholesterol, smoking, diabetes,
body mass index, and baseline CAD. Oxman et al. (1995) examined the effects of religious
27
attendance, importance of religion, and religious support on six-month mortality rates for older
adults that underwent CABG. Only 5% of persons who attended religious services at least every
few months died compared to 12% of those who never or rarely attended services. None of the
persons that described themselves as deeply religious died during the study.
Colantonio, Kasi, and Ostfeld (1992) examined psychosocial variables (including
religiousness) as risk factors for stroke among community dwelling older adults. Both high
depression scores and infrequent church attendance predicted high stroke incidence.
Stroke incidence among persons who never attended church was almost double that of those who
attended church weekly or more often.
Musick (1996) examined a three-year prospective cohort study of persons over the age of
65 in North Carolina. Among 1,202 whites, there was a significant interaction between both
private and public religious involvement and functional impairment.
High levels of functional impairment and either high devotional activity or high religious
attendance at baseline were related to better perceptions of physical health on follow-up.
Hogstel and Kashka (1989) examined accounts by the old-old (over the age of 85 years) on how
they maintain their health and well-being. Faith in God and Christian living rank right up there
among the factors that the old-old feel contribute to their longevity and health.
Seeman et al. (1987) examined the effects of church membership on mortality in
Alameda County (Participant 38 years or older). Lack of church membership predicted greater
mortality for persons age 60 and over. Goldman et al. (1995) examined predictors of mortality
between 1984 and 1990 in a national probability sample (Participants over the age of 70 years).
Lack of church attendance significantly predicted a greater probability of dying during the six-
28
year follow-up period for men and women after several variables were controlled. Hummer et al.
(1999) followed a random sample of adults from 1987 to 1995. Non church attendees lived to an
average age of 75.3 years, compared with 81.9 years for those who attended services once a
week and 82.9 for those who attended services more than once a week.
Schiller and Levin (1988) performed a comprehensive literature search on the topic “a
religious factor in healthcare utilization.” After controlling for age, sex, race, education, health
status, chronic diseases, and health lotus of control, subjects holding a church office had both
shorter hospital stays and a longer period of time from their last hospitalization. There was a
Levin and Markides (1985) study to examine the relationship between religious attendances,
self-rated religiosity, days of bed disability and physician visits per year. The results of this study
provided little evidence (except for men 65 to 80 years old that demonstrated fewer physician
visits for frequent church service attendees) that there is a relationship religion and a reduction in
healthcare utilization among Mexican Americans.
As evidenced from the information provided in the table above, there is some link
between physical health and religious involvement. Whether this relationship is causal or
coincidence remains to be proven through further research. However, further study of this
relationship and understanding the degree of its importance could be important to public health
professionals and healthcare policy makers.
2.5 Theory of Successful Aging:
In the book Successful Aging, Kahn and Rowe define successful aging as the ability to
maintain three key behaviors or characteristics:
29
• Low risk of disease and disease-related disability
• High mental and physical function
• Active engagement with life
Each of these factors is important in itself, and to some extent independent of the others (Kahn &
Rowe, 1998).
There is a kind of hierarchical ordering among the three components of successful aging.
The absence of disease and disability makes it easier to maintain mental and physical health.
And maintenance of mental and physical function in turn enables (but does not guarantee) active
engagement in life (Kahn & Rowe, 1998). However, it is the combination of these three factors
that represents the concept of successful aging most fully.
This successful aging theory will be used to determine whether or not religion has an
effect on adults throughout life and their overall mental and physical health. This theory allows
a more holistic approach to aging and health. It also incorporates all the health issues mentioned
previously that impact public health and the aging process.
3.0 RESEARCH DESIGN, PROBLEM STATEMENT AND METHODS
The purposed research is an observational study that will investigate any relationship
between religiosity and three components of successful aging theory in a population of
Americans 25-74 years old. The data used in this dissertation was not originally collected for
this purpose; however, use of existing data can provide important and cost-effective information
about this topic in a large already studied population.
30
3.1 Study Population
The 1994/95 National Survey of Midlife Development in the United States (MIDUS) was
chosen for this dissertation. The advantages of using this data are that it contains a large number
of midlife and older subjects selected from across the United States and it collected extensive
physical health, psychological, behavioral, and social factors on this population.
3.1.1 The National Survey of Midlife Development in the United States
The first MIDUS, funded by the John D. and Catherine T. MacArthur Foundation,
investigation was conducted in 1994/95 with a sample of over 7,000 Americans aged 25 to 74.
In 2002, the National Institute on Aging provided a 26 million dollar grant to the Institute on
Aging at the University of Wisconsin, Madison to carry out this study and a longitudinal follow-
up. MIDUS II is currently in progress (Wisc.edu, 2006).
The purpose of the study was to investigate the role of behavioral, psychological, and
social factors in understanding age-related differences in physical and mental health. The study
was innovative for its broad scientific scope; its diverse samples (which included twins and
siblings of main sample respondents), and its creative use of “satellite” studies to obtain in-depth
assessments in key areas (e.g. daily stress, cognitive functioning) (Wisc.edu, 2006).
3.1.2 Description and Demographics of Study Population
The study population for this dissertation was drawn from the first MIDUS study. The
MIDUS survey was administered to a nationally representative sample of 7,189 non-
institutionalized, English-speaking adults. There was an oversampling of older respondents and
31
men to guarantee a good distribution on the cross-classification of age and gender. All
respondents are in the age range 25-74. Respondents were recruited by telephone to participate
in the survey. The respondents were administered a 30-minute telephone interview, and then a
two-part self-administered questionnaire was mailed to them (MIDMAC, 2006). For the
purposes of this dissertation, the MIDUS study population of participants who completed both
parts of the survey will be used. The total number of participants was 4,242.
Table 2 on the next page documents the demographic variables of the study population:
3.2 Study Variables
This section describes the characteristics of variables used to analyze the statistical
relationships between religiosity measures (specifically religious salience, religious service
attendance, and religious influence) and three components of successful aging theory (including
low risk of disease and disease-related disability; high mental and physical function; and active
engagement with life) in the first MIDUS survey data of respondents. The variables selected in
this analysis were limited due to the constraints of using data not collected solely for the
purposes of the intended study.
32
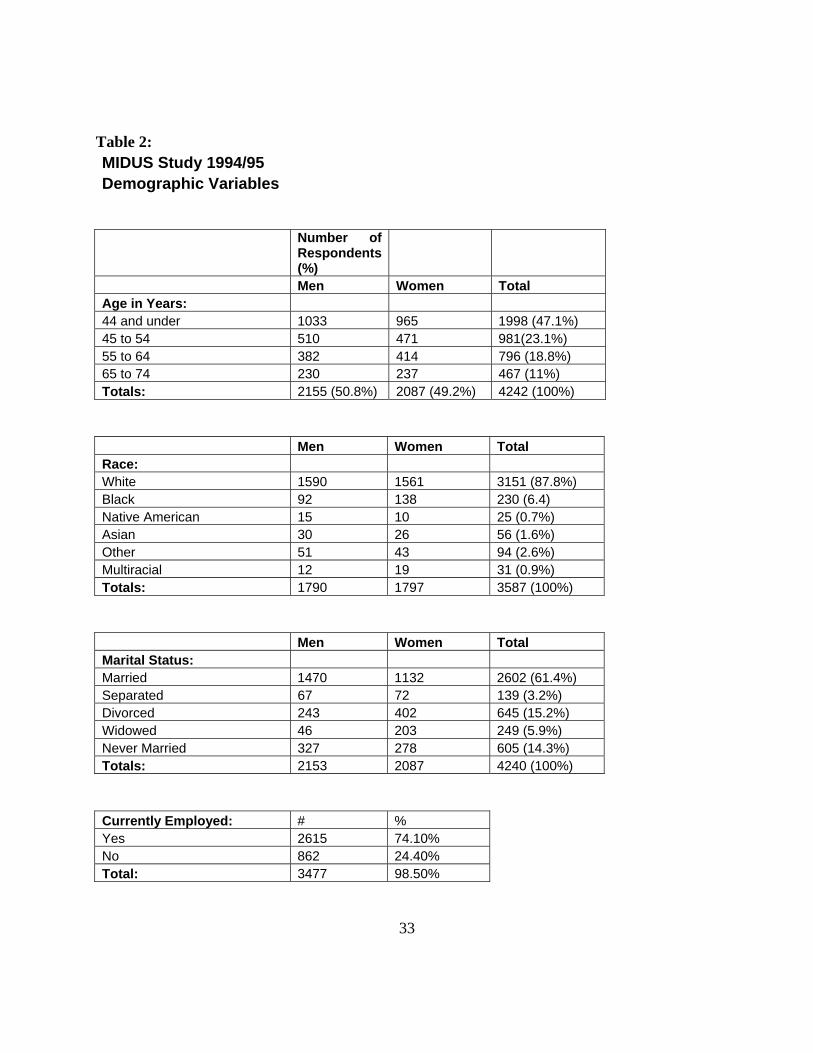
Table 2: MIDUS Study 1994/95 Demographic Variables
Number of Respondents (%)
Men Women Total Age in Years: 44 and under 1033 965 1998 (47.1%) 45 to 54 510 471 981(23.1%) 55 to 64 382 414 796 (18.8%) 65 to 74 230 237 467 (11%) Totals: 2155 (50.8%) 2087 (49.2%) 4242 (100%)
Men Women Total Race: White 1590 1561 3151 (87.8%) Black 92 138 230 (6.4) Native American 15 10 25 (0.7%) Asian 30 26 56 (1.6%) Other 51 43 94 (2.6%) Multiracial 12 19 31 (0.9%) Totals: 1790 1797 3587 (100%)
Men Women Total Marital Status: Married 1470 1132 2602 (61.4%) Separated 67 72 139 (3.2%) Divorced 243 402 645 (15.2%) Widowed 46 203 249 (5.9%) Never Married 327 278 605 (14.3%) Totals: 2153 2087 4240 (100%)
Currently Employed: # % Yes 2615 74.10% No 862 24.40% Total: 3477 98.50%
33
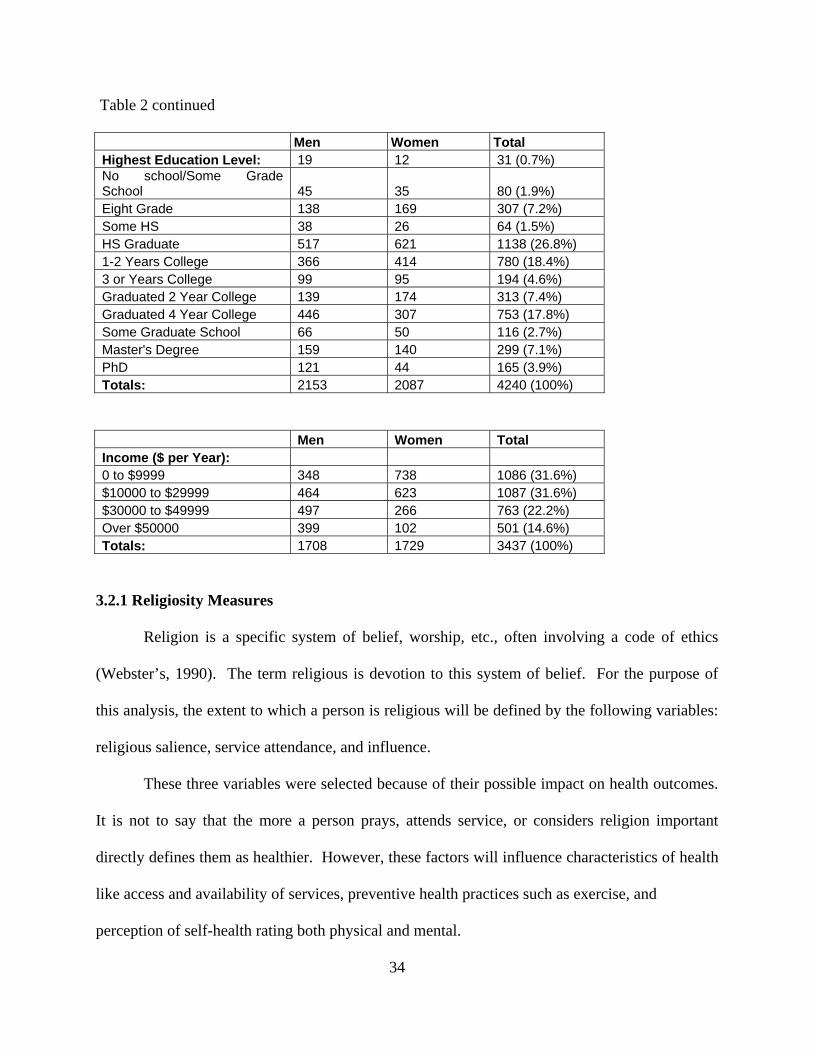
Table 2 continued
Men Women Total Highest Education Level: 19 12 31 (0.7%) No school/Some Grade School 45 35 80 (1.9%) Eight Grade 138 169 307 (7.2%) Some HS 38 26 64 (1.5%) HS Graduate 517 621 1138 (26.8%) 1-2 Years College 366 414 780 (18.4%) 3 or Years College 99 95 194 (4.6%) Graduated 2 Year College 139 174 313 (7.4%) Graduated 4 Year College 446 307 753 (17.8%) Some Graduate School 66 50 116 (2.7%) Master's Degree 159 140 299 (7.1%) PhD 121 44 165 (3.9%) Totals: 2153 2087 4240 (100%)
Men Women Total Income ($ per Year): 0 to $9999 348 738 1086 (31.6%) $10000 to $29999 464 623 1087 (31.6%) $30000 to $49999 497 266 763 (22.2%) Over $50000 399 102 501 (14.6%) Totals: 1708 1729 3437 (100%)
3.2.1 Religiosity Measures
Religion is a specific system of belief, worship, etc., often involving a code of ethics
(Webster’s, 1990). The term religious is devotion to this system of belief. For the purpose of
this analysis, the extent to which a person is religious will be defined by the following variables:
religious salience, service attendance, and influence.
These three variables were selected because of their possible impact on health outcomes.
It is not to say that the more a person prays, attends service, or considers religion important
directly defines them as healthier. However, these factors will influence characteristics of health
like access and availability of services, preventive health practices such as exercise, and
perception of self-health rating both physical and mental.
34
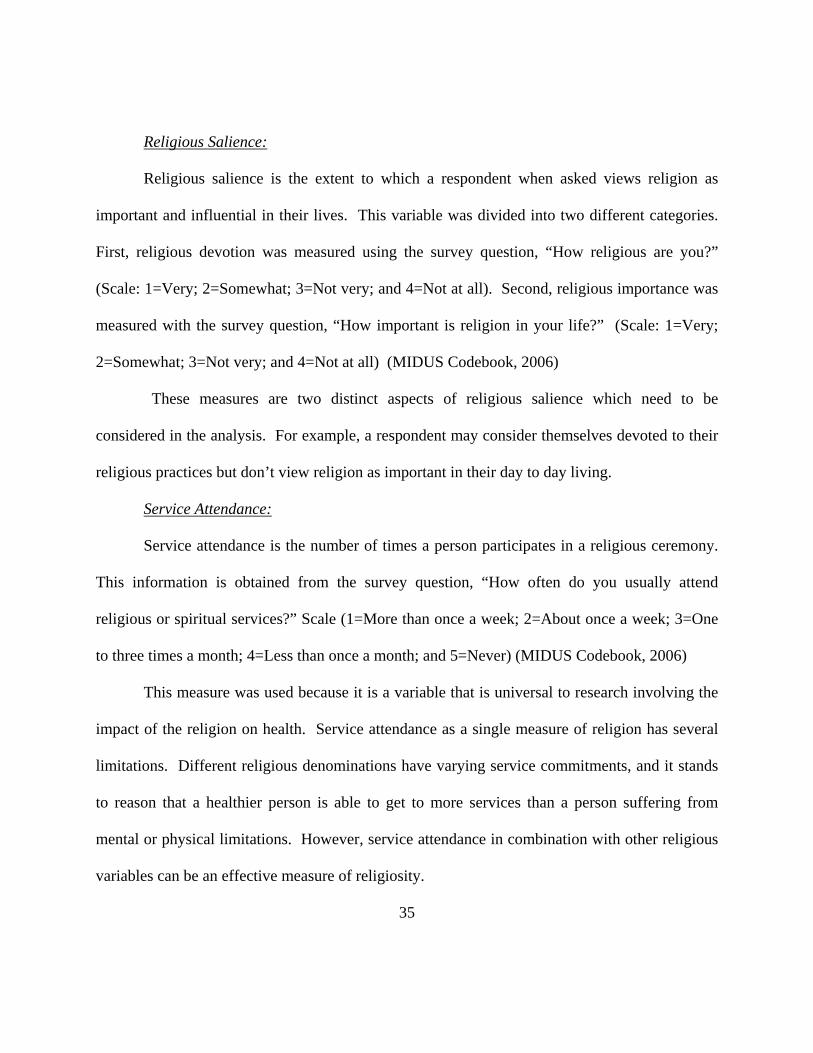
Religious Salience:
Religious salience is the extent to which a respondent when asked views religion as
important and influential in their lives. This variable was divided into two different categories.
First, religious devotion was measured using the survey question, “How religious are you?”
(Scale: 1=Very; 2=Somewhat; 3=Not very; and 4=Not at all). Second, religious importance was
measured with the survey question, “How important is religion in your life?” (Scale: 1=Very;
2=Somewhat; 3=Not very; and 4=Not at all) (MIDUS Codebook, 2006)
These measures are two distinct aspects of religious salience which need to be
considered in the analysis. For example, a respondent may consider themselves devoted to their
religious practices but don’t view religion as important in their day to day living.
Service Attendance:
Service attendance is the number of times a person participates in a religious ceremony.
This information is obtained from the survey question, “How often do you usually attend
religious or spiritual services?” Scale (1=More than once a week; 2=About once a week; 3=One
to three times a month; 4=Less than once a month; and 5=Never) (MIDUS Codebook, 2006)
This measure was used because it is a variable that is universal to research involving the
impact of the religion on health. Service attendance as a single measure of religion has several
limitations. Different religious denominations have varying service commitments, and it stands
to reason that a healthier person is able to get to more services than a person suffering from
mental or physical limitations. However, service attendance in combination with other religious
variables can be an effective measure of religiosity.
35
Religious Influence:
Religious influence is the extent to which an individual uses their knowledge and beliefs
of religion to influence their decisions. This information is taken from the survey question,
“When you make decisions in your daily life; how often do you refer to your religious or
spiritual beliefs?” Scale (1=Often; 2=Sometimes; 3=Rarely; and 4=Never) (MIDUS Codebook,
2006)
This variable is used in the dissertation to examine the impact of religion on personal
health decisions. A respondent may consider their self very religious, but the weight they give to
this factor while analyzing health options is an important relationship that needs to be
investigated in this study.
Table 3 documents the frequencies of the religiosity variables:
36
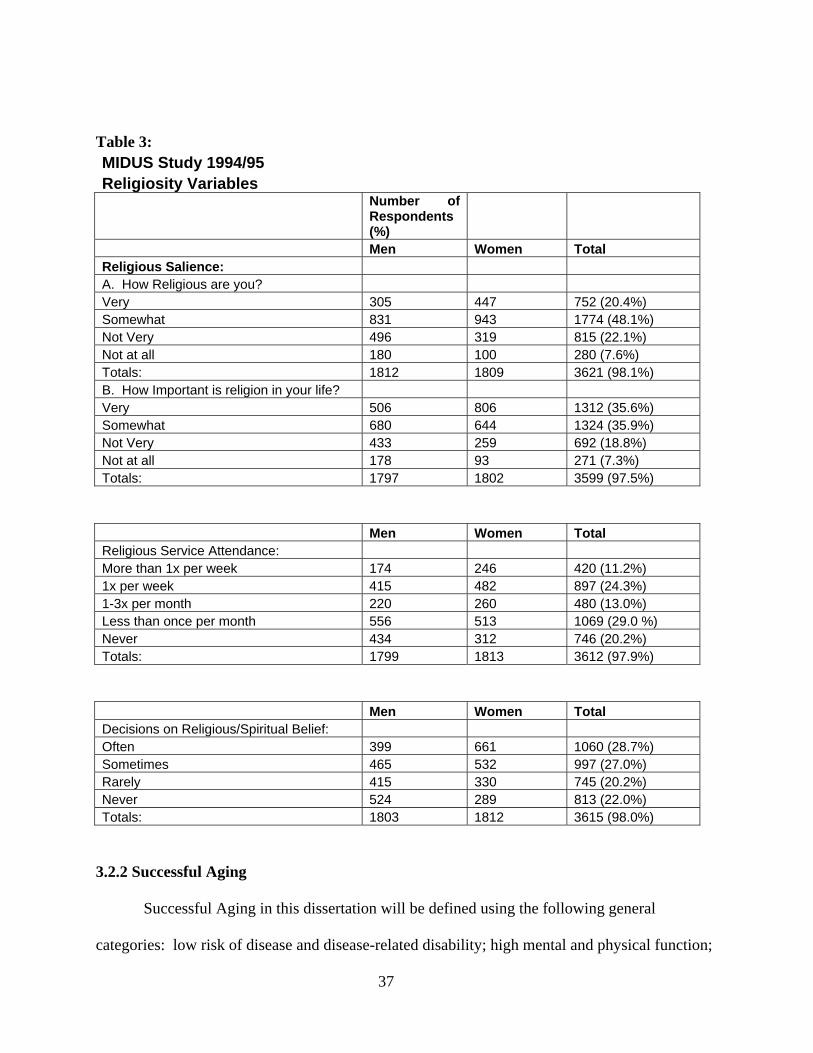
Table 3: MIDUS Study 1994/95 Religiosity Variables
Number of Respondents (%)
Men Women Total Religious Salience: A. How Religious are you? Very 305 447 752 (20.4%) Somewhat 831 943 1774 (48.1%) Not Very 496 319 815 (22.1%) Not at all 180 100 280 (7.6%) Totals: 1812 1809 3621 (98.1%) B. How Important is religion in your life? Very 506 806 1312 (35.6%) Somewhat 680 644 1324 (35.9%) Not Very 433 259 692 (18.8%) Not at all 178 93 271 (7.3%) Totals: 1797 1802 3599 (97.5%)
Men Women Total Religious Service Attendance: More than 1x per week 174 246 420 (11.2%) 1x per week 415 482 897 (24.3%) 1-3x per month 220 260 480 (13.0%) Less than once per month 556 513 1069 (29.0 %) Never 434 312 746 (20.2%) Totals: 1799 1813 3612 (97.9%)
Men Women Total Decisions on Religious/Spiritual Belief: Often 399 661 1060 (28.7%) Sometimes 465 532 997 (27.0%) Rarely 415 330 745 (20.2%) Never 524 289 813 (22.0%) Totals: 1803 1812 3615 (98.0%)
3.2.2 Successful Aging
Successful Aging in this dissertation will be defined using the following general
categories: low risk of disease and disease-related disability; high mental and physical function;
37
k of disease and disease-related disability; high mental and physical function:
37
and active engagement with life. Several variables were selected from the study population to
represent each of these general categories. Low risk of disease and disease-related disability
includes variables such as current BMI, presence of chronic diseases (heart, hypertension, and
cancer), depression, and number of times seen by doctor or admitted to the hospital. High mental
and physical function includes variables such as current self rating of health, physical activity,
and self rating of mental functional status. Active engagement with life includes variables that
define social networks such as contact with others, family engagement, community involvement,
employment, and volunteer activities.
This model as defined by Dr. Rowe and Dr. Kahn in their 1998 book titled, Successful
Aging, is dynamic and changes throughout the lifespan. It is a combination of all three factors
that determines the success of an individual through the aging process. Successful aging
according to this model is not necessarily ranking high is all three general categories. For
example, an individual considered to be successfully aging may have a debilitating disease such
as cancer but is able to remain actively engaged in life and function at a highest possible mental
and physical level.
3.3 Problem Statement
The overall goal of this dissertation is to determine if there is a statistically significant
relationship between religiosity measures (religious salience, service attendance, and religious
influence) and three components of successful aging theory (including low risk of disease and
disease-related disability; high mental and physical function; and active engagement with life)
38
using a national survey of American adults. This will be achieved through specific analysis of
the data to answer the following questions:
• In the MIDUS survey population of adults, does statistically significant
relationship exist between the following: religious salience and three components
of successful aging?
• In the MIDUS survey population of adults, does statistically significant
relationship exist between the following: religious service attendance and three
components of successful aging?
• In the MIDUS survey population of adults, does statistically significant
relationship exist between the following: religious influence and three
components of successful aging?
• Are relationships demonstrated from the previous four questions when analyzed
across the following factors: age, sex, race, marital status, and educational level?
• In the MIDUS survey population of adults, does statistical support exist for a
theoretical model between religiosity and successful aging?
• What if any impact does these discoveries have on the public health and
professional practice?
3.4 Theoretical Model:
This theoretical model analyzes the relationship that exists between religiosity and
successful aging theory. The model demonstrates that religiosity effects active engagement in
life (one component of successful aging) which then in turn effects low risk of disease and
39
disease-related disability and high mental and physical function (the other two components of
successful aging.
This relationship is interwoven and dynamic. The definition of interwoven is that several
of the variables can be affected at the same time with no clear-cut divisions. For example, an
individual can have a strong social network which gives that person an increased level of mental
and physical function causing a higher perception of health status and increased religious service
attendance. This demonstrates how several factors, some of which were not measured in the
survey data, interact to provide a link between religiosity and successful aging theory. Also,
dynamic means this relationship can be either positive or negative causing a re-evaluation of an
individual’s position. Finally, there are several other outside variables that influence this
relationship. These variables include the following: age, sex, race, education level, and marital
status. A diagram of how this relationship exists in a theoretical model is illustrated in Figure 1
on the next page.
3.5 Analysis Strategy
The analysis will attempt to investigate the statistical relationships between complex
variables of religiosity and successful aging. Other variables that will be considered because of
their possible influence religiosity and successful aging are age, sex, race, marital status, and
educational level.
The analysis will be completed in two stages both using various bivariate and
multivariate statistical techniques. The first stage will compare the components of religiosity
with the measures of successful aging. The second stage will analyze the relationship of
religiosity and the components of successful aging within the theoretical model illustrated in
40
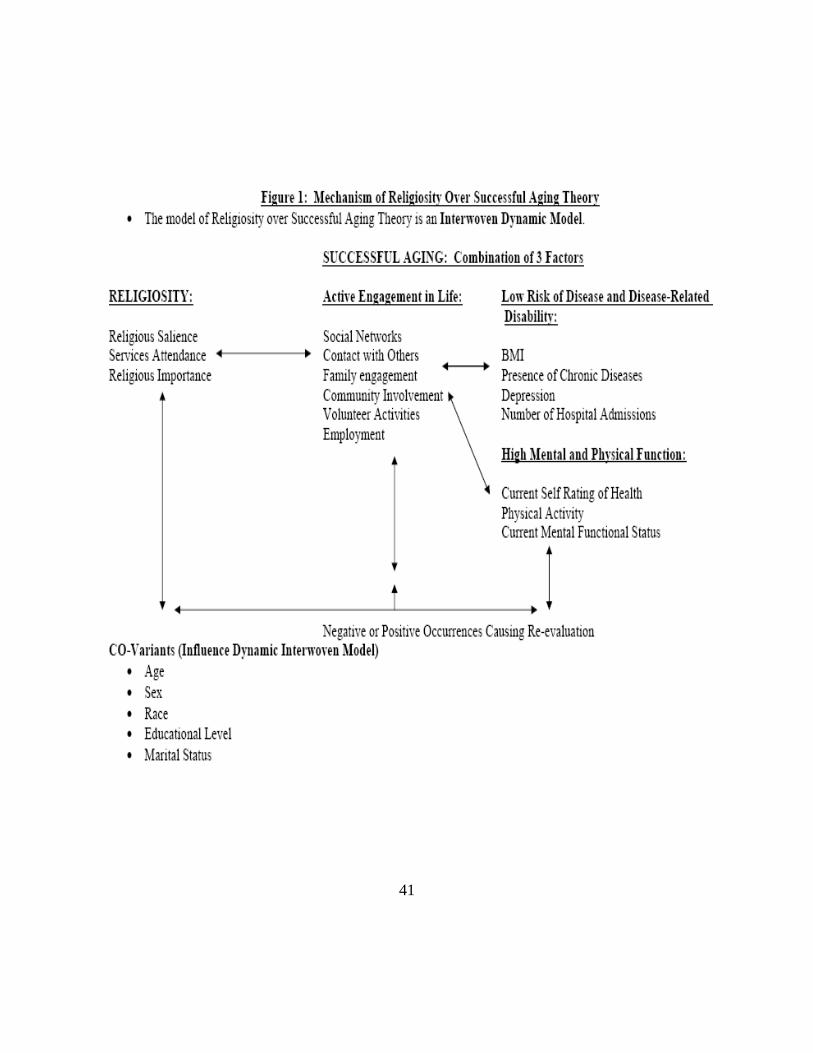
41
4.0 ANALYSIS, DISCUSSION, AND CONCLUSION FROM RESULTS
4.1 Data Analysis
The data will be analyzed overall and across age, sex, race, education, and marriage.
4.1.1 Analysis Overall
The results of statistical chi-squared and ANOVA comparisons between the religiosity
variables and health variables (including those of successful aging) are demonstrated in tables 4-
5. In addition, appendix A contains detailed frequencies of religiosity and successful aging
variables. The following paragraphs are the results from this analysis.
First, the variables used to measure active engagement in life were statistically significant
at the p<0.001 level across all religiosity variables. This indicates that a relationship between the
social aspects of the successful aging model and religiosity exists. Individuals ranking
themselves as more religious, placing a greater importance on religion, more frequent service
attendees, and using religion as a greater influence in decision making were more likely to have
contact with family or friends more the once a week, work for pay, and volunteer in community
services. This demonstrates that individuals ranking themselves as more religious in all
categories have increased social interaction with family, friends, and community. These
individuals, also, rank higher in one of the key components of successful aging, active
engagement in life.
42
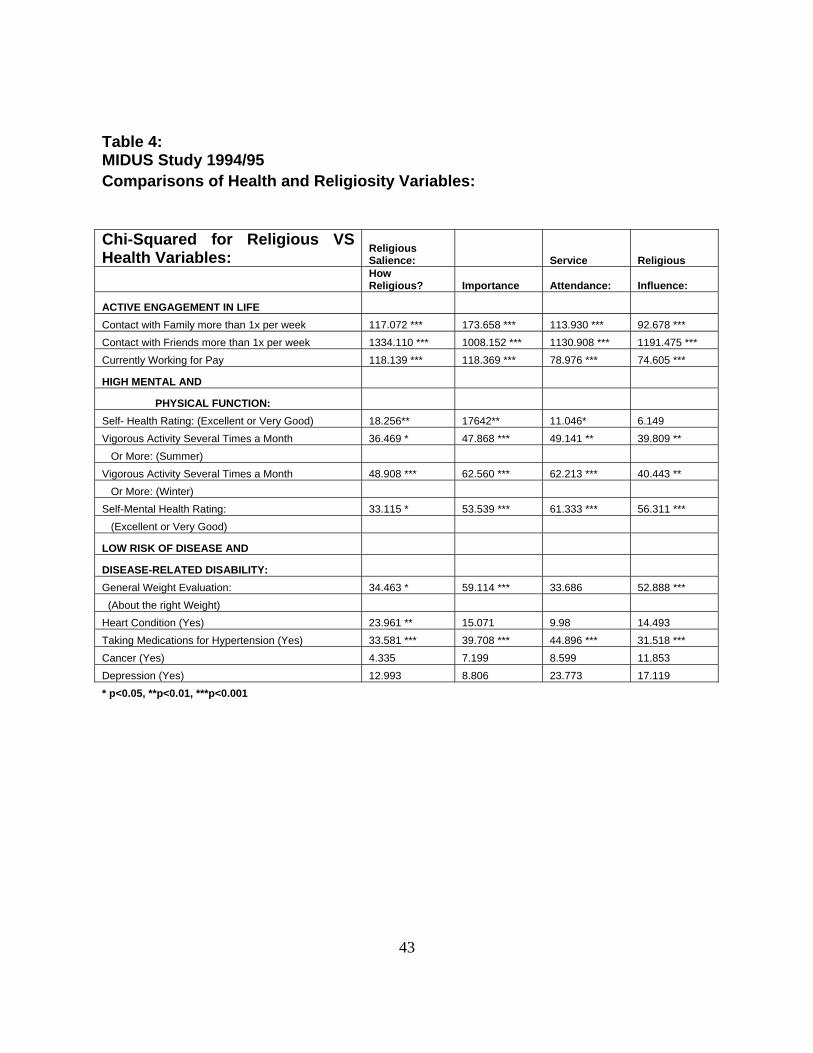
Table 4: MIDUS Study 1994/95 Comparisons of Health and Religiosity Variables:
Chi-Squared for Religious VS Health Variables:
Religious Salience: Service Religious
How Religious? Importance Attendance: Influence:
ACTIVE ENGAGEMENT IN LIFE Contact with Family more than 1x per week 117.072 *** 173.658 *** 113.930 *** 92.678 *** Contact with Friends more than 1x per week 1334.110 *** 1008.152 *** 1130.908 *** 1191.475 *** Currently Working for Pay 118.139 *** 118.369 *** 78.976 *** 74.605 ***
HIGH MENTAL AND
PHYSICAL FUNCTION: Self- Health Rating: (Excellent or Very Good) 18.256** 17642** 11.046* 6.149 Vigorous Activity Several Times a Month 36.469 * 47.868 *** 49.141 ** 39.809 ** Or More: (Summer) Vigorous Activity Several Times a Month 48.908 *** 62.560 *** 62.213 *** 40.443 ** Or More: (Winter) Self-Mental Health Rating: 33.115 * 53.539 *** 61.333 *** 56.311 *** (Excellent or Very Good)
LOW RISK OF DISEASE AND
DISEASE-RELATED DISABILITY: General Weight Evaluation: 34.463 * 59.114 *** 33.686 52.888 *** (About the right Weight) Heart Condition (Yes) 23.961 ** 15.071 9.98 14.493 Taking Medications for Hypertension (Yes) 33.581 *** 39.708 *** 44.896 *** 31.518 *** Cancer (Yes) 4.335 7.199 8.599 11.853 Depression (Yes) 12.993 8.806 23.773 17.119 * p<0.05, **p<0.01, ***p<0.001
43
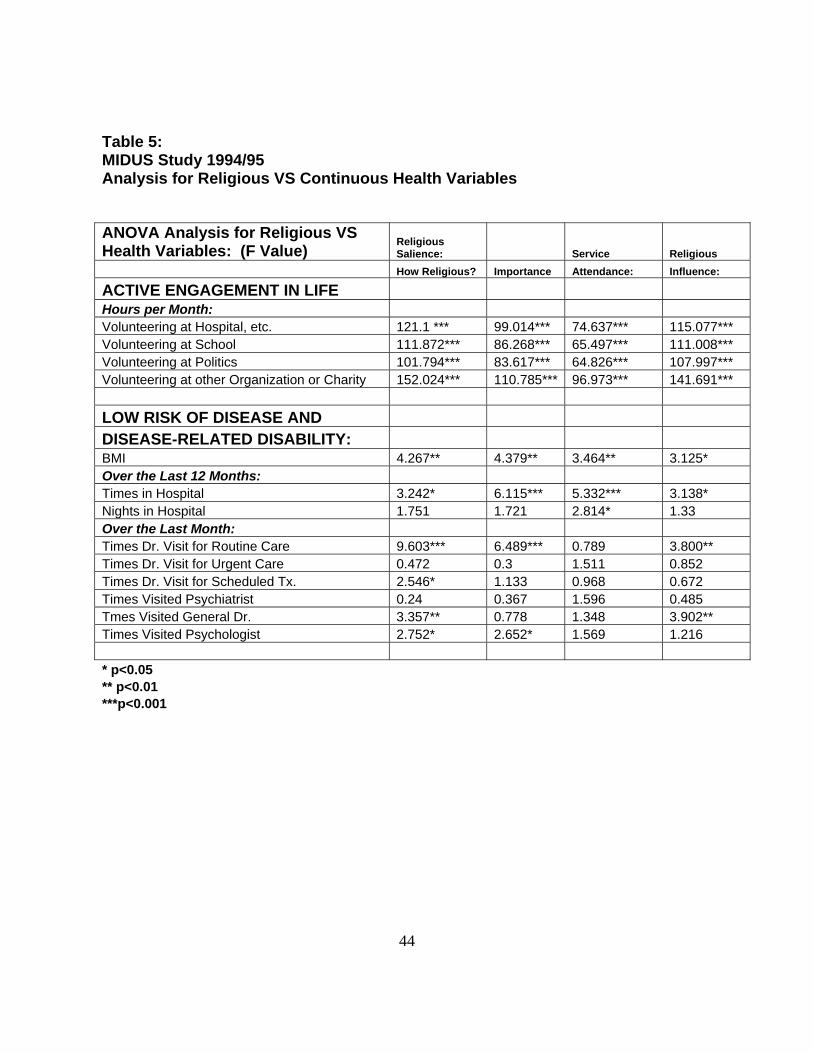
Table 5: MIDUS Study 1994/95 Analysis for Religious VS Continuous Health Variables ANOVA Analysis for Religious VS Health Variables: (F Value)
Religious Salience: Service Religious
How Religious? Importance Attendance: Influence:
ACTIVE ENGAGEMENT IN LIFE Hours per Month: Volunteering at Hospital, etc. 121.1 *** 99.014*** 74.637*** 115.077*** Volunteering at School 111.872*** 86.268*** 65.497*** 111.008*** Volunteering at Politics 101.794*** 83.617*** 64.826*** 107.997*** Volunteering at other Organization or Charity 152.024*** 110.785*** 96.973*** 141.691*** LOW RISK OF DISEASE AND DISEASE-RELATED DISABILITY: BMI 4.267** 4.379** 3.464** 3.125* Over the Last 12 Months: Times in Hospital 3.242* 6.115*** 5.332*** 3.138* Nights in Hospital 1.751 1.721 2.814* 1.33 Over the Last Month: Times Dr. Visit for Routine Care 9.603*** 6.489*** 0.789 3.800** Times Dr. Visit for Urgent Care 0.472 0.3 1.511 0.852 Times Dr. Visit for Scheduled Tx. 2.546* 1.133 0.968 0.672 Times Visited Psychiatrist 0.24 0.367 1.596 0.485 Tmes Visited General Dr. 3.357** 0.778 1.348 3.902** Times Visited Psychologist 2.752* 2.652* 1.569 1.216 * p<0.05 ** p<0.01 ***p<0.001
44
Second, the variables used to measure high mental and physical function were compared
with the religiosity variables. Self-health rating (excellent or very good) was significant with
religious salience and service attendance at the p<0.05 level. Respondents rating self-health as
excellent or very good and religious devotion as very or somewhat important was 33.6%
compared with 16.2% rating the opposite. The results for religious importance was 35.4% to
14% and service attendance was 25% for heavy attendees (more than 1-3 times per month) to
24.1% for individuals with less service attendance respectfully. This variable was not significant
with religious influence. Self-mental health rating (excellent or very good) was significant with
all religiosity variables at the p<0.05 level (religious importance, service attendance, and
religious influence all significant at the p<0.001 level). Individuals rating mental health as
excellent to very good and religious devotion as very or somewhat important were 40.4% to
13.6% for the opposite. The results for religious importance were 42.4% to 15%, religious
influence 33.2% to 24.4%, and service attendance was 30.4% for heavy attendees to 27.1% for
respondents with less services attendance respectively. Additionally, vigorous physical
activity during both the winter and summer were statistically significant at the p<0.05 level with
all religiosity variables. These results exhibit a relationship that exists with religiosity variables
and high mental and physical function another key component of the successful aging model.
Finally, variables measuring low risk of disease and disease-related disability were
compared with the religiosity variables. Individuals ranking themselves at about the right weight
were more likely to rank themselves as religious 19.4% to 9.5%, give religion greater importance
20.7% to 8.1%, and use religion to influence decisions 15.6% to 13.3% all significant at the
p<0.05 level. BMI was statically significant with all religiosity variables at the p<0.05 level.
45
Also, the times that an individual was in the hospital with the mean number of visits decreasing
and the taking medications for hypertension for higher rankings in religiosity were significant at
the p<0.05 level. Individuals ranking higher in religious devotion, religious importance, and
religious influence visited the doctor more for routine care with the mean number of visits
increasing for higher rankings in religiosity variables. These results indicate that there is a
statistical relationship between some measures for low risk of disease and disease-related
disability, the third component of successful aging. In addition, there may be a relationship
between the religiosity variables and access to health care concerning number of hospital visits
and routine doctor care.
The next step in this analysis will be to compare these religiosity variables and successful
aging variables across age, sex, race, martial status, and education. Then the variables will be
compared using logistic regression with the model demonstrated with Figure 1.
4.1.2 Analysis by Age, Sex, Race, Education, and Marriage
The statistical analysis of age across religiosity variables and health variables was
completed by dividing some of the data into two sets: 44 years old and younger vs. 45 years and
older. The remainder of information was controlled for age and analyzed. The results are
demonstrated in tables 6-8.
Once again, all the active engagement in life variables were significant at the p<0.001
level when compared with religiosity. This means that regardless of age or age group the social
network variables were all associated with a greater ranking in religious salience, service
46
attendance, and religious influence. These results imply that there is statistical relationship
between increased active engagement in life and individuals that attend service more and
consider religion as both important and influential.
The comparison between high mental and physical function and religiosity differed with
age. Individuals that were 44 years and younger who ranked religiosity higher in all four
categories were also more likely to rate their health as excellent or very good at the p<0.01 level.
None of the other variables were significant. For individuals 45 and older, this was true only at
the p<0.05 level. These older respondents, also, with a higher ranking in religious importance
and service attendance were more likely to engage in vigorous activity during the winter several
times a month at the p<0.01 level. Religious influence was significant with this variable at the
p<0.05 level. This information indicates that age does play a role in the relationship between
religiosity, self-health rating, and vigorous activity during the winter months.
Finally, there were some relationships noted between religiosity and low risk of disease
and disease-related disability. Respondents with higher rankings in all religiosity variables when
controlled for age had a better BMI and visited the hospital less times at least at the p<0.05 level.
Respondents ranking higher in religious devotion, importance, and influence had more routine
visits to the doctor at the p<0.001 level.
47
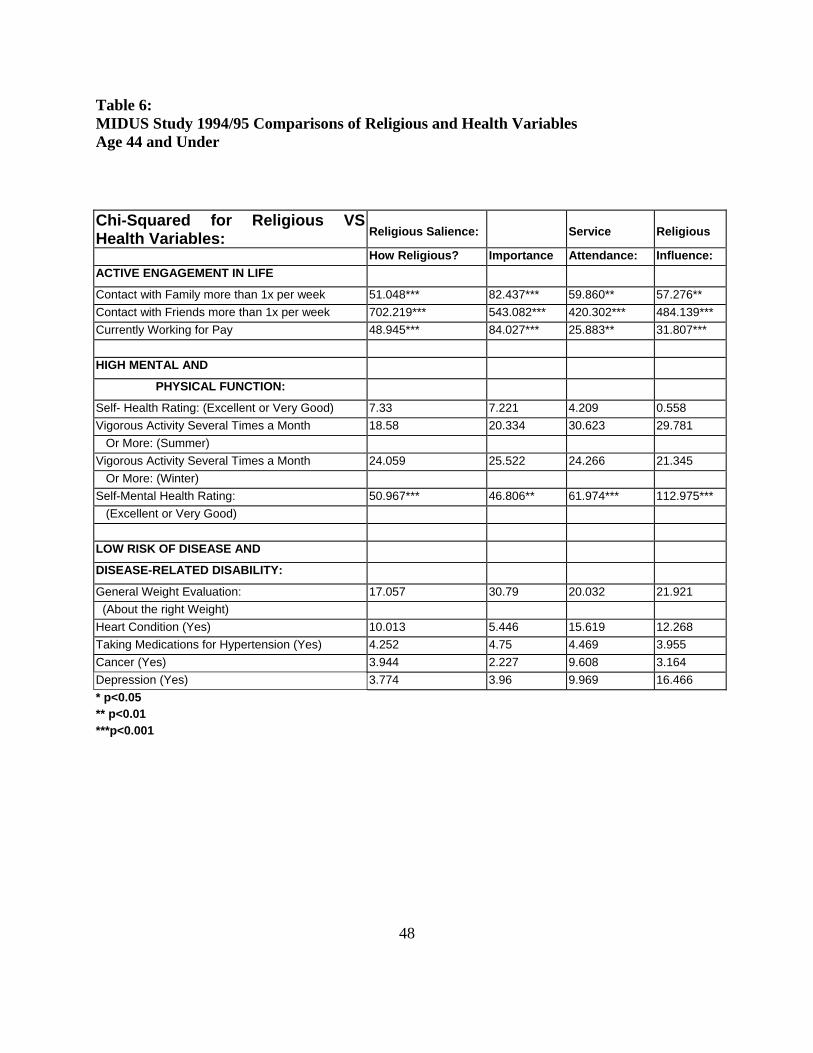
Table 6: MIDUS Study 1994/95 Comparisons of Religious and Health Variables Age 44 and Under
Chi-Squared for Religious VS Health Variables:
Religious Salience:
Service
Religious
How Religious? Importance Attendance: Influence: ACTIVE ENGAGEMENT IN LIFE
Contact with Family more than 1x per week 51.048*** 82.437*** 59.860** 57.276** Contact with Friends more than 1x per week 702.219*** 543.082*** 420.302*** 484.139*** Currently Working for Pay 48.945*** 84.027*** 25.883** 31.807*** HIGH MENTAL AND
PHYSICAL FUNCTION:
Self- Health Rating: (Excellent or Very Good) 7.33 7.221 4.209 0.558 Vigorous Activity Several Times a Month 18.58 20.334 30.623 29.781 Or More: (Summer) Vigorous Activity Several Times a Month 24.059 25.522 24.266 21.345 Or More: (Winter) Self-Mental Health Rating: 50.967*** 46.806** 61.974*** 112.975*** (Excellent or Very Good) LOW RISK OF DISEASE AND
DISEASE-RELATED DISABILITY:
General Weight Evaluation: 17.057 30.79 20.032 21.921 (About the right Weight) Heart Condition (Yes) 10.013 5.446 15.619 12.268 Taking Medications for Hypertension (Yes) 4.252 4.75 4.469 3.955 Cancer (Yes) 3.944 2.227 9.608 3.164 Depression (Yes) 3.774 3.96 9.969 16.466 * p<0.05 ** p<0.01 ***p<0.001
48

Table 7: MIDUS Study 1994/95 Comparisons of Religious and Health Variables Age 45 and Over
Chi-Squared for Religious VS Health Variables:
Religious Salience:
Service
Religious
ACTIVE ENGAGEMENT IN LIFE How Religious? Importance Attendance: Influence:
Contact with Family more than 1x per week 91.793*** 117.892*** 88.005*** 59.371*** Contact with Friends more than 1x per week 685.513*** 516.644*** 754.112*** 738.139*** Currently Working for Pay 59.514*** 51.675*** 49.624*** 33.318*** HIGH MENTAL AND
PHYSICAL FUNCTION:
Self- Health Rating: (Excellent or Very Good) 10.150* 11.084* 11.672* 10.981* Vigorous Activity Several Times a Month 21.057 32.801* 30.918 26.906 Or More: (Summer) Vigorous Activity Several Times a Month 29.993 40.445** 49.264** 34.974* Or More: (Winter) Self-Mental Health Rating: 18.9 26.174 41.069* 20.862 (Excellent or Very Good) LOW RISK OF DISEASE AND
DISEASE-RELATED DISABILITY:
General Weight Evaluation: 35.066* 55.625*** 25.67 33.724* (About the right Weight) Heart Condition (Yes) 12.991 9.889 4.781 8.288 Taking Medications for Hypertension (Yes) 14.873 21.776** 27.456** 13.74 Cancer (Yes) 1.591 3.644 7.973 16.476* Depression (Yes) 19.446 14.721 23.694 15.726 * p<0.05 ** p<0.01 ***p<0.001
49
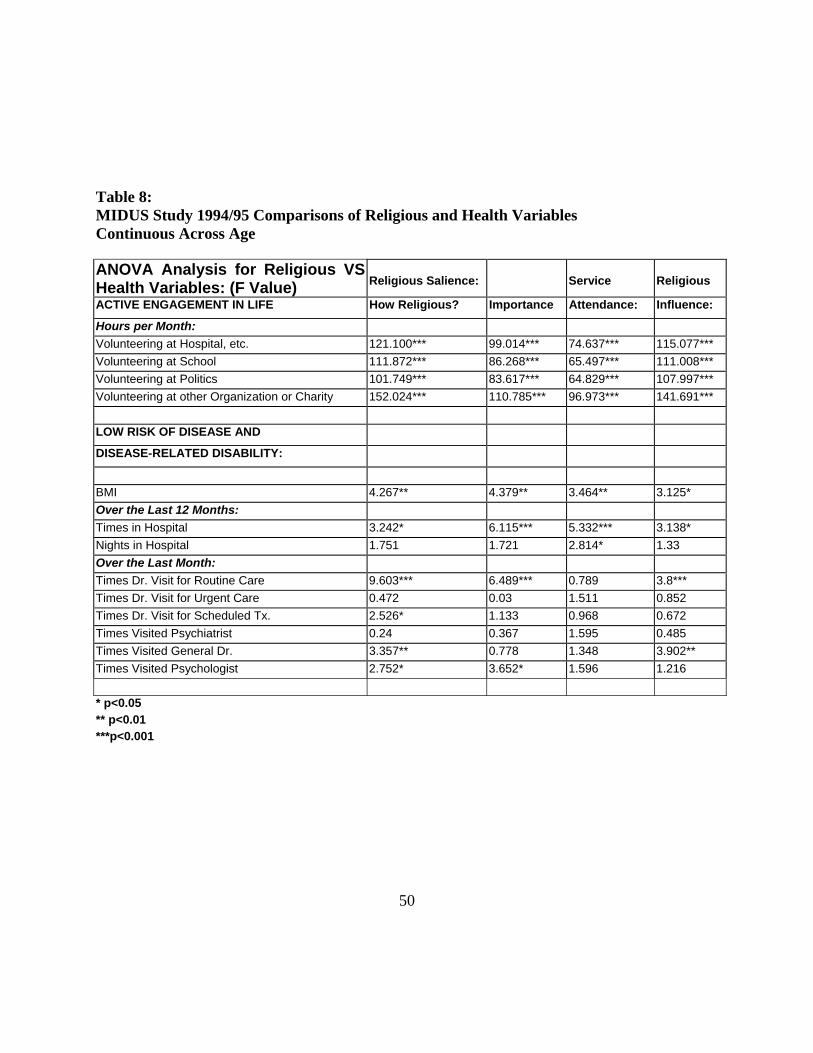
Table 8: MIDUS Study 1994/95 Comparisons of Religious and Health Variables Continuous Across Age
ANOVA Analysis for Religious VS Health Variables: (F Value)
Religious Salience:
Service
Religious
ACTIVE ENGAGEMENT IN LIFE How Religious? Importance Attendance: Influence:
Hours per Month: Volunteering at Hospital, etc. 121.100*** 99.014*** 74.637*** 115.077*** Volunteering at School 111.872*** 86.268*** 65.497*** 111.008*** Volunteering at Politics 101.749*** 83.617*** 64.829*** 107.997*** Volunteering at other Organization or Charity 152.024*** 110.785*** 96.973*** 141.691*** LOW RISK OF DISEASE AND
DISEASE-RELATED DISABILITY:
BMI 4.267** 4.379** 3.464** 3.125* Over the Last 12 Months: Times in Hospital 3.242* 6.115*** 5.332*** 3.138* Nights in Hospital 1.751 1.721 2.814* 1.33 Over the Last Month: Times Dr. Visit for Routine Care 9.603*** 6.489*** 0.789 3.8*** Times Dr. Visit for Urgent Care 0.472 0.03 1.511 0.852 Times Dr. Visit for Scheduled Tx. 2.526* 1.133 0.968 0.672 Times Visited Psychiatrist 0.24 0.367 1.595 0.485 Times Visited General Dr. 3.357** 0.778 1.348 3.902** Times Visited Psychologist 2.752* 3.652* 1.596 1.216 * p<0.05 ** p<0.01 ***p<0.001
50
The rest of tables 9-20 compare religiosity with successful aging variables across
sex, race, education, and marriage. Active engagement in life variables were significant for the
most part across all demographic variables to at least p<0.05 level. This means that regardless of
the sex, race, education, and marriage individuals who ranked themselves as more religious,
placing a greater importance on religion, attending service more frequently, and influenced by
religion more when making decisions were, also, more likely to have employment and frequent
contact with family and friends. A case can be made that statistically there is a relationship
across religiosity variables and active engagement in life variables regardless of age, sex, race,
education status, and marital status of the individual respondent.
When investigating the variables used for high mental and physical function across sex,
race, education, and marital status, some differences arise. Females demonstrate no significant
difference between and rating of mental health status and religiosity variables; whereas, self-
rating of mental health status as excellent to very good is significant for males with religious
devotion (p<0.01), importance (p<0.001), service attendance (p<0.01), and influence (p<0.001).
The opposite is true for self-health rating with males demonstrating a significant relationship
with religious devotion (p<0.01), importance (p<0.01), service attendance (p<0.05), and
influence (p<0.05) respectively. All other variables investigated across gender showed no
significance. With race, a relationship exists with mental health status as well. Caucasians in
study demonstrated a statistical relationship with mental health rating, religious importance
(p<0.001), and service attendance (p<0.001). Self mental health rating for all other races was
significant at the p<0.001 level with all religiosity variables. The only significant relationship
for self-rated health (excellent or very good) was with religious influence at the p<0.01 level for
other race individuals.
51
51
When comparing the respondents across education (high school and below vs. above high
school) and martial status, some differences were noted for the high mental and physical function
variables. Individuals with a high school education or lower who ranked self health as excellent
to very good had higher religiosity rankings in all four categories at the p<0.01 level. This
variable was not significant for individuals with a higher than high school education. However,
a self mental health rating (excellent or very good) was significant with lower educated
individuals with a higher rank in service attendance (p<0.01) and religious influence (p<0.001)
and higher educated individuals with a higher rank in religious importance (p<0.001) and service
attendance (p<0.05). The only major difference in martial status was a higher mental health
rating had a significant statistical relationship with all religiosity variables at least at the p<0.01
level for married individuals and this variable was not significant for the non-married.
The next step in this analysis was to compare religiosity with the low risk of disease and
disease-related disability variables across sex, race, education, and marital status. As evidenced
by tables 6-20, the only variable that was significant across all variables of religiosity was times
in the hospital. Individuals that rated themselves as religious, considered religion important,
attended services more, and used religion to influence their decisions had less visits to the
hospital of the last 12 months when controlled for sex, race, education, and martial status. There
was also an occasional statistically significant relationship between number of routine doctor
visits and religiosity.
52
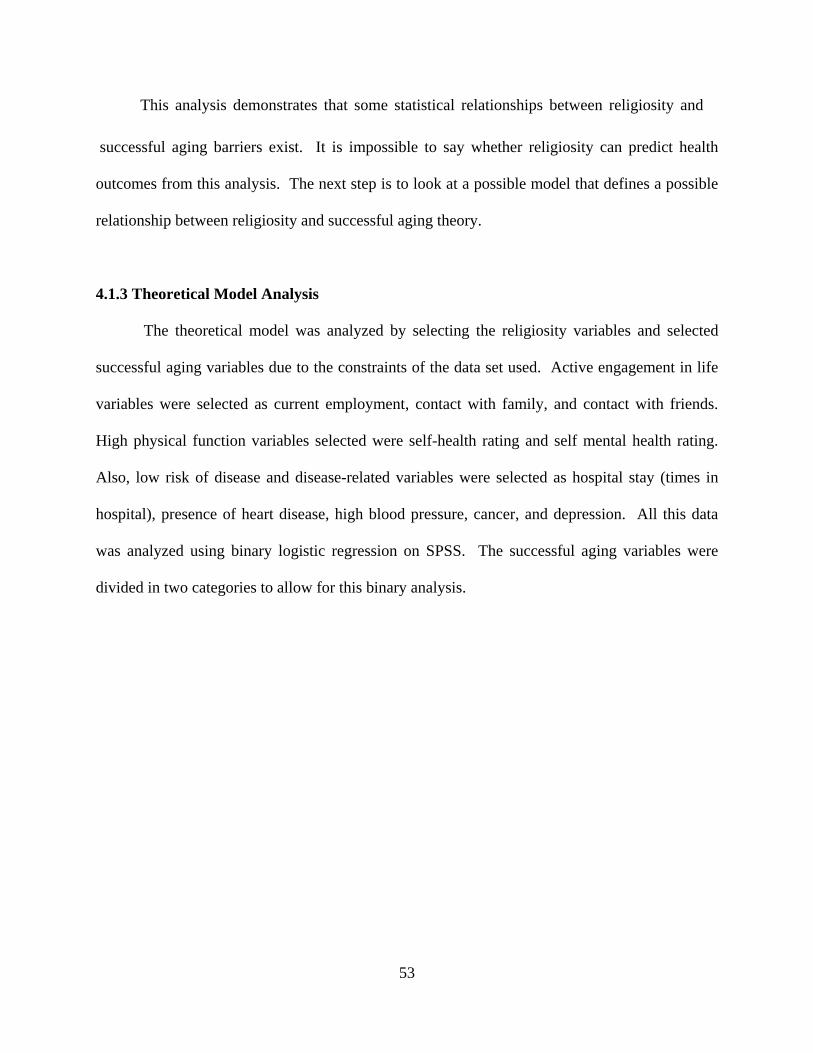
This analysis demonstrates that some statistical relationships between religiosity and successful aging barriers exist. It is impossible to say whether religiosity can predict health
outcomes from this analysis. The next step is to look at a possible model that defines a possible
relationship between religiosity and successful aging theory.
4.1.3 Theoretical Model Analysis
The theoretical model was analyzed by selecting the religiosity variables and selected
successful aging variables due to the constraints of the data set used. Active engagement in life
variables were selected as current employment, contact with family, and contact with friends.
High physical function variables selected were self-health rating and self mental health rating.
Also, low risk of disease and disease-related variables were selected as hospital stay (times in
hospital), presence of heart disease, high blood pressure, cancer, and depression. All this data
was analyzed using binary logistic regression on SPSS. The successful aging variables were
divided in two categories to allow for this binary analysis.
53
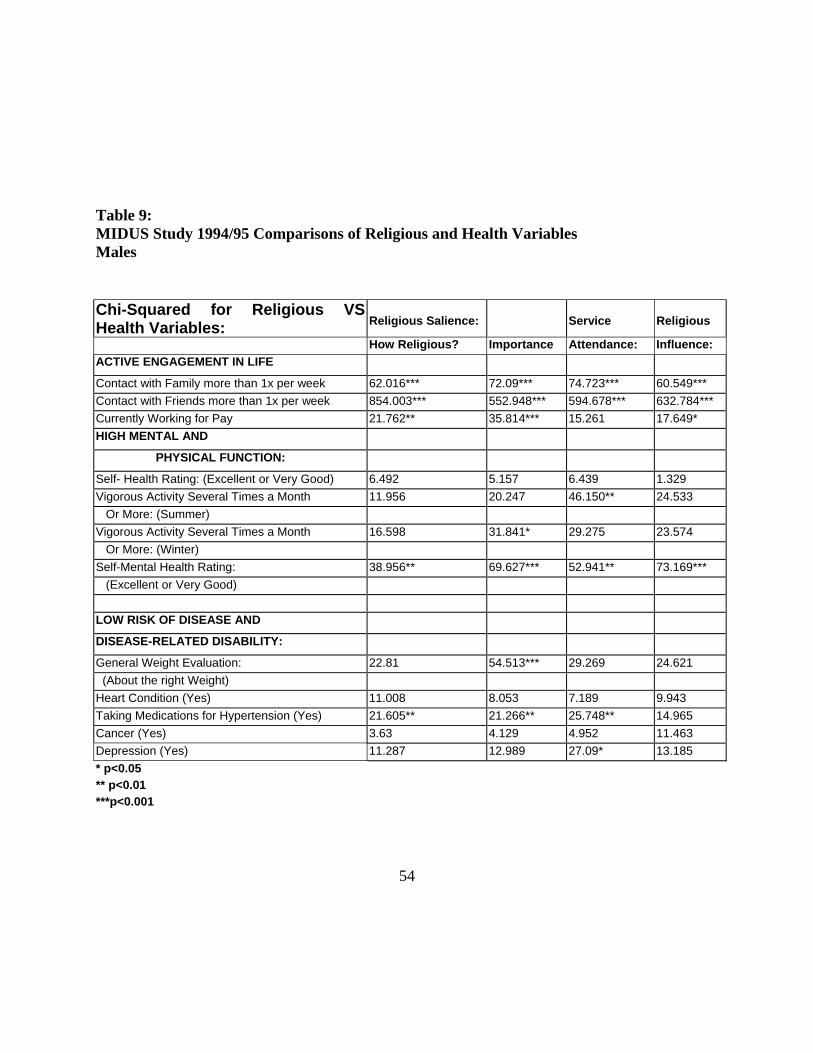
Table 9: MIDUS Study 1994/95 Comparisons of Religious and Health Variables Males
Chi-Squared for Religious VS Health Variables:
Religious Salience:
Service
Religious
How Religious? Importance Attendance: Influence: ACTIVE ENGAGEMENT IN LIFE
Contact with Family more than 1x per week 62.016*** 72.09*** 74.723*** 60.549*** Contact with Friends more than 1x per week 854.003*** 552.948*** 594.678*** 632.784*** Currently Working for Pay 21.762** 35.814*** 15.261 17.649* HIGH MENTAL AND
PHYSICAL FUNCTION:
Self- Health Rating: (Excellent or Very Good) 6.492 5.157 6.439 1.329 Vigorous Activity Several Times a Month 11.956 20.247 46.150** 24.533 Or More: (Summer) Vigorous Activity Several Times a Month 16.598 31.841* 29.275 23.574 Or More: (Winter) Self-Mental Health Rating: 38.956** 69.627*** 52.941** 73.169*** (Excellent or Very Good) LOW RISK OF DISEASE AND
DISEASE-RELATED DISABILITY:
General Weight Evaluation: 22.81 54.513*** 29.269 24.621 (About the right Weight) Heart Condition (Yes) 11.008 8.053 7.189 9.943 Taking Medications for Hypertension (Yes) 21.605** 21.266** 25.748** 14.965 Cancer (Yes) 3.63 4.129 4.952 11.463 Depression (Yes) 11.287 12.989 27.09* 13.185 * p<0.05 ** p<0.01 ***p<0.001
54
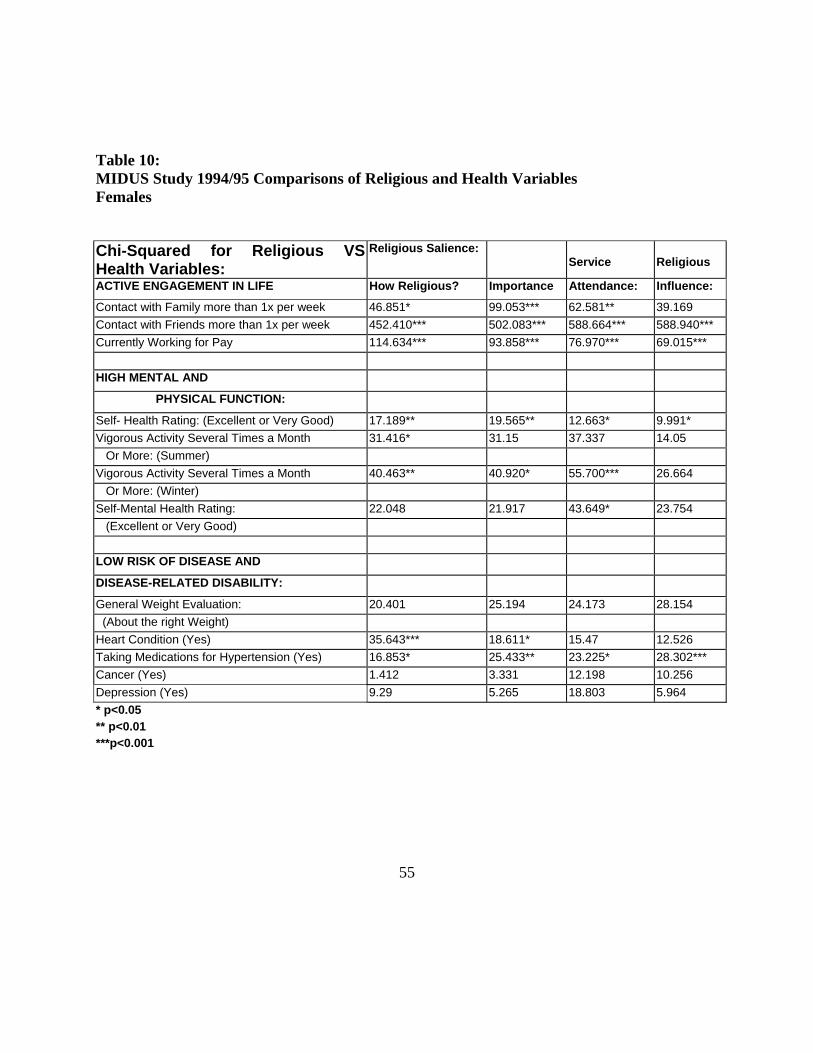
Table 10: MIDUS Study 1994/95 Comparisons of Religious and Health Variables Females
Chi-Squared for Religious VS Health Variables:
Religious Salience: Service
Religious
ACTIVE ENGAGEMENT IN LIFE How Religious? Importance Attendance: Influence:
Contact with Family more than 1x per week 46.851* 99.053*** 62.581** 39.169 Contact with Friends more than 1x per week 452.410*** 502.083*** 588.664*** 588.940*** Currently Working for Pay 114.634*** 93.858*** 76.970*** 69.015*** HIGH MENTAL AND
PHYSICAL FUNCTION:
Self- Health Rating: (Excellent or Very Good) 17.189** 19.565** 12.663* 9.991* Vigorous Activity Several Times a Month 31.416* 31.15 37.337 14.05 Or More: (Summer) Vigorous Activity Several Times a Month 40.463** 40.920* 55.700*** 26.664 Or More: (Winter) Self-Mental Health Rating: 22.048 21.917 43.649* 23.754 (Excellent or Very Good) LOW RISK OF DISEASE AND
DISEASE-RELATED DISABILITY:
General Weight Evaluation: 20.401 25.194 24.173 28.154 (About the right Weight) Heart Condition (Yes) 35.643*** 18.611* 15.47 12.526 Taking Medications for Hypertension (Yes) 16.853* 25.433** 23.225* 28.302*** Cancer (Yes) 1.412 3.331 12.198 10.256 Depression (Yes) 9.29 5.265 18.803 5.964 * p<0.05 ** p<0.01 ***p<0.001
55
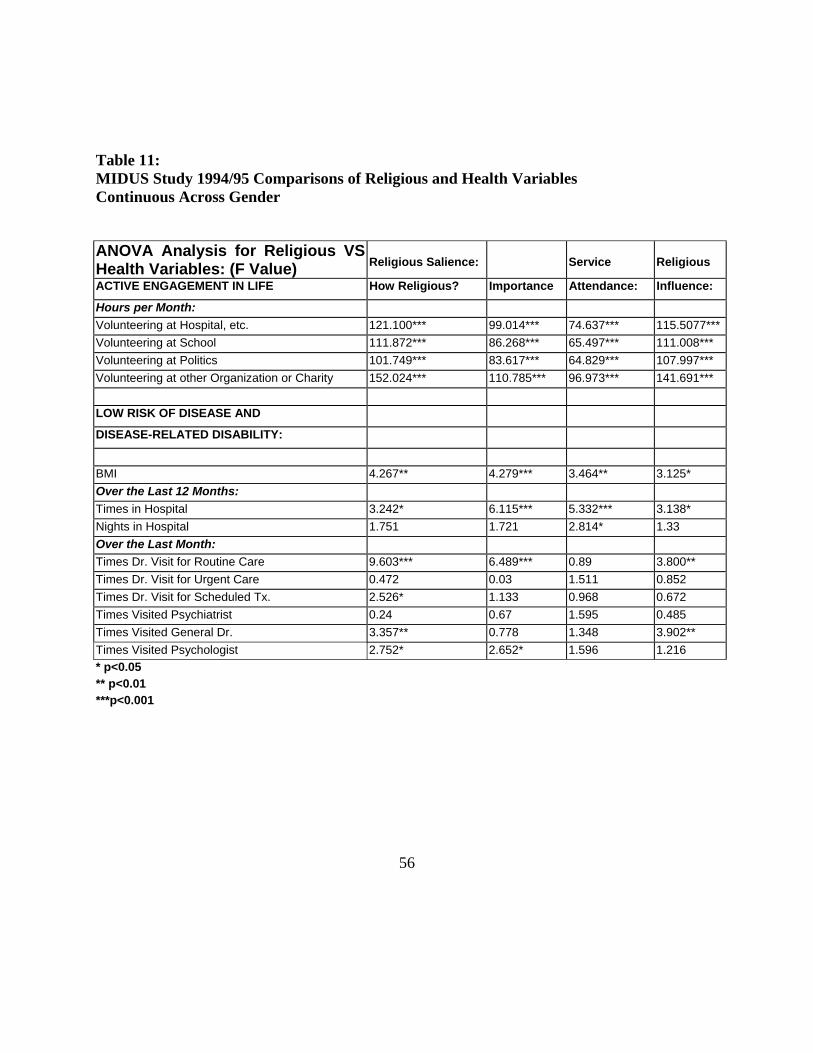
Table 11: MIDUS Study 1994/95 Comparisons of Religious and Health Variables Continuous Across Gender
ANOVA Analysis for Religious VS Health Variables: (F Value)
Religious Salience:
Service
Religious
ACTIVE ENGAGEMENT IN LIFE How Religious? Importance Attendance: Influence:
Hours per Month: Volunteering at Hospital, etc. 121.100*** 99.014*** 74.637*** 115.5077***Volunteering at School 111.872*** 86.268*** 65.497*** 111.008*** Volunteering at Politics 101.749*** 83.617*** 64.829*** 107.997*** Volunteering at other Organization or Charity 152.024*** 110.785*** 96.973*** 141.691*** LOW RISK OF DISEASE AND
DISEASE-RELATED DISABILITY:
BMI 4.267** 4.279*** 3.464** 3.125* Over the Last 12 Months: Times in Hospital 3.242* 6.115*** 5.332*** 3.138* Nights in Hospital 1.751 1.721 2.814* 1.33 Over the Last Month: Times Dr. Visit for Routine Care 9.603*** 6.489*** 0.89 3.800** Times Dr. Visit for Urgent Care 0.472 0.03 1.511 0.852 Times Dr. Visit for Scheduled Tx. 2.526* 1.133 0.968 0.672 Times Visited Psychiatrist 0.24 0.67 1.595 0.485 Times Visited General Dr. 3.357** 0.778 1.348 3.902** Times Visited Psychologist 2.752* 2.652* 1.596 1.216 * p<0.05 ** p<0.01 ***p<0.001
56
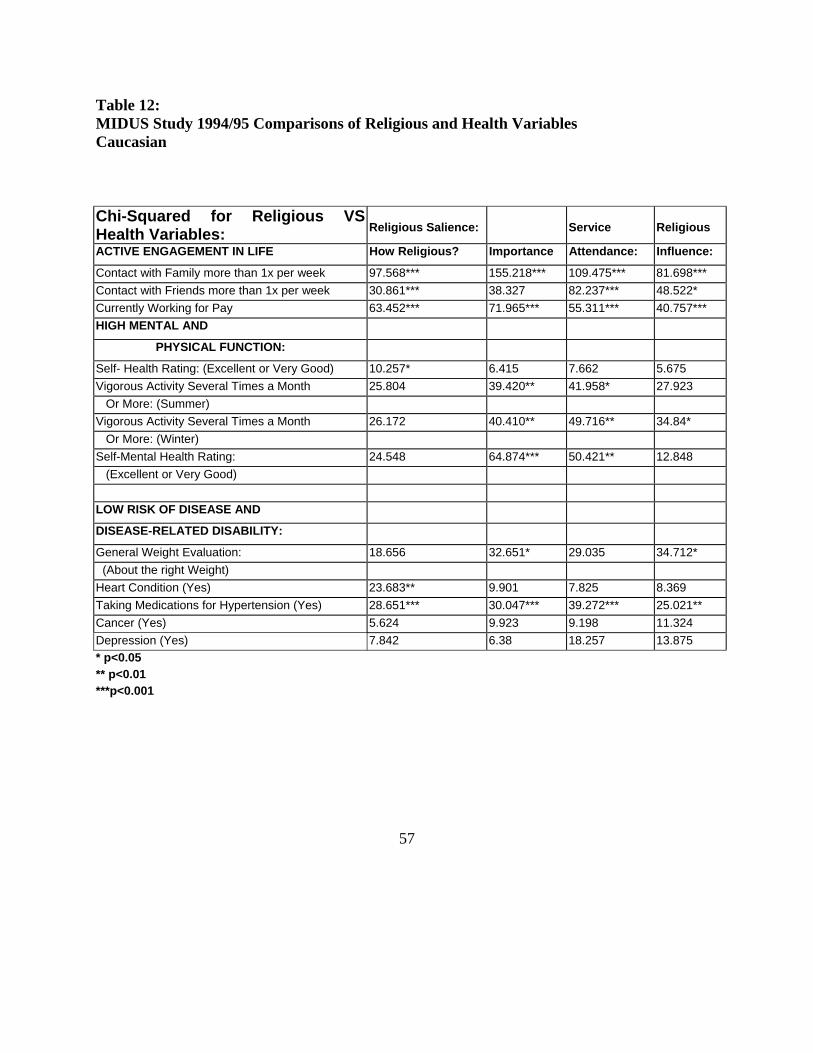
Table 12: MIDUS Study 1994/95 Comparisons of Religious and Health Variables Caucasian
Chi-Squared for Religious VS Health Variables:
Religious Salience:
Service
Religious
ACTIVE ENGAGEMENT IN LIFE How Religious? Importance Attendance: Influence:
Contact with Family more than 1x per week 97.568*** 155.218*** 109.475*** 81.698*** Contact with Friends more than 1x per week 30.861*** 38.327 82.237*** 48.522* Currently Working for Pay 63.452*** 71.965*** 55.311*** 40.757*** HIGH MENTAL AND
PHYSICAL FUNCTION:
Self- Health Rating: (Excellent or Very Good) 10.257* 6.415 7.662 5.675 Vigorous Activity Several Times a Month 25.804 39.420** 41.958* 27.923 Or More: (Summer) Vigorous Activity Several Times a Month 26.172 40.410** 49.716** 34.84* Or More: (Winter) Self-Mental Health Rating: 24.548 64.874*** 50.421** 12.848 (Excellent or Very Good) LOW RISK OF DISEASE AND
DISEASE-RELATED DISABILITY:
General Weight Evaluation: 18.656 32.651* 29.035 34.712* (About the right Weight) Heart Condition (Yes) 23.683** 9.901 7.825 8.369 Taking Medications for Hypertension (Yes) 28.651*** 30.047*** 39.272*** 25.021** Cancer (Yes) 5.624 9.923 9.198 11.324 Depression (Yes) 7.842 6.38 18.257 13.875 * p<0.05 ** p<0.01 ***p<0.001
57
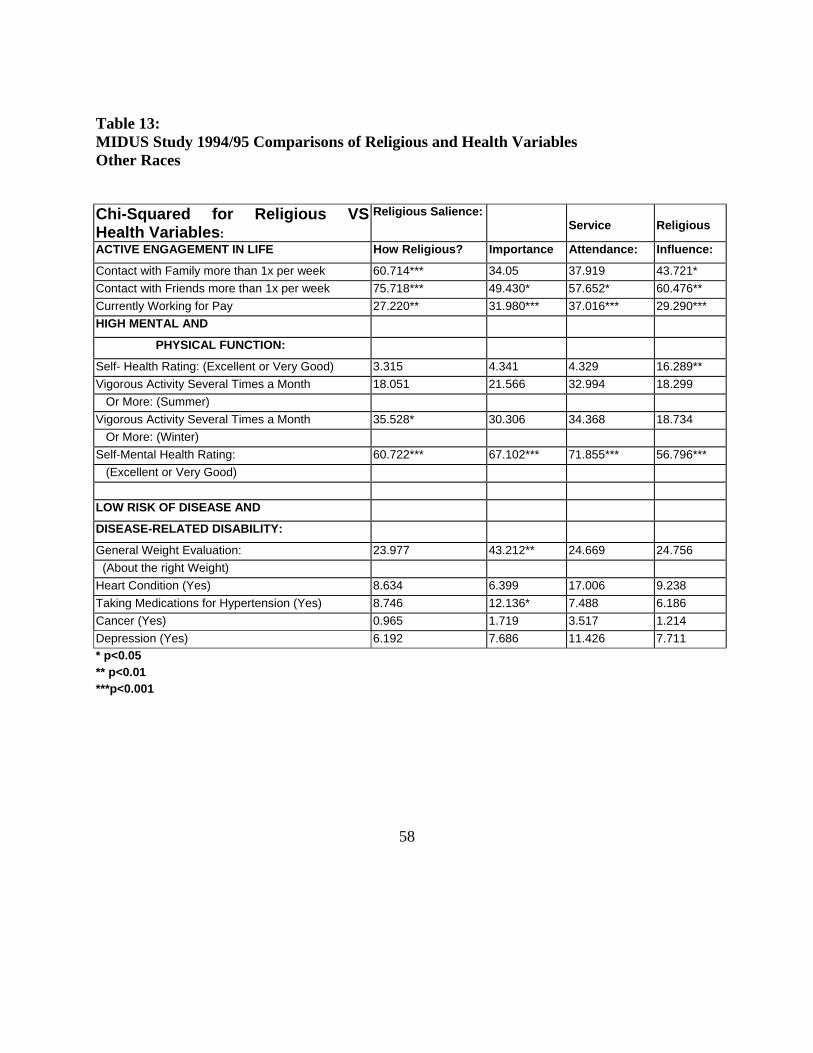
Table 13: MIDUS Study 1994/95 Comparisons of Religious and Health Variables Other Races
Chi-Squared for Religious VS Health Variables:
Religious Salience: Service
Religious
ACTIVE ENGAGEMENT IN LIFE How Religious? Importance Attendance: Influence:
Contact with Family more than 1x per week 60.714*** 34.05 37.919 43.721* Contact with Friends more than 1x per week 75.718*** 49.430* 57.652* 60.476** Currently Working for Pay 27.220** 31.980*** 37.016*** 29.290*** HIGH MENTAL AND
PHYSICAL FUNCTION:
Self- Health Rating: (Excellent or Very Good) 3.315 4.341 4.329 16.289** Vigorous Activity Several Times a Month 18.051 21.566 32.994 18.299 Or More: (Summer) Vigorous Activity Several Times a Month 35.528* 30.306 34.368 18.734 Or More: (Winter) Self-Mental Health Rating: 60.722*** 67.102*** 71.855*** 56.796*** (Excellent or Very Good) LOW RISK OF DISEASE AND
DISEASE-RELATED DISABILITY:
General Weight Evaluation: 23.977 43.212** 24.669 24.756 (About the right Weight) Heart Condition (Yes) 8.634 6.399 17.006 9.238 Taking Medications for Hypertension (Yes) 8.746 12.136* 7.488 6.186 Cancer (Yes) 0.965 1.719 3.517 1.214 Depression (Yes) 6.192 7.686 11.426 7.711 * p<0.05 ** p<0.01 ***p<0.001
58
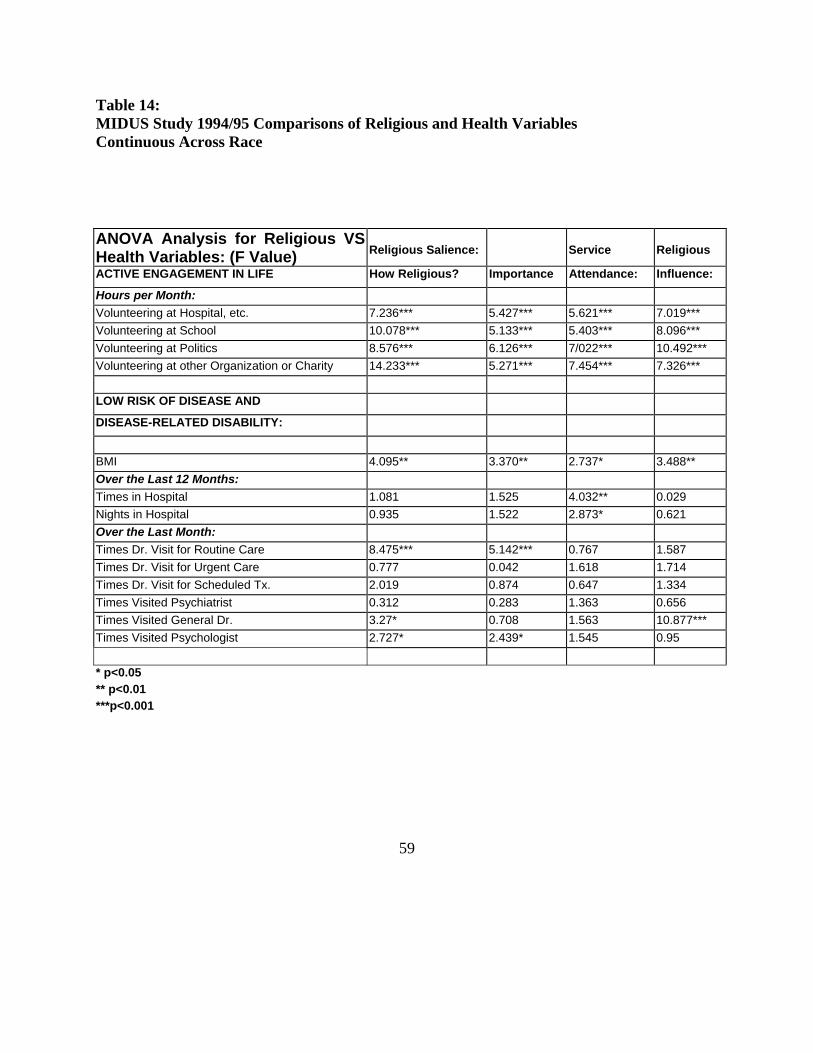
Table 14: MIDUS Study 1994/95 Comparisons of Religious and Health Variables Continuous Across Race
ANOVA Analysis for Religious VS Health Variables: (F Value)
Religious Salience:
Service
Religious
ACTIVE ENGAGEMENT IN LIFE How Religious? Importance Attendance: Influence:
Hours per Month: Volunteering at Hospital, etc. 7.236*** 5.427*** 5.621*** 7.019*** Volunteering at School 10.078*** 5.133*** 5.403*** 8.096*** Volunteering at Politics 8.576*** 6.126*** 7/022*** 10.492*** Volunteering at other Organization or Charity 14.233*** 5.271*** 7.454*** 7.326*** LOW RISK OF DISEASE AND
DISEASE-RELATED DISABILITY:
BMI 4.095** 3.370** 2.737* 3.488** Over the Last 12 Months: Times in Hospital 1.081 1.525 4.032** 0.029 Nights in Hospital 0.935 1.522 2.873* 0.621 Over the Last Month: Times Dr. Visit for Routine Care 8.475*** 5.142*** 0.767 1.587 Times Dr. Visit for Urgent Care 0.777 0.042 1.618 1.714 Times Dr. Visit for Scheduled Tx. 2.019 0.874 0.647 1.334 Times Visited Psychiatrist 0.312 0.283 1.363 0.656 Times Visited General Dr. 3.27* 0.708 1.563 10.877*** Times Visited Psychologist 2.727* 2.439* 1.545 0.95 * p<0.05 ** p<0.01 ***p<0.001
59
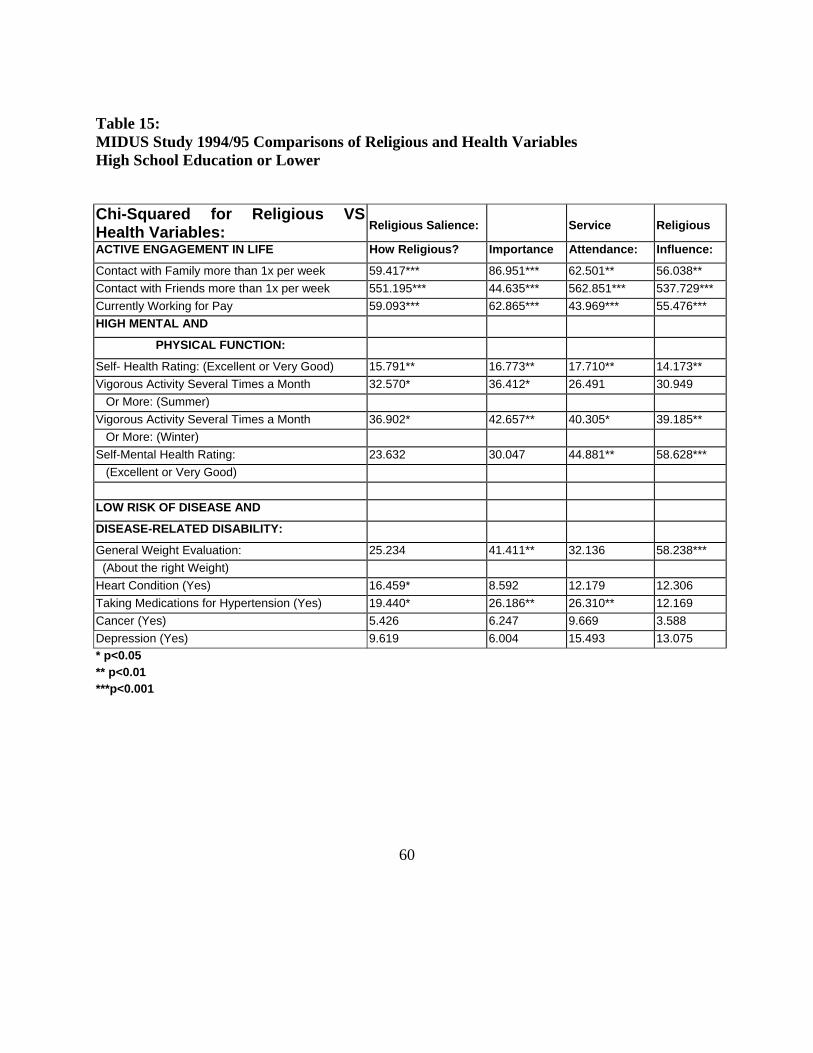
Table 15: MIDUS Study 1994/95 Comparisons of Religious and Health Variables High School Education or Lower
Chi-Squared for Religious VS Health Variables:
Religious Salience:
Service
Religious
ACTIVE ENGAGEMENT IN LIFE How Religious? Importance Attendance: Influence:
Contact with Family more than 1x per week 59.417*** 86.951*** 62.501** 56.038** Contact with Friends more than 1x per week 551.195*** 44.635*** 562.851*** 537.729*** Currently Working for Pay 59.093*** 62.865*** 43.969*** 55.476*** HIGH MENTAL AND
PHYSICAL FUNCTION:
Self- Health Rating: (Excellent or Very Good) 15.791** 16.773** 17.710** 14.173** Vigorous Activity Several Times a Month 32.570* 36.412* 26.491 30.949 Or More: (Summer) Vigorous Activity Several Times a Month 36.902* 42.657** 40.305* 39.185** Or More: (Winter) Self-Mental Health Rating: 23.632 30.047 44.881** 58.628*** (Excellent or Very Good) LOW RISK OF DISEASE AND
DISEASE-RELATED DISABILITY:
General Weight Evaluation: 25.234 41.411** 32.136 58.238*** (About the right Weight) Heart Condition (Yes) 16.459* 8.592 12.179 12.306 Taking Medications for Hypertension (Yes) 19.440* 26.186** 26.310** 12.169 Cancer (Yes) 5.426 6.247 9.669 3.588 Depression (Yes) 9.619 6.004 15.493 13.075 * p<0.05 ** p<0.01 ***p<0.001
60
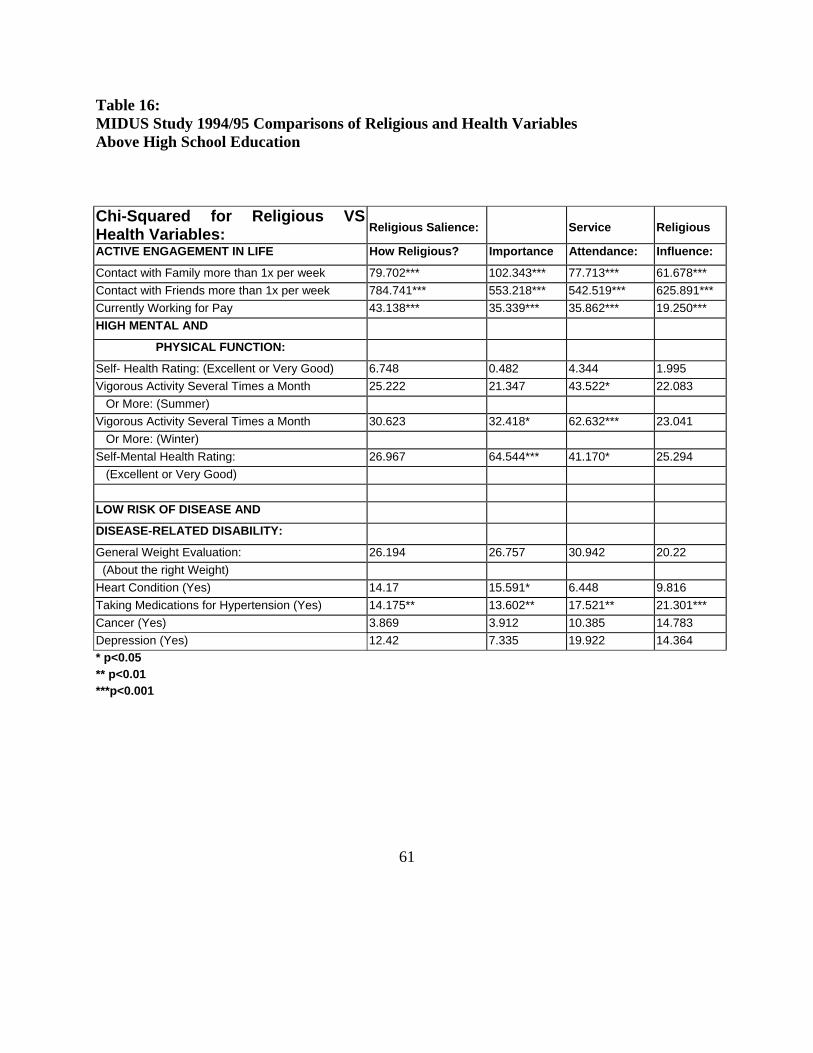
Table 16: MIDUS Study 1994/95 Comparisons of Religious and Health Variables Above High School Education
Chi-Squared for Religious VS Health Variables:
Religious Salience:
Service
Religious
ACTIVE ENGAGEMENT IN LIFE How Religious? Importance Attendance: Influence:
Contact with Family more than 1x per week 79.702*** 102.343*** 77.713*** 61.678*** Contact with Friends more than 1x per week 784.741*** 553.218*** 542.519*** 625.891*** Currently Working for Pay 43.138*** 35.339*** 35.862*** 19.250*** HIGH MENTAL AND
PHYSICAL FUNCTION:
Self- Health Rating: (Excellent or Very Good) 6.748 0.482 4.344 1.995 Vigorous Activity Several Times a Month 25.222 21.347 43.522* 22.083 Or More: (Summer) Vigorous Activity Several Times a Month 30.623 32.418* 62.632*** 23.041 Or More: (Winter) Self-Mental Health Rating: 26.967 64.544*** 41.170* 25.294 (Excellent or Very Good) LOW RISK OF DISEASE AND
DISEASE-RELATED DISABILITY:
General Weight Evaluation: 26.194 26.757 30.942 20.22 (About the right Weight) Heart Condition (Yes) 14.17 15.591* 6.448 9.816 Taking Medications for Hypertension (Yes) 14.175** 13.602** 17.521** 21.301*** Cancer (Yes) 3.869 3.912 10.385 14.783 Depression (Yes) 12.42 7.335 19.922 14.364 * p<0.05 ** p<0.01 ***p<0.001
61

Table 17: MIDUS Study 1994/95 Comparisons of Religious and Health Variables Continuous Across Education
ANOVA Analysis for Religious VS Health Variables: (F Value)
Religious Salience:
Service
Religious
ACTIVE ENGAGEMENT IN LIFE How Religious? Importance Attendance: Influence:
Hours per Month: Volunteering at Hospital, etc. 121.018*** 98.942*** 74.579*** 114.988*** Volunteering at School 111.798*** 86.207*** 65.444*** 110.931*** Volunteering at Politics 101.680*** 83.556*** 64.778*** 107.919*** Volunteering at other Organization or Charity 151.954*** 110.175*** 96.91*** 141.6*** LOW RISK OF DISEASE AND
DISEASE-RELATED DISABILITY:
BMI 4.169*** 4.292** 3.545** 3.990* Over the Last 12 Months: Times in Hospital 3.243* 6.113*** 5.333*** 3.134* Nights in Hospital 1.751 1.721 2.814* 1.33 Over the Last Month: Times Dr. Visit for Routine Care 9.588*** 6.467*** 0.775 3.778** Times Dr. Visit for Urgent Care 0.472 0.031 1.51 0.853 Times Dr. Visit for Scheduled Tx. 2.522* 1.146 0.97 0.664 Times Visited Psychiatrist 0.241 0.37 1.603 0.485 Times Visited General Dr. 3.373** 0.769 1.344 3.893** Times Visited Psychologist 2.766* 2.66* 1.593 1.212 * p<0.05 ** p<0.01 ***p<0.001
62
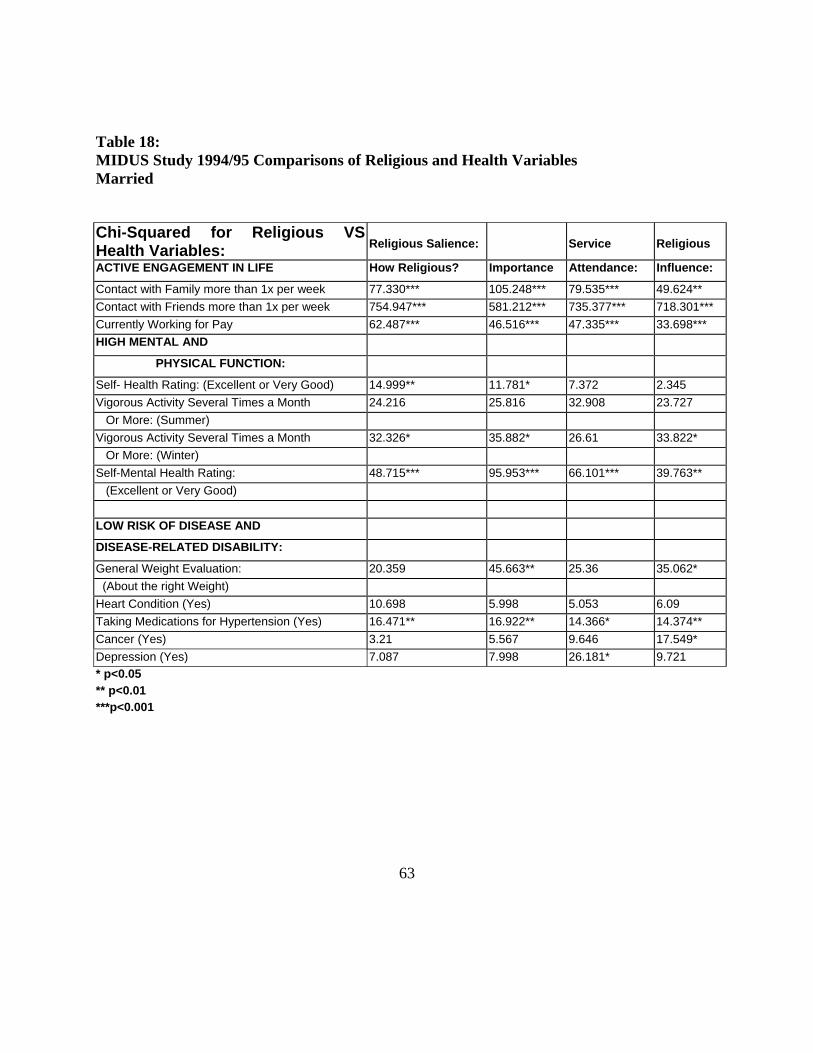
Table 18: MIDUS Study 1994/95 Comparisons of Religious and Health Variables Married
Chi-Squared for Religious VS Health Variables:
Religious Salience:
Service
Religious
ACTIVE ENGAGEMENT IN LIFE How Religious? Importance Attendance: Influence:
Contact with Family more than 1x per week 77.330*** 105.248*** 79.535*** 49.624** Contact with Friends more than 1x per week 754.947*** 581.212*** 735.377*** 718.301*** Currently Working for Pay 62.487*** 46.516*** 47.335*** 33.698*** HIGH MENTAL AND
PHYSICAL FUNCTION:
Self- Health Rating: (Excellent or Very Good) 14.999** 11.781* 7.372 2.345 Vigorous Activity Several Times a Month 24.216 25.816 32.908 23.727 Or More: (Summer) Vigorous Activity Several Times a Month 32.326* 35.882* 26.61 33.822* Or More: (Winter) Self-Mental Health Rating: 48.715*** 95.953*** 66.101*** 39.763** (Excellent or Very Good) LOW RISK OF DISEASE AND
DISEASE-RELATED DISABILITY:
General Weight Evaluation: 20.359 45.663** 25.36 35.062* (About the right Weight) Heart Condition (Yes) 10.698 5.998 5.053 6.09 Taking Medications for Hypertension (Yes) 16.471** 16.922** 14.366* 14.374** Cancer (Yes) 3.21 5.567 9.646 17.549* Depression (Yes) 7.087 7.998 26.181* 9.721 * p<0.05 ** p<0.01 ***p<0.001
63

Table 19: MIDUS Study 1994/95 Comparisons of Religious and Health Variables Not Married
Chi-Squared for Religious VS Health Variables:
Religious Salience:
Service
Religious
ACTIVE ENGAGEMENT IN LIFE How Religious? Importance Attendance: Influence:
Contact with Family more than 1x per week 63.806*** 91.611*** 63.631** 59.904*** Contact with Friends more than 1x per week 594.724*** 452.482*** 436.473*** 489.069*** Currently Working for Pay 60.804*** 105.430*** 37.807*** 52.836*** HIGH MENTAL AND
PHYSICAL FUNCTION:
Self- Health Rating: (Excellent or Very Good) 8.894 10.792* 4.547 5.735 Vigorous Activity Several Times a Month 36.113* 55.103*** 44.930** 35.520* Or More: (Summer) Vigorous Activity Several Times a Month 43.442** 52.174*** 58.653*** 32.682* Or More: (Winter) Self-Mental Health Rating: 15.101 15.721 35.16 23.871 (Excellent or Very Good) LOW RISK OF DISEASE AND
DISEASE-RELATED DISABILITY:
General Weight Evaluation: 27.647 39.741** 26.125 32.648* (About the right Weight) Heart Condition (Yes) 23.973 19.900* 16.689 12.441 Taking Medications for Hypertension (Yes) 18.455* 25.094** 31.604*** 19.101* Cancer (Yes) 7.589 8.293 12.951 7.669 Depression (Yes) 16.471 8.438 17.046 16.481 * p<0.05 ** p<0.01 ***p<0.001
64
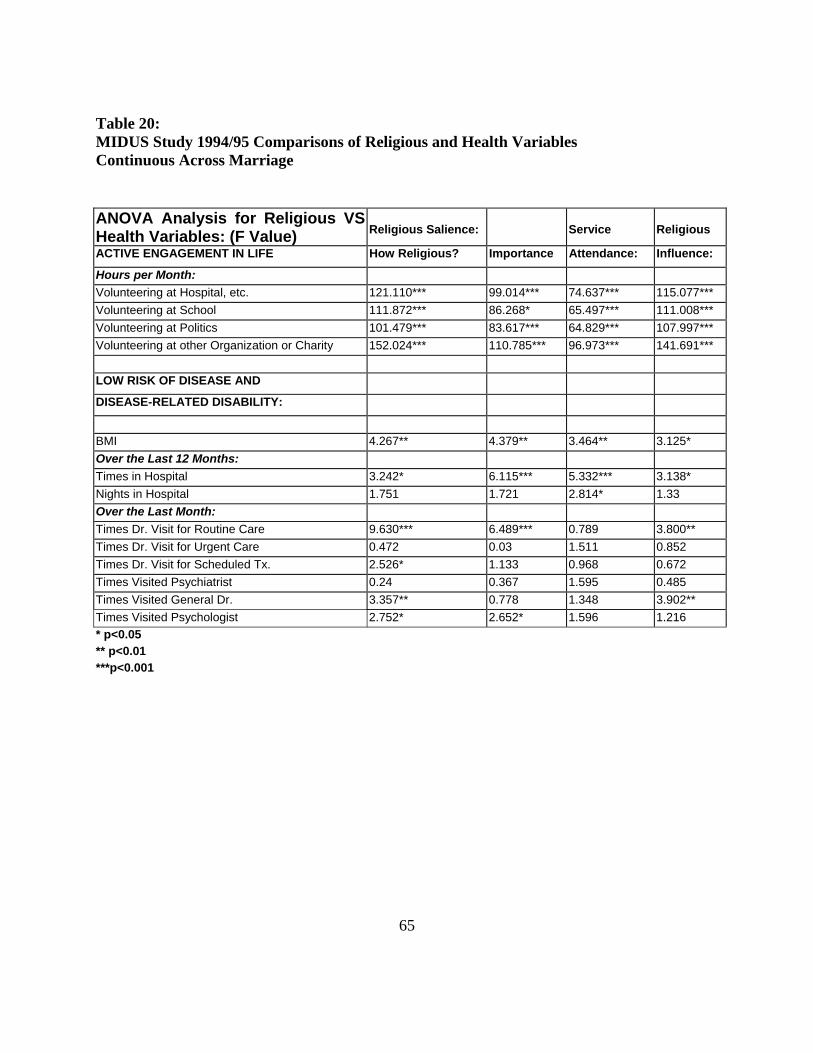
Table 20: MIDUS Study 1994/95 Comparisons of Religious and Health Variables Continuous Across Marriage
ANOVA Analysis for Religious VS Health Variables: (F Value)
Religious Salience:
Service
Religious
ACTIVE ENGAGEMENT IN LIFE How Religious? Importance Attendance: Influence:
Hours per Month: Volunteering at Hospital, etc. 121.110*** 99.014*** 74.637*** 115.077*** Volunteering at School 111.872*** 86.268* 65.497*** 111.008*** Volunteering at Politics 101.479*** 83.617*** 64.829*** 107.997*** Volunteering at other Organization or Charity 152.024*** 110.785*** 96.973*** 141.691*** LOW RISK OF DISEASE AND
DISEASE-RELATED DISABILITY:
BMI 4.267** 4.379** 3.464** 3.125* Over the Last 12 Months: Times in Hospital 3.242* 6.115*** 5.332*** 3.138* Nights in Hospital 1.751 1.721 2.814* 1.33 Over the Last Month: Times Dr. Visit for Routine Care 9.630*** 6.489*** 0.789 3.800** Times Dr. Visit for Urgent Care 0.472 0.03 1.511 0.852 Times Dr. Visit for Scheduled Tx. 2.526* 1.133 0.968 0.672 Times Visited Psychiatrist 0.24 0.367 1.595 0.485 Times Visited General Dr. 3.357** 0.778 1.348 3.902** Times Visited Psychologist 2.752* 2.652* 1.596 1.216 * p<0.05 ** p<0.01 ***p<0.001
65
The self ratings of physical and mental health were divided by individuals that ranked
themselves as excellent to very good and good to poor. All other variables were divided by yes
and no. For example, times in the hospital were divided by individuals that visited the hospital at
least once vs. those who were not over the last 12 months. An abbreviated model with the
predicted relationships is illustrated in Figure 2.
Upon completing the analysis, the only religiosity variable that was statistically
significant with the successful aging variables for high physical and mental health and low risk
of disease and disease-related disability once the active engagement in life variables were added
to the model was service attendance at least at the p<0.05 level.
These results indicate that individuals in the survey with higher levels of service
attendance who are currently employed and have regular contact with family and friends were
more likely to rank themselves as excellent to very good on both the self-health and mental
rating, have no hospital stays over the last 12 months, and have no presence of high blood
pressure, cancer, or depression. None of the other religiosity variables and successful aging
variables demonstrated statistical significant in this model analysis. The results of this analysis
were posted in tables 21, 22, and 23.
66
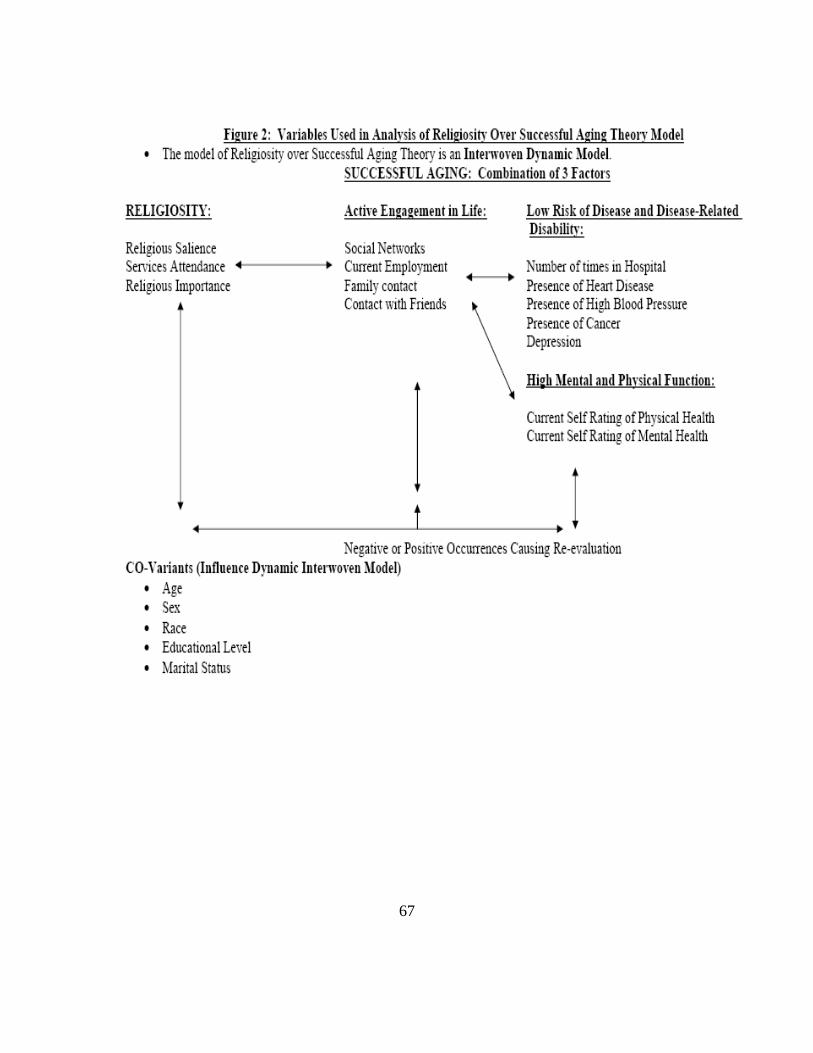
67
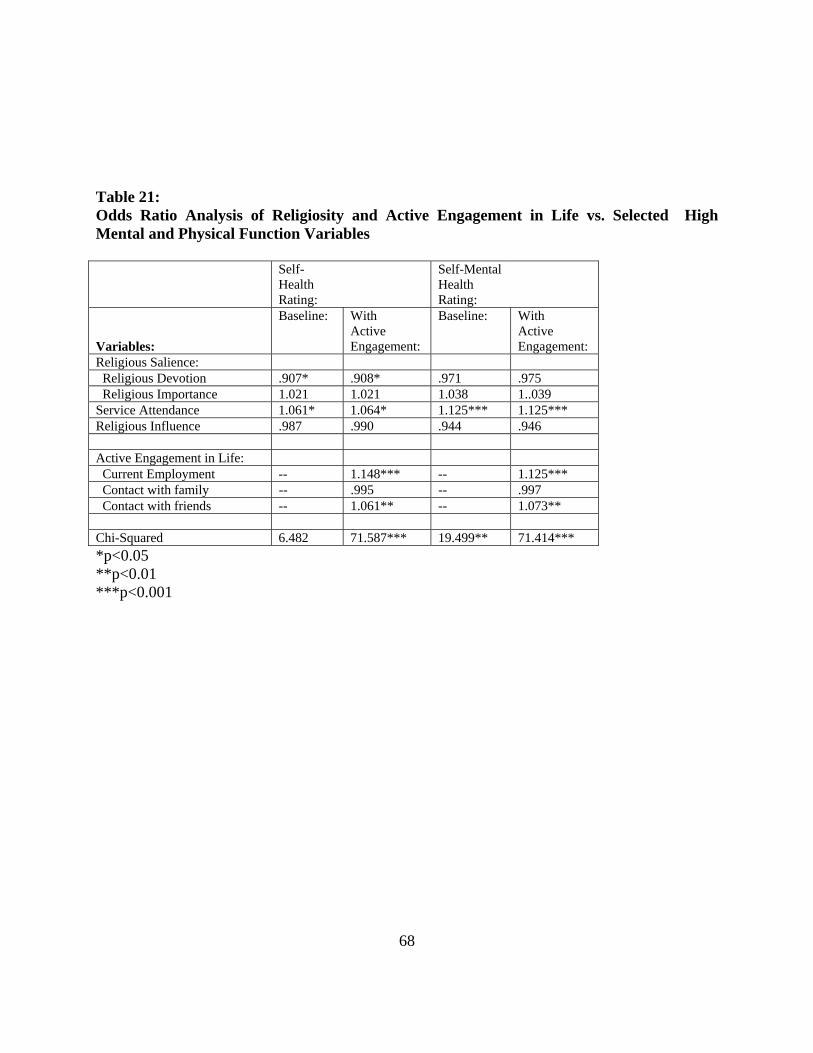
Table 21: Odds Ratio Analysis of Religiosity and Active Engagement in Life vs. Selected High Mental and Physical Function Variables Self-
Health Rating:
Self-Mental Health Rating:
Variables:
Baseline: With Active Engagement:
Baseline: With Active Engagement:
Religious Salience: Religious Devotion .907* .908* .971 .975 Religious Importance 1.021 1.021 1.038 1..039 Service Attendance 1.061* 1.064* 1.125*** 1.125*** Religious Influence .987 .990 .944 .946 Active Engagement in Life: Current Employment -- 1.148*** -- 1.125*** Contact with family -- .995 -- .997 Contact with friends -- 1.061** -- 1.073** Chi-Squared 6.482 71.587*** 19.499** 71.414*** *p<0.05 **p<0.01 ***p<0.001
68
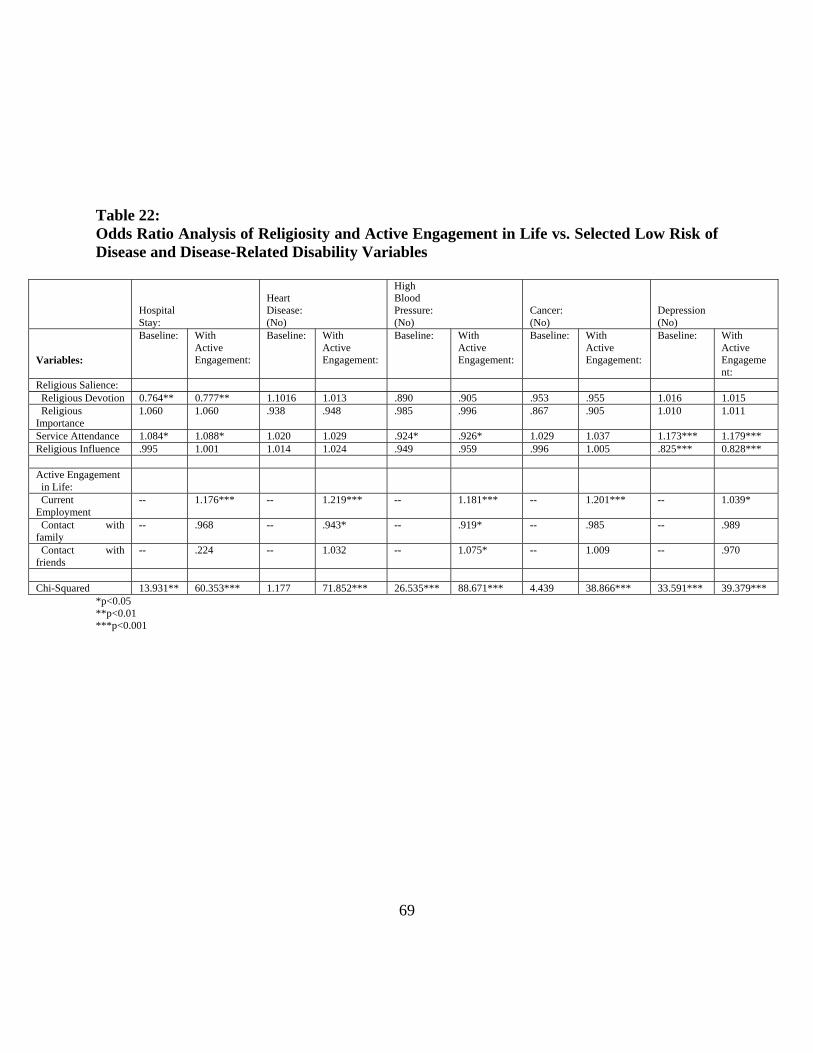
Table 22: Odds Ratio Analysis of Religiosity and Active Engagement in Life vs. Selected Low Risk of Disease and Disease-Related Disability Variables
Hospital Stay:
Heart Disease: (No)
High Blood Pressure: (No)
Cancer: (No)
Depression (No)
Variables:
Baseline: With Active Engagement:
Baseline: With Active Engagement:
Baseline: With Active Engagement:
Baseline: With Active Engagement:
Baseline: With Active Engagement:
Religious Salience: Religious Devotion 0.764** 0.777** 1.1016 1.013 .890 .905 .953 .955 1.016 1.015 Religious Importance
1.060 1.060 .938 .948 .985 .996 .867 .905 1.010 1.011
Service Attendance 1.084* 1.088* 1.020 1.029 .924* .926* 1.029 1.037 1.173*** 1.179*** Religious Influence .995 1.001 1.014 1.024 .949 .959 .996 1.005 .825*** 0.828*** Active Engagement in Life:
Current Employment
-- 1.176*** -- 1.219*** -- 1.181*** -- 1.201*** -- 1.039*
Contact with family
-- .968 -- .943* -- .919* -- .985 -- .989
Contact with friends
-- .224 -- 1.032 -- 1.075* -- 1.009 -- .970
Chi-Squared 13.931** 60.353*** 1.177 71.852*** 26.535*** 88.671*** 4.439 38.866*** 33.591*** 39.379***
*p<0.05 **p<0.01 ***p<0.001
69
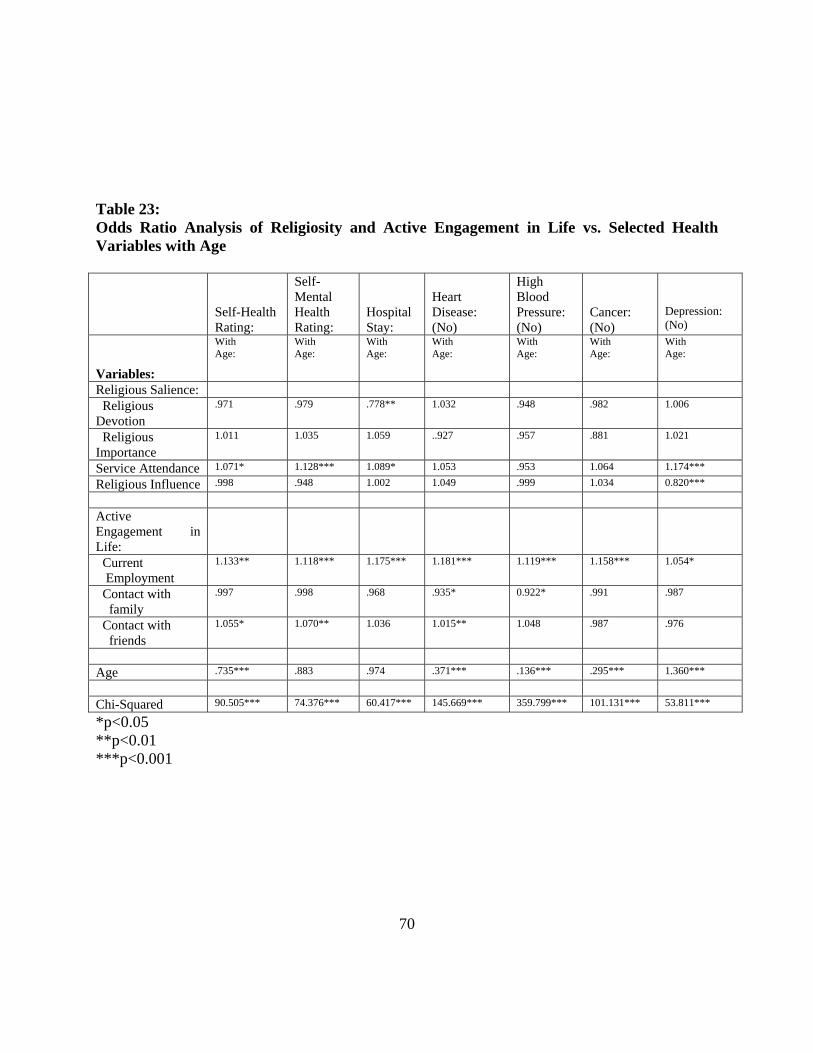
Table 23: Odds Ratio Analysis of Religiosity and Active Engagement in Life vs. Selected Health Variables with Age
Self-Health Rating:
Self-Mental Health Rating:
Hospital Stay:
Heart Disease: (No)
High Blood Pressure: (No)
Cancer: (No)
Depression: (No)
Variables:
With Age:
With Age:
With Age:
With Age:
With Age:
With Age:
With Age:
Religious Salience:
Religious Devotion
.971 .979 .778** 1.032 .948 .982 1.006
Religious Importance
1.011 1.035 1.059 ..927 .957 .881 1.021
Service Attendance 1.071* 1.128*** 1.089* 1.053 .953 1.064 1.174***
Religious Influence .998 .948 1.002 1.049 .999 1.034 0.820***
Active Engagement in Life:
Current Employment
1.133** 1.118*** 1.175*** 1.181*** 1.119*** 1.158*** 1.054*
Contact with family
.997 .998 .968 .935* 0.922* .991 .987
Contact with friends
1.055* 1.070** 1.036 1.015** 1.048 .987 .976
Age .735*** .883 .974 .371*** .136*** .295*** 1.360***
Chi-Squared 90.505*** 74.376*** 60.417*** 145.669*** 359.799*** 101.131*** 53.811***
*p<0.05 **p<0.01 ***p<0.001
70
4.2 Discussion, Summary, and Conclusions
The results indicate that there are several statistically significant relationships that exist
from analysis of this data set. However, interpretations of these results are limited due to the
survey information used. My conclusion is that there is a relationship between religiosity and
successful aging, but the impact and direction of the relationship cannot be determined in this
dissertation. Further study is required in this area. This study does stress the importance of
consideration for an individual’s personal religious beliefs when studying public issues or
providing health services in the community. It is not to say that the more religious a person is
makes them more healthy, but that religion does impact a person’s health is some ways that will
be directly determined through further study.
The data used for the study contained threats to validity. The subjects used came from
the MIDUS survey. They were prescreened using a telephone interview and then asked to fill
out a more extensive mailed survey. Although the subjects were randomly selected for the
telephone survey, they were limited to institutionalized, English-speaking adults and only 4,242
of the original 7,189 selected completed the second part of the survey. This limits the
generalizability of the dissertation results, because there may have been unique reasons why the
subjects chose to participate in the more extensive second survey. Additional limits to
generalizabiltity included the fact that the majority of the subjects classified their race as
Caucasian. There were a limited number of participants from other races. Although an analysis
was done, it is difficult to truly discussion the religiosity differences based on race from this data.
Another limitation in this study was the variables used for religiosity. The data collected
was not originally intended for the purposes of this dissertation. The variables selected were the
71
best available. Information regarding spiritually and other aspects of religiosity would have been
valuable information. In addition, the term religion is extremely hard to quantify and the
questions asked on the survey did not address all the aspects of religiosity that the subjects may
feel. Besides religiosity, the variables for the successful aging theory were selected from pre-
assigned survey questions. This is dynamic and at times hard to quantify.
Although there were limitations in this observational study, some relevant information
was discovered. The overall analysis demonstrated a relationship between the religiosity
variables selected (religious devotion, religious importance, service attendance, and religious
influence) and the social or active engagement in life variables from the successful aging theory.
These results indicate that there is relationship between how a person ranks themselves in
religiosity and social interaction with family, friends, work, and community. Individual with
increased social contact in these areas also ranked higher in all areas of religiosity. This
relationship also existed when compared across and controlled for age, sex, race, education, and
martial status. This means that there is a relationship regardless of the circumstances existing
between religiosity and social interaction. The direction of this relation is unknown. It is hard to
say whether religiosity affects social interaction or social interaction affects religiosity, but
regardless of the direction this finding is important to public health professionals. Increased
social networks and social interaction could lead to increased opportunity for health education
and access to health care.
Religiosity variables were also compared across several health outcome variables relating
to the successful aging model. Some common themes were the statistically relationship that
existed between self-rating of physical and mental health with all of the selected religiosity
72
variables. The higher a person rated themselves on the religiosity measures the more likely they
were to consider the physical and mental health as excellent to very good. In addition, older
individuals demonstrated this relationship more with physical health and younger individuals
with mental health. Mental health self ratings were also statistically related to several of the
religiosity variables for men, women, and Caucasians. Other common themes that existed were
a relationship between the number of times a person was in the hospital and routine doctor visits.
Individuals whether or not the data was controlled for age, sex, race, education, and marital
status demonstrated a relationship with decreased hospital visits, increased routine doctor visits
and higher rankings in at least one of the religiosity variables. These results indicate that the a
significant relationship exists between the religiosity variables selected and some of the
successful aging variables even when analyzed in the presence of age, sex, race, education and
marital status.
Finally, analysis of the theoretical model indicated a relationship existing between service
attendance and the health outcome variables. Self physical and mental health ranking, number of
times in hospital over the last 12 months, number of routine doctor visits, and the presence of
high blood pressure, cancer, and depression were all significantly related to service attendance
when the active engagement of life variables (employment, contact with family, and, friends)
were added to the model. These results indicate that active engagement in life may be a bridge
variable between successful aging health outcomes and service attendance. The other religiosity
variables did not remain significant when fitted into the model. Interpretation of this result is
limited, because it is hard to know whether increased service attendance led to healthier people
or healthier people attended service more.
73
Regardless of the limitations of the information discovered in this dissertation, the results
are important from a public health perspective. Although it is unknown whether religiosity
affects successful aging or vice versa, it is important for public health professionals to consider
religion. Religiosity affects health care in various ways. For example, an individual wh attends
services regularly may have a more extended social network which gives way to increased access
to health care. Religious venues may provide a good resource for preventative health services
and public health education. Most importantly, a person’s religious or spiritual beliefs may
affect the way a person deals with a chronic or acute physical or mental illness. The use of
religion as a coping skill should be considered and embraced by all public health professionals
when dealing with patients regardless of their own held beliefs. This dissertation has
documented a relationship that statistically exists between religiosity and the components of
successful aging (active engagement in life, high mental and physical function, and low risk of
disease and disease related disability) regardless of age. It is not to say that the more religious a
person is the healthier they are, but that religion can play an intricate role in an individual’s own
health in various ways.
74
APPENDIX A: FREQUENCY COMPARISONS OF HEALTH
RELIGIOSITY VARIABLES
75
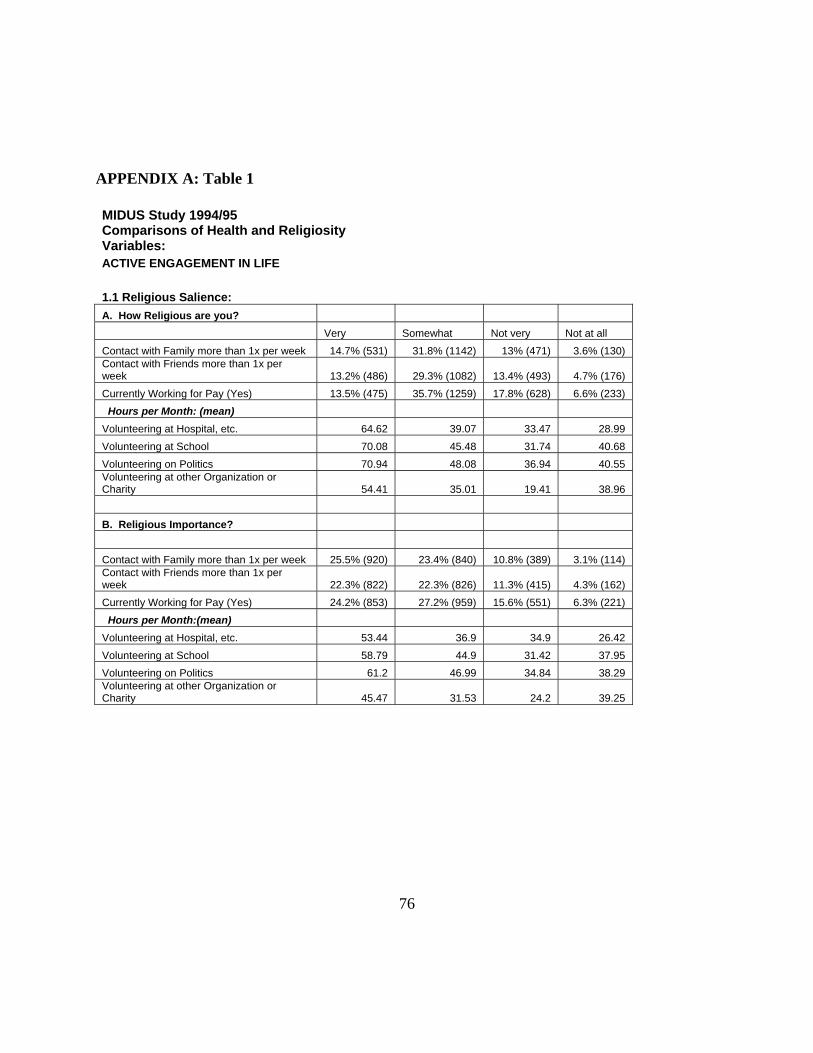
APPENDIX A: Table 1
MIDUS Study 1994/95 Comparisons of Health and Religiosity Variables: ACTIVE ENGAGEMENT IN LIFE 1.1 Religious Salience: A. How Religious are you? Very Somewhat Not very Not at all Contact with Family more than 1x per week 14.7% (531) 31.8% (1142) 13% (471) 3.6% (130) Contact with Friends more than 1x per week 13.2% (486) 29.3% (1082) 13.4% (493) 4.7% (176) Currently Working for Pay (Yes) 13.5% (475) 35.7% (1259) 17.8% (628) 6.6% (233) Hours per Month: (mean) Volunteering at Hospital, etc. 64.62 39.07 33.47 28.99 Volunteering at School 70.08 45.48 31.74 40.68 Volunteering on Politics 70.94 48.08 36.94 40.55 Volunteering at other Organization or Charity 54.41 35.01 19.41 38.96 B. Religious Importance? Contact with Family more than 1x per week 25.5% (920) 23.4% (840) 10.8% (389) 3.1% (114) Contact with Friends more than 1x per week 22.3% (822) 22.3% (826) 11.3% (415) 4.3% (162) Currently Working for Pay (Yes) 24.2% (853) 27.2% (959) 15.6% (551) 6.3% (221) Hours per Month:(mean) Volunteering at Hospital, etc. 53.44 36.9 34.9 26.42 Volunteering at School 58.79 44.9 31.42 37.95 Volunteering on Politics 61.2 46.99 34.84 38.29 Volunteering at other Organization or Charity 45.47 31.53 24.2 39.25
76
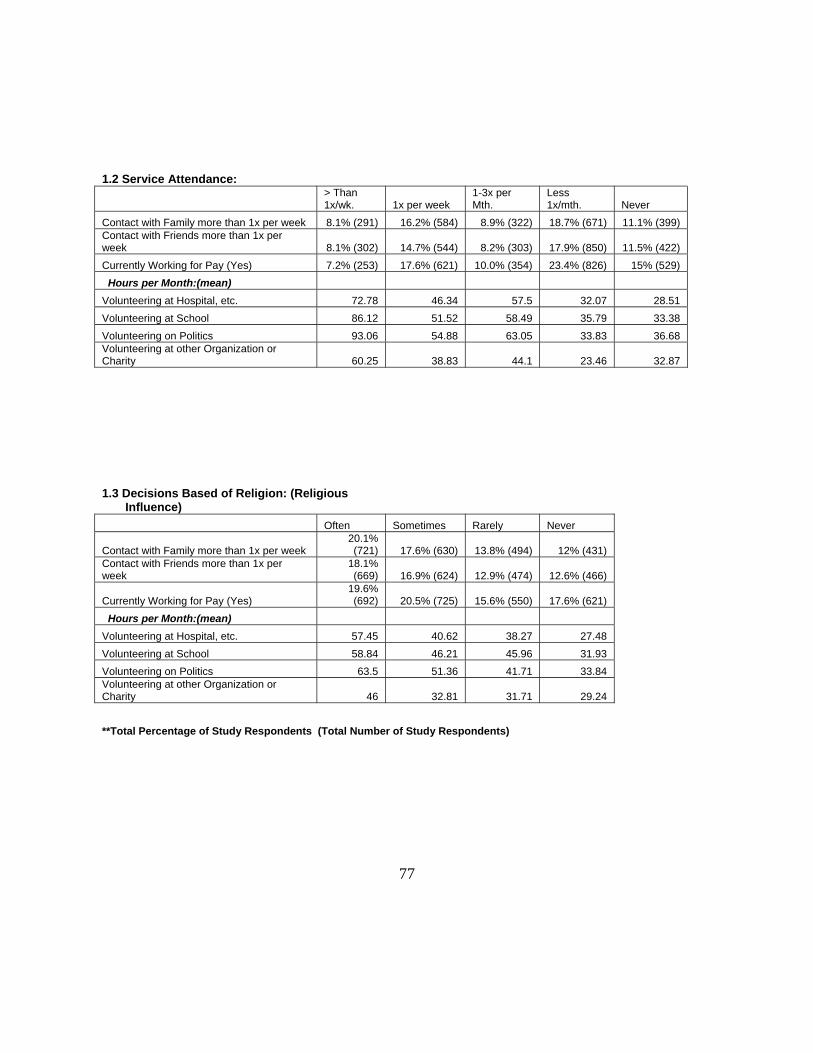
1.2 Service Attendance:
> Than 1x/wk. 1x per week
1-3x per Mth.
Less 1x/mth. Never
Contact with Family more than 1x per week 8.1% (291) 16.2% (584) 8.9% (322) 18.7% (671) 11.1% (399) Contact with Friends more than 1x per week 8.1% (302) 14.7% (544) 8.2% (303) 17.9% (850) 11.5% (422) Currently Working for Pay (Yes) 7.2% (253) 17.6% (621) 10.0% (354) 23.4% (826) 15% (529) Hours per Month:(mean) Volunteering at Hospital, etc. 72.78 46.34 57.5 32.07 28.51 Volunteering at School 86.12 51.52 58.49 35.79 33.38 Volunteering on Politics 93.06 54.88 63.05 33.83 36.68 Volunteering at other Organization or Charity 60.25 38.83 44.1 23.46 32.87 1.3 Decisions Based of Religion: (Religious Influence) Often Sometimes Rarely Never
Contact with Family more than 1x per week 20.1% (721) 17.6% (630) 13.8% (494) 12% (431)
Contact with Friends more than 1x per week
18.1% (669) 16.9% (624) 12.9% (474) 12.6% (466)
Currently Working for Pay (Yes) 19.6% (692) 20.5% (725) 15.6% (550) 17.6% (621)
Hours per Month:(mean) Volunteering at Hospital, etc. 57.45 40.62 38.27 27.48 Volunteering at School 58.84 46.21 45.96 31.93 Volunteering on Politics 63.5 51.36 41.71 33.84 Volunteering at other Organization or Charity 46 32.81 31.71 29.24 **Total Percentage of Study Respondents (Total Number of Study Respondents)
77
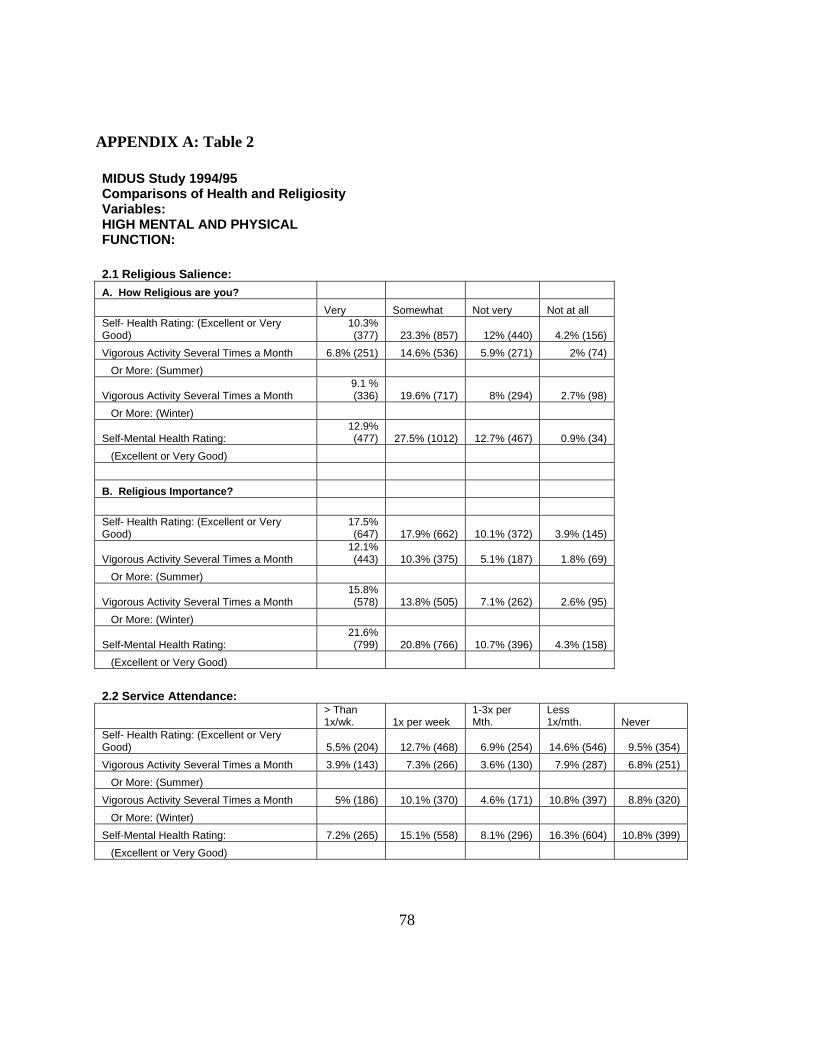
APPENDIX A: Table 2
MIDUS Study 1994/95 Comparisons of Health and Religiosity Variables: HIGH MENTAL AND PHYSICAL FUNCTION: 2.1 Religious Salience: A. How Religious are you? Very Somewhat Not very Not at all Self- Health Rating: (Excellent or Very Good)
10.3% (377) 23.3% (857) 12% (440) 4.2% (156)
Vigorous Activity Several Times a Month 6.8% (251) 14.6% (536) 5.9% (271) 2% (74) Or More: (Summer)
Vigorous Activity Several Times a Month 9.1 % (336) 19.6% (717) 8% (294) 2.7% (98)
Or More: (Winter)
Self-Mental Health Rating: 12.9% (477) 27.5% (1012) 12.7% (467) 0.9% (34)
(Excellent or Very Good) B. Religious Importance? Self- Health Rating: (Excellent or Very Good)
17.5% (647) 17.9% (662) 10.1% (372) 3.9% (145)
Vigorous Activity Several Times a Month 12.1% (443) 10.3% (375) 5.1% (187) 1.8% (69)
Or More: (Summer)
Vigorous Activity Several Times a Month 15.8% (578) 13.8% (505) 7.1% (262) 2.6% (95)
Or More: (Winter)
Self-Mental Health Rating: 21.6% (799) 20.8% (766) 10.7% (396) 4.3% (158)
(Excellent or Very Good) 2.2 Service Attendance:
> Than 1x/wk. 1x per week
1-3x per Mth.
Less 1x/mth. Never
Self- Health Rating: (Excellent or Very Good) 5.5% (204) 12.7% (468) 6.9% (254) 14.6% (546) 9.5% (354) Vigorous Activity Several Times a Month 3.9% (143) 7.3% (266) 3.6% (130) 7.9% (287) 6.8% (251) Or More: (Summer) Vigorous Activity Several Times a Month 5% (186) 10.1% (370) 4.6% (171) 10.8% (397) 8.8% (320) Or More: (Winter) Self-Mental Health Rating: 7.2% (265) 15.1% (558) 8.1% (296) 16.3% (604) 10.8% (399) (Excellent or Very Good)
78
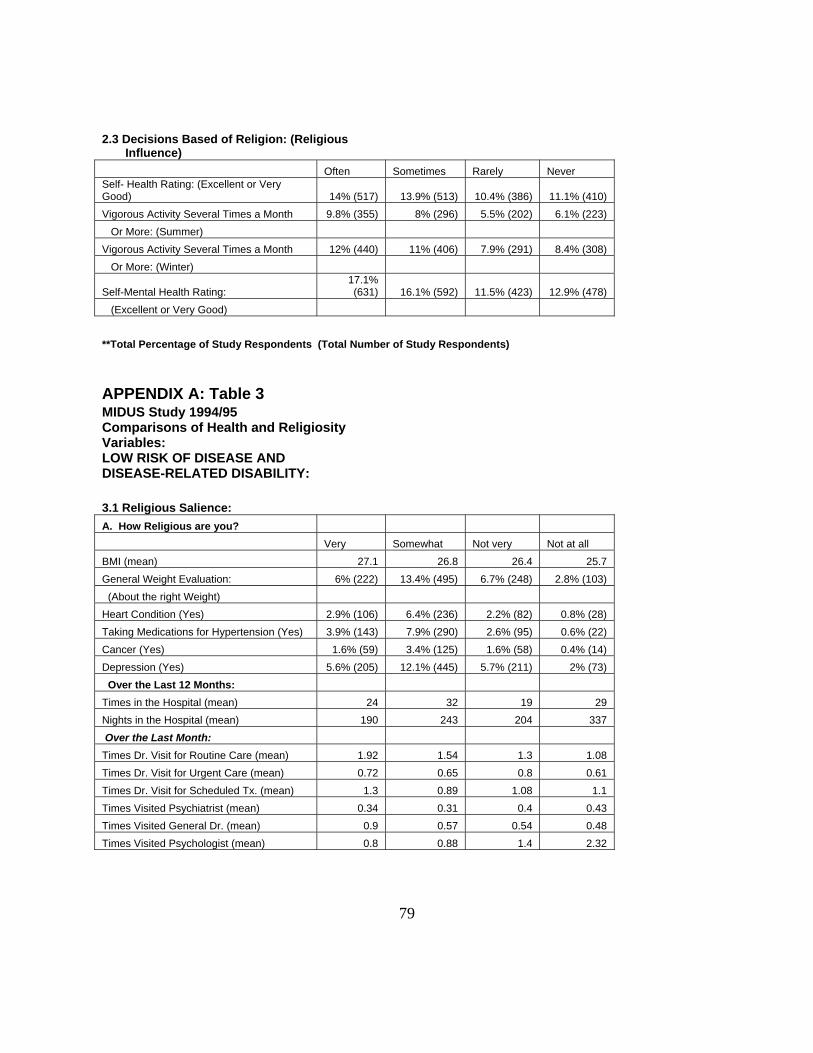
2.3 Decisions Based of Religion: (Religious Influence) Often Sometimes Rarely Never Self- Health Rating: (Excellent or Very Good) 14% (517) 13.9% (513) 10.4% (386) 11.1% (410) Vigorous Activity Several Times a Month 9.8% (355) 8% (296) 5.5% (202) 6.1% (223) Or More: (Summer) Vigorous Activity Several Times a Month 12% (440) 11% (406) 7.9% (291) 8.4% (308) Or More: (Winter)
Self-Mental Health Rating: 17.1% (631) 16.1% (592) 11.5% (423) 12.9% (478)
(Excellent or Very Good) **Total Percentage of Study Respondents (Total Number of Study Respondents) APPENDIX A: Table 3 MIDUS Study 1994/95 Comparisons of Health and Religiosity Variables: LOW RISK OF DISEASE AND DISEASE-RELATED DISABILITY: 3.1 Religious Salience: A. How Religious are you? Very Somewhat Not very Not at all BMI (mean) 27.1 26.8 26.4 25.7 General Weight Evaluation: 6% (222) 13.4% (495) 6.7% (248) 2.8% (103) (About the right Weight) Heart Condition (Yes) 2.9% (106) 6.4% (236) 2.2% (82) 0.8% (28) Taking Medications for Hypertension (Yes) 3.9% (143) 7.9% (290) 2.6% (95) 0.6% (22) Cancer (Yes) 1.6% (59) 3.4% (125) 1.6% (58) 0.4% (14) Depression (Yes) 5.6% (205) 12.1% (445) 5.7% (211) 2% (73) Over the Last 12 Months: Times in the Hospital (mean) 24 32 19 29 Nights in the Hospital (mean) 190 243 204 337 Over the Last Month: Times Dr. Visit for Routine Care (mean) 1.92 1.54 1.3 1.08 Times Dr. Visit for Urgent Care (mean) 0.72 0.65 0.8 0.61 Times Dr. Visit for Scheduled Tx. (mean) 1.3 0.89 1.08 1.1 Times Visited Psychiatrist (mean) 0.34 0.31 0.4 0.43 Times Visited General Dr. (mean) 0.9 0.57 0.54 0.48 Times Visited Psychologist (mean) 0.8 0.88 1.4 2.32
79
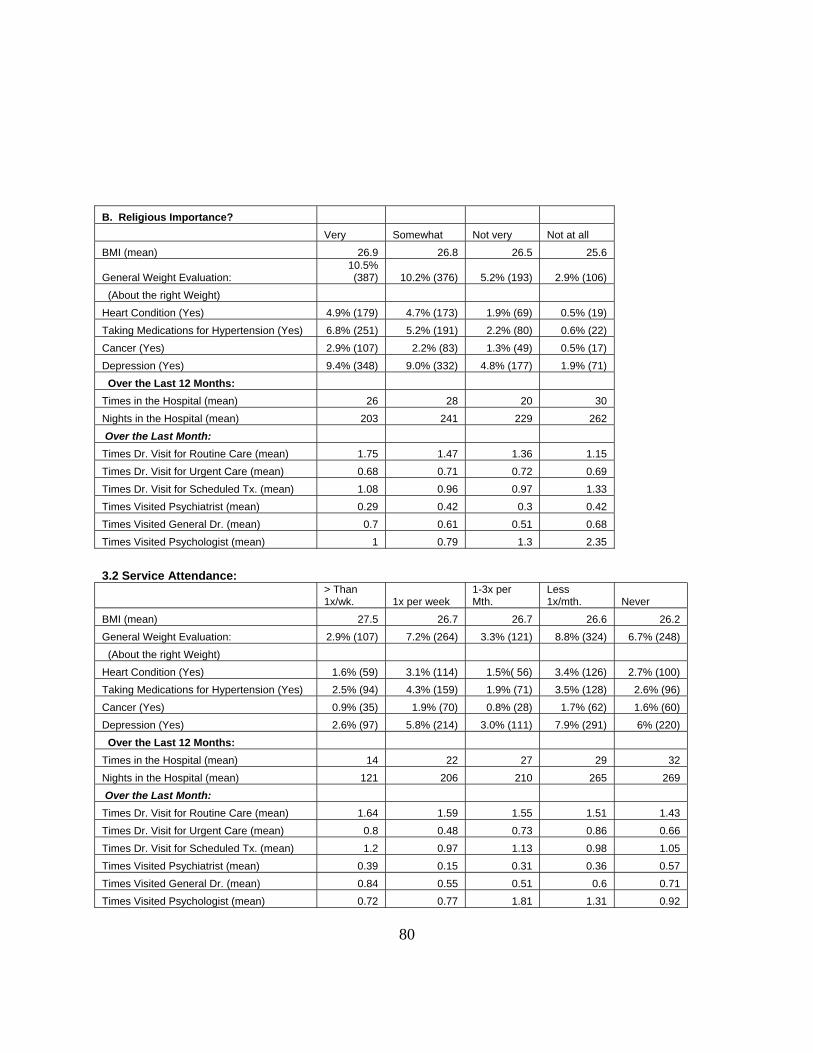
B. Religious Importance? Very Somewhat Not very Not at all BMI (mean) 26.9 26.8 26.5 25.6
General Weight Evaluation: 10.5% (387) 10.2% (376) 5.2% (193) 2.9% (106)
(About the right Weight) Heart Condition (Yes) 4.9% (179) 4.7% (173) 1.9% (69) 0.5% (19) Taking Medications for Hypertension (Yes) 6.8% (251) 5.2% (191) 2.2% (80) 0.6% (22) Cancer (Yes) 2.9% (107) 2.2% (83) 1.3% (49) 0.5% (17) Depression (Yes) 9.4% (348) 9.0% (332) 4.8% (177) 1.9% (71) Over the Last 12 Months: Times in the Hospital (mean) 26 28 20 30 Nights in the Hospital (mean) 203 241 229 262 Over the Last Month: Times Dr. Visit for Routine Care (mean) 1.75 1.47 1.36 1.15 Times Dr. Visit for Urgent Care (mean) 0.68 0.71 0.72 0.69 Times Dr. Visit for Scheduled Tx. (mean) 1.08 0.96 0.97 1.33 Times Visited Psychiatrist (mean) 0.29 0.42 0.3 0.42 Times Visited General Dr. (mean) 0.7 0.61 0.51 0.68 Times Visited Psychologist (mean) 1 0.79 1.3 2.35 3.2 Service Attendance:
> Than 1x/wk. 1x per week
1-3x per Mth.
Less 1x/mth. Never
BMI (mean) 27.5 26.7 26.7 26.6 26.2 General Weight Evaluation: 2.9% (107) 7.2% (264) 3.3% (121) 8.8% (324) 6.7% (248) (About the right Weight) Heart Condition (Yes) 1.6% (59) 3.1% (114) 1.5%( 56) 3.4% (126) 2.7% (100) Taking Medications for Hypertension (Yes) 2.5% (94) 4.3% (159) 1.9% (71) 3.5% (128) 2.6% (96) Cancer (Yes) 0.9% (35) 1.9% (70) 0.8% (28) 1.7% (62) 1.6% (60) Depression (Yes) 2.6% (97) 5.8% (214) 3.0% (111) 7.9% (291) 6% (220) Over the Last 12 Months: Times in the Hospital (mean) 14 22 27 29 32 Nights in the Hospital (mean) 121 206 210 265 269 Over the Last Month: Times Dr. Visit for Routine Care (mean) 1.64 1.59 1.55 1.51 1.43 Times Dr. Visit for Urgent Care (mean) 0.8 0.48 0.73 0.86 0.66 Times Dr. Visit for Scheduled Tx. (mean) 1.2 0.97 1.13 0.98 1.05 Times Visited Psychiatrist (mean) 0.39 0.15 0.31 0.36 0.57 Times Visited General Dr. (mean) 0.84 0.55 0.51 0.6 0.71 Times Visited Psychologist (mean) 0.72 0.77 1.81 1.31 0.92
80
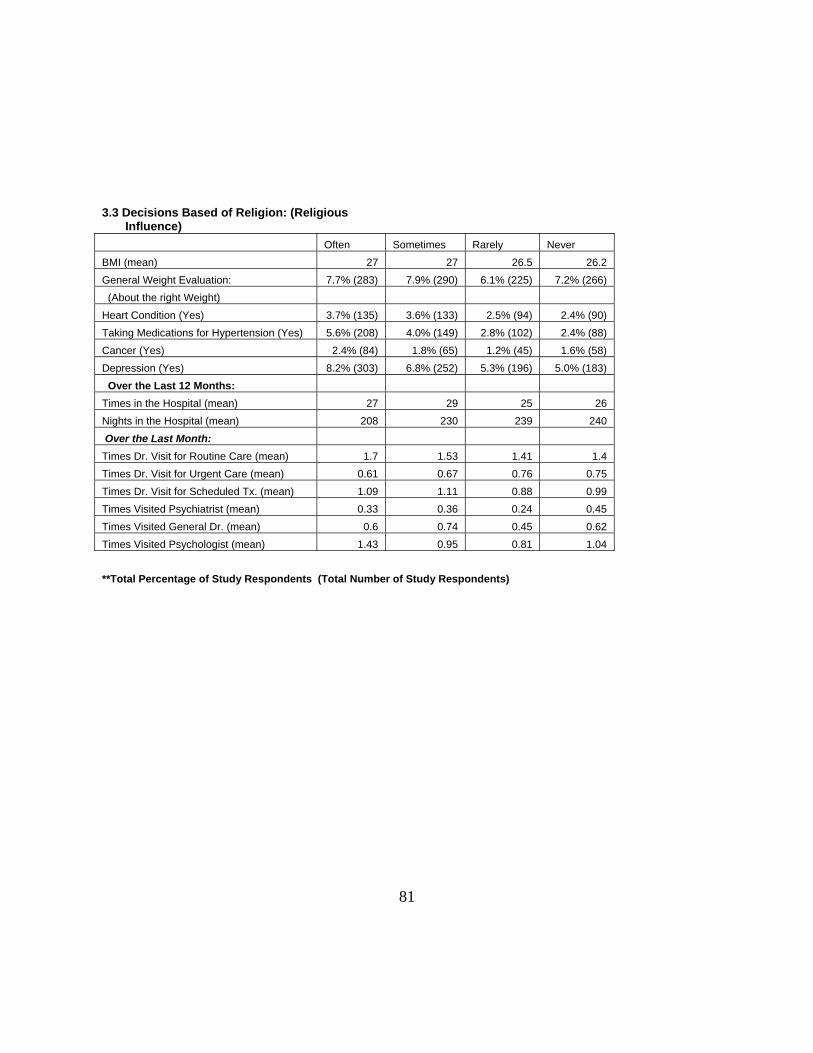
3.3 Decisions Based of Religion: (Religious Influence) Often Sometimes Rarely Never BMI (mean) 27 27 26.5 26.2 General Weight Evaluation: 7.7% (283) 7.9% (290) 6.1% (225) 7.2% (266) (About the right Weight) Heart Condition (Yes) 3.7% (135) 3.6% (133) 2.5% (94) 2.4% (90) Taking Medications for Hypertension (Yes) 5.6% (208) 4.0% (149) 2.8% (102) 2.4% (88) Cancer (Yes) 2.4% (84) 1.8% (65) 1.2% (45) 1.6% (58) Depression (Yes) 8.2% (303) 6.8% (252) 5.3% (196) 5.0% (183) Over the Last 12 Months: Times in the Hospital (mean) 27 29 25 26 Nights in the Hospital (mean) 208 230 239 240 Over the Last Month: Times Dr. Visit for Routine Care (mean) 1.7 1.53 1.41 1.4 Times Dr. Visit for Urgent Care (mean) 0.61 0.67 0.76 0.75 Times Dr. Visit for Scheduled Tx. (mean) 1.09 1.11 0.88 0.99 Times Visited Psychiatrist (mean) 0.33 0.36 0.24 0.45 Times Visited General Dr. (mean) 0.6 0.74 0.45 0.62 Times Visited Psychologist (mean) 1.43 0.95 0.81 1.04 **Total Percentage of Study Respondents (Total Number of Study Respondents)
81
BIBLIOGRAPHY Administration on Aging (2001) A profile of older Americans: 2001.
www.aoa.dhhs.gov/aoa/stats/prome/default.htm. Aging Stats (2000) Older Americans 2000: key indicators of well being (federal interagency
forum on aging-related statistics). www.agingstats.gov/chartbook2000/population.html. Atchley, R. (1991) Social forces and aging. Wadsworth, Belmont. American Religious Identity Survey (2001) published at
www.gc.cuny.edu/studies/aris_index.htlm. Brim, Orville G., Paul B. Baltes, Larry L. Bumpass, Paul D. Cleary, David L. Featherman,
William R. Hazzard, Ronald C Kessler, Margie E. Lachman, Hazel Rose Markus, Michael G. Marmot, Alice S. Rossi, Carol D. Ryff, and Richard A. Shweder. NATIONAL SURVEY OF MIDLIFE DEVELOPMENT IN THE UNITED STATES (MIDUS). 1995-1996 [Computer file]. 2nd ICPSR version, Ann Arbor, MI: Inter-university Consortium for Political and Social Research [distributor]. 2003.
Centers for Disease Control and Prevention (1997) Unrealized prevention opportunities:
reducing the health and economic burden of chronic disease. Centers for Disease Control and Prevention, National Center for Chronic Disease Prevention and Health Promotion, Atlanta.
Chatters, L. M. (2000) Religion and health: public health research and practice. Annu. Rev. Public Health, 21: 335-67.
Colantonio, A., Kasl, S. V., and Ostfeld, A. M. (1992) Depressive symptoms and other
psychosocial factors as predictors of stroke in the elderly. American Journal of Epidemiology, 136: 884-894.
Courtenay, B. C., Poon, L. W., Clayton, G. M., and Johnson, M. A. (1992) Religiosity and
adaptation in the oldest-old. International Journal of Aging and Human Development, 34(1): 47-56.
Day, J. C. and Curry, A. E. (1998) Educational attainment in the United States: March 1998.
U.S. Census Bureau, Current Population Reports pp. 20-513. U.S. Government Printing Office, Washington, D. C.
82
Degenova, M. K. (1992) If you had your life to live over again: What would you do differently? International Journal of Aging and Human Development, 34: 135-143.
Doyle, D. and Forehand, M. J. (1984) Life satisfaction and old age. Research and Aging, 6:
432-448. Ellison, C. G., Gay, D. A., and Glass, T. A. (1989) Does religious commitment contribute to
individual life satisfaction. Soc. Forces, 68: 100-123. Ellison, C. G. (1991) Religious involvement and subjective well-being. J. Health Soc. Behav.,
32: 80-99. Ellison, C. G. (1993) Religious involvement and self-perceptions among black Americans. Soc.
Forces, 71: 1027-55. Friedlander, Y., Kark, J. D., and Stein, Y. (1986) Religious orthodoxy and myocardial
infarction in Jerusalem: a case-control study. International Journal of Cardiology, 10: 33-41.
Glamser, F. D. (1987) The impact of retirement on religiosity. Journal of Religion and Aging,
4(1): 27-37. Goldbourt, U., Yaari, S., and Medalie, J. H. (1993) Factors predictive of long-term coronary
health disease mortality among 10,059 male Israeli civil servants and municipal employees. Cardiology, 82: 100-121.
Goldman, N., Korenman, S., and Wienstein, R. (1995) Marital status and health among the
elderly. Social Service and Medicine, 40: 1717-1730. Graham, T. W., Kaplan, B. H., Cornoni-Huntley, J. C., James, S. A., Becker, C., Hames, C. G.,
and Heyden, S. (1978) Frequency of church attendance and blood pressure elevation. Journal of Behavioral Medicine, 1: 37-43.
Hall, C. M. (1981) The bowen family theory and its uses. Athertion, New York. Hall, C. M. (1985) Religion and aging. Journal of Religion and Health, 24(1): 70-78. Health and Retirement Study (1998) www.umich.edu/~hrswww/. Hill, P. C. (1999) An overview of measurement issues and scales in the scientific study of
spirituality. Presented at “Studying Spirituality and Alcohol,” cosponsored by Natl. Inst. Alcohol Abuse Alcoholism and Fetzer Inst., Bethesda, Maryland.
Hiltner, S. (1981) A theology of aging. In LeFevre, S., and LeFevre, P., eds., Aging and the
Human Spirit. Exploration Press, Chicago.
83
Hogstel, M. O. and Kashla, M. (1989) Staying healthy after 85. Geriatric Nursing, January/February: 16-18.
HRS/AHEAD Codebook (2000) Codebooks: Data Center: HRS/AHEAD Website.
http://www.umich.edu/~hrswww/center/codebks.html (December 1, 2000). Hummer, R., Rogers, R. Nam, C., and Ellison, C. G. (1999) Religious involvement and U.S.
adult mortality. Demography, 36: 273-285. Idler, E. L. and Benyamini, Y. (1997) Self-reported health and mortality: a review of twenty-
seven community studies. Journal of Health and Social Behavior, 38: 21-37. Kahn, R. L. and Rowe, J. W. (1999) Successful aging: the MacArthur Foundation Study. Dell
Publishing, New York. Kane, R. A., Kane, R. L., and Ladd, R. C. (1998) The heart of long-term care. Oxford
University Press, New York. Kendler, K. S., Gardner, C. O., and Prescott, C. A. (1997) Religion, psychopathology, and
substance use and abuse: A multimeasure, genetic-epidemiologic study. Am. J. Psychait., 154: 322-329.
Kennedy, G., Wisniewski, W., Kelman, H., Thomas, C. and Metz, H. (1990) Religious
preference, attendance at services, and the prevalence of depressive symptoms in the elderly. The Gerontologist, 30: 260A.
Kirland, R. (2001) A definition of “religion”.
www.uga.edu/religion/rk/basehtml/guides/RELDEF.html. Koenig, H. G., Cohen, H. J., Blazer, D. G., Pieper, C., Meador, K. G., Shelp, F., Goli, V., and
DiPasquale, R. (1992) Religious coping and depression in elderly hospitalized medically ill men. American Journal of Psychiatry, 149: 1693-1700.
Koenig, H. G., Ford, S., George, L. K., Blazer, D. G., and Meador, K. G. (1993) Religion and
anxiety disorder: An examination and comparison of associations in young, middle-aged, and elderly adults. J. Anx. Disord., 7: 321-342.
Koenig, H. G., George, L. K., Blazer, D. G., Prichett, J. and Meador, K. G. (1993) The
relationship between religion and anxiety in a sample of community-dwelling older adults. Journal of Geriatric Psychiatry, 26(1): 65-93.
Koenig, H. G. (1994) Aging and God: spiritual paths to mental health in midlife and later
years. Haworth Press, Binghamton.
84
Koenig, H. G. (1997) Is religion good for your health? The effects of religion on physical and mental health. Haworth Press, New York.
Koenig, H. G., George, L. K., Cohen, H. J., Hays, J. C., Blazer, D. G., and Larson, D. B. (1998)
The relationship between religious activities and blood pressure in older adults. Int. J. Psychiat, Med., in press.
Koenig, H. G., George, L. K., and Peterson, B. L. (1998) Religiosity and remission form
depression in medically ill older patients. American Journal of Psychiatry, 155: 536-542. Koenig, H. G., McCullough, M. E., and Larson, D. B. (2001) Handbook of religion and health.
Oxford University Press, New York. Krause, N. (1993) Measuring religiosity in later life. Research on Aging, 15: 170-197. Kubler-Ross, E. (1969) On death and dying. Macmillan, New York. Lapane, K. L., Lasater, T. M., Allan, C., and Carleton, R. A. (1997) Religon and cardiovascular
disease risk. Journal of Religion and Health, 36(2): 155-163. Lemke, D. W. and Redman, I. (1984) Worship! A means to involve and counsel the alienated
person. Paper presented at 34th annual conference of the National Council on Aging, Inc. Washington, D.C.
Lester, D. (1988) Religion and personal violence (homicide and suicide) in the USA.
Psychological Reports, 62: 618. Levin, J. S. and Markides, K. S. (1985) Religion and health in Mexican Americans. Journal of
Religion and Health, 24: 60-69. Levin, J. S., Taylor, R. J., and Chatters, L. M. (1995) A multidimensional measure of religious
involvement for African Americans. Soc. Q., 36: 901-19. Levin, J. S. and Chatters, L. M. (1998) Research on religion and mental health: an overview of
empirical findings and theoretical issues. In Handbook of Religion and Mental Health, ed. H. G. Koenig, pp. 34-50. Academic, San Diego.
Martin, W. T. (1984) Religiosity and United States suicide rates, 1972-1978. J. Clin. Psychol.,
40: 1166-1169. Meador, K. G., Koenig, H. G., Turnbull, J., Blazer, D. G., George, L. K., and Hughes, D. C.
(1992) Religious affiliation and major depression. Hosp. Community Psychiatry, 43: 1204-8.
85
Medicare Current Beneficiary Survey (1996) www.hcfa.gov/mcbs/Default.asp or www.hcfa.gov/stats/stats.htm.
Melloni, B. J., Dox, I., and Eisner, G. M. (1985) Melloni’s illustrated medical dictionary:
second edition. Williams & Wilkins, Baltimore. MIDMAC (2006) MIDMAC: the John D. and Catherine T. MacArthur Foundation research
network on successful midlife development. Accessed online at: midac.med.harvard.edu/research.html.
MIDUS Codebook (2006) Accessed online at: www.midus.wisc.edu. Moberg, D. O. (1956) Religious activities and personal adjustment in old age. Journal of
Gerontology, 8: 261-267. Morse, C. K. and Wisocki, P. A. (1987) Importance of religiosity to elderly adjustment. Journal
of Religion and Aging, 4: 15-25. Musick, M. A. (1996) Religion and subjective health among black and white elders. Journal of
Health and Social Behavior, 37: 221-237. National Center for Health Statistics (1999) Health, United States, 1999, with health and aging
chartbook pp. 36-37. National Center for Health Statistics, Hyattsville. National Center for Health Statistics and U.S. Census Bureau (2001) Health United States:
2001; current population reports, “Americans with disabilities, 1997”. February: 70-73. National Council on the Aging (2001) President Bush unveils plan to expand role of religious
groups in social programs. www.ncoa.org/news/reng_pres.num. National Health Interview Survey (1998) www.cdc.gov/nchs/nhis.htm. Nelson, H. M. (1987) Life without afterlife: toward a congruency of belief across generations.
J. Scientific Study of Religion, 20: 109-118. Ornstein, R. E. (1988) Psychology: the study of human experience. Harcourt Brace
Jovanovich, Publishers, Orlando. Oxman, T. E., Freeman, D. H., and Manheimer, E. D. (1995) Lack of social participation or
religious strength and comfort as risk factors for death after cardiac surgery in the elderly. Psychosomatic Medicine, 57: 5-15.
Pargament, K. L. (1997) The psychology of religious coping: Theory, research, and practice.
Guilford Press, New York.
86
Payne, B. (1981) Religion and the elderly in today’s world. In Clements, W. M., ed., Ministry with the Aging. Harper & Row, San Francisco.
Poisal, J. A. and Chulis, G. S. (2000) Medicare beneficiaries and drug coverage. Health
Affairs, 19(2): 248-256. Princeton Religion Research Center (1996) Religion in America. Gallup Poll, Princeton, NJ. Saluter, A. F. and Lugaila, (1998) Martial status and living arrangements: March 1996. U.S.
Census Bureau, Current Population Reports pp. 20-513. U.S. Government Printing Office, Washington, D. C.
Sasaki, M. (1987) Changes in religious commitment in the United States. American Journal of
Sociology, 92: 1055-1076. Schiller, P. L. and Levin, J. S. (1988) Is there a religious factor in health care utilization?: a
review. Social Science in Medicine, 27: 1369-1379. Scotch, N. (1963) Sociocultural factors in the epidemiology of Zulu hypertension. American
Journal of Public Health, 53: 1205-1213. Seeman, T. E., Kaplan, G. A., Knudsen, L., Cohen, R., and Guralnik, J. (1987) Social network
ties and mortality among the elderly in the Alameda County study. American Journal of Epidemiology, 126: 714-723.
Singh, B. K. and Williams, J. S. (1982) Satisfaction with health and physical condition among
the elderly. Journal of Psychiatric Treatment and Evaluation, 4: 403-408. Social Gerontology (2002) Religion, aging, and old age. www.trinity.edu/~mkearl/ger-
relg.html. Supplement on Aging & Second Supplement on Aging (1987 & 1995)
www.cdc.gov/nchs/about/otheract/aging/Isoa.htm. Social Security Administration (2000) Income of the population 55 or older, 1998. Tables
VIII.4 and VIII.11. U.S. Government Printing Office, Washington, D. C. Taylor, R. J., Ellison, C. G., Chatters, L. M., Levin, J. S., and Lincoln, K. D. (2000) Mental
health services within faith communities: the role of clergy in black churches. Soc. Work, 45: 73-87.
U. S. Census Bureau (2000 & 2001) Accessed online at: www.census.gov. Webster’s New World Dictionary (1990) Warner Books, Inc., New York. 87
Wells, K. B., Stewart, A., Hays, R. D., Burman, A., Rogers, W., Daniels, M., Berry, S., Greenfield, S., and Ware, J. (1989) The functioning and well-being of depressed patients. Results form the Medical Outcomes Study. Journal of Health and Social Behavior, 38: 21-37.
Wisc.edu (2006) Midlife in the United States: a National study of health & well-being.
Accessed online at: www.midus.wisc.edu. Williams, D. R. (1994) The measurement of religion in epidemiologic studies, In Religion in
Aging and Health: Theoretical Foundations and Methodological Frontiers, ed. J. S. Levin, pp. 125-48. Sage, California.
Willis, R. J. (1999) Health and Retirement Study: individual’s own health in various ways.
Accessed online at: www.hrsonline.isr.umich.edu .
88