Embed Size (px)
Citation preview
THE SHIPBUILDING&FORCE STRUCTURE ANALYSIS TOOL
A USER’S GUIDE
Prepared for the
U.S. Navy
Approved for Public Release;
Distribution Unlimited
RNATIONAL DEFENSE RESEARCH INSTITUTE
Mark V. Arena • John F. Schank • Megan Abbott

The research described in this report was sponsored by the U.S.Navy. The research was conducted in the RAND National DefenseResearch Institute, a federally funded research and developmentcenter supported by the Office of the Secretay of Defense, the JointStaff, the unified commands, and the defense agencies underContract DASW01-01-C-0004.
The RAND Corporation is a nonprofit research organizationproviding objective analysis and effective solutions that address thechallenges facing the public and private sectors around the world.RAND’s publications do not necessarily reflect the opinions orpolicies of its research sponsors.
© Copyright 2004 RAND
All rights reserved. No part of this book may be reproduced in anyform by any electronic or mechanical means (includingphotocopying, recording, or information storage and retrieval)without permission in writing from RAND.
Published 2004 by RAND1700 Main Street, P.O. Box 2138, Santa Monica, CA 90407-2138
1200 South Hayes Street, Arlington, VA 22202-5050201 North Craig Street, Suite 202, Pittsburgh, PA 15213-1516
RAND URL: http://www.rand.org/To order RAND documents or to obtain additional information,
contact Distribution Services: Telephone: (310) 451-7002; Fax: (310) 451-6915; Email: [email protected]
Library of Congress Cataloging-in-Publication Data
Arena, Mark V.Shipbuilding and force structure analysis tool : a user’s guide / Mark V. Arena,
John F. Schank, Megan Abbott.p. cm.
Includes bibliographical references.“MR-1743.”ISBN 0-8330-3484-7 (pbk. : alk. paper)1. United States. Navy—Procurement—Mathematical models. 2. Warships—
United States—Design and construction—Mathematical models. 3. Shipbuilding industry—United States—Mathematical models. 4. Military planning—United States—Mathematical models. I. Schank, John F. (John Frederic), 1946– II. Abbott, Megan E., 1971– III.Title.
VC263.A798 2003359.6'84'028557565—dc22
2003019132
Cover design by Stephen Bloodsworth

iii
PREFACE
Periodic defense reviews require analysts to address difficultquestions regarding the Navy’s ship force structure, resource levelsand allocations, and the shipbuilding industrial base. While a rangeof tools is available to assist analysts in their decisionmaking, theneed for improvement exists. In earlier research, RAND identified thetypes of issues that arise during major defense reviews and describedthe abilities of the tools currently available to address those issues.RAND also described an overarching analytical architecture thatcould assist the Office of the Secretary of Defense (OSD), Navy, andother organizations in addressing the difficult naval ship–relatedquestions.
This document describes the effort to implement the integratedarchitecture as outlined in the earlier work. Also contained in thisdocument are detailed user instructions (see the Appendices) forthose interested in exercising the analytical capability of the tool.
The Assessments Division of the Deputy Chief of Naval Operationsfor Resources, Warfare Requirements, and Assessment (OPNAV/N81)sponsored this portion of the research. The research should be ofinterest to OSD and Navy policymakers, planners, and analystsconcerned with shipbuilding resource requirements and industrialbase.
This research was conducted for the U.S. Navy within the Acquisitionand Technology Policy Center of RAND’s National Defense ResearchInstitute, a federally funded research and development centersponsored by the Office of the Secretary of Defense, the Joint Staff,the unified commands, and the defense agencies.


v
CONTENTS
Preface .............................................................................................. iii
Figures .............................................................................................. ix
Tables ................................................................................................ xiii
Summary .......................................................................................... xv
Acknowledgments ........................................................................... xix
Acronyms .......................................................................................... xxi
Chapter OneINTRODUCTION ...................................................................... 1Background ............................................................................... 1Past Studies: Methods and Their Limitations......................... 3A New Model: Learning from Past Limitations ...................... 5Shipbuilding and Force Structure Analysis Tool .................... 6
Chapter TwoAN OVERVIEW OF THE ANALYSIS TOOL............................... 9Fundamentals of the Tool’s Architecture ............................... 9Key Concepts of the Tool ......................................................... 13
Stored Data and Data Sets .................................................... 13Main Inputs ........................................................................... 14Main Outputs......................................................................... 15
Force Transition Model: An Overview..................................... 17How the Model Generates a Shipbuilding Plan.................. 17
The Industrial Base Model: An Overview................................ 21The O&S Cost Model: An Overview ......................................... 22
vi The Shipbuilding and Force Structure Analysis Tool: A User’s Guide
The Financial Adjustments and Assumptions Model:An Overview ...................................................................... 22
Constant-Dollar Basis and Net Present Value .................... 23Assumptions Check .............................................................. 25
Chapter ThreeTHE INDUSTRIAL BASE MODEL ............................................ 27Shipyard Production Labor ...................................................... 27
The Labor Metric: Full-Time Equivalent............................. 28Ship Class Labor........................................................................ 29
First-of-a-Class Versus Follow-on Ships ............................. 29Workload, Labor Profiles, and Learning.............................. 31The “Project” Concept: When Labor Is Divided Across
Shipyards........................................................................... 32Contractor Roles.................................................................... 33
Shipyard Labor and Costs ........................................................ 35New Production, Existing Production, and
Other Work ........................................................................ 35Effective Versus Required Labor .......................................... 36Attrition, Hiring, and Termination Rates ............................ 37Productivity............................................................................ 38Burden Costs ......................................................................... 39
The Industrial Base Model in Action ....................................... 40Required Labor Calculations................................................ 41Effective Labor Calculations ................................................ 42Productivity Calculations ..................................................... 43
Chapter FourWORKING WITH THE TOOL ................................................... 47Summary ................................................................................... 47Running the Models ................................................................. 49Limitations of the Tool ............................................................. 49
Data Updates Required ........................................................ 49Force Transition Model Limitations .................................... 51Industrial Base Model Limitations....................................... 51
Dealing with Real-World Problems ......................................... 52Implications of Changing Ship Life ..................................... 52Detecting Industrial Base Problems .................................... 54Extending or Moving Construction Time for a Ship .......... 54Changing Force Structure..................................................... 55
Conclusion ................................................................................ 56

Contents vii
AppendixA. MICROSOFT ACCESS AND TOOL INSTALLATION ............... 59B. START-UP AND CREATING A DATA SET ............................... 67C. DATA EDIT AND ENTRY........................................................... 73D. RUNNING THE DATA SET—CALCULATIONS....................... 111E. GENERATING REPORTS........................................................... 119F. COMPARISON UTILITY............................................................ 133G. SHIP ROLES, HULL TYPES, AND CLASSES............................. 141
References ........................................................................................ 143


ix
FIGURES
S.1. Summary Tool Architecture .............................................. xvi2.1. High-Level Architecture..................................................... 102.2. Model Inputs and Outputs ................................................ 142.3. Flow Diagram for Force Transition Model....................... 182.4. Example Acquisition Plan.................................................. 213.1. First-of-a-Class Versus Follow-on Ship Workloads......... 303.2. Example Labor Profile ....................................................... 323.3. Example Production Plan.................................................. 343.4. Flow Diagram for the Industrial Base Model ................... 414.1. Edit Ship Class Data ........................................................... 53A.1. Needed References for VBA............................................... 63A.2. Entering the Solver DLL Key String in VBA Editor........... 65B.1. Warning Screen .................................................................. 68B.2. Top-Level Menu ................................................................. 69B.3. Manage Data Sets Form..................................................... 70B.4. A Selected Data Set ............................................................ 70B.5. Successful Link to a New Data Set .................................... 71C.1. Data Edit and Entry Menu................................................. 73C.2. Example of Active Status Bar ............................................. 75C.3. Edit Active Fleet Information Form .................................. 76C.4. Force Level Requirements ................................................. 77C.5. Ships in Production Data Entry Form .............................. 78C.6. Example Acquisition Plan.................................................. 80C.7. Modify Acquisition Table Format ..................................... 81C.8. Edit New Production Plan ................................................. 83C.9. Edit Other Work List ........................................................... 84
C.10. Edit Ship Class Data Form ................................................. 86C.11. Learning Data Subform ..................................................... 89
x The Shipbuilding and Force Structure Analysis Tool: A User’s Guide
C.12. Material and Equipment Subform .................................... 91C.13. Operations and Support Costs Subform .......................... 93C.14. Labor Subform.................................................................... 94C.15. Funding Profile Subform ................................................... 96C.16. Edit Hull Types ................................................................... 97C.17. Edit Ship Roles .................................................................... 98C.18. Shipyard Labor Data .......................................................... 99C.19. Shipyard Burden Rates ...................................................... 102C.20. Productivity Data ............................................................... 103C.21. Other Work Material and Equipment Subform ............... 105C.22. Other Work Labor Data Subform...................................... 106C.23. Edit Labor Profile ............................................................... 107C.24. Edit Inflation Index Data ................................................... 109C.25. Data Source Documentation Form .................................. 110
D.1. Calculations Form .............................................................. 111D.2. Select Calculation Method ................................................ 112D.3. Missing Production Data Warning ................................... 114D.4. Funding Assumptions Form ............................................. 115D.5. Invalid Funding Data Warning.......................................... 117E.1. Reports Menu ..................................................................... 119E.2. Labor Output Form ............................................................ 121E.3. Required Labor (FTE) at a Shipyard by Class................... 122E.4. Required Labor (FTE) by Class as a Table ........................ 123E.5. Required Labor with New Build Table.............................. 123E.6. Required Versus Effective Labor ....................................... 124E.7. Burden Rates Report .......................................................... 124E.8. Funding Output Selection Form ....................................... 125E.9. Detail of Summary Funding by Year Report .................... 126
E.10. Chart of Summary Spending ............................................. 126E.11. Ship Count Reports ............................................................ 128E.12. Table of Hull Types by Year............................................... 128E.13. Hull Types by Year, XY Plot ............................................... 129E.14. Active Hull Types by Year—Sand Chart ........................... 129E.15. Table of Ship Requirements .............................................. 130E.16. Data Source Comments Report ........................................ 131
F.1. Main Screen ........................................................................ 134F.2. Labor Differences Pop-Up Window ................................. 136F.3. Example Absolute Delta Labor Graph with Delta
Build Plan ............................................................................ 137 F.4. Funding Differences Menu ............................................... 138

Figures xi
F.5. Funding Differences Table ................................................ 138F.6. Ship Counts Pop-Up Window ........................................... 139F.7. Delta Ship Production by Ship Role ................................. 140


xiii
TABLES
2.1. Sample Deficit Array .......................................................... 194.1. Example Force Level Requirement................................... 55G.1. Ship Roles, Hull Types, and Classes.................................. 142


xv
SUMMARY
Each time a major defense review is undertaken, policymakers mustconfront a range of complicated issues about the Navy’s future forcestructure, including resource concerns and significant changes in theshipbuilding industrial base. To help answer these concerns, analystsin the Office of the Secretary of Defense (OSD) and the Chief of NavalOperations (CNO) staff turn to the available analytical tools to helpprovide options to decisionmakers. Although an array of such toolsexists, there is a significant need for improvement to ensure thatpolicy and resource decisions are well analyzed and supported.
In earlier research, RAND identified the types of issues that ariseduring these defense reviews and evaluated the capacity of currentanalytical models to help address these issues. We found that themost common concerns of defense analysts were cost, schedule,industrial base capacity, shipyard performance, and programmanagement strategies. Further, we found that existing tools lackedan integrated approach that would allow analysts to consider not justindividual elements (e.g., manpower and procurement fundingrequirements) but the interaction and interrelationships among theindustrial base components—from attrition rates to ship lifeextensions, from labor learning curves to overhead costs. We thenoutlined an overarching analytical architecture that could providethis integrated analysis environment—an environment in which theuser is able to understand the implications of force structure choiceson resource requirements and the private shipyard industrial base.
This document describes the result of efforts to implement this in-tegrated architecture, the Shipbuilding and Force Structure Analysis

xvi The Shipbuilding and Force Structure Analysis Tool: A User’s Guide
Tool. The purpose of the tool is to assist the OSD, Navy, and otherorganizations in addressing the difficult naval ship–relatedquestions. The general architecture of the tool is shown in Figure S.1.
The tool consists of four linked models. The first model, the ForceTransition Model, determines when new ships are acquired andwhen existing ships retire, based either on a given acquisition plan oron a desired force structure. The outputs from the force transitionmodel serve as important inputs to the next two models: theIndustrial Base Model and the Operating and Support (O&S) CostModel. The Industrial Base Model calculates workforce demandsand labor costs based on the acquisition plan. The O&S Cost Modeldetermines the operating and support costs for ships in the fleet. Thelast model, Financial Adjustments and Assumptions Model, allocatesthe various funding streams to the appropriate budget categories,adjusts the base year of the costs to a fixed year, and applies adiscount rate for discounted cash flow analysis. This model alsodetermines whether the inputs used by the other models violatebasic assumptions or whether data are incomplete, thus producingmisleading results.
This document serves as a basic introduction to the tool. It describesthe general architecture and outlines some basic concepts that may
IndustrialBaseModel
O&SCost
Model
RANDMR1743-S.1
Force Transition Model
FinancialAdjustments
andAssumptions
Model
Output
Currentforce
Futureforce
Figure S.1—Summary Tool Architecture

Summary xvii
be necessary to understand before using the tool. The tool’s primaryuser is meant to be an analyst seeking to determine the industrialbase and resource implications of a desired force structure choice.We intend this document to provide users with the tool’s basicnavigational capacities, guiding them through the user interface,providing background concepts and a description of methodology,offering data field definitions, and pointing out the tool’s centralfeatures. We also provide more detailed discussions of two of thetool’s primary models—the Force Transition Model and theIndustrial Base Model. Finally, we consider the tool’s currentlimitations as well as common issues the user will confront. Theappendices serve as a user’s guide and data dictionary for analystsinterested in using the tool.


xix
ACKNOWLEDGMENTS
The authors thank CAPT John D. Ingram, Jr. (currently Supervisor ofShipbuilding and Repair, Bath Iron Works) for his significantcontributions to the initial tool development. CAPT Ingram helped todefine many of the user requirements, report formats, and sources ofdata. This project would not have been possible without his efforts.We also thank CAPT Jeffrey Reed of the Office of the Chief of NavalOperations staff, who helped to define many of the enhancementsand refinements for the second and third versions of the tool. CAPTReed’s input greatly improved the usefulness of the tool. Finally, wethank Jack Graser and Walter Perry for their careful review of thedocument. Their suggestions greatly improved the final version.


xxi
ACRONYMS
AP advanced procurement
CFE contractor-furnished equipment
DCMA Defense Contract Management Agency
DLL Dynamic Link Library
DoD Department of Defense
FTE full-time equivalent
FY fiscal year
G&A general and administrative
GFE government-furnished equipment
LP linear programming
M&E material and equipment
MOD UK Ministry of Defence
MPN Military Personnel, Navy (budget category)
MS Microsoft
NAVCOMP Navy Comptroller’s office
NAVSEA Naval Sea Systems Command
NNS Newport News Shipbuilding

xxii The Shipbuilding and Force Structure Analysis Tool: A User’s Guide
NVR Naval Vessels Registry
NPV net present value
OMB Office of Management and Budget
O&M operation and maintenance
OMN Operations and Maintenance, Navy (budgetcategory)
OPNAV Office of the Chief of Naval Operations
O&S operating and support
OSCAM Operating and Support Cost Analysis Model
OSD Office of the Secretary of Defense
PSA Post-Shakedown Availability
PEO Program Executive Office
RCOH Refueling Complex Overhaul
SCN Shipbuilding and Conversion, Navy (budgetcategory)
SUPSHIP Supervisor of Shipbuilding Office
UIC Unit Information Code
VAMOSC Visibility and Management of Operating and SupportCosts
VBA Visual Basic for Applications

1
Chapter One
INTRODUCTION
BACKGROUND
The end of the Cold War created a challenging environment for mili-tary planners. Shifting defense priorities resulted in dramatically re-duced budgets and procurement levels.1 As a result, the U.S. indus-trial base has grown smaller and more consolidated, with two largedefense contractors now owning the nation’s six largest shipyards.These transformations have posed still more challenges to those re-sponsible for ensuring that the United States meets its force structurerequirements. Military decisionmakers have found themselves underunprecedented pressure to employ the nation’s shrinking industrialbase resources more efficiently to meet current and future defenseneeds. The terrorist attacks of September 11, 2001, only raised thestakes further, demonstrating that, despite budget reductions, U.S.forces must be in a state of constant readiness to face increasinglycomplex and daunting global contingencies.
Given these many programs and sizable production runs, theDepartment of Defense (DoD) could treat the shipbuilding sector ofthe industrial base almost as a public utility; it was there whenever itwas needed. But as defense budgets began to shrink, the DoD faced,and continues to face, major policy dilemmas. On the one hand, thefleet must be affordable, given reduced funding. On the other hand,
______________ 1Although recent events have prompted the possibility of increased defense spending,it is unlikely that shipbuilding rates will approach prior-year levels. The annual rate ofship orders in 2002 was roughly one-quarter of the 1980s rate.

2 The Shipbuilding and Force Structure Analysis Tool: A User’s Guide
the nature of the dangers the United States faces has changed radi-cally. No longer does the nation’s fleet confront a lone adversary or astatic set of threats. Now it must be adaptable and responsive to anever-wider array of contingencies.
As a result, the Office of the Secretary of Defense (OSD) and the Navyhave taken a more active role in monitoring and shaping the evolu-tion of the shipbuilding industrial base. They must now take pains toensure that current industrial capabilities are adequate to meet fu-ture defense needs in a timely and efficient manner. Further, theymust be certain that the capabilities that do remain are the mostcritical and that marginal contributors to the force do not siphon offcritical resources.
Ultimately, to obtain maximum force structure from limited shipconstruction dollars, OSD and the Navy must make informed ship-building decisions. However, understanding how best to use the na-tion’s shipyards to support national defense is not a simple task. Awide range of acquisition, industrial base, and economic questionsmust be considered. For instance, because defense procurement andrepair work dominate the domestic shipbuilding industry, the U.S.Navy’s shipbuilding decisions have a direct and profound impacton the industrial base. Shipbuilding also tends to be highly labor-intensive, requiring the coordination of multiple skills and trades.Likewise, labor rules, hiring limitations, unions, and training needsall complicate the establishment of a sufficient workforce. Further,resource constraints may often limit flexibility. For instance, theamount of work that can be done at any given time is constrainedboth by the number of available building docks and the fact thatshipyards must maintain threshold work levels in order to be viable.
Given such complexities, informed policy decisions require analysisthat is attuned to the multifaceted nature of these shipyard and in-dustrial base issues. Inevitably, such analysis begins with the use ofanalytical models, and a number of models have been developed tohelp defense analysts with these matters.2 The issue is whether
______________ 2Two examples of the development and use of analytic tools to answer complex forcestructure questions for specific programs are described in John Birkler et al., The U.S.Submarine Production Base: An Analysis of Cost, Schedule, and Risk for Selected ForceStructures, RAND Corporation, MR-456-OSD, 1994, and John Birkler et al., The U.S.

Introduction 3
existing models are sufficient to answer the host of questions thatarise when policymakers approach force structure evaluations.
In 1998, the Navy and OSD asked RAND to examine the analyticmodels that support shipbuilding decisions. Specifically, they askedthe researchers to identify the ongoing shipbuilding issues thatemerge during defense reviews of force capability, describe themodels available to address those issues, recommend improvementsto those models, and point out when new models might be needed toreplace or augment them.
PAST STUDIES: METHODS AND THEIR LIMITATIONS
Since the end of the Cold War, numerous defense reviews haveexamined ways for our military services to align themselves with thenew political and military environment. These studies include theBottom-Up Review (1993), the Commission on Roles and Missions(1995), the National Defense Panel (1997), and the QuadrennialDefense Review (1997, 2001)—all of which have focused on the fu-ture roles and composition of our military forces.3 In relation to theNavy, these studies considered the composition of future navalforces, the resources necessary to achieve the force structure objec-tives, and the makeup and use of a shipbuilding industrial base thatcould efficiently and effectively provide the necessary future forcestructure.
Through interviews with relevant personnel at OSD and Navy orga-nizations and with individuals who either build or maintain modelsthat examine shipbuilding issues, we identified the major ship forcestructure, budget, and industrial base issues that arose during thesedefense reviews and the models that Navy and OSD analysts haveused to help address those issues. Specifically, we identified five per-sistent concerns:
______________________________________________________________ Aircraft Carrier Industrial Base: Force Structure, Cost, Schedule, and Technology Issuesfor CVN 77, RAND Corporation, MR-948-NAVY/OSD, 1998.3Les Aspin, Secretary of Defense, Report of the Bottom-Up Review, October 1993;Direction for Defense, Report of the Commission on Roles and Missions of the ArmedForces, May 1995; William S. Cohen, Secretary of Defense, Report of the QuadrennialDefense Review, May 1997; Transforming Defense: National Security in the 21stCentury, Report of the National Defense Panel, December 1997.
4 The Shipbuilding and Force Structure Analysis Tool: A User’s Guide
• funding required versus funding available
• schedule, especially in relation to cost
• capacity (e.g., available capacity within the industrial base toproduce a given ship type)
• shipyard performance (e.g., on-time completion rates, produc-tivity measures)
• program management strategies (e.g., the effect of competition,the impact of dual sourcing or teaming on projects).
These concerns are deeply interrelated. For instance, cost is often aconcern because of its effect on schedule, which is in turn affected bycapacity, such as the availability of a shipyard to construct theneeded type of ship.
After identifying these core concerns, we began a study of the analyt-ical tools available to help decisionmakers weigh these issues as theydevelop policies for naval ship procurement and operations. Wefound, however, that the existing tools were limited. For instance,most of the tools focused on a single shipyard rather than allowing aconsideration of multiple shipyards across the industrial base.Moreover, these models were typically focused on short-term issues,such as the cost to build the next submarine or surface combatant,and thus were too narrow to examine broader policy issues related tothe overall Navy acquisition strategy.
Ultimately, we found that, since no inclusive, policy-oriented model-ing capabilities to address the range of ship construction optionswere available, the Navy and OSD perpetually faced the choice ofeither assembling new databases and constructing new analyticalmethods or modifying existing models and tools. Rather than havinga solid analytical base from which to start, they were forced to re-build a base for each major defense review. Often, the results of sev-eral models had to be manually integrated to provide the necessarylevel of detail. In turn, since individual models were often developedby different organizations, the underlying assumptions, data, andanalytic methods of the various models were not necessarily consis-tent, causing uncertainty about the validity of the integrated results.

Introduction 5
All these factors made a periodic defense review an excessively time-consuming process with limited payoff. By the time researchers haddeveloped the necessary databases and analytical tools, there waslittle time to identify and analyze policy options. As a result, thestudies failed to examine the impact of various options or fully an-swer important questions and so their findings were typically lessthan satisfying.
A NEW MODEL: LEARNING FROM PAST LIMITATIONS
Since the cost of building, maintaining, and operating even a singleship is significant, naval force structure and shipbuilding issues willalways be an important part of overall defense reviews. The sameinterrelated concerns over cost, scheduling, capacity, and shipyardperformance will consistently reemerge, and various alternatives willrequire examination. In 1999, given these continuing needs and thelimits of existing analytical models, the Assessments Division (N81)of the Deputy Chief of Naval Operations (Resources, Warfare Re-quirements, and Assessment) approached RAND for help in im-proving analytical capabilities in terms of the effects of various bud-getary and acquisition strategies on force structure decisions. Basedon the limits identified in past models, we proceeded to outline anew architecture based on the following principles:
• The new model should consider the entire industrial base, ratherthan focusing on a single shipyard.
• The model should integrate a range of influences—expenditures,schedule, workload, shipyard capacity, etc.—to formulate a totalresource requirement for analysts, rather than forcing analysts tomanually link together the results of calculations generated bymultiple tools that each account for one part of the picture.
• The model should provide an integrated capability to identifyand evaluate in a systematic way various naval force structure,funding requirements, and industrial base options, while also in-corporating the relationships between factors that influence op-erating and ship construction costs.
• The model should help organizations build and overhaul ships ata lower cost.

6 The Shipbuilding and Force Structure Analysis Tool: A User’s Guide
• Finally, in contrast to past models, the model should be welldocumented, listing assumptions, definitions, and sources for alldata.
A model with these components would be an invaluable tool to assistdecisionmakers in understanding the cost implications of a widerange of options at the same time as it maintained data integrity anduser flexibility.
The Shipbuilding and Force Structure Analysis Tool architecture de-scribed in this report embodies these principles by integrating sev-eral aspects of the shipbuilding funding and industrial base analysis.We completed an initial version of the tool in April 2001 and thenwent on to improve the tool and update some of its associated data.The result is the version outlined in this document.
SHIPBUILDING AND FORCE STRUCTURE ANALYSIS TOOL
The purpose of the ensuing chapters is to describe the structure anduse of the Shipbuilding and Force Structure Analysis Tool. The tool’sprimary user is meant to be an analyst seeking to determine the in-dustrial base and resource implications of a desired force structurechoice.4 It produces estimates suitable for the planning and pro-gramming phases of the DoD Planning, Programming, and Bud-geting System (PPBS) cycles. Before using these estimates for theannual Budget Estimate Submission and the President’s budget cy-cles, the Navy Comptroller’s office (NAVCOMP) would have to reviewthem to ensure their accuracy and integrate them with other parts ofthe Navy.
We intend this document to provide the user with the tool’s basicnavigational capacities, guiding the analyst through the user inter-face, providing background concepts and a description of methodol-ogy, offering data field definitions, and pointing out limitations andpotential improvements to the tool.
______________ 4This report is not intended as a tutorial on cost analysis, force structure analysis, orbudgeting practices, nor is it a tutorial on Microsoft Access (the underlying engine ofthe tool).

Introduction 7
Chapter Two serves as a basic introduction to the tool, describing itsgeneral architecture and outlining some basic concepts that may benecessary to understand before using the tool. Chapter Three offersmore detailed discussion of the tool’s most developed model, theIndustrial Base Model. Chapter Four describes the tool’s limitationsand common issues an analyst is likely to face. The appendices serveas a user’s guide and data dictionary for analysts interested in usingthe tool.


9
Chapter Two
AN OVERVIEW OF THE ANALYSIS TOOL
The Shipbuilding and Force Structure Analysis Tool is designed tooffer analysts a way to determine the industrial base and resourceimplications of a specific future force structure. Simply put, the toolis a computer program, with an associated database, that usesMicrosoft Access as its primary engine.
To begin, the analyst must, at minimum, specify a time period and adesired force structure to be achieved over that period. The tool’sdatabase contains values—updated through internal and externalNavy sources—for the various factors associated with the currentforce structure and with the shipyards that make up the industrialbase. The analyst may use those values or enter new ones more ap-propriate for the specific analysis. The tool calculates the requiredshipyard labor, funding, and ship construction schedule needed tomeet the force structure specified. Finally, it produces the annualShipbuilding and Conversion, Navy (SCN); Operations andMaintenance, Navy (OMN); and Military Personnel, Navy (MPN)funding required over the period specified.
This chapter describes the overall structure and concepts that un-derlie the tool. First, we offer a larger view of the primary models atwork, followed by a discussion of the tool’s data sets and key compo-nents. (The appendices supply a screen-by-screen guide to using thetool and editing the information in the database.)
FUNDAMENTALS OF THE TOOL’S ARCHITECTURE
As discussed in Chapter One, the high-level architecture that formsthe basis of the Shipbuilding and Force Structure Analysis Tool (see

10 The Shipbuilding and Force Structure Analysis Tool: A User’s Guide
Figure 2.1) was developed as part of our earlier analysis of the issuessurrounding naval ship force structure, funding requirements, andindustrial base issues. This architecture derives from the way navaldecisionmakers plan for the future, weighing trade-offs between op-erational needs, force structure, and funding requirements andavailability.
With all force structure decisions, analysts inevitably find themselvesin one of two positions: one oriented toward a funding requirement,the other oriented toward a force capability. On one hand, fundinggoals may already be specified, and analysts are left to determine themost capable future force structure that the constrained resourcescan support. On the other hand, a desired future force structure mayfirst be specified, and analysts must then seek to estimate the mini-mum future funding required to support that force structure. TheShipbuilding and Force Structure Analysis Tool addresses analysisrelated to the later question, i.e., understanding the implications of agiven force structure.
When the analyst begins with a proposed force structure require-ment, the current force structure serves as the baseline from whichall force transition alternatives derive. Starting with this current force
Maintenancelabor rates
Productionplan
Operatingplan
IndustrialBaseModel
O&SCost
Model
Procurement $
Workload
Active ships
Operations $
Fundingrequirements
RANDMR1743-2.1
Forcestructuremethod
orAcquisition
planmethod
Force Transition Model FinancialAdjustments
andAssumptions
Model
Output
• Shipyard
• Funding
• Ship counts
Currentforce
Futureforce
Figure 2.1—High-Level Architecture
An Overview of the Analysis Tool 11
structure and with the desired future force structure for each of theyears in the period under analysis, the analyst needs three plans todescribe how the fleet composition evolves:
1. a retirement plan that determines when specific ships will be re-tired
2. a production plan that determines how many of each type of shipto build and when to introduce them into the operating force
3. an operating plan that specifies how many of each type of ship arein the operational force each year.
The tool concentrates on the production plan and how the industrialbase can meet that plan.1 Specifically, the tool moves through a se-ries of steps (left to right in Figure 2.1), using the four linked modelsthat form the tool’s high-level architecture: the Force TransitionModel, the Industrial Base Model, the Operating and Support (O&S)Cost Model, and the Financial Adjustments and Assumptions Model.
The Force Transition Model is designed to produce a constructionplan to meet the analyst’s force level requirements. Based on theanalyst’s inputs and stored data, the model generates a list of neededships, including the start and end year of construction, and all thework associated with that particular hull. The model assumes thatships are built in a just-in-time fashion (i.e., there are no early shipdeliveries).2 Further, this model accounts for retirements from theactive fleet (the retirement plan) as well as the introduction of newships currently under construction. The results from the Force
______________ 1Previous ad hoc models projected the current force into the future using the age ofexisting ships and their expected useful lives. Analysts then compared the resultingfuture profile for the current force to the desired future force to reach an estimate ofthe number of new ships to acquire. This procurement plan would thus lead to a fu-ture ship construction budget. The new tool, however, can evaluate a more robust setof force transition options, including, for instance, extending the service lives of exist-ing ships.2Many construction plans could meet a given force structure, depending on user in-puts and assumptions. For example, ships could be delivered before they are needed.Such a plan would also meet force-level requirements. Such an approach would front-load the acquisition funding requirements. By assuming a just-in-time delivery, wehave taken the conservative view that procurement will be delayed as long as possible.
12 The Shipbuilding and Force Structure Analysis Tool: A User’s Guide
Transition Model are then factored into the Industrial Base Modeland the O&S Cost Model.
The Industrial Base Model simulates how the shipyard industrialbase reacts to changes in production levels and then generates theassociated cost. Based on analyst inputs, the build plan generated bythe Force Transition Model, and existing construction plans, theIndustrial Base Model calculates workloads at each shipyard. Fromthese workloads, the model determines general employment levels,productivity, and burden rates. From these rates and factors, themodel calculates a total labor cost.
The O&S Cost Model determines the operating and support costs as-sociated with a given force structure. Based on the operating plandetermined in the Force Transition Model, the O&S Cost Model cal-culates the number and ages for each active ship by year. With theseship demographics, the model can then determine funding require-ments based on all associated general maintenance, operations, andmanpower costs. This model functions as a “pass-through” for theNavy’s Operating and Support Cost Analysis Model (OSCAM) orother O&S cost models and databases that supply O&S costs on anannual basis.
The outputs of these two models feed the Financial Adjustments andAssumptions Model. This model has several functions. One functionis to aggregate the total acquisition costs using direct costs, burdenrates, and material and equipment costs. These costs are then allo-cated to the appropriate fiscal years. The analyst is given a choice ofsummarizing the funding requirements for a particular acquisitionon an “as-appropriated” year basis or leaving it on an “as-expended”basis.3 These costs are then converted, as will be discussed later inthis chapter, into a fixed-year dollar basis for a specified base yearand discounted to net present value (NPV), if appropriate. The sec-ond function of the model is to check and characterize specific dataassumptions for consistency (e.g., the NPV discount rate used, peri-
______________ 3Congress normally appropriates all the funds required to build a ship in the first yearthat money is required to initiate a contract for the ship. This is called the “full fundingconcept.” These funds are expended over a number of years as the contractor(s) in-crementally buys materials, completes work, and bills the Navy.

An Overview of the Analysis Tool 13
ods of the force level requirement, specified year for the constant-dollar basis, starting year for force structure requirement).
The Shipbuilding and Force Structure Analysis Tool thus enables theanalyst to weigh a complex range of factors and to evaluate the ef-fects of each factor on the entire funding requirement. Much of thetool’s value lies in its flexibility as well as its capacity to calculate theripple effects that changing one element of the model can have on allother elements.
KEY CONCEPTS OF THE TOOL
Now that we have considered the tool’s high-level architecture, let ustake a closer look by considering the tool’s primary components.Figure 2.2 shows each model’s key inputs and outputs. We will ad-dress these data and each model in the sections that follow.
Stored Data and Data Sets
The fuel that runs the tool is data. Therefore, an important require-ment for use is that the analyst be able to work easily with differentassumptions and baseline data. The rationale for developing the toolin a database platform was the recognition of the importance, scope,and complexity of the data needed for such an analytical approach.
A data set in this tool refers to a unique collection of inputs for ananalysis, or one possible force structure/budget combination. Itconsists of all the data required to generate a funding requirementsprofile. Any change the analyst makes to the data will result in a newdata set. These data sets allow the analyst to examine multiple as-sumptions quickly and to document and preserve each alternative.For example, the analyst could create two different force structureassumptions with two data sets and then compare and contrast theresults of each. Moreover, each set contains all the data and in-formation necessary to replicate an analysis or calculation. Toperform a different analysis, the analyst must therefore create adifferent data set. A baseline data set, drawn from a variety of docu-mented Navy internal and external sources, is provided with the tool.

14 The Shipbuilding and Force Structure Analysis Tool: A User’s Guide
IndustrialBase Model
O&S CostModel
RANDMR1743-2.2
FinancialAdjustments and
AssumptionsModel
Forcestructuremethod
Acquisitionplan
method
Force Transition Model
or
Key inputs:• Current fleet• Current ships under
construction• Desired force
structure or• Acquisition plan
Key outputs:• Production plan• Operating plan• Number of active
ships
Key inputs:• Production plan• Ship class data
– Shipyard workload by role
– Equipment and material cost
– Learning– Construction time– Expected useful
life• Shipyard labor data
– Direct $/hr– Burden rates– Hiring/training
termination costs– Productivity
Key outputs:• Production $• Shipyard workload
Key inputs:• O&S costs by class
and age• Annual personnel
costs• Maintenance labor
rates• Operating plan
Key output:• Operations $
Key inputs:• Production $• Operations $• Discount rate• Cash flow
assumption (as appropriate or as expended)
• Inflation indices
Key output:• Funding
requirements
Figure 2.2—Model Inputs and Outputs
Further, analysts should be careful to document the sources of thedata they enter into the tool. Many of the problems with past modelshave arisen from a lack of data-source integrity. To avoid theseproblems, the tool is equipped with a form for analysts to enter anitem, date, and description of the information; this sourcing infor-mation is then effectively linked to the data set (see Appendix E,“Data Sources”).
Main Inputs
What, then, do these data sets consist of? Let us briefly consider thekinds of inputs available in the tool. Many of these inputs are dis-cussed in greater detail in Chapter Three and the Appendices.
When generating reports on specific force structure options, the ana-lyst will use an array of inputs, including the number and type of

An Overview of the Analysis Tool 15
ships that need to be built and the time by which they must be intro-duced into the force.
Let us first consider data at the level of a ship class.4 The analyst canmake regular updates and changes to the available ship classes,adding new ones, updating details about existing ships in produc-tion, extending ship “lives” when necessary, revising various materialand equipment costs associated with each hull, and so forth. Whenadding a new ship, the analyst must specify the shipyard or shipyardsable to do the work and in what capacity—that is, whether the yard isdesigning, building, or integrating the new ship, or some combina-tion thereof (see Chapter Three, “Contractor Roles”).
In addition, the analyst must classify the new ship class into thetool’s two hierarchical categories. The top level is the ship’s role inthe fleet (e.g., aircraft carrier, surface combatant). The second level isthe hull type, which is a more refined definition of its role. For in-stance, there are two hull types for the ship role of “submarine”: bal-listic missile submarine and attack submarine. (The classificationscheme for the current fleet is shown in Appendix G.) These cate-gories are useful to the analyst primarily at the output level; many ofthe reports generated by the tool allow analysts to summarize infor-mation using these three categories—for instance, a chart showingthe number of ships of each hull type that are active in the fleet overa specific period (see Figure E.13).
Moving from ship class to shipyard-level inputs, the tool enables theanalyst to specify the order in which ships are allocated to the ship-yards and to enter values for such fields as workload (the number ofhours to complete a task, etc.); hiring, termination, and attritionrates; wage rates; and the burden rate (see Chapter Three for discus-sion of these components).
Main Outputs
After the entry of any inputs needed for the analyst’s force structureand/or resource concerns, the analyst is ready to calculate the vari-
______________ 4A ship class is a specific hull type, such as the Arleigh Burke destroyer (DDG 51) orVirginia submarine (SSN 774).
16 The Shipbuilding and Force Structure Analysis Tool: A User’s Guide
ous outputs from the models within the tool. Let us step back a mo-ment and look at the typical sequence leading up to the output func-tion of the tool:
• Entry or modification of data, creating a new data set.
• Selection of the time frame for the analysis.
• Entry or calculations of either the known acquisition plan or aplan based on a desired future force structure.
• The Force Transition Model of the tool generates a list of the newship construction activity by yard and time.
• Based on the new construction activity and ongoing work at theshipyard, the tool calculates (in the Industrial Base Model) thelabor necessary to build these ships at the available shipyards,followed by a calculation of the workforce productivities at eachof the shipyards.
• Finally, the Financial Adjustments and Assumptions Modelin the tool calculates the spending profiles for the given plan,using the analyst-specified NPV and cash-flow assumptions.
The analyst is now ready to generate outputs based on these choicesand calculations. The analyst chooses an output format (chart, table,or summary report) and category. The tool offers three core outputcategories:
1. Shipyard Labor reports show labor demands at each of the yards,as well as the associated burden (overhead, profit, and generaland administrative [G&A] cost) rates and productivity for this la-bor.
2. Funding reports consist of funding profiles at varying levels of de-tail, from the total fleet level to individual class level. These re-ports are broken down into Navy budget categories—specifically,shipbuilding and conversion (SCN), operation and maintenance(OMN), and military personnel (MPN).
3. Ship Count reports feature the number of active ships in the fleetper year (grouped by role, hull type, or class).

An Overview of the Analysis Tool 17
Now that we have set out the inputs and outputs of the tool, we canbegin to look at how the tool works. Because the Industrial BaseModel involves so many constituent parts and is the most developedtool component, we devote a full chapter to it. First, however, webriefly consider each of the models in turn.
FORCE TRANSITION MODEL: AN OVERVIEW
As noted earlier, the Force Transition Model determines the requisitetypes and numbers of new ships by using future force level re-quirements or a preexisting acquisition plan.5 Thus, it gives two op-tions for creating a building plan: the Force Structure Method or theAcquisition Plan Method. Generally, an analyst coming to the toolwith very general force structure requirements would use the ForceStructure Method, whereas an analyst with a set plan, includingspecific ships, timeline, and budget, would likely use the AcquisitionPlan Method, which allows the analyst to dictate the acquisitionprofile. The overall flow of the model is shown in Figure 2.3 and isdescribed below.
How the Model Generates a Shipbuilding Plan
Force Structure Method. We first follow the path an analyst mighttake through the Force Structure Method. The process has two parts.First, the analyst needs to specify force level requirements; then themodel formulates a shipbuilding plan to meet those requirements.6
For instance, consider an analyst who comes to the tool knowing thatsix additional Virginia Class submarines (SSN 774s) are needed bythe year 2010. The analyst proceeds to the data edit and entry portionof the tool and chooses Force Structure to enter the new six-submarine requirement. A submenu appears that allows the analystto change any of the data regarding the current fleet, force
______________ 5The tool only allows the user to specify a requirement by class, not role or hull type.6The model treats the requirements as the number of ships in the active inventory, notthe number available for operational duty; i.e., it does not factor in unavailability dueto overhaul, etc.

18 The Shipbuilding and Force Structure Analysis Tool: A User’s Guide
RANDMR1743-2.3
Inputs:
Outputs:
Force levelrequirements
Acquisition planCurrent fleet
Operating plan Production plan
Model:
Acquisition plan method
Step 1: Generate procurement plan
Force structure method
Step 1: Determine deficits
Step 2: Determine required new construction
Step 3: Generate procurement plan
Figure 2.3—Flow Diagram for Force Transition Model
level requirements, and ships currently in production. The analystchooses the option Edit Force Level Requirements, opening up adatasheet that contains the force level requirements for each class byyear. These data are a key input to the Force Transition Model whenusing the Force Structure Method.7 Here, the analyst chooses theSSN 774 class from the “Class Name” and specifies the number ofships needed and the year by which they must be completed. Thetool defines a force level requirement as the minimum number of aparticular ship class that is needed by the fleet in a specific year.8
After entering these data, the analyst is ready to generate a produc-tion plan to achieve the Virginia Class requirement. In broad terms, ifthere are no ships of this class in the current fleet, the model will startthe construction of six new submarines so that they are delivered to
______________ 7There are other important inputs, particularly the number and commissioning yearsof the existing ships of that class.8The tool only allows the user to specify a requirement by class, not role or hull type.

An Overview of the Analysis Tool 19
the fleet by 2010.9 If SSN 774s are currently in the active fleet, themodel will factor these existing hulls into the plan.
How does the tool make these determinations? Let us examine howthe Force Transition Model actually generates a production planbased on these force level requirements. At the most basic level, thetool determines the plan using the demographics of the current fleet,force level requirements, and construction already in progress.
This method works in three sequential steps. The first step of themethod determines the shortfall of active vessels relative to the forcelevel requirements. The term used in the tool’s code and queries isdeficit. For example, a deficit of two means that the fleet has twofewer active vessels of the class than the force level requirements dic-tate. For each year, the model calculates a deficit and places the re-sults in an array. Table 2.1 shows an example of the array values forone class.
For the third through seventh year, there is a deficit of two vessels.For the eighth through eleventh year, there is a deficit of three ves-sels. Note that this means not that you need to build three vessels,but only that the fleet needs three vessels.
The second step determines when a new ship needs to enter thefleet. The algorithm employed is a modification of an integer pro-gramming technique used for scheduling, which is found in basic
Table 2.1
Sample Deficit Array
Year 1 2 3 4 5 6 7 8 9 10 11
Deficit 0 0 2 2 2 2 2 3 3 3 3
______________ 9The current version of the tool does not incorporate any facility limitations; thus, ifone of the shipyards has a capacity limit of three construction starts per year for thisclass, the user will have to manually “ramp up” the requirement over time. To accountfor the three-ship limit in this example, the requirement would be three new ships for2009 and six (three from 2009 and three new) for 2010. If the capacity limit were twonew starts per year, the force level requirements would be two ships in 2008, four shipsin 2009, and six ships for 2010—reaching the final force objective of six by 2010.

20 The Shipbuilding and Force Structure Analysis Tool: A User’s Guide
operations research texts.10 This technique determines a build pat-tern such that ships arrive in the fleet in a just-in-time fashion. Inother words, no new vessels are delivered before they are required.
The third step generates a new production plan based on the deliveryplan determined in the previous step (see Appendix C for a descrip-tion of the form to view the new production tables). This step ismostly a bookkeeping process and does not employ any elaboratetechniques. First, the model determines the start and end dates forconstruction based on the nominal build time for the ship class andthe delivery date. Next, the model determines the associated projectsfor the new construction by selecting a shipyard from one of theyards in the “Allocation Order” list. The model proceeds sequentiallythrough the list to determine a builder. For the first new hull, the firstshipyard on the Allocation Order list is the first, or “prime,” builder(see the Shipbuilder Production Labor section in Chapter Three fordetails about builder categories). The second shipyard builds thesecond hull, and so on. For teamed production, all the allowed ship-yards participate in construction, but the responsibility for final as-sembly and integration alternates by the order on the AllocationOrder list. Finally, the model adds a work package, or “project,” thatrepresents the design and nonrecurring work for the first-of-a-classship.
Acquisition Plan Method. The Acquisition Plan Method is the secondoption available within the Force Transition Model. Primarily for useby analysts with a specific acquisition plan already in place, thismethod generates a new construction plan based on the acquisitionprofile that the analyst defines. The analyst using the AcquisitionPlan Method comes to the tool with a schedule of new-ship produc-tion already in hand, as opposed to the general force level require-ments an analyst using the Force Structure Method would have.
To use the Acquisition Plan method, the analyst chooses the EditAcquisition Plan option, which opens a datasheet that allows the an-alyst to choose ship classes from a pull-down menu and then tospecify the number of ships of that class acquired for a given year.The analyst can also modify the start and/or end years of the acqui-
______________ 10For example, see Rick Hesse and Gene Woolsey, Applied Management Science:A Quick and Dirty Approach, Science Research Associates, 1980, pp. 248–251.

An Overview of the Analysis Tool 21
sition plan. An example of an acquisition plan datasheet is shown inFigure 2.4.
For the sample acquisition plan shown, a new LPD 17 amphibioustransport dock would be acquired in 2002, 2004, and 2007. Further,one CVN (X) aircraft carrier would be acquired in 2006. The produc-tion begins the year following the “buy” (contract award) year; for theCVN (X) in the example, construction would begin in 2007. Themethod determines the build plan by doing the bookkeeping (i.e.,setting starting years, durations, contractor roles, etc.) in a singlestep. In essence, this method bypasses the first two steps of the ForceStructure Method and directly implements the third step.
The build plan generated by either one of these two methods thenserves as a major input to the O&S Cost Model, which determines itsassociated costs, as we will see presently.
Figure 2.4—Example Acquisition Plan
THE INDUSTRIAL BASE MODEL: AN OVERVIEW
Although we cover the details of the Industrial Base Model fully inthe next chapter, a quick overview is useful at this point in the dis-cussion. This model forms the core of the tool and is focused onquantifying employment levels and labor costs at the shipyardsbased on the production plan generated by the Force TransitionModel. The Industrial Base Model determines labor demandsaccording to the production plan and then assesses the costs of thoselabor demands. One of the reasons this model is so complex is that itconsiders the entire workload at a shipyard, not just individual ship

22 The Shipbuilding and Force Structure Analysis Tool: A User’s Guide
programs. Example outputs from this model include direct laborcosts, productivity of the workforce, and burden and overhead rates.
THE O&S COST MODEL: AN OVERVIEW
In the tool, the current force data and the build plan determined bythe Force Transition Model serve as inputs to the O&S Cost Model.The model uses these two plans to determine the operating plan (thedates and ages of ships operated in the fleet). From this plan, themodel next ascertains the operating plan’s associated costs forgeneral maintenance, operations, and manpower costs—all based onthe hull’s age.
As noted earlier, this model is currently a pass-through for othermodels, such as the OSCAM, or for aggregate data from the Visibilityand Management of Operating and Support Costs (VAMOSC)database. These other models provide data on direct costs—e.g.,project-related personnel, repair, maintenance, engineering, andtraining expenses—as well as indirect O&S costs, such as overheadand administrative expenses.
THE FINANCIAL ADJUSTMENTS AND ASSUMPTIONSMODEL: AN OVERVIEW
Funding calculations, referred to in the tool as “Updating FundingProfiles,” are the final step after the analyst has worked through theForce Transition Model and the Industrial Base Model calculations(see Chapter Three). This last stage serves three functions. First, itcollects and summarizes all the funding requirements data into onetable based on the analyst’s choice of whether to aggregate cash flowon an “as-expended” or “as-appropriated” basis by fiscal year (seefootnote 3). The tool also breaks down the funding profiles into Navybudget categories—SCN, OMN, and MPN. Second, the costs are ad-justed to a fixed-year (constant-dollar) basis using the inflation in-dices. Third, the analyst has the option to enter a fixed discount ratefor all cost calculations. The tool then discounts the spending valuesby the NPV rate specified. Finally, as we discuss in the next subsec-tion, these calculations are the basis of the tool’s funding require-ments output, enabling the analyst to view the funding associatedwith the force structure choice specified.

An Overview of the Analysis Tool 23
Constant-Dollar Basis and Net Present Value
To understand fully how the tool adjusts the funding values, the ana-lyst should be comfortable with two key financial terms: constant-dollar basis and net present value. We discuss these concepts brieflyin this subsection. Analysts unfamiliar with them, however, arestrongly encouraged to consult a financial textbook or reference formore detail.11
First, let us consider constant-dollar basis. Cost analysts generally usea constant- (“fixed-”) year dollar (often called a “base-year dollar”) tocompare funding profiles over different periods and to remove theeffect of inflation. Why is it important to eliminate inflation? First,analysts often use historical data as a basis for future costs. The pur-chasing power of a dollar ten years ago was much more than it is to-day. Thus, if you used historical costs as a proxy for future costswithout any adjustment, you would be underestimating those futurecosts. Second, predicting inflation is often difficult or contentious, soto eliminate inflation predictions from analyses, funding values arefrequently quoted in constant/base year dollars.
Within the tool, adjusting costs to a constant-dollar basis is doneautomatically provided that a base year is supplied for any cost factorentered and the inflation indices that remove the effects of inflationare up-to-date. The model selects an appropriate index based on thetype of cost (SCN, OMN, MPN) in order to normalize costs from athen-year basis to a designated fixed-year basis.12 To adjust to a fixedbasis, the model divides the actual, historical costs by the index forthat year. For example, the 2001 procurement deflator for outlays in1997 was 96.1 (with 100.0 as the base for 2001). The 2001 constant-year basis for an expenditure of $10 million in 1997 would be $10.4million ($10 million/0.961). All financial outputs from the tool arethus adjusted to a fixed-year basis according to an index in the
______________ 11For example, Cost Considerations in Systems Analysis, Gene H. Fisher, RANDCorporation, R-490-ASD, 1970; DoD Instruction 7041.3, Functional Economic Analysis,Department of Defense, 1995, located on website: http://www.c3i.osd.mil.12The OSD Comptroller’s website publishes indices, in a document called the “GreenBook,” that are appropriate for DoD budgets and expenditures. Available at http://www.dtic.mil/comptroller/.

24 The Shipbuilding and Force Structure Analysis Tool: A User’s Guide
“Inflation Indices” table of the tool’s data entry section (seeAppendix C, Figure C.23).
The other important concept for the analyst entering financial data isnet present value. NPV is used to equate cash flows at different peri-ods, a process known as discounting. Underlying NPV is the principlethat money has a time value. Suppose you were given a choice be-tween $100 today or $116 in five years and that inflation is a constant3 percent per year. If we adjust the future payment to today’s dollarsusing the inflation rate, the $116 is really worth $100 in today’s dol-lars. However having $100 today is more valuable than having $100five years from now. If you can earn a real return of 5 percent on the$100 received today, that $100 will grow to about $127 in five years orabout $110 in today’s dollars (after adjusting for inflation)—9 percentmore than receiving $116 in five years. The lower value of the futurepayout is a function of its limited usage—you can neither invest itnor use it to buy something today.
Most NPV calculations utilize a fixed rate of return (discount rate) todetermine an effective investment that would be required today toproduce some future revenue or expenditure. Using the previous ex-ample, the NPV of $100 (in today’s dollars) in five years, with a dis-count rate of 3 percent, is about $86. For DoD cost benefit analyses,the Office of Management and Budget (OMB) prescribes the discountrate and adjustment method.13
These concepts become crucial for calculating funding requirementsin the tool. During the data entry stage, the analyst will encounter an“O&S Cost” subform that lists a combined dollar figure representingthe total OMN and other support costs for each year of the hull’s life.The form also features two key input fields: (1) the MPN costs for thehull for one year, and (2) the base year the analyst has used to deter-mine these costs. For example, if the data are in 1999 constant dollarsfor the OMN and MPN costs, the analyst would enter “1999” for thebase year. The results of these inputs are then fed into the fundingprofile calculations.
______________ 13See OMB Circular Number A-94.

An Overview of the Analysis Tool 25
Assumptions Check
Given the significant amount of data entered into the tool, it is quitepossible that some of the data or assumptions an analyst may usecould be inconsistent with one another. The tool cannot check for allproblems, but it does look for some very basic ones. Specifically, thetool evaluates the following conditions and values, flagging anyproblems and discrepancies that may emerge:
• The method by which new production was generated (either theForce Structure or Acquisition Plan Method, as discussed ear-lier).
• The funding assumption (as-expended or as-appropriated), dis-count rate, and discount “zero” year.
• The base year for dollar values.
• The last year a force level requirement is set.
• Whether new production starts before the analysis period. Thischeck identifies a potential problem when new production isadded prior to the analysis period in order to meet acquisitiongoals. It may indicate a force structure goal that is not practical.
• Whether new production is starting before the current year. Ifthis condition is true, it may indicate another force structure goalthat is unrealistic. New production is added to years that have al-ready passed.
• Whether the end of new production finishes after the analysisperiod. If this does occur, it may indicate that the analysis win-dow is too small: New ships purchased outside the analysis win-dow are not included in the cost calculations. This conditiondoes not always imply a problem, however. It merely indicates tothe analyst that some acquisition costs may not be included inthe analysis window.
• Whether maximum capacity limits are exceeded at a shipyard.
• Shipyards that have missing or invalid burden data.
• Ship classes that do not have a valid funding profile.

26 The Shipbuilding and Force Structure Analysis Tool: A User’s Guide
The funding reports of the tool begin by listing these key assump-tions and discrepancies (see Appendix E, Figure E.9, for a sample).

27
Chapter Three
THE INDUSTRIAL BASE MODEL
In a broad sense, the Industrial Base Model of the Shipbuilding andForce Structure Analysis Tool simulates the ways in which changes inacquisition levels affect shipyard labor and then determines the costsassociated with those changes. Based on existing production plansand the new plans specified by the analyst, the model first calculatesworkloads at each of the shipyards. Next, based on these workloads,it calculates general employment levels, productivity, and burdenrates. Finally, the model determines acquisition funding require-ments using these costs along with material and equipment costs. Italso calculates the effect on other shipbuilding work by adjustingburden rates for increased or decreased workloads resulting fromproposed ship acquisition decisions.
The model is thus designed to reflect an array of factors—labor pool,experience levels, workload distribution, labor profiles, etc.—thatcan affect ship production within the industrial base. This chapterdescribes the Industrial Base Model, beginning with the model’s im-portant concepts and components. The database contains values forthese components but also allows new values to be entered whenand where appropriate. (Appendix C describes the process ofchanging the current values stored in the tool’s database.) We alsoprovide specifics on the methodology behind many of the calcula-tions.
SHIPYARD PRODUCTION LABOR
Typically, it takes a shipyard several years to produce a ship fromstart of production to delivery. Over that period, the necessary labor

28 The Shipbuilding and Force Structure Analysis Tool: A User’s Guide
resources will vary considerably, often starting out low, rising to apeak about two-thirds of the way through production, and thentrailing off for the remaining work. The production duration andspeed also depend in large part on the ship class and the work prac-tices of the shipyard. On an even more detailed level, the need fordifferent labor trades (welding, electrical, assembly, etc.) will peak atdifferent periods during the build cycle. These variations are part ofthe reason that shipyard resource loading (the amount of resources agiven shipbuilding schedule requires during specific periods) is sucha complex issue.
A variety of features are included in the tool to account for this com-plexity. We first discuss the tool’s measurement for shipyard labor,then we proceed to the labor demands required for individual ships.Finally, we take a step back and look at the larger picture of ship-builder production labor in relation to the full workload of a shipyardand, ultimately, to the work of all the shipyards, or the shipyard in-dustrial base as a whole.
The Labor Metric: Full-Time Equivalent
Full-time equivalent (FTE) is the metric used to capture the size ofthe workforce at a shipyard. An FTE is analogous to a labor head-count but with the addition of fractional values for part-time workersand workers who are not required for the entire period. For example,if the specified work requires four full-time workers and one workerworking one-quarter time (or a full-time person who was needed foronly one calendar quarter of the period), the FTE value would be4.25. The model converts hourly labor data into FTE units based onthe standard hours per year for the shipyard. The number of hoursper quarter for an FTE is typically about 465.1 To determine anapproximate, direct headcount, however, analysts can divide thetotal number of site hours worked in a quarter by 465. For example, ifa shipyard books 25,000 hours of work during a quarter, that workwould equate to 53.8 FTE.
______________ 1The number of standard hours per year in an FTE varies slightly by shipyard anddepends on benefits and local labor practices. A standard year is basically 2,080 hours(52 weeks times 40 hours per week) minus holidays, annual and sick leave hours, etc.Thus, 465 hours per quarter yields an FTE of 1,860 hours annually.

The Industrial Base Model 29
Although all labor data are currently entered into the tool in hours(because data on labor demands for a ship are provided in hours),workforce calculations in the model are based on this FTE metric.2
The value of the FTE metric is that it accounts not just for labor hoursbut also for some of the indirect costs associated with changingworkforce levels at a shipyard. These costs (productivity, hiring andtraining costs, etc.) are directly related to headcount and do notstrictly represent total hours. Furthermore, the FTE metric allows theanalyst to compare model output more directly with actual employ-ment levels.
SHIP CLASS LABOR
Now that our labor metric is in place, let us describe the labor de-mands at the level of the individual ship. For each ship class, the toolcontains a set of fields and values that the analyst can edit, includingforce structure data, production plans, shipyard data, and, for ourpurposes here, labor data.
Within the ship class data fields, the analyst can specify a great dealof information about each class, including the sequence in whichnew ships are allocated to the shipyards (the allocation order), a va-riety of O&S costs, and so forth (see Appendix C for further details).For our purposes here, we focus on two areas: how workload (labor)varies over multiple hulls of a given ship class and how the workloadchanges over the course of building a hull.
First-of-a-Class Versus Follow-on Ships
A comparison of the labor demand for the first (or lead) ship of a newclass with that for a subsequent (follow-on) hull shows that thefollow-on hulls have much lower labor demands than the first ship ofa class, which typically requires more labor hours over a longer pe-riod. This additional labor arises for a variety of reasons. First, mostof the engineering and design work is necessary only for the first ship(e.g., nonrecurring engineering). Second, building and integration
______________ 2The hours for a ship class used in the model are the actual hours required to build theship. They are not the “standard hours” often used in an industrial engineering con-text.

30 The Shipbuilding and Force Structure Analysis Tool: A User’s Guide
issues are likely to surface with construction of the first hull. Onceresolved, these issues are not likely to reappear for subsequent hulls.Last, a general improvement in labor efficiency typically emerges asthe workforce becomes more experienced at building a particularclass of ship. This improvement is generically called learning.3
Therefore, each subsequent hull in a class should take fewer hours toconstruct than its predecessor, with the most dramatic learningoccurring between the first-of-a-class and the follow-on ship.
For example, Figure 3.1 shows the notional number of workers overtime for the first hull of a class and a follow-on ship. Notice that thereis an initial peak around 30 months for the first hull that is not pre-sent for the follow-on ship. The area under the curve out to about 40months represents the design and nonrecurring construction work.The larger peaks between 40 and 80 months represents the majorityof the recurring labor. The peaks are roughly the same shape, but the
806040200 100
Months
FT
E
2,000
1,500
1000
500
2,500
0
RANDMR1743-3.1
1st
Follow-on
Figure 3.1—First-of-a-Class Versus Follow-on Ship Workloads
______________ 3For example, see D. Novick, Use of the Learning Curve, RAND Corporation, P-267,1951, and Joseph P. Large, An Introduction to Equipment Cost Estimating, RANDCorporation, RM-5470-SA, 1968.

The Industrial Base Model 31
magnitudes are different. Subsequent hulls would have a similarworkload plot as that of the follow-on ship. The peak might decreasefor subsequent hulls through efficiency (i.e., the learning curve).
Why do these distinctions matter? In the course of using the tool—inparticular, when editing ship class data or adding new ships—theanalyst will need to provide data that describe how these workloadcurves change as a function of hull number for a given class. This dis-tinction is made to model workloads more accurately at the ship-yards. Specifically, the tool’s user will need to know the time distri-bution of hours in the nonrecurring work, the number of hours forrecurring work for the first hull, the learning curve slope, and the de-sign offset—the time between the beginning of the nonrecurringdesign for the first-of-class ship and the construction start (in the ex-ample above, it is about 30 months). (See Appendix C for more de-tails.)
Workload, Labor Profiles, and Learning
The tool stores the workload for an individual ship in two parts: thetotal number of hours it takes to build the ship and its labor profile.In the tool, a labor profile is a list of the percentage of labor used oneach task, by calendar quarter—rather than the absolute values (thenumber of FTEs or hours). This profile dictates the shape of the labordemand, but not the magnitude. The full workload profile can be de-rived by multiplying the total hours for the activity by the profile. Wechose this split format to allow an analyst to use a similarly shapedprofile for multiple projects even though the total hours might bedifferent, thus saving time on data entry.
For example, in Figure 3.1, we saw the workload for a first-of-classand follow-on ship, with the workload plotted as the number of FTEsby month. If we converted the follow-on ship workload to the profileformat as would be entered in the tool, the resulting profile is asshown graphically in Figure 3.2. The corresponding number of hourswould be 7.44 million hours (a conversion from FTEs in Figure 3.1).In the tool’s “Labor” subform, the analyst chooses from a selection oflabor profiles, such as “DDG 51-Prime.” (See Appendix C, “Edit LaborProfiles,” for details on the actual values associated with the profilenames.)

32 The Shipbuilding and Force Structure Analysis Tool: A User’s Guide
151050 20
Quarter
Per
cent
age
of to
tal l
abor
14
6
4
2
16
0
12
10
8
RANDMR1743-3.2
Figure 3.2—Example Labor Profile (as entered)
The final step in generating a labor profile for a specific hull is to ad-just the curve based on learning. The model applies a unit learningcurve to the baseline workload (as described above). The analyst isable to enter specific data relative to learning, such as the slope of thelearning curve and the amount of prior production.
The “Project” Concept: When Labor Is Divided AcrossShipyards
The view of ship production described above assumes that one ship-yard does all the production work. However, in some cases the workmay be split among multiple shipyards. A good example of such acase is the production of the new Virginia Class submarine (SSN 774).For this class, the production of each submarine has been split be-tween Newport News Shipbuilding and Electric Boat. The two con-tractors have defined responsibilities for the production of moduleson each hull (i.e., each contractor produces certain sections of theship), and each alternates responsibility for the final assembly andintegration of the modules.

The Industrial Base Model 33
To model the sharing of production on a single hull, the tool uses theconcept of a “project” for ship labor. A project is a work package thata specific shipyard performs as part of the production of the entirehull. In the tool, a project includes the shipyard name and the con-tractor role (see the following section). The total production of onehull is made up of one or more projects. If one shipyard builds theentire hull, there is only one project for the ship’s production.4 Ifmultiple yards produce a hull, there will be one project for each ship-yard.5 Using the example of the Virginia Class submarine, NewportNews and Electric Boat would each have a project for the productionof every hull. However, the labor profile associated with each projectmight vary based on the role of the contractor on a particular ship.
Or consider a different situation. Suppose production of a class isshared, but shipyards alternate production of a complete ship, as wasdone initially for the Arleigh Burke class (DDG 51). For this example,each hull would have one project, but the shipyard responsible forthat project would change.
The fact that the tool can account for this sharing, a common prac-tice in the current industrial base, reflects its flexibility in terms ofportraying actual shipyard practices.
Contractor Roles
Connected with each project is the role of the contractor. For a givenclass, a contractor might have a fixed role, or the role may vary fromhull to hull. The tool sets out four types of roles that can be chosen(from a pull-down menu):
• Designer: A contractor that does the initial design work for thefirst of a class. Note that this role applies only for the first hull of anew class. Even though one shipyard might produce the hull,
______________ 4Design and nonrecurring work for the first-of-a-class ship is also considered a pro-ject. Thus, the first hull might have two projects even though one shipyard might buildthe entire ship.5When ships are produced by multiple shipyards, it is fairly common for the work tobe allocated by blocks or modules (major structural units). Thus, a shipyard will pro-duce certain section of the ship for each hull. Examples of such an approach are theVirginia Class submarine and the United Kingdom’s Type 45 destroyer.

34 The Shipbuilding and Force Structure Analysis Tool: A User’s Guide
there will be two projects for the first hull: one project with theshipyard role as a Prime and the other project with the same yardas a Designer. For the follow-on hulls, there would be one projectfor each hull, with the shipyard having the Prime role.
• Builder: A contractor that produces only modules and is not re-sponsible for final assembly and integration. The production of ahull is shared with other contractors.
• Builder and Integrator: A contractor that produces some of themodules and also performs the final assembly and integration.
• Prime: A single contractor that builds, assembles, and integratesthe entire hull.
To make this information more concrete, consider a specific sce-nario. Figure 3.3 shows a sample construction plan for a series ofship classes taken directly from one of the current database’s tables.
Figure 3.3—Example Production Plan
The Industrial Base Model 35
(The data are an example only.) A new ship in the DDG 51 class ishull number DDG 100, as shown in the figure. It starts production in2003 and is delivered in 2006. Ingalls Shipyard is the sole producer ofthat hull. Therefore, there is one project for the DDG 100 productionwith Ingalls serving in the Prime role. For the next hull produced inthe class, DDG 101, Bath Iron Works is the producer. Similar to theDDG 100, there is one project for that ship production, with the con-tractor serving in the Prime role. For the production of SSN 775,however, there are two projects. The first project has Electric BoatShipyard as Builder and the second has Newport News as Builderand Integrator, meaning that Newport News will build somemodules and do the final assembly and integration.
These categories serve a larger purpose than just documenting therole each shipyard takes in a hull’s production. They are importantfor determining workloads, labor profiles, build times, and full-scaleindustrial base schedules, because each contractor role carries with ita different demand on a shipyard.
SHIPYARD LABOR AND COSTS
Let us now move from individual ships to a discussion of the work-load for an entire shipyard and related costs. First, we discuss howdifferent types of work at the shipyards are categorized.
New Production, Existing Production, and Other Work
In the tool, all the production work performed at each of the ship-yards is distinguished by one of three categories:
• New Production consists of future work on ship production. It isa speculative category and therefore no funding is associatedwith it in the tool. This category changes when new ships areadded by the Force Transition Model.
• Existing Production means ship production currently under way(or already planned and programmed to begin). Work is added tothese tables when new ships are authorized, and it remains inthis category until delivery, at which time the analyst should re-

36 The Shipbuilding and Force Structure Analysis Tool: A User’s Guide
move the “work” from this category and add it to the existingfleet list.6
• Other Work is production work that is part of the overall indus-trial base but is not related to building a new ship or submarinefor the U.S. Navy. All the ship availability and repair work done atprivate shipyards would fall into this category. For example, aRefueling Complex Overhaul (RCOH) for a nuclear aircraft carrieris a major production for which the resource demands are signif-icant. Such work, however, does not produce an additional shipin the fleet. Another example of a type of work that falls underthis category is work for non–U.S. Navy customers. For instance,Newport News at one time produced tankers for a private cus-tomer. This work influenced the industrial base even though theU.S. Navy did not pay for it and the production did not result in anew ship for the fleet.
These categories are necessary as a result of the way the tool calcu-lates various quantities. For example, because Other Work does notresult in new ships for the U.S. Navy, these activities are excludedfrom any of the ship count calculations. In turn, because ExistingProduction is considered fixed in time, the Force Transition Modeldoes not change the start and end dates for such work. Ultimately,then, these categories offer different ways of distinguishing betweenproduction that influences the schedule and costs.
Now let us turn from the categories of production that make upshipyard workloads to measures of aggregate workload and effi-ciency. Specifically, we consider three sets of labor calculations: ef-fective versus required labor; the effect of attrition, hiring, and ter-mination rates; and, finally, shipyard productivity.
Effective Versus Required Labor
At the shipyard level, one of the important distinctions of the tool isthe difference between effective and required labor. The IndustrialBase Model assumes that shipyard workload is a summation of indi-
______________ 6The Naval Sea Systems Command (NAVSEA) 017 produces a quarterly report ofongoing work at http://www.navsea.navy.mil/sea017/INDEX.html.

The Industrial Base Model 37
vidual ship production activities. Therefore, one can determine thetime-varying workload at a shipyard by knowing the timing of theindividual ship constructions and their associated labor demands.The direct sum of all the work is termed required labor, which is theminimum labor necessary to complete all the work at a shipyard tofulfill its orders.
Shipyards, however, rarely staff to the required workload. At certaintimes, the shipyard may need to employ a larger labor pool than re-quired to meet future demands or to comply with union agreements.Similarly, the shipyard may not be able to reduce the labor pool asrapidly as the requirement falls. Effective labor is the tool’s term forthe labor resulting not from the required numbers of workers at ashipyard but from the actual number of workers. Effective labor,which is always equal to or greater than the required labor value inthe tool, is more representative of the actual employment at ashipyard because it reflects the inefficiencies of expanding andcontracting the workforce. All acquisition costs are calculated basedon the effective workload. For more detail, see “Running the Models”in the next chapter.
Attrition, Hiring, and Termination Rates
The distinction between effective and required labor is based on thefact that shipyard labor pools are not static. Each shipyard has fac-tors that dictate how quickly the workforce (in FTE units) can changefrom quarter to quarter. The rates of change are expressed as per-centage changes from the total labor pool.
The attrition rate is the percentage of the labor base lost because ofattrition for each calendar quarter as a result of retirements and res-ignations. The hiring rate, a function of the local labor base, the worktype, and the economic conditions, is the maximum percentage bywhich the labor base can increase for one quarter. Likewise, thetermination rate is the maximum percentage by which the labor basecan decrease. This rate is determined, in part, on company policiesand labor contracts.
When the tool runs its calculations, these three rates are combined tolimit how much the labor workforce can change in a given quarter. Itthus has a direct impact on questions of effective and required labor

38 The Shipbuilding and Force Structure Analysis Tool: A User’s Guide
calculations. (See the section entitled “Industrial Base Model inAction” below for specific details as to how these attrition, hiring,and termination rates operate as constraints in effective laborcalculations.)
Productivity
The final labor calculation in the Industrial Base Model is workforceproductivity. The calculation of effective labor, described above,assumes that the shipyards make rational employment decisionsbased on long-term workload and labor conditions. The effectiveemployment levels are set such that there are a sufficient number ofworkers and that hiring and firing are kept to a minimum. However,the above calculations do not account for the experience level of theworkforce. Workers with some experience are generally moreproductive than inexperienced workers. Thus, for a workforce with ahigher proportion of inexperienced workers, additional effort isneeded to complete an identical task. This additional work might bedone using temporary workers, overtime, additional full-timeemployees, or even lengthening the ship production schedule.
The Industrial Base Model calculates relative productivity for asteady-state workforce—that is, a workforce that is held at a constantlevel for a long time. Thus with normal attrition, some baseline hiringof workers is necessary. This long-term productivity level is definedat 1.0. When the workforce needs to expand, more workers are hiredthan the steady-state level. Therefore, the overall productivity will belower. When the productivity of the workforce drops below 1.0, themodel assumes that the work shortfall is addressed through the useof overtime and not through additional hiring. The assumption is areflection of the belief that shipyards will try to minimize their per-manent workforce levels.7
______________ 7An alternative strategy would use temporary/contract labor. Typically, this tempo-rary labor is targeted at a specific trade or activity and not general productivity. Unionagreements limit where and how temporary or contract labor can be used. For sim-plicity, we assumed that extra work resulting from productivity shortfalls would beaddressed through overtime work.

The Industrial Base Model 39
Burden Costs
Burden costs (or indirect costs) for shipbuilding are costs associatedwith work at a shipyard that cannot be connected with a specificship. While these burden costs are related to, and scale with, the totaldirect labor for a shipyard, the relationship is not strictly linear.Indirect costs include both fixed and variable components. The toolis designed to reflect the fact that the overhead and G&A rates de-crease as the number of direct labor hours at a site increase becausethe relatively fixed overhead and G&A costs are spread over a greaternumber of hours.8
Each shipyard has its own practices with respect to direct and indi-rect costs. Generalizing, indirect costs consist of the following:
• Overhead expenses, the largest of the indirect costs, are those re-lated to production activities that cannot be charged on a directbasis for a particular product for reasons of either practicality oraccounting convention. They typically include the costs of fringebenefits, indirect labor, depreciation, building maintenance andinsurance, computer services, supplies, travel, and so forth.9
• G&A expenses relate more to the company as an entity than toactivity levels at only one plant. These include such general busi-ness costs as executive salaries, human resources costs, and thecosts of staff services such as legal, accounting, public relations,
______________ 8To reflect the relationship between direct hours and the indirect cost rates, we usethe following formulation:
rate
A
Total Direct FTEsBk
kk= + ,
where ratek is the indirect rate, and Ak and Bk are constants. The constants Ak and Bkare obtained through regressing the burden rate sensitivity versus the inverse of thetotal direct FTEs. Ak is the slope of the regression, and Bk is the constant (seeAppendix C for more detail).9Indirect-Cost Management Guide: Navigating the Sea of Overhead, published by theDepartment of Defense Systems Management College Press, October 2001, FortBelvoir, Va. Available at http://www.dau.mil/pubs/gdbks/icm_guide.pdf.

40 The Shipbuilding and Force Structure Analysis Tool: A User’s Guide
and financial functions.10 G&A costs are typically incurred andaccounted for at the corporate level, whereas overhead tends tobe a site-specific cost.
• Other components relate to such indirect costs as cost of money,overtime premium, fee, etc.
THE INDUSTRIAL BASE MODEL IN ACTION
All these industrial base factors, while individually useful for analysts,work toward the broader goal of creating a tool that allows de-cisionmakers a greater degree of integration and depth in the array ofelements that affect procurement decisions. Further, the tight inte-gration of these components reproduces the way that naval produc-tion operates—influenced as it is by factors both large (for instance,the capabilities of the limited number of U.S. shipyards left) andsmall (for instance, the peak productivity rates of welders versuselectrical engineers). Thus the tool moves toward the goal of creatingmore-robust analytical capabilities for decisionmakers. Of course,the tool’s value depends not just on the accumulation of variousspecification capabilities; it also depends on the way the tool actuallyworks—the means by which it produces outcomes.
Let us now consider the flow of the Industrial Base Model as shownin Figure 3.4. Using the production plan produced in the ForceTransition Model, the Industrial Base Model first calculates the re-quired labor (step 1). (As stated earlier, required labor is theminimum labor necessary to complete all the work at a shipyard for agiven quarter.) Calculation of effective labor, which is morerepresentative of the actual employment at a shipyard, is step 2 ofthe model. Next, the model calculates productivity and burden ratesusing effective labor (steps 3 and 4). Finally, in step 5, productionlabor costs (direct and indirect) are determined. We describe themethodology for steps 1 through 3 below. step 4, burden ratecalculations, was described fully above. Step 5, the production laborcost calculations, is a simple aggregation process.
______________ 10“Evaluating Indirect Costs,” Contract Pricing Reference Guides: Volume 4—Advanced Issues in Contract Pricing. Available at the Department of DefenseProcurement website at http://www.acq.osd.mil/dp/cpf/pgv1_0/pgv4/pgv4c2.html.

The Industrial Base Model 41
RANDMR1743-3.4
Inputs:
Output:Production $
(to financial adjustmentsand assumptions model)
Production plan(from force transition model)
Existing productionand other work
Model:
Step 1: Calculate required labor• Rescale demand profile• Apply learning
Step 2: Calculate effective labor
Step 3: Calculate productivity
Step 4: Calculate burden rates
Step 5: Calculate production $
Figure 3.4—Flow Diagram for the Industrial Base Model
Required Labor Calculations
The required labor portion of the Industrial Base Model works bysumming all the labor demands for a site by quarter. Normally, aquery object within MS Access could directly handle such a simplecalculation; no Visual Basic for Applications (VBA) programmingwould be necessary. However, because the tool allows the analyst toshorten or lengthen build durations from their typical values, the re-quired labor calculations are more complicated. This rescaling of theworkload profiles requires a custom program. The current rescalingmethod works in two steps:
• First, the labor profile is expanded or contracted from the defaultlength to the desired duration while preserving the overall curva-ture of the labor distribution (the first derivative of the curve).This process is done through piecewise, linear interpolation.
42 The Shipbuilding and Force Structure Analysis Tool: A User’s Guide
• Second, the labor profile is adjusted so that the total sum re-mains the same.
Thus, rescaling does not change the total FTEs for a project, just theirdistribution. The method chosen was a compromise to preserve therelative “curvature” of the distribution while fixing the total FTEs.
The exceptions to the rescaling method are the projects in which thecontractor has a Designer role. Those projects are not scaled basedon the start and end dates; they are fixed. Some care must be exer-cised when rescaling the construction duration for the first of a classso that the Designer and Prime distributions overlap correctly.
Effective Labor Calculations
The effective labor calculations are based upon a constrained growthmethodology. That is, employment levels are restricted by howrapidly they can expand or contract. The model uses a linear pro-gramming (LP) method to “solve” for the minimum employmentlevel that satisfies the growth constraints and the demand. The LPmodel specification is as follows:
Objective Function:
Minimize
Ett
t n
=
=
∑1
where Et is the effective labor for quarter t (which runs from 1 to n,the total number of quarters being analyzed).
Constraints:
E Rt t≥
where Rt is the required labor for quarter t.
E E k kt t grow attr≤ + −−1 1*( ), for all t > 1
The Industrial Base Model 43
where kgrow is the maximum growth rate and kattr is the overall at-
trition rate
E E k kt t term attr≥ − −−1 1*( ), for all t > 1
where kterm is the maximum termination rate
Et ≥ 0 .
Note that the effective labor for the first quarter (where t = 1) is un-constrained except for E R1 1≥ . We deliberately did not constrain theinitial value so that the analyst would not try to solve an infeasibleproblem. That is, the algorithm will always find a solution to thisparticular specification, but the analyst should determine whetherthe solution is realistic, particularly with respect to the initial effec-tive labor value and the actual shipyard employment.
Once the required and effective labor calculations are complete, theanalyst can calculate the workforce productivities at each of theshipyards. Those calculations are based on the effective labor calcu-lations and on productivity data, as described earlier in this chapter.In turn, a variety of reports can be generated from these calculations,including required labor at a given shipyard by class, required laborwith a new build table, and required labor compared with effectivelabor.
Productivity Calculations
In the tool, productivity for each trade is determined by calculatingthe number of workers at discrete experience levels, using a forwardpropagation technique. From quarter to quarter, workers move tothe next highest experience level until they reach the highest level.However, not all workers progress to the next level. Some might belet go because of declining workload at the shipyard, and some arelost because of attrition.11 If the workload increases, additionalworkers might be added to a particular experience level through hir-
______________ 11We do not address the situation for which workers do not progress because of lackof ability. That is, we directly model not competence level but seniority. We assumethat there is a one-to-one correspondence.

44 The Shipbuilding and Force Structure Analysis Tool: A User’s Guide
ing. The following assumptions were made concerning the produc-tivity calculations:
• Because we do not have experience data from the shipyards, thefirst quarter is assumed to be in a steady-state condition; i.e.,most of the workers are at the highest level of experience with afew workers at the lower levels to replace those lost because ofattrition.
• If workers must be let go, the more inexperienced workers are letgo first.
• For situations in which the product of the productivity and ef-fective labor is less than the required labor, the work shortfall isovercome through the use of overtime. There is no limit set tothe amount of overtime used. However, the amount used is typi-cally small because the required labor is close to the effective la-bor and the majority of the workforce has some prior experience(i.e., the workforce does not comprise mostly inexperiencedworkers).
• The productivity rate never exceeds 100 percent.
• The experience level of newly hired workers is based on ananalyst-specified probability distribution. That is, a newly hiredworker might not be inexperienced. (The probability of a newhire being at level i is prbi .)
For a specific trade, the number of workers (x) at a level (i) at quarter(t) is given by:
x ht t1 1, ,= , for t > 1
x x k h li t i t attr i t i ti, , , ,*( )= − + −− − −1 1 11
, for t > 1 and 1< i < n,
x x k x k h ln t n t attr n t attr n t n tn n, , , , ,*( ) *( )= − + − + −− − −−1 1 11 1
1
where
hi t, is the number of workers hired for the it h level at quarter t;
li t, is the number of workers laid-off for the ith level at quarter t;n is the total number of levels.
Note that we must have that

The Industrial Base Model 45
x Ei ti
n
t,=∑ =
1
.
Either hi t, or li t, may be zero for a given quarter depending on thenumber of workers remaining. These specific relationships are:
If
E x kt j tj
n
attr j≥ −−
=∑ , *( )1
1
1
(the case where workers need to be hired), the expected level of newhires is
h prb E x ki t i t j tj
n
attr j, ,* *( )= − −⎧⎨⎪
⎩⎪
⎫⎬⎪
⎭⎪−
=∑ 1
1
1 and li t, = 0 for t > 1,
where prbi is the probability of hiring a new worker at experiencelevel i.
Otherwise,
(the case where workers need to be let go)
x t1 0, = (no new entry-level workers)
l Min x k E l or x k
l Minx k E l or
i t j tj
n
attr t j tj
i
i t attr
n tj t
j
n
attr t j tj
n
j i
j
, , , ,
,, ,
*( ) *( )
*( )
= − − − −⎧⎨⎪
⎩⎪
⎫⎬⎪
⎭⎪
< <
=− − −
−= =
−
− −
−= =
−
∑ ∑
∑ ∑
−11 2
1
1 1
11 2
1
1 1
1
1
1
for i n;
xx k x kn t attr n t attrn n− − −− + −
⎧
⎨⎪⎪
⎩⎪⎪
⎫
⎬⎪⎪
⎭⎪⎪−1 1 11 1
1, ,*( ) *( )
hi t, = 0
The net productivity of the workforce for a quarter, then, is calcu-lated by weighting the relative productivity for each level by the

46 The Shipbuilding and Force Structure Analysis Tool: A User’s Guide
number of workers employed at that level. The net productivity isnormalized such that the steady state (the first quarter) has a pro-ductivity of 100 percent:
prod
pd x x
pd x x
t
ii
n
i t ii
n
ii
n
i i ti
n=
⋅
⋅
= =
= =
∑ ∑
∑ ∑1
11
11
1
, ,
, ,
where pdi is the relative productivity of the workers at level i.
These productivity calculations then lead to the final set of calcula-tions: generating the funding requirements by year and budgetaryaccount. After generating funding requirements, the analyst is readyto view the outcomes for the force structure set forth.

47
Chapter Four
WORKING WITH THE TOOL
Having set out the basic architecture of the Shipbuilding and ForceStructure Analysis Tool and explored how it works, we turn in thischapter to the details of how it should be used, its limitations, and is-sues that may confront the analyst in the course of use.
SUMMARY
Recall that the tool is a collection of four interlinked models that al-low an analyst to understand the industrial base, funding, and fleetsize consequences of various force structure or acquisition assump-tions. The following summarizes the analysis process:
• Create a new data set to store a record of the assumptions andinputs used.
• Enter new data and modify existing data to meet the given sce-nario.
• Choose a time period, and then calculate the build table usingthe Force Transition Model (see Chapter Two).
• Run the Industrial Base Model as follows:
— Generate the required labor needed to carry out the buildtable. To do so, the tool determines the minimum labor(FTEs) necessary to build the specified ships at the shipyards.To make these calculations, the tool uses the labor, learning,or project data that has been entered for each ship class.

48 The Shipbuilding and Force Structure Analysis Tool: A User’s Guide
— From here, determine the effective labor required to buildthe required ships at the shipyards based on contractionsand expansions of the labor pool.
— Next, calculate the workforce productivity at each of theshipyards. The calculations are based on the effective laborprofiles and the productivity data for the shipyard’s work-force. This step also calculates burden rates and theoverall production labor costs.
• Update funding profiles. This series of calculations consists ofrunning the O&S Cost Model, adjusting costs to a constant-yearbasis, allocating costs to fiscal years on an as-expended or as-appropriated basis, calculating NPV, and generating notes onimportant financial parameters and inconsistencies. This laststep serves as the final stage in the calculations process beforethe analyst is ready to generate the output reports on thespecified force structure plan.
When ready to view the results of the calculations in various forms,the analyst returns to the top-level menu and chooses the Reportsoption. The analyst can run reports in three categories: shipyard la-bor, funding, and ship counts. (See Appendix E for sample reports.)
Shipyard labor reports provide the analyst with a range of outputsfocused on labor, overhead, and productivity. The analyst can specifysuch elements as the labor data type (required, effective, requiredversus effective, burden rates, or productivity) and the labor units(FTEs or hours), as well as the output format (chart or table).
As discussed in Chapter Two, funding reports highlight a variety offunding profiles at different levels of detail, from the total fleet levelto the individual class level. The output is available in chart, table, orreport summary format.
Finally, ship count reports allow the analyst to view output of thenumber and hull type of active ships over time, a table of require-ments by ship class, or a table of the new construction starts, for allshipyards or a particular shipyard.

Working with the Tool 49
RUNNING THE MODELS
After entering all relevant data, the analyst can return to the tool’stop-level menu and begin to run the models. Most often, the analystwould approach the calculations in the order that the menu liststhem:
• Update Year List
• Calculate Build Table (runs Force Transition Model)
• Generate Required Labor Profiles (step 1 of Industrial BaseModel)
• Generate Effective Labor Profiles (step 2 of Industrial BaseModel)
• Calculate Productivity (steps 3–5 of Industrial Base Model,which include productivity, burden rate, and production costcalculations)
• Update Spending Profiles (runs Financial Adjustments andAssumptions Model).
LIMITATIONS OF THE TOOL
Data Updates Required
A considerable amount of data is required to make full use of thetool. We have done our best to populate it with all available data, butanalysts will need to supplement, modify, and update the data pro-vided to make valid assessments. The tool’s “Data Sources Report”contains the documentation of sources used. Because the financialdata change regularly, we suggest that the following data should becollected or updated before running any of the models. We suggestthat these data be updated every 3–12 months (depending on type)to ensure that the latest data are used for analyses. The most likelysource of the required data is shown in parenthesis.
• Labor hours and material and equipment costs for all shipclasses need to be gathered (ship Program Executive Offices[PEOs] or NAVSEA 017). Note that in the database supplied withthe tool, the material and equipment costs are entered as “0.”

50 The Shipbuilding and Force Structure Analysis Tool: A User’s Guide
• Accurate learning curve information for each ship class needs tobe entered into the tool. The data currently entered are only a“placeholder.” (NAVSEA 017)
• Overhead, G&A costs, fees, and so forth are currently rolled intoone burden rate. In the supplied dataset, there are no shipyard-specific data for the slopes of these rates as a function of work-load. Thus, the burden rate is static and does not vary by work-load. The specific rates should be updated with the latest datafrom the Defense Contract Management Agency [DCMA] repre-sentative at each shipyard. (shipyard DCMA or Supervisor ofShipbuilding [SUPSHIP] office)
• O&S cost data exist for only a few classes. The data are based on amix from two existing systems that track O&S costs: the VAMOSCtool and the OSCAM. Specifically, the O&S data in theShipbuilding and Force Structure Analysis Tool are from theVAMOSC class averages from 1997 and from a series of OSCAMruns. These values may contain maintenance, overhead, andrepair costs. Some of the data, however, might already beincluded in the Other Work items (specifically, carrieravailabilities at Newport News Shipbuilding). In practice, theanalyst should avoid double-counting these costs (once in OtherWork and once in the O&S data) by removing them from the O&Sdata if they also appear as workload at a shipyard.1 (www.navyvamosc.com, http://www.oscamtools.com/, and ship PEOs)
• Labor data for some ships now under construction should beadded. For other classes in which more than one yard can build aship, the current data use the same labor profile for each yard.(NAVSEA 017 and PEOs)
• The hiring, termination, and attrition rate data for shipyard laborare used to test the model and do not reflect actual values.(shipyards)
• The productivity data, as discussed in Chapter Three, are basedon assumptions rather than fact. In particular: (1) It takes three
______________ 1Note that the RCOH costs for nuclear carriers have already been removed from theOSCAM output because the RCOH costs are included as part of the Other Workcategory in the tool. The work is done at a private shipyard.

Working with the Tool 51
years to become fully proficient at a trade; (2) worker productiv-ity improves linearly with experience to a fully qualified status,beyond which no further productivity is modeled; (3) a workerwith no experience has a productivity of two-thirds that of a fullyproficient worker; and (4) the chances of hiring a worker at anyexperience level are identical. (shipyards)
Before using the tool, an analyst will need either to resolve these datadeficiencies or to take into account that some of the results will beincomplete or are only representative of actual situations.
In addition to these data issues, analysts should be aware of two setsof limitations for the tool, which we discuss below.
Force Transition Model Limitations
The Force Transition Model has several important limitations. First,the force level requirement must be specified by ship class (e.g., DDG51) and not by hull type or role (e.g., Guided Missile Destroyer,Surface Combatant). Second, as described earlier, the model doesnot account for any shipyard facility constraints; that is, it allowseach shipyard to produce (or start) a number of ships that, in reality,would be impractical. For example, you could create a data set inwhich Newport News builds five new aircraft carriers at once. In re-ality, however, dock and pier facilities preclude Newport News frombuilding more than two new aircraft carriers at any given time.Therefore, you must be careful about how force level requirementsor acquisition plans are set. The best way to avoid this problem is toincrease force level requirements or acquisition amount by a reason-able number from year to year. For the above carrier example, oneadditional carrier added to the fleet every three to four years wouldbe a reasonable increase. A good source to discuss these limitationswith would be the shipyards and the local SUPSHIP offices.
Industrial Base Model Limitations
The Industrial Base Model is limited in that it assumes that workloadcan be scaled linearly for a project when its duration is changed. Thatis, if the duration of a project changes, the total aggregate FTE work-load does not change. In practice, the aggregate workload might de-

52 The Shipbuilding and Force Structure Analysis Tool: A User’s Guide
pend on project duration. In addition, long-lead-time items maylimit the degree to which a schedule can be shortened. Thus, theanalyst should be careful not to shorten or extend schedules by morethan a year or two.
DEALING WITH REAL-WORLD PROBLEMS
An analyst is likely to encounter a number of common issues whenemploying the tool. This section discusses those issues and how toaddress them with the tool.
Implications of Changing Ship Life
A familiar analysis problem is how modifying the active life of a shipclass changes force structure and O&S costs. For instance, what arethe resource and force-level implications if we extend the life of aclass by a few years?
The analyst needs to address two issues to answer this question. Thefirst is to understand how the count of active ships changes overtime. To change the active life of a ship class, the analyst needs tochange the “Ship Life” field on the “Edit Ship Class Data” form (seeFigures 4.1 and C.2). This field determines the retirement year for allactive ships that do not have an explicit “Out Year” value entered (onthe “Edit Active Fleet Information” form, see Appendix C). The samefield also determines the retirement year for all new ships. Based onthe force level requirements, the number of new ships for that classbuilt may change, resulting in a different acquisition funding profile.Further, the number of active ships may change as well.
The more difficult part of the problem is determining the effect of thelife extension on O&S costs. For some ship classes, data may beavailable to enable the analyst simply to add new records to the O&Scosts for the additional years (as shown on Figure 4.1). For otherships, particularly nuclear ones, the issue becomes whether a refuel-ing or major overhaul is necessary to extend the life. If so, the analystwill need to add the appropriate availabilities to the Edit Other WorkList (see Figure C.9) (one major overhaul and/or refueling for eachhull whose life is extended) if the work would be performed by one of

Working with the Tool 53
Figure 4.1—Edit Ship Class Data
the private shipyards (see Appendix C). Otherwise, the cost should beadded to the O&S category.
Early retirement is a simpler issue. The analyst can take two ap-proaches. One is to shorten the life of all the ships of that class.Again, modifying the Ship Life field easily modifies the active life. Analternative approach would be to selectively retire hulls early usingthe Out Year field for the active ships. For early retirement, it is notnecessary to modify the O&S costs, since the model will do it auto-matically.2
______________ 2We have not addressed the decommissioning or scrapping costs for the ships. Thesecosts are beyond the scope of the tool. The analyst should be aware that there may beother budget implications to the retirement of ships that the tool also does not address(e.g., defueling).

54 The Shipbuilding and Force Structure Analysis Tool: A User’s Guide
Detecting Industrial Base Problems
Recognizing industrial base problems in an analysis is often a quali-tative process. A useful place to start after entering the data set is toexamine the Required Labor chart (see Figure E.2), which shows thelabor demands over time. The analyst should be looking for rapidchanges in employment levels (FTEs). Deep gaps, valleys, or spikesmay indicate temporary problems with workload. Furthermore,rapid changes in employment levels could indicate a potential prob-lem. A steep labor profile is disruptive to the shipyards. It means theyeither are laying off a good number of workers or are hiring andtraining many new ones. Both of these situations are costly and inef-ficient. There are no hard and fast rules as to what is a “significant”change, but shipyard workforce turnover is about 3–4 percent an-nually, so a greater turnover could be considered significant. Somejudgment is required.
Another chart that might illustrate a problem is the Burden Ratechart (see Figure E.2). Big swings in the burden rate also indicate ahighly variable workforce. Often, a shipyard will have a range of rea-sonable burden rates it can maintain. Moving outside that rangecould mean that the shipyard will need to modify its infrastructure inorder to sustain a given workload. However, the burden rate in thetool only changes if the appropriate data are supplied.
Extending or Moving Construction Time for a Ship
The analyst may also confront the need to move or extend construc-tion time. Program issues, budgeting concerns, or industrial baseconsiderations might cause the schedule change. To modify a par-ticular hull, the analyst needs to edit the Start and End fields(Quarters and/or Years) of either the “In Production” or “NewProduction” forms (see Figures C.5 and C.8 in Appendix C). TheIndustrial Base Model automatically rescales the workload profile.
There are some practical limits to how well the rescaling works.Changing the build time by more than two to three years from itsnominal value could result in unrealistic profiles. Recall that therescaling algorithm fixes the total workload demand for a class. If theconstruction were extended dramatically, this assumption might nolonger be correct; fixed resource and management demands would

Working with the Tool 55
not diminish proportionally to the duration. Thus, the total numberof hours might be greater for a very extended schedule.
Furthermore, the projects in which the contractor has the Designerrole are not rescaled by this method. The workload profiles remainstatic. As discussed earlier, if the construction period is shortened orlengthened, the analyst should make certain the Design Offset valueand workload profile for the nonrecurring work is consistent (see thetop level of the form shown in Figure C.10, described in Item 8).
Changing Force Structure
Some care must be exercised when changing force levels. If thenumber of ships in the fleet is increased, the analyst will need toramp up the force level requirements gradually so that the new con-struction does not overwhelm the industrial base. For example, sup-pose there is a requirement for 12 ADC (X) ships by 2009 and ships ofthat class exist. If the analyst entered a single requirement, 12 shipsin 2009, the Force Transition Model would build 12 new ships, allstarting in 2005 and finishing in 2008. Remember that the modelbuilds new ships only when needed. To avoid this problem, the ana-lyst should set an increasing series of requirements until the finallevel is reached. Table 4.1 shows how the analyst might set the re-quirements for the example of 12 ADC (X).
In no case are more than three new ships started in one year, yet by2009 the force structure goal of 12 active ships will be met.
Table 4.1
Example Force Level Requirement
Year ADC (X)
2004 1
2005 4
2006 6
2007 9
2008 11
2009 12

56 The Shipbuilding and Force Structure Analysis Tool: A User’s Guide
CONCLUSION
The strength of the Shipbuilding and Force Structure Analysis Tool isits integrated architecture. Existing tools offer capabilities for analyz-ing individual facets of the industrial base, weighing force transitionoptions, or determining various funding options. Until now, how-ever, no modeling environment has captured all these componentsin one tool and assisted decisionmakers in weighing trade-offsamong operational needs, force structure, and funding decisions.Further, existing tools focus on individual shipyards rather than con-sidering the entire shipbuilding industrial base. In addition, becausepast models were often developed by different organizations, theirassociated data sources and analytic methods were not necessarilyconsistent, resulting in uncertainty about the dependability of the in-tegrated results.
The Shipbuilding and Force Structure Analysis Tool, however, pro-vides that integrated capability. In the past, analysts needed to stringtogether the results from a range of tools, subjectively formulating anoverall force structure picture. Now, analysts will be able to identifyand evaluate various naval force structure, resource requirements,and industrial base options in a systematic way while also incorpo-rating various relationships between the factors that influence operat-ing and ship construction costs. Specifically, this tool allows the ana-lyst to integrate an array of influences—resource requirements(funding), schedule, workload, shipyard capacity, etc.—to formulatea total resource requirement. Finally, in contrast to past approaches,the tool allows users to fully document their analysis by listing as-sumptions, definitions, and data sources, thus ensuring the integrityof the results.
We hope that the tool will simplify and improve the process ofanalyzing future naval force structure options for defense reviews,helping analysts by means of its integrated capabilities and helpingpolicymakers by providing integrated results that will enable more-informed decisions. In the end, the tool should enable the rapidscreening of multiple options and alternative strategies and allowthe Navy to better understand the industrial-base and resource-allocation implications of its acquisition strategies.

Working with the Tool 57
In 2001, the Shipbuilding and Force Structure Analysis Tool was putinto use by RAND researchers conducting an analysis for the UnitedKingdom’s Ministry of Defence (MOD). The RAND team examinedoptions open to the MOD to acquire and produce the Royal Navy’snext-generation destroyer, the Type 45. Using the tool, the teamevaluated various options for acquiring and building the Type 45 andthe effects of these options on the United Kingdom’s shipbuildinglabor force and infrastructure.3
Specifically, the team considered whether the Type 45 should haveone or two producers; whether, if two producers were used, the workshould be open to competition or whether it should be allocated di-rectly to specific shipbuilders; and whether the Type 45 should beconstructed in its entirety in one shipyard or assembled from seg-ments or blocks produced in several shipyards. The analysis involveda quantitative comparison of the advantages and disadvantages ofhaving either one or two shipbuilding companies produce the Type45 over the next 15 years. The team also compared building the Type45 in its entirety in one shipyard versus assembling it from segmentsor blocks produced in various shipyards. The tool enabled the teamto address the production labor costs, the indirect costs, and the in-dustrial base implications of various acquisition strategies.
The RAND analysis aimed to help MOD policymakers in two ways:first, to gain an understanding of the costs and benefits of differentType 45 acquisition and production strategies, and, second, to gaugethe effect of those strategies both on the shipbuilding industrial baseand on the costs of other current and future MOD ship programs.The tool thus proved to be a valuable asset in terms of both expedit-ing the analysis itself and offering policymakers a comprehensiveand fully documented view of the effects and implications of a forcestructure change.
______________ 3See John Birkler et al., The Royal Navy’s New-Generation Type 45 Destroyer:Acquisition Options and Implications, RAND Corporation, MR-1486-MOD, 2002.


59
Appendix A
MICROSOFT ACCESS AND TOOL INSTALLATION
MICROSOFT ACCESS
The underlying engine for the Shipbuilding and Force StructureAnalysis Tool is Microsoft Access 2000. We chose Access over otherpossible platforms, such as Excel, for a number of reasons:
• MS Access has the functionality of a true database and is able tostore, manipulate, and aggregate data efficiently. Most of thework done by the tool is this type of data manipulation.
• Access can easily accommodate data changes and additions. Forexample, it is relatively easy to add a new ship class to the Accesstool simply by filling out a form. In the equivalent spreadsheetsolution, columns or rows would need to be added to severalpages and formulas copied and updated, making maintenanceexceedingly difficult. Spreadsheets are good for static models;databases are good for models in which data and scope mightchange or evolve over time.
• Because Access uses an interface similar to that of other commonMS Office products, such as Word and Excel, we hope there willbe less of a learning curve for a new user.
• Access is very “extensible,” meaning that it is relatively easy tocustomize by adding code. This customization is done usingVBA, which is an integral part of all MS Office products. Behindthe tool is a fair amount of VBA code that implements the coretool calculations.

60 The Shipbuilding and Force Structure Analysis Tool: A User’s Guide
Access differs from other MS Office products, such as Word and Ex-cel, in one very important respect. Because Access is a multiuserdatabase program, it updates changes to the source data file imme-diately (or nearly so). Thus, you never need to save a database file af-ter working with it to make changes permanent; the changes are al-ready saved. However, the downside of this feature is that it is nearlyimpossible to undo any changes or revert to an older version. Wecannot emphasize this point enough: You should always keep abackup copy of the database file (called a data set; see Chapter Two,“Stored Data and Data Sets”) or work from a copy when makingchanges. By always keeping an older copy, you can recreate or back-track to an earlier version.
A MS Access database has six basic objects:
• Tables store and organize data.
• Queries manipulate data from the tables and summarize them (ifdesired).
• Forms lay out fields to simplify data entry.
• Reports format queries into a more printable layout.
• Macros store user commands to automate and facilitate repeti-tive database actions.
• Modules are groups of VBA code that extend the functionality ofMS Access.1
All the objects of the database are accessible; we have hiddennothing. Therefore, it is possible to modify them should the needarise. With the possible exception of minor format changes to the re-ports, we strongly recommend that you do not modify any of the ex-isting objects unless you are very familiar with Access and VBA. Even
______________ 1These descriptions gloss over many of the important details and functionality of theobjects. Interested users should consult one of the many books on the subject of MSAccess. For example, for new users, Access 2000 for Dummies, John Kaufeld, IDG BooksWorldwide, 1999; for VBA and Access, Teach Yourself Microsoft Access 2000 Program-ming, Paul Kimmel, SAMS Publishing, 1999; and for advanced programming, MicrosoftAccess 2000 Power Programming, F. Scott Barker, SAMS Publishing, 1999.

Microsoft Access and Tool Installation 61
renaming an object can cause errors in various parts of the tool. Inmost cases, it would be best to make a copy of the object and thenmake changes or modifications to it.
Before using the tool, you should be alert to the fact that pastingrecords into a MS Access Table is a bit different than it is for pastingcells into a MS Excel spreadsheet. There is no simple way to copy asingle element and paste it across multiple records. From our per-spective, the easiest way to do this task is to create the data entries inMS Excel, where it is easy to copy and paste. Note that the columnsin the spreadsheet must match the fields in the table or form withinMS Access. After you have created a range in Excel that mimics thenew data you want to add to the Access table or form, use one of thefollowing two methods:
• To overwrite existing data: (1) copy the range from Excel; (2)highlight the fields to be replaced in the MS Access object; and(3) paste the changes into MS Access. Note that the biggest dif-ference is that you need to highlight the entire range, not just thefirst cell as you would in Excel.
• To add new data to the MS Access object: (1) copy the range fromExcel; (2) select the MS Access form or table; and (3) use thePaste_Append command from the Edit menu.
INSTALLING THE DATABASE FILES
The tool comes as two MS Access database files in a self-extractingzip file (.exe extension). The file names for the front and back ends onthe zip file are
• Front End: Shipbuilding 1.1a.mdb
• Back End: realdata4c.mdb
To install the files, double click on the icon. A menu should appearasking for a directory to unzip the files. Select any directory youwant. You will always open the front-end database from the directoryyou select.

62 The Shipbuilding and Force Structure Analysis Tool: A User’s Guide
MISSING OR INCORRECT REFERENCES IN VBA
Over time, Microsoft updates its programs and driver files. The cur-rent version of the tool is based on SR-1 for MS Access 2000 and MSJet 4.0 SP6. It is unlikely you will have this exact configuration; thus,you will need to reconfigure the VBA References for MS Access beforeyou are able to run the tool for the first time. MS Access does not up-date these driver references automatically. If problems with the VBAreferences exist, a warning pop-up window will indicate that thereare broken references. Below are the seven steps you should follow tocorrect the problem:
1. On the warning message, click the OK button.
2. Select the VBA window that is open.
3. Select the Tools—References… command. A window should openthat looks like Figure A.1. The figure shows a list of the sixreferences needed. If one is missing, the word “MISSING” shouldappear right after the check box. Make a note of the missingreferences. Uncheck the items that are missing and press the OKbutton.
4. Replace the references you removed. Note that you must close theReferences window opened in the prior step before proceeding.Now, reopen the References window by selecting the Tools—References… menu item again. From the list, select the item thatbest matches the missing component(s) you unchecked. Forexample, if you have an original version of Microsoft Access 2000without any service pack updates, you will likely need to make thefollowing substitutions:
• “Microsoft ADO Ext. 2.1 for DLL and Security” for “MicrosoftADO Ext. 2.5 for DLL and Security.”
• “Microsoft Jet and Replication Objects 2.1 Library” for“Microsoft Jet and Replication Objects 2.5 Library.”
Note the only difference is the version number of the two refer-ences; in the example above, you are selecting an earlier version.Select the OK button.
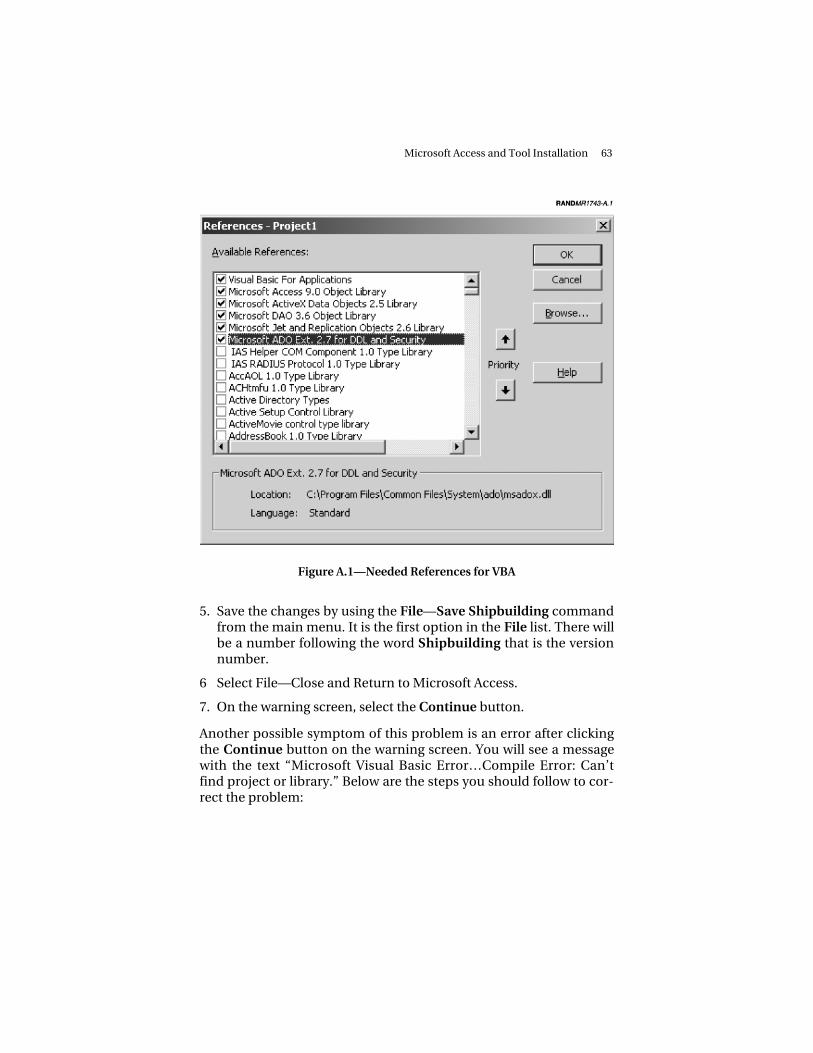
Microsoft Access and Tool Installation 63
Figure A.1—Needed References for VBA
5. Save the changes by using the File—Save Shipbuilding commandfrom the main menu. It is the first option in the File list. There willbe a number following the word Shipbuilding that is the versionnumber.
6 Select File—Close and Return to Microsoft Access.
7. On the warning screen, select the Continue button.
Another possible symptom of this problem is an error after clickingthe Continue button on the warning screen. You will see a messagewith the text “Microsoft Visual Basic Error…Compile Error: Can’tfind project or library.” Below are the steps you should follow to cor-rect the problem:

64 The Shipbuilding and Force Structure Analysis Tool: A User’s Guide
1. On the Error message, click OK.
2. Stop the program from running by selecting Run—Reset from themenu interface (the Reset option from the Run command).
3. Follow instructions above starting with #3.
INSTALLING OPTIMIZATION DLL ROUTINES
The Industrial Base Model determines effective labor loading at ashipyard using a linear programming approach. A Dynamic Link Li-brary (DLL), produced by Frontline Systems, Inc.,2 determines the LPsolution.3 Each user must have a license to use this library, availablefrom Frontline Systems, Inc. Your office may already have a user/sitelicense, however. The software vendor provides the library file and akey string. The manufacturer provides general instruction on how toinstall the library. To use the library with this tool, you need to com-plete two steps:
• Copy the DLL file into the Windows system directory (e.g.,C:\WINNT\system32 for a Windows NT computer).
• Enter the key string. (This step should not be necessary for thelatest version of the tool delivered to N81 because the key fieldshould already be entered.) The key string can be found in thefile Frontkey.bas, which is included on the distribution disk thatcomes from Frontline Systems. To enter the key into the tool,open the tool and go past the warning screen. Close the tool’smain menu. Open the Key module object with the VBA editor(double click on the object). Between the quotation marks afterthe equals sign, enter the license string provided by the vendor(see Figure A.2). Next, exit Access and restart the application. Ac-cess will prompt you to save the changes to the Key module. Re-spond with YES. Finally, restart the tool.
If you do not own a license for the DLL, you should leave the licensekey string field empty (do not put anything between the quotation
______________ 2See www.frontsys.com.3See “Solver User’s Guide” for Dynamic Link Library Version 3.5 by Frontline SystemsInc.
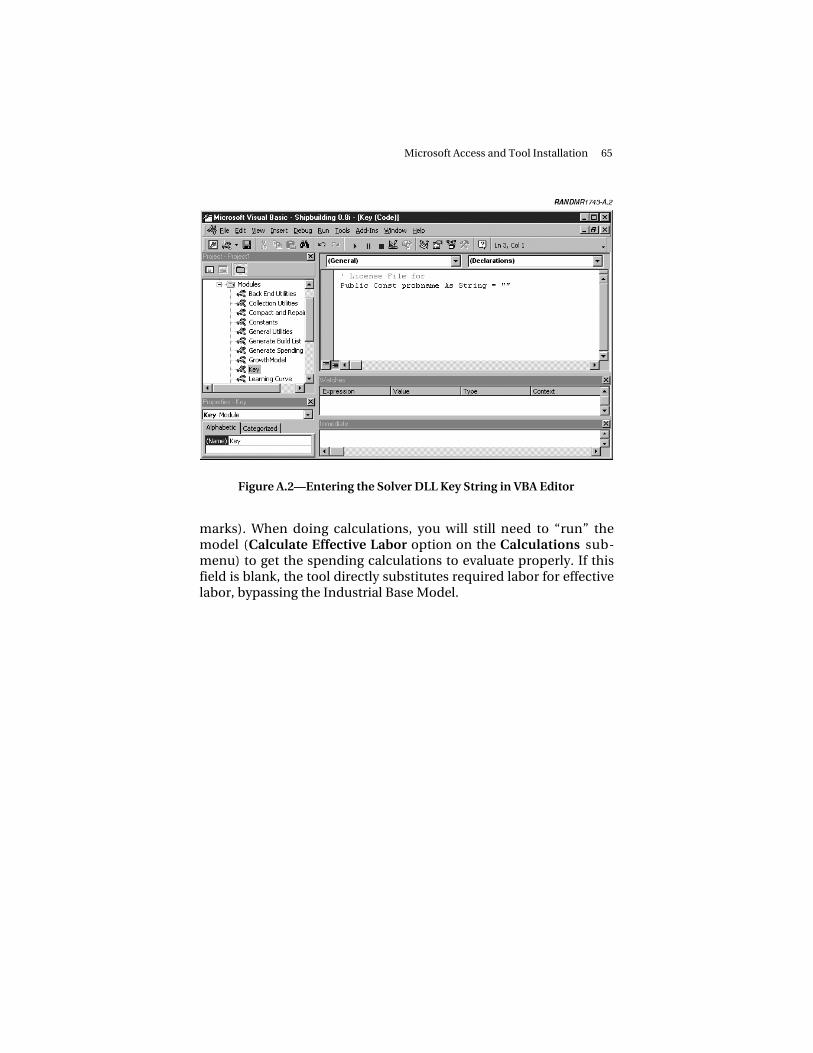
Microsoft Access and Tool Installation 65
Figure A.2—Entering the Solver DLL Key String in VBA Editor
marks). When doing calculations, you will still need to “run” themodel (Calculate Effective Labor option on the Calculations sub-menu) to get the spending calculations to evaluate properly. If thisfield is blank, the tool directly substitutes required labor for effectivelabor, bypassing the Industrial Base Model.


67
Appendix B
START-UP AND CREATING A DATA SET
OVERVIEW
In Appendices B–F, we will walk through each of the menus in thetool and describe how they are used. The order of the topics isroughly equivalent to the sequence used to analyze a data set.
Warning and Top-Level Menus
When the tool first starts, a warning screen, shown in Figure B.1, ap-pears first. The intent of the window is to inform the user of the sen-sitive nature of much of the data and output. A good deal of the inputdata is proprietary and/or business-sensitive. The same restrictionapplies to some of the reports and charts generated. In no wayshould the user release any of the information outside of the gov-ernment.
After the user presses the Continue button on the warning screen,the main menu should appear as shown below in Figure B.2. (If youget an error message at this stage, see Appendix A for instructions onhow to correct the problem.) As a general convention used for all themenus, any menu item ending with an ellipsis (…) indicates that themenu command opens another menu. The order of the top-levelmenu items should generally be the order you need to approach ananalysis:
1. Create or open a data set.
2. Edit or enter relevant data/assumptions for the data set.

68 The Shipbuilding and Force Structure Analysis Tool: A User’s Guide
Figure B.1—Warning Screen
3. Calculate the results.
4. View and print the summarized results.
5. Exit the program.
Manage Data Sets
We have split the tool into two parts: front-end and back-enddatabase files. This technique is designed to avoid the commonproblems associated with copying the entire database file each timeyou want to create a new data set. Copying is inefficient because itwould duplicate all the menus, reports, queries, etc., that do notchange from data set to data set. Splitting the database solves thisproblem by having the back-end file store all the data associated withthe data set and nothing else; it is an MS Access database file consist-ing only of tables. The front-end file then stores the user interface,code, queries, and reports; these objects do not change. The tables

Start-Up and Creating a Data Set 69
Figure B.2—Top-Level Menu
from the back end are then linked1 to the front-end database. An in-terface form allows the user to manipulate and link to different datasets.
Each data set contains all the data and information necessary toreplicate an analysis or calculation. To do a different analysis (or casestudy), you need to create a different data set. Alternatively, to mod-ify an existing study, you will need to link to that data set. To performeither of these tasks, you will need to open the “Manage Data Sets”form. Selecting the first button on the main menu opens the form.
Figure B.3 shows an image of the “Manage Data Sets” form.
______________ 1The term link arises from the concept of front-end and back-end databases. The datatables reside in a different file (back-end) but can still be manipulated in the currentone (front-end). The back end holds all the data set information and is linked to thefront end through file references. In the table object window, an arrow shows that ta-bles are linked rather than residing in the front end.

70 The Shipbuilding and Force Structure Analysis Tool: A User’s Guide
Figure B.3—Manage Data Sets Form
The first item on the form is a file box that allows you to select a dataset from a list of .mdb files in the current directory. If the file youwant is not in the list, click the Browse button. This action will open aMS Windows standard File Open window.
Figure B.4 shows a data set selected. However, you have not linked tothat data set yet. All you have done is select the file name. To com-plete the linking action, you must click the Link Data Set button. Ifthe linking action is successful, the main menu will display the new
Figure B.4—A Selected Data Set
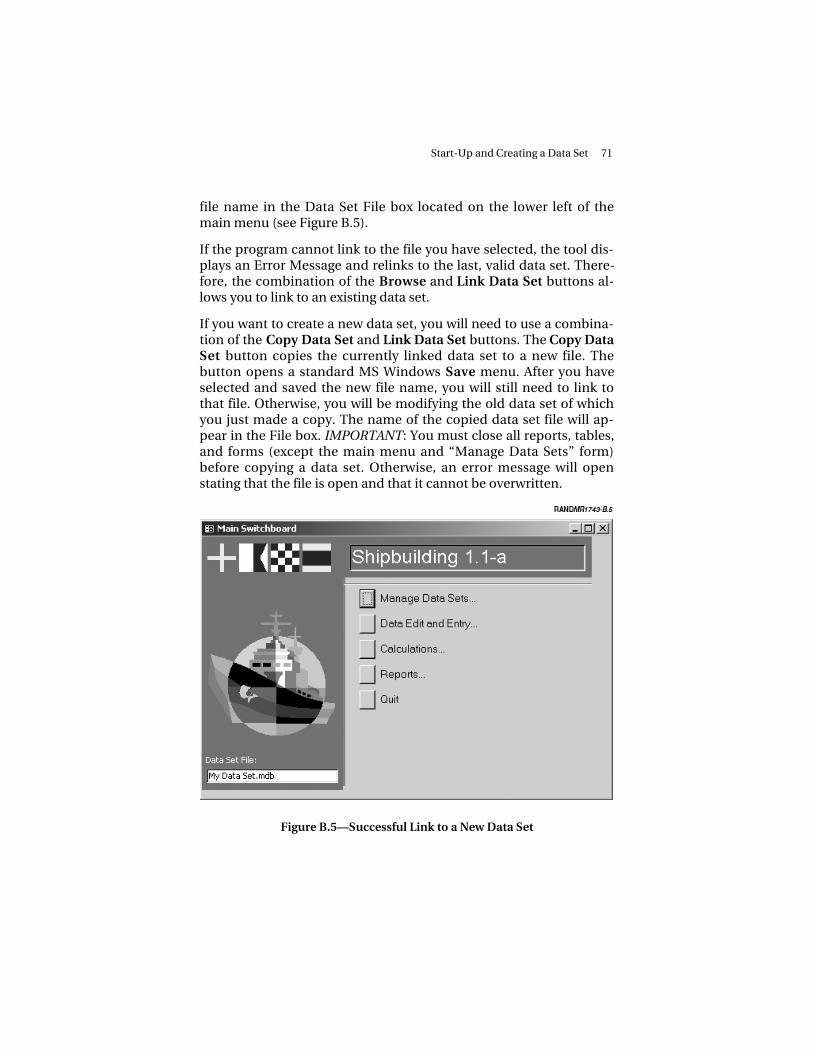
Start-Up and Creating a Data Set 71
file name in the Data Set File box located on the lower left of themain menu (see Figure B.5).
If the program cannot link to the file you have selected, the tool dis-plays an Error Message and relinks to the last, valid data set. There-fore, the combination of the Browse and Link Data Set buttons al-lows you to link to an existing data set.
If you want to create a new data set, you will need to use a combina-tion of the Copy Data Set and Link Data Set buttons. The Copy DataSet button copies the currently linked data set to a new file. Thebutton opens a standard MS Windows Save menu. After you haveselected and saved the new file name, you will still need to link tothat file. Otherwise, you will be modifying the old data set of whichyou just made a copy. The name of the copied data set file will ap-pear in the File box. IMPORTANT: You must close all reports, tables,and forms (except the main menu and “Manage Data Sets” form)before copying a data set. Otherwise, an error message will openstating that the file is open and that it cannot be overwritten.
Figure B.5—Successful Link to a New Data Set


73
Appendix C
DATA EDIT AND ENTRY
OVERVIEW
The Data Edit and Entry Menu selections allow you to display andedit data (see Figure C.1). The menu items and submenus under thisitem segregate the information by type (force structure, productionplans, etc.). Most of the commands bring up a form to manipulate
Figure C.1—Data Edit and Entry Menu

74 The Shipbuilding and Force Structure Analysis Tool: A User’s Guide
the data. Some of the form objects may have more than one activa-tion command. In other words, it may be possible to open the formfrom multiple locations of the submenus. This replication was doneto facilitate data manipulation of like information from the samebase menu.
The data or examples shown below do not necessarily represent ac-tual data. Proprietary information has been modified in the figures.
STATUS BAR
The status bar provides useful information for the analyst when en-tering data or performing a calculation. The status bar is the lowestpart of the Access window. During a calculation, the status bar showsa progress meter. When entering data into a table form, the statusbar shows a description of the selected field. In Figure C.2, the statusbar shows an expanded description of the “CFE Cost” field as“Contractor Furnished Equipment Cost.”
FORCE STRUCTURE
The Force Structure submenu allows you to change any of the dataregarding the current fleet, force level requirements, and ships cur-rently in production at the shipyards. All these items affect shipcounts and the Force Transition Model. The menu elements are
• Edit Active Fleet Information
• Edit Force Level Requirements
• Edit Ships in Production.
Edit Active Fleet Information
The Edit Active Fleet Information menu option opens a datasheetform to modify the data on the active fleet. An example of thedatasheet is shown in Figure C.3.
There are eight fields for each record. Each record is an active ship inthe fleet. (At the end of the explanation of each field throughout thisappendix, we include in parentheses the type of response required.)

Data Edit and Entry 75
Figure C.2—Example of Active Status Bar
1. Hull Number: The hull number for the ship as found on the NavalVessels Registry (NVR) website. For example, the hull number forthe USS Carl Vinson is CVN 70. (text)
2. Ship Class: Designates the class of ship for a particular hull. Selectthe value from a pull-down menu. (list selection)
3. Name: The name of the ship. (text)
4. UIC: The Unit Information Code for the hull. It is not used in anyof the calculations, so it is an optional field. (integer)
5. In Qtr: The calendar quarter during which the ship is delivered tothe Navy (the quarter it enters the fleet). This field has no effect in

76 The Shipbuilding and Force Structure Analysis Tool: A User’s Guide
Figure C.3—Edit Active Fleet Information Form
the model and can be left blank. (The field is for potential up-grades of the tool.) (list)
6. In Year: The year the ship is delivered to the Navy (the year it en-ters the fleet). (integer)
7. Out Qtr: The last calendar quarter the ship is active in the fleet.This field has no effect in the current version of the model and canbe left blank. (The field is for potential upgrades of the tool.) (list)
8. Out Year: The last year the ship is active in the fleet. If the field isleft blank (as it is for many of the hulls shown in the example), thenominal ship life is used to calculate the out year (found on the“Ship Class Data” form). You only need to enter a value in thisfield if the planned ship life is longer or shorter than typical forships of the class. Such a case might be the early retirement of ahull (integer) or a core life that is shorter than expected.

Data Edit and Entry 77
Edit Force Level Requirements
This datasheet (Figure C.4) contains the force level requirements foreach class by year. Each record (row) specifies the minimum numberof hulls required for a given class for a given year. The datasheet is akey input to the Force Structure Method of the Force TransitionModel. It is not necessary to enter a requirement for every ship classand every year of the analysis. Not entering any requirements for aship class will mean that there will be no new construction for thatclass and that the existing hulls of that class will be retired when theyreach the end of their nominal life.
Figure C.4—Force Level Requirements

78 The Shipbuilding and Force Structure Analysis Tool: A User’s Guide
The fields for each record on the form are
1. Ship Class: Select from a pull-down menu. (list selection)
2. Year: The year for the requirement. (integer)
3. Min #: The minimum number of hulls required for the class forthat year. For example, the first entry shows that there will be oneactive ADC (X) by 2004. Notice that by 2006, the requirement hasrisen to a minimum of six hulls. (integer)
Edit Ships in Production
The Edit Ships in Production option opens a data entry form (FigureC.5) that allows the analyst to edit data for the ships already underconstruction.
Figure C.5—Ships in Production Data Entry Form

Data Edit and Entry 79
The form fields are
1. Hull Number: The hull number for the ship as found on the NVRwebsite. For example, the hull number for the USS Preble is DDG88. (text)
2. Ship Class: Designates the class of ship for a particular hull. Selectthe value from a pull-down menu. (list selection)
3. Name: The name of the ship. (text)
4. UIC: The Unit Information Code for the hull. Since the tool doesnot use these data in any of the calculations, it is an optional field.(integer)
5. Start Qtr: The calendar quarter that the construction began. (listselection)
6. Start Year: The year that the construction began. (integer)
7. End Qtr: The last calendar quarter of construction. (list selection)
8. End Year: The last year of construction (the year construction wascompleted). (integer)
9. Shipyards Doing Work Subform: Lists all the projects that com-prise the ship construction. The fields on this subform are
a. Shipyard: The shipyard doing the project work. Select a valuefrom a pull-down list. (list selection)
b. Role: The nature of the work the shipyard is performing for theconstruction of the hull. For the example shown, Ingalls is thePrime builder of the ship. (list selection)
EDIT PRODUCTION PLANS
This submenu brings up forms that manipulate all the productiondata, both planned and ongoing, at the shipyards.
Edit Acquisition Plan
The Edit Acquisition Plan command opens a datasheet view of atable so that you can modify the existing acquisition plan. Figure C.6shows an example of the form. Each row represents a different ship

80 The Shipbuilding and Force Structure Analysis Tool: A User’s Guide
Figure C.6—Example Acquisition Plan
class. Classes can be added or subtracted as typical records in Access.The subsequent fields (column headings) denote the year of acquisi-tion.
The form fields are
1. Ship Class: Designates the class of ship for a particular hull. Selectthe value from a pull-down menu. (list selection)
2. Number Acquired: The number of ships of the particular class ac-quired for a given year (starting year for construction). In the fig-ure example, one LPD-17 is acquired in 2002. Note that the valuesof the years and their number (column headings) may vary basedon the user-defined scenario. In the example below, the range ofyears runs from 2001 past 2014 (the list actually goes to 2021 butcannot fit in one window). The year values are modified with thenext command, Modify Acquisition Table. (integer)
The Force Structure Model uses the Acquisition Plan to generate thenew production plan if the analyst selects the Acquisition Planmethod of calculation. This table is not used if the method is basedon the force structure.
Modify Acquisition Table Format
This menu option opens a pop-up form to modify the acquisitiontable, which we described previously. The form allows the analyst to

Data Edit and Entry 81
delete the first year in the table, to add a new year to the end, or tototally restructure the table with defined starting and end years(Figure C.7).
The first button deletes the first year column of the table but pre-serves the rest of the data. For the example Acquisition Plan, thecolumn for the year 2001 would be removed. Similarly, the secondbutton adds an additional year to the end of the table. For theAcquisition Plan example in Figure C.6, the last year in the table is2021. So a new column would be added to the end of the table for2022. The last button completely rebuilds the table based on the“Start Year” and “End Year” fields at the bottom of the table. Notethat all data in the table are erased when the table is rebuilt.
Edit New Ship Construction
The Edit New Ship Construction menu option opens a form (seeFigure C.8) to edit the new ship construction plan calculated by the
Figure C.7—Modify Acquisition Table Format

82 The Shipbuilding and Force Structure Analysis Tool: A User’s Guide
Figure C.8—Edit New Production Plan
Force Transition Model. In general, you should rarely have to editthis list. In fact, changing date fields may alter the actual forcestructure, giving results that are inconsistent with the required forcestructure or acquisition plan. Further, the record IDs (Build # andProject # fields) are not automatically generated. The analyst willneed to enter these fields manually. The analyst will know how tomake these modifications by understanding how key fields work in arelational database. The only fields that you can change withoutcausing significant errors are the Start Year, Shipyard, andContractor Role fields. The form’s fields are

Data Edit and Entry 83
1. Build #: A key index for the ship construction. It uniquely identi-fies the hull. (integer)
2. Ship Class: Designates the class of ship for a particular hull. Selectthe value from a pull-down menu. (list selection)
3. Start Qtr: The calendar quarter construction began. (list selection)
4. Start Year: The year that the construction began. (integer)
5. End Qtr: The last calendar quarter of construction. (list selection)
6. End Year: The last year of construction. (integer)
7. Shipyards Doing Work Subform: Lists all the projects that make upthe new ship construction. The fields on this subform are
a. Shipyard: The shipyard doing the project work. Select from apull-down list. (list selection)
b. Role: The nature of the work the shipyard is performing for theconstruction of the hull. For the example shown, Bath IronWorks is the Prime builder of the ship. (list selection)
c. Project # : The key index uniquely identifying the project fornew construction. (integer)
Edit Ships in Production
This option opens the “Ships in Production” form shown in FigureC.5.
Edit Other Work List
This menu item (see Figure C.9) opens a datasheet to edit work at theshipyard that does not result in a new or additional active ship for theNavy, such as ship availabilities (the assignment of a Navy ship tomaintenance or repair work), commercial work, and sustaining workdone at private shipyards. (See Chapter Two for more detail on thedifference between other work and new ship construction.) Thefields on the form are

84 The Shipbuilding and Force Structure Analysis Tool: A User’s Guide
Figure C.9—Edit Other Work List
1. Build ID: An automatically generated field that serves as the keyindex for the table. You should not edit this field. (auto number)
2. Work Type: The values for this field are brief descriptions of thetype of work done (e.g., RCOH, Post-Shakedown Availability [PSA],commercial tanker) and is selected from a pull-down list. The listis generated from the items entered in the “Edit Other Work Data”form. The analyst can only select, not create, items from this list.(list selection)
3. Shipyard: The shipyard doing the project work. Select the valuefrom a pull-down menu. (list selection)
4. StartQtr: The calendar quarter the work began. (list selection)
5. Start Year: The year that the work began. (integer)
6. EndQtr: The calendar quarter the work ends. (list selection)
7. End Year: The last year for the work. (integer)
8. Ship Class: Designates the class of ship associated with work. Se-lect the value from a pull-down menu. This field is optional and

Data Edit and Entry 85
should be selected for availabilities so that the item costs can beallocated to one of the budget accounts (acquisition or O&S). Thefield is grayed out if “None” is selected for the Account field. (listselection)
9. Account: Describes the budget account (SCN, OMN, MPN, orNone) in which the costs are placed. For example, labor costs forcarrier RCOHs are generally placed in the Acquisition account.Other availabilities (depot repair work) are placed in the OMN ac-count. The value of “None” is for work that will not be included inthe funding calculations but will be part of the overall industrialbase calculations. (list selection)
SHIP CLASS DATA FORMS
The same form is used to add a new ship class or to edit ship classdata. This form is the most complex in the tool. Most of the data usedby the tool are organized by ship class.
Add a New Ship Class
This form is identical to the “Edit Ship Class” form described belowexcept that all the fields are initially blank.
Edit Ship Class Data
This form allows the analyst to edit any of the data associated with aship class. Because there are so many data to manage, the form has anumber of subforms that are accessed through menu tabs. There aresix submenus:
1. Allocation Order: Allows the analyst to specify how new ships areallocated to the shipyards.
2. Learning Data: Allows the analyst to specify the cost improve-ment/learning data.
3. Material & Equipment Costs: The submenu for editing Materialand Equipment Cost.

86 The Shipbuilding and Force Structure Analysis Tool: A User’s Guide
4. O&S Costs: The submenu for editing Operating and SupportCosts.
5. Labor: The submenu for editing production labor for one hull(both total hours and profile).
6. Funding Profile: The submenu for editing how the total cost isspread over different fiscal years.
Figure C.10 shows the form as it appears when opened. The first tab,Allocation Order, is selected by default. We first describe the fields forthe top-level form, then describe the fields for each of the subformsin turn.
Figure C.10—Edit Ship Class Data Form
Data Edit and Entry 87
Top-Level Form
The top level of the form (the top half of the form, which does notchange when a tab is selected) holds the generic information for theclass.
1. Class Name: The hull symbol for the class. Figure C.10 shows datafor the DDG 51 class. (text)
2. Type of Ship: Describes the ship type in a more generic way than ahull symbol. The “Type of Ship” field is the ship’s hull type. AsFigure C.10 shows, the hull type for the DDG 51 is a “Guided Mis-sile Destroyer.” The choices for the field are given in a pull-downlist. This field cannot be left blank/empty. (list selection)
3. Ship Life: The notional life of the ship in whole years (rounded-up). It is the number of years that a typical hull stays active in thefleet. The DDG 51’s life is 40 years, as shown in Figure C.10. The“Ship Life” field is used to determine the number of active hullsfor a class as a function of time. For this example, all DDG 51s willbe active for 40 years and then retired. This generic ship life can beoverridden for a single hull by entering a specific year in the “OutYear” field from the “Edit Active Fleet Information” form. (integer)
4. Build Time: The number of quarters (whole number, rounded-up)it takes to build a typical hull. Note that this value determines thedefault building time for new hulls. It does not need to match thenumber of entries for each labor profile (see the “Labor” sub-form). If the number of entries does not match the build timevalue, the Industrial Base Model rescales the labor profile. Theanalyst must exercise care, however, because drastic rescalingmay distort the profile shape. The “Build Time” field can be blank(null) if there will be no additional ships of the class constructed(i.e., no future requirements beyond those vessels already activeor in production). (integer)
5. Teamed: A check box denoting whether construction is part of ateaming arrangement by multiple yards; that is, more than oneshipyard participates in the production of each hull. The VirginiaClass (SSN 774) attack submarine is an example in which twoshipyards construct each hull. (yes/no)

88 The Shipbuilding and Force Structure Analysis Tool: A User’s Guide
6. Exclude: A check box allowing you to exclude a class from any ofthe cost calculations. The element is still included in the labor cal-culations, however. (yes/no)
7. New Class: Denotes a new class in which no prior hulls exist or arein production; i.e., the first of a class does not exist. Checking thisbox indicates that the Force Transition Model should add aDesign project to the first hull built. Refer to Chapter Three for ageneral discussion of first-of-a-class and follow-on hulls. (yes/no)
8. Design Offset: Only active when the new-class box is checked. Thefield holds the number of quarters that the nonrecurring workbegins prior to the start of the recurring construction for the firstof a class. It is the number of years that the Design labor is offsetfrom the start of construction. For example, it takes six years tobuild a vessel. However, for the first hull in the class, it takes eightyears to build the vessel because of the additional design and de-velopment effort. The Design Offset value for this case is the dif-ference between the two build durations: (8 – 6) × 4 = 8 quarters.(integer)
Allocation Order Subform
The first tab on the “Edit Ship Class” form is the “Allocation Order”subform. This subform is also shown in Figure C.10. The subformlists each of the shipyards that can build the ship class in the se-quence that new ships are allocated to each of the shipyards. In theexample, both Bath Iron Works and Ingalls can build the DDG 51class. The order that the shipyards are listed is very important. Theorder on the subform is the order that the Force Transition Modelassigns additional construction work to each of the shipyards. Forthe example shown, Bath Iron Works would build the next requiredhull and Ingalls would build the second. The tool restarts from thebeginning of the list when it reaches the end. For the example, con-struction of the DDG 51 class would alternate between Bath IronWorks and Ingalls.1 A shipyard can appear multiple times on the listso that complex sequences may be used. The one field on this form is
______________ 1It is important to note that this sequence begins from the first hull added to the newproduction list. This hull may not be the very first hull of the class. To make certainthat the two shipbuilders always alternate production, you must determine the ship-

Data Edit and Entry 89
1. Shipyard: The name of the shipyard that is allowed to build theclass. Select the value from a pull-down list. (list selection)
Learning Data
The “Learning Data” subform is the second tab on the form, asshown in Figure C.11. The five fields on this subform are
1. Shipyard: The name of the shipyard that is allowed to build theclass. The value is selected from a pull-down list. (list selection)
Figure C.11—Learning Data Subform
______________________________________________________________ yard building the last ship of the class from the Ships In Progress list (see the “EditOther Work List” section). Then you can sequence the yards appropriately.
90 The Shipbuilding and Force Structure Analysis Tool: A User’s Guide
2. Labor Type: The type of labor (labor, engineering, etc.) for the re-quirement. (list selection)
3. Slope: The unit learning curve slope in a decimal format. Learn-ing/cost improvement curves describe the phenomenon that re-curring unit labor tends to decrease with more production experi-ence. A slope of 1.0 means that there is no decrease in recurringlabor. A value of 0.95 means that the recurring labor falls by 5 per-cent every time the cumulative production quantity doubles.Historically, ship production slopes have been very flat (i.e.,slopes close to 1.0). The general format of the unit the learningcurve is
L L ii
slope
= 12*
ln( )
ln( )
where
Li = total labor for unit i
L1 = total labor for the first hull (unit #1)
ln(slope) = natural log of the learning curve slope in decimal form
ln(2) = natural log of 2.0
i = unit number (e.g., the second hull produced would be two).
4. Cum. Prod.: The Cumulative Production field holds the values forthe prior/cumulative production to date. The field determineswhich unit number (“i” in the formula) is produced next. If thevalue is 0, there is no prior production. If the values is 1 or greater,the next unit in production will be that value plus 1. (integer)
5. Max. Prod.: The Maximum Production field denotes the maxi-mum annual production rate for a given class at a specific ship-yard. This value is only checked for the Notes section of the fund-ing summary reports. It does not alter the calculations. (integer)
Material & Equipment Costs Subform
The “Material & Equipment (M&E) Costs” subform holds all the costassociated with material and equipment costs for new acquisitions.The subform is shown on Figure C.12.

Data Edit and Entry 91
Figure C.12—Material and Equipment Subform
The subform has five fields:
1. Shipyard: The shipyard doing the project work. Each shipyard thatis capable of building a hull must have its own M&E cost record.Select the value from a pull-down list. (list selection)
2. GFE Cost: The cost for the government-furnished equipment. It isthe total price to the government, including any fees, in dollars.(currency)
3. CFE Cost: The cost for the contractor-furnished equipment. It isthe total price to the government, including any fees, in dollars.(currency)

92 The Shipbuilding and Force Structure Analysis Tool: A User’s Guide
4. Material: The cost for any material used that is not part of either ofthe equipment costs. It is the total price to the government, in-cluding any fees, in dollars. (currency)
5. Base Year: The base year for costs on the record. For example, ifthe costs were reported in 1999 constant dollars, the base yearwould be 1999. Similarly, if the M&E costs were based on actualacquisition costs from 1995, the base year would be 1995. (list se-lection) Note: If actual costs for any of the above items are fromdifferent FYs, the costs will have to be changed to a common FYbefore entry into the model.
O&S Costs Subform
Figure C.13 shows the subform when the “O&S Costs” tab is selected.This subform has the fields for the operating and support cost data.The O&S costs are a list of
• operation and maintenance expenditures by the age of the hull(OMN)
• annual military personnel costs (MPN).
The example in Figure C.13 shows the OMN costs for the first nineyears (periods). The values shown are made up and do not representactual values. For each year that a hull can be active, a correspondingrecord needs to be added to this subform. If a ship life is 40 years,then 40 records need to be added to the OMN table. The annualpersonnel costs for the DDG 51, as shown by Figure C.13, are$1,234,567 per year.
The four fields on the subform are
1. Period: The hull’s age in years as of the end of the period. Thevalue of 5 is the record for the ship class when the hull is five yearsold. The numbers should sequentially run from 1 to the maximumlife of the class. You cannot repeat entries. In other words, therecannot be two values for the same age of the ship. (integer)
2. O&S Cost: Contains the dollar value of the operations, mainte-nance, and support costs for the hull at that particular age. It in-
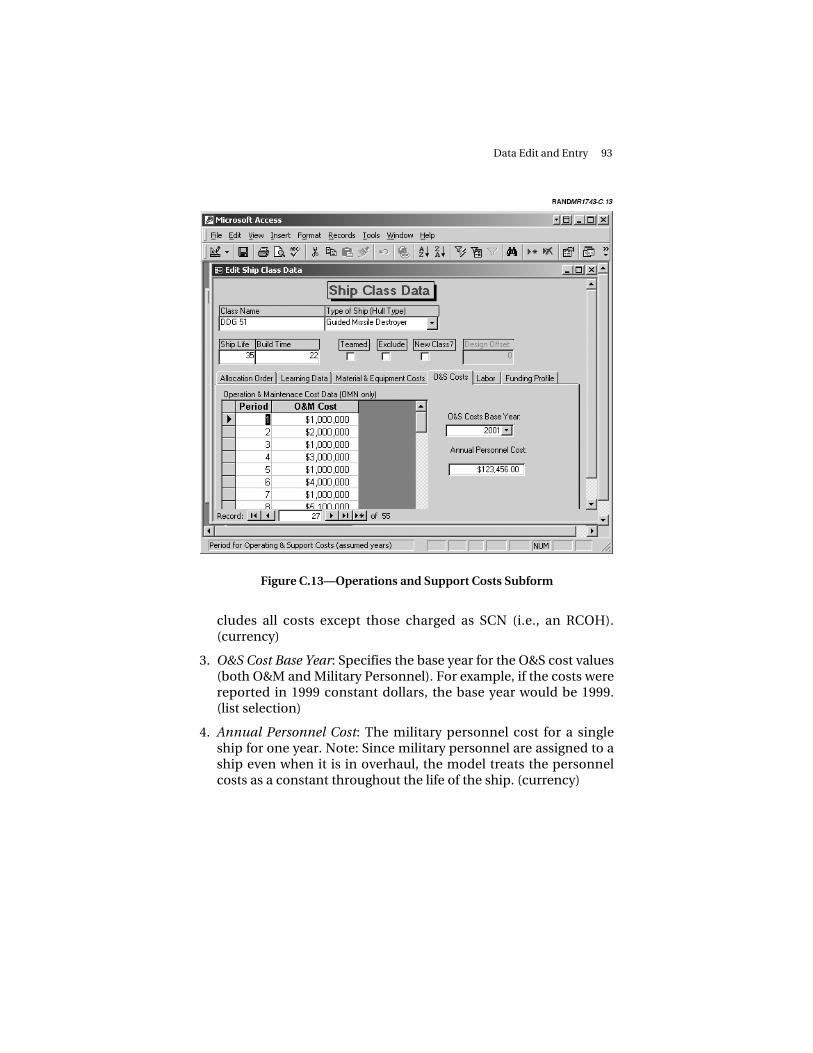
Data Edit and Entry 93
Figure C.13—Operations and Support Costs Subform
cludes all costs except those charged as SCN (i.e., an RCOH).(currency)
3. O&S Cost Base Year: Specifies the base year for the O&S cost values(both O&M and Military Personnel). For example, if the costs werereported in 1999 constant dollars, the base year would be 1999.(list selection)
4. Annual Personnel Cost: The military personnel cost for a singleship for one year. Note: Since military personnel are assigned to aship even when it is in overhaul, the model treats the personnelcosts as a constant throughout the life of the ship. (currency)

94 The Shipbuilding and Force Structure Analysis Tool: A User’s Guide
Labor Subform
The fifth tab on the “Edit Ship Class Data” form is the “Labor” sub-form. This subform contains the labor data that each shipyard re-quires to build the vessel. As described earlier, workload is describedby (1) total number of hours and (2) labor profile. Figure C.14 showsthe labor information for the DDG 51 class. There is one entry pershipyard per role per labor type. So if there are two shipyards withone role and one labor type, there should be two entries on the table.This situation is exactly the case for the DDG 51. Although the laborprofile and the total hours are identical for both shipyards on FigureC.14, neither is a necessary assumption for the tool. You could use a
Figure C.14—Labor Subform

Data Edit and Entry 95
different number of hours, a different profile, or both for each ship-yard.
If there are multiple labor types, an entry would be needed for eachtype. So if labor was differentiated between production and en-gineering for the DDG 51 case, each shipyard would have two entrieson the subform.
The subform has five fields:
1. Shipyard: The shipyard doing the project work. The value is se-lected from a pull-down list. (list selection)
2. Role: The contractor’s role. (list selection)
3. Labor Type: The type of labor (e.g., engineering, labor, and sup-port) for the requirement. (list selection)
4. Profile Name: The shape of the labor profile. (list selection)
5. kHours: The summation of the required number of hours for allquarters divided by 1,000. It corresponds to the total number ofhours in thousands. The value is for the first hull for a given role(unit #1 or the T1 value). The tool calculates the subsequent hullvalues using the learning curve slope and prior cumulative pro-duction entered on the “Learning Data” tab. (number). Note: Thevalues shown in Figure C.14 are made up and do not representactual values.
Funding Profile Subform
The last tab on the “Edit Ship Class Data” form is the “Funding Pro-file” subform. The data on this subform describe how the total cost ofthe ship is spread over multiple budget years. For example, some ofthe costs for a ship may be incurred before the production workstarts. Typically, these advanced costs are for long-lead-time items.In other cases in which the total cost is very large (e.g., an aircraftcarrier), the costs may be spread over a few fiscal years. Thisspreading is typically done to minimize large spikes in the budgetand to purchase long-lead-time items.
To describe how the total cost is spread over different fiscal years, theuser enters a profile on this subform as the fraction of total cost rela-

96 The Shipbuilding and Force Structure Analysis Tool: A User’s Guide
tive to the production start. An example of the subform is shown inFigure C.15. For the data shown, the total estimated cost is requiredin full in the same fiscal year the production starts. If a quarter of thetotal cost were required one year prior to the build start and the restat the start, the profile would have two entries: one entry at minusone year prior to the start with a % total of 25 percent and anotherentry at zero with a % total of 75 percent. The subform has two fields:
1. Years Relative to Build Start: Designates the fiscal year relative tothe start of the build. Negative numbers indicate fiscal years be-fore the start and positive ones after the start. (integer)
Figure C.15—Funding Profile Subform

Data Edit and Entry 97
2. % Total: The percentage of the total cost required for a specificyear relative to the build start. (percentage)
Edit Force Level Requirements
This menu action, which opens the form that allows you to edit forcestructure requirements, was described earlier.
Edit Hull Types
This menu action opens a form to edit hull types and is shown inFigure C.16. The form has two fields:
Figure C.16—Edit Hull Types

98 The Shipbuilding and Force Structure Analysis Tool: A User’s Guide
1. Ship Hull Type: Describes the ship type in a more generic waythan a hull symbol. This field is described more in Appendix G(“Ship Roles, Hull Types, and Classes”). (text)
2. Ship Role: High-level categorization of the ship’s role in the fleet(e.g., aircraft carrier, amphibious, surface combatant). (list selec-tion)
Edit Ship Roles
This form has only one field (see Figure C.17):
1. Ship Role: High-level categorization of the ship’s role in the fleet(e.g., aircraft carrier, amphibious, surface combatant). (text)
Figure C.17—Edit Ship Roles

Data Edit and Entry 99
EDIT SHIPYARD DATA
Each of the private shipyards has data corresponding to its wagerates, labor pool, and burden rates. The menu item Edit ShipyardData opens a form to edit this information.
Labor Data Subform
The first tab on the form shows the labor data for the yard compris-ing the wage rate and labor pool data. This tab is active in FigureC.18. There are nine fields to this subform:
1. Labor Type: The type of labor (e.g., engineering, labor, and sup-port) for the labor data. (list selection)
Figure C.18—Shipyard Labor Data
100 The Shipbuilding and Force Structure Analysis Tool: A User’s Guide
2. Wage Rate: The direct, average hourly wage rate for workers atthe yard.2 (currency)
3. Standard Hours per Year: The number of hours per year that anaverage worker is employed. This value is the same as thenumber of hours per FTE (normally 1,860 hours per year. SeeChapter Three, footnote 1). It does not include overtime, whichis figured in the following field. (integer)
4. Overtime Premium: If the workforce is not 100 percent efficient,additional labor must be used to complete a given task. Theproductivity model assumes that the additional work is donethrough overtime. This field allows the analyst to set the over-time pay rate relative to the wage rate. A value of 150 percentmeans that workers are paid 1.5 × their normal rate for overtimework. (percentage)
5. Attrition Rate: The percentage that the labor base at the yardwould shrink if there were no new hires and no reductions in theworkforce (quarter to quarter). The field is the overall attritionrate used for the effective labor calculations (whereas produc-tivity splits attrition rate by experience level). The analyst shoulduse an average value or the value for the most experiencedworkers. (percentage)
6. Hiring Rate: The hiring rate is the maximum rate allowable inany given quarter relative to the current level. (percentage)
7. Termination Rate: This field is the maximum rate by which theshipyard can reduce its labor force every quarter. A value of 50percent implies that the most the yard can reduce the labor poolis to cut it in half in one calendar quarter. (percentage)
8. Hiring Cost: The one-time cost for a new hire. It could be fortraining costs, recruiting costs and/or recruiting bonuses.(currency)
9. Termination Cost (not shown): The one-time cost when a workeris terminated. It could be for severance pay, accrued leave, out-placement and/or unemployment fees. (currency)
______________ 2Note that in previous versions of the model, an annual wage rate was used. Thechange was made to remove ambiguity.

Data Edit and Entry 101
10. Base Year (not shown): This is the base year for costs on therecord. For example, if the costs were reported in 1999 constantdollars, the base year would be 1999. Similarly, if the M&E costswere based on actual acquisition costs from 1995, the base yearwould be 1995. (list selection)
Burden Rates Subform
The burden rate is the combined rate for overhead for direct laborhours, G&A costs, and profit/fee. In other words, it encompasses allthe indirect costs. The burden rate times the direct labor hourly rateyield the total hourly cost (“wrap rate”). This rate will be a function ofthe overall workload at the site. Being able to assess the change in theburden rate compared with the change in work hours is important indetermining the impact of adding or reducing these hours to allprograms at that shipyard. The function for the burden rate is
Burden Rate = (burden slope)/(total direct work at site in FTEs)
+ burden base
The “Burden Data” subform (see Figure C.19) shows the two parame-ters (slope and base). If you do not know the slope or want to assumethe burden rate is independent of total work done at the site, you canenter 0 percent for the slope and the fixed rate in the Base field. Thefigure shows an example in which the burden rate for Newport Newsis fixed to 173 percent. The five fields are
1. Burden Slope: The slope for the burden rate (see the above equa-tion). The slope is the result of a regression of the burden rate onthe reciprocal of the total direct work (specified in FTEs). It is theslope from the regression. (percentage)
2. Burden Base: The base, or the result of a regression of the burdenrate on the reciprocal of the total direct work (specified in FTEs). Itis the constant from the regression. (percentage)
3. Burden Minimum: This field sets the lower limit for the burdenrate. An empty field means there is no minimum value. (per-centage)

102 The Shipbuilding and Force Structure Analysis Tool: A User’s Guide
Figure C.19—Shipyard Burden Rates
4. Burden Maximum: This field limits the maximum value for theburden rate. An empty field means there is no maximum value.(percentage)
5. Effective Year: The first fiscal year that the burden rate parameters(slope and base) are effective. For each quarterly overhead calcu-lation, the tool selects the corresponding parameters with thehighest value for the Effective Year such that the fiscal year isgreater than or equal to the Effective Year. (integer)
Productivity Subform
Data for the productivity calculations are entered on the third tab ofthe “Shipyard Data” form shown in Figure C.20.
For every labor type (trade), you need to enter the productivity ofworkers with differing experience levels. Each level represents one

Data Edit and Entry 103
Figure C.20—Productivity Data
quarter of experience and increases with the level. Thus a Level 1worker is a new worker with no experience; a Level 2 worker has onequarter of experience; and so on. If it takes three years to becomefully proficient, there would be a total of 12 levels. Any experiencebeyond the last level does not result in greater proficiency. FigureC.20 shows an example in which the first seven levels begin withinexperienced workers at a 67 percent proficiency relative to a fullyproficient worker (Level 12 is 100 percent, which is not shown). Thesubform has five fields:
1. Labor Type: The type of labor (e.g., engineering, labor, and sup-port) for the labor data. (list selection)
2. Level: The level of experience for the worker. The lowest level isalways 1 and the highest is the level at which the worker becomes100 percent proficient. Levels are in experience steps by calendar

104 The Shipbuilding and Force Structure Analysis Tool: A User’s Guide
quarter. If it takes four years to become fully proficient, the lastlevel would be 16. (integer)
3. Productivity: The productivity for workers of a given level relativeto 100 percent. A worker with 50 percent productivity would ac-complish a similar task in twice the time as a fully proficient one.(percentage)
4. Availability: The fraction of new hires in the labor pool at a par-ticular experience level. This field allows the analyst to specify theexperience distribution as described in Chapter Three, “Pro-ductivity.” For example, if all new hires had no prior experience,the value for level 1 would be 100% and all other levels 0%. Asshown in the figure, all levels have the same availability (8.3%).(percentage)
5. Attrition: This field is the attrition rate for workers of that level. Itrepresents the number of workers lost per quarter. (percentage)
EDIT OTHER WORK DATA
As with new ship construction, the “Other Work” at each of the ship-yards requires information on material and labor cost. On the mainform, there is one field:
1. Type Name: A short description or title for the “Other Work” Item.In the example in Figure C.21, the name is RCOH (1). (text field)
Material & Equipment Cost Subform
This subform is identical to the one used for ship class data. The dataon this form are the material and equipment costs for the work item.If the government does not pay for the work, these fields can be leftblank. An example might be private commercial work at one of theshipyards. It is not necessary to enter material costs for such items.This subform has five fields:
1. Shipyard: The shipyard doing the project work. Each shipyard thatis capable of building a hull must have its own M&E cost record.Select the value from a pull-down list. (list selection)

Data Edit and Entry 105
Figure C.21—Other Work Material and Equipment Subform
2. GFE Cost: The cost for the government-furnished equipment. It isthe total price to the government, including any fees, in dollars.(currency)
3. CFE Cost: The cost for the contractor-furnished equipment. It isthe total price to the government, including any fees, in dollars.(currency)
4. Material: The cost for any material used that is not part of either ofthe equipment costs. It is the total price to the government, in-cluding any fees, in dollars. (currency)
5. Base Year: The base year for costs on the record. For example, ifthe costs were reported in 1999 constant dollars, the base yearwould be 1999. Similarly, if the M&E costs were based on actualacquisition costs from 1995, the base year would be 1995. Note: Ifactual costs for any of the above items are from different FYs, thecosts will have to be changed to a common FY before entry intothe model. (list selection)

106 The Shipbuilding and Force Structure Analysis Tool: A User’s Guide
Labor Subform
Again, this subform is similar to the “Labor” subform used for theship class data. The only exceptions are that there is neither a learn-ing curve nor a contractor role associated with this work. The fourfields on the form (shown in Figure C.22) are
1. Shipyard: The shipyard doing the project work. The value is se-lected from a pull-down list. (list selection)
2. Labor Type: The type of labor (e.g., engineering, labor, and sup-port) for the requirement. (list selection)
3. Profile Name: The shape of the labor profile. (list selection)
4. kHours: The summation of the required number of hours for allquarters divided by 1,000. It corresponds to the total number ofhours in thousands. (number). Note: The values shown in FigureC.22 is made up and does not represent the actual value.
Figure C.22—Other Work Labor Data Subform

Data Edit and Entry 107
EDIT LABOR PROFILES
This menu option allows you to edit and view the labor profiles thatdescribe the shape of the workload for an activity. The top field onthe form is
1. Profile Name: A string describing the profile. In the example ofFigure C.23, the profile name corresponds to a ship class and role.However, we could have chosen a more general name, such as“Generic Profile A,” and used this profile with many activities.(text)
The subform lists the labor profile. The number of records for eachprofile will generally correspond to the build time for that activity. InFigure C.23, the “Generic Profile A” profile has multiple entries.
Figure C.23—Edit Labor Profile

108 The Shipbuilding and Force Structure Analysis Tool: A User’s Guide
There are a total of 22 entries (only eleven are shown in the figure),because it takes 22 quarters, or 5 1/2 years, to build the ship. The twofields on the table are
1. Period: The sequential quarter for the labor demand. For example,a period value of 12 corresponds to the last quarter of the thirdyear for the construction. (integer)
2. Fraction: The percentage of the total work needed for that quarter.For example, the Fraction value would be 2 percent for a period ifthe number of hours worked that period were 200 out of a total of10,000 for the entire task. (percentage)
To the right of the subform is a graph of the profile.
EDIT DATA SOURCES AND INFLATION INDICES
This next menu option groups two somewhat unrelated items: defla-tors and data source documentation.
Edit Inflation Indices
The first item on this submenu, Edit Inflation Indices, allows you toadjust costs to a constant dollar basis. This form has five fields(shown in Figure C.24):
1. Year: The year for the index value. (integer)
2. O&M: The Operation and Maintenance index. It adjusts O&M datafrom the O&S Cost Model (OMN). (percentage)
3. Procurement: An index to deflate procurement expenditures. Itadjusts all labor, material, and equipment costs (SCN). (percent-age)
4. MilPers: An index to deflate military personnel cost (MPN).(percentage)
5. Overall: Overall index for inflation. (percentage)

Data Edit and Entry 109
Figure C.24—Edit Inflation Index Data
Edit Data Source Documentation
Part of any good cost analysis is documenting the sources of the dataused to generate the results. Often, questions asked about the valid-ity of the results will focus on the assumptions and the data sourcesused. Anytime you modify or update data for a data set, you shoulddocument those changes. To keep the documentation with each dataset, the tool has a documentation form to enter an item, date, anddescription of the information. You should expand and modify thelist as given. The list in the example data set is intended as an exam-ple only. To bring up the form, select Edit Data Source Documenta-tion. A user form should appear as shown below in Figure C.25. Thisform has three fields:

110 The Shipbuilding and Force Structure Analysis Tool: A User’s Guide
Figure C.25—Data Source Documentation Form
1. Element: Briefly describes the data element. The example figureshows the data description for the O&S data. (text field)
2. Update Date: You should enter the date the data was changed ormodified. (date field)
3. Notes: A field to hold the full description of the data source. Itmight describe the source and any limitations or assumptionsused for the data. This field is a free-form text field and can be aslong as the analyst wants. (memo field)

111
Appendix D
RUNNING THE DATA SET—CALCULATIONS
The next step after editing the data is to calculate the various outputsfrom the models within the tool. Figure D.1 shows an image of theCalculations submenu. In general, you will want to start with the firstitem on the form and proceed sequentially down the list. The firststep is setting the bounds for the time frame of the displayed outputfor the analysis. The last step is calculating the funding profiles. The
Figure D.1—Calculations Form

112 The Shipbuilding and Force Structure Analysis Tool: A User’s Guide
tool formats and displays results of the calculations through asubmenu described in Appendix E.
UPDATE YEAR LIST
The first step in the calculations is to define the boundary range offiscal years for the results (see Figure D.2). For example, you mightonly be interested in results from FY2000 through FY2015. By settinga range for the output, the tool is able to truncate calculations andnot waste time determining values for unwanted periods. Once thesebounds are set, they remain in place until changed. Therefore, youshould only need to set them once at the beginning of the calcula-tions. When the button is pressed, a pop-up window appears askingyou to enter a “Starting Year,” which is the first fiscal year shown forthe output. The field has a default value of the current year. Afterentering the starting year, you are next prompted to enter the endingyear in a similar box. The default value for the ending year is 20 yearsfrom the current year.
Figure D.2—Select Calculation Method

Running the Data Set—Calculations 113
CALCULATE BUILD TABLE
The second step is to calculate a new “Build Table” (the informationyou can edit in the form “Edit New Ship Construction”). This menuitem runs the Force Transition Model, which generates a list of theship build requirements in order to meet force-level requirements.The table lists the type of ship, the start and end year of construction,and all the “projects” associated with that particular hull. When youpress the button, a pop-up window opens prompting you to selectthe calculation method used to generate the new production table.
On the form, select one of the two methods and press the Calculatebutton (a summation sign). Next, another pop-up window opensasking you to confirm the deletion of the current contents of thetable. The analyst needs to click OK to proceed with the calculation.The status bar will show the progress of the calculations.
GENERATE REQUIRED LABOR PROFILES
The third step is to calculate the minimum labor (FTEs) necessary tobuild the ships at the shipyards. The concept of required labor is dis-cussed in Chapter Three. Similar to the above command, a pop-upbox will prompt you to overwrite the existing data in the appropriatetable object. Confirming with OK allows the calculations to proceed.If the tool cannot find labor, learning, or project data for a particularship class in the course of determining the required labor, it will dis-play a form (see Figure D.3) listing the missing information. In thecase of missing labor data or project information, the missing valuesare assumed to be 0 for that item. When the learning data are miss-ing, the slope is assumed to be 100 percent.
GENERATE EFFECTIVE LABOR PROFILES
Running the Industrial Base Model is the fourth step in the process ofcalculating output. This model determines the effective labor re-quired to build the required ships at the shipyards. As before, you areprompted to overwrite the contents of the table holding the existingoutput data. Recall that if the software key field has not been entered
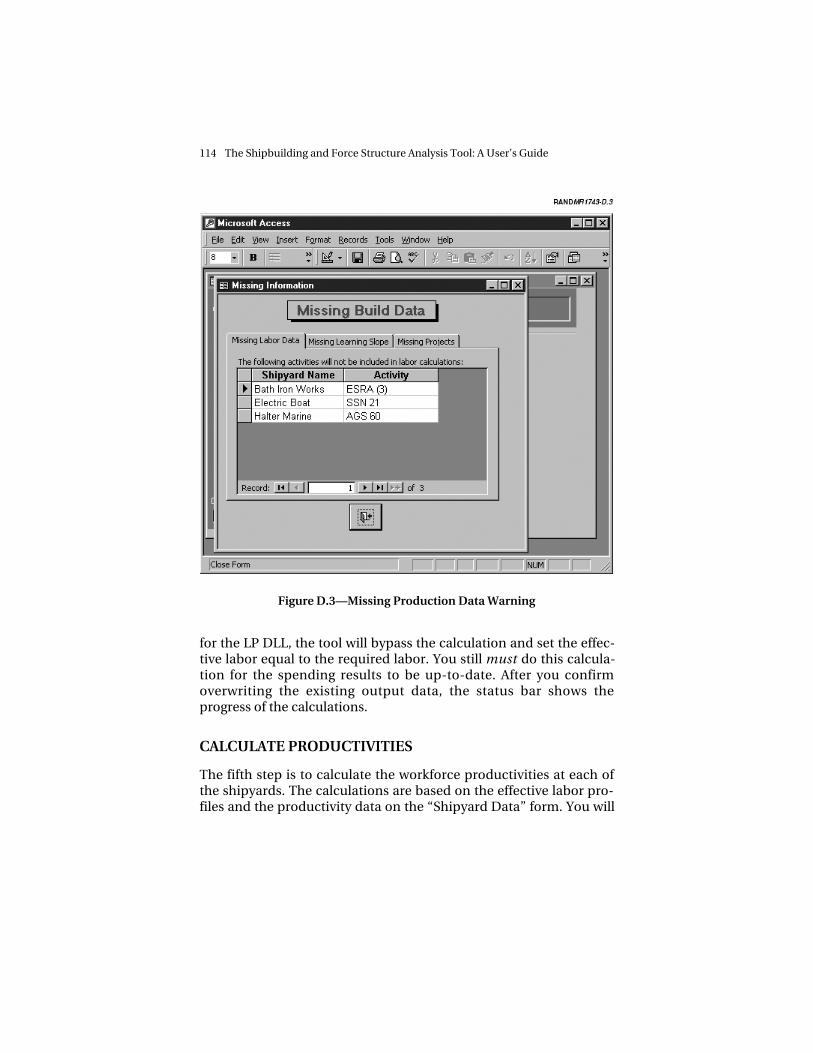
114 The Shipbuilding and Force Structure Analysis Tool: A User’s Guide
Figure D.3—Missing Production Data Warning
for the LP DLL, the tool will bypass the calculation and set the effec-tive labor equal to the required labor. You still must do this calcula-tion for the spending results to be up-to-date. After you confirmoverwriting the existing output data, the status bar shows theprogress of the calculations.
CALCULATE PRODUCTIVITIES
The fifth step is to calculate the workforce productivities at each ofthe shipyards. The calculations are based on the effective labor pro-files and the productivity data on the “Shipyard Data” form. You will

Running the Data Set—Calculations 115
be prompted if you want to overwrite the existing data. If you con-firm by selecting yes, a progress bar shows the status of the calcula-tions.
UPDATE FUNDING PROFILES
The last step in the calculations is to generate the funding require-ments by year and account. This calculation also runs the O&S CostModel embedded in the tool. When the button is pressed, a windowopens for the analyst to set the NPV and Cash Flow assumptions (seeFigure D.4). For the NPV parameters, the default “zero” year is thepresent year (you should almost never need to change the zero yearfrom the default value). The other NPV item on the form is the dis-count rate. The default discount rate is 0 percent. If you are looking
Figure D.4—Funding Assumptions Form

116 The Shipbuilding and Force Structure Analysis Tool: A User’s Guide
at budget projections,1 you should leave this rate at 0. However, ifyou are examining the cost-benefits of alternative plans, you willneed to set an appropriate rate, which is usually specified by the Of-fice of Management and Budget.
For determining how expenditures are tracked over time, the cashflow box contains two options: As Expended and As Appropriated(default). The first method models the cash flow as work is accruedby the yards. In other words, only work and expenses charged in aparticular year are allocated as costs for that year. The secondmethod models funding required to the appropriation year (first yearof construction/work). Using this method, all funding required for anitem, which may span several years of work, is attributed to the firstyear. When you press the button with the sigma (summation) on it,the status bar shows the calculation progress with a meter.
If certain values used in the funding calculations are invalid, a pop-up window appears warning the analyst of the data problems (seeFigure D.5). Two problem issues are checked: burden values not cov-ering the full range of the analysis and budget profiles that do notsum to 100 percent.
VIEW INTERMEDIATE RESULTS
This command brings up menu options that allow the analyst to viewthe intermediate results of the calculations. There are two options forthis submenu. The first option, View and Edit New Production List,opens a form that allows you to view and edit new ship productiongenerated by the Force Transition Model. This is the same form asthe one described in Appendix C. Again, you should exercise cautionwhen editing this table.
The second menu option is View and Edit Required Labor. The formthat opens allows you to modify the labor demands generated by theGenerate Required Labor menu option. Listed in the table are all theelements associated with each shipyard project for every hull. Thelist can be quite large, easily over a thousand records. You should
______________ 1Recall that the tool reports all costs on a constant-dollar basis, which is different fromthe discounting issue.

Running the Data Set—Calculations 117
Figure D.5—Invalid Funding Data Warning
exercise care when modifying the data on this form. In fact, there arevery few reasons to edit the information. However, the data are avail-able to import into another application, such as MS Excel, for furtheranalysis.


119
Appendix E
GENERATING REPORTS
The last major menu item opens a submenu for the pre-generatedreport objects (see Figure E.1). These objects are formatted chartsand tables based on the calculations and data entered by the analyst.There are three main categories of output. The first, Shipyard Labor,produces charts to analyze the FTE loadings at each of the yards as
Figure E.1—Reports Menu

120 The Shipbuilding and Force Structure Analysis Tool: A User’s Guide
well as the burden rate effect. The second, Funding, generates chartsand tables for required funding aggregated at varying levels of detail.The third, Ship Counts, produces tables and charts related to thenumber of active ships per year. The other item on this menu is DataSources, which formats a report of the data source information. Toprint any of the reports, click the Print button on the Access toolbar(or select File—Print from the main Access menu).
REPORT FORMATS
Most of the chart reports have a landscape orientation and the tablereports have a portrait orientation. A bug in the initial release of Ac-cess 2000 causes report orientations to reset to the default settings(usually portrait).1 This problem is fixed in SR-1a. However, if youhave an early version of Access, you can fix the problem by disablingthe auto-rename feature. The steps are
1. On the Tools menu, click Options.
2. In the Options dialog box, click the General tab.
3. Click to clear the Perform Name AutoCorrect check box.
4. Click OK.
5. Quit and then restart Access.
To reset a specific report:
1. Select Page Setup… option from the File menu.
2. Under the Margins tab, set all margins to 0.5" for landscape and1.0" for portrait reports.
3. Under the Page tab, select the proper orientation.
4. Close the report and save if prompted.
______________ 1See Microsoft Knowledge Base article Q240826—ACC2000: Lost Printer Settings WhenName AutoCorrect Is Enabled.

Generating Reports 121
SHIPYARD LABOR
Selecting the Shipyard Labor option from the Reports menu opens aform where you can select different reports on shipyard labor, over-head, and productivity. The form is shown in Figure E.2.
To view a particular labor output, select a type and format of theoutput from the various option boxes. Note that not all options areavailable for each type of output. Various selection choices will “grayout” if the choice is not appropriate. Once all choices have beenmade, press the Preview Report button to display the results.
The main choice is “Labor Data Type.” You have four options:
1. Required Labor: Displays a chart or table of required labor.
2. Effective vs. Required Labor: Displays a chart of total effective laborat a shipyard contrasted with the total required labor.
3. Burden Rates: Displays the burden rates for all shipyards.
4. Productivity: Displays the productivity for a shipyard by the labortype.
After you have selected the data type, some additional options maybe available. The Shipyard option, if active, allows you to select the
Figure E.2—Labor Output Form

122 The Shipbuilding and Force Structure Analysis Tool: A User’s Guide
output for a particular shipyard. The Show All check box displays allthe yards at once in a summary figure. The Labor Units option letsyou format the output labor in units of either FTE (heads) or hours.The Group By option lets you aggregate by either labor type or shipclass. The Output As option allows you to select the format of theoutput. The table option for this selection lets you easily cut andpaste data into other programs (such as Excel). The check box In-clude New Build Plan will produce a combined chart and table forthe required labor chart by appending a table of the starts for newships.
Example Output
The next several charts display the various output formats (FiguresE.3 through E.7). The data presented do not represent actual values.
Figure E.3—Required Labor (FTE) at a Shipyard by Class
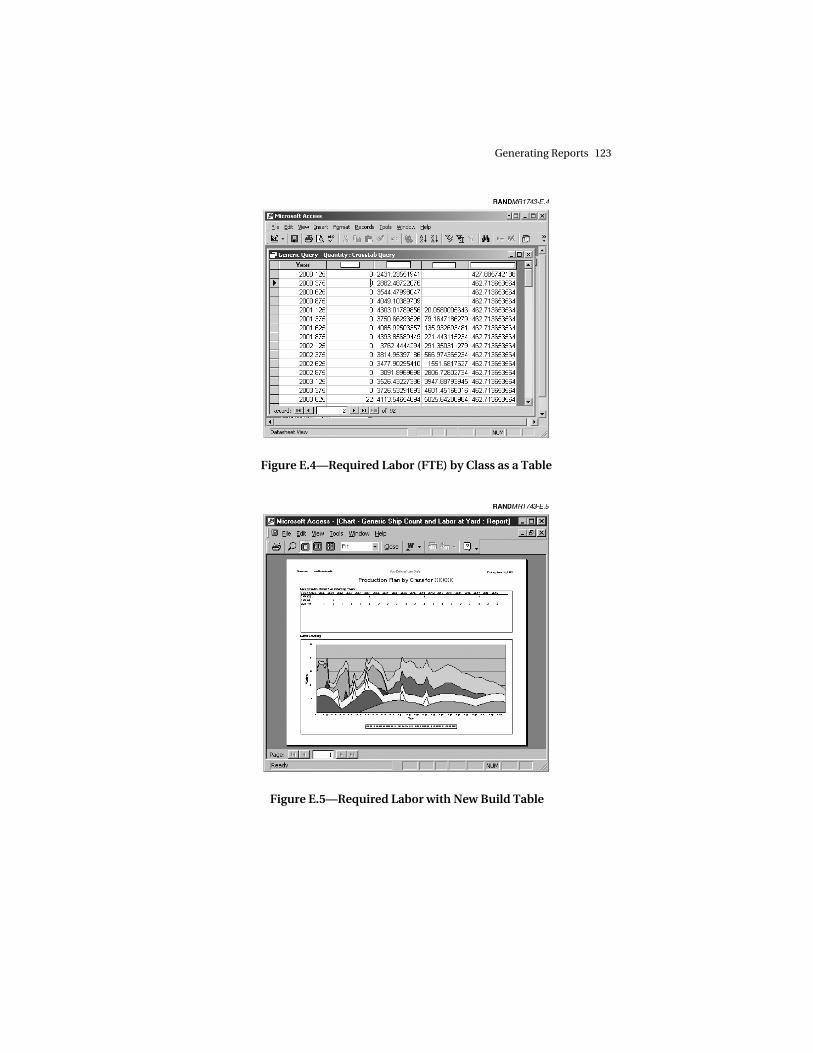
Generating Reports 123
Figure E.4—Required Labor (FTE) by Class as a Table
Figure E.5—Required Labor with New Build Table

124 The Shipbuilding and Force Structure Analysis Tool: A User’s Guide
Figure E.6—Required Versus Effective Labor
Figure E.7—Burden Rates Report

Generating Reports 125
FUNDING
Figures E.8–E.10 display the funding profiles at varying levels ofdetail—from the total fleet level to individual class level. Theselection form is shown below in Figure E.8. Each level of detail hasthree different output types:
• Chart: Chart of the data
• Table: Table of numbers to export data
• Report: Formatted table of numbers to print.
At the beginning of the reports, key assumptions (such as the dis-count rate used) are summarized. Furthermore, any mismatch be-tween the analysis period and the force requirements are noted. Anexample can be seen in Figure E.9. Note 5 on the report indicates that
Figure E.8—Funding Output Selection Form
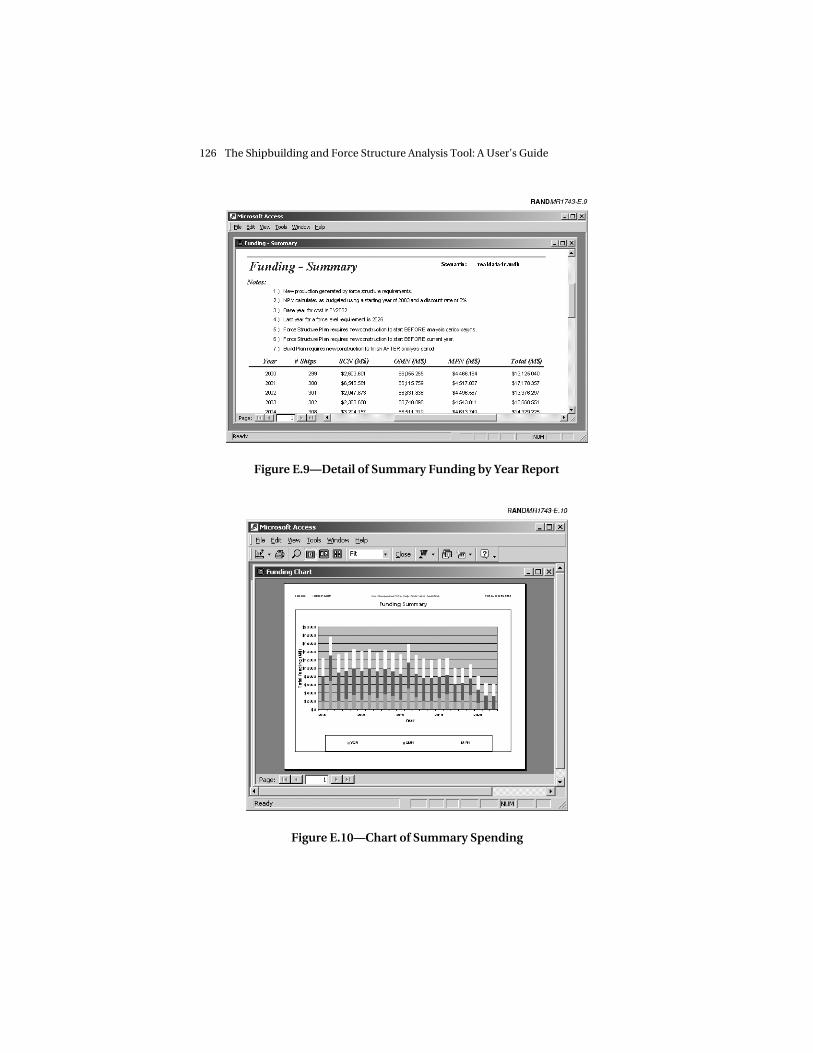
126 The Shipbuilding and Force Structure Analysis Tool: A User’s Guide
Figure E.9—Detail of Summary Funding by Year Report
Figure E.10—Chart of Summary Spending

Generating Reports 127
the new construction must begin before the analysis period in orderto meet the force level requirements. Further, Note 6 indicates thatthe new construction starts before the current year. These notes in-dicate potential problems of either infeasible force structures orpossible truncation of the funding data. You will need to use yourjudgment as to whether the results are misleading. For the example,Note 6 indicates a possible problem with an infeasible force struc-ture. However, the data set was created so that the Force TransitionModel would generate new hull construction before the current yearas a check to actual plans.
SHIP COUNTS
This group in the Reports submenu displays ship count reports.
The four main choices for this output form are
• # of Active Ships: Displays the number of ships active in the fleet.
• Requirements: A table of the requirements by ship class.
• New Production—All: A table of the new construction starts forall shipyards.
• New Production—Shipyard: A table of new construction starts ata particular shipyard.
Example Output
Figures E.11–E.15 show sample output for the ship count reports.

128 The Shipbuilding and Force Structure Analysis Tool: A User’s Guide
Figure E.11—Ship Count Reports
Figure E.12—Table of Hull Types by Year

Generating Reports 129
Figure E.13—Hull Types by Year, XY Plot
Figure E.14—Active Hull Types by Year—Sand Chart

130 The Shipbuilding and Force Structure Analysis Tool: A User’s Guide
Figure E.15—Table of Ship Requirements
DATA SOURCES
This submenu item (Figure E.16) displays the data source commentsentered by the analyst from the form described in Appendix C, “EditData Source Documentation.”
QUIT
This main menu item closes the application. Using this method ofclosing the tool is preferable to using the Access Menu or the Closebutton (the upper-rightmost “x” button). When you end the applica-tion with the Quit command, the back-end database is compactedand cleaned before the application terminates. This database main-tenance should be done routinely because Access tends to createwasted file space after manipulating the data. If you use one of theother methods by accident, it will not harm the file, but the back-endfile might be unnecessarily large. Using the Quit command beforeyou use that data set for a subsequent session should correct theproblem.

Generating Reports 131
Figure E.16—Data Source Comments Report


133
Appendix F
COMPARISON UTILITY
During the development of the Shipbuilding and Force StructureAnalysis Tool, one of the improvements we were requested to makewas adding the ability to compare the results of two data sets. In thisappendix, we describe a utility that was created to do just that. Theutility is a Microsoft Access file that links the output tables of twodata sets created with the tool. With the utility, an analyst can exam-ine how labor, budgets, and ship counts differ between two data sets.This comparison ability allows an analyst to look quickly at the ef-fects of changes in acquisition strategy and force structure plans.
MAIN SCREEN
The opening screen (a switchboard) of the utility is shown in FigureF.1. The main screen has two sections: right and left. On the rightside of the switchboard are the menu selection commands. The mainoptions are
• Select Data Sets: The user selects the comparison data sets usinga standard pop-up window.
• Update Year List: The user selects the fiscal years over which thecomparison is performed.
• Labor Differences: A set of charts and tables appears to allow theuser to compare the differences in labor demands between thetwo comparison data sets.
• Funding Differences: Charts and tables show the funding differ-ence between the two comparison data sets.

134 The Shipbuilding and Force Structure Analysis Tool: A User’s Guide
Figure F.1—Main Screen
• Ship Counts: Tables and charts show the differences in the num-ber of active ships.
• Quit: Closes the utility.
We explore the details for each of these options later in this ap-pendix.
The comparison utility is designed to examine two data sets. On theleft side of the switchboard the two datasets are listed. The “BaselineData Set” serves as the basis from which the changes are measuredand the “Change Data Set” is the set after modifications have beenmade. All the analysis screens and output of the comparison utilityshow the impact of the “Change Data Set” relative to the “BaselineData Set.”
The left half of the main switchboard also provides key informationabout each of the comparison data sets. First, the file names of the

Comparison Utility 135
data sets are listed. Next, the base fiscal year and discount rates usedfor the funding calculations are shown. For any valid comparison ofexpenditures/appropriations, the values should be the same for bothdata sets. If not, the user should analyze one of the data sets againusing the shipbuilding tool so that the values match. Last, a checkbox is shown indicating whether or not the calculations are up todate for a particular data set. If the box is not checked, the calcula-tions are not up to date. Again, the analyst should redo the calcula-tions for the data set using the shipbuilding tool. In Figure F.1, youcan see that the second data set, “Change Data Set,” does not haveup-to-date calculations.1
SELECT DATA SETS
Choosing Select Data Sets from the main menu brings up a screenwhere the user is able to select a new baseline or change the data set.Selecting one of the menu options to change either the baseline orchange data set causes a standard Windows Open File pop-up to ap-pear, allowing the user to select a new data set.
UPDATE YEAR LIST
When the analyst selects this option, two pop-up windows appearasking for the starting year and ending year for the analysis. Thesetwo values set the range for the output for all the comparison analy-sis. Therefore, if the user selects 2003 as a starting year and 2020 asan ending year, the output will cover fiscal years 2003 through 2020(provided that data exist for those years).
LABOR DIFFERENCES
This menu option opens a pop-up window that lets analysts examinethe differences in labor at the shipyards between the two data sets.The pop-up is shown in Figure F.2.
______________ 1An important qualification is that the tool is only able to track changes and determinewhether the calculations are up-to-date when data changes are made through theinterface windows and forms. The tool will not recognize any changes made directly inthe Access tables.
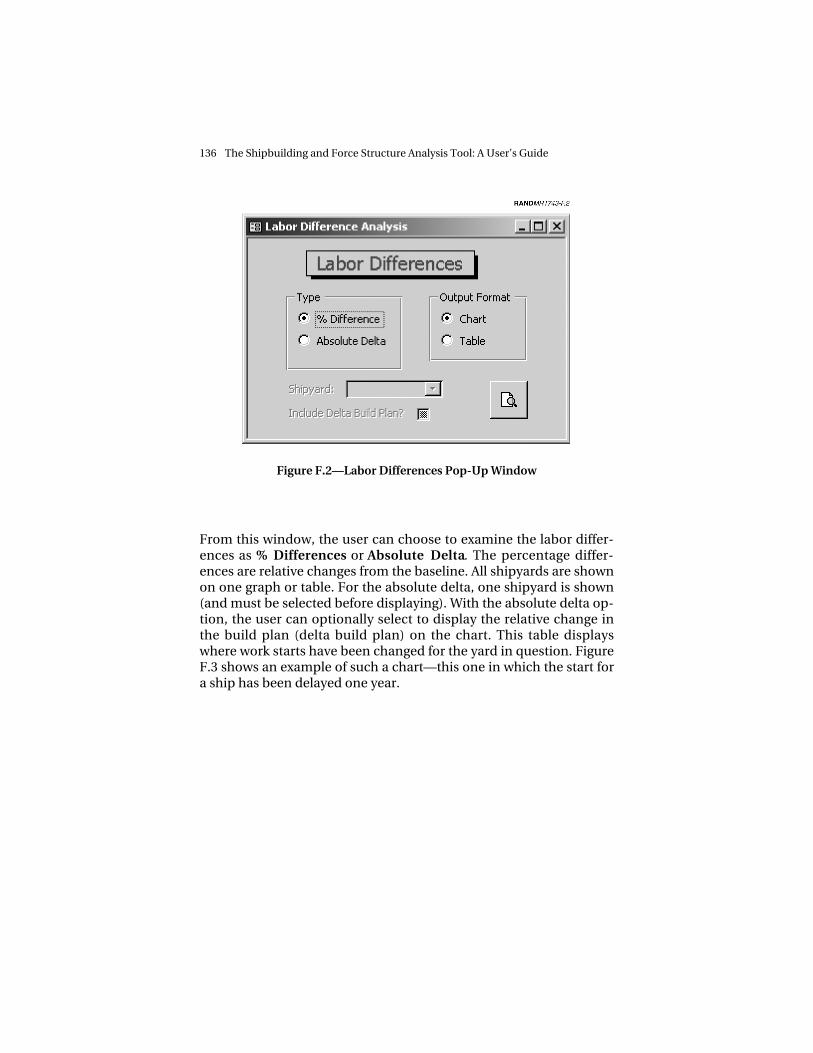
136 The Shipbuilding and Force Structure Analysis Tool: A User’s Guide
Figure F.2—Labor Differences Pop-Up Window
From this window, the user can choose to examine the labor differ-ences as % Differences or Absolute Delta. The percentage differ-ences are relative changes from the baseline. All shipyards are shownon one graph or table. For the absolute delta, one shipyard is shown(and must be selected before displaying). With the absolute delta op-tion, the user can optionally select to display the relative change inthe build plan (delta build plan) on the chart. This table displayswhere work starts have been changed for the yard in question. FigureF.3 shows an example of such a chart—this one in which the start fora ship has been delayed one year.

Comparison Utility 137
Figure F.3—Example Absolute Delta Labor Graph with Delta Build Plan
FUNDING DIFFERENCES
The Funding Differences option from the main menu opens a sub-screen of the switchboard, shown in Figure F.4. The user is given theoption to produce a chart, table, or report of the funding differencesbetween the two data sets. Figure F.5 shows a highlight of the fund-ing difference table.

138 The Shipbuilding and Force Structure Analysis Tool: A User’s Guide
Figure F.4—Funding Differences Menu
Figure F.5—Funding Differences Table

Comparison Utility 139
SHIP COUNTS
The last major menu item allows the analyst to examine differencesin the number of active ships or produced ships based on thechanges between the two data sets. Figure F.6 shows the pop-upwindow that opens when this switchboard option is selected.
The first selection option on the window, Delta, lets the user choosebetween differences in production (i.e., the number of productionstarts) and the number of active ships. Next, Group Results By allowsthe user to summarize the results based on the various ship cate-gories (see Appendix G). Last, the analyst is given the choice of theoutput format: either a table or a chart. Figure F.7 shows a table ofthe delta number of active ship by role.
Figure F.6—Ship Counts Pop-Up Window

140 The Shipbuilding and Force Structure Analysis Tool: A User’s Guide
Figure F.7—Delta Ship Production by Ship Role

141
Appendix G
SHIP ROLES, HULL TYPES, AND CLASSES
Table G.1 on the next page provides a list of ship roles, hull types,and classes.

142 The Shipbuilding and Force Structure Analysis Tool: A User’s Guide
Table G.1
Ship Roles, Hull Types, and Classes
Ship Role Hull Type Ship Class
Aircraft Carrier Aircraft Carrier CV 63, CVN 65, CV 67,CVN 68, CVN (X)
Amphibious Tank Landing Ship LST 1179Dock Landing Ship LSD (X), LSD 36, LSD 41,
LSD 49Amphibious Assault Ship LH (X), LHA 1, LHD 1Amphibious Transport
DockLPD 1, LPD 14, LPD 17, LPD 7
Auxiliary/Support Auxiliary ADC (X), AO (X), ATFFast Combat Support
ShipAOE (X), AOE 1, AOE 6
Research Vessel AGER 2, AGSS 555Salvage Ship ARS 50Submarine Tender AS 39Ocean Surveillance Ship AGOS 23Surveying Ship AGS 60, AGS 65Vehicle Cargo Ship AKR 300, AKR 310Misc. Command Ship AGF 11, AGF 3, JCC (X)
Mine Warfare Mine Hunter Coastal MHC 51Mine Countermeasures
ShipMCM (X), MCM 1, MCS (X)
Mine CountermeasuresSupport Ship
MCS 12
Patrol Patrol Coastal PC 1
Submarine Attack Submarine SSN 21, SSN 637, SSN 640,SSN 688, SSN 774
Ballistic MissileSubmarine
SSBN 726
Surface Combatant Destroyer DD 21, DD 963Guided Missile Cruiser CG 21, CG 47Guided Missile Destroyer DDG 51Guided Missile Frigate FFG 7
Unclassified

143
REFERENCES
Aspin, Les, Secretary of Defense, Report of the Bottom-Up Review,October 1993.
Barker, F. Scott, Microsoft Access 2000 Power Programming, SAMSPublishing, 1999.
Birkler, J. L., J. Schank, Giles K. Smith, F. S. Timson, James R. Chiesa,Marc D. Goldberg, Michael G. Mattock, and Malcolm MacKin-non, The U.S. Submarine Production Base: An Analysis of Cost,Schedule, and Risk for Selected Force Structures, Santa Monica,Calif.: RAND Corporation, MR-456-OSD, 1994.
Birkler, J. L., Michael G. Mattock, J. Schank, Giles K. Smith, F. S. Tim-son, James R. Chiesa, Bruce Woodyard, Malcolm MacKinnon,and Denis Rushworth, The U.S. Aircraft Carrier Industrial Base:Force Structure, Cost, Schedule, and Technology Issues for CVN77, Santa Monica, Calif.: RAND Corporation, MR-948-NAVY/OSD, 1998.
Birkler, J. L., J. Schank, Mark Arena, Giles K. Smith, and Gordon Lee,The Royal Navy’s New-Generation Type 45 Destroyer: AcquisitionOptions and Implications, Santa Monica, Calif.: RAND Corpora-tion, MR-1486-MOD, 2002.
Cohen, William S., Secretary of Defense, Report of the QuadrennialDefense Review, May 1997.
Commission on Roles and Missions of the Armed Forces, Directionfor Defense, May 1995.

144 The Shipbuilding and Force Structure Analysis Tool: A User’s Guide
Department of Defense, DoD Instruction 7041.3, Functional Eco-nomic Analysis, 1995. Online at http://www.c3i.osd.mil (as ofApril 10, 2003).
Department of Defense, Contract Pricing Reference Guides: Volume4—Advanced Issues in Contract Pricing. Online at the DoD Pro-curement website at http://www.acq.osd.mil/dp/cpf/pgv1_0/pgv4/pgv4c2.html (as of April 10, 2003).
Department of Defense Systems Management College, Indirect-CostManagement Guide: Navigating the Sea of Overhead, FortBelvoir, Va.: Defense Systems Management College Press, Octo-ber 2001. Online at http://www.dau.mil/pubs/gdbks/icm_guide.pdf (as of April 10, 2003).
Fisher, Gene H., Cost Considerations in Systems Analysis, Santa Mon-ica, Calif.: RAND Corporation, R-490-ASD, 1970.
Hesse, Rick, and Gene Woolsey, Applied Management Science: AQuick and Dirty Approach, Chicago: Science Research Associ-ates, 1980.
Kaufeld, John, Access 2000 for Dummies, IDG Books Worldwide, 1999.
Kimmel, Paul, Teach Yourself Microsoft Access 2000 Programming,SAMS Publishing, 1999.
Large, Joseph P., An Introduction to Equipment Cost Estimating,Santa Monica, Calif.: RAND Corporation, RM-5470-SA, 1968.
National Defense Panel, Transforming Defense: National Security inthe 21st Century, Arlington, Va., December 1997.
Novick, D., Use of the Learning Curve, Santa Monica, Calif.: RANDCorporation, P-267, 1951.
Office of Management and Budget (OMB), Guidelines and DiscountRates for Benefit-Cost Analysis of Federal Programs, OMB Circu-lar Number A-94, October 29, 1992.