Embed Size (px)
Citation preview

The Seven Percent Solution
HSUAN-CHI CHEN and JAY R. RITTER*
ABSTRACT
Gross spreads received by underwriters on initial public offerings ~IPOs! in theUnited States are much higher than in other countries. Furthermore, in recentyears more than 90 percent of deals raising $20–80 million have spreads of exactlyseven percent, three times the proportion of a decade earlier. Investment bankersreadily admit that the IPO business is very profitable, and that they avoid com-peting on fees because they “don’t want to turn it into a commodity business.” Weexamine several features of the IPO underwriting business that result in a marketstructure where spreads are high.
IT IS WIDELY ACCEPTED THAT there are fixed costs associated with issuing se-curities, leading to economies of scale in the costs of issuing debt, equity, andhybrid securities. For initial public offerings ~IPOs! of moderate size, how-ever, no economies of scale are evident when one examines the commissionspaid to investment bankers, also known as the gross spreads or underwrit-ing discounts. In the period from 1995 to 1998, for the 1,111 IPOs raisingbetween $20 and $80 million in the United States, more than 90 percent ofissuers paid gross spreads of exactly seven percent.
This clustering of spreads at seven percent has not always been present.There is much more clustering at seven percent now than a decade ago,although the average spread on IPOs has not changed during this period. Inthe 1985 to 1987 period, only about one-quarter of moderate size IPOs hadspreads of exactly seven percent, in contrast to the more than 90 percentincidence that has prevailed in recent years. We offer a few ideas about thispattern, but the convergence remains puzzling.
Spreads on IPOs outside of the United States, such as in Australia, Japan,Hong Kong, or Europe, are approximately half the level of those in the UnitedStates. Spreads within the United States for bond, convertible bond, andseasoned equity offerings do not show pronounced clustering on one number.1
* Chen is from Fu Jen University, Taiwan, and Ritter is from the University of Florida. Weare grateful to William Christie, Stuart Gillan, Jason Karceski, Tim Loughran, Ananth Mad-havan, Tim McCormick, Andy Naranjo, Paul Schultz, Shawn Thomas, Steve Wallman, WilliamWilhelm, Kent Womack, Li-Anne Woo, Hui Yang, Hsiu-Chuan Yeh, two anonymous referees,participants in seminars at Arizona State, Boston College, Cornell, Duke, Maryland, and Tulane,and especially Harry DeAngelo, Mark Flannery, Bruce Foerster, Tracy Lewis, Michael Ryn-gaert, and René Stulz for helpful comments. Data on analyst forecasts have been supplied byI0B0E0S.
1 See the appendix table in Lee, et al. ~1996!.
THE JOURNAL OF FINANCE • VOL. LV, NO. 3 • JUNE 2000
1105

This article examines several possible explanations for the high averagespreads on IPOs in the United States, the striking fact that so many issuerspay exactly 7.0 percent, and the increase in clustering during the past de-cade. We argue that the spreads for most deals above $30 million are abovecompetitive levels. One reason for this opinion is that the spreads are muchhigher than elsewhere in the world. A second reason is that if spreads weredetermined primarily by costs, the average spreads on $80 million dealswould be lower than on $20 million deals. But they are not. And if costs werethe main determinant of spreads, $40 million deals by risky companies wouldhave higher spreads than $40 million deals by relatively easy to value firms.But they do not. A third reason for our opinion is that investment bankersreadily concede that the spreads are high, “The fact is, we’d be cutting ourown throats to compete on price.”2
Ideally, we would like to have cost information to directly test whether thegross spreads that are charged are equal to costs, including a competitiverate of return on capital employed. Unfortunately, this information is pro-prietary. More importantly, there would be problems in interpreting the num-bers, since many of the costs are hard to allocate, and the costs of operatinga gold-plated operation are higher than for a bare-bones operation. In otherwords, the costs are endogenous. High spreads induce underwriters to com-pete for business by adding more services.
There are several features of the IPO underwriting market that are con-ducive to high spreads. The importance of underwriter prestige results in a“pecking order” where few issuers will turn down a “bulge bracket” under-writer for a less prestigious one, even if it means paying higher fees. Theimportance of analyst coverage limits the number of viable competitors for agiven deal, and leads issuing firms to choose a lead underwriter at leastpartly on the basis of characteristics unrelated to the fees charged.
Explanations that we address for the high average spreads, and the highfrequency of seven percent spreads, include the possibility of implicit or ex-plicit collusion among investment bankers. Among game theorists, the term“implicit collusion” is used to denote an outcome in which sellers keep pricesabove competitive levels without explicitly colluding. Because the term “im-plicit collusion” is sometimes interpreted in a conspiratorial manner, we willuse the term “strategic pricing.” In the strategic pricing explanation, indi-vidual underwriters realize that by undercutting spreads to win a deal, com-petitors will respond by charging lower spreads in the future, resulting in alower present value of profits. The self-interest of each individual invest-ment banker results in higher spreads than if the fees were at competitivelevels. By competitive levels, we mean spreads where no economic profitsare being earned by underwriters. The logic is based on the Dutta and Mad-havan ~1997! model of a noncooperative game used to explain the high bid-ask spreads on Nasdaq stocks.
2 Attributed to the anonymous head of underwriting for an investment bank in RogerLowenstein’s April 10, 1997 Wall Street Journal column.
1106 The Journal of Finance
We also discuss several other, more innocuous, reasons why IPO spreads arehigh. These reasons include the necessity of having high spreads in order toinduce underwriters to do a credible job of certifying the quality of an offering.Further, although spreads are the primary direct compensation of under-writers, the money “left on the table” via the short-run underpricing of IPOsis an important indirect compensation, for underwriters are able to allocatethis money to their favored clients. Alternatively, low spreads would encour-age greater underpricing as a way of reducing the expected costs of stabilizingIPOs, thereby increasing the indirect costs to issuing firms. Yet another rea-son is that high spreads induce underwriters to compete for business on thebasis of analyst coverage, which enhances the liquidity of a company’s stock.
There are some similarities between patterns of gross spreads on IPOsand those of Nasdaq bid-ask spreads. Prior to the publicity generated byChristie and Schultz ~1994!, Nasdaq market makers avoided odd-eighth quotes.In other words, quotes at $10, $10.25, and $10.50 were far more commonthan quotes at $10.125, $10.375, and $10.625. Various parties have arguedthat the avoidance of odd-eighth quotes facilitated either implicit or explicitcollusion to keep the bid-ask spreads wide. ~The evidence of explicit collusionwas strong enough to result in a lawsuit settlement of $1.03 billion paid byNasdaq market makers in November 1998.! In the IPO market, the avoid-ance of spreads that are not exactly seven percent could facilitate eitherexplicit collusion or strategic pricing, in that it is readily observable ~fromthe prospectus! whether one underwriter is charging a fee that is “too low.”On the other hand, there is a tendency to have at least some clustering atintegers in almost every market, including the London gold market and in-terest rates paid on bank deposits ~Kahn, Pennacchi, and Sopranzetti ~1999!!in spite of no requirement to avoid noninteger prices.
Explanations for the increased clustering over time are harder to come by.We conjecture that seven percent has arisen as a focal point partly becauseissuers have placed relatively little attention on fees, and underwriters findit easy to justify a given spread by pointing to previous deals done at thesame spread.
The structure of the remainder of this article is as follows: In Section I, wepresent the facts on the distribution of gross spreads on IPOs in the UnitedStates over the 1985 to 1998 period. In Section II, we discuss features of theIPO market that may facilitate high spreads. In Section III, we discuss al-ternative explanations for the clustering of spreads at seven percent. In Sec-tion IV, we discuss possible reasons for the increased clustering of spreadsover time. Section V concludes this article.
I. The FactsA. Data
We examine the spreads on 3,203 firm commitment IPOs from January1985 to December 1998 covered in the New Issues database of SecuritiesData Company ~SDC!. Closed-end funds, American Depository Receipts ~ADRs!,
The Seven Percent Solution 1107
real estate investment trusts ~REITs!, and unit offerings are excluded fromthe sample. The sample is restricted to equity IPOs with domestic grossproceeds of at least $20 million because the compensation for underwritingsmaller offerings is much higher due to the diseconomies of scale, and thesedeals may be accompanied with underwriter warrants.3 Throughout the pa-per, the proceeds exclude overallotment options, and are expressed in termsof dollars of 1997 purchasing power adjusted using the U.S. GDP implicitprice def lator.4 It is worth noting that in the United States, buyers of IPOspay no brokerage commission.
B. Empirical Evidence of the Clustering of Underwriting Spreadsat Seven Percent
Table I reports the number of offerings by calendar year, offering size, andgross spread. The table shows that the proportion of IPOs with a sevenpercent spread has an upward trend until 1995, then stabilizes at about77 percent. For deals with proceeds of $20 million up to $80 million, whichwe refer to as moderate size deals, the increasing concentration at sevenpercent is especially noteworthy. This is illustrated in Figure 1.
At the bottom of Table I we report the distributions after aggregating theyears into three time periods: 1985 to 1987, 1988 to 1994, and 1995 to 1998.We also report the numbers by proceeds category: moderate size deals andlarge deals. In the 1985 to 1987 period, 26 percent of the moderate size IPOsoccurred at seven percent, with 46 percent at lower spreads and 28 percentat higher spreads. By the 1995 to 1998 period, only five percent of thesedeals occurred at lower spreads, and only four percent occurred at higherspreads. Fully 91 percent of these moderate size IPOs paid a spread of ex-actly 7.0 percent.
Although the clustering of spreads has increased over time, in Table II weshow that the average spread has remained virtually unchanged over thelast 14 years.5 This includes not only high-volume periods, but also the low-volume years following the October 1987 stock market crash. During the1988 to 1990 period when there was relatively little equity-issuing activity,presumably there was plenty of excess capacity in the underwriting business.
In Figure 2, we show a scattergram of the relation between spreads andthe logarithm of proceeds for IPOs from 1998. The figure shows the strongclustering of spreads at seven percent for deals with proceeds of $20 million
3 See Barry, Muscarella, and Vetsuypens ~1991! for a description of underwriter warrantsand related regulation.
4 An overallotment option gives the underwriter the right, but not the obligation, to pur-chase additional shares from the issuer. The spread per share on these incremental shares isthe same as for the rest of the issue.
5 The low value-weighted spread for large IPOs in 1998 is attributable to three very largeIPOs ~all over $2 billion! at gross spreads of approximately four percent. The spreads on theConoco, Fox Entertainment, and Infinity Broadcasting IPOs were in line with predictions, giventhe size.
1108 The Journal of Finance

Tab
leI
Nu
mb
erof
IPO
sb
yC
alen
dar
Year
,P
roce
eds,
and
Gro
ssS
pre
ad
,19
85–1
998
Th
esa
mpl
eco
nsi
sts
of3,
203
firm
com
mit
men
tin
itia
lpu
blic
offe
rin
gs~I
PO
s!w
ith
dom
esti
cgr
oss
proc
eeds
ofat
leas
t$2
0m
illi
onbe
fore
the
exer
cise
ofth
eov
eral
lotm
ent
opti
on.
Sec
uri
ties
Dat
aC
o.is
the
sou
rce
ofth
eda
ta.
Clo
sed-
end
fun
ds,
RE
ITs,
AD
Rs,
and
un
itof
feri
ngs
are
excl
ude
d.T
he
amou
nt
ofpr
ocee
dsis
expr
esse
din
term
sof
doll
ars
of19
97pu
rch
asin
gpo
wer
,u
sin
gth
eU
.S.
GD
Ppr
ice
defl
ator
.T
her
ear
eth
ree
cate
gori
esof
gros
ssp
read
sex
pres
sed
asa
perc
enta
geof
proc
eeds
:be
low
seve
npe
rcen
t,se
ven
perc
ent,
and
abov
ese
ven
perc
ent.
Pan
elA
:$2
0–79
.99
mil
lion
proc
eeds
Pan
elB
:$
$80
mil
lion
proc
eeds
Pan
elC
:All
IPO
s
Gro
ssS
prea
dG
ross
Spr
ead
Gro
ssS
prea
d
Year
Bel
ow7%
7%A
bove
7%A
llB
elow
7%7%
Abo
ve7%
All
Bel
ow7%
7%A
bove
7%A
ll
1985
3818
2278
161
320
54~5
5%!
19~1
9%!
25~2
6%!
9819
8692
3851
181
428
858
134
~56%
!46
~19%
!59
~25%
!23
919
8751
4939
139
294
336
80~4
6%!
53~3
0%!
42~2
4%!
175
1988
1622
1048
133
016
29~4
5%!
25~3
9%!
10~1
6%!
6419
8913
328
5313
20
1526
~38%
!34
~50%
!8
~12%
!68
1990
1337
1464
120
012
25~3
3%!
37~4
9%!
14~1
8%!
7619
9126
109
2716
246
20
4872
~34%
!11
1~5
3%!
27~1
3%!
210
1992
2515
518
198
624
167
87~3
3%!
159
~60%
!19
~7%
!26
519
9326
223
1826
768
100
7894
~27%
!23
3~6
8%!
18~5
%!
345
1994
1815
316
187
355
040
53~2
3%!
158
~70%
!16
~7%
!22
719
9514
248
1227
453
120
6567
~20%
!26
0~7
7%!
12~3
%!
339
1996
2134
814
383
7426
210
295
~20%
!37
4~7
7%!
16~3
%!
485
1997
1525
616
287
5930
190
74~2
0%!
286
~76%
!17
~4%
!37
719
986
158
316
745
230
6851
~22%
!18
1~7
7%!
3~1
%!
235
1985
–87
181
105
112
398
8713
1411
426
8~5
2%!
118
~23%
!12
6~2
5%!
512
~46%
!~2
6%!
~28%
!~1
00%
!~7
6%!
~12%
!~1
2%!
~100
%!
1988
–94
137
731
111
979
249
261
276
386
~31%
!75
7~6
0%!
112
~9%
!1,
255
~14%
!~7
5%!
~11%
!~1
00%
!~9
0%!
~10%
!~0
%!
~100
%!
1995
–98
561,
010
451,
111
231
913
325
287
~20%
!1,
101
~77%
!48
~3%
!1,
436
~5%
!~9
1%!
~4%
!~1
00%
!~7
1%!
~28%
!~1
%!
~100
%!
The Seven Percent Solution 1109

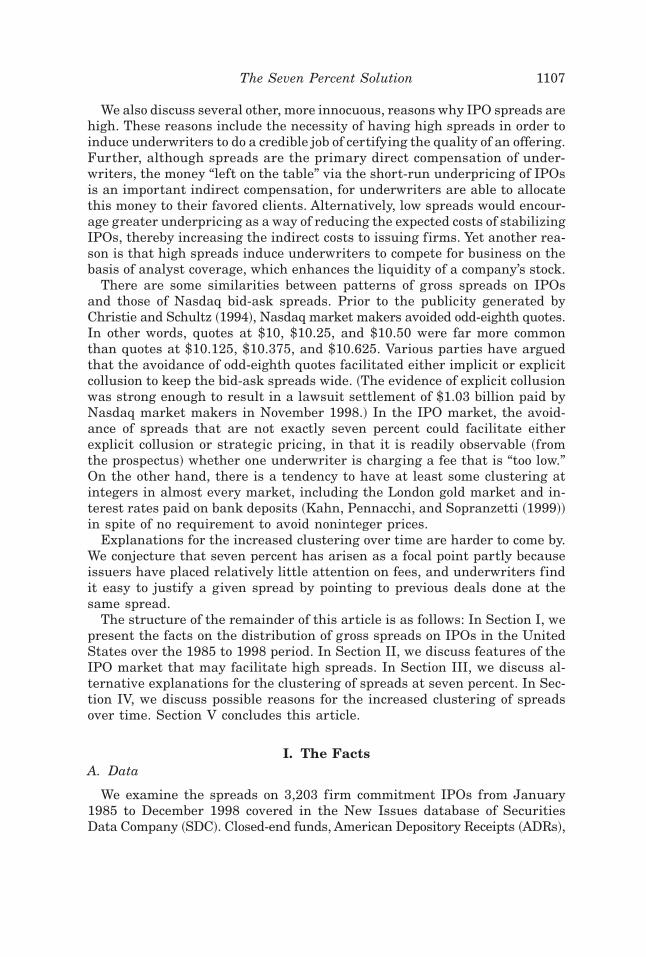
~log~20! 5 3.00! to $80 million ~log~80! 5 4.38!. In Figure 3, we show thescattergram of the relation between spreads and proceeds for the subset ofthe deals with proceeds of less than $100 million, without logging the proceeds.
As reported in Table I, of the 1,111 moderate size IPOs in the 1995 to 1998period, 56 had spreads of less than seven percent, and 45 had spreads ofmore than seven percent, according to SDC. Inspection of these 101 non–seven percent IPOs reveals that 38 of them had spreads different from 7.0 per-cent because of “rounding errors.” Although there is no requirement thatspreads be expressed as pennies per share, if a firm has an offer price of$13.50 per share, the spread tends to be either 94 cents ~6.963 percent! or95 cents ~7.037 percent!, rather than the 94.5 cents that would make thepercentage spread equal to 7.0 percent. If we classify these cases as sevenpercent spreads, there are only 63 of the 1,111 moderate size IPOs withnon–seven percent spreads. On closer inspection, we find that several ofthese 63 were ADRs of foreign firms that were misclassified by SDC, severalwere Canadian companies, 11 were IPOs where the spreads were lower thanseven percent but the expected proceeds from the preliminary prospectus
Figure 1. Gross spread distribution for moderate size IPOs. The sample consists of 2,488firm commitment IPOs from 1985 through 1998 with proceeds of at least $20 million but lessthan $80 million ~expressed in terms of dollars of 1997 purchasing power! before the exercise ofthe overallotment option. Closed-end funds, REITs, ADRs, and unit offerings are excluded fromthe sample. There are three categories of gross spreads expressed as a percentage of proceeds:below seven percent, seven percent, and above seven percent. The percentage of IPOs in eachcategory are from Panel A of Table I.
1110 The Journal of Finance

indicated an intention to raise at least $80 million, and five were IPOs wherethe spreads were higher than seven percent but the expected proceeds fromthe preliminary prospectus were less than $20 million. ~The spread is gen-erally negotiated before the preliminary prospectus is issued.! This leavesonly about 40 of the 1,111 moderate size IPOs with non–seven percent spreads.Thus, in the 1995 to 1998 period, the clustering of spreads at seven percentis actually even more extreme than the 91 percent of moderate size deals
Table II
Average Gross Spreads by Year and Size of IPOs, 1985–1998The sample consists of 3,203 firm commitment initial public offerings ~IPOs! in 1985 to 1998with proceeds of at least $20 million before the exercise of the overallotment option. Closed-endfunds, REITs, ADRs, and unit offerings are excluded from the sample. The amount of proceedsis expressed in terms of 1997 dollars, using the U.S. GDP price def lator. IPOs with proceeds ofat least $20 million but less than $80 million are designated as moderate size IPOs, others aredesignated as large IPOs. VW spread denotes value-weighted spread with proceeds being theweight. EW spread denotes equally weighted spread. Numbers in parentheses represent thestandard deviations.
Moderate Size IPOs Large IPOs All IPOs
YearVW Spread
~%!EW Spread
~%!VW Spread
~%!EW Spread
~%!VW Spread
~%!EW Spread
~%!
1985 6.88 6.96 6.08 6.38 6.40 6.84~0.47! ~0.64! ~0.56!
1986 6.89 6.94 5.83 6.33 6.20 6.79~0.40! ~0.71! ~0.56!
1987 6.96 7.00 5.55 6.08 6.04 6.82~0.40! ~0.80! ~0.63!
1988 6.85 6.92 6.01 6.14 6.33 6.72~0.27! ~0.64! ~0.52!
1989 6.95 6.97 5.89 6.16 6.30 6.80~0.12! ~0.59! ~0.45!
1990 6.99 7.03 5.83 5.98 6.45 6.86~0.43! ~0.62! ~0.60!
1991 6.99 7.01 5.82 6.03 6.28 6.79~0.18! ~0.80! ~0.58!
1992 6.99 7.01 5.78 6.04 6.24 6.77~0.26! ~0.57! ~0.56!
1993 6.98 6.99 5.75 6.14 6.23 6.80~0.16! ~0.59! ~0.47!
1994 6.94 6.97 5.94 6.09 6.44 6.82~0.21! ~0.53! ~0.45!
1995 6.98 6.98 5.82 6.15 6.34 6.82~0.13! ~0.63! ~0.44!
1996 6.98 6.99 5.74 6.38 6.27 6.86~0.15! ~0.63! ~0.41!
1997 6.95 6.98 6.01 6.36 6.37 6.83~0.30! ~0.70! ~0.50!
1998 6.97 6.98 5.05 6.14 5.52 6.74~0.18! ~0.92! ~0.64!
The Seven Percent Solution 1111

shown in Table I. When the above reclassifications are made, we find that atleast 96 percent of IPOs with expected proceeds of $20 to 80 million paidseven percent spreads.6
C. Spreads in Other Countries
Spreads on IPOs in other countries are much lower than in the UnitedStates. For example, the March 19, 1997 IPO of Cambridge Antibody Tech-nology in the United Kingdom, underwritten by Kleinwort, raised $66 mil-lion ~U.S.$! with a 3.36 percent spread ~composed of a 3.0 percent commissionplus a 150,000 pound fee!, according to SDC.7 In Japan, IPO spreads are
6 Seven of the moderate size IPOs in the 1995 to 1997 period that deviated from the sevenpercent norm were equity carveouts from Thermo Electron at spreads of 6.5 percent, six ofwhich were underwritten by Natwest Securities. An equity carveout is an IPO that is a sub-sidiary of a parent company, where the parent company retains a partial equity stake. In atelephone conversation on June 11, 1998 with Thanasis Delistathis, who is currently in chargeof handling these equity carveouts for Thermo Electron, an explanation was offered. First,Thermo Electron has done many equity carveouts over the years, and its in-house experiencespeeds up the paperwork, lowering costs for investment bankers. Second, Thermo Electronbegan doing equity carveouts before seven percent become established as an industry norm.The company successfully argues that each new deal should be done at the same spread as theprevious deals, and the underwriters view these offerings as a special case. Allen ~1998! exam-ines the equity carveouts of Thermo Electron from 1983 to 1995.
7 In 1998, the British government’s Monopolies and Mergers Commission launched an in-quiry into possible price-fixing on equity offerings in the U.K. ~see The Economist, June 27,1998!. The focus of the British inquiry appears to be on the standard two percent fee that is
Figure 2. Scatter diagram relating actual proceeds and gross spreads. The sample con-sists of 330 firm commitment IPOs in 1998 with nominal proceeds of at least $5 million beforethe exercise of the overallotment option. Closed-end funds, REITs, ADRs, and unit offerings areexcluded from the sample. The amount of proceeds is measured in millions of dollars and thenthe natural logarithm is taken. Two IPOs ~with proceeds of $5.0 million and $1.3 billion! withspreads of 11.11 percent and 2.97 percent are not shown in the diagram. A $20 million IPO hasa log of 3.00, and an $80 million IPO has a log of 4.38.
1112 The Journal of Finance
typically in the range of 3 to 3.5 percent of proceeds for moderate size deals.In Taiwan, spreads are even lower, although potential buyers of IPOs alsopay a commission, unlike in the United States. Woo ~1999! reports that inAustralia the average gross spread ~including underwriter and broker fees!on 68 IPOs with proceeds of $30 to 100 million ~Australian! from 1984 to1996 was 3.4 percent, with considerable cross-sectional variation.
There are certainly differences in the regulations and associated costs forunderwriting IPOs in different countries. One reason frequently advanced toexplain the higher costs of underwriting in the United States is the lawsuitpotential. But the reality is that auditing firms and investment bankershave been successful in their strategy during the 1980s of fighting securitiesfraud lawsuits with such ferocity that plaintiffs attorneys usually do noteven bother suing them anymore ~see Beatty and Welch ~1996!!. Instead,directors and officers ~D&O! insurance pays settlements in the typical secu-rities class action lawsuit, with underwriters untouched.
D. Spreads on Small and Large IPOs
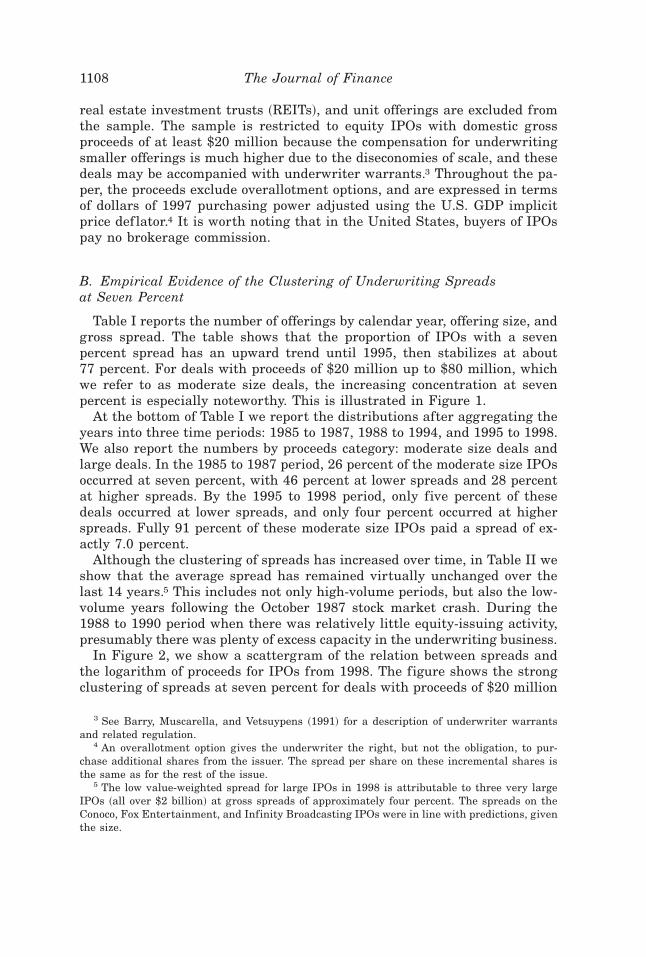
For deals below $20 million, spreads are frequently even higher than sevenpercent, as shown in Figure 3. This is consistent with substantial fixed costsin underwriting. Revenue must be sufficient to cover the cost of writing a
charged for “sub-underwriting” seasoned equity offerings. In the U.K., seasoned equity offer-ings are typically rights offerings priced at a discount of about 10 percent to the market price,with the price set several weeks before the exercise date. The sub-underwriting fee is the priceof the put option that the issuer has implicitly purchased. Plausible estimates of the put’s valueare substantially less than two percent.
Figure 3. Scatter diagram for IPOs with proceeds of at least $5 million but less than$100 million in 1998. The sample consists of 278 firm commitment IPOs in 1998 with nominalproceeds of at least $5 million but less than $100 million before the exercise of the overallot-ment option. Closed-end funds, REITs, ADRs, and unit offerings are excluded from the sample.One IPO ~with proceeds of $5.0 million! with a spread of 11.11 percent is not shown in thediagram.
The Seven Percent Solution 1113

prospectus and conducting a roadshow, as well as to cover the costs of “busted”deals and the costs of prospecting for business. The conventional wisdom isthat the large, prestigious investment banking houses have costs that are sohigh that they do not find it profitable to do these small deals, which areprimarily sold to a retail, rather than an institutional, clientele. These smalldeals frequently include compensation for the underwriters that includeswarrants to buy stock in the issuing company, in addition to the stated grossspread ~Barry et al. ~1991!!. We do not analyze these small deals.
For large deals, which we define as IPOs with proceeds of $80 million ormore, average spreads are below seven percent, and there is little clustering.Inspection of Figure 2 shows that economies of scale are clearly displayed forlarge IPOs: the bigger the deal, the lower the spread tends to be.
E. Spreads on Seasoned Equity Offerings
Given the clustering of IPO spreads, a natural question is whether thesame pattern is observed for the spreads on seasoned equity offerings ~SEOs!.Figures 4 and 5 show the spreads on SEOs, also known as follow-on offer-ings, for 1998. Figure 4 for SEOs is analogous to Figure 2 for IPOs, showingspreads versus the natural logarithm of proceeds. Figure 5 for SEOs is anal-ogous to Figure 3 for IPOs, showing spreads versus proceeds on deals below$100 million. Inspection of Figures 4 and 5 shows that there is a slight
Figure 4. Scatter diagram for SEOs with proceeds of at least $5 million in 1998. Thesample consists of 366 seasoned equity offerings ~SEOs! with proceeds of at least $5 millionbefore the exercise of the overallotment option. Closed-end funds, REITs, ADRs, and unit of-ferings are excluded from the sample. The amount of proceeds is measured in millions of dollarsand then the natural logarithm is taken. One SEO ~proceeds of $268.3 million! with a spread of0.69 percent is not shown in the diagram. This was from Flextronics International, a companyfrom Singapore.
1114 The Journal of Finance

tendency to prefer spreads that are at integers or half-integers ~4.5 percent,5.0 percent, 5.5 percent, etc.!. Figure 4 suggests that there are economies ofscale in conducting SEOs, with a nearly linear relation between the log ofproceeds and spreads.8 Most important, there is no tendency to cluster on asingle number for SEOs. For SEOs of a given size, there is considerabledispersion in the spreads paid on different deals. A comparison of the figuresfor IPOs and SEOs suggests that there is something special about sevenpercent spreads when it comes to IPOs.
F. Summary
In sum, the facts show that there is a pronounced clustering of gross spreadsat exactly seven percent for almost all IPOs raising $20 to $80 million. Thisconcentration increased gradually during the 1988 to 1994 period, to thepoint where in recent years well over 90 percent of moderate size IPOs in theUnited States have had seven percent spreads. In other countries, spreadsare substantially lower than in the United States. The patterns suggest thatgross spreads are competitive for deals below $20 to $30 million, but in-creasingly profitable on larger deals. There is no clustering on a single num-ber for SEOs.
8 Altinkilic and Hansen ~2000! argue that displays such as Figure 4 tend to overstate theeconomies of scale that exist due to a confounding effect. They argue that the larger offeringsare typically from larger, safer firms, and that any given firm faces diseconomies of scale forproceeds above some amount.
Figure 5. Scatter diagram for SEOs with proceeds of at least $5 million but less than$100 million in 1998. The sample consists of 228 seasoned equity offerings ~SEOs! with pro-ceeds of at least $5 million but less than $100 million before the exercise of the overallotmentoption. Closed-end funds, REITs, ADRs, and unit offerings are excluded from the sample.
The Seven Percent Solution 1115

II. Explanations for High Spreads
At its most general level, this paper is asking the following question: Whatfeatures of the IPO market structure are conducive to an equilibrium inwhich fees are high?
When going public, an issuing firm typically conducts a “beauty contest”to choose a lead manager ~also known as the book manager! and one or twoco-managers. The conventional wisdom is that underwriter prestige and an-alyst reputation are of paramount importance in this decision. Underwritersdo not commit to a specific offer price at the time an underwriting agree-ment is signed. Thus, competition on the basis of valuations is muted.
A. Analyst Coverage
An implicit understanding is that the managing underwriters of an IPOwill each assign a securities analyst to cover the company and produce re-search reports and issue buy recommendations for the stock ~see Power ~1993!,Rajan and Servaes ~1997!, Dunbar ~2000!, and Michaely and Womack ~1999!!.For a small firm ~in 1998 a firm with a market capitalization of equity of$250 million is too small to be included in the Russell 2000!, there is apresumption that the stock price is affected by analyst coverage and whetherthere are buy recommendations on the stock. “Buy” recommendations maybe especially important after the lock-up provision has expired, and insiderswant to sell some of their stock in the open market.9 In other words, theobjective function of a firm’s managers at the time of the offering includesraising money at the time of the offering, and raising money in future open-market insider sales. Other shareholders benefit, too, from the enhancedliquidity of their shares that is a consequence of the analyst coverage.
In the 1980s, many IPOs did not have co-managers. Today, almost all IPOshave one, two, three, or even more co-managers. A reason for this growth inthe number of co-managers is that the issuing firm is essentially buyingadditional analyst coverage at no incremental expense ~since the underwrit-ing fees will be seven percent of proceeds whether or not there are co-managers!. In Table III, we report the number of managers for moderatesize ~Panel A! and large ~Panel B! IPOs. Panel A shows that in the 1985 to1987 period, 37 percent of moderate size IPOs were solely managed, whereasin the 1995 to 1998 period, only four percent were.
In Table IV, we report the number of analyst forecasts within one year ofan IPO as reported by I0B0E0S ~Institutional Brokers Estimate System!.Our IPO sample ends in 1997 because of this requirement. In Panel C, wereport two regressions where the number of analysts making an earningsforecast within a year of the IPO is the dependent variable. The top rowreports the results of a pooled cross section-time series regression. The bottom
9 While it is in effect, a lockup provision restricts pre-issue shareholders from selling shareswithout the explicit written permission of the managing underwriter. A typical lockup provisionis for 180 calendar days after the IPO.
1116 The Journal of Finance

Table III
The Number of Managers in Underwriting Syndicates, 1985–1998The sample consists of 3,203 firm commitment IPOs in 1985 to 1998 with proceeds of at least$20 million ~1997 purchasing power! before the exercise of the overallotment option. Closed-endfunds, REITs, ADRs, and unit offerings are excluded from the sample. IPOs with proceeds of atleast $20 million but less than $80 million are designated as moderate size IPOs, others aredesignated as large IPOs. If there is a sole manager on a deal, the number of managers is one.If there is one co-manager on a deal, the number of managers is two.
Number of Managers
1 2 34 ormore Mean Median
Panel A: Moderate Size IPOs
1985–1987N ~398 total! 146 184 55 13 1.9 2% of IPOs 37% 46% 14% 3%% of Proceeds 36% 44% 16% 4%
1988–1994N ~979 total! 137 648 182 12 2.1 2% of IPOs 14% 66% 19% 1%% of Proceeds 12% 65% 21% 2%
1995–1998N ~1,111 total! 46 581 415 69 2.5 2% of IPOs 4% 52% 38% 6%% of Proceeds 4% 47% 41% 8%
AllN ~2,488 total! 329 1,413 652 94 2.2 2% of IPOs 13% 57% 26% 4%% of Proceeds 12% 53% 30% 5%
Panel B: Large IPOs
1985–1987N ~114 total! 12 48 22 32 2.9 2% of IPOs 11% 42% 19% 28%% of Proceeds 8% 32% 22% 38%
1988–1994N ~276 total! 27 86 93 70 2.9 3% of IPOs 10% 31% 34% 25%% of Proceeds 8% 26% 29% 37%
1995–1998N ~325 total! 5 47 107 166 3.8 4% of IPOs 1% 15% 33% 51%% of Proceeds 1% 8% 25% 66%
AllN ~715 total! 44 181 222 268 3.3 3% of IPOs 6% 25% 31% 38%% of Proceeds 5% 18% 26% 51%
The Seven Percent Solution 1117

Table IV
Analyst Following by Offering Size, Years, and Number of Managersin the Underwriting Syndicate and Regression Analysis, 1985–1997The sample consists of 2,911 firm commitment IPOs in 1985 to 1997 with proceeds of at least$20 million before the exercise of the overallotment option and covered by I0B0E0S. Closed-endfunds, REITs, ADRs, and unit offerings are excluded from the sample. The amount of proceedsis expressed in terms of 1997 dollars, using the U.S. GDP price def lator. IPOs with proceeds ofat least $20 million but less than $80 million are designated as moderate size IPOs, others aredesignated as large IPOs. Panels A and B report the summary statistics of analyst following.Number of full coverage represents the number of IPOs in which all managers issue earningsforecasts within one year after the offering. The first row in Panel C reports the results of apooled cross-sectional and time-series regression analysis. The amount of proceeds is measuredin millions of dollars. The sample size is reduced because of the requirement of a first-dayreturn that is defined as the percentage return from the offering price to the closing price of thefirst trading day. Numbers in parentheses are t-statistics calculated using White ~1980! robuststandard errors. The second row reports average parameter values from yearly cross-sectionalregressions using the approach of Fama and MacBeth ~1973!.
Number of Managers
1 2 34 ormore All
Panel A: Moderate Size IPOs
1985–1987Number of IPOs 133 177 52 12 374Number of full coverage 94 106 13 0 213Mean manager forecasts 0.71 1.45 1.90 1.50 1.25Mean unaffiliated forecasts 1.75 2.00 1.96 1.67 1.90
1988–1994Number of IPOs 131 647 181 12 971Number of full coverage 114 569 126 6 815Mean manager forecasts 0.87 1.86 2.60 3.17 1.88Mean unaffiliated forecasts 1.68 1.96 2.18 6.92 2.03
1995–1997Number of IPOs 40 517 332 46 935Number of full coverage 31 480 287 27 825Mean manager forecasts 0.77 1.92 2.86 3.39 2.28Mean unaffiliated forecasts 1.27 1.39 1.61 2.41 1.51
Panel B: Large IPOs
1985–1987Number of IPOs 11 46 19 31 107Number of full coverage 8 28 4 3 43Mean manager forecasts 0.73 1.48 1.37 2.16 1.58Mean unaffiliated forecasts 3.82 5.30 2.79 2.90 4.01
1988–1994Number of IPOs 27 85 92 68 272Number of full coverage 26 70 60 31 187Mean manager forecasts 0.96 1.80 2.48 3.44 2.36Mean unaffiliated forecasts 6.44 4.06 4.78 5.24 4.83
1995–1997Number of IPOs 4 40 85 123 252Number of full coverage 3 38 60 63 164Mean manager forecasts 0.75 1.95 2.64 3.81 3.07Mean unaffiliated forecasts 2.00 2.97 3.89 3.58 3.56
1118 The Journal of Finance

row reports the average coefficients from thirteen regressions, each of whichuses the IPOs from one calendar year during 1985 to 1997. The R2 reportedfor this second regression is the average of the thirteen R2 values, and thet-statistics are based on the time-series standard deviation of the coeffi-cients. Both regressions find that more analysts follow an IPO if it is larger,and if it has a higher first-day return. These results are consistent withRajan and Servaes ~1997, Table II!. Of particular interest, however, is ourfinding that an incremental co-manager adds 0.36–0.55 net analysts, hold-ing the proceeds and first-day return constant.
Securities analysts are beneficiaries of this system. Analysts with goodreputations ~as measured, e.g., by the annual Institutional Investor maga-zine all-star rankings! can command a high salary and bonuses. Analystswho help bring in equity financing business also stand to receive large bo-nuses ~Siconolfi ~1992!, Smith ~1996!, and Raghavan ~1997!!. Krigman, Shaw,and Womack ~1999! report survey evidence that issuers cite analyst cover-age as a main determinant for choosing underwriters.
The importance of analyst coverage represents a potential barrier to entryfor new underwriters. Without a well-regarded analyst being involved in thedeal, issuers will be skeptical about the ability of an underwriter to success-fully maintain demand for the stock in the aftermarket, or even to place itinitially. Furthermore, by emphasizing industry expertise, the IPO under-writing business becomes one of differentiated products, reducing the num-ber of viable competitors for any given deal.
B. Underwriter Prestige
Underwriter prestige is a second important criterion for choosing manag-ers. There is a perception that the “certification” of a prestigious under-writer is very valuable to an issuing firm. The most prestigious underwriterstoday include Goldman Sachs, Morgan Stanley Dean Witter, and Merrill Lynch.As long as issuing firms choose a lead underwriter primarily on the basis ofanalyst and investment banker reputations, there is little incentive for un-derwriters to charge differential gross spreads, for the elasticity of demand
Table IV—Continued
Panel C: Dependent Variable: Number of Forecasts within One Year after IPO
Regression Intercept Ln~proceeds!
Numberof
Managers
First-dayReturn
~%!Adjusted
R2Sample
Size
Pooled CS–TS 24.36 1.84 0.55 0.02 0.210 2,844~28.05! ~10.69! ~3.63! ~5.88!
Fama–MacBeth 24.02 1.84 0.36 0.05 0.227 13~26.92! ~12.61! ~1.74! ~3.99!
The Seven Percent Solution 1119
is not high with respect to the fees charged. Competition to be a lead man-ager is thus focused on the intermediary’s “quality” rather than the feescharged.
For intermediaries to have an incentive to certify the value of the itembeing sold, a stream of future quasi-rents must be anticipated ~Beatty andRitter ~1986!, Booth and Smith ~1986!!. Quasi-rents are the cash f lows abovemarginal cost that can be viewed as a return on the prior investment inestablishing a reputation. This framework would suggest that above-competitive spreads are needed to give underwriters an incentive to turndown deals that may be attractive in the short-run, but would be bad forinvestors in the long run.
Although above-competitive underwriter compensation is needed to induceinvestment bankers to perform a certification function, it is not clear whythis should result in spreads of seven percent for essentially all deals, whetherthey are $20 million or $80 million. Given the economies of scale that existin the cost structure, the seven percent pricing structure results in substan-tial profits on deals at the high end of the moderate size range.
C. Underwriting Syndicates
Once an issuer chooses a book manager and co-managers, the lead man-ager invites other underwriters into the underwriting syndicate. Typically,the syndicate is split into several brackets ~see Carter, Dark, and Singh~1998! for a description!, depending on how many syndicate members thereare. Because the fees are shared among the syndicate members, at firstglance the resulting revenue sharing might be viewed as conducive to areduced competitive environment.
Historically, syndicates existed partly for regulatory capital requirementand risk-sharing purposes, and partly to facilitate the distribution of anissue. This was particularly relevant when the lead underwriter did nothave a significant retail or institutional distribution network, and had lim-ited capital. Today, there is little reason to form a syndicate to perform thetraditional economic roles of risk sharing, distribution, and meeting capitalrequirements. Not surprisingly, syndicate size, as measured by the numberof participating firms, has fallen over time, even as the number of co-managers has grown. Underwriters such as Merrill Lynch, with their largeinstitutional and retail distribution networks, do not need other investmentbankers to assist in distributing a given issue. And with their large capitalbases, risk sharing would seem to be important only for the very largestissues.
In recent years almost all IPOs have had not only a book manager, butalso one or two co-managers. In Table V, we present a hypothetical examplewith Goldman Sachs as lead underwriter and BT Alex. Brown as the co-manager. We assume that there are 13 other members of the underwritingsyndicate, where the two managers underwrite 900,000 shares each, theseven members of the major bracket underwrite 100,000 shares each, and
1120 The Journal of Finance
the six members of the submajor bracket underwrite 50,000 shares each.The total number of shares is 2,800,000, before a 15 percent overallotmentoption, and the amount of gross proceeds at the $12.00 offer price is$33,600,000 net of the overallotment option. We assume a gross spread ofseven percent, which has three components, as shown in Panel A of Table V.Of the 84 cent gross spread, we assume a selling concession of 48 cents, anunderwriting fee of 19 cents, and a management fee of 17 cents. A syndicatemember would receive 48 cents for each share whose sale is credited to thatmember. There is no necessary relation between the number of shares un-derwritten and the selling credits earned. Normally, the vast majority of theshares sold will be credited to the book manager, as illustrated in Panel B ofTable V. All 15 syndicate members would receive the underwriting fee of19 cents, minus underwriting and stabilization expenses, for each share un-derwritten. The managing underwriters would receive 17 cents on everyshare sold by any member, with the split between the lead and co-managingunderwriters usually tilted in the lead manager’s favor.
In a typical IPO, the vast majority of revenue and profits goes to the bookmanager, as illustrated in Panel C of Table V. The book manager receives atleast a proportionate share of the management fee revenue, the vast major-ity of the selling concession revenue, and part of the net underwriting feerevenue. This last item is typically a small number, and may even be neg-ative if stabilization expenses are high.
There are certain ongoing expenses that lead and co-managers have, suchas the pay of analysts and corporate finance employees, so the revenue figuresare not the same as profit figures. Furthermore, part of the revenue is merelya competitive return on the capital required by regulators to underwritesecurities. But the example in Table V shows how lucrative it can be to be thelead manager on a large IPO. Thus, although the fees are shared among syn-dicate members, there is still fierce competition to be a lead manager.
It is noteworthy that new entrants to the IPO underwriting market havenot tried to gain market share by cutting spreads. The two most prominentnew entrants in IPO underwriting in the 1990s have been Deutsche BankSecurities ~formerly Deutsche Morgan Grenfell ~DMG!! and Friedman Bill-ings Ramsey. Both firms have charged seven percent spreads on moderatesize IPOs in the mid-1990s.
D. The Cost of Price Support
Underwriters frequently stabilize, or support, the price of an IPO immedi-ately after it has gone public. Price support involves the practice of being a netbuyer of shares, which are retired if the underwriter overallocates the issue.If an underwriter buys back too many shares in an attempt to keep the marketprice from dipping below the offer price, it will not be able to exercise the over-allotment option. This would result in less profit for the underwriter. The prob-ability that the overallotment option will be exercised increases when there ishigher expected underpricing. If spreads were lower, underwriters might be
The Seven Percent Solution 1121
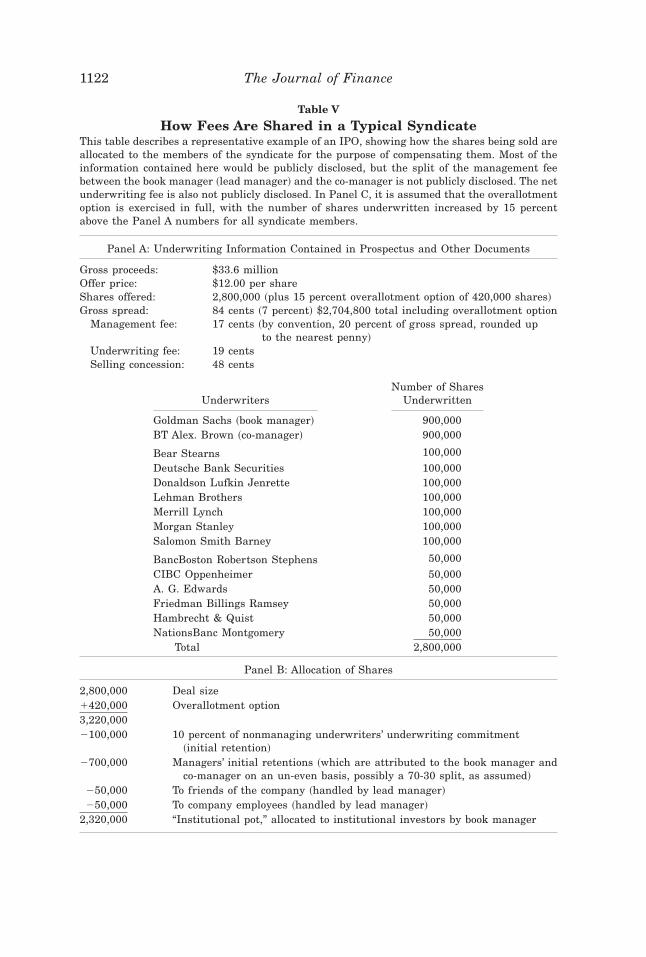
Table V
How Fees Are Shared in a Typical SyndicateThis table describes a representative example of an IPO, showing how the shares being sold areallocated to the members of the syndicate for the purpose of compensating them. Most of theinformation contained here would be publicly disclosed, but the split of the management feebetween the book manager ~lead manager! and the co-manager is not publicly disclosed. The netunderwriting fee is also not publicly disclosed. In Panel C, it is assumed that the overallotmentoption is exercised in full, with the number of shares underwritten increased by 15 percentabove the Panel A numbers for all syndicate members.
Panel A: Underwriting Information Contained in Prospectus and Other Documents
Gross proceeds: $33.6 millionOffer price: $12.00 per shareShares offered: 2,800,000 ~plus 15 percent overallotment option of 420,000 shares!Gross spread: 84 cents ~7 percent! $2,704,800 total including overallotment option
Management fee: 17 cents ~by convention, 20 percent of gross spread, rounded upto the nearest penny!
Underwriting fee: 19 centsSelling concession: 48 cents
UnderwritersNumber of Shares
Underwritten
Goldman Sachs ~book manager! 900,000BT Alex. Brown ~co-manager! 900,000
Bear Stearns 100,000Deutsche Bank Securities 100,000Donaldson Lufkin Jenrette 100,000Lehman Brothers 100,000Merrill Lynch 100,000Morgan Stanley 100,000Salomon Smith Barney 100,000
BancBoston Robertson Stephens 50,000CIBC Oppenheimer 50,000A. G. Edwards 50,000Friedman Billings Ramsey 50,000Hambrecht & Quist 50,000NationsBanc Montgomery 50,000
Total 2,800,000
Panel B: Allocation of Shares
2,800,000 Deal size1420,000 Overallotment option3,220,0002100,000 10 percent of nonmanaging underwriters’ underwriting commitment
~initial retention!
2700,000 Managers’ initial retentions ~which are attributed to the book manager andco-manager on an un-even basis, possibly a 70-30 split, as assumed!
250,000 To friends of the company ~handled by lead manager!
250,000 To company employees ~handled by lead manager!
2,320,000 “Institutional pot,” allocated to institutional investors by book manager
1122 The Journal of Finance
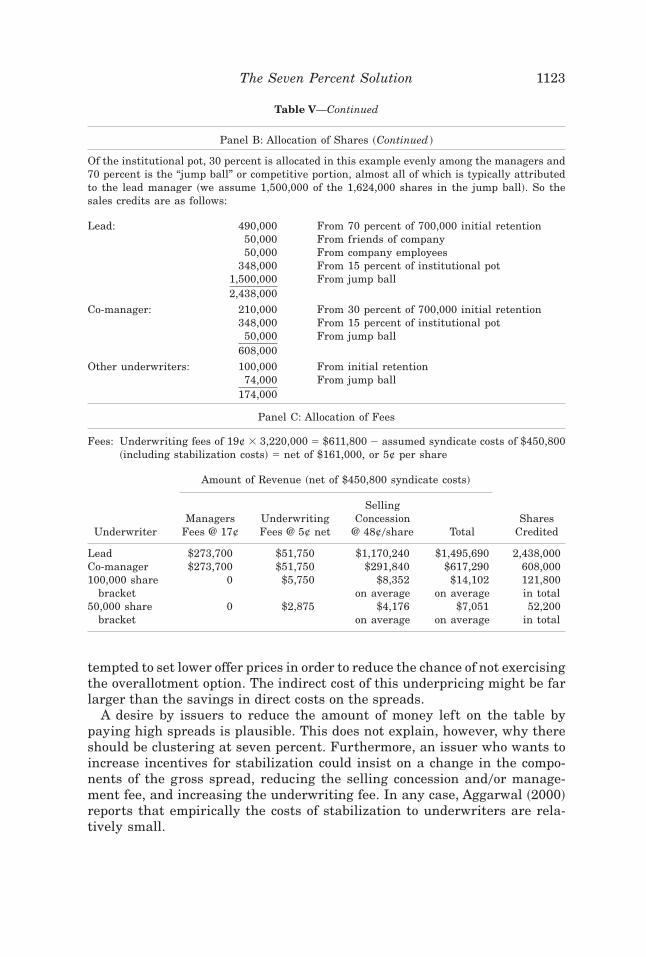
tempted to set lower offer prices in order to reduce the chance of not exercisingthe overallotment option. The indirect cost of this underpricing might be farlarger than the savings in direct costs on the spreads.
A desire by issuers to reduce the amount of money left on the table bypaying high spreads is plausible. This does not explain, however, why thereshould be clustering at seven percent. Furthermore, an issuer who wants toincrease incentives for stabilization could insist on a change in the compo-nents of the gross spread, reducing the selling concession and0or manage-ment fee, and increasing the underwriting fee. In any case, Aggarwal ~2000!reports that empirically the costs of stabilization to underwriters are rela-tively small.
Table V—Continued
Panel B: Allocation of Shares ~Continued !
Of the institutional pot, 30 percent is allocated in this example evenly among the managers and70 percent is the “jump ball” or competitive portion, almost all of which is typically attributedto the lead manager ~we assume 1,500,000 of the 1,624,000 shares in the jump ball!. So thesales credits are as follows:
Lead: 490,000 From 70 percent of 700,000 initial retention50,000 From friends of company50,000 From company employees
348,000 From 15 percent of institutional pot1,500,000 From jump ball2,438,000
Co-manager: 210,000 From 30 percent of 700,000 initial retention348,000 From 15 percent of institutional pot
50,000 From jump ball608,000
Other underwriters: 100,000 From initial retention74,000 From jump ball
174,000
Panel C: Allocation of Fees
Fees: Underwriting fees of 19¢ 3 3,220,000 5 $611,800 2 assumed syndicate costs of $450,800~including stabilization costs! 5 net of $161,000, or 5¢ per share
Amount of Revenue ~net of $450,800 syndicate costs!
UnderwriterManagers
Fees @ 17¢UnderwritingFees @ 5¢ net
SellingConcession
@ 48¢0share TotalShares
Credited
Lead $273,700 $51,750 $1,170,240 $1,495,690 2,438,000Co-manager $273,700 $51,750 $291,840 $617,290 608,000100,000 share 0 $5,750 $8,352 $14,102 121,800
bracket on average on average in total50,000 share 0 $2,875 $4,176 $7,051 52,200
bracket on average on average in total
The Seven Percent Solution 1123

E. Spreads Signal High Quality Underwriting
In many other markets, such as medical specialties, consulting, andlegal advice, professionals find that charging a low price for their ser-vices signals lower quality and results in lost business. This phenomenonis present in markets where clients are unable to easily evaluate qualityon either an ex ante or ex post basis, and where repeat dealings areuncommon. In these markets, sellers of services tend to charge highprices and at least some market participants have excess capacity ~whichthey attempt to hide because its existence might signal low quality!. Anunderwriter charging a low fee might raise concerns about its willing-ness to engage in price stabilization, provide analyst coverage, exercisecare in helping to write a prospectus, aggressively market a deal, and soforth.
IPO underwriting seems to share many of the characteristics of marketswhere price signals quality. But while any given firm will generally go pub-lic just once, limiting repeat business and learning, this is too myopic a view.Reputation effects overcome some of the information asymmetries: If Gold-man Sachs decided to cut its spreads, few issuers would conjecture that ithad become a low-quality underwriter.
III. Explanations for the Clustering of Spreadsat Seven Percent
A. Explicit Collusion
One possible explanation for the clustering of spreads at seven percentis collusion. If underwriters compete for business on the basis of spreadsthat they charge, competition will drive the spread on any given deal tothe cost of providing the services, including compensation for expected risksthat are borne by the underwriter. If underwriters agree to form a cartel,they can increase their profits. On every deal, a mechanism to decide howmuch to charge would be needed. One possible arrangement is to agreeto always charge the same fees ~seven percent!, with the profits shared.The existence of syndicates would seem to be an excellent way to share theprofits.
With literally scores of people involved in setting spreads at different in-vestment banking firms, the ability to explicitly collude and keep it a secretstrains credibility. Legal liability is also a deterrent.10 And though under-writing syndicates could in principle be used for sharing profits, in practicethe lead underwriter grabs the lion’s share of profits.
10 NASD Notice to Members 98-88, issued in October 1998, reminds underwriters that thereis no standard level of underwriter compensation, and that coordination among members on thegross spreads charged is explicitly prohibited. This notice was partly motivated by the patternof clustering at seven percent spreads on IPOs.
1124 The Journal of Finance

B. Strategic Pricing
It is possible that investment bankers are of the opinion that if they com-pete aggressively on the basis of fees, spreads will be driven down to thepoint where there will be little money for year-end bonuses for the individ-uals involved. Thus, the individuals involved may act strategically to avoidturning IPO underwriting into a “commodity business.” Strategic pricingrequires that each underwriter realizes that high spreads result in largeyear-end bonuses that would be jeopardized if spreads get driven down tocompetitive levels due to cutthroat competition. As long as the present valueof the future cash f lows resulting from high spreads is greater than theshort-term gains associated with undercutting the competition to win a deal,each underwriter will avoid cutting its spread.
The logic behind the strategic pricing explanation for high spreads canbe formalized in a noncooperative dynamic game ~Chen ~1998!!, based onthe Dutta and Madhavan ~1997! model. With IPOs, it is quite plau-sible that underwriters fear that quoting a lower spread will set off a pricewar that will drive gross spreads down on future deals. After all, many ofthe individuals in the business that we have talked to state that they donot want to charge a lower spread because they “don’t want to turn it intoa commodity business.” It is hard to think of stronger evidence to supportthe proposition that the participants are thinking strategically. In otherwords, they are forecasting the spreads that will prevail in the future basedon what is done today, and acting accordingly. Thus, each underwriter maydecide to keep its spread above competitive levels, even without explicitcollusion.
The strategic pricing argument also offers an explanation for why thespreads on deals above $80 million are generally lower than seven percent.Since there are economies of scale in the costs of underwriting IPOs, dealsabove $30 or $40 million are for the most part extremely profitable at aseven percent spread. If the profits on a deal are too large, each underwriterhas an incentive to undercut the competition, even if it means jeopardizingall of the future profits from high spreads. In order to forestall a price warfrom breaking out, underwriters must limit the economic profits earned onany given deal to a “reasonable” level ~see Rotemberg and Saloner ~1986!,Dutta and Madhavan ~1997!, and Chen ~1998!!. Beyond a certain level ofproceeds size, spreads of seven percent are unsustainable.
The strategic pricing explanation for high average fees and clustering atseven percent raises the following question: Why, since sellers in every in-dustry prefer high prices to low prices, is a strategic pricing equilibriumsustainable with IPO spreads and not in most other businesses? Our answeris that customers ~issuing firms! view the fees charged as just one of a set ofcharacteristics on which to choose an underwriter. Krigman et al.’s ~1999!survey of issuing firms supports this view. If customers were more focusedon fees, the strategic pricing equilibrium would be harder to sustain relativeto the competitive ~“commodity business”! equilibrium.
The Seven Percent Solution 1125

C. Resolving Agency Costs with Multiple Principals
There are many other markets for intermediary services which displaystrong clustering of fees at integers. Probably the most obvious example isbrokerage commissions on residential real estate; in many cities, most trans-actions are done at 6.0 percent. The real estate market involves both listingagents ~representing sellers! and buying agents. Each property has a vectorof characteristics and different buyers have different tastes, resulting in atime-intensive matching problem. In real estate, agents representing buyersobserve the fees being offered on a property through the multiple listingservice books, and they steer clients away from properties that do not com-pensate the agents well. Because real estate agents are representing multi-ple clients, charging a uniform commission eliminates the incentive of agentsto spend a disproportionately low amount of effort on properties offeringlower commissions ~Williams ~1998!!. Also, there is less homogeneity of realestate percentage fees than it appears. In fact, real estate fees can be nego-tiated in two ways. First, on properties that ex ante appear easy to sell, aseller can get a listing agent to rebate part of the listing fee. Second, whena buyer makes a bid on a property, the seller can respond with a reservationprice ~net of commission! where the difference is too small to give the bro-kers their full commission. Rather than start all over with a new buyer or anew house, the agents can be ex post “squeezed.” In other words, there is ahold-up problem.
There are several important distinctions between the markets for inter-mediaries in real estate and for IPOs. With financial securities, the objectivefunction of both buyers and sellers is dependent primarily on a single attribute,the cash payoffs. So, unlike in real estate, there is not a time-intensive prob-lem of matching desired characteristics. Thus, a uniform commission so thatone client is not favored over another client is not needed with IPOs.
D. Other Components of Compensation
If underwriter compensation is composed of more than just the spread, theclustering of spreads at seven percent may give a misleading view of thedegree of clustering of the total compensation. On small offerings, under-writer warrants, “nonaccountable expense allowances,” and other additionalunderwriter compensation is common. But for deals above $20 million, in-dustry practice is to have the gross spread represent all of the underwriter’scompensation. Inspection of a random sample of prospectuses in 1997 forIPOs with proceeds of $20 to $25 million found no cases of nonaccountableexpense allowances boosting underwriter compensation. It should also benoted that almost all IPOs have a 15 percent overallotment option, so thereis almost no time-series or cross-sectional variation on this dimension.
One dimension on which there is substantial cross-sectional variation, how-ever, is the degree of short-run underpricing. On average, the first-day re-turn on IPOs is 10 to 15 percent ~e.g., see Lee et al. ~1996, Table 4!!, which is
1126 The Journal of Finance
an indirect cost of going public. The first-day returns represent profits toinvestors ~and an opportunity cost to issuers! that are approximately twiceas large as the direct fees received by underwriters. For example, on a $40million IPO with a seven percent spread and a first-day return of 14 percent,the direct fees are $2.8 million, and the money “left on the table” is $5.6million. In this example, investment bankers have $5.6 million in profits tohand out to favored clients, such as clients who are willing to overpay forother services. In unreported regressions, we have examined whether thereis a trade-off between underpricing and spreads. The evidence of a trade-offexisting is fairly weak.
Another form of compensation for the lead underwriter is the profits fromfuture market making activity. Ellis, Michaely, and O’Hara ~2000! reportthat the lead underwriter usually is the most active market maker in thefirst 60 days of post-IPO trading for a sample of 312 Nasdaq-listed IPOsfrom 1996 to 1997. They calculate that the lead underwriter makes moneyon this market making activity, although the numbers are modest relative tothe fees from the gross spread.
There is no regulatory constraint that forces spreads to equal sevenpercent. National Association of Securities Dealers ~NASD! Rule 2710prohibits a member from participating in a public offering with unfairor unreasonable underwriter compensation, where NASD Regulation’sCorporate Financing Department has direct responsibility for the reviewof underwriter compensation. There is no evidence that this rule isa binding constraint for the moderate size and large deals that weanalyze.
E. Resale Price Maintenance
As discussed in Section II, the conventional wisdom is that future analystcoverage is an important consideration for firms going public. Thus, invest-ment bankers are intermediaries who are selling a bundle of services: theIPO underwriting itself, and future analyst coverage. By paying above-competitive underwriting fees, issuing companies induce underwriters to of-fer more analyst coverage in their attempt to compete for the profitablebusiness. The logic is the same as that of the “resale price maintenance”literature, where a producer wants distributors to offer a minimum servicelevel ~Telser ~1960!!. By setting a minimum price at which the products canbe resold, the producer induces the intermediaries to offer more servicesthan they otherwise would.
Although high spreads on average can be viewed as compensation for in-ducing underwriters to provide future analyst coverage, this does not ex-plain why seven percent spreads on $80 million deals are the norm, just asthey are on $20 million deals. The clustering at seven percent for almost alldeals within a very large range of proceeds suggests that the larger andsafer deals are providing substantial economic profits to the underwritersinvolved.
The Seven Percent Solution 1127

Presumably, some issuers would prefer to pay high fees and “purchase” ahigh level of services. Other issuers would prefer fewer services in return forlower fees. But the lack of dispersion of spreads suggests that this choice isnot available to issuers.
F. Cross-Subsidization
One possible reason for the clustering of spreads at seven percent is thatunderwriters have difficulty knowing their exact costs on a given deal, andthey price their services in a manner whereby some issuers subsidize otherissuers. As long as underwriters break even on average, there is little reasonto change this policy. The problem with this argument is that, given theeconomies of scale that exist, it does not take a rocket scientist to realizethat $80 million deals are more profitable than $20 million deals if the per-centage spread is the same on both. An underwriter could increase its prof-itability by concentrating on the larger deals.
IV. Possible Reasons for the Increased Clusteringof Spreads over Time
As shown in Table I and Figure 1, the clustering of spreads has increasedsubstantially in the last decade. This raises the question of why this is so.
One possibility is that, as in almost all markets, learning has occurredover time. In the mid and late 1970s, IPO volume in the United States ~andalmost all other countries! was virtually nonexistent, with the number ofdeals per year less than the number in many weeks during the 1990s. As IPOvolume picked up in the 1980s, four boutiques ~L.F. Rothschild, Unterberg,Towbin; Robertson Stephens; Hambrecht & Quist; and Alex. Brown! special-izing in IPO underwriting captured a large share of a growing market. Inthe early 1980s, “bulge bracket” investment bankers such as Goldman Sa-chs, Morgan Stanley, and Merrill Lynch did relatively few IPOs. By the mid-1980s, the bulge bracket firms started to get more involved, and L.F. Rothschildwent out of business after a falloff in IPO volume following the 1987 marketcrash.
In the 1980s, there was more heterogeneity of spreads, less concentrationof underwriters, and a higher frequency of sole managers. The average spreadon IPOs has not changed, even as clustering has increased, but this is notevidence that spreads are at competitive levels today. In many related mar-kets, such as the fees on mergers and acquisitions, investment banker feeshave fallen from the mid-1980s to the mid-1990s. Auditor fees have declined,too. The fact that IPO spreads have not fallen is consistent with the exis-tence of a market structure that is conducive to strategic pricing.
Several other reasons may explain the increased clustering over time. First,precedent is important. It is easier to justify a given spread to a client if anunderwriter can point to other recent deals at the same ~or a higher! spread.Charging a higher than seven percent spread might have become increasingly
1128 The Journal of Finance
unattractive as competitors used it to dissuade a potential client from goingwith an expensive underwriter. Also, in the 1980s it may have been morecommon to negotiate the spread at the pricing meeting immediately beforean offering, at the same time that the offering price and number of shares tobe issued are negotiated. ~See Uttal ~1986! for a description of the negotia-tion of the spread in the Microsoft IPO.!
V. Summary and Conclusions
This article presents evidence of the clustering of gross spreads on IPOs atseven percent, with the concentration of seven percent spreads increasingduring the 1990s. For offerings with proceeds of $20 to 80 million ~in dollarsof 1997 purchasing power!, more than 90 percent of IPOs during the 1995 to1998 period had spreads of exactly seven percent. For comparison, only 26percent of moderate size IPOs in the 1985 to 1987 period had seven percentspreads. There is widespread agreement that fixed costs exist in underwrit-ing IPOs, yet investment bankers charge the same seven percent spread on$20 million deals as they do on $80 million deals. The average spread onIPOs has remained virtually constant during the 1985 to 1998 period, incontrast to declining fees for mergers and acquisitions, etc. Spreads on U.S.IPOs are roughly twice as high as in other countries.
We argue that for most IPOs with gross proceeds larger than $30 million,spreads are above competitive levels in the United States. The high averagespread and the concentration of spreads at seven percent is consistent withstrategic pricing on the part of investment bankers. In other words, eventhough investment bankers are acting independently, average spreads areabove competitive levels. We argue that several features of the IPO under-writing market are conducive to spreads above competitive levels. The im-portance of analyst coverage and buy recommendations, and the perceivedimportance of underwriter prestige, facilitate high spreads.
If gross spreads are above competitive levels, investment bankers have anincentive to use nonprice competition to attract deals. Although issuing firmsface high and, for moderate size deals, nonnegotiable spreads, issuers canstill bargain on another dimension. In particular, by insisting on additionalco-managers, issuing firms receive more extensive analyst coverage. We showthat the number of co-managers has increased over the last decade, and thatan additional co-manager adds between 0.36 and 0.55 net analysts followingthe stock. Highly ranked analysts have benefited, as their compensation hasbeen bid up as underwriters use the implicit promise of favorable coverageand buy recommendations to compete for business. Investment bankers arealso able to use analyst coverage as a means for product differentiation,relaxing price competition.
There is a further aspect to industry specialization by analysts that isrelevant. To the degree that the only underwriters that would be viable com-petitors are those with a well-regarded analyst, an investment banker thatundercuts spreads on IPOs in one industry cannot expect to gain market
The Seven Percent Solution 1129
share in IPOs from other industries. To the degree that the broader marketis split into submarkets, the gains from undercutting the spread for an un-derwriter are limited to the submarket, increasing the sustainable spread~see Dutta and Madhavan ~1997!!. In this respect, industry specialization byinvestment bankers is analogous to payment for order f low on Nasdaq stocks.
We favor a strategic pricing explanation for the patterns that we havedocumented. The evidence is consistent with underwriters realizing that ifone investment banker tries to win business by cutting spreads, the under-writing industry is likely to move to an equilibrium with low spreads, andlower compensation for corporate finance employees.
In contrast to the pattern for IPOs, there is little clustering of spreads onfollow-on offerings, and economies of scale are evident for all proceeds sizes.The difference in findings for IPOs and SEOs suggests that investment bank-ers and analysts are more important in establishing a public market than insustaining one.
There is some evidence that gross spreads on follow-on offerings have comedown a little in recent years ~see Beatty, Thompson, and Vetsuypens ~1998!and Gande, Puri, and Saunders ~1999!!. Trade journals have attributed thisto competition from commercial banks, which are trying to enter the under-writing business. It remains to be seen how big an impact this is having onthe gross spreads on follow-on offerings, and whether this competition hasany effect on the gross spreads on IPOs. In the year after Nationsbank,Bankers Trust, BankAmerica, and BancBoston bought investment bankingfirms that specialized in IPOs, there does not seem to have been any impactin the IPO market. Another source of competition may emerge from theinnovation of internet technology. For example, new underwriters W.R. Ham-brecht and E*Offering threaten to undercut the seven percent fee that isnow standard. Only time will tell whether this changes the gross spreadsthat prevail in the IPO underwriting industry.
REFERENCES
Aggarwal, Reena, 2000, Stabilization activities by underwriters after new offerings, Journal ofFinance 55, 1075–1103.
Allen, Jeffrey W., 1998, Capital markets and corporate structure: The equity carveouts of ThermoElectron, Journal of Financial Economics 48, 99–124.
Altinkilic, Oya, and Robert S. Hansen, 2000, Are there economies of scale in underwriting fees?Evidence of rising external financing costs, Review of Financial Studies, forthcoming.
Barry, Christopher, Chris Muscarella, and Michael Vetsuypens, 1991, Underwriter warrants,underwriter compensation, and the costs of going public, Journal of Financial Economics29, 113–135.
Beatty, Randolph P., and Jay R. Ritter, 1986, Investment banking, reputation, and the under-pricing of initial public offerings, Journal of Financial Economics 15, 213–232.
Beatty, Randolph P., Rex Thompson, and Michael Vetsuypens, 1998, Issuance costs and regu-latory change in the investment banking industry, Working paper, Southern MethodistUniversity.
Beatty, Randolph P., and Ivo Welch, 1996, Issuer expenses and legal liability in initial publicofferings, Journal of Law and Economics 39, 545–602.
1130 The Journal of Finance

Booth, James, and Richard Smith, 1986, Capital raising, underwriting, and the certificationhypothesis, Journal of Financial Economics 15, 261–281.
Carter, Richard B., Frederick H. Dark, and Ajai K. Singh, 1998, Underwriter reputation, initialreturns, and the long-run underperformance of IPO stocks, Journal of Finance 53, 285–311.
Chen, Hsuan-Chi, 1998, Competition and collusion in the IPO market, Working paper, Univer-sity of Florida.
Christie, William G., and Paul H. Schultz, 1994, Why do NASDAQ market makers avoid odd-eighth quotes? Journal of Finance 49, 1813–1840.
Dunbar, Craig C., 2000, Factors affecting investment bank initial public offering market share,Journal of Financial Economics 55, 3–41.
Dutta, Prajit, and Ananth Madhavan, 1997, Competition and collusion in dealer markets, Jour-nal of Finance 52, 245–276.
The Economist, 1998, Overcharging underwriters, June 27.Ellis, Katrina, Roni Michaely, and Maureen O’Hara, 2000, When the underwriter is the market
maker: An examination of trading in the IPO aftermarket, Journal of Finance 55, 1039–1074.
Fama, Eugene F., and James MacBeth, 1973, Risk, return, and equilibrium: Empirical tests,Journal of Political Economy 81, 607–636.
Gande, Amar, Manju Puri, and Anthony Saunders, 1999, Bank entry, competition, and themarket for corporate securities underwriting, Journal of Financial Economics 54, 165–195.
Kahn, Charles, George Pennacchi, and Ben Sopranzetti, 1999, Bank deposit rate clustering:Theory and empirical evidence, Journal of Finance 54, 2185–2214.
Krigman, Laurie, Wayne Shaw, and Kent L. Womack, 1999, Why do firms switch underwriters?Journal of Financial Economics, forthcoming.
Lee, Inmoo, Scott Lochhead, Jay Ritter, and Quanshui Zhao, 1996, The costs of raising capital,Journal of Financial Research 19, 59–74.
Lowenstein, Roger, 1997, Street’s incredible unshrinking spread, Wall Street Journal, April 10,C1.
Michaely, Roni and Kent Womack, 1999, Conf lict of interest and the credibility of underwriteranalyst recommendations, Review of Financial Studies 12, 653–686.
National Association of Securities Dealers, 1998, Notice to Members 98-88.Power, William, 1993, Why hot, new stocks get booster shots, Wall Street Journal, Febru-
ary 10, C1.Raghavan, Anita, 1997, How one top analyst vaults “Chinese Wall” to do deals for firm, Wall
Street Journal, March 25, A1.Rajan, Raghuram, and Henri Servaes, 1997, Analyst following of initial public offerings, Jour-
nal of Finance 52, 507–529.Rotemberg, Julio, and Garth Saloner, 1986, A supergame-theoretical model of price wars during
booms, American Economic Review 76, 390–407.Siconolfi, Michael, 1992, At Morgan Stanley, analysts were urged to soften harsh views, Wall
Street Journal, July 14, A1.Smith, Randall, 1996, Firms vie for spot in AT&T’s huge IPO, Wall Street Journal, Febru-
ary 1, C1.Telser, Lester G., 1960, Why should manufacturers want fair trade? Journal of Law and Eco-
nomics 3, 86–105.Uttal, Bro, 1986, Inside the deal that made Bill Gates $350,000,000, Fortune ~July 21, 1986!,
343–361.White, Halbert, 1980, A heteroskedasticity consistent covariance matrix estimator and a direct
test for heteroskedasticity, Econometrica 48, 817–838.Williams, Joseph T., 1998, Agency and brokerage of real assets in competitive equilibrium,
Review of Financial Studies 11, 239–280.Woo, Li-Anne, 1999, Primary equity formation in Australia, Working paper, University of New
South Wales.
The Seven Percent Solution 1131

1132