Embed Size (px)
Citation preview
Korean J Radiol 12(4), Jul/Aug 2011 kjronline.org456
The Serum CA-125 Concentration Data Assists in Evaluating CT Imaging Information When Used to Differentiate Borderline Ovarian Tumor from Malignant Epithelial Ovarian TumorsJi-Eun Shin, MD, Hyuck Jae Choi, MD, Mi-hyun Kim, MD, Kyoung-Sik Cho, MDAll authors: Department of Radiology and the Research Institute of Radiology, University of Ulsan College of Medicine, Asan Medical Center, Seoul 138-736, Korea
Objective: We wanted to evaluate the diagnostic value of serum CA-125 concentration, when used in combination with the preoperative contrast-enhanced CT results, to differentiate borderline ovarian tumors (BOTs) from stage I malignant epithelial ovarian tumors (MEOTs). Materials and Methods: Ninety-eight masses (46 BOTs and 52 stage I MEOTs) from 87 consecutive patients (49 with BOTs and 38 with stage I MEOTs) who had undergone preoperative contrast-enhanced computed tomography (CT) and surgical staging were evaluated retrospectively and independently by two radiologists. The preoperative serum CA-125 concentration was measured in all patients. The utility of analyzing serum CA-125 concentration in combination with the CT results was evaluated by receiver operating characteristic (ROC) curve analysis.Results: An irregular tumor surface and lymphadenopathy were predictive of a MEOT. ROC analysis showed that the combination of CT data and the serum CA-125 level resulted in a higher diagnostic performance than did using the CT alone for differentiating BOTs from MEOTs. The areas under the curves (AUCs) without and with the use of the serum CA-125 level data were 0.67 (95% confidence interval [CI]: 0.57-0.77) and 0.78 (95% CI: 0.68-0.85), respectively, for reader 1 (p = 0.029) and 0.71 (95% CI: 0.61-0.80) and 0.81 (95% CI: 0.72-0.89), respectively, for reader 2 (p = 0.009).Conclusion: The serum CA-125 concentration is of additional diagnostic value when used in conjunction with the CT imaging results for differentiating BOTs from MEOTs.Index terms: CT; Borderline ovarian tumor; Malignant ovarian tumor; CA-125
Received December 1, 2010; accepted after revision March 9, 2011.This study was supported by a grant (A090698) of the Korean Healthcare technology R&D Project, Ministry for Health, Welfare & Family Affairs, Republic of Korea.This study was supported by a grant (2009-056) from the Asan Institute of Life Sciences.Corresponding author: Hyuck Jae Choi, MD, Department of Radiology and the Research Institute of Radiology, University of Ulsan College of Medicine, Asan Medical Center, 86 Asanbyeongwon-gil, Songpa-gu, Seoul 138-736, Korea.• Tel: (822) 3010-5686 • Fax: (822) 476-4719• E-mail: [email protected] is an Open Access article distributed under the terms of the Creative Commons Attribution Non-Commercial License (http://creativecommons.org/licenses/by-nc/3.0) which permits unrestricted non-commercial use, distribution, and reproduction in any medium, provided the original work is properly cited.
Original ArticleDOI: 10.3348/kjr.2011.12.4.456pISSN 1229-6929 · eISSN 2005-8330Korean J Radiol 2011;12(4):456-462
INTRODUCTION
Borderline ovarian tumors (BOTs) are semi-malignant ovarian tumors with a more indolent clinical course than is shown by malignant epithelial ovarian tumors (MEOTs) (1). Unlike MEOTs, BOTs commonly affect women in their fourth decade and they tend to be localized in the ovary at the initial presentation, and this results in an excellent prognosis (2, 3). The principal treatment for BOTs is surgical resection of the primary tumors without adjuvant therapy (4), and the younger patients who desire to maintain ovarian function often receive unilateral oophorectomy (4). In contrast, the primary surgical treatment for MEOTs is total abdominal hysterectomy, bilateral salpingo-oophorectomy and thorough surgical staging (5), followed

Korean J Radiol 12(4), Jul/Aug 2011kjronline.org 457
CA-125 and CT for Distinguishing Borderline from Malignant Epithelial Ovarian Tumors
by adjuvant chemotherapy (6). Thus, the accurate preoperative differentiation of BOTs from MEOTs is important for determining the treatment methods for individual patients.
CT has been extensively used for making the preoperative diagnosis of ovarian cancer patients. Although several reports have evaluated the ability of CT to differentiate BOTs from MEOTs (7-11), those studies found that imaging alone could not easily distinguish between these two types of tumor. In one randomized, multicenter prospective study involving 1,066 patients, the serum concentration of CA-125 was lower in the patients with BOTs than that in the patients with MEOTs (12). Although these findings suggested that addition of CA-125 measurements to the CT results could improve the differentiation of BOTs from MEOTs, to the best of our knowledge, there have been no studies that have assessed the additional diagnostic value of the CA-125 level. We investigated the utility of this parameter, used in conjunction with CT imaging, for differentiating BOTs from MEOTs.
MATERIALS AND METHODS
Study PopulationThis retrospective analysis involved 98 masses (46 BOTs
and 52 stage I MEOTs) in 87 consecutive patients with histologically confirmed BOTs (n = 43; mean age, 52 years; range, 14 to 79 years) and surgically confirmed FIGO stage I MEOTs (n = 44; mean age, 52 years; range, 27 to 73 years) and all patients were recruited between January 2001 and March 2008. None of these patients had any contraindications to surgery and all of them had Eastern Cooperative Oncology Group performance scores of 0-1.
CT TechniqueAll patients underwent CT using a single-channel detector
helical CT scanner (Somatom Plus-S, Siemens, Germany) from the diaphragm to the symphysis pubis, with a beam collimation of 5 mm or 7 mm, a pitch of 1.5 or 1.7, and an image reconstruction increment of 5 mm. Approximately 600-900 ml of contrast material (2% barium sulfate suspension, E-Z-CAT; E-Z-Em, Westbury, NY) was orally administered to each patient 30-40 min before scanning. Starting approximately 120 sec before scanning, all patients were intravenously given 100-120 ml of a second contrast medium (iopromide, Ultravist 300, Schering, Berlin, Germany) at a rate of 3.0 ml/sec.
Analysis and StatisticsThe CT images were retrospectively and independently
interpreted by two radiologists with nine years and one year of clinical experience, respectively, in gynecologic imaging, including CT imaging. Both readers were informed of the patients’ medical history in that they were aware that all patients had undergone surgery for ovarian tumors (BOTs or MEOTs), but both were blinded to the pathologic results and the serum CA-125 concentrations. The serum CA-125 level was measured after the CT scan within two weeks (range, 3-31 days). The serum CA-125 level was analyzed in a gamma counter (Cobra II; Packard, Meriden, CT). The assessed imaging features included the presence of ascites, pleural effusion, peritoneal implantation, enlarged lymph nodes (short axis diameter ≥ 1 cm), the character of the mass (cystic, mainly [> 2 of 3] cystic or mainly [> 2 of 3] solid, and a smooth or irregular appearance of the surface) and the mass size (13-17).
The CT images were visually interpreted using a 5-point grading system: 0 = BOT, 1 = probably BOT, 2 = indeterminate, 3 = probably malignant, 4 = malignant. Each reader initially evaluated the CT images alone, followed 3 month later by a combined evaluation of the CT images and the CA-125 concentrations.
The degree of agreement between the two readers was measured using k statistics. The parameters of the combined CT and serum CA-125 level for differentiating BOTs from stage I MEOTs were obtained with the probability from the bivariate multiple logistic regression analysis. The probability estimation is primarily aimed at establishing conditions under which the true correlation structure may remain unknown; in such an analysis, standardized and non-standardized coefficients are obtained using logistic regression analysis. The utility of adding the serum CA-125 concentration data to the CT findings was evaluated by means of receiver operating characteristic (ROC) curve analysis and measurement of the interobserver agreement. The analysis was performed using STATA (version 9.2; Stata Corp, TX). A p value < 0.05 was considered statistically significant.
RESULTS
Detailed histologic analyses of the 98 ovarian masses showed that 37 were serous adenocarcinomas, nine were mucinous adenocarcinomas, 21 were serous BOTs and 31 were mucinous BOTs. The mean serum CA-125 concentration
Korean J Radiol 12(4), Jul/Aug 2011 kjronline.org458
Shin et al.
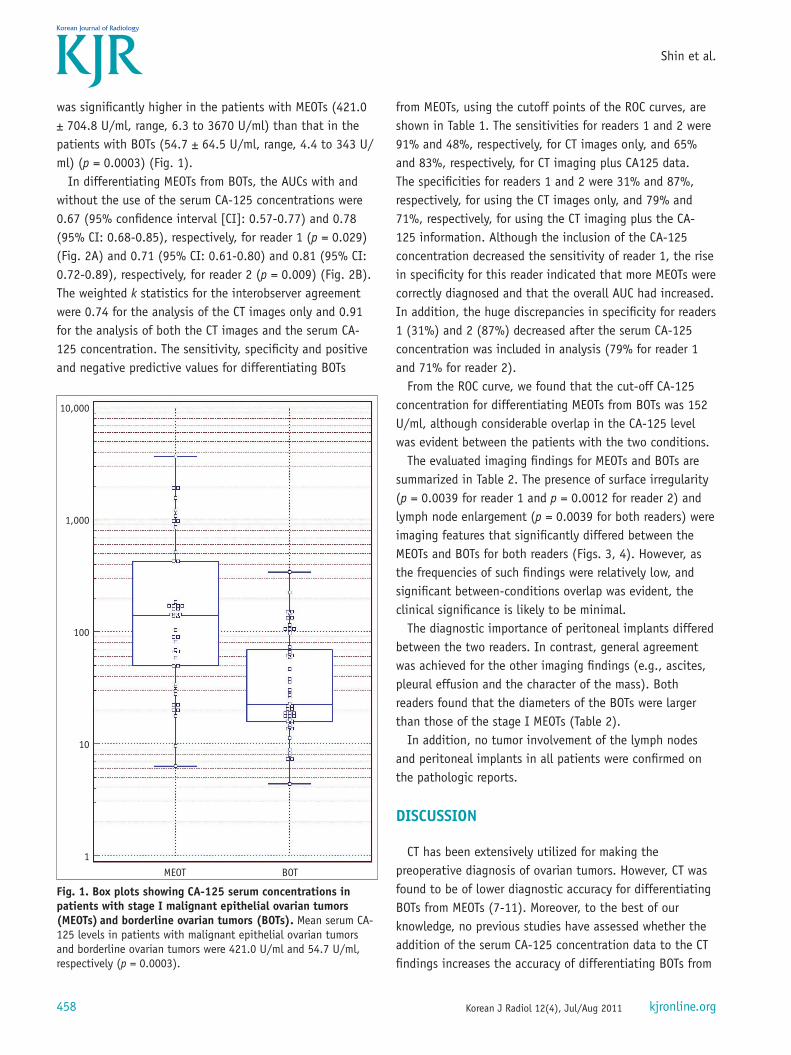
was significantly higher in the patients with MEOTs (421.0 ± 704.8 U/ml, range, 6.3 to 3670 U/ml) than that in the patients with BOTs (54.7 ± 64.5 U/ml, range, 4.4 to 343 U/ml) (p = 0.0003) (Fig. 1).
In differentiating MEOTs from BOTs, the AUCs with and without the use of the serum CA-125 concentrations were 0.67 (95% confidence interval [CI]: 0.57-0.77) and 0.78 (95% CI: 0.68-0.85), respectively, for reader 1 (p = 0.029) (Fig. 2A) and 0.71 (95% CI: 0.61-0.80) and 0.81 (95% CI: 0.72-0.89), respectively, for reader 2 (p = 0.009) (Fig. 2B). The weighted k statistics for the interobserver agreement were 0.74 for the analysis of the CT images only and 0.91 for the analysis of both the CT images and the serum CA-125 concentration. The sensitivity, specificity and positive and negative predictive values for differentiating BOTs
from MEOTs, using the cutoff points of the ROC curves, are shown in Table 1. The sensitivities for readers 1 and 2 were 91% and 48%, respectively, for CT images only, and 65% and 83%, respectively, for CT imaging plus CA125 data. The specificities for readers 1 and 2 were 31% and 87%, respectively, for using the CT images only, and 79% and 71%, respectively, for using the CT imaging plus the CA-125 information. Although the inclusion of the CA-125 concentration decreased the sensitivity of reader 1, the rise in specificity for this reader indicated that more MEOTs were correctly diagnosed and that the overall AUC had increased. In addition, the huge discrepancies in specificity for readers 1 (31%) and 2 (87%) decreased after the serum CA-125 concentration was included in analysis (79% for reader 1 and 71% for reader 2).
From the ROC curve, we found that the cut-off CA-125 concentration for differentiating MEOTs from BOTs was 152 U/ml, although considerable overlap in the CA-125 level was evident between the patients with the two conditions.
The evaluated imaging findings for MEOTs and BOTs are summarized in Table 2. The presence of surface irregularity (p = 0.0039 for reader 1 and p = 0.0012 for reader 2) and lymph node enlargement (p = 0.0039 for both readers) were imaging features that significantly differed between the MEOTs and BOTs for both readers (Figs. 3, 4). However, as the frequencies of such findings were relatively low, and significant between-conditions overlap was evident, the clinical significance is likely to be minimal.
The diagnostic importance of peritoneal implants differed between the two readers. In contrast, general agreement was achieved for the other imaging findings (e.g., ascites, pleural effusion and the character of the mass). Both readers found that the diameters of the BOTs were larger than those of the stage I MEOTs (Table 2).
In addition, no tumor involvement of the lymph nodes and peritoneal implants in all patients were confirmed on the pathologic reports.
DISCUSSION
CT has been extensively utilized for making the preoperative diagnosis of ovarian tumors. However, CT was found to be of lower diagnostic accuracy for differentiating BOTs from MEOTs (7-11). Moreover, to the best of our knowledge, no previous studies have assessed whether the addition of the serum CA-125 concentration data to the CT findings increases the accuracy of differentiating BOTs from
Fig. 1. Box plots showing CA-125 serum concentrations in patients with stage I malignant epithelial ovarian tumors (MEOTs) and borderline ovarian tumors (BOTs). Mean serum CA-125 levels in patients with malignant epithelial ovarian tumors and borderline ovarian tumors were 421.0 U/ml and 54.7 U/ml, respectively (p = 0.0003).
10,000
1,000
100
10
1
MEOT BOT

Korean J Radiol 12(4), Jul/Aug 2011kjronline.org 459
CA-125 and CT for Distinguishing Borderline from Malignant Epithelial Ovarian Tumors
MEOTs, relative to the use of the CT information alone. Elevated serum concentrations of glycoprotein CA-125,
up to ≥ 30 U/ml, are considered to indicate the presence of a malignant ovarian tumor (18, 19). However, the serum CA-125 level alone cannot differentiate between benign and malignant tumors. For example, high serum CA-125 concentrations have been observed in some patients with benign ovarian masses, as well as in patients with endometriosis, tubo-ovarian abscesses and fibromas, and all of which irritate the peritoneal surface (12). In addition, some patients with ovarian tumors, including BOTs, can have low serum CA-125 concentrations. For these reasons, the serum CA-125 level alone can be of low diagnostic accuracy when used to differentiate between benign and
malignant ovarian masses. However, in patients with primary, invasive, ovarian tumors and who have higher serum CA-125 concentrations than do those patients with borderline ovarian tumors, the CA-125 level may be useful for differentiating between BOTs and MEOTs (12).
We found that the addition of the serum CA-125 concentration data to the CT imaging information increased the accuracy of differentiating BOTs from MEOTs. The mean serum CA-125 concentrations in the patients with BOTs and MEOTs were 54.7 U/ml and 421 U/ml, respectively (p = 0.0003). We also found that the inter-observer agreement was higher when the serum CA-125 data were added to the CT image results (k = 0.91) than when the CT images alone were evaluated (k = 0.74).
The sensitivities afforded by CT imaging alone, as assessed by the two readers, were 91% and 48%, and the specificities were 31% and 87%, respectively. Although inclusion of the CA-125 concentration data decreased the sensitivity for reader 1, the specificity rose, indicating that more MEOTs were correctly diagnosed and that the overall AUC had increased. In addition, the huge discrepancy in the specificity between the two readers fell when the serum CA-125 data was included.
Our findings indicate that evaluation of patients using a combination of the CT data and the CA-125 concentration results in more reproducible and accurate differentiation of BOTs from MEOTs. Thus, the serum CA-125 concentration should be used to assist the differentiation of patients with
Fig. 2. Receiver operating characteristic curve analyses showing additional utility of CA-125 concentration data for differentiating between borderline ovarian tumors and stage I malignant epithelial ovarian tumors. Dotted lines = diagnoses performed using both CT images and serum CA-125 concentrations. Solid lines = diagnoses made by CT imaging alone. A. Areas under curve for reader 1 were 0.71 and 0.81 before and after addition of serum CA-125 concentration data, respectively, to diagnoses obtained using CT imaging (p = 0.009). B. Areas under curve for reader 2 were 0.67 and 0.78 before and after addition of serum CA-125 concentration data, respectively, to diagnoses obtained using CT imaging (p = 0.029). *Reader 1_ pre = diagnoses using CT images only, reader 1 _ post = diagnoses using CT images and CA-125 concentration data, reader 2_ pre = diagnoses by CT images only, reader 2 _ post = diagnoses by CT images and CA-125 concentrations
100-Specificity0 40 80
Sens
itiv
ity
100
80
60
40
20
0
reader1_prereader1_post
reader2_prereader2_post
100-Specificity0 40 80
Sens
itiv
ity
100
80
60
40
20
0
A B
Table 1. Accuracy of CT Imaging, and Combined CT Data and Serum CA-125 Concentration, for Differentiating Stage I Malignant Epithelial Ovarian Tumors from Borderline Ovarian Tumors
Condition Sensitivity (95% CI) Specificity (95% CI)
Reader 1
CT* 91 (79-98) 31 (19-45)
CT & CA-125** 65 (50-79) 79 (65-89)
Reader 2
CT* 48 (33-63) 87 (74-94)
CT & CA-125** 83 (69-92) 71 (57-83)
Note.— *CT imaging only, **CT imaging combined with serum CA-125 level. CI = confidence interval
Korean J Radiol 12(4), Jul/Aug 2011 kjronline.org460
Shin et al.
ovarian masses.We also found that the presence of surface irregularities
and lymph node enlargement were specific features indicative of MEOTs. However, the percentages of masses with surface irregularities (15% for reader 1 and 24% for reader 2) and enlarged lymph nodes (7% for both readers) were relatively low, with significant overlaps between the MEOTs and BOTs; thus, these features are unlikely to be of useful clinical significance. Both readers found that the BOTs were significantly larger than the MEOTs, but the size
range substantially overlapped, and we were unable to determine a cutoff value. Reader 1 found that peritoneal implants were more frequent for the MEOTs than for the BOTs (p = 0.0007), but reader 2 disagreed (p = 0.3388). Moreover, peritoneal implants were rarely found on the CT images (20% for reader 1 and 15% for reader 2). Together, these findings indicate that the peritoneal implant status could not be used to differentiate between BOTs and MEOTs
Our study had several limitations. First, our study had a retrospective design and all included patient underwent
Table 2. Imaging Features of Stage I Malignant Epithelial Ovarian Tumors and Borderline Ovarian TumorsReader 1
PReader 2
PBOT MEOT BOT MEOT
Ascites 5 (10) 5 (11) 1.0000 10 (19) 7 (15) 0.7900Pleural effusion 0 (0) 0 (0) 1.0000 1 (2) 0 (0) 1.0000Peritoneal implant 0 (0) 9 (20) 0.0007 4 (8) 7 (15) 0.3388Enlarged lymph node 0 (0) 7 (15) 0.0039 0 (0) 7 (15) 0.0039Mass character 0.4945 0.1583
Cystic 29 (56) 7 (15) 8 (15) 2 (4)Mainly cystic 21 (38) 26 (57) 40 (77) 29 (63)Mainly solid 2 (4) 11 (24) 3 (6) 11 (24)Solid 0 (0) 2 (4) 0 (0) 4 (9)
Surface appearance 0.0039 0.0012Smooth 52 (100) 39 (85) 51 (98) 35 (76)Irregular 0 (0) 7 (15) 1 (2) 11 (24)
Diameter 12.6 cm (2-31)* 8.9 cm (8-20) 0.0017 13.2 cm (2-30) 9.2 cm (0.5-24) 0.0012Total 52 46 52 46Note.— Numbers in parentheses are percentages. *Mean (range). BOT = borderline ovarian tumor, MEOT = FIGO stage I malignant epithelial ovarian tumor
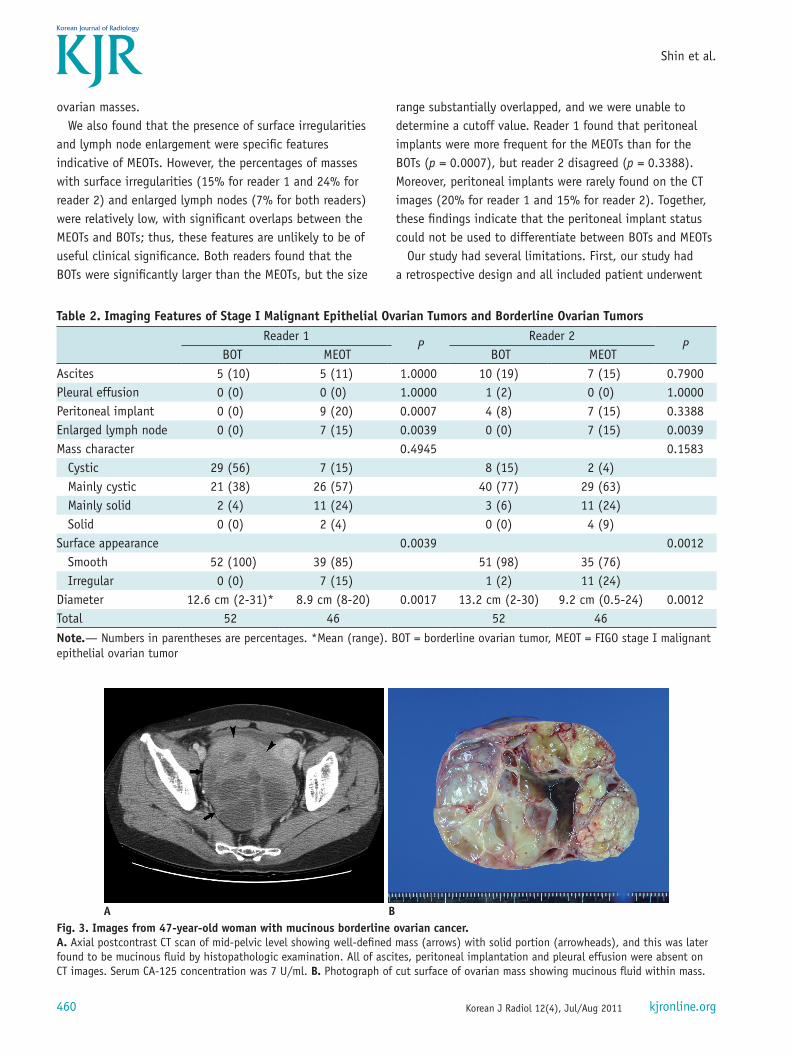
A BFig. 3. Images from 47-year-old woman with mucinous borderline ovarian cancer. A. Axial postcontrast CT scan of mid-pelvic level showing well-defined mass (arrows) with solid portion (arrowheads), and this was later found to be mucinous fluid by histopathologic examination. All of ascites, peritoneal implantation and pleural effusion were absent on CT images. Serum CA-125 concentration was 7 U/ml. B. Photograph of cut surface of ovarian mass showing mucinous fluid within mass.

Korean J Radiol 12(4), Jul/Aug 2011kjronline.org 461
CA-125 and CT for Distinguishing Borderline from Malignant Epithelial Ovarian Tumors
preoperative CT scanning. Considering that CT scans are usually done for the characterization or further evaluation of ovarian masses, there could be selection bias in our study population. Second, we did not use objective grading standards for the CT results or the CA-125 levels. Third, we currently do not have an objective method to solve the substantial overlap between the serum CA-125 level and CT imaging findings, as is observed clinically, and this indicates the need for further investigation.
In conclusion, the addition of the serum CA-125 concentration data to the CT imaging results was of significant diagnostic value for differentiating BOTs from MEOTs.
REFERENCES
1. Jones MB. Borderline ovarian tumors: current concepts for prognostic factors and clinical management. Clin Obstet Gynecol 2006;49:517-525
2. Bell DA, Longacre TA, Prat J, Kohn EC, Soslow RA, Ellenson LH, et al. Serous borderline (low malignant potential, atypical proliferative) ovarian tumors: workshop perspectives. Hum Pathol 2004;35:934-948
3. Tinelli R, Tinelli A, Tinelli FG, Cicinelli E, Malvasi A. Conservative surgery for borderline ovarian tumors: a review. Gynecol Oncol 2006;100:185-191
4. Cadron I, Leunen K, Van Gorp T, Amant F, Neven P, Vergote I. Management of borderline ovarian neoplasms. J Clin Oncol 2007;25:2928-2937
5. Holschneider CH, Berek JS. Valvar cancer. In: Berek JS, Novak E, eds. Berek & Novak’s gynecology, 14th ed. Philadelphia: Lippincott Williams & Wilkins, 2007:1549-1580
6. Pignata S, Cannella L, Leopardo D, Pisano C, Bruni GS,
Facchini G. Chemotherapy in epithelial ovarian cancer. Cancer Lett 2011;303:73-83
7. Buy JN, Ghossain MA, Sciot C, Bazot M, Guinet C, Prevot S, et al. Epithelial tumors of the ovary: CT findings and correlation with US. Radiology 1991;178:811-818
8. Dobson M, Carrington BM, Radford JA, Buckley CH, Crowther D. The role of computed tomography in the management of ovarian tumours of borderline malignancy. Clin Radiol 1997;52:280-283
9. Grab D, Flock F, Stohr I, Nussle K, Rieber A, Fenchel S, et al. Classification of asymptomatic adnexal masses by ultrasound, magnetic resonance imaging, and positron emission tomography. Gynecol Oncol 2000;77:454-459
10. Rieber A, Nussle K, Stohr I, Grab D, Fenchel S, Kreienberg R, et al. Preoperative diagnosis of ovarian tumors with MR imaging: comparison with transvaginal sonography, positron emission tomography, and histologic findings. AJR Am J Roentgenol 2001;177:123-129
11. deSouza NM, O’Neill R, McIndoe GA, Dina R, Soutter WP. Borderline tumors of the ovary: CT and MRI features and tumor markers in differentiation from stage I disease. AJR Am J Roentgenol 2005;184:999-1003
12. Van Calster B, Timmerman D, Bourne T, Testa AC, Van Holsbeke C, Domali E, et al. Discrimination between benign and malignant adnexal masses by specialist ultrasound examination versus serum CA-125. J Natl Cancer Inst 2007;99:1706-1714
13. Zhang J, Mironov S, Hricak H, Ishill NM, Moskowitz CS, Soslow RA, et al. Characterization of adnexal masses using feature analysis at contrast-enhanced helical computed tomography. J Comput Assist Tomogr 2008;32:533-540
14. Brown DL, Zou KH, Tempany CM, Frates MC, Silverman SG, McNeil BJ, et al. Primary versus secondary ovarian malignancy: imaging findings of adnexal masses in the Radiology Diagnostic Oncology Group Study. Radiology 2001;219:213-218
A BFig. 4. 44-year-old woman with FIGO stage I ovarian serous cystadenocarcinoma. A. Axial postcontrast CT scan of mid-pelvic level showing well-defined cystic mass (arrow). No ascites, peritoneal implant or pleural effusion was evident on CT images. Serum CA-125 concentration was 263 U/ml. B. Photograph of cut surface of ovarian mass showing solid and cystic characteristics, with hemorrhagic serous fluid in cystic portion.

Korean J Radiol 12(4), Jul/Aug 2011 kjronline.org462
Shin et al.
15. Choi HJ, Lee JH, Kang S, Seo SS, Choi JI, Lee S, et al. Contrast-enhanced CT for differentiation of ovarian metastasis from gastrointestinal tract cancer: stomach cancer versus colon cancer. AJR Am J Roentgenol 2006;187:741-745
16. Jang YJ, Kim JK, Park SB, Cho KS. Variable CT findings of epithelial origin ovarian carcinoma according to the degree of histologic differentiation. Korean J Radiol 2007;8:120-126
17. Jung DC, Kim SH. MR imaging findings of ovarian cystadenofibroma and cystadenocarcinofibroma: clues for the differential diagnosis. Korean J Radiol 2006;7:199-204
18. Jacobs IJ, Skates S, Davies AP, Woolas RP, Jeyerajah A, Weidemann P, et al. Risk of diagnosis of ovarian cancer after raised serum CA 125 concentration: a prospective cohort study. BMJ 1996;313:1355-1358
19. Paramasivam S, Tripcony L, Crandon A, Quinn M, Hammond I, Marsden D, et al. Prognostic importance of preoperative CA-125 in International Federation of Gynecology and Obstetrics stage I epithelial ovarian cancer: an Australian multicenter study. J Clin Oncol 2005;23:5938-5942