Embed Size (px)
Citation preview
The Sense of Crisis among Science Journalists
A survey conducted on the occasion of WCSJ_09 in London
Martin W Bauer & Susan Howard
STePS (Science, Technology and the Public Sphere) London School of Economics and Political Science
Institute of Social Psychology
Contact: [email protected]
5th November 2009
2
List of Contents
A sense of crisis among science journalists? Page 3
1 Executive summary Page 3
2 The context Page 4
3 The questionnaire instrument Page 5
4 Data collection and the profile of respondents Page 6
5 Some basic results Page 8
Appendix I: Questionnaire as used in print at WCSJ and on-line Page 14
Appendix II: Invitation and Instructions to fill-in the on-line questionnaire Page 24
Appendix III: Selected top line results from NATURE 2009 Page 25
Appendix IV: Codebook WCSJ 2009 Page 28
3
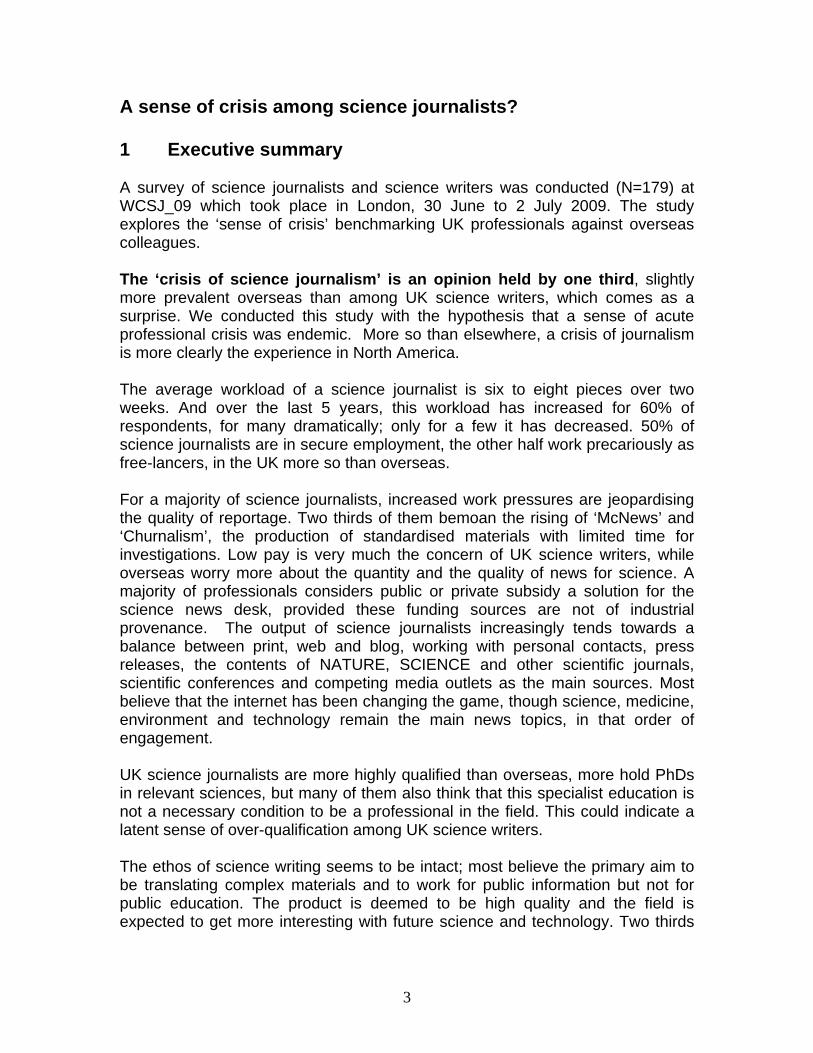
A sense of crisis among science journalists? 1 Executive summary A survey of science journalists and science writers was conducted (N=179) at WCSJ_09 which took place in London, 30 June to 2 July 2009. The study explores the ‘sense of crisis’ benchmarking UK professionals against overseas colleagues. The ‘crisis of science journalism’ is an opinion held by one third, slightly more prevalent overseas than among UK science writers, which comes as a surprise. We conducted this study with the hypothesis that a sense of acute professional crisis was endemic. More so than elsewhere, a crisis of journalism is more clearly the experience in North America. The average workload of a science journalist is six to eight pieces over two weeks. And over the last 5 years, this workload has increased for 60% of respondents, for many dramatically; only for a few it has decreased. 50% of science journalists are in secure employment, the other half work precariously as free-lancers, in the UK more so than overseas. For a majority of science journalists, increased work pressures are jeopardising the quality of reportage. Two thirds of them bemoan the rising of ‘McNews’ and ‘Churnalism’, the production of standardised materials with limited time for investigations. Low pay is very much the concern of UK science writers, while overseas worry more about the quantity and the quality of news for science. A majority of professionals considers public or private subsidy a solution for the science news desk, provided these funding sources are not of industrial provenance. The output of science journalists increasingly tends towards a balance between print, web and blog, working with personal contacts, press releases, the contents of NATURE, SCIENCE and other scientific journals, scientific conferences and competing media outlets as the main sources. Most believe that the internet has been changing the game, though science, medicine, environment and technology remain the main news topics, in that order of engagement. UK science journalists are more highly qualified than overseas, more hold PhDs in relevant sciences, but many of them also think that this specialist education is not a necessary condition to be a professional in the field. This could indicate a latent sense of over-qualification among UK science writers. The ethos of science writing seems to be intact; most believe the primary aim to be translating complex materials and to work for public information but not for public education. The product is deemed to be high quality and the field is expected to get more interesting with future science and technology. Two thirds

4
expect to be working in the field in 5 year’s time, and an even higher proportion of respondents would recommend the career to a young student if asked. 2 The context There are two societal trends which make an investigation of the situation of science writers and science communicators a pressing issue.1 Trend 1: decline of the traditional newspaper business model In North America and Europe the traditional business model of newspapers seems in crisis and leads to a frantic search for viable alternatives (see Manning, 2009). Newspapers have been the mainstay of the societal conversation about politics and science for much of the 19th and 20th century in Western countries. A 400-year-old business model of newsprint was destroyed in only 15 years by the delusion that quality contents come for free. Apparently 7000 newspapers around the world picked up a recent comment by Rupert Murdoch who warned that the publishing industry ‘is cannibalising itself’ (NZZ Folio, 2009). Newspaper readership, especially among the younger generation, is declining and lost to internet bulletins; in consequence advertising spending also moves to different outlets. Traditional titles are closing down, merging, or are distributed freely in an attempt to woo back readers and advertising revenues. This puts pressure on working conditions, quality of reportage and job security of journalists in general, and specialist writers like science journalists in particular. Specialism is squeezed first. This crisis does not seem to affect the large Asian countries such as China and India; here newspaper reading is expanding. Hence, we need to keep things in perspective on a global scale. Trend 2: commercialisation of science Since the 1970s more and more scientific research is conducted under private patronage, and thus operates increasingly under a climate of commercialisation and securing market shares. This puts pressures on science communication. Science writing is less and less following a service ethos of public information and education, and more and more enrolled to push the publicity of particular scientists, research groups, and scientific institutions. The model of professional PR for science, though not new, is turning into generalised practice at the expense of other models. This contributes to the dual risk of ‘scientific fraud’ on the one hand, because of higher production pressures of scientists and more ‘‘bullshit’’ (sensu Frankfurt, 2005) in the societal conversation about science on the other hand, because of the enforced publicity drive of researchers (see Bauer, 2008). In order not to turn into a festival of misinformation, this situation requires structures of the public
1 Due to lack of formal funding, this research was sponsored by the authors themselves, in part from leftovers of a previous research project.
5
sphere which are capable of scrutinising the process of knowledge production outside science itself, and extending the peer review process. For science communication this amounts to a paradigm change (see Bauer, 2008). It is an historical irony that when society is most in need of science communication (trend 2), its basis of independent professionalism is being eroded (trend 1). The weakness of science journalism is the power of science public relations (see Goepfert, 2007). Earlier in the year, a feature in NATURE (March 19, 2009) sounded the alarm bells on the ‘end of science journalism as we knew it’ (Brumfield et al, 2009). The traditional business model of newspapers with specialist correspondents, writing for print, in fixed employment positions is an endangered species. Paradoxically, while science news is expanding worldwide, science journalism is under pressure both in terms of employment and in terms of its traditional formats. From 30 June to 2 July 2009, science writers of the world met in London for the 6th reunion of the World Conference of Science Journalists. This was an opportunity to test the climate of opinion. We had contacted the organisers and were given agreement to conduct the current survey among the science writing professionals who were about to gather in London. This report investigates the climate of opinion among science journalists and science writers. The results do not amount to a complete diagnosis of the situation. The data represent perceptions of the societal trends mentioned above. This data needs to be complemented with information about the structure of the profession: their overall numbers, types, the number of full-time positions in the mass media, the recent increase in PR positions in universities and research institutions, and the trends in salary and working conditions. Others will have to make that information available to reach a full assessment of the situation. 3 The questionnaire instrument We constructed a questionnaire by consulting other sources such as PEW studies on ’Journalism in the US’, a recent NATURE survey, similar in character, and commentaries echoing the NATURE features in newspapers like the NZZ. Maldidier and Boltanski (1969 and 1970) provided questions allowing us to track long-term changes in the culture of science writing2 back to the 1960s. The UK national study Jobs2000 provided items on the employment situation and job satisfaction3, to benchmark the situation of science journalists to that of the entire workforce. The NATURE survey conducted in March 2009 offered several useful
2 Questions v03, v08, v17a-f, v19 3 Questions v14 and v37
6
items to benchmark against their results.4 Finally the PEW surveys of how US journalists see journalism of 2004 and 2007 offer useful comparisons of the situation of science journalists with that of all journalists in the US.5 The final questionnaire (see Appendix I) is structured into five sections. First, we asked about the personal and educational background of the respondents, followed questions about the current professional situation, their employment status and country of activities. The third section explores the working routines and world loads and how these have changed over the last five years. The fourth section explores views about the current status of science writing and its likely future. The fifth and final section asks questions pertaining to the ethos of science communicators and what it takes to be a professional in the field. The questionnaire comprises 38 questions yielding a total of 138 items. 4 Data collection and the profile of respondents The questionnaire responses were collected in two ways. Firstly, we contacted participants of WCSJ_09, which took place 30 June – 2 July 2009 in London’s Central Hall, Westminster. All 800 plus delegates received a hard-copy of the questionnaire in their welcome pack with the invitation to complete and return it to the reception desk. 66 of 800 delegates did so. Secondly, an further 113 responses were obtained on-line via a follow-up e-mail invitation. The on-line survey opened on 30 June 2009; the cut-off point for the current database was 15 October 2009. Respondents that reached the survey after this date are not included in this report. Of the final respondents (N=179), 104 were delegates to the London conference making it a 13% response rate on that part of the sample. The other 75 responded to a snow-balled invitation through science journalist colleagues in the UK, Germany, Sweden, Spain, Korea, China, Nigeria and the US. We have no information of the response rate to that part. By comparison the PEW surveys work with larger samples (e.g. N=538, Sept-Dec 2007), and so did the survey of NATURE 2009 (N=493), and better response rates. The response rate among conference delegates remained unsatisfactory (13%), despite several follow-up invitations circulated via the organiser’s e-mail list. The response rate is even smaller among British delegates than among delegates from overseas. Journalists are a difficult population to reach with a questionnaire and by e-mail; most science writers are probably flooded by e-mail and ignore most of what is not related to a good story. By comparison the response rates of PEW surveys is in the area of 55% (see PEW 2007, 35), while the NATURE 2009 survey provides no information on response rates. 4 Questions: v8, v9, v12, v13, v16a – v16k, v21a – v21l, v22, v23, v24a, v25, v26a – v26j, v27, v28 and v38. 5 Questions: v6a, v23, v24, v30, c31, v33a – v33k, v35

7
By way of proviso we need to say that it remains unclear of whom the current survey is representative. It is unlikely to be representative of the delegates of WCSJ_09 nor of the world’s science journalists and science writers. To a large extent it is a haphazard sample, but some information is better than none, and we are validating some of our results with previous studies to get a better sense of the population involved. Our results might be a further step towards a more systematic picture in any one country or comparisons of several countries of the state of affairs and the perception of the situation of science journalism in the 21st century. 59% of out 179 respondents are from Europe/Russia (19% UK), 14% from North/South America, 12% for Asia/Pacific, 6% from Sub-Saharan Africa, 0.5% (one respondent) from North Africa/Middle East, and for three respondents we do not know their location of work. In comparison, the NATURE survey mobilised 42% responses from US/Canada, 50% from Europe/Russia, 4.5% from Asia, and 3.5% from Latin America. The present sample is more European, less North American, and includes more African and Asian voices. In this report we will mainly compare UK voices against all others, which we will conveniently call ‘overseas’. 58% of our respondents participated at WCSJ_09. This ratio is higher among the UK respondents than among the overseas. This reflects our dual efforts of soliciting responses to our questions via the conference and snowballing via a personal network overseas. Male and female professionals are equally represented in our study, and two thirds are professional organised as members of a writers’ association. The average age of respondents was 40 years (SD=12; median=37 years); US and African respondents were slightly older (average 44 years), than Europeans and Asians. 40% have been on the job for less than 5 years, another 22% for 6-10 years, 15% 11-15 years, and 23% longer than 16 years. Overseas respondents have been on the job for somewhat longer. Compare the NATURE survey, where 22% were on the job for less than 5 years, 21% 6-10 years, 16% 11-15 years, and 41% 16 years and more. While NATURE 2009 reached the ‘older work horses’, our study surveyed more of the ‘new kids on the block’. Most respondents (85%) have a university degree. In the UK most get their journalism training on the job, while overseas about half of these have a specialist training as ‘journalist’ or ‘science journalists’. 44% of UK respondents have a PhD degree compared to 24% of those overseas.
8
By political orientation, most science writers identify themselves as left or centre-left (66%), 14% position themselves in the centrally, and 7% to the right. 13% decline to declare themselves. By comparison, PEW regularly asks this question of US journalists, of whom 32 identify themselves as ‘liberal’, 53% as ‘moderate’ and 8% as ‘conservative’; 7% do not position themselves. By comparison, science journalists seem to be considerably more left-leaning than the average US journalist (see PEW07). 5 Some Basic Results For a quick run through of some of the basic results of this investigation, we focus on three aspects of the work of science journalists: their working conditions and current practices, their worries and sense of crisis, and the observed differences between UK and overseas respondents in some of these aspects. Working conditions and current working practices 45% of respondents are in full-time employment, 5% in part-time employment, 25% are full-time freelancers,14% are part-time freelancers and 8% unknown. By comparison, the NATURE sample reported 55% in full employment, 5% part-timers, 24% free-lancers and 13% part-time freelances, 3% unknown. The picture is fairly consistent, about 50% of science writers are in secure employment and about 50% are free-lancers and hence in a more precarious situation. 55% of respondents did not experience any employment change in the last five years, others moved from part-time to full-time (8%), full-time to part-time (7%) and employed to self-employed (18%), and from self-employed to employment (7%). Among overseas we find more full-timers, in the UK more free-lancers. Considering the main topic areas of their reportage, respondents can be grouped (by hierarchical cluster analysis of v15a to v15f) into three tendencies towards ‘health & medicine’ (HM 41%), ‘science & technology’ (ST 24%) and ‘business & social science’ (BS 12%), though the range of work of these grouping are overlapping. The rest does not show a clear centre of gravity in their topics, and can therefore be considered ‘generalists’ (GE, 24%). The degree of specialisation is higher among HM and ST than among BS and GE, counting the number of times respondents have identified that they never write about a particular topic in the list of medicine, science, technology, environment, social science, and business. The operational hierarchy of news topics is science, before medicine and health, environment and technology, followed by business and social science related topics. This ranking is similar to that of NATURE 2009. Among the respondents we find that 70% write mainly for print, 12% mainly for radio, 10% for Television. On the new media, 37% of respondents write mainly for websites, 17% mainly blog, 7% write books or pod-casts, and 4% do mainly

9
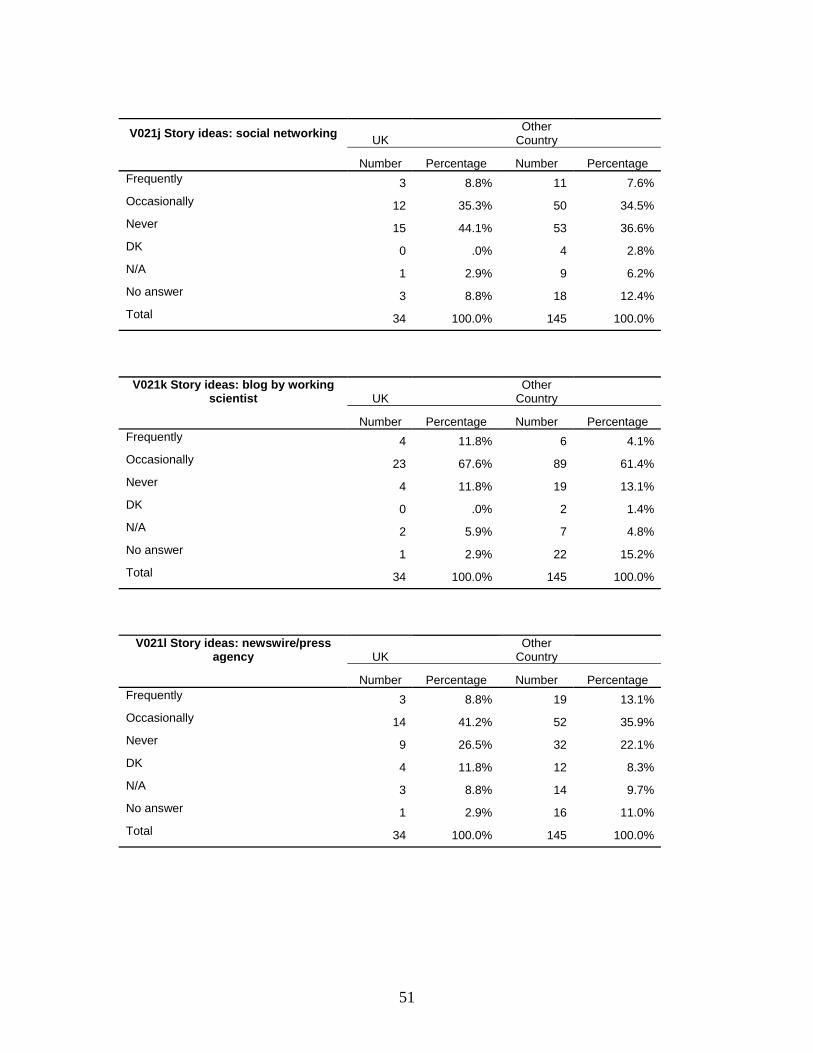
exhibition work. Considering multiple lines of outputs, 92% write for print, 71% for the web, and 53% blog as well. NATURE reported 84% print, 77% web, and 32% blog activities. In sum, the work of a science writer is tending towards a balance between print, web and blog. In terms of story sources, we observe very similar results to NATURE (March 2009): a clear hierarchy of importance. Personal contacts, press releases, the contents of NATURE, SCIENCE and other scientific journals, scientific conferences and competing media outlets are the main fonts of science writing. To a lesser extent science blogs, exhibitions, media centres, social networking sites, and news wires services comes into the picture. Which sources are ‘frequently used’ when writing stories? Personal contacts (33%), press releases (27%), list of contents of specialist science journals (22%) are followed by NATURE (18%) and SCIENCE (19%), scientific meetings and conferences (18%). News in competitor media outlets (16%), news wires (12%), media series like Alpha-Galileo, social network sites and blogs (each about 10%) also figures as a prominent source. Contrary to expectations, scientists are only for 5% of respondents a frequent source. Press releases are shunned by 5% of respondents, while wire services are avoided by 23%, social network sites by 38% and media centres by 40%. 11% report never to consult NATURE or SCIENCE. With regard to quoting press releases, 45% report doing that more frequently over the last five years, while 28% report increasing caution in that respect.
Figure 1: The number of pieces in work over the last two weeks
36.0027.0023.00 20.00 19.00 18.00 17.0016.0015.0014.0013.0012.0011.0010.009.008.007.006.005.004.00 3.00 2.00 1.00 .00
20
15
10
5
0
Number of pieces last two weeks

10
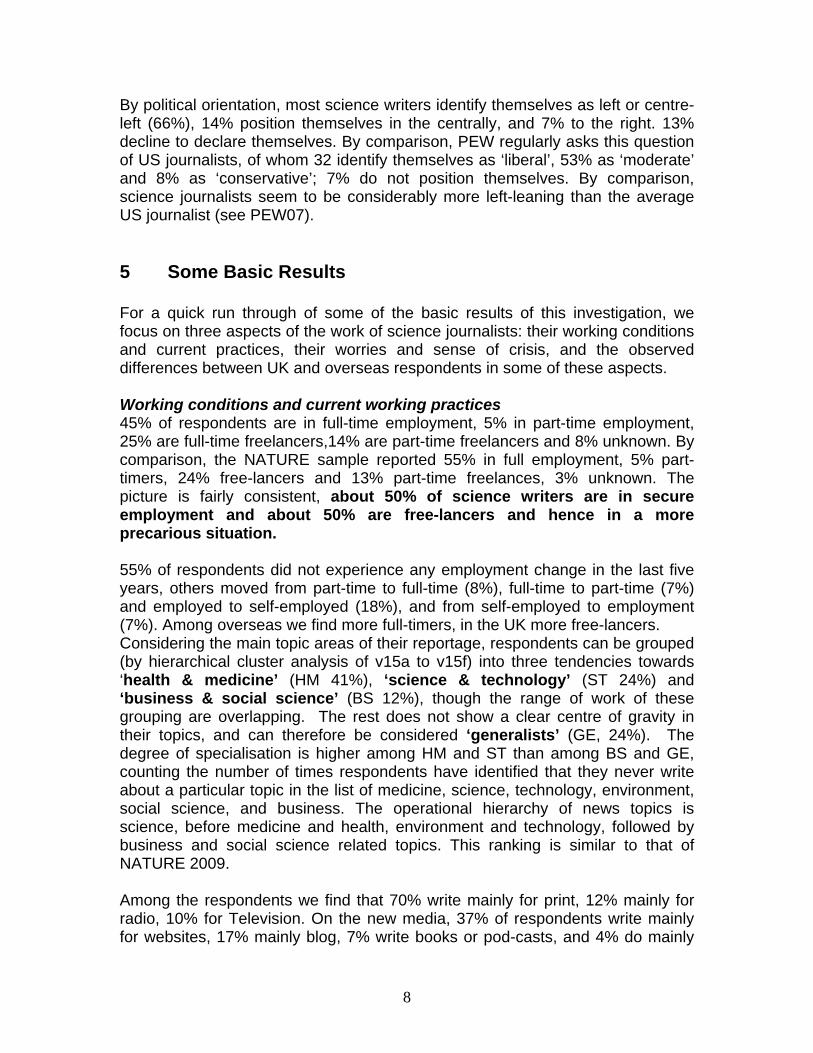
To determine the workload of our respondents, we asked for various outlets, how many pieces they were working on over the last two weeks. Figure 1 shows the distribution of the workload among the respondents ranging from 0 to 36 pieces. On average respondents report between seven and eight pieces in production in the last two weeks (Median=6, SD=5.5). The most frequent response is three items over two weeks; the maximum is 36. Different specialities of science journalism report no different workloads, whether the focus is health or science & technology, journalists are equally busy. 60% of respondents experienced an increase in workload over the last five years, of which a quarter perceives a dramatic increase. 17% report no change, and 11% a decrease in workload. Similar levels of work intensification are reported by NATURE 2009, 19% reported a dramatic increase, 61% an increase, 29% no change, and 12% a decrease in weekly workload.
The absolute level and the increase in workload give rise to a potential sense of crisis. 60% expect working pressures to harm the quality of science writing, while only 8% see no danger in that respect, and 13% see a change in working conditions, but no harm to quality. Compare PEW2007 which reports that 68% of US journalists expect work pressures to harm the quality of writing. In our survey, 75% attribute these changes to new technology and agree with the statement ‘the internet is changing the value of journalism’, so do 83% of all US journalists (PEW07). However, opinions are split over whether the 24 hour news cycle which comes with the internet has weakened journalism in general: 48% belief so, 28% do not, 25% do not know. PEW2007 reports that 47% of all journalists are blaming the news cycle, and 52% do not. A sense of crisis for one third of science journalists Contrary to news reports, the sense of crisis is not pertinent among science journalists. A majority of respondents (65%) disagree with the statement ‘science journalism is a dying profession’. UK writers are not different from overseas colleagues. Also the overwhelming majority (77%) would happily recommend the career of the science journalist to a young student who might ask for advice. NATURE respondents were slightly less optimistic: 60% would recommend a career, while 27% were not sure, and 14% would not advise taking up science journalism in this day and age. This probably reflects their more senior and more US based sample. Asked whether ‘science journalism is in crisis’, again, two thirds of our respondents disagree with this statement; equally about two thirds are satisfied with their work as science journalists. This sense of crisis and dissatisfaction is slightly higher among overseas than UK journalists.

11
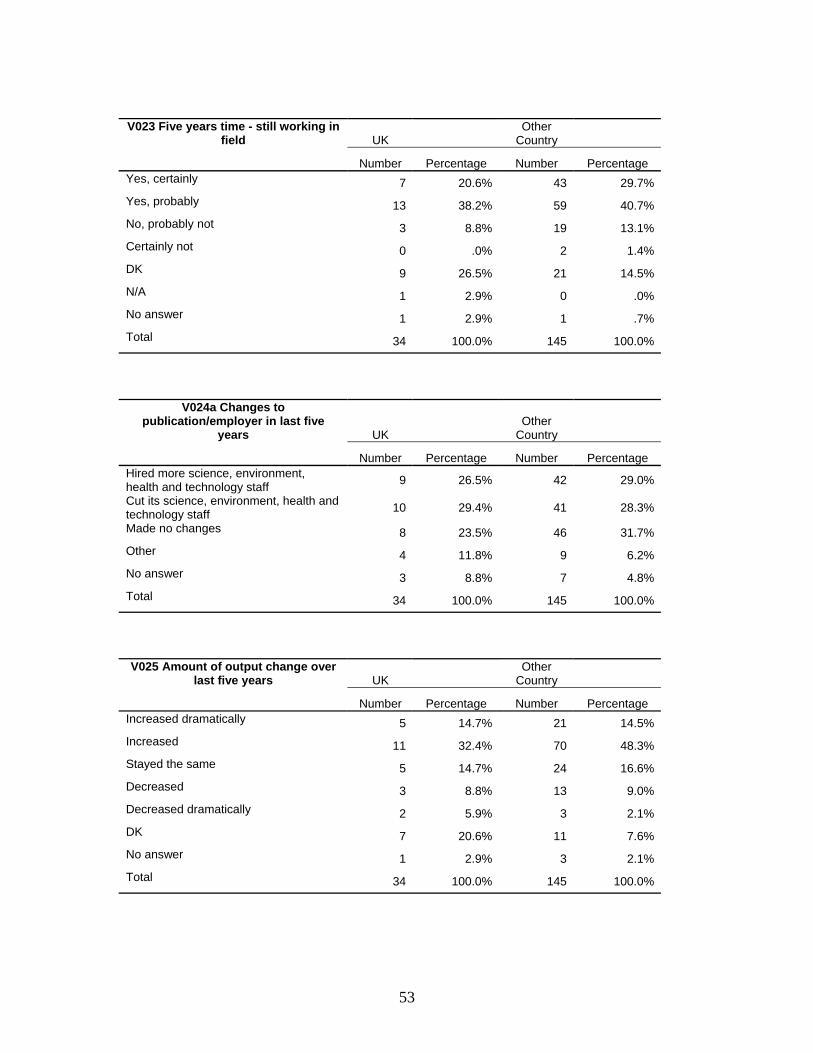
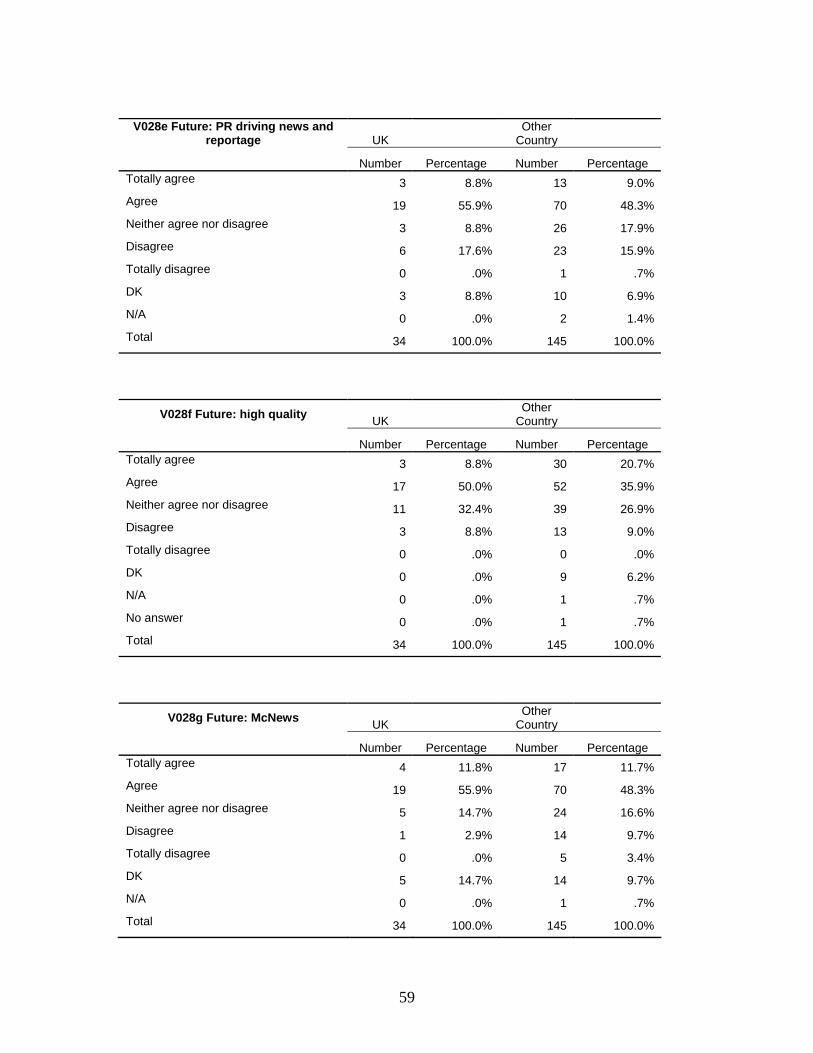
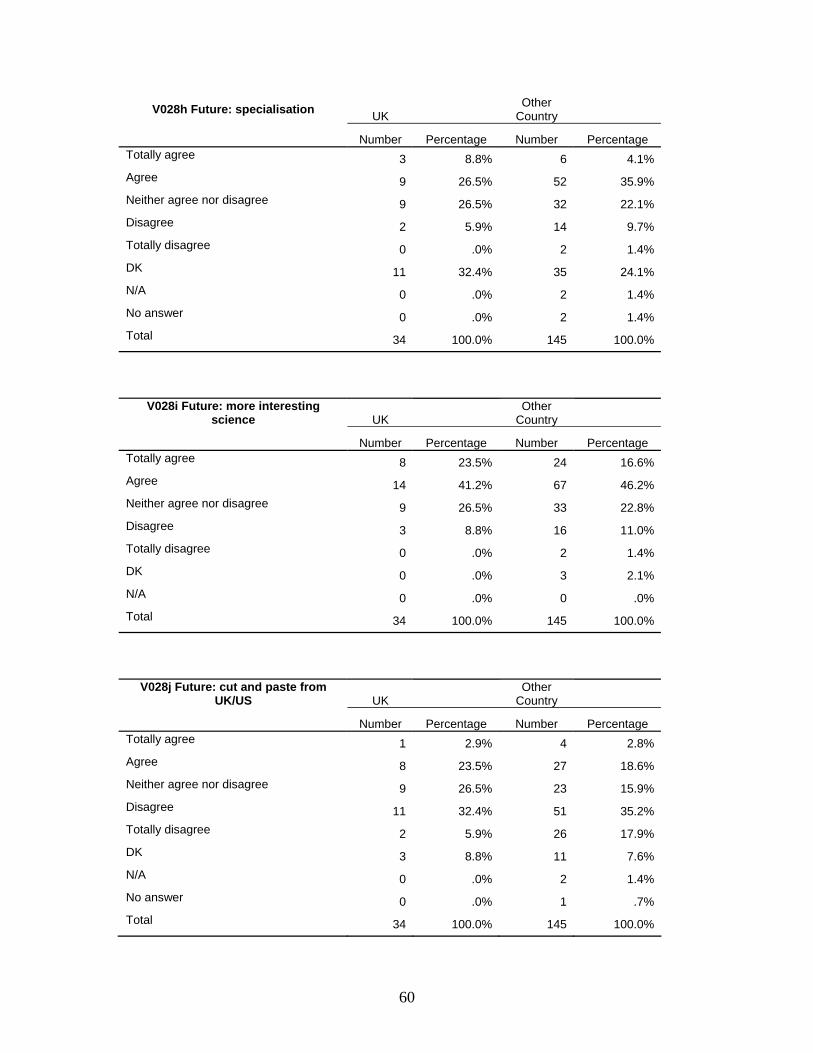
Two thirds of respondents expect to work in the profession in 5 years’ time, while one third considers that unlikely or does not venture an opinion. Similar feelings were prevalent among all US journalists of whom 28% felt secure about the jobs and 40% probably secure, while 30% felt insecure in December 2007 (PEW07). Asking our respondents directly, whether ‘all considered science journalism was on the right track’, 27% agreed, 17% thought it moved on the wrong track, and 52% had no clear view on this. Among US journalists, a strong sense of crisis is evident: 62% belief that journalism is moving on the wrong track (PEW07). Asked whether ‘newspapers are a thing of the past’ 50% of our respondents beg to disagree and 8% very much so. Two thirds also consider claims of the ‘death of print journalism’ as exaggerated. Overall, we conclude that one third of respondents have an acute sense of crisis, while two thirds do not share that perception. Science journalists in general seem to have a lesser sense of crisis than US journalists expressed in 2007 in the PEW survey. Asked whether their current employer had over the last 5 years cut or expanded the science desk, 28% report increased hiring, 28% report cuts and 30% experienced not changes (12% did not answer). PEW07 carried a similar question and reported 48% experiencing cuts, 24% expansion, and 25% no change. The employment situation in the US seems to be worse than elsewhere. There may be no majority of science journalist with an acute sense of crisis among the respondents, there are however widespread concerns about trends in the profession. The pride of the profession seems intact: two thirds expect the future to bring more interesting science and technology, and 60% think that science writing is the most existing field of journalism, and 55% think that science journalism is a ‘high quality product’. Only about 30% agree that science journalism has become a job of cutting and pasting from NATURE and SCIENCE. Most see their role mainly as providers of ‘public information’ (50%), and as ‘translators of complex materials’ (30%); only few aspire to a role as ‘watchdog’ (5%), entertainer (3%), or educator (12%). None in the UK subscribes to the latter mission. However, the absence of an acute sense of crisis does not mean the absence of major worries. We find that two thirds bemoan ‘McNews’ and ‘Churnalism’, the thoughtless reproduction of press releases and the churning out of prepared materials due to time pressures at work. An equal proportion worries about science news being driven by PR agencies and efforts. Note that 45% report increased usage of press releases over the last five years. 50% of respondents regret that too little is written on the process of science instead of results. Low pay is a concern for 56% of UK respondents, but only 32% among overseas. 44% worry about declining quality of writing, 26% about job security, and 14% about the type of assignments they might get.

12
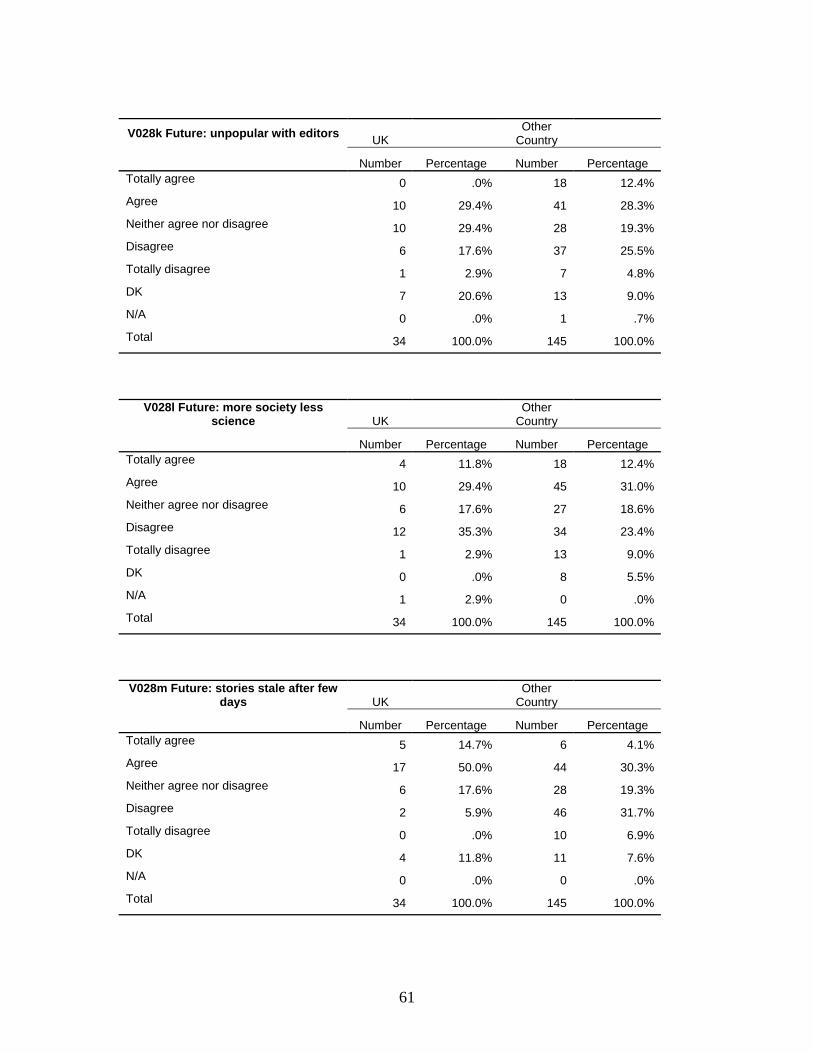
Opinions are split on whether the future will see more libel suits against science journalists and on whether the centre of gravity of science journalism is moving from general news outlets to specialist media such as blogs and websites, as suggested for example by the NATURE feature of March 2009. Opinions are equally split on whether science reporting is critical enough or not. 58% think science journalism is not critical enough, 31% think it is fair, and only 3% think it is too critical. Here Science writers do not differ from other journalists. PEW07 reported a similar distribution among all US journalists: 55% believing that news is not critical enough, 35% thinking it is fair and 8% that it is too critical. One of the solutions discussed in relation to a ‘crisis of journalism’ in general and specifically for science journalism is sponsorship of a science news desk. This is a very unusual step, but seriously discussed for example in Switzerland (see NZZ, 2008). 44% of respondents struggle with the fact that science news is unpopular with their editors, while 33% see no barriers in the news room. 21% are agnostic on this point. Outside sponsorship of science writing might be able to shore up an important news topic that is otherwise an ‘endangered species’. Asked directly whether sponsorship of the news desk would be a solution, 55% agree to such an arrangement to save a science news desk. There is a clear majority for this among UK respondents (59% yes), but not among the overseas (41% yes). 45% (UK 41%, overseas 58% no) worry that such a solution jeopardises the independence of reporting. Asked which sponsorship might be acceptable, most respondents see a government agency, a national university, a charitable foundation, national or otherwise, as a suitable source of subsidy Thumbs down for such a sponsorship clearly goes to the pharmaceutical or any other national or international industry as these are often interested parties in the science news process. Some differences between UK and overseas journalists There are few significant differences between UK and overseas journalists in our study. But as any statistically minded person knows, some differences can be expected by pure chance, and we only observe a relative small number of respondents in the UK and overseas (see tables in Appendix IV). Some of these observed differences are however worth mentioning as a kind of benchmark comparison. A sense of crisis seems to be slightly more prevalent overseas than among UK science writers; though that sense of crisis is more prevalent in the US as documented by the PEW studies: it might have spilled over to other places by 2009.

13
The training background of UK and overseas science journalists is slightly different. Overseas, more professionals have a specialist training in journalism but hold less often a PhD degree than those in the UK. The level of professional satisfaction is slightly lower among overseas respondents, mainly in regard to press freedom, access to information, direct access to scientist and in some cases also personal safety. UK respondents are newer to the job than those overseas; and overseas journalists are more likely to be in a permanent full-time position. While UK journalists worry about their job security, those overseas worry more about the quality of science writing. This might reflect the more precarious job situation in the UK compared to overseas. UK science journalists believe that there is sufficient ‘science stuff’ in the news, while most overseas consider the amount of science coverage insufficient. A similar disparity can be observed with regard to the quality of science news: for most UK respondents the science reportage is good or very good (53%), while overseas, a only minority (37%) think so. Overseas science journalists are more likely to see their mission in education than UK writers, for whom translation and information are the key points. Overseas respondents disagree with UK colleagues on what makes a ‘good science journalists’. UK professionals consider training in relevant sciences less important than their counterparts overseas; the same is true for holding a science degree. More split on this issue is opinion in the UK, where a science degree is normally expected from a science journalist. Considering that UK respondents are more likely qualified to the level of PhD, it appears that some UK journalists feel overqualified because in practice their PhD was not a necessary qualification for their current job. Needless to say, that not least on the last point, further research might be needed.

14
References Bauer MW (2008) Paradigm change for Science Communication: commercial science needs a critical public, in: D Cheng, M Claessens, T Gascoigne, J Metcalf, B Schiele, S Shi (eds) Communicating Science in Social Contexts, NY, Springer, 1-26 Frankfurt, HG (2005) On bullshit, Princeton, PUP Goepfert W (2007) The strength of PR and the weakness of science journalism, in: Bauer MW and M Bucchi (eds) Journalism, Science and Society – Science communication between news and public relations, NY, Routledge, 215-226 Maldidier P & L Boltanski (1969) La vulgarization scientifique et ses agents, Paris, Centre de Sociologie Europeen Boltanski L & P Maldidier (1070) Carriere scientifique, moral scientifique et vulgarization, Social Science Information, 9, 3, 99-118 Manning M (2009) A new horizon for the news, The NY Review of Books, Vol LVI, no 1, Sept 24 – Oct 7, 31-34 (PEW04) PEW RESEARCH CENTER FOR THE PEOPLE AND THE PRESS Survey of Journalists - Final Top-line Results, March 10 - April 20, 2004 (PEW07) PEW Research Centre & Project for Excellence in Journalism, Journalist survey report of 2007, 17 March 2008 (Nature09) Brumfield G (2009) Supplanting the old media? NATURE, March 19, 274-77 (plus editorial ‘filling the void’, p260) (NZZ08) NZZ (2008) Wissenschaftsjournalismus zwischen Mythos und Markt, no 305, p29, Wed 31 Dec 2008 NZZ Folio (2009) Die Zeitung – das Neueste von der Front, October 2009 (jobs2000) Working in Britain in the year 2000 – questionnaire (kindly provided by Pat McGovern of LSE Sociology)

15
Appendix I: Questionnaire as used in print at WCSJ and on-line
World Conference of Science Journalists
London, 30 June-2 July 2009
Dear Colleague,
Welcome to WCSJ 2009 in London. The organizers would like to ask you a few
questions about your professional situation, your working practices, and the
future of the profession. It should take you less than 10 minutes to answer these
questions.
Please complete and return the questionnaire to the conference registration desk, or answer on-line at:
http://www.psych.lse.ac.uk/surveys/wcsj_2009_questionnaire/
If you would like to know the results, please leave us an e-mail address and we
will send you a report.
Thank you,
Martin W Bauer (LSE, Methodology Institute); [email protected]
Contact e-mail:

16
Today’s Date ……………………..
London 2009 Brazil 2002 Melbourne 2007 Budapest 1999
Q1 Are you part of WCSJ 2009 in London, and did you participate in previous conferences? Please mark all the years you participated Montreal 2004 Tokyo 1992
Journalistic training on the job Journalism school University degree + training on the job University degree + general journalism training
Q2 What is your training background? Please mark the ONE that best describes your background, and specify further if needed: University degree + specialist science journalism training If University degree, please state your highest degree: First degree Master PhD If University degree, please also state your last degree subject:
Yes No, was previously
Q3 Are you a member of a national Science Journalism Association or any another professional journalism body? No, never was Q4 How old are you? (In years) Q5 Are you: Male Female
Left Centre-right Centre-left Right Centre Other (Please specify)
Q6 How would you position yourself politically on a left-right spectrum? Would you say you are:
Q7 How do you describe yourself professionally? Please specify
Science journalism is my main occupation I am a scientist, who writes occasionally for the wider public I am a Public Relations officer working with journalists My main employment is other, please specify
Q8 Is science journalism your main activity, or are you otherwise employed?
Europe/Russia USA and Canada Asia/Pacific Northern Africa and Middle East
Q9 For which world region do you mainly report? Tick only ONE South and Central America Sub-Saharan and Southern Africa Q10 In which country are you based?

17
Q11 To what extent are you satisfied or dissatisfied with the situation in your country regarding Completely
Satisfied Very
Satisfied Satisfied Neither
Satisfied nor Dissatisfied
Dissatisfied Very Dissatisfied
Completely Dissatisfied
Not Applicable
Freedom of the press / freedom of expression Access to information from government agencies Access to scientists as sources for your work Personal safety in the discharge of your duties as a journalist
Less than 5 years 11-15 years Q12 How long have you worked in science journalism? 6-10 years More than 15 years
Part-time freelance Full-time freelance Part-time staff Full-time staff Other (please specify)
Q13 What best describes your current professional employment position?
No change From part-time to full-time contract From full-time to part-time contract From employed to self employed
Q14 How has your present employment changed over the last five years? Please mark as appropriate
From self employed to employed Q15 What topic areas do you primarily cover? Please rate all areas Mainly Occasionally Never Don’t Know Not Applicable Health and medicine
Science
Technology
Environment
Business
Social science
Other (please specify): ……………………………

18
Q16 In which of these media does your work appear? Please rate all
Mainly Occasionally Never Don’t Know Not Applicable Print
Radio
Television
Podcast
Video podcast
Blog
Web story
Book
Exhibition
Other (please specify): …………………………… Q17 Whom do you consider your audience? Please indicate your focus for each of these audiences Mainly Occasionally Never Don’t Know Not Applicable The general, wider public
A special interest public
A scientific audience
Your fellow journalists
Politicians
Other (please specify):
……………………………
I have no feedback at all Occasional letters from readers Click stream ratings from internet Regular audience research of my outlet From friends and family Other (please specify below):
Q18 How do you know about your audiences and whether you reach them? Please mark all that apply
To translate complex material To mobilize the public To entertain To be a public watchdog To inform Other (please specify below):
Q19 How would you define your role as science journalist vis-à-vis your audience, tick only the ONE that BEST describes your ethos
To educate

19
Q20 Think of the last TWO WEEKS, how many stories, items or packages were you working on for the following outlets? One Two Three Four Five More than five
Article
Blog
Website
Podcast
Promotional text
Press release
Exhibition
Book
Other (please specify) …………………………… Q21 How often do you get story ideas from the following sources? Please answer for each source
Frequently Occasionally Never Don’t Know
Not Applicable
Press release/press officers
Conferences
Other media outlets
Nature
Science
Other science journal’s contents
Exhibition
Science Media Centre etc
Personal contacts
Social networking
(Facebook, Twitter, etc)
Blog by a working scientist
Newswire/press agency
Alphagalileo/Eurekalert
Other blogs
Q22 How often do you use images or b-roll from a press release or press office?
Frequently Occasionally Never Don’t Know Not Applicable

20
Q23 Do you believe you will be working as a science, environment, technology or health journalist in FIVE YEAR’S TIME? Yes, certainly No, probably not Don’t know Yes, probably Certainly not Not applicable Q24 Compared to FIVE YEARS AGO, has your primary publication/ employer…? Please chose ONE Hired more science, environment, health and technology staff
Cut its science, environment, health and technology staff
Made no changes
Other, please specify
Q25 Compared to FIVE YEARS AGO, has the number of stories, items or packages you work on in a given week...
Increased dramatically Decreased Increased
Stayed the same Decreased dramatically
Don’t know
Q26 Think of your journalistic work FIVE YEARS AGO. For each of these media, did your work appear more often, less often, the same or it never appeared at that time? More often Less often The same Never Don’t know Not applicable
Radio
Television
Podcast
Video podcast
Blog
Web story
Book
Exhibition
Other (please specify) ………………………… Q27 Compared to FIVE YEARS AGO, have your direct quotes of press release or press officers….. Increased Become less frequent Don’t know The same frequency Never use such quotes Not applicable

21
Q28 The following statements are made about the future of Science Journalism, please indicate for each of them whether you agree or disagree with them considering the context you are working in Totally agree Agree Neither
agree nor disagree
Disagree Totally disagree
Don’t know Not Applicable
Science journalism is a dying profession Libel suits against science journalists are increasingly common and make it a risky activity Too few people are reporting on the process of science as opposed to the results of scientific research Science journalism is in crisis Science Public Relations is driving the science news and reportage Science journalism is a high quality product The proliferation of press releases from journals, universities and researchers, combined with budget cuts in newsrooms, leads to “McNews” and “churnalism” Profits and jobs are moving from general outlets to more specialized publications As science and technology gets more interesting, so does science journalism Science journalism is primarily “cut, paste and translate” from US and UK science outlets Science journalism is unpopular among editors and publishers Science journalism needs to get more journalistic, i.e. more society and less science Stories are now considered stale if they are more than a few days old Science journalism is the most exciting field in journalism Science journalism’s pay rate favors people without financial commitments

22
Q29 How would you grade the science reporting in the country where you are working, both in terms of quantity and of quality?
Too much stuff Sufficient coverage Not applicable Quantity Insufficient coverage Don’t know
Very good Bad Don’t know Quality Good Very bad Not applicable
Fair Q30 Do you think that the tone of science news and reportage in general is…? Too critical Not critical enough Generally fair Don’t Know Not Applicable
Q31 Do you think that working pressures are harming the quality of science stories?
Harming Not harming Just changing Don’t Know Not Applicable Q32 My main worry about science journalism currently is … pick ONE The quality of writing The type of job assignments I can get Job security; to have a job next year at all Other, please specify …………………………………………… Q33 Here are some criticisms often made of the print media in general. For each one of these, do you think this is a valid criticism, or not? Totally agree Agree Neither
agree nor disagree
Disagree Totally disagree
Don’t know Not Applicable
The distinction between reporting and commentary has seriously eroded News reports are increasingly full of factual errors and sloppy reporting Too little attention is paid to complex issues Newspapers are a thing of the past Predictions of the ‘death of print journalism’ are greatly exaggerated The internet is changing the values of journalism The press is too cynical

23
Totally agree Agree Neither agree nor disagree
Disagree Totally disagree
Don’t know Not Applicable
Journalists have become out-of-touch with their audiences Journalists are letting their ideology bias their reporting, and this is bad The press is too timid these days The emergence of the 24 hour news cycle is weakening journalism The posting of internet links is too often to material that is unvetted or unfiltered Q34 Imagine a situation where a national or an international news wire service does not have a science desk, or can no longer afford to have one. They are looking for a sponsor to set one up or keep it open. Do you think that such a sponsorship arrangement would be a good idea? A NO, news sponsorship jeopardizes independent reporting YES, if necessary to have a science desk at all
If YES, go to b), if NO go to next question B Who in your preference should sponsor this science news desk?
A suitable sponsor
Not a suitable sponsor
Don’t know
Not applicable
A government agency
The leading national university
The national pharmaceutical industry
Other national industry
A foreign industry
A national charitable foundation
A foreign charitable foundation
Other, please specify
…………………………
Q35 Considering all the trends mentioned in previous questions, where do you think science journalism is moving? On the right track On the wrong track Don’t know Not applicable

24
Q36 Here are a number of statements that define ‘good science journalism’, please indicate how important in your view any of these is to make a good science journalist these days
Very important
Important Neither important
nor unimportant
Unimportant Totally unimportant
Don’t know Not Applicable
Training for online media, especially video podcasting Reporting the facts accurately To be passionate about science Have reasonable numeracy and grasp of statistics Possess a university degree in a scientific discipline Do investigative journalism of science Train in the fields of science you cover to be able to better present the science Use more images and photos Others (please specify) ………………………… Q37 Overall, how satisfied are you with your work as a science journalist? Completely satisfied Dissatisfied Don’t Know Satisfied
Neither satisfied nor dissatisfied Completely dissatisfied Not Applicable
Q38 On balance would you recommend a career in science, health, environment or technology journalism to a young student? Yes, certainly Probably not Don’t Know Yes, probably Definitely not Not Applicable Thank you for your cooperation !

25
Appendix II: Reminder for the on-line questionnaire Dear _____ You recently attended the WCSJ. Several sessions at the conference addressed a ‘crisis’ in science journalism, as have a recent series of features in Nature. We at the London School of Economics have been investigating this issue for some time, and now the Department of Business, Innovation and Skills (DBIS)'s Media Expert Group joins the investigation of this sense of ‘crisis’. We have produced a short questionnaire on your working conditions and evaluation of the situation past and present. We urge you to complete this questionnaire, if you have not already done so, as soon as possible. It will take no longer than 10 minutes of your time to complete on-line at http://www.psych.lse.ac.uk/surveys/wcsj_2009_questionnaire/ Yours sincerely, Martin W Bauer and Susan Howard STePS (Science, Technology and the Public Sphere) London School of Economics and Political Science

26
Appendix III Selected top line results from NATURE 2009
Here we include those results of the NATURE (March 2009) survey which are comparable to the present LSE-WCSJ_09 survey; data exist only as EXCELL format with topline results; no cross-tabulations are possible. Data are generously provided by Geoff Brumfield of NATURE. Regions journalists work in [v09] USA and Canada 42.0% 206Europe/Russia 49.7% 244Asia/Pacific 4.9% 24South/Central America 3.5% 17Africa 0.0% 0 answered 491 NA 2 Q2. What best describes your current position? [v13] Part-time freelance 13.2% 65Full-time freelance 23.5% 116Part-time staff 5.3% 26Full-time staff 54.6% 269Other (please specify) 3.4% 17 answered question 493 NA 0
Q3. How long have you worked as a journalist? [v12] 0-5 years 22.2% 109 6-10 years 20.8% 102 11-15 years 16.3% 80 16 years or more 40.6% 199 answered question 490 NA 3
Q4. What areas do you primarily cover? Please select all that apply [v15a-v15f] Health and medicine 61.2% 298 Science 86.2% 420 Technology 36.8% 179 Environment 48.0% 234 answered question 487 NA 6

27
Q6. In which of these media does your work appear? Please select all that apply [v26a-v26j] Print 83.7% 407 Radio 15.6% 76 Television 8.4% 41 Podcast 15.0% 73 Video podcast 5.3% 26 Blog 31.5% 153 Web story 76.5% 372 Other (please specify) 5.1% 25 answered question 486 NA 7 Q8. In the past five years, has your primary publication...? [v24] Hired more science, environment, health and technology staff 26.9% 125 Cut its science, environment, health and technology staff 29.2% 136 Made no changes 34.4% 160 Other (please specify) 9.5% 44 answered 465 NA 28
Q9. In the past five years, has the number of items you work on in a given week... [v25] Increased dramatically 18.5% 87 Increased somewhat 40.6% 191 Stayed the same 28.9% 136 Decreased somewhat 8.5% 40 Decreased dramatically 3.6% 17 answered question 471 NA 22
Q10. How often do you get story ideas from the following sources? [v21a-v21n] Answer Options Frequently Sometimes Rarely Never Response Count Press release/press officers 54% 37% 9% 1% 460 Conferences 28% 48% 21% 2% 456 Other media outlets 26% 50% 21% 3% 439 Science journal's table of contents 54% 31% 11% 4% 457 Personal contacts 35% 48% 16% 1% 449 Social networking (Facebook, Twitter, etc.) 1% 8% 27% 65% 420 Blog by a working scientist 4% 20% 39% 37% 421 Other blogs 8% 25% 35% 32% 421 answered question 464 NA 29

28
Q12. How often do you use direct quotes or clips from a press release or press office? [v21a] Frequently 13.8% 64Sometimes 24.8% 115Rarely 35.6% 165Never 25.7% 119 answered question 463 NA 30
Q13. How often do you use images or b-roll from a press release or press office? [v22] Frequently 18.6% 86Sometimes 37.0% 171Rarely 22.1% 102Never 22.3% 103 answered question 462 NA 31
Q14. Do you believe you will be working as a science, environment, technology or health journalist in five years time? [v23] Yes 67.9% 313No 6.3% 29Unsure 25.8% 119 answered question 461 NA 32
Q15. Would you recommend a career in science, health, environment or technology journalism to a student? [v38] Yes 59.8% 275No 13.5% 62Unsure 26.7% 123 answered question 460 NA 33

29
Appendix IV: Codebook WCSJ 2009
V001a London 2009 UK Other
Country Number Percentage Number Percentage
Yes 28 82.4% 76 52.4% No answer 6 17.6% 69 47.6% Total 34 100.0% 145 100.0%
V001b Melbourne 2007 UK Other
Country Number Percentage Number Percentage
Yes 0 .0% 13 9.0% No answer 34 100.0% 132 91.0% Total 34 100.0% 145 100.0%
V001c Montreal 2004 UK Other
Country Number Percentage Number Percentage
Yes 0 .0% 10 6.9% No answer 34 100.0% 135 93.1% Total 34 100.0% 145 100.0%
V001d Brazil 2002 UK Other
Country Number Percentage Number Percentage
Yes 0 .0% 4 2.8% No answer 34 100.0% 141 97.2% Total 34 100.0% 145 100.0%
V001e Budapest 1999 UK Other
Country Number Percentage Number Percentage
Yes 1 2.9% 4 2.8% No answer 33 97.1% 141 97.2% Total 34 100.0% 145 100.0%

30
V002a Training Background UK Other
Country Number Percentage Number Percentage
Journalistic training on the job 2 5.9% 9 6.2% Journalism school 2 5.9% 14 9.7% University degree and training on the job 18 52.9% 49 33.8%
University degree and general journalism training 6 17.6% 25 17.2%
University degree and specialist science journalism training 6 17.6% 47 32.4%
No answer 0 .0% 1 .7% Total 34 100.0% 145 100.0%
V002b Highest Degree UK Other
Country Number Percentage Number Percentage
First degree 8 23.5% 37 25.5% Master 9 26.5% 62 42.8% PhD 15 44.1% 37 25.5% No answer 2 5.9% 9 6.2% Total 34 100.0% 145 100.0%
V003 Science Journalism Association/Other Professional
Journalism Body UK Other
Country Number Percentage Number Percentage
Yes 25 73.5% 93 64.1% No, was previously 3 8.8% 8 5.5% No, never was 6 17.6% 44 30.3% Total 34 100.0% 145 100.0%
V004 Gender UK Other
Country Number Percentage Number Percentage
Male 16 47.1% 77 53.1% Female 18 52.9% 68 46.9% Total 34 100.0% 145 100.0%

31
V006a Left-Right Spectrum UK Other
Country Number Percentage Number Percentage
Left 8 23.5% 33 22.8% Centre left 18 52.9% 59 40.7% Centre 4 11.8% 20 13.8% Centre right 1 2.9% 9 6.2% Right 0 .0% 3 2.1% Other 3 8.8% 10 6.9% No answer 0 .0% 11 7.6% Total 34 100.0% 145 100.0%
V008 Main Profession UK Other
Country Number Percentage Number Percentage
Science journalism is my main occupation 9 26.5% 25 17.2%
I am a scientist who writes occasionally for the wider public 1 2.9% 0 .0%
I am a public relations officer working with journalists 2 5.9% 7 4.8%
My main employment is other 2 5.9% 17 11.7% No answer 20 58.8% 96 66.2% Total 34 100.0% 145 100.0%
V009 World Region UK Other
Country Number Percentage Number Percentage
Europe/Russia 31 91.2% 75 51.7% Asia/Pacific 0 .0% 21 14.5% South and Central America 0 .0% 13 9.0% USA and Canada 1 2.9% 24 16.6% Northern Africa and Middle East 0 .0% 1 .7% Sub-Saharan and Southern Africa 1 2.9% 10 6.9% No answer 1 2.9% 1 .7% Total 34 100.0% 145 100.0%

32
V011a Satisfaction: freedom of the
press UK Other
Country Number Percentage Number Percentage
Completely satisfied 7 20.6% 28 19.3% Very satisfied 12 35.3% 40 27.6% Satisfied 5 14.7% 42 29.0% Neither satisfied nor dissatisfied 5 14.7% 9 6.2% Dissatisfied 5 14.7% 20 13.8% Very dissatisfied 0 .0% 3 2.1% Completely dissatisfied 0 .0% 3 2.1% DK 0 .0% 0 .0% NA 0 .0% 0 .0% Total 34 100.0% 145 100.0%
V011b Satisfaction: access to information UK
Other Country
Number Percentage Number Percentage Completely satisfied 1 2.9% 3 2.1% Very satisfied 1 2.9% 18 12.4% Satisfied 19 55.9% 52 35.9% Neither satisfied nor dissatisfied 6 17.6% 28 19.3% Dissatisfied 6 17.6% 25 17.2% Very dissatisfied 1 2.9% 11 7.6% Completely dissatisfied 0 .0% 5 3.4% DK 0 .0% 0 .0% NA 0 .0% 3 2.1% Total 34 100.0% 145 100.0%

33
V011c Satisfaction: access to scientists UK
Other Country
Number Percentage Number Percentage Completely satisfied 5 14.7% 15 10.3% Very satisfied 10 29.4% 46 31.7% Satisfied 18 52.9% 50 34.5% Neither satisfied nor dissatisfied 0 .0% 17 11.7% Dissatisfied 0 .0% 11 7.6% Very dissatisfied 0 .0% 3 2.1% Completely dissatisfied 0 .0% 0 .0% DK 0 .0% 0 .0% NA 1 2.9% 2 1.4% No answer 0 .0% 1 .7% Total 34 100.0% 145 100.0%
V011d Satisfaction: personal safety UK Other
Country Number Percentage Number Percentage
Completely satisfied 15 44.1% 42 29.0% Very satisfied 8 23.5% 46 31.7% Satisfied 4 11.8% 22 15.2% Neither satisfied nor dissatisfied 2 5.9% 19 13.1% Dissatisfied 0 .0% 7 4.8% Very dissatisfied 0 .0% 4 2.8% Completely dissatisfied 0 .0% 1 .7% DK 0 .0% 0 .0% NA 5 14.7% 2 1.4% No answer 0 .0% 2 1.4% Total 34 100.0% 145 100.0%
34
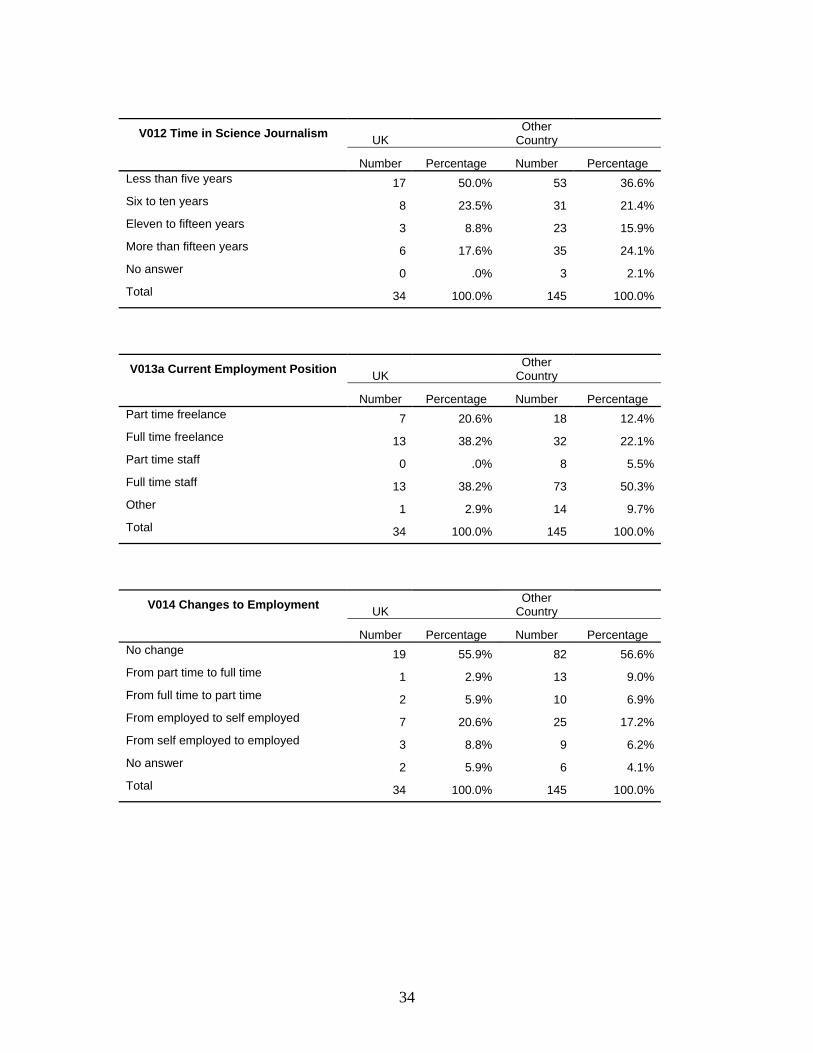
V012 Time in Science Journalism UK Other
Country Number Percentage Number Percentage
Less than five years 17 50.0% 53 36.6% Six to ten years 8 23.5% 31 21.4% Eleven to fifteen years 3 8.8% 23 15.9% More than fifteen years 6 17.6% 35 24.1% No answer 0 .0% 3 2.1% Total 34 100.0% 145 100.0%
V013a Current Employment Position UK Other
Country Number Percentage Number Percentage
Part time freelance 7 20.6% 18 12.4% Full time freelance 13 38.2% 32 22.1% Part time staff 0 .0% 8 5.5% Full time staff 13 38.2% 73 50.3% Other 1 2.9% 14 9.7% Total 34 100.0% 145 100.0%
V014 Changes to Employment UK Other
Country Number Percentage Number Percentage
No change 19 55.9% 82 56.6% From part time to full time 1 2.9% 13 9.0% From full time to part time 2 5.9% 10 6.9% From employed to self employed 7 20.6% 25 17.2% From self employed to employed 3 8.8% 9 6.2% No answer 2 5.9% 6 4.1% Total 34 100.0% 145 100.0%

35
V015a Topic areas covered: health
and medicine UK Other
Country Number Percentage Number Percentage
Mainly 6 17.6% 63 43.4% Occasionally 15 44.1% 63 43.4% Never 7 20.6% 8 5.5% DK 0 .0% 0 .0% N/A 3 8.8% 3 2.1% No answer 3 8.8% 8 5.5% Total 34 100.0% 145 100.0%
V015b Topic areas covered: science UK Other
Country Number Percentage Number Percentage
Mainly 20 58.8% 97 66.9% Occasionally 9 26.5% 41 28.3% Never 1 2.9% 1 .7% DK 0 .0% 0 .0% N/A 1 2.9% 1 .7% No answer 3 8.8% 5 3.4% Total 34 100.0% 145 100.0%
V015c Topic areas covered: technology UK
Other Country
Number Percentage Number Percentage Mainly 10 29.4% 32 22.1% Occasionally 18 52.9% 91 62.8% Never 3 8.8% 9 6.2% DK 0 .0% 0 .0% N/A 1 2.9% 3 2.1% No answer 2 5.9% 10 6.9% Total 34 100.0% 145 100.0%

36
V015d Topic areas covered:
environment UK Other
Country Number Percentage Number Percentage
Mainly 10 29.4% 47 32.4% Occasionally 15 44.1% 82 56.6% Never 6 17.6% 7 4.8% DK 0 .0% 0 .0% N/A 1 2.9% 4 2.8% No answer 2 5.9% 5 3.4% Total 34 100.0% 145 100.0%
V015e Topic areas covered: business UK Other
Country Number Percentage Number Percentage
Mainly 6 17.6% 12 8.3% Occasionally 18 52.9% 55 37.9% Never 6 17.6% 52 35.9% DK 0 .0% 2 1.4% N/A 1 2.9% 8 5.5% No answer 3 8.8% 16 11.0% Total 34 100.0% 145 100.0%
V015f Topic areas covered: social science UK
Other Country
Number Percentage Number Percentage Mainly 3 8.8% 14 9.7% Occasionally 18 52.9% 91 62.8% Never 8 23.5% 21 14.5% DK 0 .0% 1 .7% N/A 2 5.9% 5 3.4% No answer 3 8.8% 13 9.0% Total 34 100.0% 145 100.0%

37
V016a Media: Print UK Other
Country Number Percentage Number Percentage
Mainly 22 64.7% 104 71.7% Occasionally 9 26.5% 30 20.7% Never 1 2.9% 9 6.2% DK 0 .0% 0 .0% N/A 0 .0% 1 .7% No answer 2 5.9% 1 .7% Total 34 100.0% 145 100.0%
V016b Media: Radio UK Other
Country Number Percentage Number Percentage
Mainly 4 11.8% 17 11.7% Occasionally 9 26.5% 49 33.8% Never 14 41.2% 50 34.5% DK 1 2.9% 5 3.4% N/A 1 2.9% 12 8.3% No answer 5 14.7% 12 8.3% Total 34 100.0% 145 100.0%
V016c Media: Television UK Other
Country Number Percentage Number Percentage
Mainly 1 2.9% 16 11.0% Occasionally 3 8.8% 33 22.8% Never 19 55.9% 64 44.1% DK 1 2.9% 4 2.8% N/A 3 8.8% 14 9.7% No answer 7 20.6% 14 9.7% Total 34 100.0% 145 100.0%

38
V016d Media: Podcast UK Other
Country Number Percentage Number Percentage
Mainly 2 5.9% 10 6.9% Occasionally 12 35.3% 27 18.6% Never 12 35.3% 71 49.0% DK 1 2.9% 8 5.5% N/A 1 2.9% 11 7.6% No answer 6 17.6% 18 12.4% Total 34 100.0% 145 100.0%
V016e Media: Video Podcast UK Other
Country Number Percentage Number Percentage
Mainly 0 .0% 2 1.4% Occasionally 5 14.7% 21 14.5% Never 20 58.8% 80 55.2% DK 1 2.9% 9 6.2% N/A 1 2.9% 12 8.3% No answer 7 20.6% 21 14.5% Total 34 100.0% 145 100.0%
V016f Media: Blog UK Other
Country Number Percentage Number Percentage
Mainly 6 17.6% 23 15.9% Occasionally 14 41.2% 52 35.9% Never 7 20.6% 42 29.0% DK 1 2.9% 5 3.4% N/A 1 2.9% 6 4.1% No answer 5 14.7% 17 11.7% Total 34 100.0% 145 100.0%

39
V016g Media: Web Story UK Other
Country Number Percentage Number Percentage
Mainly 18 52.9% 48 33.1% Occasionally 8 23.5% 54 37.2% Never 5 14.7% 25 17.2% DK 0 .0% 6 4.1% N/A 0 .0% 4 2.8% No answer 3 8.8% 8 5.5% Total 34 100.0% 145 100.0%
V016h Media: Book UK Other
Country Number Percentage Number Percentage
Mainly 4 11.8% 7 4.8% Occasionally 7 20.6% 58 40.0% Never 17 50.0% 53 36.6% DK 1 2.9% 4 2.8% N/A 2 5.9% 9 6.2% No answer 3 8.8% 14 9.7% Total 34 100.0% 145 100.0%
V016i Media: Exhibition UK Other
Country Number Percentage Number Percentage
Mainly 2 5.9% 5 3.4% Occasionally 5 14.7% 38 26.2% Never 18 52.9% 66 45.5% DK 1 2.9% 4 2.8% N/A 2 5.9% 14 9.7% No answer 6 17.6% 18 12.4% Total 34 100.0% 145 100.0%

40
V016k Media: Other UK Other
Country Number Percentage Number Percentage
Mainly 1 2.9% 6 4.1% Occasionally 1 2.9% 5 3.4% Never 5 14.7% 10 6.9% DK 0 .0% 3 2.1% N/A 4 11.8% 20 13.8% No answer 23 67.6% 101 69.7% Total 34 100.0% 145 100.0%
V017a Audience: general, wider public UK
Other Country
Number Percentage Number Percentage Mainly 19 55.9% 101 69.7% Occasionally 11 32.4% 36 24.8% Never 2 5.9% 1 .7% DK 0 .0% 1 .7% N/A 0 .0% 0 .0% No answer 2 5.9% 6 4.1% Total 34 100.0% 145 100.0%
V017b Audience: special interest public UK
Other Country
Number Percentage Number Percentage Mainly 11 32.4% 55 37.9% Occasionally 20 58.8% 71 49.0% Never 1 2.9% 4 2.8% DK 0 .0% 4 2.8% N/A 1 2.9% 3 2.1% No answer 1 2.9% 8 5.5% Total 34 100.0% 145 100.0%

41
V017c Audience: scientific audience UK Other
Country Number Percentage Number Percentage
Mainly 11 32.4% 30 20.7% Occasionally 17 50.0% 84 57.9% Never 2 5.9% 14 9.7% DK 0 .0% 5 3.4% N/A 2 5.9% 3 2.1% No answer 2 5.9% 9 6.2% Total 34 100.0% 145 100.0%
V017d Audience: your fellow journalists UK
Other Country
Number Percentage Number Percentage Mainly 0 .0% 22 15.2% Occasionally 17 50.0% 70 48.3% Never 9 26.5% 22 15.2% DK 2 5.9% 9 6.2% N/A 2 5.9% 7 4.8% No answer 4 11.8% 15 10.3% Total 34 100.0% 145 100.0%
V017e Audience: politicians UK Other
Country Number Percentage Number Percentage
Mainly 3 8.8% 18 12.4% Occasionally 15 44.1% 68 46.9% Never 9 26.5% 28 19.3% DK 2 5.9% 12 8.3% N/A 3 8.8% 3 2.1% No answer 2 5.9% 16 11.0% Total 34 100.0% 145 100.0%

42
V017f Audience: other UK Other
Country Number Percentage Number Percentage
Mainly 2 5.9% 10 6.9% Occasionally 0 .0% 4 2.8% Never 1 2.9% 5 3.4% DK 0 .0% 4 2.8% N/A 3 8.8% 15 10.3% No answer 28 82.4% 107 73.8% Total 34 100.0% 145 100.0%
V018a Reaching audiences: no feedback at all UK
Other Country
Number Percentage Number Percentage Yes 6 17.6% 9 6.2% No answer 28 82.4% 136 93.8% Total 34 100.0% 145 100.0%
V018b Reaching audiences: occasional letters UK
Other Country
Number Percentage Number Percentage Yes 22 64.7% 97 66.9% No answer 12 35.3% 48 33.1% Total 34 100.0% 145 100.0%
V018c Reaching audiences: click stream ratings UK
Other Country
Number Percentage Number Percentage Yes 18 52.9% 62 42.8% No answer 16 47.1% 83 57.2% Total 34 100.0% 145 100.0%

43
V018d Reaching audiences: regular
research UK Other
Country Number Percentage Number Percentage
Yes 8 23.5% 42 29.0% No answer 26 76.5% 103 71.0% Total 34 100.0% 145 100.0%
V018e Reaching audiences: friends and family UK
Other Country
Number Percentage Number Percentage Yes 10 29.4% 42 29.0% No answer 24 70.6% 103 71.0% Total 34 100.0% 145 100.0%
V018f Reaching audiences: other feedback UK
Other Country
Number Percentage Number Percentage Yes 7 20.6% 30 20.7% No answer 27 79.4% 115 79.3% Total 34 100.0% 145 100.0%
V019a Role UK Other
Country Number Percentage Number Percentage
To translate complex material 11 32.4% 33 22.8% To entertain 1 2.9% 4 2.8% To inform 17 50.0% 69 47.6% To educate 0 .0% 17 11.7% To mobilise the public 0 .0% 5 3.4% To be a public watchdog 1 2.9% 11 7.6% Other 4 11.8% 5 3.4% No answer 0 .0% 1 .7% Total 34 100.0% 145 100.0%

44
V020a Amount of output: article UK Other
Country Number Percentage Number Percentage
None 5 14.7% 29 20.0% One 8 23.5% 26 17.9% Two 6 17.6% 24 16.6% Three 6 17.6% 19 13.1% Four 0 .0% 14 9.7% Five 2 5.9% 9 6.2% More than five 7 20.6% 23 15.9% No answer 0 .0% 1 .7% Total 34 100.0% 145 100.0%
V020b Amount of output: blog UK Other
Country Number Percentage Number Percentage
None 15 44.1% 87 60.0% One 8 23.5% 21 14.5% Two 3 8.8% 12 8.3% Three 3 8.8% 6 4.1% Four 1 2.9% 4 2.8% Five 0 .0% 2 1.4% More than five 4 11.8% 11 7.6% No answer 0 .0% 2 1.4% Total 34 100.0% 145 100.0%

45
V020c Amount of output: website UK Other
Country Number Percentage Number Percentage
None 13 38.2% 62 42.8% One 7 20.6% 24 16.6% Two 5 14.7% 14 9.7% Three 4 11.8% 8 5.5% Four 1 2.9% 10 6.9% Five 0 .0% 7 4.8% More than five 4 11.8% 18 12.4% No answer 0 .0% 2 1.4% Total 34 100.0% 145 100.0%
V020d Amount of output: podcast UK Other
Country Number Percentage Number Percentage
None 27 79.4% 108 74.5% One 3 8.8% 22 15.2% Two 2 5.9% 7 4.8% Three 2 5.9% 2 1.4% Four 0 .0% 0 .0% Five 0 .0% 1 .7% More than five 0 .0% 3 2.1% No answer 0 .0% 2 1.4% Total 34 100.0% 145 100.0%

46
V020e Amount of output: promotional
text UK Other
Country Number Percentage Number Percentage
None 26 76.5% 110 75.9% One 5 14.7% 21 14.5% Two 1 2.9% 6 4.1% Three 0 .0% 2 1.4% Four 1 2.9% 0 .0% Five 0 .0% 1 .7% More than five 1 2.9% 3 2.1% No answer 0 .0% 2 1.4% Total 34 100.0% 145 100.0%
V020f Amount of output: press release UK
Other Country
Number Percentage Number Percentage None 28 82.4% 100 69.0% One 3 8.8% 22 15.2% Two 1 2.9% 8 5.5% Three 1 2.9% 4 2.8% Four 0 .0% 2 1.4% Five 1 2.9% 2 1.4% More than five 0 .0% 5 3.4% No answer 0 .0% 2 1.4% Total 34 100.0% 145 100.0%

47
V020g Amount of output: exhibition UK Other
Country Number Percentage Number Percentage
None 31 91.2% 127 87.6% One 3 8.8% 10 6.9% Two 0 .0% 1 .7% Three 0 .0% 2 1.4% Four 0 .0% 0 .0% Five 0 .0% 0 .0% More than five 0 .0% 3 2.1% No answer 0 .0% 2 1.4% Total 34 100.0% 145 100.0%
V020h Amount of output: book UK Other
Country Number Percentage Number Percentage
None 26 76.5% 108 74.5% One 7 20.6% 25 17.2% Two 1 2.9% 4 2.8% Three 0 .0% 3 2.1% Four 0 .0% 1 .7% Five 0 .0% 1 .7% More than five 0 .0% 1 .7% No answer 0 .0% 2 1.4% Total 34 100.0% 145 100.0%
V020j Amount of output: other UK Other
Country Number Percentage Number Percentage
None 0 .0% 0 .0% One 0 .0% 2 28.6% Two 0 .0% 2 28.6% Three 1 100.0% 1 14.3% Four 0 .0% 1 14.3% Five 0 .0% 0 .0% More than five 0 .0% 1 14.3% Total 1 100.0% 7 100.0%

48
V021a Story ideas: press release/press officers UK
Other Country
Number Percentage Number Percentage Frequently 10 29.4% 38 26.2% Occasionally 19 55.9% 82 56.6% Never 1 2.9% 7 4.8% DK 0 .0% 1 .7% N/A 2 5.9% 5 3.4% No answer 2 5.9% 12 8.3% Total 34 100.0% 145 100.0%
V021b Story ideas: conferences UK Other
Country Number Percentage Number Percentage
Frequently 5 14.7% 27 18.6% Occasionally 21 61.8% 97 66.9% Never 3 8.8% 7 4.8% DK 1 2.9% 0 .0% N/A 2 5.9% 4 2.8% No answer 2 5.9% 10 6.9% Total 34 100.0% 145 100.0%
V021c Story ideas: other media outlets UK
Other Country
Number Percentage Number Percentage Frequently 5 14.7% 24 16.6% Occasionally 19 55.9% 81 55.9% Never 5 14.7% 5 3.4% DK 0 .0% 2 1.4% N/A 1 2.9% 8 5.5% No answer 4 11.8% 25 17.2% Total 34 100.0% 145 100.0%

49
V021d Story ideas: Nature UK Other
Country Number Percentage Number Percentage
Frequently 5 14.7% 27 18.6% Occasionally 19 55.9% 80 55.2% Never 6 17.6% 16 11.0% DK 0 .0% 0 .0% N/A 2 5.9% 8 5.5% No answer 2 5.9% 14 9.7% Total 34 100.0% 145 100.0%
V021e Story ideas: Science UK Other
Country Number Percentage Number Percentage
Frequently 5 14.7% 29 20.0% Occasionally 16 47.1% 80 55.2% Never 7 20.6% 16 11.0% DK 1 2.9% 1 .7% N/A 3 8.8% 7 4.8% No answer 2 5.9% 12 8.3% Total 34 100.0% 145 100.0%
V021f Story ideas: other science journal UK
Other Country
Number Percentage Number Percentage Frequently 7 20.6% 33 22.8% Occasionally 20 58.8% 82 56.6% Never 1 2.9% 9 6.2% DK 1 2.9% 2 1.4% N/A 3 8.8% 4 2.8% No answer 2 5.9% 15 10.3% Total 34 100.0% 145 100.0%

50
V021g Story ideas: exhibition UK Other
Country Number Percentage Number Percentage
Frequently 0 .0% 2 1.4% Occasionally 16 47.1% 68 46.9% Never 11 32.4% 43 29.7% DK 1 2.9% 1 .7% N/A 4 11.8% 7 4.8% No answer 2 5.9% 24 16.6% Total 34 100.0% 145 100.0%
V021h Story ideas: science media centre UK
Other Country
Number Percentage Number Percentage Frequently 2 5.9% 7 4.8% Occasionally 7 20.6% 37 25.5% Never 19 55.9% 59 40.7% DK 1 2.9% 9 6.2% N/A 4 11.8% 9 6.2% No answer 1 2.9% 24 16.6% Total 34 100.0% 145 100.0%
V021i Story ideas: personal contacts UK Other
Country Number Percentage Number Percentage
Frequently 13 38.2% 46 31.7% Occasionally 15 44.1% 82 56.6% Never 3 8.8% 5 3.4% DK 1 2.9% 0 .0% N/A 1 2.9% 5 3.4% No answer 1 2.9% 7 4.8% Total 34 100.0% 145 100.0%
51
V021j Story ideas: social networking UK Other
Country Number Percentage Number Percentage
Frequently 3 8.8% 11 7.6% Occasionally 12 35.3% 50 34.5% Never 15 44.1% 53 36.6% DK 0 .0% 4 2.8% N/A 1 2.9% 9 6.2% No answer 3 8.8% 18 12.4% Total 34 100.0% 145 100.0%
V021k Story ideas: blog by working scientist UK
Other Country
Number Percentage Number Percentage Frequently 4 11.8% 6 4.1% Occasionally 23 67.6% 89 61.4% Never 4 11.8% 19 13.1% DK 0 .0% 2 1.4% N/A 2 5.9% 7 4.8% No answer 1 2.9% 22 15.2% Total 34 100.0% 145 100.0%
V021l Story ideas: newswire/press agency UK
Other Country
Number Percentage Number Percentage Frequently 3 8.8% 19 13.1% Occasionally 14 41.2% 52 35.9% Never 9 26.5% 32 22.1% DK 4 11.8% 12 8.3% N/A 3 8.8% 14 9.7% No answer 1 2.9% 16 11.0% Total 34 100.0% 145 100.0%

52
V021m Story ideas:
Alphagalileo/Eurekalert UK Other
Country Number Percentage Number Percentage
Frequently 5 14.7% 12 8.3% Occasionally 8 23.5% 24 16.6% Never 8 23.5% 41 28.3% DK 8 23.5% 25 17.2% N/A 4 11.8% 23 15.9% No answer 1 2.9% 20 13.8% Total 34 100.0% 145 100.0%
V021n Story ideas: other blogs UK Other
Country Number Percentage Number Percentage
Frequently 2 5.9% 4 2.8% Occasionally 9 26.5% 34 23.4% Never 5 14.7% 39 26.9% DK 7 20.6% 19 13.1% N/A 7 20.6% 27 18.6% No answer 4 11.8% 22 15.2% Total 34 100.0% 145 100.0%
V022 Images or b-roll UK Other
Country Number Percentage Number Percentage
Frequently 3 8.8% 27 18.6% Occasionally 12 35.3% 58 40.0% Never 9 26.5% 28 19.3% DK 3 8.8% 9 6.2% N/A 6 17.6% 18 12.4% No answer 1 2.9% 5 3.4% Total 34 100.0% 145 100.0%
53
V023 Five years time - still working in
field UK Other
Country Number Percentage Number Percentage
Yes, certainly 7 20.6% 43 29.7% Yes, probably 13 38.2% 59 40.7% No, probably not 3 8.8% 19 13.1% Certainly not 0 .0% 2 1.4% DK 9 26.5% 21 14.5% N/A 1 2.9% 0 .0% No answer 1 2.9% 1 .7% Total 34 100.0% 145 100.0%
V024a Changes to publication/employer in last five
years UK Other
Country Number Percentage Number Percentage
Hired more science, environment, health and technology staff 9 26.5% 42 29.0%
Cut its science, environment, health and technology staff 10 29.4% 41 28.3%
Made no changes 8 23.5% 46 31.7% Other 4 11.8% 9 6.2% No answer 3 8.8% 7 4.8% Total 34 100.0% 145 100.0%
V025 Amount of output change over last five years UK
Other Country
Number Percentage Number Percentage Increased dramatically 5 14.7% 21 14.5% Increased 11 32.4% 70 48.3% Stayed the same 5 14.7% 24 16.6% Decreased 3 8.8% 13 9.0% Decreased dramatically 2 5.9% 3 2.1% DK 7 20.6% 11 7.6% No answer 1 2.9% 3 2.1% Total 34 100.0% 145 100.0%

54
V026a Media output change: print UK Other
Country Number Percentage Number Percentage
More often 10 29.4% 62 42.8% Less often 6 17.6% 18 12.4% The same 7 20.6% 31 21.4% Never 0 .0% 6 4.1% DK 0 .0% 0 .0% N/A 11 32.4% 22 15.2% No answer 0 .0% 6 4.1% Total 34 100.0% 145 100.0%
V026b Media output change: radio UK Other
Country Number Percentage Number Percentage
More often 6 17.6% 18 12.4% Less often 4 11.8% 18 12.4% The same 4 11.8% 13 9.0% Never 3 8.8% 36 24.8% DK 0 .0% 3 2.1% N/A 17 50.0% 40 27.6% No answer 0 .0% 17 11.7% Total 34 100.0% 145 100.0%
V026c Media output change: television UK
Other Country
Number Percentage Number Percentage More often 3 8.8% 15 10.3% Less often 2 5.9% 13 9.0% The same 1 2.9% 14 9.7% Never 7 20.6% 40 27.6% DK 0 .0% 4 2.8% N/A 21 61.8% 41 28.3% No answer 0 .0% 18 12.4% Total 34 100.0% 145 100.0%

55
V026d Media output change: podcast UK Other
Country Number Percentage Number Percentage
More often 4 11.8% 10 6.9% Less often 5 14.7% 7 4.8% The same 2 5.9% 11 7.6% Never 4 11.8% 43 29.7% DK 0 .0% 7 4.8% N/A 19 55.9% 45 31.0% No answer 0 .0% 22 15.2% Total 34 100.0% 145 100.0%
V026e Media output change: video podcast UK
Other Country
Number Percentage Number Percentage More often 1 2.9% 7 4.8% Less often 6 17.6% 4 2.8% The same 2 5.9% 9 6.2% Never 5 14.7% 45 31.0% DK 0 .0% 8 5.5% N/A 19 55.9% 48 33.1% No answer 1 2.9% 24 16.6% Total 34 100.0% 145 100.0%
V026f Media output change: blog UK Other
Country Number Percentage Number Percentage
More often 5 14.7% 31 21.4% Less often 6 17.6% 18 12.4% The same 1 2.9% 11 7.6% Never 4 11.8% 29 20.0% DK 0 .0% 5 3.4% N/A 17 50.0% 32 22.1% No answer 1 2.9% 19 13.1% Total 34 100.0% 145 100.0%

56
V026g Media output change: web
story UK Other
Country Number Percentage Number Percentage
More often 7 20.6% 40 27.6% Less often 7 20.6% 22 15.2% The same 5 14.7% 15 10.3% Never 2 5.9% 13 9.0% DK 0 .0% 6 4.1% N/A 13 38.2% 31 21.4% No answer 0 .0% 18 12.4% Total 34 100.0% 145 100.0%
V026h Media output change: book UK Other
Country Number Percentage Number Percentage
More often 4 11.8% 15 10.3% Less often 0 .0% 16 11.0% The same 4 11.8% 19 13.1% Never 6 17.6% 32 22.1% DK 0 .0% 3 2.1% N/A 19 55.9% 39 26.9% No answer 1 2.9% 21 14.5% Total 34 100.0% 145 100.0%
V026i Media output change: exhibition UK
Other Country
Number Percentage Number Percentage More often 2 5.9% 13 9.0% Less often 0 .0% 8 5.5% The same 3 8.8% 12 8.3% Never 4 11.8% 40 27.6% DK 0 .0% 7 4.8% N/A 23 67.6% 43 29.7% No answer 2 5.9% 22 15.2% Total 34 100.0% 145 100.0%

57
V026j Media output change: other UK Other
Country Number Percentage Number Percentage
More often 0 .0% 2 1.4% Less often 0 .0% 3 2.1% The same 1 2.9% 1 .7% Never 1 2.9% 9 6.2% DK 0 .0% 2 1.4% N/A 16 47.1% 32 22.1% No answer 16 47.1% 96 66.2% Total 34 100.0% 145 100.0%
V027 Direct quotes from press release/press officers UK
Other Country
Number Percentage Number Percentage Increased 3 8.8% 32 22.1% The same frequency 8 23.5% 38 26.2% Became less frequent 5 14.7% 16 11.0% Never used such quotes 7 20.6% 21 14.5% DK 0 .0% 7 4.8% N/A 11 32.4% 27 18.6% No answer 0 .0% 4 2.8% Total 34 100.0% 145 100.0%
V028a Future: science journalism is a dying profession UK
Other Country
Number Percentage Number Percentage Totally agree 1 2.9% 2 1.4% Agree 3 8.8% 11 7.6% Neither agree nor disagree 8 23.5% 17 11.7% Disagree 16 47.1% 67 46.2% Totally disagree 6 17.6% 40 27.6% DK 0 .0% 7 4.8% N/A 0 .0% 0 .0% No answer 0 .0% 1 .7% Total 34 100.0% 145 100.0%

58
V028b Future: libel suits more
common UK Other
Country Number Percentage Number Percentage
Totally agree 1 2.9% 6 4.1% Agree 6 17.6% 19 13.1% Neither agree nor disagree 8 23.5% 23 15.9% Disagree 7 20.6% 43 29.7% Totally disagree 1 2.9% 18 12.4% DK 11 32.4% 33 22.8% N/A 0 .0% 3 2.1% Total 34 100.0% 145 100.0%
V028c Future: too few people report on process UK
Other Country
Number Percentage Number Percentage Totally agree 6 17.6% 25 17.2% Agree 10 29.4% 65 44.8% Neither agree nor disagree 8 23.5% 23 15.9% Disagree 4 11.8% 16 11.0% Totally disagree 1 2.9% 4 2.8% DK 5 14.7% 10 6.9% N/A 0 .0% 1 .7% No answer 0 .0% 1 .7% Total 34 100.0% 145 100.0%
V028d Future: crisis UK Other
Country Number Percentage Number Percentage
Totally agree 1 2.9% 9 6.2% Agree 8 23.5% 45 31.0% Neither agree nor disagree 10 29.4% 32 22.1% Disagree 13 38.2% 42 29.0% Totally disagree 0 .0% 8 5.5% DK 2 5.9% 8 5.5% N/A 0 .0% 1 .7% Total 34 100.0% 145 100.0%
59
V028e Future: PR driving news and
reportage UK Other
Country Number Percentage Number Percentage
Totally agree 3 8.8% 13 9.0% Agree 19 55.9% 70 48.3% Neither agree nor disagree 3 8.8% 26 17.9% Disagree 6 17.6% 23 15.9% Totally disagree 0 .0% 1 .7% DK 3 8.8% 10 6.9% N/A 0 .0% 2 1.4% Total 34 100.0% 145 100.0%
V028f Future: high quality UK Other
Country Number Percentage Number Percentage
Totally agree 3 8.8% 30 20.7% Agree 17 50.0% 52 35.9% Neither agree nor disagree 11 32.4% 39 26.9% Disagree 3 8.8% 13 9.0% Totally disagree 0 .0% 0 .0% DK 0 .0% 9 6.2% N/A 0 .0% 1 .7% No answer 0 .0% 1 .7% Total 34 100.0% 145 100.0%
V028g Future: McNews UK Other
Country Number Percentage Number Percentage
Totally agree 4 11.8% 17 11.7% Agree 19 55.9% 70 48.3% Neither agree nor disagree 5 14.7% 24 16.6% Disagree 1 2.9% 14 9.7% Totally disagree 0 .0% 5 3.4% DK 5 14.7% 14 9.7% N/A 0 .0% 1 .7% Total 34 100.0% 145 100.0%
60
V028h Future: specialisation UK Other
Country Number Percentage Number Percentage
Totally agree 3 8.8% 6 4.1% Agree 9 26.5% 52 35.9% Neither agree nor disagree 9 26.5% 32 22.1% Disagree 2 5.9% 14 9.7% Totally disagree 0 .0% 2 1.4% DK 11 32.4% 35 24.1% N/A 0 .0% 2 1.4% No answer 0 .0% 2 1.4% Total 34 100.0% 145 100.0%
V028i Future: more interesting science UK
Other Country
Number Percentage Number Percentage Totally agree 8 23.5% 24 16.6% Agree 14 41.2% 67 46.2% Neither agree nor disagree 9 26.5% 33 22.8% Disagree 3 8.8% 16 11.0% Totally disagree 0 .0% 2 1.4% DK 0 .0% 3 2.1% N/A 0 .0% 0 .0% Total 34 100.0% 145 100.0%
V028j Future: cut and paste from UK/US UK
Other Country
Number Percentage Number Percentage Totally agree 1 2.9% 4 2.8% Agree 8 23.5% 27 18.6% Neither agree nor disagree 9 26.5% 23 15.9% Disagree 11 32.4% 51 35.2% Totally disagree 2 5.9% 26 17.9% DK 3 8.8% 11 7.6% N/A 0 .0% 2 1.4% No answer 0 .0% 1 .7% Total 34 100.0% 145 100.0%
61
V028k Future: unpopular with editors UK Other
Country Number Percentage Number Percentage
Totally agree 0 .0% 18 12.4% Agree 10 29.4% 41 28.3% Neither agree nor disagree 10 29.4% 28 19.3% Disagree 6 17.6% 37 25.5% Totally disagree 1 2.9% 7 4.8% DK 7 20.6% 13 9.0% N/A 0 .0% 1 .7% Total 34 100.0% 145 100.0%
V028l Future: more society less science UK
Other Country
Number Percentage Number Percentage Totally agree 4 11.8% 18 12.4% Agree 10 29.4% 45 31.0% Neither agree nor disagree 6 17.6% 27 18.6% Disagree 12 35.3% 34 23.4% Totally disagree 1 2.9% 13 9.0% DK 0 .0% 8 5.5% N/A 1 2.9% 0 .0% Total 34 100.0% 145 100.0%
V028m Future: stories stale after few days UK
Other Country
Number Percentage Number Percentage Totally agree 5 14.7% 6 4.1% Agree 17 50.0% 44 30.3% Neither agree nor disagree 6 17.6% 28 19.3% Disagree 2 5.9% 46 31.7% Totally disagree 0 .0% 10 6.9% DK 4 11.8% 11 7.6% N/A 0 .0% 0 .0% Total 34 100.0% 145 100.0%

62
V028n Future: exciting UK Other
Country Number Percentage Number Percentage
Totally agree 6 17.6% 31 21.4% Agree 14 41.2% 39 26.9% Neither agree nor disagree 6 17.6% 47 32.4% Disagree 7 20.6% 18 12.4% Totally disagree 0 .0% 1 .7% DK 1 2.9% 7 4.8% N/A 0 .0% 2 1.4% Total 34 100.0% 145 100.0%
V028o Future: low pay UK Other
Country Number Percentage Number Percentage
Totally agree 8 23.5% 11 7.6% Agree 11 32.4% 36 24.8% Neither agree nor disagree 6 17.6% 39 26.9% Disagree 4 11.8% 14 9.7% Totally disagree 0 .0% 3 2.1% DK 5 14.7% 37 25.5% N/A 0 .0% 4 2.8% No answer 0 .0% 1 .7% Total 34 100.0% 145 100.0%
V029a Quantity of science journalism UK Other
Country Number Percentage Number Percentage
Too much stuff 1 2.9% 1 .7% Sufficient coverage 22 64.7% 41 28.3% Insufficient coverage 9 26.5% 100 69.0% DK 1 2.9% 1 .7% N/A 0 .0% 2 1.4% No answer 1 2.9% 0 .0% Total 34 100.0% 145 100.0%

63
V029b Quality of science journalism UK Other
Country Number Percentage Number Percentage
Very good 9 26.5% 3 2.1% Good 9 26.5% 51 35.2% Fair 12 35.3% 69 47.6% Bad 2 5.9% 11 7.6% Very bad 1 2.9% 9 6.2% DK 0 .0% 0 .0% N/A 0 .0% 2 1.4% No answer 1 2.9% 0 .0% Total 34 100.0% 145 100.0%
V030 Tone of science news/reportage UK Other
Country Number Percentage Number Percentage
Too critical 0 .0% 5 3.4% Not critical enough 19 55.9% 86 59.3% Generally fair 12 35.3% 44 30.3% DK 3 8.8% 5 3.4% N/A 0 .0% 5 3.4% Total 34 100.0% 145 100.0%
V031 Working pressures UK Other
Country Number Percentage Number Percentage
Harming 19 55.9% 87 60.0% Not harming 1 2.9% 13 9.0% Just changing 7 20.6% 17 11.7% DK 7 20.6% 24 16.6% N/A 0 .0% 3 2.1% No answer 0 .0% 1 .7% Total 34 100.0% 145 100.0%

64
V032a Worry about science
journalism UK Other
Country Number Percentage Number Percentage
Quality of writing 8 23.5% 70 48.3% Type of job assignments I can get 7 20.6% 18 12.4% Job security; to have a job next year at all 11 32.4% 36 24.8%
Other 7 20.6% 20 13.8% No answer 1 2.9% 1 .7% Total 34 100.0% 145 100.0%
V033a Criticisms of print media: eroded distinction of report and
comment UK Other
Country Number Percentage Number Percentage
Totally agree 1 2.9% 7 4.8% Agree 10 29.4% 50 34.5% Neither agree nor disagree 8 23.5% 42 29.0% Disagree 11 32.4% 32 22.1% Totally disagree 1 2.9% 3 2.1% DK 3 8.8% 9 6.2% N/A 0 .0% 2 1.4% Total 34 100.0% 145 100.0%
V033b Criticisms of print media: factual errors, slopping writing UK
Other Country
Number Percentage Number Percentage Totally agree 2 5.9% 11 7.6% Agree 10 29.4% 48 33.1% Neither agree nor disagree 8 23.5% 37 25.5% Disagree 8 23.5% 35 24.1% Totally disagree 2 5.9% 2 1.4% DK 4 11.8% 10 6.9% N/A 0 .0% 0 .0% No answer 0 .0% 2 1.4% Total 34 100.0% 145 100.0%

65
V033c Criticisms of print media: little
attention paid to complex issues UK Other
Country Number Percentage Number Percentage
Totally agree 8 23.5% 29 20.0% Agree 12 35.3% 79 54.5% Neither agree nor disagree 7 20.6% 18 12.4% Disagree 4 11.8% 13 9.0% Totally disagree 1 2.9% 2 1.4% DK 2 5.9% 2 1.4% N/A 0 .0% 0 .0% No answer 0 .0% 2 1.4% Total 34 100.0% 145 100.0%
V033d Criticisms of print media: newspapers are a thing of the past UK
Other Country
Number Percentage Number Percentage Totally agree 1 2.9% 2 1.4% Agree 3 8.8% 16 11.0% Neither agree nor disagree 7 20.6% 43 29.7% Disagree 19 55.9% 66 45.5% Totally disagree 2 5.9% 13 9.0% DK 2 5.9% 4 2.8% N/A 0 .0% 0 .0% No answer 0 .0% 1 .7% Total 34 100.0% 145 100.0%

66
V033e Criticisms of print media:
‘death of print journalism’ is exaggerated UK
Other Country
Number Percentage Number Percentage Totally agree 3 8.8% 19 13.1% Agree 15 44.1% 67 46.2% Neither agree nor disagree 8 23.5% 17 11.7% Disagree 3 8.8% 24 16.6% Totally disagree 0 .0% 3 2.1% DK 5 14.7% 14 9.7% N/A 0 .0% 0 .0% No answer 0 .0% 1 .7% Total 34 100.0% 145 100.0%
V033f Criticisms of print media: internet is changing journalism UK
Other Country
Number Percentage Number Percentage Totally agree 8 23.5% 34 23.4% Agree 20 58.8% 71 49.0% Neither agree nor disagree 6 17.6% 19 13.1% Disagree 0 .0% 17 11.7% Totally disagree 0 .0% 1 .7% DK 0 .0% 2 1.4% N/A 0 .0% 0 .0% No answer 0 .0% 1 .7% Total 34 100.0% 145 100.0%

67
V033g Criticisms of print media: press is too cynical UK
Other Country
Number Percentage Number Percentage Totally agree 2 5.9% 10 6.9% Agree 5 14.7% 17 11.7% Neither agree nor disagree 11 32.4% 46 31.7% Disagree 15 44.1% 59 40.7% Totally disagree 1 2.9% 7 4.8% DK 0 .0% 4 2.8% N/A 0 .0% 1 .7% No answer 0 .0% 1 .7% Total 34 100.0% 145 100.0%
V033h Criticisms of print media: journalists out of touch with
audience UK Other
Country Number Percentage Number Percentage
Totally agree 0 .0% 3 2.1% Agree 5 14.7% 27 18.6% Neither agree nor disagree 10 29.4% 48 33.1% Disagree 15 44.1% 48 33.1% Totally disagree 2 5.9% 7 4.8% DK 2 5.9% 12 8.3% N/A 0 .0% 0 .0% Total 34 100.0% 145 100.0%
V033i Criticisms of print media: journalists' ideology biases reporting UK
Other Country
Number Percentage Number Percentage Totally agree 1 2.9% 5 3.4% Agree 7 20.6% 44 30.3% Neither agree nor disagree 11 32.4% 47 32.4% Disagree 9 26.5% 31 21.4% Totally disagree 2 5.9% 9 6.2% DK 4 11.8% 6 4.1% N/A 0 .0% 2 1.4% No answer 0 .0% 1 .7% Total 34 100.0% 145 100.0%

68
V033j Criticisms of print media: press
is too timid UK Other
Country Number Percentage Number Percentage
Totally agree 0 .0% 11 7.6% Agree 13 38.2% 45 31.0% Neither agree nor disagree 8 23.5% 45 31.0% Disagree 12 35.3% 25 17.2% Totally disagree 1 2.9% 3 2.1% DK 0 .0% 10 6.9% N/A 0 .0% 4 2.8% No answer 0 .0% 2 1.4% Total 34 100.0% 145 100.0%
V033k Criticisms of print media: 24 hour news weakens journalism UK
Other Country
Number Percentage Number Percentage Totally agree 5 14.7% 17 11.7% Agree 10 29.4% 48 33.1% Neither agree nor disagree 6 17.6% 33 22.8% Disagree 9 26.5% 32 22.1% Totally disagree 1 2.9% 5 3.4% DK 3 8.8% 8 5.5% N/A 0 .0% 1 .7% No answer 0 .0% 1 .7% Total 34 100.0% 145 100.0%

69
V033l Criticisms of print media:
internet material is too often unvetted UK Other
Country Number Percentage Number Percentage
Totally agree 4 11.8% 15 10.3% Agree 11 32.4% 53 36.6% Neither agree nor disagree 9 26.5% 31 21.4% Disagree 7 20.6% 22 15.2% Totally disagree 0 .0% 1 .7% DK 3 8.8% 15 10.3% N/A 0 .0% 5 3.4% No answer 0 .0% 3 2.1% Total 34 100.0% 145 100.0%
V034a Sponsorship of science desk UK Other
Country Number Percentage Number Percentage
No 20 58.8% 60 41.4% Yes 14 41.2% 84 57.9% No answer 0 .0% 1 .7% Total 34 100.0% 145 100.0%
V034b Who should sponsor: government agency UK
Other Country
Number Percentage Number Percentage A suitable sponsor 10 29.4% 51 35.2% Not a suitable sponsor 4 11.8% 32 22.1% DK 1 2.9% 11 7.6% NA 1 2.9% 1 .7% No answer 18 52.9% 50 34.5% Total 34 100.0% 145 100.0%

70
V034c Who should sponsor: leading
national university UK Other
Country Number Percentage Number Percentage
A suitable sponsor 11 32.4% 66 45.5% Not a suitable sponsor 4 11.8% 22 15.2% DK 1 2.9% 8 5.5% NA 0 .0% 0 .0% No answer 18 52.9% 49 33.8% Total 34 100.0% 145 100.0%
V034d Who should sponsor: foreign university (not on paper Q) UK
Other Country
Number Percentage Number Percentage A suitable sponsor 5 14.7% 29 20.0% Not a suitable sponsor 3 8.8% 20 13.8% DK 3 8.8% 11 7.6% NA 0 .0% 1 .7% No answer 23 67.6% 84 57.9% Total 34 100.0% 145 100.0%
V034e Who should sponsor: national pharmaceutical industry UK
Other Country
Number Percentage Number Percentage A suitable sponsor 1 2.9% 13 9.0% Not a suitable sponsor 14 41.2% 74 51.0% DK 0 .0% 3 2.1% NA 1 2.9% 3 2.1% No answer 18 52.9% 52 35.9% Total 34 100.0% 145 100.0%

71
V034f Who should sponsor: other
national industry UK Other
Country Number Percentage Number Percentage
A suitable sponsor 3 8.8% 21 14.5% Not a suitable sponsor 9 26.5% 55 37.9% DK 3 8.8% 11 7.6% NA 1 2.9% 4 2.8% No answer 18 52.9% 54 37.2% Total 34 100.0% 145 100.0%
V034g Who should sponsor: foreign industry UK
Other Country
Number Percentage Number Percentage A suitable sponsor 1 2.9% 17 11.7% Not a suitable sponsor 11 32.4% 58 40.0% DK 3 8.8% 13 9.0% NA 1 2.9% 3 2.1% No answer 18 52.9% 54 37.2% Total 34 100.0% 145 100.0%
V034h Who should sponsor: national charitable foundation UK
Other Country
Number Percentage Number Percentage A suitable sponsor 12 35.3% 82 56.6% Not a suitable sponsor 2 5.9% 7 4.8% DK 1 2.9% 5 3.4% NA 1 2.9% 1 .7% No answer 18 52.9% 50 34.5% Total 34 100.0% 145 100.0%

72
V034i Who should sponsor: foreign
charitable foundation UK Other
Country Number Percentage Number Percentage
A suitable sponsor 9 26.5% 66 45.5% Not a suitable sponsor 4 11.8% 16 11.0% DK 3 8.8% 9 6.2% NA 1 2.9% 1 .7% No answer 17 50.0% 53 36.6% Total 34 100.0% 145 100.0%
V034k Who should sponsor: other UK Other
Country Number Percentage Number Percentage
A suitable sponsor 0 .0% 12 8.3% Not a suitable sponsor 1 2.9% 1 .7% DK 2 5.9% 4 2.8% NA 1 2.9% 11 7.6% No answer 30 88.2% 117 80.7% Total 34 100.0% 145 100.0%
V035 Where is science journalism moving UK
Other Country
Number Percentage Number Percentage On the right track 9 26.5% 40 27.6% On the wrong track 4 11.8% 26 17.9% DK 20 58.8% 73 50.3% NA 1 2.9% 5 3.4% No answer 0 .0% 1 .7% Total 34 100.0% 145 100.0%
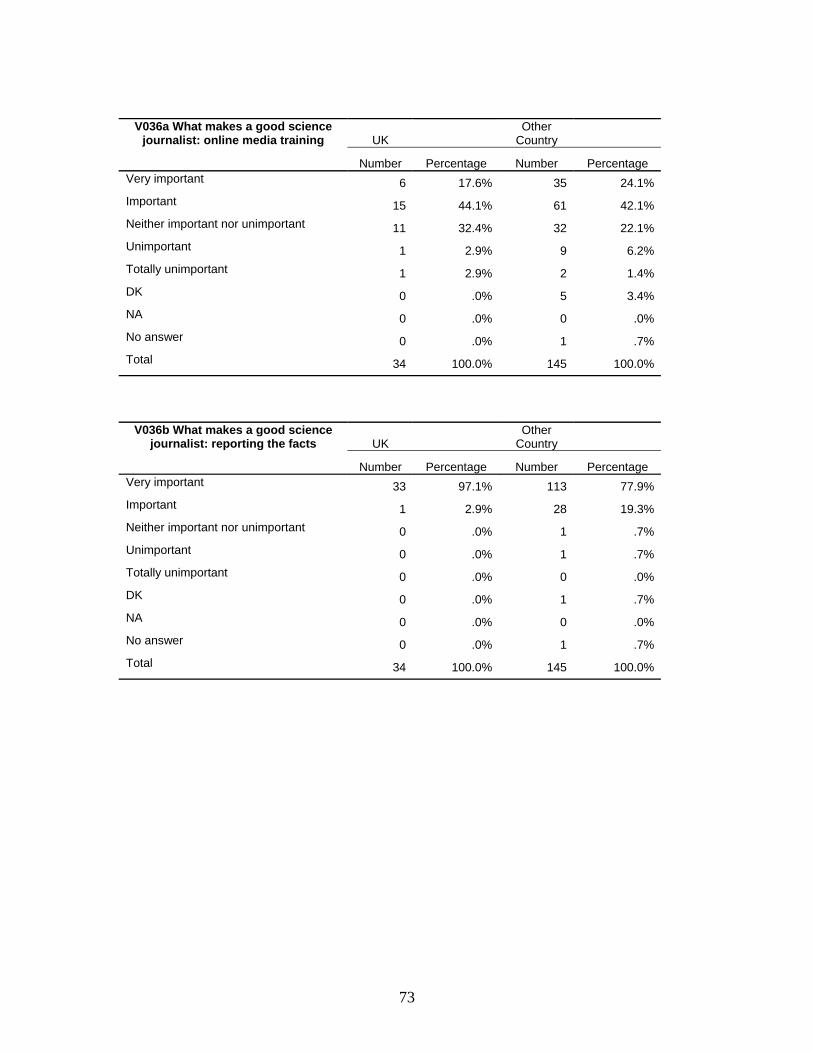
73
V036a What makes a good science
journalist: online media training UK Other
Country Number Percentage Number Percentage
Very important 6 17.6% 35 24.1% Important 15 44.1% 61 42.1% Neither important nor unimportant 11 32.4% 32 22.1% Unimportant 1 2.9% 9 6.2% Totally unimportant 1 2.9% 2 1.4% DK 0 .0% 5 3.4% NA 0 .0% 0 .0% No answer 0 .0% 1 .7% Total 34 100.0% 145 100.0%
V036b What makes a good science journalist: reporting the facts UK
Other Country
Number Percentage Number Percentage Very important 33 97.1% 113 77.9% Important 1 2.9% 28 19.3% Neither important nor unimportant 0 .0% 1 .7% Unimportant 0 .0% 1 .7% Totally unimportant 0 .0% 0 .0% DK 0 .0% 1 .7% NA 0 .0% 0 .0% No answer 0 .0% 1 .7% Total 34 100.0% 145 100.0%

74
UK Other
Country Number Percentage Number Percentage
Very important 16 47.1% 67 46.2% Important 9 26.5% 56 38.6% Neither important nor unimportant 6 17.6% 17 11.7% Unimportant 0 .0% 2 1.4% Totally unimportant 2 5.9% 0 .0% DK 0 .0% 2 1.4% NA 1 2.9% 0 .0% No answer 0 .0% 1 .7% Total 34 100.0% 145 100.0%
V036d What makes a good science journalist: numeracy/grasp of
statistics UK Other
Country Number Percentage Number Percentage
Very important 19 55.9% 59 40.7% Important 14 41.2% 68 46.9% Neither important nor unimportant 0 .0% 9 6.2% Unimportant 1 2.9% 5 3.4% Totally unimportant 0 .0% 0 .0% DK 0 .0% 3 2.1% NA 0 .0% 0 .0% No answer 0 .0% 1 .7% Total 34 100.0% 145 100.0%

75
V036e What makes a good science journalist: science degree UK
Other Country
Number Percentage Number Percentage Very important 5 14.7% 9 6.2% Important 10 29.4% 46 31.7% Neither important nor unimportant 6 17.6% 59 40.7% Unimportant 10 29.4% 24 16.6% Totally unimportant 2 5.9% 3 2.1% DK 0 .0% 3 2.1% NA 0 .0% 0 .0% No answer 1 2.9% 1 .7% Total 34 100.0% 145 100.0%
V036f What makes a good science journalist: investigative journalism UK
Other Country
Number Percentage Number Percentage Very important 10 29.4% 50 34.5% Important 16 47.1% 59 40.7% Neither important nor unimportant 5 14.7% 25 17.2% Unimportant 2 5.9% 3 2.1% Totally unimportant 0 .0% 1 .7% DK 0 .0% 6 4.1% NA 1 2.9% 0 .0% No answer 0 .0% 1 .7% Total 34 100.0% 145 100.0%

76
V036g What makes a good science
journalist: trained in relevant science UK Other
Country Number Percentage Number Percentage
Very important 2 5.9% 33 22.8% Important 10 29.4% 52 35.9% Neither important nor unimportant 13 38.2% 36 24.8% Unimportant 6 17.6% 18 12.4% Totally unimportant 3 8.8% 3 2.1% DK 0 .0% 1 .7% NA 0 .0% 1 .7% No answer 0 .0% 1 .7% Total 34 100.0% 145 100.0%
V036h What makes a good science journalist: using images UK
Other Country
Number Percentage Number Percentage Very important 7 20.6% 42 29.0% Important 14 41.2% 64 44.1% Neither important nor unimportant 9 26.5% 24 16.6% Unimportant 3 8.8% 8 5.5% Totally unimportant 0 .0% 1 .7% DK 0 .0% 5 3.4% NA 1 2.9% 0 .0% No answer 0 .0% 1 .7% Total 34 100.0% 145 100.0%

77
V036j What makes a good science journalist: other UK
Other Country
Number Percentage Number Percentage Very important 1 2.9% 15 10.3% Important 1 2.9% 2 1.4% Neither important nor unimportant 1 2.9% 1 .7% Unimportant 0 .0% 1 .7% Totally unimportant 0 .0% 0 .0% DK 0 .0% 7 4.8% NA 4 11.8% 7 4.8% No answer 27 79.4% 112 77.2% Total 34 100.0% 145 100.0%
V037 Satisfied with work as science journalist UK
Other Country
Number Percentage Number Percentage Completely satisfied 1 2.9% 17 11.7% Satisfied 22 64.7% 84 57.9% Neither satisfied nor dissatisfied 3 8.8% 30 20.7% Dissatisfied 3 8.8% 7 4.8% Completely dissatisfied 0 .0% 1 .7% DK 0 .0% 1 .7% NA 4 11.8% 4 2.8% No answer 1 2.9% 1 .7% Total 34 100.0% 145 100.0%
V038 Recommend a career as science journalist UK
Other Country
Number Percentage Number Percentage Yes, certainly 9 26.5% 49 33.8% Yes, probably 17 50.0% 64 44.1% Probably not 6 17.6% 18 12.4% Definitely not 1 2.9% 6 4.1% DK 1 2.9% 6 4.1% NA 0 .0% 0 .0% No answer 0 .0% 2 1.4% Total 34 100.0% 145 100.0%