Embed Size (px)
Citation preview

The Self-Sufficiency STandard for ConneCtiCut 2015Prepared for connecticut Permanent commission on the Status of Women

the Center for Women’s WelfareThe center for Women’s Welfare at the university of Washington School of Social Work is
devoted to furthering the goal of economic justice for women and their families. The main
work of the Center focuses on the development of the Self-Sufficiency Standard. Under the
direction of Dr. Diana Pearce, the Center partners with a range of government, non-profit,
women’s, children’s, and community-based groups to:
• research and evaluate public policy related to income adequacy;
• create tools to assess and establish income adequacy; and
• develop programs and policies that strengthen public investment in low-income women,
children, and families.
For more information about the Center’s programs, or work related to the Self-Sufficiency
Standard, call (206) 685-5264. This report and more can be viewed at
http://www.selfsufficiencystandard.org.
Center for Women’s Welfare…advancing economic justice through research and the Sel f-Suciency Standard
the Permanent Commission on the status of WomenThe Permanent commission on the Status of Women (PcSW) was formed in 1973 under
Sec. 46a-1 of the connecticut General Statutes to study and improve connecticut women’s
economic security, health, and safety; to promote consideration of qualified women to
leadership positions; and to work toward the elimination of gender discrimination. as a
nonpartisan arm of the General assembly, the agency monitors, critiques, and recommends
changes to legislation in order to inform public policy, and assesses programs and practices in
all state agencies for their effect on the state’s women. The PcSW serves as a liaison between
government and its diverse constituents, and convenes stakeholders—including the business,
nonprofit and educational communities, local governments, and the media—in order to
promote awareness of women’s issues.
Permanent commission on the Status of Women
18-20 Trinity Street
hartford, cT 06106
Phone: 860-240-8300
fax: 860-240-8314
email: [email protected]
http://www.ctpcsw.com

The Self-Sufficiency STandard for connecTicuT 2015By Diana m. Pearce, PhD • september 2015
DireCtor, Center for Women’s Welfare
uniVersitY of WashinGton sChool of soCial WorK
PrePareD for the Permanent Commission on the status of Women

The Self-Sufficiency Standard for Connecticut 2015©2015DianaPearceandThePermanentCommissionontheStatusofWomen

Pre face
ThisreportpresentsandanalyzesThe Self-Sufficiency Standard for Connecticut 2015.Thismeasurecalculateshowmuchincomeafamilymustearntomeetbasicneeds,withtheamountvaryingbyfamilycompositionandwheretheylive.TheStandardpresentedhereisatoolthatcanbeusedinavarietyofways—byclientsofworkforce/trainingprogramsseekingpathstoself-sufficiency,byprogrammanagerstoevaluateprogrameffectiveness,andbypolicymakersandlegislatorsseekingtocreateprogramsandpathwaysthatleadtoself-sufficiencyforworkingfamilies.
The Self-Sufficiency Standard for Connecticut 2015isthethirdcalculationofthisdata.TheStandardforConnecticuthasbeenpreviouslypublishedfor2000and2005.AswithallSelf-SufficiencyStandardreports,thisonewasauthoredbyDr.DianaM.PearceandproducedbytheCenterforWomen’sWelfareattheUniversityofWashington.Thisreport,plustablesprovidingregion-specificinformationfor152familytypes,isavailableonlineatwww.selfsufficiencystandard.orgordownloadthereportatwww.ctpcsw.com.
Dr.DianaPearcedevelopedtheSelf-SufficiencyStandardwhileshewastheDirectoroftheWomenandPovertyProjectatWiderOpportunitiesforWomen(WOW).TheFordFoundationprovidedfundingfortheStandard’soriginaldevelopment.
Overthepast19yearstheStandardhasbeencalculatedin37statesaswellastheDistrictofColumbiaandNewYorkCity.Itsusehastransformedthewaypoliciesandprogramsforlow-incomeworkersarestructuredandhascontributedtoagreaterunderstandingofwhatittakestohaveadequateincometomeetone’sbasicneedsintheUnitedStates.
ForfurtherinformationaboutanyoftheotherstateswiththeStandard,includingthelatestreports,theStandarddataitself,andrelatedpublicationssuchasdemographicreports(whichanalyzehowmanyandwhichhouseholdsareaboveandbelowtheStandard),pleaseseewww.selfsufficiencystandard.org.AlistofSelf-SufficiencyStandardstatepartnersisalsoavailableatthiswebsite.
Forfurtherinformation,contactLisaManzerwiththeCenterat(206)685-5264/[email protected],orthereportauthorandCenterDirector,Dr.DianaPearce,at(206)616-2850/[email protected].

acknowled gment s
The Self-Sufficiency Standard for Connecticut 2015 hasbeenpreparedthroughthecooperativeeffortsofLisaManzer,LisaMikesell,andKarenSegarattheUniversityofWashington,CenterforWomen’sWelfare,andCarolynTreissandChristinePalmofthePermanentCommissionontheStatusofWomen.
AnumberofotherpeoplehavealsocontributedtothedevelopmentoftheStandard,itscalculation,andthewritingofstatereportsoverthepast18years.JenniferBrooks,MaureenGolga,andKateFarrar,formerDirectorsofSelf-SufficiencyProgramsandPoliciesatWOW,werekeytotheearlydevelopmentofinitiativesthatpromotedtheconceptofself-sufficiencyandtheuseoftheStandard,andwereinstrumentalinfacilitatingandnurturingstatecoalitions.AdditionalpastcontributorstotheStandardhaveincludedLauraHenzeRussell,JaniceHamiltonOuttz,RobertaSpalter-Roth,AntoniaJuhasz,AliceGates,AleshaDurfee,MelanieLavelle,NinaDunning,MaureenNewby,andSeookJeong.
Theconclusionsandopinionscontainedwithinthisdocumentdonotnecessarilyreflecttheopinionsofthoselistedabove.Anymistakesaretheauthor’sresponsibility.

e xecut i ve summar y
ThePermanentCommissionontheStatusofWomenispublishingThe Self-Sufficiency Standard for Connecticut 2015inanefforttoensurethebestdataandanalysesareavailabletoenableConnecticut’sfamiliesandindividualstomakeprogresstowardrealeconomicsecurity.Theresultisacomprehensive,credible,anduser-friendlytool.
AttheheartofthisreportistheSelf-SufficiencyStandarditself.ThismeasuredescribeshowmuchincomefamiliesofvarioussizesandcompositionneedtomakeendsmeetwithoutpublicorprivateassistanceineachregionofConnecticut.TheSelf-SufficiencyStandardisameasureofincomeadequacythatisbasedonthecostsofbasicneedsforworkingfamilies:housing,childcare,food,healthcare,transportation,andmiscellaneousitems,aswellasthecostoftaxesandtheimpactoftaxcredits.Inaddition,thisreportprovidesforeachfamilytype,ineachplace,theamountofemergencysavingsrequiredtomeetneedsduringaperiodofunemploymentorotheremergency.
TheSelf-Sufficiency Standard for Connecticut 2015 definestheincomeneededtorealisticallysupportafamily,withoutpublicorprivateassistance.FormostworkersthroughoutConnecticuttheSelf-SufficiencyStandardshowsthatearningswellabovetheofficialFederalPovertyLevelareneverthelessfarbelowwhatisneededtomeetfamilies’basicneeds.
ThereportbeginswithputtingtheSelf-SufficiencyStandardincontext,describinghowitisauniqueandimportantmeasureofincomeadequacy,comparingandcontrastingitwithfederalpovertymeasures.Thereportthenleadsreadersthroughadescriptionofwhataself-sufficientwageisforConnecticutfamiliesandhowitdiffersdependingonfamilytypeandgeographicarea.ThereportcomparesConnecticuttootherplacesintheUnitedStates,demonstrateshowtheStandardhaschangedinConnecticutovertime,andcomparestheConnecticutStandardtoothercommonlyusedbenchmarksofincome.Forfamilieswithoutadequateincome,thereportmodelshowpublicsupports,suchaschildcareassistance,canbeavaluableresourcetohelpfamiliescovertheirbasicneedsastheymovetowardself-sufficiency.Itconcludeswithabriefdiscussionofthevariouspathwaystoeconomicself-sufficiency.
Theappendicesprovide:amoredetailedexplanationofthemethodologyanddatasourcesusedtocalculatetheConnecticutStandard;adiscussionwithexamplesofhowtheSelf-SufficiencyStandardcanbeusedasatooltoevaluateprogramperformance,informpolicy-making,counselclients,andimproveresearchonpovertyandincomeadequacy;amoredetailedcomparisonoftheConnecticutStandardandfederalpovertymeasures;detailedtablesoftheStandard,includingthespecificcostsofmeetingeachbasicneedandtheSelf-

SufficiencyWageforeightselectedfamilytypesin23Connecticutregions;anddetailedcalculationsbehindthemodelingofworksupports’impactonwageadequacyinthereportitself(Figure10).Notethatthedataforthefullsetof152familytypesandeachConnecticutregionisavailableathttp://selfsufficiencystandard.org/pubs.htmlandhttp://ctpcsw.com/
seleCteD finDinGs from the self-suffiCienCY stanDarD for ConneCtiCut 2015•In Connecticut, the amount needed to be economically self-sufficient varies considerably by geographic
location.Forinstance,theamountneededtomakeendsmeetforoneadultandonepreschoolervariesfrom$21.14perhour($44,675annually)inWindhamto$36.84perhour($77,800annually)inLowerFairfield,orfrom280%oftheFederalPovertyLevelto488%oftheFederalPovertyLevel.
•The Standard also varies by family type, that is, by how many adults and children are in a family and the age of each child.OneadultlivinginBridgeportneedsanhourlywageof$10.27($21,688annually)tomeetbasicneeds.Forfamilieswithchildren,theamountneededtocoverbasicneedsincreasesconsiderably.If
The Self-Sufficiency Standard for Connecticut Regions and Select Family Types, 2015
one aDult one aDultone PresChooler
one aDultone PresChoolerone sChool-aGe
tWo aDultsone PresChoolerone sChool-aGe
WaterBurY $23,664 $50,233 $61,535 $70,182
Greater WaterBurY $26,259 $53,838 $65,008 $73,513
DanBurY $30,187 $61,917 $73,885 $82,351
Greater DanBurY $32,340 $64,072 $76,619 $84,327
northWest Corner $23,926 $51,279 $62,708 $71,219
BriDGePort $21,688 $54,142 $64,940 $70,003
stratforD $26,912 $59,942 $70,586 $79,682
stamforD $38,623 $74,600 $87,013 $93,026
nauGatuCK ValleY $26,721 $54,893 $66,427 $75,139
uPPer fairfielD $35,517 $71,024 $83,438 $90,117
loWer fairfielD $40,721 $77,800 $89,914 $95,447
hartforD $19,233 $46,753 $59,553 $63,381
hartforD suBurBs $27,381 $56,436 $68,742 $77,309
north Central $26,818 $55,764 $68,222 $76,801
neW haVen $23,641 $51,597 $63,185 $67,225
uPPer ConneCtiCut riVer $27,858 $56,221 $68,078 $77,246
Greater neW haVen $29,788 $58,449 $69,750 $78,467
loWer ConneCtiCut riVer $30,286 $61,181 $73,394 $81,896
WinDham $20,842 $44,657 $53,436 $61,064
Greater WinDham $27,277 $53,074 $62,175 $71,025
neW lonDon $22,804 $47,787 $57,209 $65,990
Greater neW lonDon $25,662 $51,864 $61,228 $70,164
northeast Corner $22,812 $47,590 $56,189 $63,901

theadulthasapreschoolerandaschool-agechild,theamountnecessarytobeeconomicallysecuretriples,increasingto$30.75perhour($64,940annually)inordertocoverthecostofchildcare,alargerhousingunit,andincreasedfoodandhealthcarecosts.Forfamilieswithyoungchildren,thecostofhousingandchildcarecombinedtypicallymakeupabout50%ofthefamily’sbudget.Forexample,forthisfamilytypeinBridgeport,childcareis31%ofthefamily’sbudgetwhilehousingis19%.Foodcoststakeup13%andhealthcareis11%ofthefamily’sbudget.
•The amount needed to meet the costs of basic needs increased between 2005 and 2015 in all Connecticut regions, despite the financial crisis.Forafamilywithtwoadults,onepreschooler,andoneschool-agechild,theStandardincreasedbetween15%and46%percent,onaverageby32%,acrossthestate.
•Although a fifth of Connecticut workers hold one of the top ten most common occupations in Connecticut (measured by the number of workers), only two of these occupations have median wages above the Standard for a family of three in Waterbury. Thesetwo—registerednursesandgeneralandoperationsmanagers—havemedianwagesabovetheSelf-SufficiencyStandardforoneadult,onepreschooler,andoneschool-agechildinWaterbury,whichis$29.14perhour($61,535annually),whilethemedianwagesfortheothereightarebelowthisfamilytype’sStandardinWaterbury.
•Maintaining an emergency savings fund is a crucial step towards economic security. Asingleparentwithapreschool-agedchildlivingintheNortheastCornerneedsearn$3,966permonthtomeetherbasicneeds.Sheneedstoearnanadditional$68permonthtohaveanemergencysavingsfund.IfshelivesinStamfordsheneeds$6,217permonthtobeself-sufficientandanadditional$117permonthtosaveforemergencies.
•The Federal Poverty Level for three-person families ($20,090 annually) is set at a level well below what is minimally needed to meet a family’s basic needs. Forexample,thefederalpovertymeasureis35%oftheStandardforoneadult,onepreschooler,andoneschool-agechildinNewLondon($27.09perhourand$57,209annually).
•A parent working full time and earning the state minimum wage ($9.15 per hour in 2015) is going to fall short of meeting the Standard for a family with two young children. IfshelivesinNewLondon,shewouldbeabletocoveronly46%ofherfamily’sbasicneeds(withhertake-homepayafteraccountingfortaxes)ifshehadonepreschoolerandoneschool-agechild.
•The 2015 Self-Sufficiency Standard for one adult with one preschooler and one school-age child in Bridgeport ($30.75 per hour) is comparable to Pasadena, CA ($30.92 per hour).TheSelf-SufficiencyStandardforthesamefamilytypeinNewHavenisthesamewageasBoulder,CO($29.92perhour).
•Work supports are crucial for helping families meet their basic needs. Asingleparentwithonepreschoolerandoneschool-agechildlivinginHartfordandworkingafull-timeminimumwagejob,whichis$9.15inConnecticut,earnsonly37%oftheincomeneededtomeetherfamily’sbasicneedsifsheisnotreceivinganyworksupports.Withthehelpofhousing,childcare,food,andhealthcareworksupports,thisparentcouldmeet88%ofherfamily’sneeds.
The coST of meeTinG baSic needS conTinueS To increaSe in moST of connecTicuT deSPiTe
STaGnaTinG WaGeS and difficulT economic TimeS.

•A single adult supporting one preschooler and one school-age child and living in Hartford, and transitioning from welfare to work, with the help of child care assistance, food assistance (SNAP and WIC), and Medicaid, would be able to meet her family’s needs with a wage of $13.20 per hour, significantly less than the full Self-Sufficiency Wage of $28.20 per hour.
Clearly,thecostofmeetingbasicneedshascontinuedtoincreaseinmostofConnecticutdespitestagnatingwagesanddifficulteconomictimes.Further,whatittakestobecomeself-sufficientinConnecticutdependsonwhereafamilylives,howmanypeopleareinthefamilyandthenumberandagesofchildren.
What the self-suffiCienCY stanDarD means for ConneCtiCutClosingthewagegapbetweencurrentwagesandtheSelf-SufficiencyStandardrequiresbothreducingcostsandraisingincomes.
reDuCinG Costs means ensuring families who are struggling to cover basic costs have access to work supports—such as child care assistance, food benefits, and the Earned Income Tax Credit—that offer stability and resources while they become self-sufficient.Mostindividualscannotachieveself-sufficiencythroughstopgapmeasuresorinasinglestep,butrequiretransitionalworksupports,guidance,andtheremovalofbarrierstohelpmeetmonthlyexpensesasfamiliesworktowardsself-sufficiencyovertime.
raisinG inComes means enhancing skills as well as improving access to jobs that pay self-sufficient wages and have career potential.Astrongeconomywillmeangoodjobsthatpayself-sufficientwages,aworkforcewiththeskillsnecessarytofillthosejobs,andenhancinglinksandremovingbarriersbetweenthosejobsandtheworkersthatneedthem.Keytoraisingincomesarepublicpoliciessuchasliving/minimumwagepoliciesandpaidsickandfamily/medicalleave,thatincreasewagesdirectly.Likewise,accesstoeducation,training,andjobsthatproviderealpotentialforskillandcareeradvancementoverthelongtermisalsoimportant.
TheSelf-SufficiencyStandardcanbeusedasatoolto:
•Evaluateproposedpolicychanges,•Targetresourcestowardjobtrainingforfieldsthatpayself-sufficientwages,•Evaluateoutcomesforclientsinemploymentprograms,•Assistgrant-makerswithneedsanalysesoftheircommunitiestoassesstheimpactsoftheirgrants,and•Serveasacounselingtoolinworktrainingprograms.
TheSelf-SufficiencyStandardiscurrentlyusedtobetterunderstandissuesofincomeadequacy,analyzepolicy,andhelpindividualsstrivingtobeself-sufficient.Communityorganizations,academicresearchers,foundations,policyinstitutes,legaladvocates,trainingproviders,communityactionagencies,andstateandlocalofficials,amongothers,areusingtheSelf-SufficiencyStandard.
table o f Content s
introduction • 1
how is the connecticut Standard calculated? • 3
how much does it cost to make ends meet in connecticut? • 5
how do family budgets change as families Grow? • 9
how does the real cost of living in connecticut cities compare to other u.S. cities? • 11
how has the cost of living changed in connecticut? • 12
how does the Self-Sufficiency Standard compare to other benchmarks of income? • 16
most Top occupations in connecticut fall Short of the Standard • 18
Work Supports bridge the difference between Wages and costs • 20
closing the Wage Gap: raising incomes • 26
how has the Self-Sufficiency Standard been used? • 28
conclusion • 29
endnotes • 30
appendix a: methodology, assumptions, and Sources • 33
appendix b: examples of how the Standard has been used • 43
appendix c: federal approaches to measuring Poverty • 49
appendix d: The Self-Sufficiency Standard for Select family Types in connecticut • 53
appendix e: impact of Work Supports on Wage adequacy • 69


ThisreportdocumentstheincreasingcostsoflivinginConnecticutinthelastdecade.EvenasConnecticut’seconomyemergesfromtheGreatRecession,manyofthelonger-termtrendscontinue,particularlystagnatingwagesandwideningincomeinequality.Asaresult,manyfindthatevenwithfull-timejobs,theyareunabletostretchtheirwagestopayforbasicnecessities.IndeedinmanyplacesinConnecticutthegapbetweenincomeandexpenseshascontinuedtowiden,asthecostsoffood,housing,transportation,healthcare,andotheressentialshaverisen—evenduringtheGreatRecession—whilewageshavenot.
TheSelf-SufficiencyStandardhighlightsthegrowinggapbetweensluggishwagesandever-increasingexpenses,clearlyilluminatingtheeconomic“crunch”experiencedbysomanyfamiliestoday.1Moreover,bytrackingandcalculatingthetruecostoflivingfacingAmericanfamilies,theStandardallowsforcomparisonsofareageographicdifferencesaswellasdocumentationofhistoricaltrends.
The Self-Sufficiency Standard for Connecticut 2015 definestheamountofincomenecessarytomeetthebasicneedsofConnecticutfamilies,differentiatedbyfamilytypeandwheretheylive.TheStandardcalculatesthecostsofsixbasicneedsplustaxesandtaxcredits.Itassumesthefullcostofeachneed,withouthelpfrompublic subsidies(e.g.,publichousing,Medicaid,orchildcareassistance)orprivate/informal assistance(e.g.,unpaidbabysittingbyarelativeorfriend,foodfromfoodbanks,orsharedhousing).
ThisreportpresentstheStandardandwhatitmeansforConnecticutfamilies.Belowisasummaryofthesectionsincludedinthisreport:
•TheintroductionexplainstheuniquefeaturesoftheSelf-SufficiencyStandardandhowitiscalculated.•ThemainbodypresentsthedetailsoftheStandardforConnecticut:howmuchaself-sufficientincomeis
forConnecticutfamilies,howtheStandardvariesbyfamilytypeandregion,andhowtheConnecticutStandardcomparestootherplacesacrosstheUnitedStates.
•SubsequentsectionstrackhowtheConnecticutStandardhaschangedoverthepastyears,andhowtheStandardcomparestoothercommonbenchmarksofincome.
•Thenextsectiondiscusseshowworksupportscanhelpfamiliesmovetowardself-sufficiency,aswellasstrategiesforclosingthegapbetweenprevailingwagesandtheSelf-SufficiencyStandard.
introduction
The Self-Sufficiency Standard measures how much income a family of a certain composition in a given
place needs to adequately meet their basic needs—without public or private assistance.

2 • The Self-Sufficiency STandard for connecTicuT 2015
•Thefinalsectiondiscusseswhatittakestomovetowardlong-termeconomicsecurityoncetheresourcesneededtomeetbasicneedshavebeensecured.Thisincludesassets,savings,andinvestmentstoachievelong-termfinancialgoals.
Thisreportalsohasseveralappendices:
•AppendixA:MethodologyprovidesadetaileddescriptionofthedataandsourcesusedtocalculatetheStandard.
•AppendixB:Applications and UsesexplainsthevariouswaysofusingtheStandardtoinformpolicymaking,counselclients,evaluateprograms,andimprovepovertyresearch.
•AppendixC:The Self-Sufficiency Standard for Connecticut Compared to the Federal Poverty Level explainsfederalapproachestomeasuringpovertyandshowstheSelf-SufficiencyStandardforConnecticutforselectfamilytypesasapercentageoftheFederalPovertyLevel.
•AppendixD:The Self-Sufficiency Standard for Select Family Types in Connecticut providesdetailedtablesoftheSelf-SufficiencyStandardforeightselectfamilytypesineachConnecticutregion.
•AppendixE:Impact of Work Supports on Wage Adequacy showsthedatabehindFigure10.
a real-WorlD aPProaCh to measurinG neeDTheSelf-SufficiencyStandardisauniquemeasureofincomeadequacythatusesamodern,comprehensive,anddetailedapproachtodeterminewhatittakesfortoday’sfamiliestomakeendsmeet.ThekeyelementsoftheStandardthatdistinguishitfromothermeasuresofincomeadequacyorpovertyarethefollowing:
a foCus on moDern families With WorKinG aDults. BecausepaidemploymentisthenormforsupportingfamiliestodayintheUnitedStates,2theStandardassumesalladultsworktosupporttheirfamilies,andthusincludesthecostsofwork-relatedexpensessuchaschildcare(whenneeded),taxes,andtransportation.
GeoGraPhiC Variation in Costs. TheStandardusesgeographicallyspecificcoststhatarecalculatedatthecounty/region/citylevelasdataavailabilityallows.
Variation BY familY ComPosition. Becausethecostsofsomebasicneedsvarysubstantiallybytheageofchildren,theStandardvariesbyboththenumberandageofchildren.Whilefoodandhealthcarecostsareslightlylowerforyoungerchildren,childcarecostsaregenerallymuchhigher—particularlyforchildrennotyetinschool—andthereforebecomeasubstantialbudgetitemforworkerswithyoungchildren.
inDiViDual anD inDePenDent PriCinG of eaCh Cost. Ratherthanassumethatanyoneitemisafixedpercentageoffamilybudgets,theStandardcalculatestherealcostsofmeetingeachofthemajorbudgetitemsfamiliesencounter,includinghousing,childcare,food,healthcare,transportation,miscellaneousitems,andtaxes.Thecostsaresetataminimallyadequatelevel,whichisdeterminedwheneverpossiblebyusingwhatgovernmentsourceshavedeterminedareminimallyadequateforthosereceivingassistance,e.g.,childcaresubsidybenefitlevels.
taxes anD tax CreDits are inCluDeD as BuDGet items. Insteadofcalculatingneeds“pretax,”taxesandtaxcreditsareincludedinthebudgetitself.Taxesincludestateandlocalsalestax,payroll(includingSocialSecurityandMedicare)taxes,federalandstateincometaxes,plusapplicablestateandfederaltaxcredits.
Permits moDelinG of the imPaCt of suBsiDies. BecausetheStandardspecifiestherealcostofeachmajornecessity,itispossibletomodeltheimpactofspecificsubsidies(suchastheSupplementalNutritionAssistanceProgram,childcareassistance,orMedicaid)onreducing(orincreasing)costs.Likewise,theadequacyofagivenwageforagivenfamily,withandwithoutsubsidies,canbeevaluatedusingthefamily’sStandardasthebenchmark.
Altogether,theaboveelementsoftheStandardmakeitamoredetailed,modern,accurate,andcomprehensivemeasureofeconomicwell-beingthantheFederalPovertyLevel.Appendix C providesamoredetailedexplanationofthefederalapproachestomeasuringpoverty,includingtheFederalPovertyLevelandtheSupplementalPovertyMeasure,andhowtheStandardcontrastswitheachapproach.

The Self-Sufficiency STandard for connecTicuT 2015 • 3
mediangrossrentsfortownsfromtheU.S.CensusBureauAmericanCommunitySurvey(ACS).
ChilD Care. Tocalculatethecostofchildcare,theStandardutilizesmarket-ratecosts(definedasthe75thpercentile)byfacilitytype,age,andgeographiclocation.4Moststatesconductorcommissionmarket-ratesurveysforsettingchildcareassistancereimbursementrates.WhileConnecticutconductedamarket-ratesurveyin2013,reimbursementratesarestillbasedonthe2002survey.Calculationsforinfantsandpreschoolersarebasedonfull-timechildcarewhileschool-agechildrenreceivecarebeforeandafterschool(parttime).
fooD. TheStandardusestheU.S.DepartmentofAgricultureLow-CostFoodPlanforfoodcosts.TheLow-CostFoodPlanwasdesignedtomeetminimumnutritionalstandardsusingrealisticassumptionsaboutfoodpreparationtimeandconsumptionpatterns.However,itisstillaveryconservativeestimateoffoodcosts.Forinstance,theLow-CostFoodPlandoesnotallowforanytake-outorrestaurantmeals.GeographicdifferencesinfoodcostsarecalculatedusingFeedingAmerica’sMaptheMealGapdatabasedonNielsenscansofgroceryreceiptstocalculatecomparativefoodcostsacrossthecountry.
transPortation. Ifthereisan“adequate”publictransportationsysteminagivenarea,theStandardassumesworkersusepublictransportationtogettoandfromwork.Apublictransportationsystemisconsidered“adequate”ifitisusedby7%ormoreoftheworkingpopulationinagivengeographicarea.InConnecticut,publictransportationisassumedforBridgeport,Hartford,andNewHavenwhileprivatetransportationisassumedforallotherregions.
Privatetransportationcostsarebasedontheaveragecostsofowningandoperatingacar.Onecarisassumedforhouseholdswithoneadult,andtwocarsareassumedforhouseholdswithtwoadults.Per-milecosts(e.g.,gas,oil,tires,andmaintenance)arecalculatedfromtheAmericanAutomobileAssociation.CommutingdistanceiscomputedfromtheNationalHouseholdTravelSurvey.AutoinsurancepremiumsaretheaveragestatewidepremiumcostfromtheNationalAssociationofInsuranceCommissioners.Within-statevariationinautoinsurancepremiumsiscalculated
ThegoalforcreatingtheSelf-SufficiencyStandardistocalculatetheamountneededtomeeteachbasicneedataminimallyadequatelevel,withoutpublicorprivateassistance,andtodosoinawaythatmakestheStandardasconsistentandaccurateaspossible,yetvariedbygeographyandfamilycomposition.Inselectingdatasources,tothemaximumextentpossible,thedatausedintheSelf-SufficiencyStandardmeetthefollowingcriteria:
•collectedorcalculatedusingstandardizedorequivalentmethodologynationwide;
•obtainedfromscholarlyorcrediblesources,suchastheU.S.CensusBureau;
•setatthelevelthatmeetsagivenneedataminimallyadequatelevel,usuallybyorforagovernmentaidagency;
•updatedregularly(preferablyannuallyorbiennially);and•geographicallyand/orage-specific,asappropriate.
TheSelf-SufficiencyStandardiscalculatedfor152differentfamilytypesfor23regionsinConnecticut.Familytypesrangefromoneadultwithnochildren,tooneadultwithoneinfant,oneadultwithonepreschooler,andsoforth,uptotwo-adultfamilieswiththreeteenagerspluslargerandmulti-generationalfamilies.
ThedatacomponentsoftheStandardandtheassumptionsincludedinthecalculationsarebrieflydescribedbelow(moredetailedinformationisincludedinAppendix A: Methodology, Assumptions, and Sources).Thesedataelementsandassumptionsarestandardforallstatesunlessotherwisenoted.
housinG. Forhousingcosts,theStandardusesthemostrecentFairMarketRents(FMRs),whicharecalculatedannuallybytheU.S.DepartmentofHousingandUrbanDevelopment(HUD)foreachstate’smetropolitanandnon-metropolitanareas.FMRsincludeutilities(excepttelephoneandcable)andreflectthecostofhousingthatmeetsbasicstandardsofdecency.FMRsaregenerallysetatthe40thpercentile,meaningthat40%ofthehousinginagivenareaislessexpensivethantheFMR.3
HUDcalculatesonlyonesetofFMRsforeachmetropolitanarea.TocalculatevariationinhousingcostsbytownswithinametropolitanareaweadjusttheFMRsusing
how is the connecticut Standard calculated?
4 • The Self-Sufficiency STandard for connecTicuT 2015
usingsamplepremiumsfromautomobileinsurancecompanieswithlargemarketsharesinthestate.Fixedcostsofcarownership(e.g.license,registration,repairs,monthlypayments)arecalculatedusingConsumerExpenditureSurveyamountsforfamilieswithincomesbetweenthe20thand40thpercentile.Theinitialcostofpurchasingacarisnotincluded.
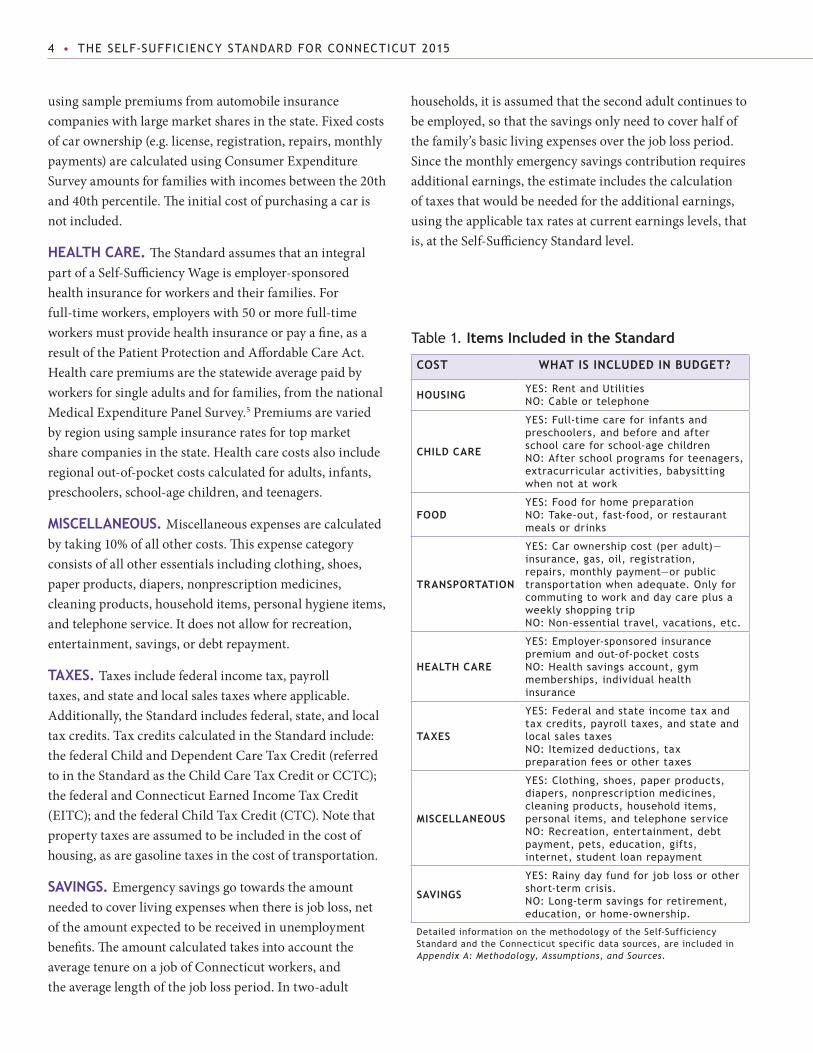
health Care. TheStandardassumesthatanintegralpartofaSelf-SufficiencyWageisemployer-sponsoredhealthinsuranceforworkersandtheirfamilies.Forfull-timeworkers,employerswith50ormorefull-timeworkersmustprovidehealthinsuranceorpayafine,asaresultofthePatientProtectionandAffordableCareAct.Healthcarepremiumsarethestatewideaveragepaidbyworkersforsingleadultsandforfamilies,fromthenationalMedicalExpenditurePanelSurvey.5Premiumsarevariedbyregionusingsampleinsuranceratesfortopmarketsharecompaniesinthestate.Healthcarecostsalsoincluderegionalout-of-pocketcostscalculatedforadults,infants,preschoolers,school-agechildren,andteenagers.
misCellaneous. Miscellaneousexpensesarecalculatedbytaking10%ofallothercosts.Thisexpensecategoryconsistsofallotheressentialsincludingclothing,shoes,paperproducts,diapers,nonprescriptionmedicines,cleaningproducts,householditems,personalhygieneitems,andtelephoneservice.Itdoesnotallowforrecreation,entertainment,savings,ordebtrepayment.
taxes. Taxesincludefederalincometax,payrolltaxes,andstateandlocalsalestaxeswhereapplicable.Additionally,theStandardincludesfederal,state,andlocaltaxcredits.TaxcreditscalculatedintheStandardinclude:thefederalChildandDependentCareTaxCredit(referredtointheStandardastheChildCareTaxCreditorCCTC);thefederalandConnecticutEarnedIncomeTaxCredit(EITC);andthefederalChildTaxCredit(CTC).Notethatpropertytaxesareassumedtobeincludedinthecostofhousing,asaregasolinetaxesinthecostoftransportation.
saVinGs. Emergencysavingsgotowardstheamountneededtocoverlivingexpenseswhenthereisjobloss,netoftheamountexpectedtobereceivedinunemploymentbenefits.TheamountcalculatedtakesintoaccounttheaveragetenureonajobofConnecticutworkers,andtheaveragelengthofthejoblossperiod.Intwo-adult
households,itisassumedthatthesecondadultcontinuestobeemployed,sothatthesavingsonlyneedtocoverhalfofthefamily’sbasiclivingexpensesoverthejoblossperiod.Sincethemonthlyemergencysavingscontributionrequiresadditionalearnings,theestimateincludesthecalculationoftaxesthatwouldbeneededfortheadditionalearnings,usingtheapplicabletaxratesatcurrentearningslevels,thatis,attheSelf-SufficiencyStandardlevel.
Table 1. items included in the standard
Cost What is inCluDeD in BuDGet?
housinG yeS: rent and utilities no: cable or telephone
ChilD Care
yeS: full-time care for infants and preschoolers, and before and after school care for school-age children no: after school programs for teenagers, extracurricular activities, babysitting when not at work
fooDyeS: food for home preparation no: Take-out, fast-food, or restaurant meals or drinks
transPortation
yeS: car ownership cost (per adult)—insurance, gas, oil, registration, repairs, monthly payment—or public transportation when adequate. only for commuting to work and day care plus a weekly shopping trip no: non-essential travel, vacations, etc.
health Care
yeS: employer-sponsored insurance premium and out-of-pocket costs no: health savings account, gym memberships, individual health insurance
taxes
yeS: federal and state income tax and tax credits, payroll taxes, and state and local sales taxes no: itemized deductions, tax preparation fees or other taxes
misCellaneous
yeS: clothing, shoes, paper products, diapers, nonprescription medicines, cleaning products, household items, personal items, and telephone service no: recreation, entertainment, debt payment, pets, education, gifts, internet, student loan repayment
saVinGs
yeS: rainy day fund for job loss or other short-term crisis. no: long-term savings for retirement, education, or home-ownership.
detailed information on the methodology of the Self-Sufficiency Standard and the connecticut specific data sources, are included in Appendix A: Methodology, Assumptions, and Sources.

The Self-Sufficiency STandard for connecTicuT 2015 • 5
how much does it cost to make ends meet in connecticut?
Howmuchincomefamiliesneedtobeeconomicallyself-sufficientdependsbothonfamilycomposition—howmanyadultsandhowmanychildrenandthechildren’sages—andwheretheylive.Table 2illustrateshowsubstantiallytheStandardvariesbyfamilytypebyshowingtheStandardforfourdifferentfamilyconfigurationsinBridgeport.
•Asingleadultneedstoearn$10.27perhourworkingfulltimetobeabletomeethisorherbasicneeds,whichisoveradollarmorethantheConnecticutminimumwage($9.15perhourin2015).
•Addingachildmorethandoublesthisnumber;oneparentcaringforonepreschool-agedchildneedstoearn$25.64perhourtobeself-sufficient.
•Addingasecondchildfurtherincreasesthewage:oneparentwithtwochildren—apreschoolerandschool-agechild—needs$30.75perhourtomeetherfamily’sbasicneeds.Evenwithoneofthehigheststateminimum
wages,thisistheequivalentofoverthreefull-timeminimumwagejobsinConnecticut.6
•Whentherearetwoadults,theadditionaladultaddssomecosts,butsplitstheeconomicburden;nevertheless,twoparentswithonepreschoolerandoneschool-agechildeachneedtoearnaminimumof$16.57perhour,workingfulltime,tomeettheirfamily’sbasicneeds.
Inadditiontovaryingbyfamilycomposition,theSelf-SufficiencyStandardalsovariesbygeographiclocation.ThemapinFigure 1displaysthegeographicvariationinthe
Table 2. TheSelf-SufficiencyStandardforSelectFamilyTypes* Monthly Expenses and Shares of Total Budgets: bridgeport, cT 2015
monthlY Costs
one aDult one aDult, one PresChooler
one aDult, one PresChooler,
one sChool-aGe
tWo aDults, one PresChooler,
one sChool-aGe
Costs % Costs % Costs % Costs %
housing $828 46 $1,054 23 $1,054 19 $1,054 18
Child Care $0 0 $1,186 26 $1,676 31 $1,676 29
food $304 17 $462 10 $696 13 $955 16
transportation $70 4 $70 2 $70 1 $140 2
health Care $199 11 $592 13 $615 11 $671 12
miscellaneous $140 8 $336 7 $411 8 $450 8
taxes $265 15 $945 21 $1,156 21 $1,154 20
earned income tax Credit (-) $0 0 $0 0 $0 0 $0 0
Child Care tax Credit (-) $0 0 ($50) -1 ($100) -2 ($100) -2
Child tax Credit (-) $0 0 ($83) -2 ($167) -3 ($167) -3
total PerCent 100 100 100 100
self-suffiCienCY WaGe
Hourly** $10.27 $25.64 $30.75 $16.57 per adult***
monthlY $1,807 $4,512 $5,412 $5,834 combined***
annual $21,688 $54,142 $64,940 $70,003 combined***
emerGenCY saVinGs funD $33 $74 $99 $50
* The Standard is calculated by adding expenses and taxes and subtracting tax credits. The “Taxes” row includes federal and state income taxes and payroll taxes.** The hourly wage is calculated by dividing the monthly wage by 176 hours (8 hours per day times 22 days per month).*** The hourly wage for families with two adults represents the hourly wage that each adult would need to earn, while the monthly and annual wages represent both parents’ wages combined.note: Totals may not add exactly due to rounding.
The amounT of money familieS need To
be economically Self-SufficienT varieS
draSTically dePendinG on family Size and The
GeoGraPhic reGion of reSidence.

6 • The Self-Sufficiency STandard for connecTicuT 2015
the fiVe ConneCtiCuts
The connecticut State data center (ctSdc) developed the five connecticuts in 2004 “to highlight inequalities that
exist at the town level which are often not clearly discernible at the county level.” The ctSdc analyzed the social
economic status, poverty rates, and population density of all 169 towns in Connecticut and generated five clusters.
The resulting clusters are characterized by the ctSdc as follows:
• Wealthy connecticut has exceptionally high income, low poverty, and moderate population density.
• Suburban connecticut has above average income, low poverty, and moderate population density.
• rural connecticut has average income, below average poverty, and the lowest population density.
• The urban Periphery of connecticut has below average income, average poverty, and high population
density.
• The urban core of connecticut has the lowest income, highest poverty, and the highest population density.
The figure below highlights how the Self-Sufficiency Standard varies across the Five Connecticuts. All towns in the
Northeast Corner region are classified as rural by the Five Connecticuts. The annual Self-Sufficiency Standard for
one adult with one preschooler is $47,590 in the northeast corner. Suburban Greater Waterbury and bridgeport,
part of the urban core, both require around $54,000 annually to meet the basic needs for this family type. danbury
falls within the urban periphery region and requires $61,917 for a one adult, one preschooler family. Lower Fairfield
is the most expensive region in the Self-Sufficiency Standard and not surprisingly classified as wealthy by the
ctSdc. This family type requires $77,800 annually to cover basic expenses in this high cost area.
TheSelf-SufficiencyStandardfortheFiveConnecticuts One Adult and One Preschooler, 2015
five connecticuts Source: levy, don, orlando rodriguez, and Wayne villemez. 2004. The Changing Demographics of Connecticut—1990 to 2000. Part 2: The Five Connecticuts. Storrs, connecticut: university of connecticut, The connecticut State data center, occasional Paper number: oP 2004-01, may 2004.
ANNUAL SELF-SUFFICIENCY STANDARD
$47,590
$53,838 $54,142
$61,917
$77,800
$0
$20,000
$40,000
$60,000
$80,000
RURAL SUBURBAN URBAN CORE URBAN PERIPHERY WEALTHYNortheast Corner Greater Waterbury Bridgeport Danbury Lower Fairfield

The Self-Sufficiency STandard for connecTicuT 2015 • 7
fiGure 1. MapofregionsbylevelofAnnualSelf-SufficiencyWage One Adult and One Preschooler, CT 2015
costofmeetingbasicneedsacrossConnecticutforfamilieswithoneadultandonepreschooler.The2015annualSelf-SufficiencyStandardforasingleadultwithonepreschoolerrangesfrom$44,657to$77,800dependingontheregion.
•ThemostexpensiveareasinConnecticutareinthesouthwestcornerandincludeStamford,LowerFairfield,andUpperFairfield.WithanannualSelf-SufficiencyStandardat$77,800peryearforthisfamilytype,theLowerFairfieldregionhasthehighestcostoflivinginConnecticut.
•Thesecondhighestcostgrouprequiresbetween$60,000and$64,999annuallytomeetbasicneedsandincludesDanbury,GreaterDanbury,andtheLowerConnecticutRiverregion.
•Themiddlecostgrouprequiresbetween$55,000and$59,000annuallyforafamilywithoneadultandonepreschoolerandincludesthefollowingregions:NorthCentral,HartfordSuburbs,UpperConnecticutRiver,GreaterNewHaven,andStratford.
•Thesecondlowestcostgrouprequiresbetween$50,000and$54,999tomeetbasicneeds.Thisgroupincludes
theNorthwestCorner,GreaterWaterbury,Waterbury,NaugatuckValley,Bridgeport,NewHaven,GreaterWindham,andGreaterNewLondon.
•Requiringlessthan$50,000annually,themostaffordableregionsinConnecticutincludeWindham,Hartford,NortheastCorner,andNewLondon.Overall,Windhamistheleastexpensiveplaceforthisfamilytypeandisover$33,000lessexpensivethanthewealthyLowerFairfieldregion.
saVinG for emerGenCies. Forallfamilies,havingsavingstomeetunexpectedemergenciesisanimportantsteptowardseconomicsecurity.The2015StandardforConnecticutincludesanemergencysavingsamountforthefirsttime.Thisestimateisbasedontheassumptionthattheminimumsavingsneededreflectsthecostoflivingexpenses(usingtheSelf-SufficiencyStandard)minustheamountofotherresourcesavailabletomeetthoseneeds(suchasunemploymentinsurance),forthelengthoftimeoftheemergency.Thesecalculationsareforthemostcommonemergency,thatofjobloss,andusethemedianamountof
Less than $50,000
$50,000 - $54,999
$55,000 - $59,000
$60,000 - $64,999
$70,000 +
ANNUALSELF-SUFFICIENCY WAGE
Lower Fairfield
Stamford
Stratford
UpperFairfield
Bridgeport
GreaterNew Haven
New Haven LowerConnecticut
River
UpperConnecticut
River
New London
NortheastCorner
Windham
North Central
Hartford Suburbs
Hartford
Waterbury
Danbury
GreaterDanbury
NorthwestCorner
NaugatuckValley
GreaterWindham
GreaterWaterbury
GreaterNew London

8 • The Self-Sufficiency STandard for connecTicuT 2015
timeoutofwork(aboutfourmonthsinConnecticut),andthemediantenureincurrentemploymentinConnecticut(sevenyears).Ofcourse,thespecificamountofmoneyfamiliesneedtobeabletomaintaineconomicself-sufficiencyvariesdependingonfamilycompositionandthelocalcostofliving.Table 3illustratestheemergencysavingsamountsfortheNortheastCornerregionandStamfordforthreedifferentfamilytypes.
•Asingleadultneedstoearn$1,901permonthworkingfulltimetobeabletomeetbasicneedsintheNortheastCornerregion.Thesingleadultneedstoearnanadditional$34permonthtomeettheemergencysavingsgoalofhavingenoughsavingstomeetbasiclivingcosts,allowingforthereceiptofunemploymentinsurance.InStamfordasingleadultneedstoearn$3,219permonthtobeself-sufficientandearnanadditional$49permonthtomeettheemergencysavingsgoal.
•Oneadultcaringforapreschool-agechildneedstoearn$3,966permonthintheNortheastCornerregion
Table 3. TheSelf-SufficiencyStandardandEmergencySavingsforSelectFamilyTypes northeast Corner and stamford, Ct 2015
monthlY Costs
northeast Corner stamforD
1 adult 1 adult 1 Preschool
2 adults 1 Preschool 1 school-age
1 adult 1 adult 1 Preschool
2 adults 1 Preschool 1 school-age
housing $733 $983 $983 $1,491 $1,852 $1,852
Child Care $0 $827 $1,228 $0 $1,186 $1,676
food $240 $365 $754 $304 $462 $955
transportation $310 $318 $605 $310 $318 $606
health Care $182 $528 $608 $199 $592 $671
miscellaneous $147 $302 $418 $230 $441 $576
taxes and tax Credits $289 $642 $729 $684 $1,366 $1,416
self-suffiCienCY WaGe
hourly $10.80 $22.53 $15.13 per adult $18.29 $35.32 $22.02
per adult
monthly $1,901 $3,966 $5,325 $3,219 $6,217 $7,752
annual $22,812 $47,590 $63,901 $38,623 $74,600 $93,026
emerGenCY saVinGs funD
living expenses (~4 months)* $6,732 $13,877 $9,595 $10,581 $20,252 $13,226
tax on additional earnings $112 $371 $435 $210 $603 $561
suBtotal $6,844 $14,248 $10,030 $10,791 $20,855 $13,787
unemployment insurance Benefit (~4 months) -$3,952 -$8,514 -$6,075 -$6,691 -$10,972 -$8,598
total saVinGs $2,892 $5,733 $3,955 $4,100 $9,883 $5,189
aDDitional monthlY earninGs (aSSumeS inTereST accrued) $34 $68 $47 $49 $117 $62
* living expenses for two adults assume half of overall living expenses, assuming only one adult will be unemployed at a time.
or$6,217permonthinStamfordtobeself-sufficient.Maintainingeconomicsecurityforthisfamilytyperequiresearninganadditional$68permonthintheNortheastCornerregionandanadditional$117permonthinStamford.Intheseregions,theoverallemergencysavingsgoaloversevenyearsis$5,733intheNortheastCornerregionand$9,883inStamford.
•Forfamilieswithtwoadults,apreschooler,andaschool-agechild,asitisassumedthatonlyoneadultisoutofworkatagiventime,theemergencysavingsgoalneedstocoveronlyhalfofthefamily’stotallivingexpensesforfourmonths.Therefore,themonthlycontributiontothesavingsaccountislessforthetwo-parenthouseholdwithonepreschoolerandoneschool-agechildthantheone-adulthouseholdwithonechild.IntheNortheastCornerregionthishouseholdneedsanadditional$47permonthintotalearningsandinStamfordtheadultsneedanadditional$62permonthinearningsinordertosaveforaspellofunemployment.

The Self-Sufficiency STandard for connecTicuT 2015 • 9
how do family budgets change as families Grow?
Asafamilygrowsandchangescomposition,theamountitspendsonbasicexpenses(suchasfoodandshelter)changes,andnewexpensesareadded,mostnotablychildcare.Figure 2demonstrateshowthesechangesoccurasthefamilycompositionchangesforafamilyintheNaugatuckValley.Eachbarchartshowsthepercentageofthetotalbudgetneededforeachexpenseandhowexpensesdifferasthefamilychangescomposition.
Whentherearejusttwoadults,theyneedtoearnatotalof$3,421permonthtomakeendsmeet,plusasmallmonthlyamountofsavingsforemergencies.ForfamilieswithtwoadultsandnochildreninNaugatuckValley,aboutaquarteroftheSelf-SufficiencyStandardgoestowardshousing.Thebudgetcategoriesoffood,transportation,andhealthcareeachaccountfor16%-18%ofthetotalhouseholdbudget.Taxesaccountfor15%ofhouseholdexpenses,andtherearenotaxcredits.(Theemergencysavingsfundcontributionisanadditional$31(about1%)addedtothefamilybudget.)
Whenafamilyexpandstoincludetwoyoungchildren(oneinfantandonepreschooler),thetotalbudgetincreasessubstantiallyto$6,900permonth,andatthesametime,withtheadditionofchildcare,theproportionsspentoneachbasicneedchange.Indeed,childcarealoneaccountsforoveraquarterofthefamily’sbudget;whenoneaddshousing,togetherthesetwoitemsaccountfor46%ofexpenses.Thisisquitecommon:acrossthecountry,itiscommonforSelf-SufficiencyStandardbudgetsforfamilieswithtwochildren(whenatleastoneisunderschoolage)tohaveroughlyhalfthebudgetgoingforhousingandchildcareexpensesalone.Foodcostsare12%oftotalincome.Thisismuchlowerthanthe33%assumedbythemethodologyoftheFederalPovertyLevel,andsimilartothenationalaverageexpenditureonfood,whichwas13%in2013.7
Healthcareaccountsfor9%ofthefamilybudget,includingboththeemployees’shareofthehealthcarepremiumandout-of-pocketcosts.8Ifneitheradulthadhealthinsurancethroughtheiremployer,aSilverplanthroughAccessHealth(Connecticut’shealthinsuranceexchange)forthisfamilyearningabout$80,000annually,wouldbeabout$150more
permonththanthehealthcostsintheSelf-SufficiencyStandard,afteraccountingforthepremiumtaxcredit.9
Nettaxesforthefamilynowreflectataxburdenthatis17%,takingintoaccounttheoffsettingeffectsoftaxcredits.NotethattaxcreditsaretreatedasiftheywerereceivedmonthlyintheStandard,althoughmostcreditsarenotreceiveduntilthefollowingyearwhentaxesarefiled.Ifitwereassumedthattaxcreditsarenotreceivedmonthly,butinsteadannuallyinalumpsum,thenthemonthlytaxburdenwouldbe21%oftotalexpensesforthisfamily.
figure 2. Percentage of standard needed to meet BasicNeedsforThreeFamilyTypes* Naugatuck Valley, CT 2015
* While the column heights are different to represent the different totals, the percentages for each cost add to 100% for each column.** The two-adult family is not eligible for any tax credits and therefore the Taxes-Net figure is the same as gross taxes owed. For the two family types with children shown in figure 2, the actual percentage of income needed for taxes without the inclusion of tax credits is 21% for two adults with one infant and one preschooler and 18% for two adults with one school-age child and one teenager. however, with tax credits included, as in the Standard, both families receive money back, and the amount owed in taxes is reduced. Please see Appendix A: Methodology, Assumptions, and Sources for an explanation of the treatment of tax credits in the Standard.
TWO ADULTS$3,421 per month
TWO ADULTSONE INFANT
ONE PRESCHOOLER$6,900 per month
TWO ADULTSONE SCHOOL-AGEONE TEENAGER
$4,995 per month
Housing 26% Housing 16% Housing 22%
Child Care 30%
Child Care 11%Food 16%
Food 12%
Food 19% Transportation 18%
Transportation 9%
Transportation 12%
Health Care 18%
Health Care 9%
Health Care 13%
Miscellaneous 8%
Miscellaneous 8%
Miscellaneous 8%
Taxes-Net* 15%
Taxes-Net* 17%
Taxes-Net* 13%

10 • The Self-Sufficiency STandard for connecTicuT 2015
Theemergencysavingsfundaddsanadditional1%tothefamilybudget.Notethatthisfundassumestheadultswillreceiveunemploymentinsuranceifajoblossoccurs.Withoutunemploymentinsurance,theadultswouldneedtosavetwoandahalftimesasmuchpermonthandtheemergencysavingsfundwouldaccountforanadditional2%ofthefamilybudget.
ThethirdbarinFigure2showstheshiftintheamountandproportionsspentinthebudgetasthechildrengetolder,andarenowaschool-agechildandateenager,andnolongerneedasmuchchildcare.Thetotalcostofbasicneedsdropsto$4,995permonth;thedecreasedamountforchildcarefortheschool-agechildaccountsforjust11%ofthisbasicneedsbudgetforthisfamilytype,amuchsmallerproportionthanwasnecessarywhenthechildrenwereyounger.Incontrast,foodaccountsforalargerproportion
ofthebudget,at19%,inpartduetoincreasedfoodcostsfortheteenager.Theemergencysavingsfundisanadditional$54,or1%addedtothefamilybudget.
Nettaxesareshownas13%ofthefamily’sbudget.Ifitwereassumed,assuggestedabove,thattaxcreditsarereceivedannuallyinalumpsum,thenthemonthlytaxburdenwouldbe18%ofthetotalcostsfortwoadultswithoneschool-agechildandoneteenager.
familieS WiTh TWo children (When one iS under
School aGe) Generally need To budGeT half
Their income for houSinG and child care
exPenSeS.

The Self-Sufficiency STandard for connecTicuT 2015 • 11
how does the real cost of living in connecticut cities compare to other u.S. cities?ThecostoflivingvariesnotonlyacrosstheUnitedStates,butwithinConnecticutaswell.InFigure 3,theSelf-SufficiencyStandardforfamilieswithoneparent,onepreschooler,andoneschool-agechildinBridgeportandNewHaven,CTarecomparedtotheStandardforseveralotherplaces:Alexandria,VA;Allentown,PA;BaltimoreCity,MD;Bellevue,WA;Boulder,CO;Dayton,OH;Lincoln,NE;Pasadena,CA;Savannah,GA;Springfield,MA;Syracuse,NY;andWilmington,DE.10
Thefull-time,year-roundwagesrequiredtomeettheSelf-SufficiencyStandardrangefromalowof$17.27perhourto$37.68.BridgeportandNewHavenarethefourthandfifthmostexpensiveplacesinthislist,withtheadultneedingtoearn$30.75perhourtobeself-sufficientinBridgeportand$29.92perhourinNewHaven.BridgeportismostcomparabletoPasadena,CAwhileNewHavensharesthesamewageforthisfamilytypeasBoulder,CO.
ThedifferencesintheSelf-SufficiencyStandardwagesreflectthevariationinthecostsofmeetingbasicneedsinurbanareasintheUnitedStates.Housingcostsinparticularvaryconsiderably(e.g.inAlexandria,VA,atwo-bedroomunitis$1,458permonthcomparedto$700permonthinLincoln,NE,accordingtothe2015FairMarketRents).
Publictransportationcostsaresignificantlylessthanthecostofowningandoperatingacar;thus,inareaswhereprivatetransportationcostsareassumed,theSelf-SufficiencyStandardwagereflectshighertransportationexpenses.FamiliesinBridgeportorNewHavenwhorequireacarwouldhavehighertransportationcoststhanshownhere,andthentheSelf-SufficiencyWagewouldbemorethaninBellevue,WA.
Iftheparentinthiscomparisonhasjustaminimumwagejob,shewillneedtoworkover130hoursperweektomeetherfamily’sbasicneedsinBridgeportorNewHaven.DespitethecostoflivinginBridgeportandNewHavenbeinglessthantheaverageforallplacesacrossConnecticut,thesecitiesaretwoofthemostexpensiveplacesinthisnationalcomparisonandhighlightthehighcostoflivinginConnecticut,nomatterwhereonelives.
figure 3. TheSelf-SufficiencyWageforBridgeport&NewHaven,CTComparedtootherCities,2015* One Adult, One Preschooler, and One School-Age Child
*Data for each city is the Self-Sufficiency Standard for the county in which the city is located. Wages for cities other than bridgeport and new haven are updated using the consumer Price index. **Wage calculated assuming family uses public transportation.
if The ParenT in ThiS comPariSon haS juST a
minimum WaGe job, She Will need To Work over
130 hourS Per Week To meeT her family’S baSic
needS in bridGePorT or neW haven
HOURLY SELF-SUFFICIENCY WAGE$17.27
$22.02
$22.77
$23.17
$24.09
$24.29
$24.39
$25.67
$29.92
$29.92
$30.75
$30.92
$32.10
$37.68
Savannah, GA
Lincoln, NE
Wilmington, DE
Dayton, OH
Baltimore City, MD
Syracuse, NY
Allentown, PA
Springfield, MA
Boulder, CO
New Haven, CT**
Bridgeport, CT**
Pasadena, CA
Bellevue, WA**
Alexandria, VA

12 • The Self-Sufficiency STandard for connecTicuT 2015
how has the cost of living changed in connecticut?
ThisisthethirdtimetheSelf-SufficiencyStandardhasbeencalculatedforConnecticut.ThissectionexamineshowtheSelf-SufficiencyStandardandcostcomponentscomparetotheresultsin1999and2005.
Adifferentsetofregionswasusedinthe1999reportthanin2005and2015.However,theNorthwestCornerregionin2005and2015consistsofthesamecitiesandtownsastheTorringtonregioncalculatedin1999.Figure 4comparestheSelf-SufficiencyStandardforthisregionforfourfamilytypes:oneadult;oneadultwithapreschooler;oneadultwithonepreschoolerandaschool-agechild;andtwoadultswithonepreschoolerandaschool-agechild.
•ThecostoflivingintheNorthwestCornerregionincreasedby60%forone-adulthouseholds,from$15,000in1999to$23,926in2015.
figure 4. TheSelf-SufficiencyStandardforNorthwestCorner,CT:1999,2005,and2015
ANNUAL INCOME
SELF-SUFFICIENCY STANDARD YEAR
$15,000
$23,926
$28,392
$39,134
$51,279
$34,596
$50,673
$62,708
$39,492
$56,761
$71,219
$0
$10,000
$20,000
$30,000
$40,000
$50,000
$60,000
$70,000
$80,000
TorringtonRegion 1999
NorthwestCorner 2005
NorthwestCorner 2015
1 Adult One Adult,One Preschooler
One Adult,One Preschooler,One Schoolage
Two Adults,One Preschooler,One Schoolage
$18,767
•TheStandardincreasedaround80%forthesefamilieswithchildrenintheNorthwestCornerregion.Thecostoflivingforafamilywithtwoadultsandtwochildren(apreschoolerandschool-agechild)increasedover$30,000since1999,from$39,492to$71,219.Incontrast,the2015federalpovertyguidelineshaveonlyincreasedby$7,550since1999,or45%.
•Witha164%increaseover16years,healthcarecostsgrewfasterthananyotherbasicexpensesince1999forthisfour-personfamily.Childcarecostsgrewataslowerratebuthadthelargestabsolutecostchangefrom$857in1999to$1,519in2015foronepreschoolerandoneschool-agechild.
TheFigure 5 mapdepictsthechangesinthecostofliving(asmeasuredbytheSelf-SufficiencyStandard)foronefamilytype—twoadults,onepreschooler,andoneschool-

The Self-Sufficiency STandard for connecTicuT 2015 • 13
agechild—between2005and2015inConnecticut.Onaverage,theSelf-SufficiencyStandardincreased32%(3.2%peryear)acrossConnecticut’sregionsoverthelastdecade.However,thereisconsiderablevariationbyregion.
•ThelargestincreasesintheStandardsince2005occurredinNewHaven,GreaterNewLondon,LowerConnecticutRiver,LowerFairfield,andStamfordwherecostsincreasedbetween39%and46%.In2005,thisfour-personfamilyinStamfordneeded$63,574peryeartomeettheirbasicneeds,butby2015thatamountincreasedto$93,026,nearly$3,000peryear.Notehoweverthatin2005publictransportationcostswereassumedinStamfordandLowerFairfieldwhilethe2015calculationincludesthecostofcarownership.Stamfordwouldhaveincreased32%since2005ifpublictransportationcostswereassumedin2015.
•TheregionswiththeslowestrateofchangeintheStandardincludeGreaterWaterbury,NaugatuckValley,NorthwestCorner,Windham,Waterbury,andStratford.
Costsincreasedinthisgroupbetween15%and28%since2015.
WhiletheoverallSelf-SufficiencyStandardincreasedbetween15%and32%,thismasksthesizablevariationinhowmucheach costincreased.Usingthesamefour-personfamilyasabove(twoadults,onepreschooler,andoneschool-agechild),Table 4showstheactualcostandpercentagechangeforeachbasicneedsince2005intheGreaterNewHavenregionaswellasstatewide.
•Healthcareincreasedbyfarthemost,forbothGreaterNewHavenandstatewide,85%and88%respectively.
•Witha43%and35%increase,housinghadthesecondlargestincreaseinbothGreaterNewHavenandstatewide.Indollarterms,thecostofhousingincreasedthemostby$400permonth,growingfrom$936to$1,335permonthforatwo-bedroomapartmentinGreaterNewHaven.
figure 5. PercentageChangeintheSelf-SufficiencyStandardforConnecticutbetween2005and2015 Two Adults, One Preschooler and One School-Age Child, CT 2015
15% - 28%
29% - 32%
33% - 38%
39% - 46%
2005 - 2015PERCENTAGE CHANGE
NorthwestCorner
Lower Fairfield
Stamford
Stratford
UpperFairfield
Bridgeport
GreaterNew Haven
New Haven LowerConnecticut
River
UpperConnecticut
River
New London
GreaterNew London
NortheastCorner
Windham
GreaterWindham
North Central
Hartford Suburbs
Hartford
GreaterWaterbury
Waterbury
Danbury
GreaterDanbury
NaugatuckValley

14 • The Self-Sufficiency STandard for connecTicuT 2015
•Taxesincreased39%inGreaterNewHaven,slightlylessthanthestatewideaverageof43%.
•Food,transportation,andmiscellaneousexpensesincreasedbetween25%,27%,and28%respectively.Onaverage,foodcostsincreasedatahigherratestatewide.NotethatcalculationofthestatewideaveragefortransportationcostsexcludesStamfordandtheLowerFairfieldregionduetothemethodologychangeinthesetworegions.
•Childcarecostsincreased8%inGreaterNewHavenand5%onaveragestatewide.11
Cost of liVinG inCreases Versus earninGs inCreases. WhiletheSelf-SufficiencyStandardforthisfour-personfamilyinGreaterNewHavenincreasedby32%
overthepast10years,workers’medianearningsincreasedbyjust7%(from$38,631to$41,193)inGreaterNewHavenoverthesametimeperiod.Likewise,statewidemedianearningshavelaggedjustasfarbehind,increasingonly8%comparedtothestatewideaverageincreaseof32%intheStandard.Putanotherway,Connecticutwageshaveriseninthelastdecadeatlessthanathirdoftherateatwhichthecostoflivinghasincreased.
DoCumentinG ChanGes in liVinG Costs With the stanDarD Versus the Consumer PriCe inDexTheofficialmeasureofinflationintheU.S.istheU.S.DepartmentofLabor’sConsumerPriceIndex(CPI).TheCPIisameasureoftheaveragechangesinthepricespaidbyurbanconsumersforgoodsandservices.SincetheStandardmeasuresthecostsofjustbasicneeds,thequestionishowtheincreasesincostsdocumentedherecomparetoofficialinflationrates.WeexaminethisquestioninFigure 6 bycomparingtheactualincreaseintheSelf-SufficiencyStandardtowhatthenumberswouldbeifwehadjustupdatedthe2005StandardwiththeCPI.SincetheCPIdoesnotincorporatetaxesortaxcredits,theseitemshavebeenremovedfromtheStandardshowninFigure6.Usingthesamefour-personfamilyasabove(twoadults,apreschoolerandschool-agechild),thiscomparisonwasdonefortwoplacesinConnecticut:DanburyandtheNorthCentralregion.
TheNortheastRegionConsumerPriceIndex(CPI)increased19%between2005and2015.Ifthe2005Self-SufficiencyStandardforDanbury($52,439peryearwithouttaxes/taxcredits),wasincreasedbythisamount,theCPI-adjustedcostofbasicneedsin2015wouldbeestimatedtohaveincreasedto$62,557peryear.12However,theactual2015Self-SufficiencyStandardamountforDanburyisconsiderablyhigher:at$68,296withouttaxes/taxcreditsperyearforthisfamilytype,a30%increaseoverthelast10years.Likewise,whentheCPIinflationrateisappliedto
Table 4. Percentage Change in the standard over time, 2005-2015, Greater new haven, cT Two Adults, One Preschooler, and One School-Age Child
Costs
2005 2015
PerCent ChanGe 2005 to
2015
stateWiDe PerCent ChanGe 2005 to
2015
housing $936 $1,335 43% 35%
Child Care $1,422 $1,532 8% 5%
food $670 $837 25% 32%
transportation $498 $635 27% 28%
health Care $336 $621 85% 88%
miscellaneous $386 $496 28% 28%
taxes $968 $1,349 39% 43%
TaxCredits* -$267 -$267 0% 0%
self-suffiCienCY WaGe
monthlY $4,950 $6,53932% 32%
annual $59,399 $78,467
MEdiANEArNiNgS**
Greater neW haVen $38,631 $41,193 7% --
stateWiDe $35,387 $38,121 -- 8%
* Total Tax credits is the sum of the monthly eiTc, ccTc, and cTc.** Greater new haven and connecticut statewide median earnings: u.S. census bureau, 2013 and 2005, american community Survey 5-year estimates, b20002, “median earnings in the Past 12 months by Sex for The Population 16 years and over With earnings in the Past 12 months,” census 2000 and 2010 Summary file 1 (Sf1) - 100 percent data “P001: Total Population,” and census 2000 Summary file 3, P085, “median earnings in 1999 (dollars) by Sex for the Population 16 Years and Over with Earnings in the Past 12 Months,” http://factfinder.census.gov (accessed february 19, 2015). data updated using the consumer Price index. u.S. department of labor, bureau of labor Statistics, (2014), consumer Price index,” northeast region all items, 1982-1984=100-cuur0400Sa0,” http://data.bls.gov/cgi-bin/surveymost?cu (accessed february 19, 2015).
connecTicuT WaGeS have riSen in The laST
decade aT leSS Than a Third of The raTe aT
Which The coST of livinG haS increaSed
The Self-Sufficiency STandard for connecTicuT 2015 • 15
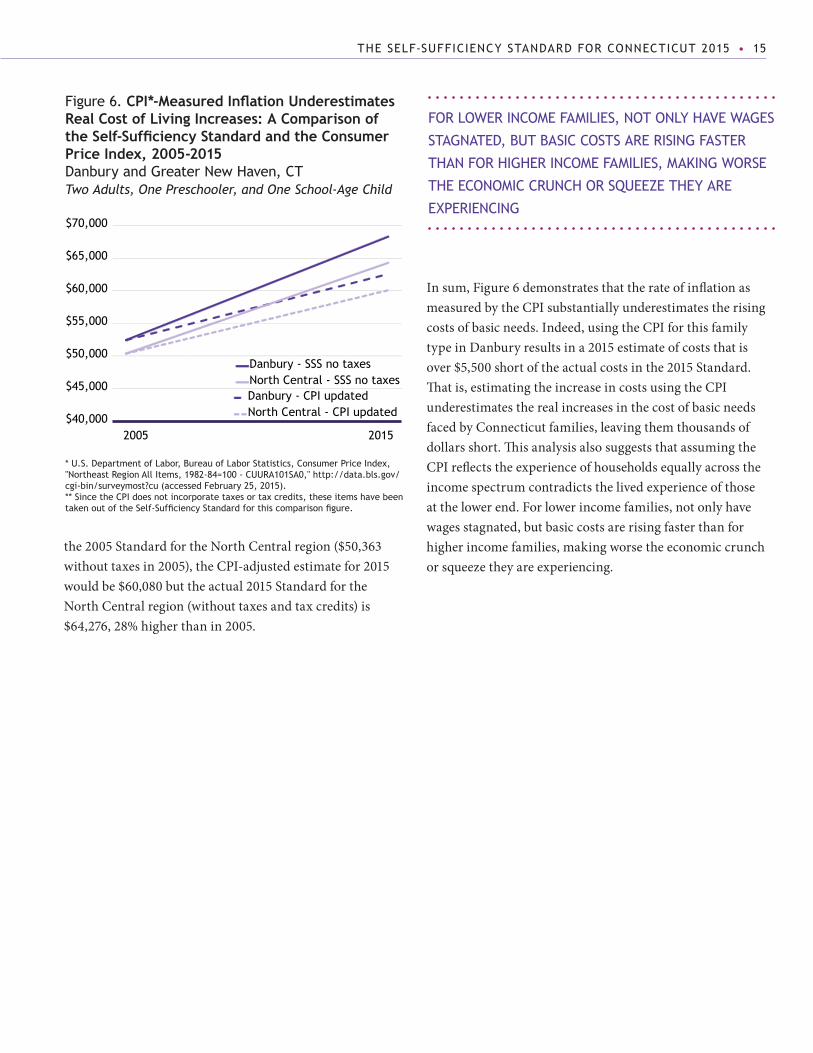
figure 6. CPi*-MeasuredinflationunderestimatesrealCostoflivingincreases:AComparisonoftheSelf-SufficiencyStandardandtheConsumerPrice index, 2005-2015 danbury and Greater new haven, cT Two Adults, One Preschooler, and One School-Age Child
* u.S. department of labor, bureau of labor Statistics, consumer Price index, "northeast region all items, 1982-84=100 - cuura101Sa0," http://data.bls.gov/cgi-bin/surveymost?cu (accessed february 25, 2015).** Since the cPi does not incorporate taxes or tax credits, these items have been taken out of the Self-Sufficiency Standard for this comparison figure.
$40,000
$45,000
$50,000
$55,000
$60,000
$65,000
$70,000
2005 2015
Danbury - SSS no taxes
Danbury - CPI updatedNorth Central - SSS no taxes
North Central - CPI updated
Insum,Figure6demonstratesthattherateofinflationasmeasuredbytheCPIsubstantiallyunderestimatestherisingcostsofbasicneeds.Indeed,usingtheCPIforthisfamilytypeinDanburyresultsina2015estimateofcoststhatisover$5,500shortoftheactualcostsinthe2015Standard.Thatis,estimatingtheincreaseincostsusingtheCPIunderestimatestherealincreasesinthecostofbasicneedsfacedbyConnecticutfamilies,leavingthemthousandsofdollarsshort.ThisanalysisalsosuggeststhatassumingtheCPIreflectstheexperienceofhouseholdsequallyacrosstheincomespectrumcontradictsthelivedexperienceofthoseatthelowerend.Forlowerincomefamilies,notonlyhavewagesstagnated,butbasiccostsarerisingfasterthanforhigherincomefamilies,makingworsetheeconomiccrunchorsqueezetheyareexperiencing.
for loWer income familieS, noT only have WaGeS
STaGnaTed, buT baSic coSTS are riSinG faSTer
Than for hiGher income familieS, makinG WorSe
The economic crunch or Squeeze They are
exPeriencinG
the2005StandardfortheNorthCentralregion($50,363withouttaxesin2005),theCPI-adjustedestimatefor2015wouldbe$60,080buttheactual2015StandardfortheNorthCentralregion(withouttaxesandtaxcredits)is$64,276,28%higherthanin2005.
16 • The Self-Sufficiency STandard for connecTicuT 2015
how does the Self-Sufficiency Standard compare to other benchmarks of income?
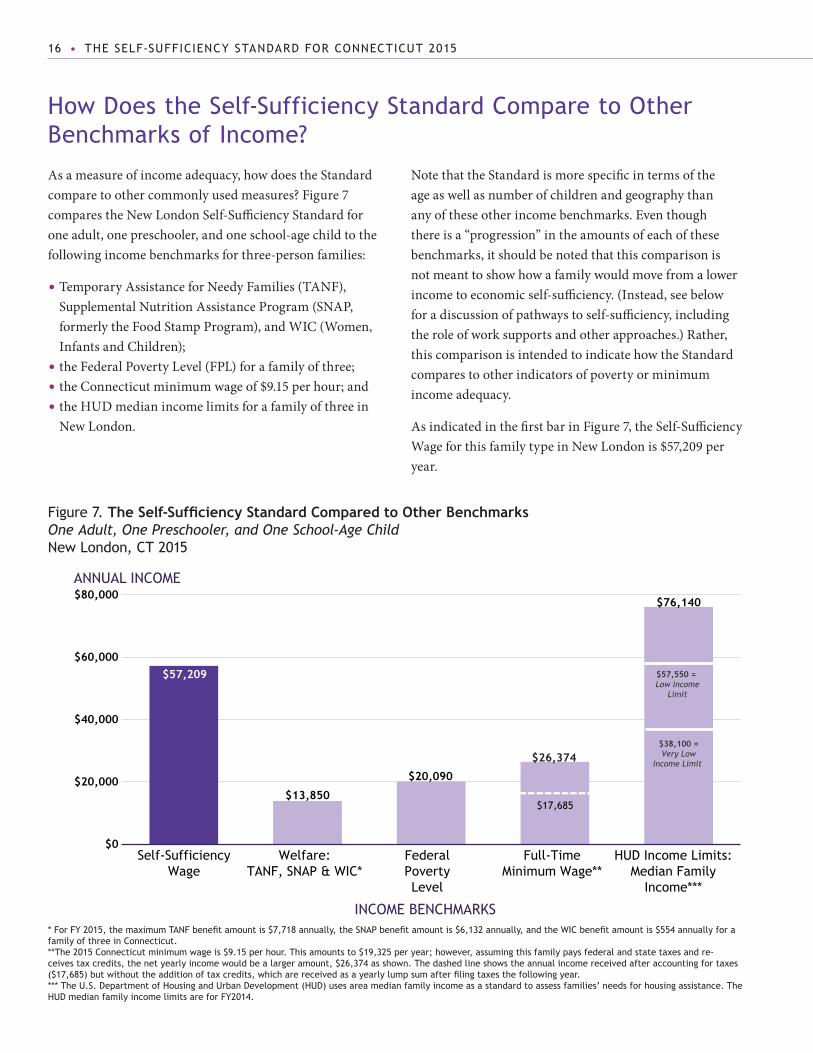
Asameasureofincomeadequacy,howdoestheStandardcomparetoothercommonlyusedmeasures?Figure7comparestheNewLondonSelf-SufficiencyStandardforoneadult,onepreschooler,andoneschool-agechildtothefollowingincomebenchmarksforthree-personfamilies:
•TemporaryAssistanceforNeedyFamilies(TANF),SupplementalNutritionAssistanceProgram(SNAP,formerlytheFoodStampProgram),andWIC(Women,InfantsandChildren);
•theFederalPovertyLevel(FPL)forafamilyofthree;•theConnecticutminimumwageof$9.15perhour;and•theHUDmedianincomelimitsforafamilyofthreein
NewLondon.
NotethattheStandardismorespecificintermsoftheageaswellasnumberofchildrenandgeographythananyoftheseotherincomebenchmarks.Eventhoughthereisa“progression”intheamountsofeachofthesebenchmarks,itshouldbenotedthatthiscomparisonisnotmeanttoshowhowafamilywouldmovefromalowerincometoeconomicself-sufficiency.(Instead,seebelowforadiscussionofpathwaystoself-sufficiency,includingtheroleofworksupportsandotherapproaches.)Rather,thiscomparisonisintendedtoindicatehowtheStandardcomparestootherindicatorsofpovertyorminimumincomeadequacy.
AsindicatedinthefirstbarinFigure7,theSelf-SufficiencyWageforthisfamilytypeinNewLondonis$57,209peryear.
figure 7. TheSelf-SufficiencyStandardComparedtootherBenchmarks One Adult, One Preschooler, and One School-Age Child new london, cT 2015
* For FY 2015, the maximum TANF benefit amount is $7,718 annually, the SNAP benefit amount is $6,132 annually, and the WIC benefit amount is $554 annually for a family of three in connecticut.**The 2015 connecticut minimum wage is $9.15 per hour. This amounts to $19,325 per year; however, assuming this family pays federal and state taxes and re-ceives tax credits, the net yearly income would be a larger amount, $26,374 as shown. The dashed line shows the annual income received after accounting for taxes ($17,685) but without the addition of tax credits, which are received as a yearly lump sum after filing taxes the following year.*** The u.S. department of housing and urban development (hud) uses area median family income as a standard to assess families’ needs for housing assistance. The hud median family income limits are for fy2014.
Self-SufficiencyWage
HUD Income Limits:Median Family
Income***
INCOME BENCHMARKS
ANNUAL INCOME
Welfare:TANF, SNAP & WIC*
FederalPovertyLevel
Full-TimeMinimum Wage**
$57,209
$13,850
$20,090
$26,374
$76,140
$0
$20,000
$40,000
$60,000
$80,000
$57,550 = Low Income
Limit
$38,100 =Very Low
Income Limit
$17,685

The Self-Sufficiency STandard for connecTicuT 2015 • 17
tanf, snaP anD WiC. ThesecondbarontheleftinFigure7calculatesthecashvalueofthebasicpublicassistancepackage,assumingnootherincome,andincludesthecashvalueofSNAP(formerlyfoodstamps),WIC,andTANF.Thispublicassistancepackagetotals$13,850peryearforthree-personfamiliesinConnecticut,whichisjust24%oftheSelf-SufficiencyStandardforathree-personfamilyinNewLondon,and69%oftheFPLforathree-personfamily.
feDeral PoVertY leVel. Athree-personfamily,regardlessofcompositionorwheretheylive,wouldbeconsidered“poor”withanincomeof$20,090annuallyorless,accordingtotheFederalPovertyLevel.TheFPLforthree-personfamiliesisjust35%oftheSelf-SufficiencyStandardforthisNewLondonfamily.
Thiscomparisonisforjustonefamilytype.InNewLondon,theSelf-SufficiencyStandardrangesfrom178%oftheFPLforahouseholdwithoneadultandtwoteenagersto351%oftheFPLforahouseholdconsistingofoneadultwiththreeinfants.Thiscomparisonisalsoforjustoneplace.Appendix C: Federal Approaches to Measuring PovertycomparesthepercentageoftheFPLneededtomeetbasicneedsforoneadult,onepreschooler,andoneschool-agechildacrossConnecticut,andfindsthattheSelf-SufficiencyStandardforthisfamilytyperangesfrom266%oftheFPLinWindhamto448%oftheFPLinLowerFairfield.SeeAppendixCfordiscussionoftherelatedSupplementalPovertyMeasure(SPM).
minimum WaGe. CurrentlyConnecticuthasaminimumwageof$9.15perhourin2015,whichamountsto$19,325peryearworkingfulltime.Becausethisisearnedincome,payrolltaxes(SocialSecurityandMedicare)aresubtractedandeligibletaxcredits(EITCandCTC)areadded.Altogetheraworkingparentwithtwochildrenwouldhaveanetcashincomeof$26,374peryear.Thisnet“takehome”amountismorethantheworker’searningsalonebecausethetaxcreditsforwhichthefamilyqualifiesaremorethanthetaxesowed.
Evenwitharelativelyhighstatewideminimumwage,afull-timeminimumwagejobinConnecticutprovideslessthanhalf,or46%oftheamountneededtobeself-sufficientforthisfamilytypeinNewLondon.Ifitisassumedmorerealisticallythattheworkerpaystaxesmonthlythroughwithholding,butdoesnotreceivetaxcreditsonamonthly basis(asistrueofallworkers),hertake-homeincomewouldbe$17,685duringtheyear,shownbythedashedlineonthethirdbar.WithoutincludingtheimpactoftaxcreditsineithertheminimumwageorSelf-SufficiencyStandardincome(butstillaccountingforpaymentoftaxes),aminimumwagejobamountstojust31%oftheSelf-SufficiencyStandardforthisfamilytypeinNewLondon.
meDian familY inCome limits. TheU.S.DepartmentofHousingandUrbanDevelopment(HUD)usespercentagesofareamedianfamilyincome(i.e.,halfoffamiliesintheareahaveincomeabovethisamount,andhalfbelow)todeterminefamilies’needsforhousingassistanceontheassumptionthatmedianincomeisaroughmeasureofthelocalcostofliving.TheFiscalYear2014HUDmedianincomeforathree-personfamilyinNewLondonis$76,140annually.13HUDincomelimitsdefinethreelevels:“lowincome”three-personfamiliesinNewLondonhaveincomesbetween50%and80%ofareamedianincome,or$38,100and$57,550;“verylowincome”three-personfamilieshaveincomesbetween30%and50%ofareamedianincome,or$22,900and$57,550;andthosewithincomesbelow30%ofareamedianincomeareconsidered“extremelylowincome.”14TheSelf-SufficiencyStandardof$76,140forthisfamilytypeinNewLondonisintheHUD“lowincome”range,demonstratingthattheStandardisaconservativemeasureoftheminimumrequiredtobeself-sufficientinNewLondon.(Notethatwithlimitedresources,mostfederalhousingassistancegoestofamilieswithincomesthatareconsidered“verylow”or“extremelylow.”)
18 • The Self-Sufficiency STandard for connecTicuT 2015
most Top occupations in connecticut fall Short of the Standard
Sincealmostallworking-agefamiliesmeettheirincomeneedswithemployment,acrucialquestioniswhetherthejobsavailableprovidesufficientwages.
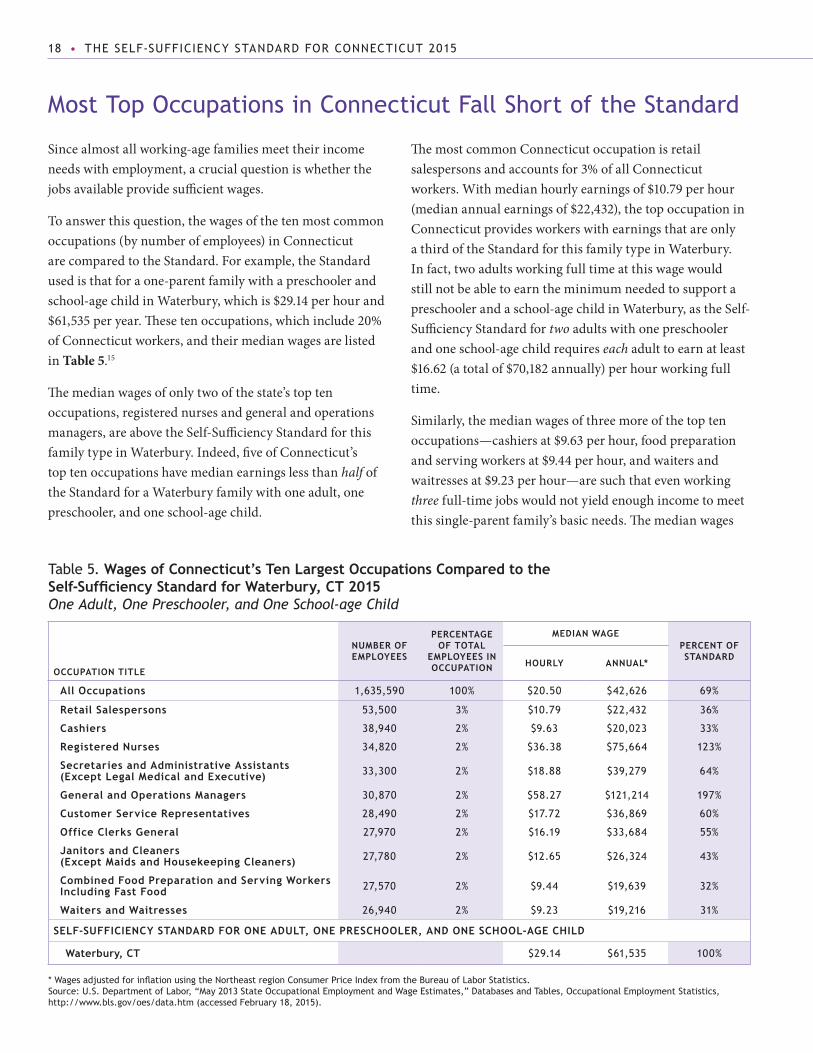
Toanswerthisquestion,thewagesofthetenmostcommonoccupations(bynumberofemployees)inConnecticutarecomparedtotheStandard.Forexample,theStandardusedisthatforaone-parentfamilywithapreschoolerandschool-agechildinWaterbury,whichis$29.14perhourand$61,535peryear.Thesetenoccupations,whichinclude20%ofConnecticutworkers,andtheirmedianwagesarelistedinTable 5.15
Themedianwagesofonlytwoofthestate’stoptenoccupations,registerednursesandgeneralandoperationsmanagers,areabovetheSelf-SufficiencyStandardforthisfamilytypeinWaterbury.Indeed,fiveofConnecticut’stoptenoccupationshavemedianearningslessthanhalfoftheStandardforaWaterburyfamilywithoneadult,onepreschooler,andoneschool-agechild.
ThemostcommonConnecticutoccupationisretailsalespersonsandaccountsfor3%ofallConnecticutworkers.Withmedianhourlyearningsof$10.79perhour(medianannualearningsof$22,432),thetopoccupationinConnecticutprovidesworkerswithearningsthatareonlyathirdoftheStandardforthisfamilytypeinWaterbury.Infact,twoadultsworkingfulltimeatthiswagewouldstillnotbeabletoearntheminimumneededtosupportapreschoolerandaschool-agechildinWaterbury,astheSelf-SufficiencyStandardfortwo adultswithonepreschoolerandoneschool-agechildrequireseachadulttoearnatleast$16.62(atotalof$70,182annually)perhourworkingfulltime.
Similarly,themedianwagesofthreemoreofthetoptenoccupations—cashiersat$9.63perhour,foodpreparationandservingworkersat$9.44perhour,andwaitersandwaitressesat$9.23perhour—aresuchthatevenworkingthree full-timejobswouldnotyieldenoughincometomeetthissingle-parentfamily’sbasicneeds.Themedianwages
Table 5. Wages of Connecticut’s ten largest occupations Compared to the Self-SufficiencyStandardforWaterbury,CT2015 One Adult, One Preschooler, and One School-age Child
oCCuPation title
numBer of emPloYees
PerCentaGe of total
emPloYees in oCCuPation
meDian WaGePerCent of stanDarD
hourlY ANNuAl*
all occupations 1,635,590 100% $20.50 $42,626 69%
retail salespersons 53,500 3% $10.79 $22,432 36%
Cashiers 38,940 2% $9.63 $20,023 33%
registered nurses 34,820 2% $36.38 $75,664 123%
secretaries and administrative assistants (except legal medical and executive) 33,300 2% $18.88 $39,279 64%
General and operations managers 30,870 2% $58.27 $121,214 197%
Customer service representatives 28,490 2% $17.72 $36,869 60%
office Clerks General 27,970 2% $16.19 $33,684 55%
Janitors and Cleaners (except maids and housekeeping Cleaners) 27,780 2% $12.65 $26,324 43%
Combined food Preparation and serving Workers including fast food 27,570 2% $9.44 $19,639 32%
Waiters and Waitresses 26,940 2% $9.23 $19,216 31%
self-suffiCienCY stanDarD for one aDult, one PresChooler, anD one sChool-aGe ChilD
Waterbury, Ct $29.14 $61,535 100%
* Wages adjusted for inflation using the Northeast region Consumer Price Index from the Bureau of Labor Statistics.Source: u.S. department of labor, “may 2013 State occupational employment and Wage estimates,” databases and Tables, occupational employment Statistics, http://www.bls.gov/oes/data.htm (accessed february 18, 2015).

The Self-Sufficiency STandard for connecTicuT 2015 • 19
oftheseoccupationsareabovetheConnecticutminimumwageyetlessthaneventheStandardforasingleadultwithnochildreninWaterbury.
Incontrast,themedianwagesofoccupationsassociatedwithindustriesprototypicalofConnecticutarewellabovetheStandard:biomedicalengineers,aerospaceengineers,andfinancialanalystsareover135%oftheSelf-SufficiencyStandardforthisfamilytypeinStratford(seeFigure 8).However,thesethreeoccupationstogetheraccountforlessthantwo-thirdsofonepercentofalloccupationsinConnecticut.
Thesenumbersreflecttheshifttowardsanincreasednumberoflow-wagejobsintherecoveryfromtheGreatRecession.Thatis,whilejoblossesoftheGreatRecession
only TWo of The STaTe’S ToP occuPaTionS,
reGiSTered nurSeS and manaGerS, yield
earninGS ThaT are above The minimum required
To meeT baSic needS
wereconcentrateddisproportionatelyinmid-wageoccupations,astheeconomyrecoversthejobgainshavebeendisproportionatelyinlower-wageoccupations,whiletheincomegainshavebeentothoseattheverytop,drivingtheincreasedincomeinequalitythatunderliesConnecticut’shighlevelsofsocioeconomicinequality.16Put another way, 80% of workers in the most common occupations, many of them in the fast growing but low wage service sector, do not earn wages sufficient to support their families.
Thisgrowingjobgaphasconsequencesinincreasedeconomicdistress,asincreasingnumbersofworkersstruggletomakeendsmeetatwageswellbelowtheminimumneededtomeettheirneeds.Atthesametime,thisanalysisofthewagesofthestate’smostcommonoccupationsdemonstratesthattheeconomicinsecurityfacedbysomanyofConnecticut’sworkersdoesnotreflectalackofworkeffort,orlackofskills,butsimplythatwagesaretoolowinmanycommonConnecticutoccupations,asituationexacerbatedbytheunbalancedpost-GreatRecessionrecovery.
***
Therearetwobasicapproachestoclosingtheincomegapbetweenlowwagesandwhatitreallytakestomakeendsmeet:reducecostsorraiseincomes.Thenexttwosectionswilldiscussstrategiesusedineachoftheseapproaches.Thefirstapproachreliesonstrategiestoreducecosts,oftentemporarily,throughworksupports(subsidies),suchasfoodandchildcareassistance.Strategiesforthesecondapproach,raisingincomes,includebroaderapproachessuchasdirectlyincreasingincomesthroughraisingtheminimumwageaswellasincreasingeducationlevels,incumbentworkerprograms,andnontraditionaljobtracks.Reducingcostsandraisingincomesarenotnecessarilymutuallyexclusive,butcanoccursequentiallyorintandem,attheindividualleveloratthecommunity,stateornationallevel.Forexample,someparentsmayseekeducationandtrainingthatleadstoanewjob,yetcontinuetosupplementtheirincomeswithworksupportsuntiltheirwagesreachtheself-sufficiencylevel.
figure 8. select occupations Compared to the Self-SufficiencyStandardforWaterbury,CT2015 One Adult, One Preschooler, and One School-age
$41.01
$44.05
$45.94
Financial Analysts
Biomedical Engineers
Aerospace Engineers
$29.14Self-Sufficiency Standard
HOURLY WAGE
20 • The Self-Sufficiency STandard for connecTicuT 2015
Asdescribedabove,giventhecurrentjobsituation,manyfamiliesstruggletomeettheirfamilies’basicneedsonearningsalone.Worksupports(subsidiesorassistance)canhelpworkingfamiliesachieveeconomicstability,sothattheydonotneedtochoosefromamongtheirbasicneeds,suchasscrimpingonnutrition,livinginovercrowdedorsubstandardhousing,orleavingchildreninunsafeornon-stimulatingenvironments.Withsuchstability,parentscannotonlyobtainjobs,butareabletoretainemployment,anecessaryconditionforimprovingwages.Thissectionmodelshowworksupportscanreduceafamily’sexpensesuntiltheyareabletoearnSelf-SufficiencyWages,thusclosingthegapbetweenactualwagesandwhatitreallytakestomakeendsmeet.
Worksupportsincludeprogramssuchas:
•child care assistance:Connecticut’sCare4Kidschildcareprogram;
•health care assistance:Connecticut’sHUSKYhealthprogramoperatesthestate’sMedicaidandChildren’sHealthInsurancePrograms(CHIP);
•food assistance:SupplementalNutritionAssistanceProgram(SNAP,formerlyknownastheFoodStampProgram)andtheWomen,InfantsandChildren(WIC)Program;
•housing assistance:Section8vouchersandpublichousing.
Work Supports bridge the difference between Wages and costs
Work SuPPorTS can helP WorkinG familieS
achieve STabiliTy WiThouT needinG To chooSe
from amonG Their baSic needS
Althoughnotaworksupportperse,childsupportisalsomodeledasitassistsfamiliesinmeetingbasicneeds.
Althoughanalyzedhere,thismodelingshouldnotimplythatallhouseholdswithinadequateincomereceivetheseworksupportsorchildsupport.Unfortunately,thesesupportsarenotavailableoraccessibletoallwhoneedthemduetoeligibilitycriteria,lackofsufficientfundingtohelpallwhoareeligible,waitinglists,administrativebarriers,lackofknowledgeorlegalenforcement,ortheperceivedstigmaofreceivingassistance.Yet,whenfamiliesdoreceivethem,worksupports,taxcredits,andchildsupportplayacriticalroleinhelpingfamiliesmovetowardseconomicself-sufficiency.
hoW Do WorK suPPorts anD ChilD suPPort reDuCe Costs? OurstartingpointistheSelf-SufficiencyStandard,whichiscalculatedwithoutanyassistance,publicorprivate,and
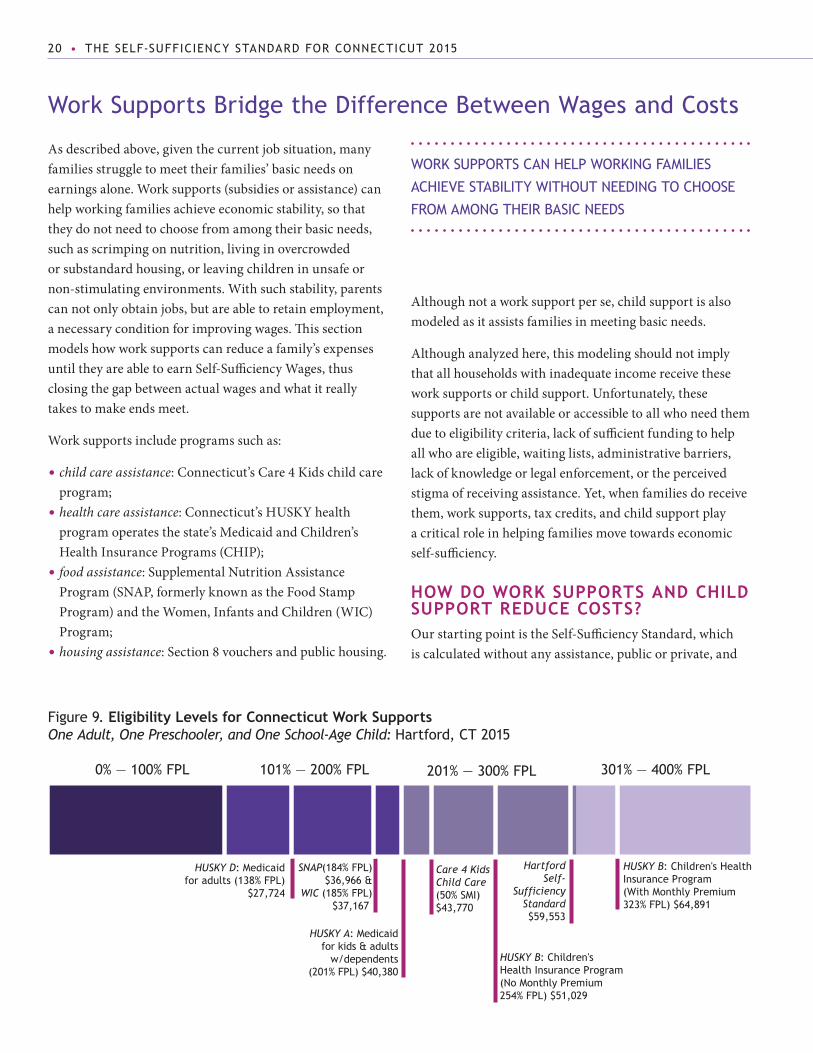
figure 9. eligibility levels for Connecticut Work supports One Adult, One Preschooler, and One School-Age Child: hartford, cT 2015
0% — 100% FPL 101% — 200% FPL 201% — 300% FPL 301% — 400% FPL
HUSKY D: Medicaidfor adults (138% FPL)
$27,724
SNAP(184% FPL)$36,966 &
WIC (185% FPL)$37,167
HUSKY A: Medicaidfor kids & adults
w/dependents(201% FPL) $40,380
Care 4 KidsChild Care(50% SMI)$43,770
HUSKY B: Children'sHealth Insurance Program(No Monthly Premium254% FPL) $51,029
HartfordSelf-
SufficiencyStandard$59,553
HUSKY B: Children's HealthInsurance Program (With Monthly Premium323% FPL) $64,891

The Self-Sufficiency STandard for connecTicuT 2015 • 21
thenweaddworksupports,onebyone.Table 6 providesasummaryoftheworksupports,childsupport,andtaxcreditsmodeledinthissection,whileFigure 9 showstheincomeeligibilitylevelsfortheworksupportsmodeledinthissection.
Table 7 showstheimpactofworksupports.ThefamilytypeusedhereisaHartfordfamilywithoneadult,onepreschooler,andoneschool-agechild.Column#1ofTable7showsthecostsintheSelf-SufficiencyStandard,withoutanyworksupportsorchildsupport,withvariouscombinationsofworksupportsandchildsupportshowninthesubsequentcolumns.Incolumns#2-#6ofTable7,theworksupportsmodeledarelistedinthecolumnheadings
andmonthlycostsreducedbytheseworksupportsareindicatedwithboldfontinthetable.
the self-suffiCienCY stanDarD (Column #1). Withoutanywork(orother)supportstoreducecosts,tomeetthecostofbasicneeds,thisHartfordfamilyneeds$4,963permonth.Thisfamilyhasmonthlychildcareexpensesof$1,663andmonthlyhousingcostsof$959.TheadultinthisfamilymustearnaSelf-SufficiencyWageof$4,963permonth,or$28.20perhourworkingfulltime,tomeetthefamily’sbasicneedswithoutthehelpofpublicorprivateassistance.
Table 6. Summary of connecticut’s Work Supports, child Support, and Tax credits
WorK suPPort ProGram Benefit inCome eliGiBilitY
ChilD Care assistanCe(connecticut care 4 kids)
child care costs are reduced to a monthly co-payment which is dependent on income level. for example, the co-pay for a family earning less than 20% of state median income is 2% of the household income.
eligibility for care 4 kids is set at 50% of state median income; currently $43,770 for a three person family.
housinG assistanCe(Section 8 housing vouchers & Public housing)
housing costs are typically set at 30% of adjusted gross income.
households may be eligible with incomes that are 80% of area median income. however, due to limited funding most new program participants must have income below the higher of 30% of area median income or 100% of the federal poverty guidelines.
meDiCaiD(connecticut huSky a & d)
health care benefits are fully subsidized. adults are covered with income up to 138% fPl. children and adults with dependents are covered with income up to 201% fPl.
ChilDren's health insuranCe ProGram(connecticut huSky b)
health care benefits for children under 19 years of age with either no or low-cost premiums depending on income and number of children insured.
children in families with income below 254% fPl are eligible for no premium, below 323% fPl with $30 premium for one child and $50 premium for two or more children.
suPPlemental nutrition assistanCe ProGram (snaP), formerlY fooD stamP ProGram
maximum benefit for a family of 3: $511 per month. maximum benefit for a family of 4: $649 per month.
families must earn gross income less than 184% of the fPl to be eligible and must also meet net income (gross income minus allowable deductions) guidelines.
sPeCial suPPlemental nutrition ProGram for Women, infants, anD ChilDren (WiC)
average monthly benefit of $46 in connecticut for purchasing supplemental nutritious foods. also includes breastfeeding support and health education.
Pregnant and postpartum women and children up to age 5: at or below 185% fPl.
ChilD suPPort average payment is $198 per month in connecticut. no income limit.
feDeral tax CreDits Benefit inCome eliGiBilitY
feDeral earneD inCome tax CreDit (eitC)
Maximum benefit for 1 child: $3,305 per year. Maximum benefit for 2 children: $5,460 per year. Maximum benefit for 3+ children: $6,143 per year.
connecticut’s state eiTc is 30% of the federal eiTc.
1 child: $38,511 (one parent) or $43,941 (married). 2 children: $43,756 (one parent) or $49,186 (married). 3+ children: $46,997 (one parent) or $52,427 (married).
feDeral ChilD anD DePenDent Care tax CreDit (CCtC)
$3,000-$6,000 annual tax deduction. no income limit.
feDeral ChilD tax CreDit (CtC) up to $1,000 annual tax credit per child. benefit is reduced by $50 for every $1000 over income threshold.
married filing jointly: up to $110,000. head of household: up to $75,000. refundable portion limited to earnings over $3,000.
Note: Eligibility levels and benefits for work supports and tax credits change routinely—typically yearly. The information reported in Table 5 represents eligibility and benefit guidelines for 2015. The 2015 Federal Poverty Level (FPL) for a family of three is $20,090 (annual income). See http://aspe.hhs.gov/poverty/15poverty.shtml.

22 • The Self-Sufficiency STandard for connecTicuT 2015
ChilD suPPort (Column #2). Childsupportpaymentsfromabsent,non-custodialparentscanbeavaluableadditiontofamilybudgets.TheaverageamountreceivedbyfamiliesparticipatinginthechildsupportenforcementprograminConnecticutis$198permonth(seecolumn#2).17Addingchildsupportreducesthewage
neededbythisparenttomeetbasicneedsto$4,690permonth,or$26.65perhour.
ChilD suPPort & ChilD Care (Column #3). Becausechildcareisamajorexpenseforfamilieswithyoungchildren,childcareassistanceoftenprovidesthegreatestfinancialreliefofanysingleworksupport,and
Table 7. impact of the addition of Child support and Work supports on MonthlyCostsandSelf-SufficiencyWage One Adult, One Preschooler, and One School-Age Child: hartford, cT 2015 Each column demonstrates how specific work supports can lower the cost of specific basic needs, and therefore lessen the income necessary to meet all of a family’s basic needs. Costs that have been reduced by these supports are indicated with bold font in the table.
#1 #2 #3 #4 #5 #6
self-suffiCienCY
stanDarD
ChilD suPPort
ChilD suPPort,
ChilD Care
ChilD suPPort,
ChilD Care, SNAP/WiC*&
meDiCaiD
ChilD suPPort,
ChilD Care W/o CaP,
SNAP/WiC*&meDiCaiD
ChilD suPPort, housinG,
ChilD Care, SNAP/WiC*&
meDiCaiD
MoNTHlyEXPENSES:
housing $959 $959 $959 $959 $959 $485
Child Care $1,663 $1,663 $852 $703 $67 $628
food $602 $602 $602 $208 $261 $135
transportation $54 $54 $54 $54 $54 $54
health Care $538 $538 $538 $0 $0 $0
miscellaneous $382 $382 $382 $382 $382 $382
taxes $1,032 $958 $642 $275 $153 $150
total monthlY exPenses (neT of Work SuPPorTS) $5,229 $5,155 $4,029 $2,580 $1,876 $1,833
AddiTioNAlMoNTHlyrESourCES:
TotalTaxCredits** ($267) ($267) ($225) ($58) $0 $0
Child support $0 ($198) ($198) ($198) ($198) ($198)
total aDDitional monthlY resourCes ($267) ($465) ($423) ($256) ($198) ($198)
SElFSuFFiCiENCyWAgE:(ToTal monThly exPenSeS minuS ToTal addiTional monThly reSourceS)
hourlY $28.20 $26.65 $20.48 $13.20 $9.53 $9.29
monthlY $4,963 $4,690 $3,605 $2,324 $1,678 $1,635
annual $59,553 $56,283 $43,261 $27,887 $20,130 $19,618
ANNuAlrEFuNdABlETAXCrEdiTS**:
total federal eitC $0 $104 $3,342 $4,976 $5,084
total state eitC $0 $29 $919 $1,368 $1,398
total federal CtC $0 $501 $2,000 $2,000 $2,000
* WIC is the Special Supplemental Nutrition Program for Women, Infants and Children (WIC) in Connecticut. Assumes average monthly value of WIC benefit $46.17 (FY 2014). SnaP is the Supplemental nutrition assistance Program, formerly known as the food Stamp Program.** The Standard shows refundable and nonrefundable tax credits as if they are received monthly. however, in order to be as realistic as possible, tax credits that are available as a refund on annual taxes are shown at the bottom of this table. eiTc is shown only as an annual tax credit. The nonrefundable portion of the child Tax credit (which is a credit against federal taxes) is included as available to offset monthly costs, and the refundable portion is shown in the bottom of the table. The child care Tax credit is nonrefundable, and therefore is only part of the monthly budget and does not appear in the bottom shaded rows of the table.

The Self-Sufficiency STandard for connecTicuT 2015 • 23
atthesametimeaddsstabilityforparents,children,andemployers.Familiesmusthaveincomesbelow50%ofstatemedianincometobeeligibleforConnecticutchildcareassistanceprogram,knownasCare4Kids,orlessthan$43,770forathree-personfamily.18Addingtheimpactofchildcareassistancereducesthemonthlywageneededbyroughlyaquarter,to$3,605($20.48perhour).
ChilD suPPort, ChilD Care, fooD, & meDiCaiD (Column #4). Foradultstransitioningfromcashassistancetoemployment,childcareassistance,foodassistance,andMedicaidmakeupthetypical“package”ofbenefits.
TheadultwouldbeeligiblefortransitionalMedicaidfor12monthswhenstartingworkaftercashassistanceandisalsoeligibleforHUSKYHealthupto138%oftheFPLwhichisnowexpandedtocoveradultsundertheAffordableCareAct(ObamaCare).Additionally,childreninfamilieswithincomeupto254%oftheFPLareeligibleforhealthinsurancewithnopremiumsandchildreninfamilieswithincomebetween254%and323%oftheFPLareeligibleforlow-costpremiums.
•Medicaidcoversallofthefamily’shealthcareexpenses,therefore,healthcarecostsarereducedfrom$538permonthtozeroincolumn#4.
•SNAPandWICreducefoodcostsfrom$602to$208permonth(familiesareeligibleforSNAPwithincomesupto184%oftheFPLinConnecticutandforWICwithincomesupto185%oftheFPL).19
•Care4Kidsreducesthefamily’schildcarecopaymentto$703permonth.
Altogether,theseworksupportsreducethewagerequiredtomeetbasicneedsto$2,324permonth,halfofthefullSelf-SufficiencyStandard.Withthehelpofthesecrucialworksupports,thisHartfordfamilymakingthetransitionfrompublicassistance/non-employmentwouldbeabletomeetthefamily’sbasicneedsatastartingwageof$13.20perhour.
ChilD suPPort, ChilD Care (no CaP), fooD, & meDiCaiD (Column #5). Column#5modelstheimpactofeliminatingthereimbursementcaponchildcarecosts.ThechildcarereimbursementrateshavenotbeenrebasedinConnecticutwithamarketratesurveysince
2001(althoughtheyarenowsettoincrease12%overafouryearperiod).Thishasmeantthatchildcarereimbursementsarenotkeepingupwiththecostofchildcare.Incolumns3and4,thechildcarecostsshownarethecombinationoftheparents’income-basedcopayamountplusthedifferencebetweenthestatemaximumreimbursementlevelandactualcosts.
Ifthemaximumreimbursementlevelwassetatthecurrent75thpercentile,thenormundertheFamilySupportAct(1988-1996)andinmoststates,andtheamountshownintheStandard,thechildcarecostswouldbejusttheparent’sincome-contingentcopayof$67(insteadof$703incolumn4).Thecostoffoodincreasesslightlyfromcolumn4asthechildcaredeductionforSNAPissmaller.Theminimummonthlywageneededunderthesecircumstancesis$1,678($9.53hourly).Thisisjustoverthestateminimumwage,andthreeofConnecticut’stoptenoccupationspaymedianwagesthatareclosetothisstartingwage.
ChilD suPPort, ChilD Care, fooD, meDiCaiD, & housinG (Column #6). Housingassistancehasasubstantialimpactonhelpingfamiliesmeettheirbasicneeds,ascanbeseenbycomparingcolumn#4tocolumn#6.Byreducingthecostofhousingto30%ofincome,throughahousingvoucherorotherassistance,housingcostsdropfrom$959to$485permonth.20Theadditionofhousingassistancereducestheincomeneededtomeetbasicneeds,therebyincreasingthepotentialfoodsubsidylevelandloweringfoodcoststo$135permonth.Withthefullbenefitpackage,aparentwithonepreschoolerandoneschool-agechildlivinginHartfordcanmeetbasicneedswithanincomeofjust$1,635permonth.Notehoweverthatveryfewfamiliesreceiveallofthesebenefits.
a note on refunDaBle tax CreDits. AlltaxesandtaxcreditsareshownintheStandardasmonthlybecausetheStandardcostsareshownasamonthlybudget.However,becausefamiliesdonotactuallyreceivetherefundabletaxcreditsmonthly,butinsteadreceivethemattheendoftheyear(astaxrefunds),theannualamountsoftherefundabletaxcreditsareshownintheshadedrowsatthebottomofthetableforcolumns#2-#6.(Thisannualtotalassumesthattheadultworksfulltimeatthesewagesthroughouttheyear.)Theamountsvarysignificantly,

24 • The Self-Sufficiency STandard for connecTicuT 2015
dependinguponincome.Whencostsareonlyreducedbychildsupportasincolumn#2,thefamily’sincomeishighenoughthattheydonotqualifyforrefundabletaxcredits.Incolumn#6,inwhichthefullworksupportpackageismodeled,theparentiseligibleforover$8,000inannualrefundabletaxcredits.
hoW Do WorK suPPorts inCrease WaGe aDeQuaCY? Table7showshowchildsupportandworksupportsreducethewageneededtomeetbasicneeds.Incontrast,Figure 10startswithspecificwagesandasks“Howadequatearethesewagesinmeetingafamily’sneeds,withandwithoutvariouscombinationsofworksupports?”Wageadequacyisdefinedasthedegreetowhichagivenwageisadequatetomeetbasicneeds,takingintoaccountthefinancialimpactofvariousworksupports,orlackthereof.Ifwage
adequacyisatorabove100%,thewageisenoughormorethanenoughtomeetallofthefamily’sbasicneeds;ifitisbelow100%,itisonlyadequatetocoverthatpercentageofthefamily’sbasicneeds.Forexample,ifwageadequacyisat80%,thenthewageonlycovers80%ofthecostofmeetingthatfamily’sbasicneeds.
Aswagesincrease,startingoutatminimumwage,worksupportshelpclosethegapbetweenactualwagesandhowmuchittakestomeetbasicneeds.ModelingthesamefamilytypeasinTable7(oneparentwithonepreschoolerandoneschool-agechildinHartford),Figure10showstheimpactofworksupportsonwageadequacyastheparent’sincomeincreases.Thedashedlineprovidesthebaseline,showingtheadequacyofvariouswageswithoutanyworksupports.Eachsolidlinerepresentsadifferentworksupport
figure 10. impact of Work supports on Wage adequacy One Adult, One Preschooler, and One School-Age Child hartford, cT 2015
PERCENTAGE OF WAGE ADEQUACY
HOURLY WAGE
Wage Adequacy
CT 2015MinimumWage
RetailSalesperson
Janitors &Cleaners(Except Maids)
Nursing Assistants
Bookkeeping, Accounting,& Auditing Clerks
0%
20%
40%
60%
80%
100%
120%
$9 $10 $11 $12 $13 $14 $15 $16 $17 $18 $19 $20 $21 $22 $23 $24 $25 $26
No Work Supports Child Care Child Care, Food, & Health Care Housing, Child Care, Food, & Health Care
Work Support DefinitionsChild Care = Connecticut Care 4 Kids; Food = Supplemental Nutrition Assistance Program (SNAP/Food Stamps) & Women, Infants, and Children (WIC); Health Care = Connecticut HUSKY Health Program; Housing = Section 8 Housing

The Self-Sufficiency STandard for connecTicuT 2015 • 25
Appendix E: Modeling the Impact of Work Supports on
Wage Adequacy shows the impact of Work Supports on
Wage adequacy in a full table format, including detail
of the impact on specific monthly expenses.
package,andshowshowmuchwageadequacyincreasesabovethedashedbaselineasaresultoftheadditionofworksupports.InadditiontoFigure10,seeAppendix E: Modeling the Impact of Work Supports on Wage Adequacyforadetailedtableoftheexactamountsofeachworksupportmodeledinthefigure.
ConneCtiCut minimum WaGe. WithaConnecticut2015minimumwageof$9.15perhour,aHartfordparentwithtwochildrenworkingfulltimeearnsjustoverathird(only37%)oftheincomeneededtomeetherfamily’sbasicneedsifsheisnotreceivinganyworksupports(seethedashedlineinFigure10).21
However,iftheparentreceivesConnecticut’sCare4Kidschildcare(thefirstsolidlinefromthebottominFigure9),themonthlycostofchildcaredecreasesfrom$1,663to$628,andwageadequacyincreasesto48%—asubstantialincreasebutstillcoveringlessthanhalfofhermonthlyexpenses.Ifthefamilyalsoreceivesassistancewithfood(SNAPandWIC)andhealthcare(HUSKYAforchildrenandadultswithdependents)thecostoffooddecreasesto$50permonthandhealthinsuranceto$0permonth,increasingwageadequacyto72%(showninthesecondsolidlinefromthetopinFigure10).Withtheadditionofhousingassistancecombinedwiththeotherworksupports,housingcostsarereducedto30%ofthefamily’sincomeandwageadequacyreaches88%(topsolidlineinFigure10).
retail salesPersons. RetailsalespersonsarethemostcommonoccupationinConnecticut.Workingattheretailsalesperson’smedianwageof$10.70perhour,thisHartfordsingleparent’swageadequacywouldbe42%withoutanyassistance.However,theadditionofjustchildcareassistanceincreasesherwageadequacyto55%,andifshealsoreceivesfoodassistanceandHUSKYhealthforthewholefamily,itreaches80%.Receivingthefullwork
supportpackagewithhousingassistanceaswellallowshertomeet93%ofthefamily’sbasicneeds.
Janitors & Cleaners (exCePt maiDs). Atthemedianwageofjanitorsandcleaners,whichis$12.55perhour,thissingleparentwouldbeabletocover49%ofherfamily’sbasicneedswithoutanyworksupports.Withchildcareassistanceherwageadequacywouldincreaseto64%.IfshealsoreceivesfoodassistanceandHUSKYhealth,wageadequacyreaches97%.
nursinG assistants. Themedianwageofnursingassistants,$14.92perhour,issuchthatthissingleparentwouldbeabletomeet58%oftheincomeneedsofherfamilywithoutanyassistance.Receivingassistancewithchildcarecostsincreasesthewageadequacyto73%.ThefurtheradditionoffoodassistanceandHUSKYhealthincreasesthewageadequacyto96%.Finally,ifshereceivesthefullworksupportpackage,wageadequacyreaches101%.
BooKKeePinG, aCCountinG, anD auDitinG ClerKs. Ifthisparent’swagewere$20.30perhour,whichisthemedianhourlywageforbookkeeping,accounting,andauditingclerks,shewouldearnenoughforhertocover76%ofherfamily’sbasicneedswithoutanyassistance.Withonlytheassistanceofchildcare,thiswagewillcover93%ofthefamily’scosts.AtthiswagelevelsheisnolongereligibleforhousingorfoodassistanceandHUSKYhealthonlycoversthechildren’shealthcosts.However,withthehelpofHUSKYBandCare4Kidschildcareassistance,theparentisabletomeetallofthefamily’sbasicneeds.

26 • The Self-Sufficiency STandard for connecTicuT 2015
closing the Wage Gap: raising incomes
Forfamilieswhoseearningsarebelow100%wageadequacy,worksupportsforhigh-costnecessitiessuchaschildcare,healthcare,andhousingarefrequentlytheonlymeanstomeetbasicneeds.However,truelong-termself-sufficiencymeanstheabilityoffamiliestomeetbasicneedswithoutanypublicorprivateassistance.FullyclosingConnecticut’swagegapwillrequirepublicpoliciesthatmakeworkpay,increasingtheskillsoflow-wageworkers,andrecognizingtheimportanceofassetbuilding.
raise WaGesAsdemonstratedinthisreport,inmanycaseseventwoadultsworkingfulltimemusteachearnwellbeyondaminimumwagetomeettheirfamily’sbasicneeds.Raisingwagescanhaveapositiveimpactnotonlyforworkers,butalsoforemployersbydecreasingturnover,increasingworkexperience,andreducingtrainingandrecruitmentcosts.
minimum WaGes. Onemethodtoincreasesalariesoflow-wageworkersistoincreaseandindextheminimumwage,thusprovidingafloorunderwagesforallworkers,andinsuringthatthewageswillcontinuetokeeppacewithinflation.Minimumwagescanbesetatthefederallevel,butalsoatthestateandlocallevel.Whilethefederalminimumwagehasremainedat$7.25anhoursince2009,22stateshavepassedhigherminimumwages,withnineindexingthemaswell.22Thehighest(andindexed)isWashingtonat$9.47perhour(in2015).23Elevenstateshaveenactedlegislationthatwillleadtohigherwagesinthefuture.24Seattle,WA,andSanFrancisco,CA,haveadoptedthehighestlocalwagestobeenactedtodate.In2018theminimumwagewillreach$15perhourinSanFranciscoandthereafterwillbeindexed.InSeattletheminimumwagewillreach$15perhourin2018forworkersoflargeemployersbutnotuntil2021forallworkers,andthereafterwillbeindexed.25
loCal liVinG WaGes. Localizedlivingwagelawsareanotherapproachtoraisingwagesofworkers.Theselawsmandatethatpublicemployers,aswellascontractorsandemployersreceivingpublicsubsidies,paya“livingwage,”thusimpactingprivatesectoraswellaspublicsectorwages.
unionization. AccordingtotheBureauofLaborStatisticsandtheU.S.DepartmentofLabor,unionrepresentationofworkersalsoleadstohigherwagesandbetterbenefits.26Thisunion“premium,”controllingforotherfactorsisworthabout13.6%inincreasedwages.27
However,thepercentageofworkersrepresentedinunionsoverthepasthalfcenturyhasdecreased,sothatcurrentlyonlyabout7%ofprivatesector,and35%ofpublicsectorworkersareunionmembers.28
PaY eQuitY laWs. Payequitylawsrequireemployerstoassessandcompensatejobsbasedonskills,effort,responsibility,andworkingconditions,andnotbasedonthegenderorrace/ethnicityofthejob’soccupants.29
Womenandpeopleofcoloralltoooftenfaceartificialbarrierstofairhiring,fairwages,andequalbenefitsandpromotionopportunities—barriersnotaddressedbytaxcreditsortrainingandeducationstrategies.Itisimportanttorecognizethatnotallbarrierstoself-sufficiencylieintheindividualsorfamiliesseekingself-sufficiency,butthatsomearegender-orrace-basedstructuralconstraintsanddiscrimination.
inCrease sKills Post-seConDarY eDuCation/traininG. Increasingtheskillsoflow-wageworkersprovidespathstoself-sufficiencyandstrengthenslocaleconomies.Asbusinessesincreasinglyneedworkerswithhigherskilllevels,ahighschooldiplomaorGEDdoesnothavethevaluethatitoncehadinthejobmarket.30AsshowninFigure 11,themedianearningsofmaleandfemaleworkersinConnecticutgrowaseducationlevelsincrease.31Whileincreasededucationisimportantforbothmenandwomen,thegenderwagegapateverylevelcontinuestopresentadditionalchallengesforwomenworkers.
BasiC aDult eDuCation. Formanyworkerswithinadequateeducation,languagedifficulties,orinsufficientjobskillsorexperience,basicadulteducationprogramsareanimportantfirststep.Duetowelfaretimelimitsandrestrictionsoneducationandtraining,short-term,highqualityprogramsthatteachbasicskillsandjobskillstogetherinawork-relatedcontextareimportant.

The Self-Sufficiency STandard for connecTicuT 2015 • 27
Source: U.S. Census Bureau, American Factfinder, 2012 American Community Survey, “b20004. median earnings by Sex by educational attainment for the Population 25 Years and Over,” Detailed Tables, http://factfinder2.census.gov/ (accessed September 12, 2014).
figure 11. impact of education on median earnings by Gender, Connecticut 2015
nontraDitional oCCuPations. Forwomen,many“nontraditional”occupations(NTOs),suchasinmanufacturing,technology,andconstruction,requirerelativelylittlepost-secondarytraining,yetcanprovidewagesatself-sufficiencylevels.Inparticular,demandforworkersinthe“greeneconomy”isanticipatedandinvestinginNTOtrainingprogramsforwomenwillbroadenthepoolofskilledworkersavailabletoemployersandcreateamorediverseworkforcethatisreflectiveofthecommunity.32
inCumBent WorKer traininG. Forlow-incomeworkerswhoarealreadyinanindustrythatoffersadequatewagestomediumorhigh-skilledworkers,incumbentworkertrainingcreatesacareerladdertoself-sufficiency.Trainingincumbentworkersallowsemployerstoretaintheiremployeeswhilegivingemployeesanopportunitytobecomeself-sufficient.Retrainingandtrainingcurrentemployeesisa“win-win”(forbothemployerandemployee)strategyinmanyindustries,particularlythosewhichrelyonskillsandtechnologyuniquetoagivencompanyorindustrysubset.
tarGeteD JoBs/seCtor strateGies. Aligningtrainingandpostsecondaryeducationprogramswiththeworkforceneedsofthelocallabormarketincreasesthepotentialincomeoflow-wageworkersandhelpscommunitiesstrengthentheirlocaleconomiesbyrespondingtobusinesses’specificlaborneeds.Targetingjobtrainingprogramstowardsoccupationswithbothhighgrowthprojectionsandself-sufficientwagesisonewaytorespondtoworkforceneeds.
CounselinG anD CoorDinateD tarGeteD serViCes. Helpinglow-wageworkersbalancework,family,andfinancialresponsibilitiesrequiresprovisionofawiderangeofservicesthatmeetspecificsubsets’ofclientsparticularneeds,includingcareercounselingtofindtheoccupationsthatbestfitworkers’skillsandneeds;incomeandinkindsupportssuchaschildcare,food,transportation,andhealthcareassistance;aswellasjobspecificcharacteristicssuchasflexibleschedulingandbenefits(e.g.,paidsickandfamilyleave).
inCrease assetsinDiViDual DeVeloPment aCCounts. Anecessaryaspectoflong-termeconomicsecurityistheaccumulationofassets.Forfamilieswithnosavings,theslightestsetback—anunexpectedhospitalbillorareductioninworkhours—cantriggeramajorfinancialcrisis.InadditiontotheEmergencySavingsFundsdiscussedaboveindividualDevelopmentAccount(IDA)programsareonewaytoencourageassetbuildingforlow-wageworkers.IDAsaresavingsaccountstowhichfamiliesmakeregularcontributionswhicharethenmatchedbycontributionsfromapublicorprivateentityandmanagedbycommunity-basedorganizations.Thesavingscanonlybeusedforcertainobjectivesthatenhancelong-termeconomicsecurity,suchasthedownpaymentforahouse,paymentforhighereducation,orstart-upcostsforasmallbusiness.Seethereport,The Road to Economic Security: Exploring Economic Security Pathways Using The Self-Sufficiency Standard for Connecticut, foradiscussionofhowfamilies,oncetheyaremeetingbasicneeds,canmovetowardsincreasedeconomicsecuritythroughsavingforeducation,moresecurehousing,andretirement.
GRADUATE ORPROFESSIONAL
DEGREE
BACHELOR'SDEGREE
SOME COLLEGEOR ASSOCIATES
DEGREE
HIGH-SCHOOLGRADUATE
OR EQUIVALENT
LESS THAN HIGH-SCHOOL GRADUATE $18,577
$26,849
$32,009
$45,952
$62,845
$23,540
$38,637
$47,271
$75,403
$96,051
MALE
FEMALE

28 • The Self-Sufficiency STandard for connecTicuT 2015
Forexample,theSelf-SufficiencyStandardisusedtotarget job training resources.Usinga“targetedjobsstrategy,”theStandardhelpstomatchjobseekerswithemploymentthatpaysSelf-SufficiencyWages.Throughanevaluationofthelocallabormarketandavailablejobtrainingandeducationinfrastructure,jobseekersarematchedtoemploymentwithfamily-sustainingwages.Throughthisanalysisitispossibletodeterminethejobsandsectorstowardswhichtotargettrainingandeducationresources.
Additionally,asacounseling tool theSelf-SufficiencyStandardhelpsparticipantsinworkandtrainingprogramsdevelopstrategiestobecomeself-sufficient.Computer-basedcounselingtoolsallowuserstodeterminewhattheirneededwagesare,andthen,usinginformationonavailableprogramsandworksupports,devisestrategiesthatbestmeettheirowncostsandneeds.Thesetoolsintegrateawidevarietyofdatanotusuallybroughttogether,allowingclientstoaccessinformationaboutthebenefitsofvariousprogramsandworksupportsthatcanmovethemtowardseconomicself-sufficiency.
Finally,theSelf-SufficiencyStandardisusedtoevaluate program outcomesforclientsinarangeofemploymentprograms,fromshort-termjobsearchandplacementprograms,toprogramsprovidingextensiveeducationorjobtraining.ByevaluatingwageoutcomesintermsoftheStandard,programsareusingameasureoftrueeffectiveness.Suchevaluationscanhelpredirectresourcestoapproachesthatresultinimprovedoutcomesforparticipants.
WhiletheSelf-SufficiencyStandardisanalternativemeasureofincomeadequacythatismoreaccurate,up-to-date,andgeographicallyspecificthanfederalmeasures,itismorethananimprovedmeasure.TheStandardisatoolthatcanbeusedacrossawidearrayofsettingstobenchmark,evaluate,educate,andilluminate.Belowwebrieflyoutlinesomeoftheseuses.Formoredetailandexamples,seeAppendix B,whichincludesmanymoreexamplesofthewaysinwhichprogramsandpersonshaveappliedtheSelf-SufficiencyStandardintheirwork.Inaddition,referencesandwebsitesareprovidedforthosewhowishtofurtherexploretheseapplications.
PoliCY analYsis. TheSelf-SufficiencyStandardisusedasatooltoevaluatetheimpactofcurrentandproposedpolicychanges.Asshownintheprevioussection,Closing the Wage Gap: Reducing Costs,theStandardcanbeusedtoevaluatetheimpactofavarietyofworksupports(SNAP/FoodStampProgram,Medicaid)onafamily’sbudget.Likewise,theStandardcanbeusedtoevaluatepolicyoptionssuchaschangesinchildcareco-paymentsortaxschedulesastheyimpactfamilyincomesoflowincomefamiliesinparticular.
eValuations of eConomiC DeVeloPment ProPosals. TheSelf-SufficiencyStandardisusedtohelpdetermineifbusinessesseekingtaxbreaksorothergovernmentsubsidieswill,orwillnot,createjobsthatpay“livingwages.”Ifnot,employeesmayneedpublicworksupportstobeabletomeettheirbasicneeds,essentiallyprovidinga“doublesubsidy”forbusinesses.CommunitiescanusetheStandardtoevaluateeconomicdevelopmentproposalsandtheirnetpositiveornegativeeffectonthelocaleconomy,aswellastheimpactonthewell-beingofpotentialworkersandtheirfamilies.
emPloYment ProGrams. TheSelf-SufficiencyStandardisusedinemploymentprogramstodeterminewhichindividualsareeligibleand/ortotargetthosemostinneedofspecificsupportortrainingservices,aswellastodeterminetrainingandcounselingneeds,andtomeasuretheeffectivenessofemploymentprograms.
how has the Self-Sufficiency Standard been used?
Case hiGhliGht
in Washington State, the Workforce development
council of Seattle-king county adopted the Self-
Sufficiency Standard as its official measure of self-
sufficiency and uses the Standard as a program
evaluation benchmark and counseling tool shifting
their focus from job placement alone to long-term
economic self-sufficiency.
conclusion
AsConnecticutcontinuestorecoverfromtheGreatRecession,long-termeconomicprosperitywillrequireresponsibleactionatthestateandcommunitylevelthatputsallConnecticutfamiliesonthepathtoself-sufficiency.AstrongeconomymeansgoodjobsthatpaySelf-SufficiencyStandardwagesandaworkforcewiththeskillsnecessarytofillthosejobs.The Self-Sufficiency Standard for Connecticut 2015definestheincomeneededtorealisticallysupportafamilywithoutpublicorprivateassistanceinConnecticut.Formostworkers,theSelf-SufficiencyStandardshowsthatearningsabovetheofficialFederalPovertyLevelareneverthelessfarbelowwhatisneededtomeetfamilies’basicneeds.
AlthoughtheSelf-SufficiencyStandarddeterminesanadequatewagelevelwithoutpublicbenefits,itdoesnotimplythatpublicworksupportsareinappropriateorunnecessaryforConnecticutfamilies.ForworkerswithwagesbelowtheSelf-SufficiencyStandard,publicsubsidiesforsuchnecessitiesaschildcare,healthcare,andhousingarecriticaltomeetingbasicneeds,retainingjobsandadvancingintheworkforce.ByutilizingtheSelf-SufficiencyStandard,Connecticuthastheopportunitytolaythefoundationtoachieveastrongworkforceandthrivingcommunities.
TheSelf-SufficiencyStandardiscurrentlybeingusedtobetterunderstandissuesofincomeadequacy,toanalyzepolicy,andtohelpindividualsstrivingtobeself-sufficient.Communityorganizations,academicresearchers,policyinstitutes,legaladvocates,trainingproviders,CommunityActionAgencies,andstateandlocalofficials,amongothers,areusingtheSelf-SufficiencyStandard.
in addition to connecticut, the Standard has been calculated for alabama, arizona, california,
colorado, delaware, florida, Georgia, hawaii, illinois, indiana, iowa, kentucky, louisiana, maryland,
massachusetts, mississippi, missouri, montana, nebraska, nevada, new jersey, new york, north
carolina, oklahoma, ohio, oregon, Pennsylvania, South dakota, Tennessee, Texas, utah, virginia,
Washington State, West virginia, Wisconsin, Wyoming, and the Washington, dc metropolitan area.
For further information about the Standard, how it is calculated or used, or the findings reported here,
as well as information about other states or localities, contact dr. diana Pearce at [email protected] or
(206) 616-2850, or the center for Women’s Welfare staff at (206) 685-5264, or visit
http://selfsufficiencystandard.org.
for more information on The Self-Sufficiency Standard for Connecticut 2015, this publication or
the Standard wage tables for Connecticut regions, or to find out more about the programs at the
Permanent commission on the Status of Women, contact (860) 240-8300 or visit http://ctpcsw.com/.

30 • The Self-Sufficiency STandard for connecTicuT 2015
endnotes
1.JaredBernstein,Crunch:WhyDoIFeelsoSqueezed(andotherUnsolvedEconomicMysteries),(SanFrancisco,CA:Berrett-KoehlerPublishers,Inc.,2008).
2.AccordingtotheU.S.BureauofLaborStatistics,bothparentswereemployedin59%oftwo-parentfamilieswithchildrenin2013.Likewise,68%ofsinglemothersand81%ofsinglefatherswereemployedin2013.Althoughabout75%ofemployedwomenwithchildrenunder18yearsofageworkedfulltimein2013,workingparttimeisclearlythedesirableoptionundermanycircumstancessuchaswhenthechildrenareveryyoungorinneedofspecialcare,orwhenaffordable/appropriatechildcareisnotavailable.Formanylow-incomemothersitisequallyclearthateconomicnecessity,aswellastheTANFrequirementsthatlimitbenefitsandstipulatethatrecipientsparticipateinjobsearches,precludethisoption.U.S.DepartmentofLabor,BureauofLaborStatistics,“EmploymentCharacteristicsofFamiliesin2013,”EconomicNewsReleases,EmploymentandUnemployment,http://www.bls.gov/news.release/pdf/famee.pdf(accessedJune9,2014).
3.Eligibilitycriteriaforareastobeassigned50thpercentileFMRswereestablishedbyarulepublishedonOctober2,2000.TheobjectivewastogivePublicHousingAuthorities(PHAs)atooltoassisttheminde-concentratingvoucherprogramusepatterns.(See24CFR888.113.)U.S.HousingandUrbanDevelopment,“FairMarketRentsfortheSection8HousingAssistancePaymentsProgram,”DataSets,FairMarketRents:Overview(2007),http://www.huduser.org/datasets/fmr/fmrover_071707R2.doc(accessedFebruary20,2013).
4.TheFamilySupportAct,ineffectfrom1988untilwelfarereformin1996,requiredstatestoprovidechildcareassistanceatmarketrateforlow-incomefamiliesinemploymentoreducationandtraining.Stateswerealsorequiredtoconductcostsurveysbiannuallytodeterminethemarketrate(definedasthe75thpercentile)byfacilitytype,age,andgeographicallocationorsetastatewiderate.
5.U.S.DepartmentofHealthandHumanServices,AgencyforHealthcareResearchandQuality,CenterforFinancing,Access,andCostTrends,“TableII.D.3:PercentofTotalPremiumsContributedbyEmployeesEnrolledinFamilyCoverageatPrivate-SectorEstablishmentsthatOfferHealthInsurancebyFirmSizeandState:UnitedStates,2013,”MedicalExpenditurePanelSurvey-InsuranceComponent,http://meps.ahrq.gov/mepsweb/data_stats/summ_tables/insr/state/series_2/2013/tiid3.htm(accessedJuly18,2014).
6.The2015Connecticutminimumwageis$9.15perhour.ConnecticutDepartmentofLabor,“HistoryofMinimumWageRates”http://www.ctdol.state.ct.us/wgwkstnd/wage-hour/history.htm(accessedApril4,2015).
7.In2013theaverageconsumerexpenditureonfoodwas$6,602peryearor12.9%oftotalexpenditures.U.S.DepartmentofLabor,BureauofLaborStatistics,“ConsumerExpendituresin2013,”http://www.bls.gov/news.release/cesan.nr0.htm(accessedOctober1,2014).
8.Healthcarepremiumsarethestatewideaveragepaidbyworkersforsingleadultsandforfamilies,fromthenationalMedicalExpenditurePanelSurvey(MEPS),whichis32.7%of
thepremiumforfamilycoverageand25%ofthepremiumforindividualcoverageinConnecticut.U.S.DepartmentofHealthandHumanServices,AgencyforHealthcareResearchandQuality,CenterforFinancing,Access,andCostTrends,“TablesII.C.3andII.D.3:Percentoftotalpremiumscontributedbyemployeesenrolledinsingle(family)coverageatprivate-sectorestablishmentsthatofferhealthinsurancebyfirmsizeandState:Connecticut,2013,”MedicalExpenditurePanelSurvey-InsuranceComponent,http://meps.ahrq.gov/mepsweb/data_stats/quick_tables_results.jsp?component=2&subcomponent=2&year=2013&tableSeries=2&tableSubSeries=&searchText=&searchMethod=1&Action=Search(accessedFebruary24,2015).
9.Thelowestcostplanforafamilywithtwoadults(age30)earning$82,800annuallywithoneyearoldand4yearoldis$653permonthaftertheestimatedtaxcredithasbeenapplied.AccessHealthConnecticut,“GetHealthCoverage,”https://www.accesshealthct.com/AHCT/LandingPageCTHIX(accessedJanuary21,2015).
10.TheSelf-SufficiencyWageforeachoftheseplaceshasbeenupdatedtocurrentdollarsusingtheConsumerPriceIndexfortheappropriateregions.U.S.DepartmentofLabor,BureauofLaborStatistics,“Northeast/Midwest/South/WestRegionsAllItems,1982-84=100-CUURA101SA0,”ConsumerPriceIndex,http://data.bls.gov/cgi-bin/surveymost?cu(accessedDecember1,2014).
11.ThiscalculationoftheConnecticutSelf-SufficiencyStandardreflectsachangeinmethodologyforchildcarecosts.In2005,infantswereassumedbecaredforinfamilyhomeswhilepreschoolersandschool-agechildrenwereassumedtoreceivecareincenters.TheStandardnowweightschildcarecostsbasedonaveragefamilyandcenterfacilityusage.Thismethodologychangeincreasesinfantcostsbutlowersthecostofcareforpreschoolersandschool-agechildrenascentercareismoreexpensivethanfamilyhomes.SeetheMethodologyAppendixformoreinformation.
12.U.S.DepartmentofLabor,BureauofLaborStatistics,“NortheastRegionAllItems,1982-84=100-CUURA101SA0,”ConsumerPriceIndex,http://data.bls.gov/cgi-bin/surveymost?cu(accessedDecember1,2014).
13.U.S.DepartmentofHousingandUrbanDevelopment,“FY2014IncomeLimitsSummary,NewLondonCounty,”DataSets,IncomeLimits,FY2014IncomeLimitsDocumentationSystem,http://www.huduser.org/portal/datasets/il/il14/index_il2014.html(accessedOctober1,2014).
14.Althoughtheseincomelimitsarebasedon80%,50%,and30%ofthemedianincome,thefinalincomelimitbenchmarksarecalculatedaftervariousadjustmentsareaccountedfor,suchashighorlowhousingcostadjustments.Thereforethefinalincomelimitsarenotnecessarilyanexactpercentoftheoriginalmedianincome.Additionally,if30%ofmedianincomeislessthanthefederalpovertylevel,thenthelowincomelimitissetatthefederalpovertylevel.Mosthousingassistanceislimitedtothe“VeryLowIncome”category,andinsomeinstancestothe“ExtremelyLowIncome”category.U.S.DepartmentofHousingandUrbanDevelopment,“FY2014IncomeLimitsSummary,NewLondonCounty,”DataSets,IncomeLimits,FY2014IncomeLimits

The Self-Sufficiency STandard for connecTicuT 2015 • 31
DocumentationSystem,http://www.huduser.org/portal/datasets/il/il14/index_il2014.html(accessedOctober1,2014).
15.MedianwagesofConnecticut’stopoccupationscomefromtheBureauofLaborStatisticsOccupationalEmploymentStatisticssurveyandareupdatedforinflationusingtheConsumerPriceIndex.U.S.DepartmentofLabor,BureauofLaborStatistics,“May2013OccupationalEmploymentandWageEstimates:Connecticut,”OccupationalEmploymentStatistics,http://www.bls.gov/oes/(accessedFebruary18,2015).U.S.DepartmentofLabor,BureauofLaborStatistics,“NortheastregionAllItems,1982-84=100-CUURA101SA0,”ConsumerPriceIndex,http://data.bls.gov/cgi-bin/surveymost?cu(accessedFebruary18,2015).
16.NationalEmploymentLawProject,“TheLow-WageRecovery:IndustryEmploymentandWagesFourYearsintotheRecovery,”DataBrief,April2014,p.1,http://www.nelp.org/page/-/Reports/Low-Wage-Recovery-Industry-Employment-Wages-2014-Report.pdf?nocdn=1(accessedJune11,2014).
17.U.S.DepartmentofHealthandHumanServices,AdministrationforChildren&Families,OfficeofChildSupportEnforcement,“FY2013PreliminaryReport,”Tables4,14,15and75,http://www.acf.hhs.gov/programs/css/resource/fy2013-preliminary-report(accessedAugust28,2014).DatahasbeeninflatedusingtheBureauofLaborStatisticsConsumerPriceIndex.U.S.DepartmentofLabor,BureauofLaborStatistics,“NortheastRegionAllItems,1982-84=100-CUURA101SA0,”ConsumerPriceIndex,http://data.bls.gov/cgi-bin/surveymost?cu(accessedDecember1,2014).
18.ConnecticutOfficeofEarlyChildhood,ConnecticutCare4Kids,“IncomeGuidelines,”http://www.ctcare4kids.com/care-4-kids-program/income-guidelines/(accessedFebruary17,2015).
19.U.S.DepartmentofAgriculture,FoodandNutritionService,SupplementalNutritionAssistanceProgram,“Eligibility,”http://www.fns.usda.gov/snap/applicant_recipients/eligibility.htm(accessedJune8,2014).U.S.DepartmentofAgriculture,FoodandNutritionService,“WICIncomeEligibilityGuidelines2014-2015,”http://www.fns.usda.gov/wic/wic-income-eligibility-guidelines(accessedMay30,2014).
20.U.S.DepartmentofHousingandUrbanDevelopment,“HousingChoiceVouchersFactSheet,”TopicAreas,HousingChoiceVoucherProgramSection8,http://portal.hud.gov/portal/page/portal/HUD/topics/housing_choice_voucher_program_section_8(accessedJune10,2014).
21.The2015Connecticutminimumwageis$9.15perhour.ConnecticutDepartmentofLabor,“HistoryofMinimumWageRates”http://www.ctdol.state.ct.us/wgwkstnd/wage-hour/history.htm(accessedFebruary24,2015).
22.NationalConferenceofStateLegislatures,“StateMinimumWages:2014MinimumWagebyState,”http://www.ncsl.org/research/labor-and-employment/state-minimum-wage-chart.aspx(accessedJune12,2014).
23.Ibid.
24.Ibid.
25.Seattle’sminimumwagewillreachatleast$15forallworkersby2021($16.49forthosewhoreach$15earlier),andin2025theminimumwagewillbe$18.13acrosstheboardandwillbeindexedthereafter.CityofSeattle,OfficeoftheMayor,“$15MinimumWage,”http://murray.seattle.gov/minimumwage/#charts(accessedMarch11,2015).CityandCountyofSanFrancisco,OfficeofLaborStandardsEnforcement,“MinimumWageOrdinance(MWO),”http://sfgsa.org/index.aspx?page=411(accessedMarch11,2015).
26.InMarch2011,unionworkers’wagesaveraged$23.02perhour,nonunion$19.51.Long,G.I.,“Differencesbetweenunionandnonunioncompensation,2001–2011,”MonthlyLaborReview,April2013,pp.16-23,http://www.bls.gov/opub/mlr/2013/04/art2full.pdf(accessedJune11,2014).
27.Mishel,L.(2012).Unions,Inequality,andFalteringMiddle-ClassWages.IssueBrief,342.http://www.epi.org/publication/ib342-unions-inequality-faltering-middle-class/(accessedJune11,2014).
28.BureauofLaborStatistics,EconomicNewsRelease,“UnionMembers–2013,”January24,2014,http://www.bls.gov/news.release/union2.nr0.htm(accessedJune11,2014).
29.FormoreinformationonpayequityseetheNationalCommitteeonPayEquityathttp://www.pay-equity.org.
30.HarryHolzer&RobertLerman,“America’sForgottenMiddleSkillJobs:EducationandTrainingRequirementsintheNextDecadeandBeyond,”TheWorkforceAlliance(2007),Washington,D.C.,http://www.urban.org/UploadedPDF/411633_forgottenjobs.pdf(accessedApril22,2009).
31.U.S.CensusBureau,“B20004.MedianEarningsbySexbyEducationalAttainmentforthePopulation25YearsandOver,”2013AmericanCommunitySurvey1-YrEstimates,DetailedTables,http://factfinder2.census.gov/(accessedFebruary26,2015).
32.TheU.S.DepartmentofLaborFY2010budgetincluded$500million(appropriatedthroughtheAmericanRecoveryandReinvestmentAct)forcompetitivegrantstotrainworkersforgreenjobsand$50millionforgreenjobsemploymentandtraininginitiatives.U.S.DepartmentofLabor,“SecretaryHildaL.SolisUnveilsU.S.DepartmentofLabor’sBudgetforFiscalYear2010,”NewsReleaseNumber09-0489-NAT,http://www.dol.gov/opa/media/press/oasam/OASAM20090489.htm(accessedMarch23,2010).


The Self-Sufficiency STandard for connecTicuT 2015 • 33
appendix a: methodology, assumptions, and Sources
Thisappendixexplainsthemethodology,assumptions,andsourcesusedtocalculatetheStandard.Webeginwithadiscussionofourgeneralapproach,followedbythespecificsofhoweachcostiscalculated,endingwithalistofdatasources.MakingtheStandardasconsistentandaccurateaspossible,yetvariedbygeographyandtheageofchildren,requiresmeetingseveraldifferentcriteria.Totheextentpossible,thedatausedintheSelf-SufficiencyStandardare:
•Collectedorcalculatedusingstandardizedorequivalentmethodologynationwide
•ObtainedfromscholarlyorcrediblesourcessuchastheU.S.CensusBureau
•Updatedregularly•Geographicallyandage-specific,asappropriate
Coststhatvarysubstantiallybyplace,suchashousingandchildcare,arecalculatedatthemostgeographicallyspecificlevelforwhichdataareavailable.Othercosts,suchashealthcare,food,andtransportation,arevariedgeographicallytotheextentthereisvariationandappropriatedataavailable.Inaddition,asimprovedorstandardizeddatasourcesbecomeavailable,themethodologyusedbytheStandardisrefinedaccordingly,resultinginanimprovedStandardthatiscomparableacrossplaceaswellastime.
TheSelf-SufficiencyStandardassumesadulthouseholdmembersworkfulltimeandthereforeincludesallmajorcostsassociatedwithemploymentforeveryadulthouseholdmember(i.e.,taxes,transportation,andchildcareforfamilieswithyoungchildren).TheSelf-SufficiencyStandarddoesnotcalculatecostsforadultswithdisabilitiesorelderlyhouseholdmemberswhonolongerwork.ItshouldbenotedthatforfamilieswithpersonswithdisabilitiesorelderlyfamilymemberstherearecoststhattheStandarddoesnotaccountfor,suchasincreasedtransportationandhealthcarecosts.
TheStandardassumesadultsworkeighthoursperdayfor22dayspermonthand12monthsperyear.EachcostcomponentintheStandardisfirstcalculatedasamonthlycost.HourlyandannualSelf-SufficiencyWagesarecalculatedbasedonthemonthlyStandardbydividingthemonthlySelf-SufficiencyStandardby176hourspermonth
toobtainthehourlywageandmultiplyingby12monthsperyeartoobtaintheannualwage.
ThecomponentsofTheSelf-SufficiencyStandardforConnecticut2015andtheassumptionsincludedinthecalculationsaredescribedbelow.
extenDeD familY tYPesThecostofeachbasicneedandtheSelf-SufficiencyWagesforeightselectedfamilytypesforeachof23regionsinConnecticutareincludedinAppendixDofthisreport.Connecticut’sfiveWorkforceDevelopmentAreas(WDAs)havebeendividedinto23regions;seeAppendixDforalistoftheWDAs,the23regions,andthecountiesandtownswithineachWDAregion.Overall,the2015editionoftheConnecticutSelf-SufficiencyStandardiscalculatedfor152familytypes.Thefirst70familytypesincludeallone-andtwo-adultfamilieswithzerotothreechildrenandrangefromasingleadultwithnochildren,tooneadultwithoneinfant,oneadultwithonepreschooler,andsoforth,uptotwo-adultfamilieswiththreeteenagers.Theadditionaltypesincludelargerfamilies,includingmultigenerationalfamiliesandfamilieswiththreeormoreadultsandfourormorechildren.aNotethatthefouragesofchildrenintheStandardare:(1)infants—0to2yearsold(meaning0through35months),(2)preschoolers—3to5yearsold,(3)school-agechildren—6to12yearsold,and(4)teenagers—13to18yearsold.
InordertoremainconsistentwiththeStandard’smethodology,itisassumedthatalladultsinone-andtwo-adulthouseholdsareworkingfulltime.TheSelf-SufficiencyStandardthereforeincludesallmajorcostsassociatedwithemploymentforadulthouseholdmembers(i.e.,taxes,transportation,andchildcareforfamilieswithyoungchildren)uptotwoadultsperhousehold.
Forhouseholdswithmorethantwoadults,itisassumedthatalladultsbeyondtwoarenon-workingdependentsofthefirsttwoworkingadults,ashouseholdcompositionanalysishasshownthatasubstantialproportionofadditionaladultsareunder25,oftencompletingschool,unemployed,orunderemployed.bThemaineffectofthisassumptionisthatthecostsfortheseadultsdonotinclude

34 • The Self-Sufficiency STandard for connecTicuT 2015
transportation(butdoincludeallothercostssuchasfood,housing,healthcare,andmiscellaneous).
AsintheoriginalStandardcalculations,itisassumedthatadultsandchildrendonotsharethesamebedroomandthattherearenomorethantwochildrenortwoadultsperbedroom.
Foodcostsforadditionaladults(greaterthantwo)arecalculatedusingtheassumptionthatthethirdadultisafemaleandthefourthadultisamale,withtheapplicablefoodcostsaddedforeach.
Thefirsttwoadultsareassumedtobeamarriedcoupleandtaxesarecalculatedforthewholehouseholdtogether(i.e.,asafamily),withadditionaladultscountedasadditional(adult)taxexemptions.
TheStandardassumesthatallnon-teenagechildrenareinpaidchildcare,eveninlargerfamilies.Thisisconsistentwiththeprinciplethatself-sufficiencymeanshavingenoughtopaythefullcostofeachbasicneedwithoutpublicorprivatesubsidies.Somefamiliesinfactmaychoosetohaveolderchildrenorothernon-employedadultsinthefamilycareforyoungerchildren;however,thatisaformofprivatesubsidyandthuswouldmaketheseStandardsinconsistentinmethodologyfromthosecalculatedforsmallerfamilies.
housinGTheStandardusesthemostrecentFiscalYear(FY)FairMarketRents(FMRs),calculatedannuallybytheU.S.DepartmentofHousingandUrbanDevelopment(HUD),tocalculatehousingcostsforeachstate’smetropolitanandnon-metropolitanareas,andareusedtodeterminethelevelofrentforthosereceivinghousingassistancethroughtheHousingChoiceVoucherProgram.Section8(c)(1)oftheUnitedStatesHousingActof1937(USHA)requirestheSecretarytopublishFairMarketRents(FMRs)periodically,butnotlessthanannually,tobeeffectiveonOctober1ofeachyear.OnOctober3,2014,HUDpublishedfinalFMRsforfiscalyear2015.Housingcostsinthe2015ConnecticutSelf-SufficiencyStandardarecalculatedusingtheFY2015HUDFairMarketRents.
TheFMRsarebasedondatafromthe1-yearand5-yearAmericanCommunitySurvey,andareupdatedforinflationusingtheConsumerPriceIndex.Thesurvey
sampleincludesrenterswhohaverentedtheirunitwithinthelasttwoyears,excludingnewhousing(twoyearsoldorless),substandardhousing,andpublichousing.FMRs,whichincludeutilities(excepttelephoneandcable),areintendedtoreflectthecostofhousingthatmeetsminimumstandardsofdecency.Inmostcases,FMRsaresetatthe40thpercentile;meaning40%ofthehousinginagivenareaislessexpensivethantheFMR.cAllofConnecticut’sFMRsaresetatthe40thpercentileexceptfortheHartford-WestHartford-EastHartfordmetroareaandtheNewHaven-Meridenmetroarea,whicharesetatthe50thpercentile.
TheFMRsarecalculatedforMetropolitanStatisticalAreas(MSAs),HUDMetroFMRAreas(HMFAs),andnon-metropolitancounties.ThetermMSAisusedforallmetropolitanareas.HUDcalculatesonesetofFMRsforanentiremetropolitanarea.BecauseHUDonlycalculatesonesetofFMRsforeachmetropolitanarea,andtherearejusteightmetropolitanareas/countiesinConnecticut(plussixnonmetropolitanareas),weusedmediangrossrentsbytownfromtheU.S.CensusBureau’s2008-2012AmericanCommunitySurvey(ACS)5-YearEstimatestocalculateadjustedFMRsweightedbythepopulationinthe2010Censusforeachofthe23regionsinConnecticut.d
Todeterminethenumberofbedroomsrequiredforafamily,theStandardassumesthatparentsandchildrendonotsharethesamebedroomandnomorethantwochildrenshareabedroom.Therefore,theStandardassumesthatsinglepersonsandcoupleswithoutchildrenhaveone-bedroomunits,familieswithoneortwochildrenrequiretwobedrooms,andfamilieswiththreechildrenrequirethreebedrooms.Becausetherearefewefficiencies(studioapartments)insomeareas,andtheirqualityisveryuneven,theSelf-SufficiencyStandardusesone-bedroomunitsforthesingleadultandchildlesscouple.
Data sourCes
Housing Cost: U.S.DepartmentofHousingandUrbanDevelopment,“ScheduleB:FY2015FinalFairMarketRentsforExistingHousing,”DataSets,FairMarketRents,http://www.huduser.org/portal/datasets/fmr.html(accessedDecember8,2014).
Town-Level Housing Costs: U.S.CensusBureau,AmericanFactfinder,“B25064MedianGrossRent,”2009-2013AmericanCommunitySurvey5-YearEstimates,Detailed
The Self-Sufficiency STandard for connecTicuT 2015 • 35
Tables,http://factfinder.census.gov/(accessedJanuary26,2015).
Town Population: U.S.CensusBureau,2010CensusRedistrictingFile,http://www2.census.gov/census_2010/01-Redistricting_File--PL_94-171/Connecticut/ct2010.pl.zip,(accessedFebruary5,2015).
ChilD CareTheFamilySupportAct,ineffectfrom1988untilwelfarereformin1996,requiredstatestoprovidechildcareassistanceatmarketrateforlow-incomefamiliesinemploymentoreducationandtraining.Stateswerealsorequiredtoconductcostsurveysbiannuallytodeterminethemarketrate(definedasthe75thpercentile)byfacilitytype,age,andgeographicallocationorsetastatewiderate.e
Manystates,includingConnecticut,havecontinuedtoconductorcommissionthesurveysonaregularbasis.DataforConnecticutchildcarecostsarefromthe2012childcareratedatafromtheConnecticutOfficeofEarlyChildhood(OEC).
Childcareratesatthe75thpercentileareprovidedintheOEC2012dataforbothcenterandfamilychildcareforfiveregions.Mostofthe23regionsdefinedforthisreportfallentirelywithinoneofthefivechildcareregions,butGreaterNewLondonandNaugatuckValleyrequiredweightingdatafromtwochildcareregionsbytownpopulation.
RateswereupdatedforinflationusingtheNortheastRegionConsumerPriceIndex.Forthe2015ConnecticutStandard,infantandpreschoolercostswerecalculatedassumingfull-timecareandcostsforschool-agechildrenwerecalculatedusingpart-timerates.Costswerecalculatedbasedonaweightedaverageoffamilychildcareandcenterchildcare.SinceoneofthebasicassumptionsoftheStandardisthatitprovidesthecostofmeetingneedswithoutpublicorprivatesubsidies,the“privatesubsidy”offreeorlow-costchildcareprovidedbyrelativesandothersisnotassumed.NotethatpreviousStandardsdidnotassumeaweightedaverageoffamilyandcenterchildcare.Previously,infantswereassumedtobecaredforinfamilychildcarewhilepreschoolandschool-agechildrenwereassumedtobecaredforinchildcarecenters.
Forinfants,familychildcareaccountsfor43%ofthecareandcenterchildcareaccountsfor57%.Forpreschoolers,
familychildcareaccountsfor26%ofthecareandcenterchildcareaccountsfor74%.Forschool-agechildren,familychildcareaccountsfor46%ofthecareandcenterchildcareaccountsfor54%.f
Data sourCes
Child Care Rates: ConnecticutOfficeofEarlyChildhood,“ConnecticutChildCareMarketRateSurveyData-DSS09/2013(UnitedWayData12/2012),”personalcommunicationwithCharmaineThomas,PublicAssistanceConsultant,onDecember11,2014.
Inflation: U.S.DepartmentofLabor,BureauofLaborStatistics,“ConsumerPriceIndex–AllUrbanConsumers,NortheastRegionAverage,”ConsumerPriceIndex,CPIDatabases,http://data.bls.gov/cgi-bin/surveymost?cu(accessedFebruary6,2015).
Town Population: U.S.CensusBureau,2010CensusRedistrictingFile,http://www2.census.gov/census_2010/01-Redistricting_File--PL_94-171/Connecticut/ct2010.pl.zip,(accessedFebruary5,2015).
fooDAlthoughtheSupplementalNutritionAssistanceProgram(SNAP,formerlytheFoodStampProgram)usestheU.S.DepartmentofAgriculture(USDA)ThriftyFoodPlantocalculatebenefits,theStandardusestheLow-CostFoodPlanforfoodcosts.WhilebothoftheseUSDAdietsweredesignedtomeetminimumnutritionalstandards,SNAP(whichisbasedontheThriftyFoodPlan)isintendedtobeonlyatemporarysafetynet.g
TheLow-CostFoodPlancosts25%morethantheThriftyFoodPlan,andisbasedonmorerealisticassumptionsaboutfoodpreparationtimeandconsumptionpatterns,whilestillbeingaveryconservativeestimateoffoodcosts.Forinstance,theLow-CostFoodPlanalsodoesnotallowforanytake-out,fast-food,orrestaurantmeals,eventhough,accordingtotheConsumerExpenditureSurvey,theaverageAmericanfamilyspendsabout40%oftheirfoodbudgetonfoodpreparedawayfromhome.h
TheUSDALow-CostFoodPlanvariesbymonthanddoesnotgiveanannualaveragefoodcost,sotheStandardfollowstheSNAPprotocolofusingJunedataofthecurrent

36 • The Self-Sufficiency STandard for connecTicuT 2015
yeartorepresenttheannualaverage.The2015ConnecticutStandardusesdataforJune2014.
BoththeLow-CostFoodPlanandtheStandard’sbudgetcalculationsvaryfoodcostsbythenumberandagesofchildrenandthenumberandgenderofadults.TheStandardassumesthatasingle-personhouseholdisoneadultmale,whilethesingle-parenthouseholdisoneadultfemale.Atwo-parenthouseholdisassumedtoincludeoneadultmaleandoneadultfemale.
GeographicdifferencesinfoodcostswithinConnecticutarevariedusingMaptheMealGapdataprovidedbyFeedingAmerica.Toestablisharelativepriceindexthatallowsforcomparabilitybetweencounties,NielsenassignseverysaleofUPC-codedfooditemsinacountytooneofthe26foodcategoriesintheUSDAThriftyFoodPlan(TFP).Thecosttopurchaseamarketbasketofthese26categoriesisthencalculatedforeachcounty.Becausenotallstoresaresampled,inlow-populationcountiesthiscouldresultinaninaccuraterepresentationofthecostoffood.Forthisreason,countieswithapopulationlessthan20,000havetheircostsimputedbyaveragingthemwiththoseofthesurroundingcounties.iFoodcostsforregionscrossingcountyboundarieswerecalculatedbyweightingcountycostsbytownpopulation.RatiosoftheregionalmarketbasketpricetothestateaveragearethencalculatedtocomparethecostoffoodacrossConnecticut.
Data sourCes
Food Costs: U.S.DepartmentofAgriculture,CenterforNutritionPolicyandPromotion,“OfficialUSDAFoodPlans:CostofFoodatHomeatFourLevels,U.S.Average,June2014,”http://www.cnpp.usda.gov/sites/default/files/usda_food_plans_cost_of_food/CostofFoodJun2014.pdf(accessedAugust26,2014).
County-Level Food Costs: CraigGunderson,EmilyEngelhard,AmySatoh,andElaineWaxman,FeedingAmerica,“MaptheMealGap2014:FoodInsecurityandChildFoodInsecurityEstimatesattheCountyLevel,”[email protected](May13,2014).
Town Population: U.S.CensusBureau,2010CensusRedistrictingFile,http://www2.census.gov/census_2010/01-Redistricting_File--PL_94-171/Connecticut/ct2010.pl.zip,(accessedFebruary5,2015).
transPortationPuBliC transPortation. Ifthereisan“adequate”publictransportationsysteminagivenarea,itisassumedthatworkersusepublictransportationtogettoandfromwork.Apublictransportationsystemisconsidered“adequate”ifitisusedbyasubstantialpercentageoftheworkingpopulationtocommutetowork.AccordingtoastudybytheInstituteofUrbanandRegionalDevelopment,UniversityofCalifornia,ifabout7%ofthegeneralpublicusespublictransportation,thenapproximately30%ofthelow-andmoderate-incomepopulationusepublictransit.jTheStandardassumesprivatetransportation(acar)incountieswherelessthan7%ofworkerscommutebypublictransportation.ForConnecticut,theStandarduses2010-2012AmericanCommunitySurvey3-YrEstimatestocalculatethepercentofeachregion’spopulationthatcommutesbypublictransportation.SomeregionsalongtheMetro-NorthCommuterRailroadexceedthe7%mark,butonlyduetointerstatecommuting.Closerexaminationofwithin-countycommutingrevealedthatlessthan7%ofpeoplewhoworklocallycommutebypublictransitinStamfordandLowerFairfield.Thisisachangeinmethodologyfromthe2005ConnecticutStandard,sothesetworegionswillhavesubstantiallyhighertransportationcoststhanbefore.ThethreeregionsthatcontinuetomeetthebarforusingpublictransitcostsareBridgeport,Hartford,andNewHaven.AllotherConnecticutregionshavefewerthan7%ofworkersusingpublictransportationtocommute.kTherefore,theStandardusesprivatetransportationtocalculatetransportationcostsforallotherConnecticutregions.
PriVate transPortation. Forprivatetransportation,theStandardassumesthatadultsneedacartogettowork.Privatetransportationcostsarebasedontheaveragecostsofowningandoperatingacar.Onecarisassumedforhouseholdswithoneadultandtwocarsareassumedforhouseholdswithtwoadults.Itisunderstoodthatthecar(s)willbeusedforcommutingfivedaysperweek,plusonetripperweekforshoppinganderrands.Inaddition,oneparentineachhouseholdwithyoungchildrenisassumedtohaveaslightlylongerweekdaytriptoallowfor“linking”tripstoadaycaresite.Per-miledrivingcosts(e.g.,gas,oil,tires,andmaintenance)arefromtheAmericanAutomobileAssociation.Thecommutingdistanceiscomputedfromthe2009NationalHouseholdTravelSurvey(NHTS).The

The Self-Sufficiency STandard for connecTicuT 2015 • 37
Connecticutstatewideaverageroundtripcommutetoworkdistanceis28.3miles.TheNewYork/NorthernNewJersey/LongIslandNY-NJ-PA-CTMSAhasaseparateaverageround-tripcommutedistanceof26.5miles.
TheautoinsurancepremiumistheaveragepremiumcostforagivenstatefromtheNationalAssociationofInsuranceCommissioners(NAIC)2012StateAverageExpendituresforAutoInsurance.Regionalvariationinthecostofautoinsuranceforthe2015ConnecticutStandardiscalculatedusingratesfiledwiththeConnecticutInsuranceDepartmentthroughtheSystemforElectronicRateandFormFiling(SERFF)fortwoofthetopmarketsharecompanies(AllstateandProgressiveCasualty).MarketshareinformationisobtainedfromtheConnecticutDepartmentofInsuranceAnnual Ranking of 2012 Calendar Year Automobile Insurance Complaints.WeusetheratesfromthetopmarketsharecompaniestocalculateratiosthatcomparethecostofinsuranceacrossregionsandvarythestatewidepremiumfromtheNationalAssociationofInsuranceCommissionersbyregionratio.
Thefixedcostsofcarownershipsuchasfire,theft,propertydamageandliabilityinsurance,license,registration,taxes,repairs,monthlypayments,andfinancechargesarealsoincludedinthecostofprivatetransportationfortheStandard.However,theinitialcostofpurchasingacarisnot.Fixedcostsarefromthe2009ConsumerExpenditureSurveydataforfamilieswithincomesbetweenthe20thand40thpercentilelivingintheCensusNortheastregionoftheU.S.Autoinsurancepremiumsandfixedautocostsareadjustedforinflationusingthemostrecentandarea-specificConsumerPriceIndex.
Data sourCes
Public Transportation Use: U.S.CensusBureau,“TableB08101:MeansofTransportationtoWork,”2010-2012AmericanCommunitySurvey3-YearEstimates,DetailedTables,http://www.factfinder.census.gov(accessedDecember10,2014)and“TableB08130:MeansofTransportationtoWorkbyPlaceofWork--StateandCountyLevel,”AmericanCommunitySurvey3-YearEstimates,DetailedTables,http://www.factfinder.census.gov(accessedFebruary2,2015).
Auto Insurance Premium: NationalAssociationofInsuranceCommissioners,“AverageExpendituresforAuto
InsurancebyState,2008-2012,”InsuranceInformationInstitute,http://www.iii.org/fact-statistic/auto-insurance(accessedFebruary7,2015).
Auto Insurance Market Share: ConnecticutInsuranceDepartment,“AutomobileInsuranceCompanyAnnualRankingReports2012”,availableathttps://www.ct.gov/cid/lib/cid/2012_Annual_Ranking_Report_-_Automobile_Insurance.pdf(accessedDecember14,2014).
Regional Insurance Premium: NationalAssociationofInsuranceCommissionersSystemforElectronicRateandFormFiling,ConnecticutInsuranceDepartmentPortal,https://filingaccess.serff.com/sfa/home/CT/(accessedJanuary23,2015).BusinessType:PropertyandCasualty;TypeofInsurance:19.0PersonalAuto;CompanyName:Allstate,ProgressiveCasualty.Allstate:SERFFTrackingNumber:ALSE-127331850,“PrivatePassengerAutoInsuranceManual.”ProgressiveCasualty:SERFFTrackingNumber:PRGS-129744066,“ProgressiveCasualtyInsuranceCompany,PrivatePassengerAutomobileProgram,RatesfortheStateofConnecticut.”DistancetoWork:U.S.DepartmentofTransportation,2009NationalHouseholdTransportationSurvey,“AveragePersonTripLength(TripPurpose:to/fromWork),”OnlineAnalysisTools,http://www.nhts.ornl.gov(accessedJanuary21,2010).
Fixed Auto Costs: CalculatedandadjustedforregionalinflationusingBureauofLaborStatisticsdataqueryfortheConsumerExpenditureSurvey.U.S.DepartmentofLabor,BureauofLaborStatistics,“OtherVehicleExpenses,”ConsumerExpenditureSurvey2013,CEDatabases,http://data.bls.gov/pdq/querytool.jsp?survey=cx/(accessedFebruary7,2015).
Inflation: U.S.DepartmentofLabor,BureauofLaborStatistics,“ConsumerPriceIndex–AllUrbanConsumers,U.S.CityAverage,”ConsumerPriceIndex,CPIDatabases,http://data.bls.gov/cgi-bin/surveymost?cu(accessedFebruary7,2015).
Per-Mile Costs: AmericanAutomobileAssociation,“YourDrivingCosts,”BehindtheNumbers2014Edition,AAAAssociationCommunication,http://publicaffairsresources.aaa.biz/wp-content/uploads/2014/05/Your-Driving-Costs-2014.pdf(accessedMay19,2014).

38 • The Self-Sufficiency STandard for connecTicuT 2015
treatment of tax CreDits in taBle 7 anD fiGure 10The Standard shows refundable and nonrefundable tax credits as if they are received monthly. however, in Table 7
(columns #2–#6) and figure 10, the refundable federal earned income Tax credit (eiTc) and the “additional” refundable
portion of the child Tax credit (cTc) are shown as received annually. however, the child care Tax credit (ccTc) is
nonrefundable, meaning it can only be used to reduce taxes and does not contribute to a tax refund. Therefore, it is
shown as a monthly credit against federal taxes in both the Self-Sufficiency Standard and in the modeling section.
The tax credits are calculated this way in Table 7 and figure 10 in order to be as realistic as possible. until 2010, a
family could receive part of their eiTc on a monthly basis (called advance eiTc), but many workers preferred to receive
it annually as a lump sum. in fact, nearly all families received the eiTc as a single payment the following year when
they filed their tax returns.a many families preferred to use the eiTc as “forced savings” to pay for larger items that
are important family needs, such as paying the security deposit for housing, buying a car, or settling debts.b Therefore,
in the modeling section, the total amounts of the refundable federal and state eiTc the family would receive annually
(when they file their taxes) are shown in the shaded rows at the bottom of the table instead of being shown monthly
as in the Self-Sufficiency Standard column. This is based on the assumption that the adult works at this same wage, full
time, for the whole year.
Like the EITC, the federal CTC is shown as received monthly in the Self-Sufficiency Standard. However, for the modeled
work support columns, the cTc is split into two amounts with only the portion that can be used to offset any remaining
(after the ccTc) taxes owed shown monthly, while the “additional” refundable portion of the cTc is shown as a lump
sum received annually in the shaded rows at the bottom of Table 7.
a. Some workers may have been unaware of the advance payment option, and others may have had employers who did not participate. also, research has shown that families make financial decisions based on receipt of the EITC (together with tax refunds) when they file their taxes early in the following year. jennifer romich and Thomas Weisner, “how families view and use the eiTc: The case for lump-Sum delivery,” National Tax Journal, 53(4) (part 2) (2000): 1107-1134; hereafter cited as how families view and use the eiTc. b. how families view and use the eiTc.
health CareTheStandardassumesthatanintegralpartofaSelf-SufficiencyWageisemployer-sponsoredhealthinsuranceforworkersandtheirfamilies.InConnecticut,72%ofnon-elderlyindividualsinhouseholdswithatleastonefull-timeworkerhaveemployer-sponsoredhealthinsurance(thisisthesameasthenationalrate).lThefull-timeworker’semployerpaysanaverageof75%oftheinsurancepremiumfortheemployeeand67%forthefamilyinConnecticut.Nationally,theemployerpays79%oftheinsurancepremiumfortheemployeeand73%oftheinsurancepremiumforthefamily.m
HealthcarepremiumsareobtainedfromtheMedicalExpenditurePanelSurvey(MEPS),InsuranceComponentproducedbytheAgencyforHealthcareResearchandQuality,CenterforFinancing,Access,andCostTrends.TheMEPShealthcarepremiumsaretheaverageemployment-basedhealthpremiumpaidbyastate’sresidentsforasingle
adultandforafamily.InConnecticuttheaveragepremiumpaidbytheemployeeis$125.17forasingleadultand$460.17forafamily.ThepremiumcostsarethenadjustedforinflationusingtheMedicalCareServicesConsumerPriceIndex.
TovarythestatepremiumcostsforConnecticut,theStandardusessamplepremiumsfromthefourtopmarketsharecompaniesforhealthinsuranceinConnecticut.MarketshareinformationisobtainedfromtheConnecticutInsuranceDepartmentpublication,“ConsumerReportCardonHealthInsuranceCarriersInConnecticut.”Thestate-levelMEPSaveragepremiumisadjustedbyregionusingratioscalculatedfromregion-specificpremiumratesforthetopmarketsharecompanies.n
Healthcarecostsalsoincluderegionalout-of-pocketcostscalculatedforadults,infants,preschoolers,school-agechildren,andteenagers.Dataforout-of-pockethealthcarecosts(byage)arealsoobtainedfromtheMEPS,adjusted

The Self-Sufficiency STandard for connecTicuT 2015 • 39
byCensusregionusingtheMEPSHouseholdComponentAnalyticalTool,andadjustedforinflationusingtheMedicalCareConsumerPriceIndex.
AlthoughtheStandardassumesemployer-sponsoredhealthcoverage,notallworkershaveaccesstoaffordablehealthinsurancecoveragethroughemployers.
However,asaresultofthePatientProtectionandAffordableCareActof2010,employerswillnowberequiredtoprovidehealthinsuranceorpayafine(amandatethatisnowsettobeineffectin2015).Thosewhodonothaveaccesstoaffordablehealthinsurancethroughtheiremployersmusteitherpurchasetheirowncoverageordowithouthealthinsurance.oThosewhodonothaveaccesstoaffordablehealthinsurancethroughtheiremployers,andwhoarenoteligiblefortheexpandedMedicaidprogram,mustpurchasetheirowncoverageindividuallyorthroughConnecticut’sindividualmarketplace(AccessHealthCT),orpayafine.Individualswhocannotaffordhealthinsurancemaybeeligibleforapremiumtaxcreditorcost-sharingreductions.p
Data sourCes
Inflation: U.S.DepartmentofLabor,BureauofLaborStatistics,“ConsumerPriceIndex–AllUrbanConsumers,U.S.CityAverage,”MedicalCareServices(forpremiums)andMedicalServices(forout-of-pocketcosts),http://www.bls.gov/cpi/(accessedFebruary7,2015).
Out-of-Pocket Costs:U.S.DepartmentofHealthandHumanServices,AgencyforHealthcareResearchandQuality,CenterforFinancing,Access,andCostTrends,MedicalExpenditurePanelSurvey-HouseholdComponentAnalyticalTool,“TotalAmountPaidbySelf/Family,allTypesofService,2012”MEPSnetHC,http://www.meps.ahrq.gov/mepsweb/data_stats/MEPSnetHC.jsp(accessedFebruary7,2015).
State Premiums: U.S.DepartmentofHealthandHumanServices,AgencyforHealthcareResearchandQuality,CenterforFinancing,Access,andCostTrends,“TablesII.C.2andII.D.2:AverageTotalEmployeeContribution(inDollars)perEnrolledEmployeeforSingle/FamilyCoverageatPrivate-SectorEstablishmentsthatOfferHealthInsurancebyFirmSizeandState,UnitedStates,2013,”MedicalExpenditurePanelSurvey-InsuranceComponent,
http://meps.ahrq.gov/mepsweb/data_stats/quick_tables.jsp(accessedDecember14,2014).
Health Insurance Market Share: ConnecticutInsuranceDepartment,“ConsumerReportCardonHealthInsuranceCarriersInConnecticut,”http://www.ct.gov/cid/lib/cid/2014_Consumer_Report_Card_on_CT_Health_Insurance_Carriers.pdf(accessedDecember14,2014).
Regional Premium Costs: AccessHealthCT,“GetHealthCoverage,”https://www.accesshealthct.com/AHCT/LandingPageCTHIX/(accessedJanuary21,2015)andAetna,“GetIndividualQuotesorApplyOnline,”https://www51.aetna.com/iqs/cp/basicInfo.do(accessedJanuary21,2015).
misCellaneousThisexpensecategoryconsistsofallotheressentialsincludingclothing,shoes,paperproducts,diapers,nonprescriptionmedicines,cleaningproducts,householditems,personalhygieneitems,andtelephoneservice.
Miscellaneousexpensesarecalculatedbytaking10%ofallothercosts.Thispercentageisaconservativeestimateincomparisontoestimatesinotherbasicneedsbudgets,whichcommonlyuse15%andaccountforothercostssuchasrecreation,entertainment,savings,ordebtrepayment.q
taxesTaxescalculatedintheStandardincludefederalandstateincometax,payrolltaxes,andstateandlocalsalestaxwhereapplicable.FederalpayrolltaxesforSocialSecurityandMedicarearecalculatedat7.65%ofeachdollarearned.Althoughthefederalincometaxrateishigherthanthepayrolltaxrate,federalexemptionsanddeductionsaresubstantial.Asaresult,whilepayrolltaxispaidoneverydollarearned,mostfamilieswillnotowefederalincometaxonthefirst$10,000to$15,000ormore,thusloweringtheeffectivefederaltaxratetoabout7%forsomefamilytypes.IncometaxcalculationsfortheStandardincludestateandlocalincometax.Connecticutincometaxratesrangefrom3%to6.7%dependingonincomelevelandfilingstatus.
Indirecttaxes(e.g.,propertytaxespaidbythelandlordonhousing)areassumedtobeincludedinthepriceofhousingpassedonbythelandlordtothetenant.Taxesongasoline

40 • The Self-Sufficiency STandard for connecTicuT 2015
andautomobilesareincludedinthecalculatedcostofowningandrunningacar.
Connecticuthasa6.35%statesalesandusetax.Therearenolocalsalestaxesortaxdistricts.
Data sourCes
Federal Income Tax: InternalRevenueService,“1040Instructions,”http://www.irs.gov/pub/irs-pdf/i1040gi.pdf(accessedJune8,2014).InternalRevenueService,“RevisedProcedures2013-35,Section3.2014AdjustedItems,”http://www.irs.gov/pub/irs-drop/rp-13-35.pdf(accessedOctober31,2013).
State Income Tax: ConnecticutDepartmentofRevenueServices,“ConnecticutResidentIncomeTaxReturnandInstructionsBooklet,”www.ct.gov/drs/lib/drs/forms/2014forms/incometax/ct-1040_booklet.pdf(accessedDecember12,2014).Marginalrates:ConnecticutIncomeTaxBrackets,“2014ConnecticutIncomeTaxTable,”http://www.tax-brackets.org/connecticuttaxtable(accessedFebruary9,2015).
State and Local Sales Tax: StateofConnecticut,DepartmentofRevenueServices,TaxpayerAnswerCenter,“WhatisthesalestaxrateinConnecticut?,”http://askdrs.ct.gov/Scripts/drsrightnow.cfg/php.exe/enduser/std_adp.php?p_faqid=398,accessedFebruary9,2015.
tax CreDitsTheStandardincludesfederaltaxcredits(theEarnedIncomeTaxCredit,theChildCareTaxCredit,andtheChildTaxCredit)andapplicablestatetaxcredits.TaxcreditsareshownasreceivedmonthlyintheStandard.
TheEarnedIncomeTaxCredit(EITC),orasitisalsocalled,theEarnedIncomeCredit,isafederaltaxrefundintendedtooffsetthelossofincomefrompayrolltaxesowedbylow-incomeworkingfamilies.TheEITCisa“refundable”taxcredit,meaningworkingadultsmayreceivethetaxcreditwhetherornottheyoweanyfederaltaxes.ConnecticuthasastateEITCthatissetat30%ofthefederalEITC.
TheChildCareTaxCredit(CCTC),alsoknownastheChildandDependentCareTaxCredit,isafederaltaxcreditthatallowsworkingparentstodeductapercentageoftheirchildcarecostsfromthefederalincometaxesthey
owe.LiketheEITC,theCCTCisdeductedfromthetotalamountofmoneyafamilyneedstobeself-sufficient.UnliketheEITC,thefederalCCTCisnotarefundablefederaltaxcredit;thatis,afamilymayonlyreceivetheCCTCasacreditagainstfederalincometaxesowed.Therefore,familieswhooweverylittleornothinginfederalincometaxeswillreceivelittleornoCCTC.In2014,upto$3,000inchildcarecostswasdeductibleforonequalifyingchildandupto$6,000fortwoormorequalifyingchildren.
TheChildTaxCredit(CTC)isliketheEITCinthatitisarefundablefederaltaxcredit.In2014,theCTCprovidedparentswithadeductionof$1,000foreachchildunder17yearsold,or15%ofearnedincomeover$3,000,whicheverwasless.FortheStandard,theCTCisshownasreceivedmonthly.
Data sourCes
Federal Child Care Tax Credit: InternalRevenueService,“Publication503.ChildandDependentCareExpenses,”http://www.irs.gov/pub/irs-pdf/p503.pdf(accessedFebruary24,2015).
Federal Child Tax Credit:InternalRevenueService,“Publication972.ChildTaxCredit,”http://www.irs.gov/pub/irs-pdf/p972.pdf(accessedFebruary24,2015).
Federal Earned Income Tax Credit: InternalRevenueService,“Publication596.EarnedIncomeCredit,”http://www.irs.gov/pub/irs-pdf/p596.pdf(accessedJune8,2014).InternalRevenueService,“RevisedProcedures2013-35,Section3.2014AdjustedItems,”http://www.irs.gov/pub/irs-drop/rp-13-35.pdf(accessedOctober31,2013).
Federal Tax Credits (General): InternalRevenueService,“1040Instructions,”http://www.irs.gov/pub/irs-pdf/i1040gi.pdf(accessedJune8,2014).
emerGenCY saVinGs funDTheSelf-SufficiencyStandardsarebasicneeds,no-frillsbudgetscreatedforallfamilytypesineachcountyinagivenstate.Assuch,theStandarddoesnotallowforanythingextrabeyonddailyneeds,suchasretirementsavings,educationexpenses,oremergencies.Ofcourse,withoutquestionfamiliesneedmoreresourcesiftheyaretomaintaineconomicsecurityandbeabletoweatheranyunexpectedincomeloss.Therefore,newtothisSelf-

The Self-Sufficiency STandard for connecTicuT 2015 • 41
SufficiencyStandardupdateisthecalculationofthemostuniversalofeconomicsecurityneedsafterbasicneedsaremetattheSelf-SufficiencyStandardlevel—thatofsavingsforemergencies.
Theemergencysavingsamountiscalculatedtomakeupfortheearningsofoneadultbecomingunemployedovertheaveragejoblossperiod,lesstheamountexpectedtobereceivedinunemploymentbenefits.Intwo-adulthouseholds,itisassumedthatthesecondadultcontinuestobeemployed,sothatthesavingsonlyneedtocoverhalfofthefamily’sbasiclivingexpensesoverthejoblossperiod.SincethemedianlengthofjobtenureamongConnecticutworkersissevenyears,itisassumedthatworkerssaveforjoblossoveracourseofsevenyears.
Todeterminetheamountofresourcesneeded,thisestimateusestheaverageperiodofunemploymentandassumesthattheminimalcostofbasicneedsthatmustbemetwillstaythesame,i.e.,thefamily’sSelf-SufficiencyStandard.Sincethemonthlyemergencysavingscontributionrequiresadditionalearnings,theestimateincludesthecalculationoftaxesandtaxcreditsofcurrentearnings(attheSelf-SufficiencyStandardlevel).Savingsareassumedtohaveaccumulatedbasedonaveragesavingsaccountinterestrates.
TheemergencysavingscalculationisbasedonallcurrentexpensesintheSelf-SufficiencyStandard.rTheadultmaynotbecommutingtoworkfivedaysaweek;howevertheoveralltransportationexpensesmaynotchangesignificantly.Aweeklyshoppingtripisstillanecessity,asisdrivingyoungchildrentochildcare.Activelyseekingemploymentrequiresbeingavailableforjobinterviews,attendingjobfairs,andengaginginnetworkingopportunities,inadditiontothetimespentlookingforandapplyingforpositions.Therefore,savingenoughtocoverthecostofcontinuingchildcareifunemployedisimportantforsupportingactivejobseekingaswellasthebenefitofkeepingchildrenintheirnormalroutineduringatimeofcrisis.
Inadditiontotheincomeneededtocoverthecostsofhousing,food,childcareandtransportation,familiesneedhealthinsurance.TheSelf-SufficiencyStandardassumesthatadultsworkfulltimeandinjobsthatprovideemployer-sponsoredhealthinsurance.Inhouseholdswith
twoadults,itisassumedthatifoneadultlosesemploymentthespouse’shealthinsurancewillprovidecoveragefortheentirefamilyatnoadditionalcost.Inaone-adulthousehold,itisassumedcoveragewillbeprovidedthroughthestate-operatedAffordableInsuranceExchangesunderthePatientProtectionandAffordableCareAct,atapproximatelythesamecostaswhenemployed.sInsomecases,children,orthewholefamily,maybecoveredunderstateMedicaidortheChildrenHealthInsuranceProgram,dependinguponincome,resources,andeligibilityrequirementsineffectatthetime,whichwoulddecreasehealthcarecostsbelowtheseestimates.t
Data sourCes
Job Tenure: U.S.CensusBureau,CurrentPopulationSurvey,“Connecticut:MedianYearsofTenurewithCurrentEmployer,allworkers”http://dataferrett.census.gov/(accessedFebruary10,2015).
Unemployment Duration:U.S.DepartmentofLabor,EmploymentandTrainingAdministration,“UnemploymentInsuranceDataSummary,”http://www.workforcesecurity.doleta.gov/unemploy/content/data.asp(accessedFebruary8,2015).
Unemployment Insurance: ConnecticutDepartmentofLabor,“FilinganUnemploymentClaim.”http://www.ctdol.state.ct.us/progsupt/unemplt/uceligb.htm#weekly%20benefit%20rate,(accessedFebruary8,2015).
Savings Rate:FederalDepositInsuranceCorporation.“WeeklyNationalRates”http://www.fdic.gov/regulations/resources/rates/previous.html(accessedAugust26,2014).
enDnotes for aPPenDix aa.TheStandardwasoriginallydesignedtoprovidecalculationsfor70familyconfigurations,whichincludesallone-andtwo-adultfamilieswithzerotothreechildren(infourdifferentagegroups).Inordertoincreasethenumberoffamilyconfigurationstoencompasslargerfamilies,thatis,thosewithmorethantwoadultsormorethanthreechildren,Dr.PearceexaminedCensusdatatodeterminethemostcommonsizesoflargerfamilies,andcalculatedStandardsforthesefamilies.Oncetheadditionofaparticularfamilyconfigurationaddedlessthan1%tothenumberofhouseholdscovered,Dr.Pearcecreateda“catchall”Standardtocovertheseremaininglargerbutrelativelyrarefamilytypes,e.g.,one-adultfamilieswithsixormorechildren,orfamilieswithfourormoreadultsandthreeormorechildren.
b.DianaPearceandRachelCassidy,“OverlookedandUndercounted:ANewPerspectiveontheStruggletoMakeEndsMeetinCalifornia,”Seattle:UniversityofWashington
42 • The Self-Sufficiency STandard for connecTicuT 2015
(2003),http://www.insightcced.org/uploads/publications/wd/overlookedexecsumm.pdf(accessedAugust17,2010).
c.U.S.HousingandUrbanDevelopment,“FairMarketRentsfortheSection8HousingAssistancePaymentsProgram,”DataSets,FairMarketRents:Overview(2007),http://www.huduser.org/portal/datasets/fmr/fmrover_071707R2.doc(accessedJune7,2014).
d.EachofthefiveWorkforceDevelopmentareaswasdividedintoregions:largetowns/cities(suchasHartford)weremadeintotheirownregion,andremainingtownsweregroupedtogetherbasedusingtheFMRareasandCensusdata.UsingCensus2010populationandmediangrossrentsbytown,population-weightedaveragesofmediangrossrentswerecreatedforeachofthe23regions.Theseweightedmediangrossrentswerethenusedtocalculateratios(reflectingrelativehousingcostsindifferentareas).Finally,theseratioswereappliedtotheFMRs,increasing/decreasingtheFMRtoreflecttheparticularmixineachregionofhousingcosts,resultinginadjustedFMRsforeachofthe23regions.
e.U.S.GovernmentPrintingOffice,“Section9.ChildCare,”108thCongress2004HouseWaysandMeansCommitteeGreenBook,http://www.gpo.gov/fdsys/pkg/GPO-CPRT-108WPRT108-6/pdf/GPO-CPRT-108WPRT108-6-2-9.pdf(accessedJune7,2014).
f.U.S.CensusBureau,SurveyofIncomeandProgramParticipation(SIPP),2008Panel,Wave8.“Who’sMindingtheKids?ChildCareArrangements:Spring2011,”http://www.census.gov/hhes/childcare/data/sipp/index.html(accessedJuly19,2013).
g.U.S.DepartmentofAgriculture,CenterforNutritionPolicyandPromotion,“ThriftyFoodPlan,2006,”http://www.cnpp.usda.gov/Publications/FoodPlans/MiscPubs/TFP2006Report.pdf(accessedNovember5,2013).
h.U.S.DepartmentofLabor,BureauofLaborStatistics,“ConsumerExpendituresin2013,”EconomicNewsRelease,http://www.bls.gov/news.release/cesan.nr0.htm(accessedFebruary24,2015).
i.CraigGunderson,EmilyEngelhard,AmySatoh,andElaineWaxman.“MaptheMealGap2014:TechnicalBrief,”http://feedingamerica.org/hunger-in-america/hunger-studies/map-the-meal-gap/~/media/Files/research/map-meal-gap/2014-MMG-web-2014.ashx(accessedMay28,2014),pp.2and11.
j.ChrisPorterandElizabethDeakin,SocioeconomicandJourney-to-WorkData:ACompendiumforthe35LargestU.S.MetropolitanAreas(Berkeley:InstituteofUrbanandRegionalDevelopment,UniversityofCalifornia,1995).
k.U.S.CensusBureau,“MeansofTransportationtoWork,”2008-2012AmericanCommunitySurvey5-YearEstimates,“TableB08101:MeansofTransportationtoWorkbyAge,Universe:Workers16YearsandOver,”http://www.factfinder2.census.gov/(accessedJuly11,2014).
l.TheHenryJ.KaiserFoundationStateHealthFactsOnline,“Connecticut:Employer-SponsoredCoverageRatesfortheNonelderlybyFamilyWorkStatus(2013),”http://kff.org/other/state-indicator/rate-by-employment-status-2/?state=CT(accessedDecember14,2014).
m.U.S.DepartmentofHealthandHumanServices,AgencyforHealthcareResearchandQuality,CenterforFinancing,Access,
andCostTrends,“TablesII.C.3andII.D.3:PercentofTotalPremiumsContributedbyEmployeesEnrolledinSingle/FamilyCoverageatPrivate-SectorEstablishmentsthatOfferHealthInsurancebyFirmSizeandState:UnitedStates,2013,”MedicalExpenditurePanelSurvey-InsuranceComponent,http://www.meps.ahrq.gov/mepsweb/data_stats/quick_tables_results.jsp?component=2&subcomponent=2&year=2012&tableSeries=2&tableSubSeries=CDE&searchText=&searchMethod=1&Action=Search(accessedDecember14,2014).
n.Aetna,AnthemBlueCrossandBlueShield,Connecticare,andUnitedHealthCarearefourofthetopfivemarketsharecompaniesforhealthinsuranceplansinConnecticut.Togetherthesecompaniesmakeup76%ofthetotalConnecticuthealthinsurancemarket.ConnecticutInsuranceDepartment,“ConsumerReportCardonHealthInsuranceCarriersInConnecticut.”www.ct.gov/cid/lib/cid/2014_Consumer_Report_Card_on_CT_Health_Insurance_Carriers.pdf(accessedDecember14,2014).
o.OfficeoftheLegislativeCounsel,111thCongress2ndSession,CompilationofPatientProtectionandAffordableCareAct,“RequirementtoMaintainMinimumEssentialCoverage,”Part1IndividualResponsibility,Section1501,p.143,http://docs.house.gov/energycommerce/ppacacon.pdf(accessedAugust31,2010).
p.CenteronBudgetandPolicyPriorities,HealthReform:BeyondtheBasics,“PremiumTaxCredits:AnswerstoFrequentlyAskedQuestions,”http://www.cbpp.org/files/QA-on-Premium-Credits.pdf(accessedJune9,2014).
q.ConstanceF.CitroandRobertT.Michael,eds.,MeasuringPoverty:ANewApproach(Washington,DC:NationalAcademyPress,1995),http://www.census.gov/hhes/povmeas/methodology/nas/report.html(accessedJune7,2014).
r.Thisamountexcludestaxesandtaxcredits(whichareintheStandard),asthefamilywouldbelivingonsavings,onwhichtaxesandtaxcreditshavealreadybeenpaidwhenearned,asdescribedabove.
s.PatientProtectionandAffordableCareAct(ACA).AffordableInsuranceExchangesarerequiredasof2014,andhealthinsurancetaxcreditsareavailabletooffsetmonthlypremiumcostsforthoseenrolledintheExchangeswithincomeupto400%FPL.CentersforMedicare&MedicaidServices,FactSheets,“AffordableInsuranceExchanges:SeamlessAccesstoAffordableCoverage,”http://www.cms.gov/Newsroom/MediaReleaseDatabase/Fact-Sheets/2011-Fact-Sheets-Items/2011-08-125.html(accessedJuly23,2014).
t.ChildrenareeligibleforfreecoverageunderConnecticut’sHUSKYHealthProgramifincomeislessthan$39,777forafamilyofthree.Three-personfamiliesabovethatlevelmaybeeligibleforthesamecoverageatlowcost:nomonthlypremiums,butsomeco-paymentsforincomeupto$50,265,$30amonthforthefirstchildwithamaximumof$50forfamilieswithincomeupto$63,921.HuskyHealthConnecticut,“ConnecticutHUSKYHealthProgramAnnualIncomeGuidelines–effectiveMarch1,2014,”http://www.huskyhealth.com/hh/lib/hh/pdf/HUSKYAnnualIncomeChart.pdf(accessedJanuary7,2015).

The Self-Sufficiency STandard for connecTicuT 2015 • 43
TheStandardisatoolthatcanbeusedacrossawidearrayofsettingstobenchmark,evaluate,educate,andilluminate.Belowweprovidespecificexamplesofsomeoftheseuses—withreferencesandwebsiteaddresses—sothatyoucanexploretheseusesaswellascontactprogramsandpersonswhohaveappliedtheSelf-SufficiencyStandardintheirwork.
assessment of PuBliC PoliCY oPtionsThe Self-Sufficiency Standard has been used as a tool to evaluate the impact of current and proposed policy changes.Asinthemodelingtablesinthisreport,theStandardcanbeusedtoevaluatetheimpactofavarietyofworksupports(suchasSNAP/FoodStampProgramorMedicaid)orpolicyoptions(suchaschangesinchildcareco-payments,taxreform,ortaxcredits)onfamilybudgets.
•TheSelf-SufficiencyStandardforMassachusettswasusedintheCrittentonWomen’sUnion2007report,Unlocking the Doors to Higher Education and Training for Massachusetts’ Working Poor Familiestoadvocatefortuition-freecommunitycollegeeducationandotherwaystoaddressfinancialbarrierstoeducationinMassachusetts,citingtheneedforpost-secondaryeducationandtraininginordertoacquireSelf-SufficiencyWagejobs(seewww.liveworkthrive.org/research_and_tools/reports_and_publications/The_Massachusetts_Working_Poor_Families_Project_Report).
•InColorado,theColoradoCenteronLawandPolicyusedtheColoradoSelf-SufficiencyStandardtodeterminetheimpactofaffordablehousingonfamilystabilityandupwardmobility.Inaddition,theColoradoDivisionofHousingusedinformationfromtheColoradoSelf-SufficiencyStandardstatewidereportHousingColorado:TheChallengeforaGrowingState(seehttp://www.dola.state.co.us/Doh).
•InMaryland,AdvocatesforChildrenandYouthusedtheSelf-SufficiencyStandardintheirMaryland Can Do Better for Childrencampaign,athree-yearplantoaddresscriticalneedsofchildrenandtheirfamiliesby2010.Duringthe2007specialsessionoftheMarylandGeneralAssembly,thecampaignutilizedtheSelf-SufficiencyStandardforeachofMaryland’s24jurisdictionsto
successfullyadvocateforanexpandedRefundableEarnedIncomeTaxCreditforlow-incomefamilies(seewww.acy.org).
•InDecember2005,theHumanServicesCoalitionofDadeCountyinFloridaissuedapolicybrieftitledNonprofits, Government, and the New War on Poverty: Beating the Odds in a Global Economy,whichusedtheStandardtoexamineFlorida’shumanservicessectorfromaneconomicandcommunityperspective.TheHumanServicesCoalitionofDadeCountysnowCatalystMiamiathttp://catalystmiami.org.
•InPennsylvania,manygroups,includingPathWaysPA,haveusedtheStandardtomodeltheimpactofastateEarnedIncomeTaxCreditontheabilityofafamilytoreachself-sufficientwages(seewww.pathwayspa.org).
•WhentheOklahomaDepartmentofHumanServicesproposedlargeincreasesinchildcareco-payments,theCommunityActionProject(CAP)ofTulsaCountyusedanalysesbasedontheSelf-SufficiencyStandardintheirreport,Increased Child Care Co-Payments Threaten Access to Care for Low Income Families,resultingintheDepartmentrescindingtheproposedincreases.FormoreinformationabouttheworkoftheCommunityActionProjectofTulsaCounty,seewww.captc.org.
eValuation of eConomiC DeVeloPment ProPosalsThe Self-Sufficiency Standard has been used to evaluate state and local level economic development proposals.UsingtheStandardcanhelpdeterminewhetherbusinessesseekingtaxbreaksorothergovernmentsubsidieswillcreatejobsthatpay“livingwages.”IfthejobstobecreatedpaywagesthatarebelowtheStandardsothattheemployeeswillneedpublicworksupportstobeabletomeettheirbasicneeds,thenewbusinessisessentiallyseekinga“doublesubsidy.”Economicdevelopmentproposalscanbeevaluatedfortheirnetpositiveornegativeeffectonthelocaleconomy,aswellasonthewell-beingofthepotentialworkersandtheirfamilies.
•Colorado’sFortCarsonisoneofthefirstmilitarybasestoconsiderreviewingitsvendorcontractsusingtheSelf-SufficiencyStandard.Theirsustainabilityplanwouldseek
appendix b: examples of how the Standard has been used
44 • The Self-Sufficiency STandard for connecTicuT 2015
vendorswhopay“livablewages”totheiremployees,asdefinedbytheStandard.
•InNebraska,theNebraskaAppleseedCenterhasdevelopedasetofjobqualitystandardsthatcorporationsshouldfollowpriortoreceivingpublicfunds(seewww.neappleseed.org).
•TheDelawareEconomicDevelopmentOfficehasusedtheDelawareSelf-SufficiencyStandardtoevaluatestrategicfundgrantapplicationsinordertofocusitsresourcesonqualityemploymentgrowth.
tarGetinG of JoB traininG resourCesThe Self-Sufficiency Standard has been used to target job training resources.Usingatargetedjobsstrategy,theStandardhelpstomatchjobseekerswithemploymentthatpaysSelf-SufficiencyWages.Throughanevaluationofthelocallabormarketandavailablejobtrainingandeducationinfrastructure,theskillsandgeographiclocationofcurrentorpotentialworkersareevaluatedandjobseekersarematchedtoemploymentwithfamily-sustainingwages.Throughthisanalysisitispossibletodeterminethejobsandsectorsonwhichtotargettrainingandeducationresources.
•InWashington,D.C.,theStandardwasusedinthe2000WorkforceInvestmentActstatute,whichrequiresthattheWorkforceInvestmentBoardtargetjob-trainingdollarsinhigh-growthoccupationsandassessthequalityofthejobsinordertomeetthewageandsupportiveserviceneedsofjobseekers.
eValuation of emPloYment ProGram outComesThe Self-Sufficiency Standard can be used to evaluate outcomes for clients in a range of employment programs,fromshort-termjobsearchandplacementprogramstoprogramsprovidingextensiveeducationorjobtraining.ByevaluatingwageoutcomesintermsoftheStandard,programsareusingameasureoftrueeffectiveness.Suchevaluationscanhelpredirectresourcestoapproachesthatresultinimprovedoutcomesforparticipants.
•InWashingtonState,theWorkforceDevelopmentCouncilofSeattle-KingCountyadoptedtheSelf-SufficiencyStandardasitsofficialmeasureofself-
sufficiencyandusestheStandardasaprogramevaluationbenchmark.UsingdatacollectedbycaseworkersandtheonlineSelf-SufficiencyStandardCalculator,theCouncildemonstratestheimpactofitseducationandtrainingprogramsontheachievementofself-sufficiencybyitsparticipants.FormoreinformationontheWorkforceDevelopmentCouncilofSeattle-KingCounty,seewww.seakingwdc.org.
•UnderitsWorkforceInvestmentAct,theChicagoWorkforceInvestmentBoardadoptedtheSelf-SufficiencyStandardasitsself-sufficiencybenchmark.FormoreinformationonChicago’sWorkforceInvestmentAct,seewww.cityofchicago.org.
•TheColoradoCenteronLawandPolicysuccessfullylobbiedtheEasternRegionalWorkforceBoardinFortMorgan,ColoradotoofficiallyadopttheSelf-SufficiencyStandardtodetermineeligibilityfortrainingandintensiveservices.
•ACHIEVEabilityinPennsylvaniaworkstobreakthecycleofpovertybyhelpingfamiliesmovetowardsfinancialfreedom.TheyusetheStandardtomeasureprogresstowardsfinancialself-sufficiency(seehttp://bit.ly/ACHIEVEabilityStandard).
tarGetinG eDuCation resourCesThe Self-Sufficiency Standard helps demonstrate the pay off for investing in education and trainingsuchaspost-secondaryeducationandtraining,includingtrainingforoccupationsthatarenontraditionalforwomenandpeopleofcolor.
•Forexample,theMissouriWomen’sCounciloftheDepartmentofEconomicDevelopmentusedtheStandardtobeginaprogramforlow-incomewomenthatpromotesnontraditionalcareerdevelopment,leadingtojobspayingSelf-SufficiencyWages.FormoreinformationontheMissouriWomen’sCouncilseewww.womenscouncil.org/about.html.
•InCalifornia’sSantaClaraCounty,theSelf-SufficiencyStandardwasusedinasectoralemploymentinterventionanalysisthatfocusedontheavailabilityofnontraditionaljobs,thegeographicalspreadofthosejobs,theavailabilityoftrainingresources,andwagerates.Theanalysisledtoacurriculumandcounselortrainingpackagethattargetedtransportationjobsandprovided$140,000tothe

The Self-Sufficiency STandard for connecTicuT 2015 • 45
communitycollegesystemtoexplorehowtostrengthenpreparationforthesejobs(seewww.insightcced.org).
•FollowingthereleaseoftheCrittentonWomen’sUnion(CWU)2005reportAchieving Success in the New Economy: Which Jobs Help Women Reach Economic Self Sufficiency,CWUhasestablishedanonlineHotJobsforWomenguide.UsingtheSelf-SufficiencyStandardforMassachusetts,theonlineguideassistswomeninidentifyingjobsinhighdemandthatpaySelf-SufficiencyWages,yetrequiretwoyearsorlessinfull-timeeducationortraining(seewww.liveworkthrive.org/research_and_tools/hot_jobs).
•InConnecticut,theSelf-SufficiencyStandardhasbeenadoptedatthestatelevelsince1998.Ithasbeenusedinplanningstate-supportedjobtraining,placementandemploymentretentionprograms,andhasbeendistributedtoallstateagenciesthatcounselindividualsseekingeducation,training,oremployment.Connecticut’sPermanentCommissionontheStatusofWomenregularlyusestheSelf-SufficiencyStandardinlegislativetestimony(seectpcsw.com).
•InNewYork,theStandardhasbeenusedinmodelingservicesforyoungadultsincareereducationtodemonstratehowtheirfuturecareerchoicesandeducationalpathsmightimpacttheirabilitytosupportafuturefamilyortoaddresschangingfamilydynamics.TheStandardhasalsobeenusedinNewYorkforjobreadinessplanningforwomenseekingskilledemployment.
•InDelaware,theStandardwasusedtotrainpeoplefromthedevelopmentaldisabilitycommunityonhowtoretaintheirbenefitswhenreturningtotheworkforce.
Determination of neeD for serViCes The Self-Sufficiency Standard has been used to determine which individuals are eligible or most in need of specific support or training services.
•Forexample,inVirginia,VoicesforVirginia’sChildrensuccessfullyadvocatedforthestate’sTANFAuthorizationCommitteetousetheVirginiaSelf-SufficiencyStandardasatoolforsettingeligibilityguidelines.FormoreinformationontheprogramsofVoicesforVirginia’s
Childrengotovakids.org/our-work/family-economic-success.
•TheConnecticutLegislatureenactedastatestatutethatidentified“theunder-employedworker”asanindividualwithouttheskillsnecessarytoearnawageequaltotheSelf-SufficiencyStandard.Thestatutedirectedstatewideworkforceplanningboardstorecommendfundingtoassistsuchworkers(seelarcc.org/files/larcc_files/documents/mapping_change_2002.pdf).
•TheDirectorofHumanResourcesandHumanServicesforNevadaincorporatedtheNevadaSelf-SufficiencyStandardintoNevada’s2005needsprojections.Additionally,theDirectorusedtheStandardintherecommendationsrelatedtocaseloads.
CounselinG tool for PartiCiPants in WorK & traininG ProGramsThe Self-Sufficiency Standard has been used as a counseling tool to help participants in work and training programs access benefits and develop strategies to become self-sufficient.Computer-basedcounselingtoolsallowuserstoevaluatepossiblewages,thencompareinformationonavailableprogramsandworksupportstotheirowncostsandneeds.Computer-basedSelf-SufficiencyCalculators,forusebycounselorswithclientsandthepublic,havebeendevelopedforCalifornia,Colorado,Illinois,Indiana,NewYorkCity,Ohio,Oregon,Pennsylvania,WashingtonState,Washington,D.C.,andWyoming.Thesetoolsintegrateawidevarietyofdatanotusuallybroughttogether,allowingclientstoaccessinformationaboutthebenefitsofvariousprogramsandworksupportsthatcanmovethemtowardsself-sufficiency.Throughonlinecalculators,clientsareempoweredwithinformationandtoolsthatallowthemtodevelopandtestouttheirownstrategiesforachievingself-sufficientincomes.
•Forexample,inWashingtonState,astatewideSelf-SufficiencyCalculatorisusedacrossworkforcecouncilsasacounselingtoolandcanbeviewedatwww.thecalculator.org.Additionally,theSnohomishCountyWorkforceDevelopmentCouncilinWashingtonhasdevelopedaself-sufficiencymatrixthatisusedincasemanagement.Theself-sufficiencymatrixcanbe

46 • The Self-Sufficiency STandard for connecTicuT 2015
usedasacasemanagementtool,aself-assessmenttool,ameasurementtool,andacommunicationtool.Thematrixiscomposedof25keyoutcomescales(e.g.,employmentstability,education,Englishlanguageskills,lifeskills,andchildcare).Thescalesarebasedonacontinuumof“incrisis”to“thriving.”Thecasemanagerworkswiththecustomertoscorethescalesandmonitorprogress.Tolearnmoreaboutthematrix,pleasevisithttp://www.docstoc.com/docs/89226985/SELF-SUFFICIENCY-MATRIX
•PathWaysPAoffersThe Pennsylvania Online Training and Benefits Eligibility Tool,aninteractivecareer-counselingtoolbasedonthe2012PennsylvaniaSelf-SufficiencyStandard.Theonlinecounselingtoolcanbeusedbycounselorsandclientstotesttheabilityofvariouswagestomeetafamily’sself-sufficiencyneeds,aswellaswhattrainingprogramstheymightbeeligibleforattheircurrentwage.Thistoolalsoallowsclientstoapplyforbenefitsimmediatelyorforcounselorstodosoonaclient’sbehalf.The Pennsylvania Online Training and Benefits Eligibility Toolcanbefoundatwww.pathwayspa.org.
•TheOregonProsperity Planner,acalculatorbasedontheOregonSelf-SufficiencyStandardcanbefoundatwww.prosperityplanner.org.
•TheDenverCountyOfficeofEconomicDevelopment,DivisionofWorkforceDevelopmentusestheSelf-SufficiencyStandardaswellastheColoradoEconomicSelf-SufficiencyStandardCalculatortoinformparticipantsaboutthecareerchoicesthatwillmovethemtowardeconomicself-sufficiency.TheWorkplaceCenterattheCommunityCollegeofDenverutilizestheColoradoEconomicSelf-SufficiencyStandardCalculatortocounselparticipantsoncareerchoices,realwagedeterminationandavoidingpotentialobstaclestoeconomicself-sufficiencysuchasthesystemic“cliffeffect”builtintomanyworksupportprograms.
•VirginiaKidsdevelopedThe Self-Sufficiency Standard for Virginia – Budget Worksheet Exerciseasacounselingtool(seehttp://www.vakids.org/pubs/FES/budget_worksheet_exercise.htm).
•IntheD.C.MetropolitanArea,WiderOpportunitiesforWomendevelopedandpilotedaTeenCurriculumbasedontheStandardthateducatesadolescentsaboutcareerchoices,lifedecisions,andself-sufficiency(seewww.wowonline.org).Additionally,theWashington,D.C.
MetroAreaSelf-SufficiencyCalculatorcanbefoundathttp://www.dcmassc.org/calculator.cfm.
•InNewYorktheWomen’sCenterforEducationandCareerAdvancementhasusedtheStandardtotraincounselorstobettercommunicateideasaboutSelf-Sufficiencyandeconomicissueswiththeirclientsandassessbenefiteligibility.TheWomen’sCenterforEducationandCareerAdvancementalsohostsanonlineSelf-SufficiencyCalculatorfortheCityofNewYork.TheCalculatorfortheCityofNewYorkcanbeaccessedatwww.wceca.org/self_sufficiency.php.
•TheIndianaInstituteforWorkingFamilieshoststhecalculatoratwww.indianaselfsufficiencystandard.org.
•TheCaliforniaSelf-SufficiencyCalculator,The Calculator,canbefoundatwww.insightcced.org/index.php/insight-communities/cfess/calculator.
•TheWyomingSelf-SufficiencyStandard&PersonalCalculatorcanbeviewedathttps://public.wyomingworkforce.org/sscalc/
PuBliC eDuCationThe Self-Sufficiency Standard has been used as a public education tool.Asaneducationtool,theStandardhelpsthepublicatlargeunderstandwhatisinvolvedinmakingthetransitiontoself-sufficiency.ForemployerstheStandardcanbeusedtodemonstratetheimportanceofprovidingbenefits,especiallyhealthcare,whichhelpfamiliesmeettheirneeds.Asaneducationtoolforserviceproviders,theStandardcanshowhowthevariouscomponentsofsocialservicesfittogether,helpingtofacilitatethecoordinationofarangeofservicesandsupports.Forpolicymakersandlegislators,theStandardasaneducationtoolshowsboththeneedforandtheimpactofworksupportprogramsonlow-wageworkers’familybudgets.
•Forexample,VoicesforUtahChildrendistributedcopiesoftheUtahSelf-SufficiencyStandardtostatelegislatorsandcandidatesduringthe2003legislativesessiontoframeadiscussionaboutincreasingfundingforUtah’sChildren’sHealthInsuranceProgram.FormoreinformationonVoicesforUtahChildrengotowww.utahchildren.org.
•InSeattle,bookmarksweredistributedduringtherunofaplaybasedonNickel and Dimed: On (Not) Getting By in America,abookbyBarbaraEhrenreichthatexploresthestrugglesconfrontedbylow-wageworkers.Acomputer

The Self-Sufficiency STandard for connecTicuT 2015 • 47
withamockwebsiteallowedparticipantstoentertheirincomesandcomparethemtotheStandardandbegintounderstandtheplightofworkingfamilies.
•MassFESS(hostedbytheCrittentonWomen’sUnion)developedanEconomicSelf-SufficiencyStandardCurriculumthatcanbeusedbyorganizationstosupporttheirworkincareerdevelopment,education/training,economicliteracy,livingwagecampaigns,andothertypesofcommunityorganizing,policymakingandadvocacyefforts.ForinformationontheCrittentonWomen’sUnion,seewww.liveworkthrive.org.
•InaninitiativestartedattheUniversityofWashingtonSchoolofSocialWork,policymakersparticipateinthe“Walk-A-Mile”program,wherethey“walk”intheshoesofwelfarerecipientsbylivingonaSNAPbudgetforonemonth.TheWashingtonStandardwasusedtodevelopeducationaltoolsusedbypolicymakersabouttheimpactofbenefitsonfamilybudgets.
•TheWisconsinWomen’sNetworkdistributedtheWisconsinSelf-SufficiencyStandardtoitsmanyandvariedwomen’scoalitionmembers,manyofwhomcontinuetofindausefortheStandardintheiradvocacywork.TheWisconsinWomen’sNetworkwebsitecanbeaccessedatwww.wiwomensnetwork.org.
Create GuiDelines for WaGe settinGThe Self-Sufficiency Standard has been used as a guideline for wage setting.Bydeterminingthewagesnecessarytomeetbasicneeds,theStandardprovidesinformationforsettingwagestandards.
•Forexample,VanderbiltUniversityinTennesseeusestheStandardtoeducateemployeesandadministratorsabouttheneedtoincreasethetake-homepayofservicestaff.Formoreinformationgotostudentorgs.vanderbilt.edu/students4livingwage/info.php.
•EmployersandeducationalinstitutionshaveusedtheSelf-SufficiencyStandardtosetorganizationalwagestandardsinColorado.TheintroductionoftheSelf-SufficiencyStandardinPitkinCounty,Colorado,hasencouragedcountycommissionersanddirectorstoreviewcurrentpayscalesandworksupportpolicies.
•TheStandardhasbeenusedinCalifornia,Illinois,NewYork,NewJersey,Hawaii,Nebraska,SouthDakota,Tennessee,Virginia,andWashingtonStatetoadvocate
forhigherwagesthroughlivingwageordinancesandinnegotiatinglaborunionagreements.
•AttherequestofthestateofCalifornia,theCenterfortheChildCareWorkforceusedtheSelf-SufficiencyStandardin2002todevelopspecificsalaryguidelinesbycounty(seewww.ccw.org/data.html).
•InMaryland,theCenterforPovertySolutionsandAdvocatesforChildrenandYouth(amongotherorganizations)proposedstatelegislationthatwouldrequiretheMarylandSecretaryofBudgetandManagementtoconsideraspecifiedSelf-SufficiencyStandardwhensettingoramendingapayrateandrequirethatastateemployeewhosepayrateislessthantheSelf-SufficiencyStandardreceiveaspecifiedpayincrease.FormoreinformationonAdvocatesforChildrenandYouth,seewww.acy.org.
•InCalifornia,theNationalEconomicDevelopmentandLawCenter(nowtheInsightCenterforCommunityEconomicDevelopment,orInsightCCED)usedtheSelf-SufficiencyStandardinawageanalysisofUniversityofCaliforniaserviceworkers,entitledHigh Ideals, Low Pay.TheStandardwasusedtoassessthedegreetowhichUniversityofCaliforniaserviceworkers’wagesaresufficienttoprovidethebasicneedsforemployeesandtheirfamilies.InsightCCEDrecommendstheUniversityofCaliforniaconsiderusingtheStandardtodetermineandadoptlivingwagepolicies(seewww.insightcced.org).
•TheSelf-SufficiencyStandardwasanintegraltoolforincreasingHawaii’sminimumwageto$6.75onJanuary1,2006and$7.25onJanuary1,2007.
•GeorgetownUniversitystudentsendedanine-dayhungerstrikewhentheUniversityadministrationagreedtoimprovewagesforthelow-paidcustodial,foodservice,andsecurityworkers.ThestudentgrouputilizedtheSelf-SufficiencyStandardfortheDistrictofColumbiaintheircampaignadvocacy.Thenegotiatedagreementincludedraisingtheminimumhourlywageto$13beginningJuly2006andannualwageadjustmentsbasedontheConsumerPriceIndex.
•TheStandardwascitedinresearchandtestimonyinsupportoftheSeaTaclivingwageordinance(raisingwagesto$15/hourforcoveredemployees)andinthesuccessfulcampaigntoraisetheminimumwageinSeattleto$15/hour(overseveralyears,dependingonestablishmentsize).

48 • The Self-Sufficiency STandard for connecTicuT 2015
suPPort researChBecause the Self-Sufficiency Standard provides an accurate and specific measure of income adequacy, it is frequently used in research.TheStandardprovidesameansofestimatinghowpovertydiffersfromplacetoplaceandamongdifferentfamilytypes.TheStandardalsoprovidesameanstomeasuretheadequacyofvariousworksupports,suchaschildsupportorchildcareassistance,givenafamily’sincome,placeofresidence,andcomposition.
•Forexample,theSelf-SufficiencyStandardhasbeenusedtoexaminethecostofhealthinsuranceinWashingtonandMassachusetts.Income Adequacy and the Affordability of Health Insurance in Washington StateandtheHealth Economic Sufficiency Standard for MassachusettsusedtheStandardtoexaminethecostofhealthinsurancefordifferentfamilytypes,withvaryinghealthstatusesandhealthcarecoverage,indifferentlocations(seewww.wowonline.org/ourprograms/fess/state-resources/documents/MAHealthEconomicSelf-SufficiencyStandard.pdf).
•PathWaysPAcitestheSelf-SufficiencyStandardfrequentlyinitspublications,includingInvesting in Pennsylvania’s Families: Economic Opportunities for All,apolicypublicationlookingattheneedsofworkingfamiliesinPennsylvaniaearninglessthan200%oftheFederalPovertyLevel(seepathwayspa.org.mytempweb.com/wp-content/uploads/2014/01/Investing-in-PA-Families-2007.pdf).PathWaysPAalsousestheStandardasameasureonwhichtobasetaxcredits,healthcarereform,andotherneeds.
•Inseveralstates,theSelf-SufficiencyStandardhasbeenusedalongwithdatafromtheU.S.CensusBureautomeasurethenumberoffamiliesaboveandbelowtheSelf-SufficiencyStandard,aswellasthecharacteristicsofthoseaboveandbelowtheStandard,suchasrace,ethnicity,familytype,education,andemployment.ThesedemographicreportshavebeenpublishedbytheCenterforWomen’sWelfareforsevenstates,suchasthereportOverlooked and Undercounted 2009: Struggling to Make Ends Meet in California(seewww.selfsufficiencystandard.org/pubs.html#addpubs).Themostrecentofthesereports,whichdemonstratetheimpactoftheGreatRecessionasmeasuredbytheStandard,isforPennsylvania,andcanbefoundatselfsufficiencystandard.org/docs/PA2012_Web_101112.pdf.

The Self-Sufficiency STandard for connecTicuT 2015 • 49
Theofficialfederalpovertymeasure,oftenknownastheFederalPovertyLevel(FPL),wasdevelopedoverfourdecadesagoandtodayhasbecomeincreasinglyproblematicandoutdatedasameasureofincomeadequacy.aIndeed,theCensusBureauitselfstates,“theofficialpovertymeasureshouldbeinterpretedasastatisticalyardstickratherthanasacompletedescriptionofwhatpeopleandfamiliesneedtolive.”bDespitethemanylimitationsofthefederalpovertymeasure,itisstillusedtocalculateeligibilityforanumberofpovertyandworksupportprograms.
Themostsignificantshortcomingofthefederalpovertymeasureisthatformostfamilies,inmostplaces,the poverty level is simply too low.Figure C-1,The Self-Sufficiency Standard and Federal Poverty Level for Select Family Types,demonstratesthatforvariousfamilytypesintheLowerConnecticutRiverregiontheincomeneededtomeetbasicneedsisfarabovetheFPL.WhiletheStandardchangesbyfamilytypetoaccountfortheincreaseincostsspecific
appendix c: federal approaches to measuring Poverty
tothetypeoffamilymember—whetherthispersonisanadultorchild,andforchildren,byage—theFPLincreasesbyaconstant$4,160foreachadditionalfamilymemberandthereforedoesnotadequatelyaccountfortherealcostsofmeetingbasicneeds.Table C-1,The Self-Sufficiency Standard as a Percentage of the Federal Poverty Level,demonstratesthatacrossallofConnecticuttheincomeneededtomeetbasicneedsisfarabovetheFPL,indicatingthatfamiliesthroughoutConnecticutcanhaveincomesabovethefederalpovertymeasureandyetlacksufficientresourcestoadequatelymeettheirbasicneeds.Forthis
The moST SiGnificanT ShorTcominG of The
federal PoverTy meaSure iS ThaT for moST
familieS, in moST PlaceS, The PoverTy level iS
SimPly Too loW.
figure c-1. TheSelf-SufficiencyStandardandFederalPovertylevelforSelectFamilyTypes Lower Connecticut River, CT 2015
ANNUAL SELF-SUFFICIENCY WAGE
Two AdultsOne Preschooler
One School-age Child
One Adult One AdultOne Preschooler
One AdultOne Preschooler
One School-age Child
FAMILY TYPE
$0
$10,000
$20,000
$30,000
$40,000
$50,000
$60,000
$70,000
$80,000
$90,000
FPL = $11,770FPL = $15,930
FPL = $20,090
FPL = $24,250
$61,917
$73,885
$82,351
$30,187

50 • The Self-Sufficiency STandard for connecTicuT 2015
reason,mostassistanceprogramsuseamultipleofthefederalpovertymeasuretodetermineneed.Forinstance,children’shealthinsurancewithlow-costpremiumsisavailablethroughConnecticutHUSKYBprogramforfamilieswithincomesupto323%oftheFPL.c
However,simplyraisingthepovertylevel,orusingamultipleoftheFPL,cannotsolvethestructuralproblemsinherentintheofficialpovertymeasure.Inadditiontothefundamentalproblemofbeingtoolow,therearefivebasicmethodologicalproblemswiththefederalpovertymeasure.
First, the measure is based on the cost of a single item—food—rather than a “market basket” of all basic needs.Overfivedecadesago,whentheFPLwasfirstdevelopedbyMollieOrshansky,foodwastheonlybudgetitemforwhichthecostofmeetingaminimalstandard,inthiscasenutrition,wasknown.(TheDepartmentofAgriculturehaddeterminedhouseholdfoodbudgetsbasedonnutritionalstandards.)KnowingthattheaverageAmericanfamilyspentathirdoftheirbudgetonfood,Orshanskyreasonedthatmultiplyingthefoodbudgetbythreewouldyieldanestimateoftheamountneededtomeetotherbasicneeds,andthusthisbecamethebasisoftheFPL.d
Second, the measure’s methodology is “ frozen,” not allowing for changes in the relative cost of food or non-food items, nor the addition of new necessary costs.Sinceitwasdeveloped,thepovertylevelhasonlybeenupdatedannuallyusingtheConsumerPriceIndex.Asaresult,thepercentageofthehouseholdbudgetdevotedtofoodhasremainedatone-thirdoftheFPLeventhoughAmericanfamiliesnowspendanaverageofonly13%oftheirincomeonfood.eAtthesametime,othercostshaverisenmuchfaster—suchashealthcare,housing,andmorerecently,andenergy—andnewcostshavearisen,suchaschildcareandtaxes.Noneofthesechangesare,orcanbe,reflectedinthefederalpovertymeasurebasedona“frozen”methodology.
Third, the federal poverty measure is dated, implicitly using the demographic model of a two-parent family with a “stay-at-home” wife, or if a single parent, implicitly assumes she is not employed.ThisfamilydemographicnolongerreflectstherealityofthemajorityofAmericanfamiliestoday.AccordingtotheU.S.BureauofLaborStatistics,bothparentswereemployedin59%oftwo-parentfamilieswithchildrenin2013.Likewise,68%ofsinglemothers
withchildrenwereemployedand81%ofsinglefatherswithchildrenwereemployedin2013.fThuspaidemploymentwithitsassociatedcostssuchaschildcare,transportation,andtaxesisthenormforthemajorityoffamiliestodayratherthantheexception.Moreover,whenthepovertymeasurewasfirstdeveloped,theseemployment-relateditemswerenotasignificantexpenseformostfamilies:taxeswererelativelylowandchildcareforfamilieswithyoungchildrenwasnotcommon.gHowever,todaytheseexpensesaresubstantial,andbornebymostfamilies,andthusthesecostsshouldbeincludedinamodernpovertymeasure.
Fourth, the poverty measure does not vary by geographic location.Thatis,thefederalpovertymeasureisthesamewhetheronelivesinLouisianaorintheSanFranciscoBayAreaofCalifornia(withAlaskaandHawaiitheonlyexceptionstotherule).However,housinginthemostexpensiveareasoftheUnitedStatescostsoverthreetimesasmuchasintheleastexpensiveareas.hEvenwithinstates,costsvaryconsiderably:inConnecticut,thecostofathree-bedroomhousingrentalintheLowerFairfieldregionis$2,475permonth,whileinWindhamathree-bedroomunitis$1,042permonth.
Finally, the federal poverty measure provides no information or means to track changes in specific costs (such as housing, child care, etc.), nor the impact of subsidies, taxes, and/or tax credits that reduce (or increase) these costs.Thefederalpovertymeasuredoesnotallowfordetermininghowspecificcostsriseorfallovertime.Likewise,whenassessingtheimpactofsubsidies,taxes,andtaxcredits,povertymeasurescannottracetheimpacttheyhaveonnetcostsunlesstheyareexplicitlyincludedinthemeasureitself.
Fortheseandotherreasons,manyresearchersandanalystshaveproposedrevisingthefederalpovertymeasure.Suggestedchangeswouldreflecttwenty-firstcenturyneeds,incorporategeographicallybaseddifferencesincosts,andrespondtochangesovertime.i
the suPPlemental PoVertY measureBesidestheSelf-SufficiencyStandard,theothermajorproposedalternativetothefederalpovertymeasureisameasurebasedonrecommendationsfromtheNationalAcademyofSciences(NAS).jTheCensusBureauproducedpovertyestimatesbasedonvariouscombinationsofthe

The Self-Sufficiency STandard for connecTicuT 2015 • 51
Table c-1. TheSelf-SufficiencyStandardasaPercentoftheFederalPovertylevel,2015 Three Family Types, All Connecticut Regions
reGion
one aDult one PresChooler
one aDult one PresChooler one sChool-aGe
tWo aDults one PresChooler one sChool-aGe
annual self-
sufficiency standard
self-sufficiency standard as
Percentage of federal Poverty
level (fPl)
annual self-
sufficiency standard
self-sufficiency standard as
Percentage of federal Poverty
level (fPl)
annual self-
sufficiency standard
self-sufficiency standard as
Percentage of federal Poverty
level (fPl)
Waterbury $50,233 315% $61,535 306% $70,182 289%
Greater Waterbury $53,838 338% $65,008 324% $73,513 303%
Danbury $61,917 389% $73,885 368% $82,351 340%
Greater Danbury $64,072 402% $76,619 381% $84,327 348%
northwest Corner $51,279 322% $62,708 312% $71,219 294%
Bridgeport $54,142 340% $64,940 323% $70,003 289%
stratford $59,942 376% $70,586 351% $79,682 329%
stamford $74,600 468% $87,013 433% $93,026 384%
naugatuck Valley $54,893 345% $66,427 331% $75,139 310%
upper fairfield $71,024 446% $83,438 415% $90,117 372%
lower fairfield $77,800 488% $89,914 448% $95,447 394%
hartford $46,753 293% $59,553 296% $63,381 261%
hartford suburbs $56,436 354% $68,742 342% $77,309 319%
north Central $55,764 350% $68,222 340% $76,801 317%
new haven $51,597 324% $63,185 315% $67,225 277%
upper Connecticut river $56,221 353% $68,078 339% $77,246 319%
Greater new haven $58,449 367% $69,750 347% $78,467 324%
lower Connecticut river $61,181 384% $73,394 365% $81,896 338%
Windham $44,657 280% $53,436 266% $61,064 252%
Greater Windham $53,074 333% $62,175 309% $71,025 293%
new london $47,787 300% $57,209 285% $65,990 272%
Greater new london $51,864 326% $61,228 305% $70,164 289%
northeast Corner $47,590 299% $56,189 280% $63,901 264%
The 2015 fPl is: $15,930 for a family of two, $20,090 for a family of three, and $24,250 for a family of four. See http://aspe.hhs.gov/poverty/15poverty.cfm.
NASrecommendations,designatingthemasexperimentalpovertymeasures.kThenewSupplementalPovertyMeasure(SPM)developedbytheObamaAdministrationin2011isbasedontheNASmethodology,withsomerevisions,andtheearlierworkbytheCensusBureauandothers.lSince2011,theCensusBureauhasreleasedreportsofpovertytrendsutilizingtheSPMmeasure.
Designedprimarilytotrackpovertytrendsovertime,theSupplementalPovertyMeasureprovidesanewandimprovedstatistictobetterunderstandtheprevalenceofpovertyintheUnitedStates.TheprimarydifferencesfromtheFPLaretwo:first,thethresholdsarebasedonexpenditures,andthustracklivingstandards,makingthe
SPMarelativemeasure.Second,theSPMusesabroadermeasureofresources,beyondcashincome,includingthevalueofsomebenefits(thosethatoffsetthecoreelementsoftheSPM,i.e.,food,housingandutilities).TheSPMisnotintendedtobeareplacementfortheFPL,butitwillprovidepolicymakerswithadditionaldataontheextentofpovertyandtheimpactofpublicpolicies.Atthesametime,theSPMwillnotreplacetheneedforotherbenchmarksofincomeadequacy,particularlybecauseitsthresholdsaresetatalevelroughlythesameastheFPL.TheStandardwillcontinuetobeanessentialtoolforunderstandingwhatittakestomakeendsmeetataminimallyadequatelevelintoday’seconomy.

52 • The Self-Sufficiency STandard for connecTicuT 2015
aPPenDix C enDnotesa.Therearetwofederalmeasurementsofpoverty.AdetailedmatrixofpovertythresholdsiscalculatedeachyearbytheU.S.CensusBureau,whichvariesbythenumberofadultsandthenumberofchildreninthehousehold,andbyageforone-andtwo-adulthouseholds.Thethresholdisusedtocalculatethenumberofpeopleinpovertyforthepreviousyear.Theotherformofthepovertymeasureiscalledthe“federalpovertyguidelines”orthe“FederalPovertyLevel”(FPG/FPL).TheFPLiscalculatedbytheU.S.DepartmentofHealthandHumanServiceseachFebruaryandisprimarilyusedbyfederalandstateprogramstodetermineeligibilityand/orcalculatebenefits,suchasforSNAP(formerlytheFoodStampsProgram).TheFPLonlyvariesbyfamilysize,regardlessofcomposition;the2015FPLforafamilyofthreeis$20,090.TheStandardreferencestheFPLinthisreport.Formoreinformationaboutthefederalpovertymeasurements,seehttp://aspe.hhs.gov/poverty/faq.cfmandhttp://aspe.hhs.gov/poverty/15poverty.cfm.
b.CarmenDeNavas-Walt,BernadetteProctor,andJessicaC.Smith,“Income,Poverty,andHealthInsuranceCoverageintheU.S.:2012,”U.S.CensusBureau,CurrentPopulationReports,SeriesP60-245,Washington,D.C.(U.S.GovernmentPrintingOffice),http://www.census.gov/prod/2013pubs/p60-245.pdf(accessedJune24,2014).
c.StateofConnecticut,“ConnecticutHUSKYHealthProgramAnnualIncomeGuidelines–effectiveMarch1,2014”http://www.huskyhealth.com/hh/lib/hh/pdf/HUSKYAnnualIncomeChart.pdf(accessedFebruary26,2015).
d.U.S.DepartmentofHealthandHumanServices,“FrequentlyAskedQuestionsRelatedtothePovertyGuidelinesandPoverty,”http://aspe.hhs.gov/poverty/faq.cfm(accessedFebruary26,2015).
e.In2012theaverageconsumerexpenditureonfoodwas$6,599peryearor12.8%oftotalexpenditures.U.S.DepartmentofLabor,BureauofLaborStatistics,“ConsumerExpendituresin2012,”http://www.bls.gov/news.release/cesan.nr0.htm(accessedFebruary26,2015).
f.U.S.DepartmentofLabor,U.S.BureauofLaborStatistics,“EmploymentCharacteristicsofFamilies-2013,”http://www.bls.gov/news.release/pdf/famee.pdf(accessedFebruary26,2015).
g.Atthetimethefederalpovertymeasurewasdevelopedchildcarewasanegligiblecomponentofconsumerexpenditures(p.27)andthetaxburdenonthelow-incomepopulationwasrelativelylowataneffective1%in1966(p.29).ConstanceCitroandRobertMichael,Eds.,Measuring Poverty: A New Approach,Washington,D.C.:NationalAcademyPress,http://www.nap.edu/openbook.php?record_id=4759(accessedJune25,2014);hereaftercitedasMeasuring Poverty.
h.Usingthe2015FairMarketRents,thecostofhousing(includingutilities)atthe40thpercentileforatwo-bedroomunitinthemostexpensiveplace—theSanFranciscometropolitanarea—is$2,062permonth.Thisisnearlyfourtimesasmuchastheleastexpensivehousinginthecountry,foundinmostcountiesinKentucky,wheretwo-bedroomunitscost$558permonth.U.S.HousingandUrbanDevelopmentDepartment,“FairMarketRents,”http://www.huduser.org/datasets/fmr.html(accessedAugust15,2014).
i.OneofthefirstpeopletoadvocateimplementingchangesovertimeintotheFederalPovertyLevelwasPatriciaRuggles,authorofDrawing the Line.Ruggles’workandtheanalysesofmanyothersaresummarizedinMeasuring Poverty.
j.Measuring Poverty.
k.ThesiaI.GarnerandKathleenS.Short,“CreatingaConsistentPovertyMeasureOverTimeUsingNASProcedures:1996-2005,”U.S.DepartmentofLabor,BLSWorkingPapers,WorkingPaper417,April2008,http://www.bls.gov/osmr/pdf/ec080030.pdf(accessedJune25,2014).
l.U.S.DepartmentofCommerce,U.S.CensusBureau,Poverty–ExperimentalMeasures,SupplementalPovertyMeasureMethodology,“ObservationsfromtheInteragencyTechnicalWorkingGrouponDevelopingaSupplementalPovertyMeasure,”March2010,https://www.census.gov/hhes/www/poverty/SPM_TWGObservations.pdf(accessedJune25,2014).U.S.DepartmentofCommerce,U.S.CensusBureau,“Webinar:SupplementalPovertyMeasureResearch,”http://www.census.gov/newsroom/releases/archives/news_conferences/2011-11-04_spm_webinar.html(accessedNovember10,2011).

appendix d: The Self-Sufficiency Standard for Select family Types in connecticut
Appendix D provides detailed tables of the Self-Sufficiency Standard for eight select family types in each
region in Connecticut. An excel file with detailed data for all one and two adult family types up to three
children plus larger families is available at www.selfsufficiencystandard.org/pubs/ orwww.ctpcsw.com.

54 • The Self-Sufficiency STandard for connecTicuT 2015
connecticut Workforce development areas, regions, Towns, and counties
northWest WorKforCe DeVeloPment area
1. Waterbury
Waterbury city, new haven county
2. Greater Waterbury
Bethlehem, Litchfield County
Thomaston, Litchfield County
Watertown, Litchfield County
Woodbury, Litchfield County
cheshire, new haven county
middlebury, new haven county
naugatuck, new haven county
Prospect, new haven county
Southbury, new haven county
Wolcott, new haven county
3. Danbury
Danbury, Fairfield County
4. Greater Danbury
Bethel, Fairfield County
Brookfield Fairfield County
New Fairfield, Fairfield County
Newtown, Fairfield County
Redding, Fairfield County
Ridgefield, Fairfield County
Sherman, Fairfield County
Bridgewater, Litchfield County
New Milford, Litchfield County
Roxbury, Litchfield County
Washington, Litchfield County
5. northwest Corner
hartland, hartford county
Barkhamsted, Litchfield County
Canaan, Litchfield County
Colebrook, Litchfield County
Cornwall, Litchfield County
Goshen, Litchfield County
Harwinton, Litchfield County
Kent, Litchfield County
Litchfield, Litchfield County
Morris, Litchfield County
New Hartford, Litchfield County
Norfolk, Litchfield County
North Canaan, Litchfield County
Salisbury, Litchfield County
Sharon, Litchfield County
Torrington, Litchfield County
Warren, Litchfield County
Winchester, Litchfield County
southWest WorKforCe DeVeloPment area
6. Bridgeport
Bridgeport City, Fairfield County
7. stratford
Stratford City, Fairfield County
8. stamford
Stamford City, Fairfield County
9. naugatuck Valley
Shelton, Fairfield County
ansonia, new haven county
beacon falls, new haven county
derby, new haven county
oxford, new haven county
Seymour, new haven county
10.upperFairfield
Easton, Fairfield County
Fairfield, Fairfield County
Monroe, Fairfield County
Trumbull, Fairfield County
11.lowerFairfield
Darien, Fairfield County
Greenwich, Fairfield County
New Canaan, Fairfield County
Norwalk, Fairfield County
Weston, Fairfield County
Westport, Fairfield County
Wilton, Fairfield County
north Central WorKforCe DeVeloPment area
12. hartford
hartford city, hartford county
13. hartford suburbs
Bloomfield, Hartford County
east hartford, hartford county
manchester, hartford county
newington, hartford county
South Windsor, hartford county
West hartford, hartford county
Wethersfield, Hartford County
Windsor, hartford county
14. north Central
avon, hartford county
berlin, hartford county
bristol, hartford county
burlington, hartford county
canton, hartford county
east Granby, hartford county
east hartford, hartford county
east Windsor, hartford county
Enfield, Hartford County
farmington, hartford county
Glastonbury, hartford county
Granby, hartford county
marlborough, hartford county

The Self-Sufficiency STandard for connecTicuT 2015 • 55
new britain, hartford county
Plainville, hartford county
rocky hill, hartford county
Simsbury, hartford county
Southington, hartford county
Suffield, Hartford County
Windsor locks, hartford county
Plymouth, Litchfield County
andover, Tolland county
bolton, Tolland county
ellington, Tolland county
hebron, Tolland county
Somers, Tolland county
Stafford, Tolland county
Tolland, Tolland county
vernon, Tolland county
south Central WorKforCe DeVeloPment area
15. new haven
new haven city, new haven county
16. upper Connecticut river
cromwell, middlesex county
durham, middlesex county
east haddam, middlesex county
east hampton, middlesex county
haddam, middlesex county
Middlefield, Middlesex County
middletown, middlesex county
Portland, middlesex county
17. Greater new haven
clinton, middlesex county
killingworth, middlesex county
branford, new haven county
bethany, new haven county
east haven, new haven county
Guilford, new haven county
hamden, new haven county
madison, new haven county
meriden, new haven county
milford, new haven county
north haven, new haven county
north branford, new haven county
orange, new haven county
Wallingford, new haven county
West haven, new haven county
Woodbridge, new haven county
18. lower Connecticut river
chester, middlesex county
deep river, middlesex county
essex, middlesex county
old Saybrook, middlesex county
Westbrook, middlesex county
eastern WorKforCe DeVeloPment area
19. Windham
Windham, Windham county
20. Greater Windham
colchester, new london county
lebanon, new london county
columbia, Tolland county
coventry, Tolland county
Mansfield, Tolland County
union, Tolland county
Willington, Tolland county
ashford, Windham county
chaplin, Windham county
21. new london
new london, new london county
22. Greater new london
bozrah, new london county
east lyme, new london county
franklin, new london county
Griswold, new london county
Groton, new london county
ledyard, new london county
lisbon, new london county
lyme, new london county
montville, new london county
north Stonington, new london county
norwich, new london county
old lyme, new london county
Preston, new london county
Salem, new london county
Sprague, new london county
Stonington, new london county
voluntown, new london county
Waterford, new london county
23. northeast Corner
brooklyn, Windham county
canterbury, Windham county
eastford, Windham county
hampton, Windham county
killingly, Windham county
Plainfield, Windham County
Pomfret, Windham county
Putnam, Windham county
Scotland, Windham county
Sterling, Windham county
Thompson, Windham county
Woodstock, Windham county

56 • The Self-Sufficiency STandard for connecTicuT 2015
Table 1 The Self-Sufficiency Standard for Waterbury, CT 2015
monThly coSTS adultAdult +
Preschooler
Adult + infant
Preschooler
Adult + Preschooler School-age
Adult + School-age Teenager
2 Adults + infant
2 Adults+ PreschoolerSchool-age
2 Adults +infant
Preschooler School-age
housing $742 $904 $904 $904 $904 $904 $904 $1,126
Child Care $0 $982 $2,012 $1,519 $537 $1,030 $1,519 $2,549
food $265 $402 $528 $606 $701 $643 $832 $920
transportation $322 $330 $330 $330 $330 $630 $630 $630
health Care $186 $542 $553 $565 $598 $600 $621 $633
miscellaneous $151 $316 $433 $392 $307 $381 $451 $586
taxes $306 $844 $1,246 $1,077 $697 $926 $1,158 $1,625
earned income tax Credit (-) $0 $0 $0 $0 $0 $0 $0 $0
Child Care tax Credit (-) $0 ($50) ($100) ($100) ($50) ($50) ($100) ($100)
Child tax Credit (-) $0 ($83) ($167) ($167) ($167) ($83) ($167) ($250)
Self-Sufficiency WaGe
hourly $11.20 $23.78 $32.60 $29.14 $21.93 $14.15 $16.62 $21.93
per adult per adult per adult
monThly $1,972 $4,186 $5,738 $5,128 $3,859 $4,981 $5,849 $7,719
annual $23,664 $50,233 $68,859 $61,535 $46,308 $59,766 $70,182 $92,626
emerGenCY saVinGs(monthly Contribution) $35 $70 $111 $89 $71 $43 $50 $62
Table 2 The Self-Sufficiency Standard for Greater Waterbury, CT 2015
monThly coSTS adultAdult +
Preschooler
Adult + infant
Preschooler
Adult + Preschooler School-age
Adult + School-age Teenager
2 Adults + infant
2 Adults+ PreschoolerSchool-age
2 Adults +infant
Preschooler School-age
housing $891 $1,106 $1,106 $1,106 $1,106 $1,106 $1,106 $1,383
Child Care $0 $982 $2,012 $1,519 $537 $1,030 $1,519 $2,549
food $269 $408 $535 $615 $711 $652 $844 $933
transportation $311 $319 $319 $319 $319 $608 $608 $608
health Care $183 $533 $544 $556 $589 $591 $612 $624
miscellaneous $165 $335 $452 $412 $326 $399 $469 $610
taxes $369 $938 $1,351 $1,157 $793 $1,017 $1,235 $1,741
earned income tax Credit (-) $0 $0 $0 $0 $0 $0 $0 $0
Child Care tax Credit (-) $0 ($50) ($100) ($100) ($50) ($50) ($100) ($100)
Child tax Credit (-) $0 ($83) ($167) ($167) ($167) ($83) ($167) ($250)
Self-Sufficiency WaGe
hourly $12.43 $25.49 $34.39 $30.78 $23.67 $14.97 $17.40 $23.01
per adult per adult per adult
monThly $2,188 $4,487 $6,052 $5,417 $4,166 $5,269 $6,126 $8,098
annual $26,259 $53,838 $72,624 $65,008 $49,992 $63,233 $73,513 $97,177
emerGenCY saVinGs(monthly Contribution) $38 $73 $122 $99 $74 $44 $51 $65
northwest Workforce development area

The Self-Sufficiency STandard for connecTicuT 2015 • 57
Table 3 The Self-Sufficiency Standard for Danbury, CT 2015
monThly coSTS adultAdult +
Preschooler
Adult + infant
Preschooler
Adult + Preschooler School-age
Adult + School-age Teenager
2 Adults + infant
2 Adults+ PreschoolerSchool-age
2 Adults +infant
Preschooler School-age
housing $1,058 $1,432 $1,432 $1,432 $1,432 $1,432 $1,432 $1,785
Child Care $0 $982 $2,012 $1,519 $537 $1,030 $1,519 $2,549
food $304 $462 $606 $696 $805 $738 $955 $1,056
transportation $305 $314 $314 $314 $314 $597 $597 $597
health Care $199 $592 $603 $615 $649 $650 $671 $683
miscellaneous $187 $378 $497 $458 $374 $445 $517 $667
taxes $462 $1,134 $1,709 $1,390 $1,017 $1,246 $1,438 $2,068
earned income tax Credit (-) $0 $0 $0 $0 $0 $0 $0 $0
Child Care tax Credit (-) $0 ($50) ($100) ($100) ($50) ($50) ($100) ($100)
Child tax Credit (-) $0 ($83) ($167) ($167) ($167) ($83) ($167) ($250)
Self-Sufficiency WaGe
hourly $14.29 $29.32 $39.23 $34.98 $27.90 $17.06 $19.50 $25.72
per adult per adult per adult
monThly $2,516 $5,160 $6,905 $6,157 $4,910 $6,004 $6,863 $9,055
annual $30,187 $61,917 $82,861 $73,885 $58,924 $72,043 $82,351 $108,654
emerGenCY saVinGs(monthly Contribution) $42 $82 $146 $125 $82 $48 $56 $69
Table 4 The Self-Sufficiency Standard for Greater Danbury, CT 2015
monThly coSTS adultAdult +
Preschooler
Adult + infant
Preschooler
Adult + Preschooler School-age
Adult + School-age Teenager
2 Adults + infant
2 Adults+ PreschoolerSchool-age
2 Adults +infant
Preschooler School-age
housing $1,179 $1,579 $1,579 $1,579 $1,579 $1,579 $1,579 $1,974
Child Care $0 $982 $2,012 $1,519 $537 $1,030 $1,519 $2,549
food $298 $452 $594 $682 $789 $723 $936 $1,035
transportation $305 $314 $314 $314 $314 $597 $597 $597
health Care $194 $572 $584 $596 $629 $630 $652 $663
miscellaneous $198 $390 $508 $469 $385 $456 $528 $682
taxes $521 $1,184 $1,789 $1,493 $1,064 $1,298 $1,483 $2,176
earned income tax Credit (-) $0 $0 $0 $0 $0 $0 $0 $0
Child Care tax Credit (-) $0 ($50) ($100) ($100) ($50) ($50) ($100) ($100)
Child tax Credit (-) $0 ($83) ($167) ($167) ($167) ($83) ($167) ($250)
Self-Sufficiency WaGe
hourly $15.31 $30.34 $40.41 $36.28 $28.86 $17.56 $19.96 $26.49
per adult per adult per adult
monThly $2,695 $5,339 $7,111 $6,385 $5,079 $6,180 $7,027 $9,326
annual $32,340 $64,072 $85,338 $76,619 $60,954 $74,160 $84,327 $111,911
emerGenCY saVinGs(monthly Contribution) $43 $89 $152 $131 $85 $49 $57 $70

58 • The Self-Sufficiency STandard for connecTicuT 2015
Table 5 The Self-Sufficiency Standard for Northwest Corner, CT 2015
monThly coSTS adultAdult +
Preschooler
Adult + infant
Preschooler
Adult + Preschooler School-age
Adult + School-age Teenager
2 Adults + infant
2 Adults+ PreschoolerSchool-age
2 Adults +infant
Preschooler School-age
housing $771 $989 $989 $989 $989 $989 $989 $1,252
Child Care $0 $982 $2,012 $1,519 $537 $1,030 $1,519 $2,549
food $279 $422 $554 $637 $737 $675 $874 $967
transportation $303 $311 $311 $311 $311 $592 $592 $592
health Care $177 $509 $521 $533 $566 $568 $589 $600
miscellaneous $153 $321 $439 $399 $314 $385 $456 $596
taxes $312 $871 $1,271 $1,104 $737 $951 $1,182 $1,669
earned income tax Credit (-) $0 $0 $0 $0 $0 $0 $0 $0
Child Care tax Credit (-) $0 ($50) ($100) ($100) ($50) ($50) ($100) ($100)
Child tax Credit (-) $0 ($83) ($167) ($167) ($167) ($83) ($167) ($250)
Self-Sufficiency WaGe
hourly $11.33 $24.28 $33.12 $29.69 $22.58 $14.37 $16.86 $22.37
per adult per adult per adult
monThly $1,994 $4,273 $5,830 $5,226 $3,974 $5,058 $5,935 $7,876
annual $23,926 $51,279 $69,959 $62,708 $47,693 $60,690 $71,219 $94,507
emerGenCY saVinGs(monthly Contribution) $36 $71 $115 $92 $72 $43 $50 $63

The Self-Sufficiency STandard for connecTicuT 2015 • 59
Table 7 The Self-Sufficiency Standard for Stratford, CT 2015
monThly coSTS adultAdult +
Preschooler
Adult + infant
Preschooler
Adult + Preschooler School-age
Adult + School-age Teenager
2 Adults + infant
2 Adults+ PreschoolerSchool-age
2 Adults +infant
Preschooler School-age
housing $871 $1,109 $1,109 $1,109 $1,109 $1,109 $1,109 $1,452
Child Care $0 $1,186 $2,605 $1,676 $490 $1,418 $1,676 $3,094
food $304 $462 $606 $696 $805 $738 $955 $1,056
transportation $315 $323 $323 $323 $323 $616 $616 $616
health Care $199 $592 $603 $615 $649 $650 $671 $683
miscellaneous $169 $367 $525 $442 $338 $453 $503 $690
taxes $384 $1,089 $1,906 $1,287 $851 $1,287 $1,377 $2,233
earned income tax Credit (-) $0 $0 $0 $0 $0 $0 $0 $0
Child Care tax Credit (-) $0 ($50) ($100) ($100) ($50) ($50) ($100) ($100)
Child tax Credit (-) $0 ($83) ($167) ($167) ($167) ($83) ($167) ($250)
Self-Sufficiency WaGe
hourly $12.74 $28.38 $42.10 $33.42 $24.70 $17.44 $18.86 $26.92
per adult per adult per adult
monThly $2,243 $4,995 $7,410 $5,882 $4,347 $6,138 $6,640 $9,474
annual $26,912 $59,942 $88,925 $70,586 $52,165 $73,658 $79,682 $113,692
emerGenCY saVinGs(monthly Contribution) $39 $80 $162 $116 $76 $48 $54 $71
Table 6 The Self-Sufficiency Standard for Bridgeport, CT 2015
monThly coSTS adultAdult +
Preschooler
Adult + infant
Preschooler
Adult + Preschooler School-age
Adult + School-age Teenager
2 Adults + infant
2 Adults+ PreschoolerSchool-age
2 Adults +infant
Preschooler School-age
housing $828 $1,054 $1,054 $1,054 $1,054 $1,054 $1,054 $1,380
Child Care $0 $1,186 $2,605 $1,676 $490 $1,418 $1,676 $3,094
food $304 $462 $606 $696 $805 $738 $955 $1,056
transportation $70 $70 $70 $70 $70 $140 $140 $140
health Care $199 $592 $603 $615 $649 $650 $671 $683
miscellaneous $140 $336 $494 $411 $307 $400 $450 $635
taxes $265 $945 $1,686 $1,156 $696 $1,023 $1,154 $1,893
earned income tax Credit (-) $0 $0 $0 $0 $0 $0 $0 $0
Child Care tax Credit (-) $0 ($50) ($100) ($100) ($50) ($50) ($100) ($100)
Child tax Credit (-) $0 ($83) ($167) ($167) ($167) ($83) ($167) ($250)
Self-Sufficiency WaGe
hourly $10.27 $25.64 $38.92 $30.75 $21.89 $15.03 $16.57 $24.24
per adult per adult per adult
monThly $1,807 $4,512 $6,851 $5,412 $3,853 $5,290 $5,834 $8,531
annual $21,688 $54,142 $82,209 $64,940 $46,242 $63,485 $70,003 $102,377
emerGenCY saVinGs(monthly Contribution) $33 $74 $145 $99 $71 $44 $50 $67
Southwest Workforce development area

60 • The Self-Sufficiency STandard for connecTicuT 2015
Table 9 The Self-Sufficiency Standard for Naugatuck Valley, CT 2015
monThly coSTS adultAdult +
Preschooler
Adult + infant
Preschooler
Adult + Preschooler School-age
Adult + School-age Teenager
2 Adults + infant
2 Adults+ PreschoolerSchool-age
2 Adults +infant
Preschooler School-age
housing $896 $1,119 $1,119 $1,119 $1,119 $1,119 $1,119 $1,434
Child Care $0 $977 $2,041 $1,530 $552 $1,064 $1,530 $2,593
food $280 $424 $556 $639 $740 $678 $877 $970
transportation $313 $321 $321 $321 $321 $613 $613 $613
health Care $191 $560 $572 $584 $617 $619 $640 $651
miscellaneous $168 $340 $461 $419 $335 $409 $478 $626
taxes $379 $966 $1,422 $1,190 $840 $1,071 $1,272 $1,853
earned income tax Credit (-) $0 $0 $0 $0 $0 $0 $0 $0
Child Care tax Credit (-) $0 ($50) ($100) ($100) ($50) ($50) ($100) ($100)
Child tax Credit (-) $0 ($83) ($167) ($167) ($167) ($83) ($167) ($250)
Self-Sufficiency WaGe
hourly $12.65 $25.99 $35.37 $31.45 $24.47 $15.45 $17.79 $23.84
per adult per adult per adult
monThly $2,227 $4,574 $6,226 $5,536 $4,307 $5,439 $6,262 $8,391
annual $26,721 $54,893 $74,708 $66,427 $51,688 $65,269 $75,139 $100,686
emerGenCY saVinGs(monthly Contribution) $38 $74 $127 $104 $76 $45 $52 $66
Table 8 The Self-Sufficiency Standard for Stamford, CT 2015
monThly coSTS adultAdult +
Preschooler
Adult + infant
Preschooler
Adult + Preschooler School-age
Adult + School-age Teenager
2 Adults + infant
2 Adults+ PreschoolerSchool-age
2 Adults +infant
Preschooler School-age
housing $1,491 $1,852 $1,852 $1,852 $1,852 $1,852 $1,852 $2,306
Child Care $0 $1,186 $2,605 $1,676 $490 $1,418 $1,676 $3,094
food $304 $462 $606 $696 $805 $738 $955 $1,056
transportation $310 $318 $318 $318 $318 $606 $606 $606
health Care $199 $592 $603 $615 $649 $650 $671 $683
miscellaneous $230 $441 $598 $516 $411 $526 $576 $775
taxes $684 $1,499 $2,431 $1,845 $1,175 $1,593 $1,683 $2,836
earned income tax Credit (-) $0 $0 $0 $0 $0 $0 $0 $0
Child Care tax Credit (-) $0 ($50) ($100) ($100) ($50) ($50) ($100) ($100)
Child tax Credit (-) $0 ($83) ($167) ($167) ($167) ($83) ($167) ($250)
Self-Sufficiency WaGe
hourly $18.29 $35.32 $49.70 $41.20 $31.15 $20.60 $22.02 $31.27
per adult per adult per adult
monThly $3,219 $6,217 $8,747 $7,251 $5,482 $7,250 $7,752 $11,006
annual $38,623 $74,600 $104,961 $87,013 $65,789 $87,001 $93,026 $132,077
emerGenCY saVinGs(monthly Contribution) $49 $117 $202 $157 $98 $55 $62 $84

The Self-Sufficiency STandard for connecTicuT 2015 • 61
Table 10 The Self-Sufficiency Standard for Upper Fairfield, CT 2015
monThly coSTS adultAdult +
Preschooler
Adult + infant
Preschooler
Adult + Preschooler School-age
Adult + School-age Teenager
2 Adults + infant
2 Adults+ PreschoolerSchool-age
2 Adults +infant
Preschooler School-age
housing $1,322 $1,683 $1,683 $1,683 $1,683 $1,683 $1,683 $2,203
Child Care $0 $1,186 $2,605 $1,676 $490 $1,418 $1,676 $3,094
food $304 $462 $606 $696 $805 $738 $955 $1,056
transportation $314 $323 $323 $323 $323 $615 $615 $615
health Care $199 $592 $603 $615 $649 $650 $671 $683
miscellaneous $214 $425 $582 $499 $395 $510 $560 $765
taxes $606 $1,382 $2,314 $1,728 $1,106 $1,526 $1,616 $2,765
earned income tax Credit (-) $0 $0 $0 $0 $0 $0 $0 $0
Child Care tax Credit (-) $0 ($50) ($100) ($100) ($50) ($50) ($100) ($100)
Child tax Credit (-) $0 ($83) ($167) ($167) ($167) ($83) ($167) ($250)
Self-Sufficiency WaGe
hourly $16.82 $33.63 $48.00 $39.51 $29.73 $19.91 $21.33 $30.77
per adult per adult per adult
monThly $2,960 $5,919 $8,449 $6,953 $5,233 $7,008 $7,510 $10,832
annual $35,517 $71,024 $101,386 $83,438 $62,798 $84,093 $90,117 $129,980
emerGenCY saVinGs(monthly Contribution) $46 $108 $193 $148 $89 $54 $60 $82
Table 11 The Self-Sufficiency Standard for Lower Fairfield, CT 2015
monThly coSTS adultAdult +
Preschooler
Adult + infant
Preschooler
Adult + Preschooler School-age
Adult + School-age Teenager
2 Adults + infant
2 Adults+ PreschoolerSchool-age
2 Adults +infant
Preschooler School-age
housing $1,601 $1,989 $1,989 $1,989 $1,989 $1,989 $1,989 $2,478
Child Care $0 $1,186 $2,605 $1,676 $490 $1,418 $1,676 $3,094
food $304 $462 $606 $696 $805 $738 $955 $1,056
transportation $307 $316 $316 $316 $316 $601 $601 $601
health Care $199 $592 $603 $615 $649 $650 $671 $683
miscellaneous $241 $454 $612 $529 $425 $540 $589 $791
taxes $740 $1,617 $2,529 $1,938 $1,231 $1,649 $1,739 $2,956
earned income tax Credit (-) $0 $0 $0 $0 $0 $0 $0 $0
Child Care tax Credit (-) $0 ($50) ($100) ($100) ($50) ($50) ($100) ($100)
Child tax Credit (-) $0 ($83) ($167) ($167) ($167) ($83) ($167) ($250)
Self-Sufficiency WaGe
hourly $19.28 $36.84 $51.10 $42.57 $32.32 $21.17 $22.60 $32.13
per adult per adult per adult
monThly $3,393 $6,483 $8,993 $7,493 $5,688 $7,452 $7,954 $11,310
annual $40,721 $77,800 $107,914 $89,914 $68,252 $89,423 $95,447 $135,718
emerGenCY saVinGs(monthly Contribution) $51 $125 $209 $164 $106 $57 $63 $89

62 • The Self-Sufficiency STandard for connecTicuT 2015
Table 12 The Self-Sufficiency Standard for Hartford, CT 2015
monThly coSTS adultAdult +
Preschooler
Adult + infant
Preschooler
Adult + Preschooler School-age
Adult + School-age Teenager
2 Adults + infant
2 Adults+ PreschoolerSchool-age
2 Adults +infant
Preschooler School-age
housing $770 $959 $959 $959 $959 $959 $959 $1,195
Child Care $0 $1,052 $2,195 $1,663 $611 $1,143 $1,663 $2,806
food $263 $399 $524 $602 $697 $639 $826 $914
transportation $54 $54 $54 $54 $54 $108 $108 $108
health Care $178 $514 $526 $538 $571 $573 $594 $606
miscellaneous $127 $298 $426 $382 $289 $342 $415 $563
taxes $211 $752 $1,217 $1,032 $590 $734 $983 $1,529
earned income tax Credit (-) $0 $0 $0 $0 ($36) $0 $0 $0
Child Care tax Credit (-) $0 ($50) ($100) ($100) ($53) ($50) ($100) ($100)
Child tax Credit (-) $0 ($83) ($167) ($167) ($167) ($83) ($167) ($250)
Self-Sufficiency WaGe
hourly $9.11 $22.14 $32.01 $28.20 $19.98 $12.40 $15.00 $20.94
per adult per adult per adult
monThly $1,603 $3,896 $5,635 $4,963 $3,516 $4,364 $5,282 $7,370
annual $19,233 $46,753 $67,615 $59,553 $42,195 $52,374 $63,381 $88,443
emerGenCY saVinGs(monthly Contribution) $30 $67 $107 $86 $70 $39 $47 $60
Table 13 The Self-Sufficiency Standard for Hartford Suburbs, CT 2015
monThly coSTS adultAdult +
Preschooler
Adult + infant
Preschooler
Adult + Preschooler School-age
Adult + School-age Teenager
2 Adults + infant
2 Adults+ PreschoolerSchool-age
2 Adults +infant
Preschooler School-age
housing $954 $1,189 $1,189 $1,189 $1,189 $1,189 $1,189 $1,480
Child Care $0 $1,052 $2,195 $1,663 $611 $1,143 $1,663 $2,806
food $263 $399 $524 $602 $697 $639 $826 $914
transportation $320 $329 $329 $329 $329 $626 $626 $626
health Care $178 $514 $526 $538 $571 $573 $594 $606
miscellaneous $172 $348 $476 $432 $340 $417 $490 $643
taxes $394 $1,005 $1,557 $1,243 $864 $1,109 $1,322 $1,927
earned income tax Credit (-) $0 $0 $0 $0 $0 $0 $0 $0
Child Care tax Credit (-) $0 ($50) ($100) ($100) ($50) ($50) ($100) ($100)
Child tax Credit (-) $0 ($83) ($167) ($167) ($167) ($83) ($167) ($250)
Self-Sufficiency WaGe
hourly $12.96 $26.72 $37.10 $32.55 $24.90 $15.80 $18.30 $24.58
per adult per adult per adult
monThly $2,282 $4,703 $6,529 $5,728 $4,383 $5,561 $6,442 $8,652
annual $27,381 $56,436 $78,346 $68,742 $52,595 $66,734 $77,309 $103,828
emerGenCY saVinGs(monthly Contribution) $39 $76 $135 $111 $76 $45 $53 $68
north central Workforce development area
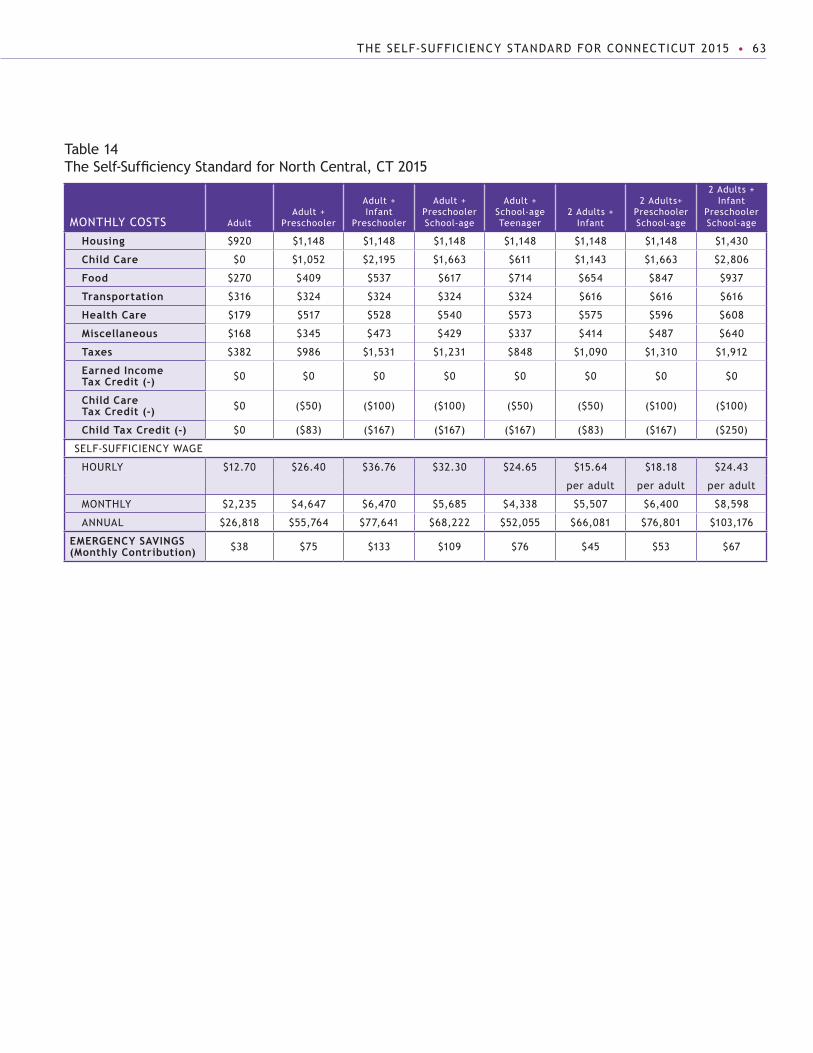
The Self-Sufficiency STandard for connecTicuT 2015 • 63
Table 14 The Self-Sufficiency Standard for North Central, CT 2015
monThly coSTS adultAdult +
Preschooler
Adult + infant
Preschooler
Adult + Preschooler School-age
Adult + School-age Teenager
2 Adults + infant
2 Adults+ PreschoolerSchool-age
2 Adults +infant
Preschooler School-age
housing $920 $1,148 $1,148 $1,148 $1,148 $1,148 $1,148 $1,430
Child Care $0 $1,052 $2,195 $1,663 $611 $1,143 $1,663 $2,806
food $270 $409 $537 $617 $714 $654 $847 $937
transportation $316 $324 $324 $324 $324 $616 $616 $616
health Care $179 $517 $528 $540 $573 $575 $596 $608
miscellaneous $168 $345 $473 $429 $337 $414 $487 $640
taxes $382 $986 $1,531 $1,231 $848 $1,090 $1,310 $1,912
earned income tax Credit (-) $0 $0 $0 $0 $0 $0 $0 $0
Child Care tax Credit (-) $0 ($50) ($100) ($100) ($50) ($50) ($100) ($100)
Child tax Credit (-) $0 ($83) ($167) ($167) ($167) ($83) ($167) ($250)
Self-Sufficiency WaGe
hourly $12.70 $26.40 $36.76 $32.30 $24.65 $15.64 $18.18 $24.43
per adult per adult per adult
monThly $2,235 $4,647 $6,470 $5,685 $4,338 $5,507 $6,400 $8,598
annual $26,818 $55,764 $77,641 $68,222 $52,055 $66,081 $76,801 $103,176
emerGenCY saVinGs(monthly Contribution) $38 $75 $133 $109 $76 $45 $53 $67

64 • The Self-Sufficiency STandard for connecTicuT 2015
South central Workforce development area
Table 15 The Self-Sufficiency Standard for New Haven, CT 2015
monThly coSTS adultAdult +
Preschooler
Adult + infant
Preschooler
Adult + Preschooler School-age
Adult + School-age Teenager
2 Adults + infant
2 Adults+ PreschoolerSchool-age
2 Adults +infant
Preschooler School-age
housing $1,008 $1,258 $1,258 $1,258 $1,258 $1,258 $1,258 $1,566
Child Care $0 $976 $2,049 $1,532 $556 $1,073 $1,532 $2,605
food $265 $402 $528 $606 $701 $643 $832 $920
transportation $54 $54 $54 $54 $54 $108 $108 $108
health Care $186 $542 $553 $565 $598 $600 $621 $633
miscellaneous $151 $323 $444 $402 $317 $368 $435 $583
taxes $306 $879 $1,301 $1,115 $748 $863 $1,083 $1,615
earned income tax Credit (-) $0 $0 $0 $0 $0 $0 $0 $0
Child Care tax Credit (-) $0 ($50) ($100) ($100) ($50) ($50) ($100) ($100)
Child tax Credit (-) $0 ($83) ($167) ($167) ($167) ($83) ($167) ($250)
Self-Sufficiency WaGe
hourly $11.19 $24.43 $33.63 $29.92 $22.82 $13.58 $15.92 $21.82
per adult per adult per adult
monThly $1,970 $4,300 $5,920 $5,265 $4,016 $4,779 $5,602 $7,680
annual $23,641 $51,597 $71,036 $63,185 $48,187 $57,347 $67,225 $92,159
emerGenCY saVinGs(monthly Contribution) $35 $72 $118 $93 $73 $42 $48 $62
Table 16 The Self-Sufficiency Standard for Upper Connecticut River, CT 2015
monThly coSTS adultAdult +
Preschooler
Adult + infant
Preschooler
Adult + Preschooler School-age
Adult + School-age Teenager
2 Adults + infant
2 Adults+ PreschoolerSchool-age
2 Adults +infant
Preschooler School-age
housing $933 $1,162 $1,162 $1,162 $1,162 $1,162 $1,162 $1,448
Child Care $0 $976 $2,049 $1,532 $556 $1,073 $1,532 $2,605
food $302 $458 $601 $690 $798 $732 $947 $1,048
transportation $321 $329 $329 $329 $329 $626 $626 $626
health Care $187 $546 $558 $570 $603 $605 $626 $638
miscellaneous $174 $347 $470 $428 $345 $420 $489 $636
taxes $405 $1,000 $1,499 $1,228 $887 $1,121 $1,321 $1,898
earned income tax Credit (-) $0 $0 $0 $0 $0 $0 $0 $0
Child Care tax Credit (-) $0 ($50) ($100) ($100) ($50) ($50) ($100) ($100)
Child tax Credit (-) $0 ($83) ($167) ($167) ($167) ($83) ($167) ($250)
Self-Sufficiency WaGe
hourly $13.19 $26.62 $36.37 $32.23 $25.36 $15.92 $18.29 $24.28
per adult per adult per adult
monThly $2,321 $4,685 $6,401 $5,673 $4,464 $5,605 $6,437 $8,548
annual $27,858 $56,221 $76,813 $68,078 $53,567 $67,260 $77,246 $102,578
emerGenCY saVinGs(monthly Contribution) $40 $76 $132 $109 $77 $46 $53 $67

The Self-Sufficiency STandard for connecTicuT 2015 • 65
Table 17 The Self-Sufficiency Standard for Greater New Haven, CT 2015
monThly coSTS adultAdult +
Preschooler
Adult + infant
Preschooler
Adult + Preschooler School-age
Adult + School-age Teenager
2 Adults + infant
2 Adults+ PreschoolerSchool-age
2 Adults +infant
Preschooler School-age
housing $1,068 $1,335 $1,335 $1,335 $1,335 $1,335 $1,335 $1,674
Child Care $0 $976 $2,049 $1,532 $556 $1,073 $1,532 $2,605
food $267 $404 $531 $610 $705 $646 $837 $926
transportation $324 $333 $333 $333 $333 $635 $635 $635
health Care $186 $542 $553 $565 $599 $600 $621 $633
miscellaneous $185 $359 $480 $438 $353 $429 $496 $647
taxes $453 $1,055 $1,591 $1,266 $930 $1,170 $1,349 $1,945
earned income tax Credit (-) $0 $0 $0 $0 $0 $0 $0 $0
Child Care tax Credit (-) $0 ($50) ($100) ($100) ($50) ($50) ($100) ($100)
Child tax Credit (-) $0 ($83) ($167) ($167) ($167) ($83) ($167) ($250)
Self-Sufficiency WaGe
hourly $14.10 $27.67 $37.53 $33.03 $26.10 $16.35 $18.58 $24.76
per adult per adult per adult
monThly $2,482 $4,871 $6,605 $5,812 $4,594 $5,755 $6,539 $8,715
annual $29,788 $58,449 $79,266 $69,750 $55,133 $69,062 $78,467 $104,582
emerGenCY saVinGs(monthly Contribution) $41 $78 $137 $114 $79 $46 $54 $68
Table 18 The Self-Sufficiency Standard for Lower Connecticut River, CT 2015
monThly coSTS adultAdult +
Preschooler
Adult + infant
Preschooler
Adult + Preschooler School-age
Adult + School-age Teenager
2 Adults + infant
2 Adults+ PreschoolerSchool-age
2 Adults +infant
Preschooler School-age
housing $1,076 $1,444 $1,444 $1,444 $1,444 $1,444 $1,444 $1,989
Child Care $0 $976 $2,049 $1,532 $556 $1,073 $1,532 $2,605
food $302 $458 $601 $690 $798 $732 $947 $1,048
transportation $307 $315 $315 $315 $315 $599 $599 $599
health Care $187 $546 $558 $570 $603 $605 $626 $638
miscellaneous $187 $374 $497 $455 $372 $445 $515 $688
taxes $465 $1,118 $1,710 $1,375 $1,009 $1,248 $1,427 $2,217
earned income tax Credit (-) $0 $0 $0 $0 $0 $0 $0 $0
Child Care tax Credit (-) $0 ($50) ($100) ($100) ($50) ($50) ($100) ($100)
Child tax Credit (-) $0 ($83) ($167) ($167) ($167) ($83) ($167) ($250)
Self-Sufficiency WaGe
hourly $14.34 $28.97 $39.25 $34.75 $27.74 $17.08 $19.39 $26.80
per adult per adult per adult
monThly $2,524 $5,098 $6,907 $6,116 $4,882 $6,013 $6,825 $9,434
annual $30,286 $61,181 $82,888 $73,394 $58,589 $72,157 $81,896 $113,209
emerGenCY saVinGs(monthly Contribution) $42 $81 $146 $124 $82 $48 $55 $71

66 • The Self-Sufficiency STandard for connecTicuT 2015
eastern Workforce development area
Table 19 The Self-Sufficiency Standard for Windham, CT 2015
monThly coSTS adultAdult +
Preschooler
Adult + infant
Preschooler
Adult + Preschooler School-age
Adult + School-age Teenager
2 Adults + infant
2 Adults+ PreschoolerSchool-age
2 Adults +infant
Preschooler School-age
housing $624 $836 $836 $836 $836 $836 $836 $1,042
Child Care $0 $827 $1,797 $1,228 $401 $970 $1,228 $2,198
food $240 $365 $479 $550 $636 $583 $754 $834
transportation $309 $317 $317 $317 $317 $603 $603 $603
health Care $182 $528 $540 $552 $585 $587 $608 $620
miscellaneous $136 $287 $397 $348 $278 $358 $403 $530
taxes $246 $694 $1,096 $888 $500 $815 $923 $1,390
earned income tax Credit (-) $0 $0 $0 $0 ($119) $0 $0 $0
Child Care tax Credit (-) $0 ($50) ($100) ($100) ($58) ($50) ($100) ($100)
Child tax Credit (-) $0 ($83) ($167) ($167) ($167) ($83) ($167) ($250)
Self-Sufficiency WaGe
hourly $9.87 $21.14 $29.52 $25.30 $18.24 $13.12 $14.46 $19.51
per adult per adult per adult
monThly $1,737 $3,721 $5,195 $4,453 $3,210 $4,618 $5,089 $6,867
annual $20,842 $44,657 $62,340 $53,436 $38,522 $55,419 $61,064 $82,399
emerGenCY saVinGs(monthly Contribution) $32 $66 $91 $80 $72 $41 $46 $57
Table 20 The Self-Sufficiency Standard for Greater Windham, CT 2015
monThly coSTS adultAdult +
Preschooler
Adult + infant
Preschooler
Adult + Preschooler School-age
Adult + School-age Teenager
2 Adults + infant
2 Adults+ PreschoolerSchool-age
2 Adults +infant
Preschooler School-age
housing $922 $1,180 $1,180 $1,180 $1,180 $1,180 $1,180 $1,470
Child Care $0 $827 $1,797 $1,228 $401 $970 $1,228 $2,198
food $294 $446 $585 $672 $777 $712 $922 $1,020
transportation $310 $319 $319 $319 $319 $605 $605 $605
health Care $184 $537 $549 $561 $594 $596 $617 $629
miscellaneous $171 $331 $443 $396 $327 $406 $455 $592
taxes $392 $916 $1,294 $1,092 $802 $1,054 $1,178 $1,652
earned income tax Credit (-) $0 $0 $0 $0 $0 $0 $0 $0
Child Care tax Credit (-) $0 ($50) ($100) ($100) ($50) ($50) ($100) ($100)
Child tax Credit (-) $0 ($83) ($167) ($167) ($167) ($83) ($167) ($250)
Self-Sufficiency WaGe
hourly $12.92 $25.13 $33.52 $29.44 $23.77 $15.31 $16.81 $22.20
per adult per adult per adult
monThly $2,273 $4,423 $5,899 $5,181 $4,183 $5,391 $5,919 $7,816
annual $27,277 $53,074 $70,789 $62,175 $50,201 $64,687 $71,025 $93,791
emerGenCY saVinGs(monthly Contribution) $39 $73 $117 $90 $74 $45 $50 $63

The Self-Sufficiency STandard for connecTicuT 2015 • 67
Table 21 The Self-Sufficiency Standard for New London, CT 2015
monThly coSTS adultAdult +
Preschooler
Adult + infant
Preschooler
Adult + Preschooler School-age
Adult + School-age Teenager
2 Adults + infant
2 Adults+ PreschoolerSchool-age
2 Adults +infant
Preschooler School-age
housing $664 $871 $871 $871 $871 $871 $871 $1,115
Child Care $0 $827 $1,797 $1,228 $401 $970 $1,228 $2,198
food $299 $454 $595 $684 $791 $725 $938 $1,038
transportation $312 $320 $320 $320 $320 $609 $609 $609
health Care $191 $560 $571 $583 $617 $618 $639 $651
miscellaneous $147 $303 $416 $369 $300 $379 $429 $561
taxes $289 $780 $1,174 $978 $658 $921 $1,051 $1,522
earned income tax Credit (-) $0 $0 $0 $0 $0 $0 $0 $0
Child Care tax Credit (-) $0 ($50) ($100) ($100) ($50) ($50) ($100) ($100)
Child tax Credit (-) $0 ($83) ($167) ($167) ($167) ($83) ($167) ($250)
Self-Sufficiency WaGe
hourly $10.80 $22.63 $31.12 $27.09 $21.26 $14.09 $15.62 $20.87
per adult per adult per adult
monThly $1,900 $3,982 $5,478 $4,767 $3,742 $4,960 $5,499 $7,345
annual $22,804 $47,787 $65,734 $57,209 $44,900 $59,522 $65,990 $88,139
emerGenCY saVinGs(monthly Contribution) $34 $68 $101 $84 $70 $42 $48 $60
Table 22 The Self-Sufficiency Standard for Greater New London, CT 2015
monThly coSTS adultAdult +
Preschooler
Adult + infant
Preschooler
Adult + Preschooler School-age
Adult + School-age Teenager
2 Adults + infant
2 Adults+ PreschoolerSchool-age
2 Adults +infant
Preschooler School-age
housing $823 $1,080 $1,080 $1,080 $1,080 $1,080 $1,080 $1,382
Child Care $0 $834 $1,808 $1,242 $408 $974 $1,242 $2,216
food $299 $454 $595 $684 $791 $725 $938 $1,038
transportation $310 $319 $319 $319 $319 $606 $606 $606
health Care $191 $560 $571 $583 $617 $618 $639 $651
miscellaneous $162 $325 $437 $391 $321 $400 $451 $589
taxes $354 $885 $1,265 $1,070 $773 $1,024 $1,158 $1,640
earned income tax Credit (-) $0 $0 $0 $0 $0 $0 $0 $0
Child Care tax Credit (-) $0 ($50) ($100) ($100) ($50) ($50) ($100) ($100)
Child tax Credit (-) $0 ($83) ($167) ($167) ($167) ($83) ($167) ($250)
Self-Sufficiency WaGe
hourly $12.15 $24.56 $33.01 $28.99 $23.25 $15.04 $16.61 $22.08
per adult per adult per adult
monThly $2,139 $4,322 $5,809 $5,102 $4,092 $5,294 $5,847 $7,773
annual $25,662 $51,864 $69,711 $61,228 $49,105 $63,531 $70,164 $93,276
emerGenCY saVinGs(monthly Contribution) $37 $72 $114 $88 $73 $44 $50 $63

68 • The Self-Sufficiency STandard for connecTicuT 2015
Table 23 The Self-Sufficiency Standard for Northeast Corner, CT 2015
monThly coSTS adultAdult +
Preschooler
Adult + infant
Preschooler
Adult + Preschooler School-age
Adult + School-age Teenager
2 Adults + infant
2 Adults+ PreschoolerSchool-age
2 Adults +infant
Preschooler School-age
housing $733 $983 $983 $983 $983 $983 $983 $1,224
Child Care $0 $827 $1,797 $1,228 $401 $970 $1,228 $2,198
food $240 $365 $479 $550 $636 $583 $754 $834
transportation $310 $318 $318 $318 $318 $605 $605 $605
health Care $182 $528 $540 $552 $585 $587 $608 $620
miscellaneous $147 $302 $412 $363 $292 $373 $418 $548
taxes $289 $775 $1,158 $954 $631 $888 $995 $1,468
earned income tax Credit (-) $0 $0 $0 $0 ($6) $0 $0 $0
Child Care tax Credit (-) $0 ($50) ($100) ($100) ($50) ($50) ($100) ($100)
Child tax Credit (-) $0 ($83) ($167) ($167) ($167) ($83) ($167) ($250)
Self-Sufficiency WaGe
hourly $10.80 $22.53 $30.79 $26.60 $20.59 $13.79 $15.13 $20.30
per adult per adult per adult
monThly $1,901 $3,966 $5,419 $4,682 $3,625 $4,855 $5,325 $7,147
annual $22,812 $47,590 $65,031 $56,189 $43,496 $58,256 $63,901 $85,768
emerGenCY saVinGs(monthly Contribution) $34 $68 $99 $83 $69 $42 $47 $59

The Self-Sufficiency STandard for connecTicuT 2015 • 69
appendix e. impact of Work supports on Wage adequacy One Adult, One Preschooler, and One School-Age Child hartford, cT 2015
#1 #2 #4 #3 #5
ConneCtiCut 2015 minimum
WaGe
meDian WaGe of toP ConneCtiCut oCCuPations
retail salespersons
Janitors and Cleaners
(except maids & house Cleaners)
nursing assistantsBookkeeping
accounting and auditing Clerks
HourlyWAgE: $9.15 $10.70 $12.55 $14.92 $20.30
ToTAlMoNTHlyiNCoME: $1,610 $1,854 $2,176 $2,586 $3,519
PANElA:NoWorkSuPPorTS
MoNTHlyCoSTS:
housing $959 $959 $959 $959 $959
Child Care $1,663 $1,663 $1,663 $1,663 $1,663
food $602 $602 $602 $602 $602
transportation $54 $54 $54 $54 $54
health Care $538 $538 $538 $538 $538
miscellaneous $382 $382 $382 $382 $382
taxes $161 $193 $275 $373 $632
TaxCredits(-)* $0 ($11) ($43) ($84) ($212)
total monthlY exPenses $4,358 $4,380 $4,429 $4,486 $4,618
shortfall (-) or surPlus ($2,748) ($2,526) ($2,254) ($1,901) ($1,099)
WaGe aDeQuaCY total income/total expenses 37% 42% 49% 58% 76%
PANElB:CHildCArEASSiSTANCE
MoNTHlyCoSTS:
housing $959 $959 $959 $959 $959
Child Care $628 $638 $651 $719 $845
food $602 $602 $602 $602 $602
transportation $54 $54 $54 $54 $54
health Care $538 $538 $538 $538 $538
miscellaneous $382 $382 $382 $382 $382
taxes $161 $193 $275 $373 $632
TaxCredits(-)* $0 ($11) ($43) ($84) ($212)
total monthlY exPenses $3,324 $3,356 $3,418 $3,543 $3,801
shortfall (-) or surPlus ($1,714) ($1,501) ($1,242) ($957) ($282)
WaGe aDeQuaCY total income/total expenses 48% 55% 64% 73% 93%
ANNuAlrEFuNdABlETAXCrEdiTS*:
annual federal eitC $5,145 $4,529 $3,716 $2,680 $321
annual state eitC $1,544 $1,359 $1,115 $804 $96
annual federal CtC $2,000 $2,000 $2,000 $2,000 $716
* The Standard shows refundable and nonrefundable tax credits as if they are received monthly. however, in order to be as realistic as possible, tax credits that are available as a refund on annual taxes are shown at the bottom of this table. eiTc is shown only as annual tax credits. The nonrefundable portions of the child Tax credit (which is a credit against federal taxes) is shown as available to offset monthly costs, and the refundable portions are shown in the bottom of the table. The child care Tax credit however is nonrefundable, and therefore is only shown as part of the monthly budget and does not appear in the bottom shaded rows of the table. See the discussion in Appendix A: Methodology, Assumptions, and Sources titled Treatment of Tax Credits in the Modeling Table and Wage Adequacy Figure.
appendix e: impact of Work Supports on Wage adequacy
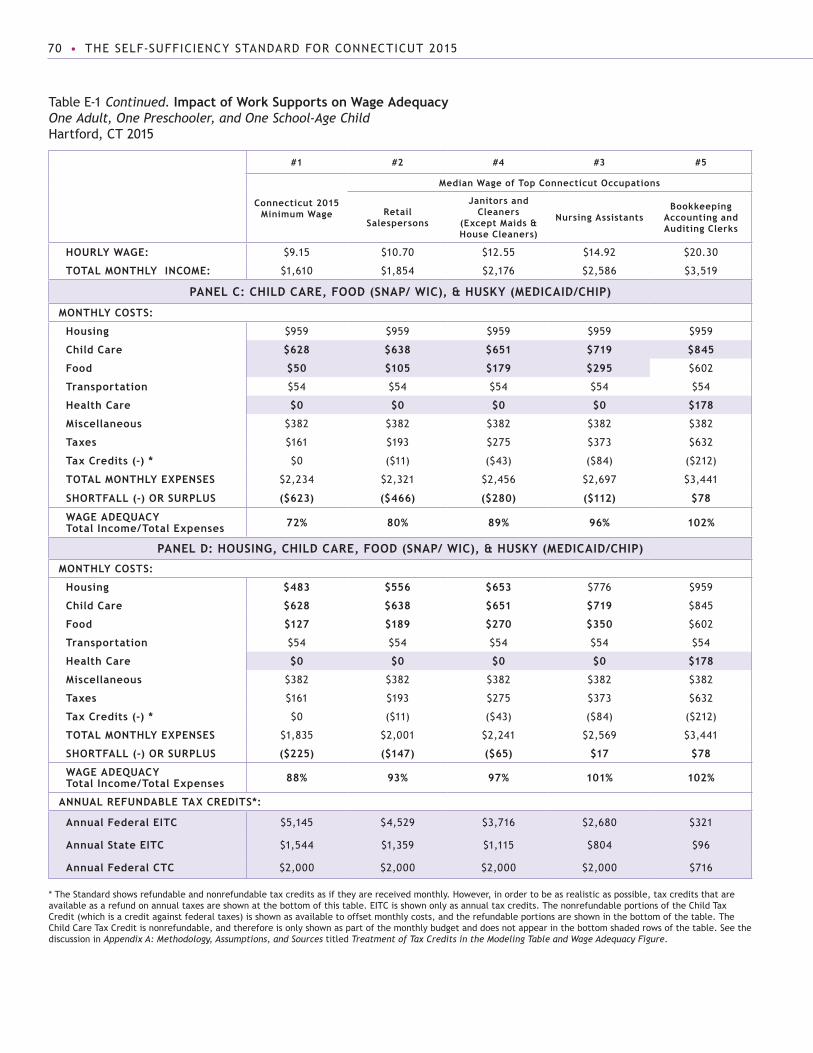
70 • The Self-Sufficiency STandard for connecTicuT 2015
Table e-1 Continued. impact of Work supports on Wage adequacy One Adult, One Preschooler, and One School-Age Child hartford, cT 2015
#1 #2 #4 #3 #5
Connecticut 2015 minimum Wage
median Wage of top Connecticut occupations
retail salespersons
Janitors and Cleaners
(except maids & house Cleaners)
nursing assistantsBookkeeping
accounting and auditing Clerks
HourlyWAgE: $9.15 $10.70 $12.55 $14.92 $20.30
ToTAlMoNTHlyiNCoME: $1,610 $1,854 $2,176 $2,586 $3,519
PANElC:CHildCArE,Food(SNAP/WiC),&HuSky(MEdiCAid/CHiP)
MoNTHlyCoSTS:
housing $959 $959 $959 $959 $959
Child Care $628 $638 $651 $719 $845
food $50 $105 $179 $295 $602
transportation $54 $54 $54 $54 $54
health Care $0 $0 $0 $0 $178
miscellaneous $382 $382 $382 $382 $382
taxes $161 $193 $275 $373 $632
TaxCredits(-)* $0 ($11) ($43) ($84) ($212)
total monthlY exPenses $2,234 $2,321 $2,456 $2,697 $3,441
shortfall (-) or surPlus ($623) ($466) ($280) ($112) $78
WaGe aDeQuaCY total income/total expenses 72% 80% 89% 96% 102%
PANEld:HouSiNg,CHildCArE,Food(SNAP/WiC),&HuSky(MEdiCAid/CHiP)
MoNTHlyCoSTS:
housing $483 $556 $653 $776 $959
Child Care $628 $638 $651 $719 $845
food $127 $189 $270 $350 $602
transportation $54 $54 $54 $54 $54
health Care $0 $0 $0 $0 $178
miscellaneous $382 $382 $382 $382 $382
taxes $161 $193 $275 $373 $632
TaxCredits(-)* $0 ($11) ($43) ($84) ($212)
total monthlY exPenses $1,835 $2,001 $2,241 $2,569 $3,441
shortfall (-) or surPlus ($225) ($147) ($65) $17 $78
WaGe aDeQuaCY total income/total expenses 88% 93% 97% 101% 102%
ANNuAlrEFuNdABlETAXCrEdiTS*:
annual federal eitC $5,145 $4,529 $3,716 $2,680 $321
annual state eitC $1,544 $1,359 $1,115 $804 $96
annual federal CtC $2,000 $2,000 $2,000 $2,000 $716
* The Standard shows refundable and nonrefundable tax credits as if they are received monthly. however, in order to be as realistic as possible, tax credits that are available as a refund on annual taxes are shown at the bottom of this table. eiTc is shown only as annual tax credits. The nonrefundable portions of the child Tax credit (which is a credit against federal taxes) is shown as available to offset monthly costs, and the refundable portions are shown in the bottom of the table. The child care Tax credit is nonrefundable, and therefore is only shown as part of the monthly budget and does not appear in the bottom shaded rows of the table. See the discussion in Appendix A: Methodology, Assumptions, and Sources titled Treatment of Tax Credits in the Modeling Table and Wage Adequacy Figure.

a bout the authordiana m. Pearce, Phd is on faculty at the School of Social Work, university of Washington in Seattle,
Washington, and is director of the center for Women’s Welfare. recognized for coining the phrase “the
feminization of poverty,” dr. Pearce founded and directed the Women and Poverty Project at Wider
opportunities for Women (WoW). She has written and spoken widely on women’s poverty and economic
inequality, including testimony before congress and the President’s Working Group on Welfare reform.
While at WOW, Dr. Pearce conceived and developed the methodology for the Self-Sufficiency Standard and
first published results in 1996 for Iowa and California. Her areas of expertise include low-wage and part-
time employment, unemployment insurance, homelessness, and welfare reform as they impact women. dr.
Pearce has helped found and lead several coalitions, including the Women, Work and Welfare coalition and
the Women and job Training coalition. She received her Phd degree in Sociology and Social Work from the
university of michigan.

Center for Women’s Welfare…advancing economic justice through research and the Sel f-Suciency Standard